xa9847605 chapter 8 p.s. soni quality assurance and ... chapter 8 quality control of imaging devices...
TRANSCRIPT

XA9847605
Chapter 8
QUALITY CONTROL OF IMAGING DEVICES
P.S. Soni
Quality Assurance and Quality Control in Nuclear Medicine
Quality assurance in nuclear medicine refers collectively to all aspects of a nuclearmedicine service. It would include patient scheduling, radiopharmaceutical preparation anddispensing, radiation protection of patients, staff and general public, preventive maintenanceand the care of instruments, methodology, data interpretation and records keeping, and manyother small things which contribute directly or indirectly to the overall quality of a nuclearmedicine service in a hospital.
Quality Control, on the other hand, refers to a single component of the system and isusually applied in relation to a specific instrument and its performance.
Quality Control of Scintillation Camera
The scintillation gamma camera is a standard device available in every nuclear medicinedepartment to obtain various organ images of patients. The image quality depends uponvarious factors, some of them are operator dependent and others are design variants. Theoperator dependent parameters are kept optimum, at the hospital level, by using standardprotocols and appropriate imaging techniques. The design dependent parameters vary frommanufacturer to manufacturer. There were no standard performance definitions and protocolsavailable till NEMA (National Electrical Manufacturers Association, U.S.A.) laid down somestandards in this respect in 1980. Afterwards, it was possible for the manufacturers andcustomers to do intercomparison studies between different gamma cameras at the time ofquotation and after installation.
Why Quality Control?
Assessment of the performance of an instrument is of paramount importance, not onlyat the time of installation, but also at regular intervals during its use, particularly after majorrepairs. Quality control measurements at regular intervals are also of great help in detectingdeterioration in the performance characteristics of an instrument as it gets older. Initially,upon completion of installation, it is of utmost importance to evaluate and record optimalperformance parameters of the instrument as a baseline for future reference. Whenestablishing these base line parameters, protocols should be developed that can beaccomplished with available in-house facilities and can be completed within a reasonable time.The need for quality control tests for acceptance at the time of installation and at subsequentfollow-up during its usage is much more significant in developing countries due to thevariations in the performance caused by frequent fluctuations in temperature, humidity and
49

CHAPTER 8
power supply. Moreover, the service and maintenance back-up available in a developingcountry could be either very poor or at times non-existent.
In short, quality control is important - at acceptance level, during routine operation asa check on maintenance measures, and for intercomparison of different systems.
For scintillation gamma cameras, the most important performance parameters are floodfield uniformity, spatial resolution, spatial linearity, energy resolution, count rate capability,multiple window spatial registration and sensitivity. Minimum tests which should be doneperiodically in each department are listed below:
Tests to be carried out
Daily Care and Preventive Maintenance for Scintillation Camera
(a) Note the room temperature daily and plot the readings on a graph paper.
(b) Use air filter for clean air environment and keep room humidity low (approx.50%) because high humidity especially at higher temperature, changes the workingcharacteristics of electronic components due to fungal growth which causes leakageof current. Presence of dust enhances this effect.
(c) Do not direct air blow of air-conditioner directly towards the instruments.
(d) Use voltage stabilizer for stable electric supply. Fluctuation in power supply maychange gain of the photomultiplier tubes.
(e) Turn oscilloscope intensity to minimum when not in use.
(f) Turn persistence oscilloscope off at night.
(g) Do not leave the crystal open and unshielded. Always keep a collimator attachedto the detector.
(h) Do not keep any radioactive material on top of the collimator. Check forcontamination on it before attaching it to the detector.
(i) Calibrate the Pulse Height Analysis (PHA) for the energy of radionuclide in usefor the clinical work.
(j) Check proper dot intensity on the formatter before exposing the film.
(k) Do not touch optic lens and clean photographic camera lenses regularly with asoft hairbrush.
50
QUALITY CONTROL OF IMAGING DEVICES
(1) Perform quality control tests regularly and record the results in a logbook.
(m) Maintain a service record by recording service calls and repairs undertaken in theservice maintenance logbook.
(n) Check that the collimator in use is appropriate for a patient's study and ensure itsproper mounting.
Acceptance reference tests
The acceptance tests to be carried out are highly dependent upon manufacturer'srecommendations but the following should be invariably done for future reference.
(a) Intrinsic/System flood field uniformity,
(b) Sensitivity,
(c) Spatial resolution and spatial distortion,
(d) Test of counting performance viz. Maximum count rate capability, Counting lossesand dead time,
(e) Test of multiple-window spatial registration.
Routine Tests
(a) Check the integrity of detector head and collimator mounting,
(b) Check analyzer peak and window settings for radionuclide in use,
(c) System uniformity,
(d) Sensitivity,
(e) Check the function of camera scope and hard-copy device,
(f) Background check under operating conditions for radionuclide in use,
(g) Check the temperature of film developer and its concentration to control developingtime.
51
CHAPTER 8
Periodical Tests
(a) Weekly:
(i) Test of sensitivity,
(ii) Test of spatial resolution and spatial distortion,
(iii) Test of contrast by step wedge phantom,
(iv) Intrinsic/System uniformity at various intensities,
(v) Test of total performance.
(b) Quarterly:
(i) Confirmation of analyzer energy peak and window settingsfor specific radionuclides,
(ii) Test of system count rate performances,
(iii) Sensitivity,
(iv) Test of Intrinsic and System flood field uniformity,
(v) Spatial resolution.
(c) Half Yearly:
(i) Test of multiple-window spatial registration, if more than one PHA is usedsimultaneously to produce a composite image, as in 67Ga imaging,
(ii) Counting performance,
(iii) Sensitivity,
(iv) Test of preset and manual PHA window settings,
(v) Test of flood field (Intrinsic/System) uniformity,
(vi) Test of intrinsic spatial resolution,
(vii) Test of flood field uniformity at energies other than 140 Kev.
52

QUALITY CONTROL OF IMAGING DEVICES
Flood Field Uniformity
The flood field uniformity of a scintillation camera is the ability of the camera to producean uniform image when exposed to a homogeneous spatial distribution. Flood fielduniformity of a detector, without collimator, is called "Intrinsic Uniformity", whereas withcollimator it is called "System Uniformity".
The non-uniformity of response has many interrelated causes including drift inphotomultiplier tube (PMT) gain, cracked crystal, improper calibration of the energy peak,accumulated dirt and dust on the cathode ray tube (CRT) or the optic system, phosphor burnon CRT, failure of one or more PMT, spatial non-linearities, deterioration of the crystal andhigh count rate.
Procedure for Intrinsic Uniformity
(a) Remove collimator, place the lead ring on the detector.
(b) Place "Tc01 point source in a disposable plastic syringe. Adjust the activity to havea count rate of 25 000 to 30 000 per second (cps) on 20% PHA window at adistance of five times the diameter of the crystal from the face of the detector.
(c) Peak the instrument for "Tc"1 (Peak 140 Kev, 20% window).
(d) Choose intensity settings used for liver scan.
(e) Take flood field pictures in format four on 8 in. x 10 in. X-ray film, at a presetcount of two to five million.
(f) Change the intensity below and above the setting used in step (d); repeat step (e).
(g) Develop the film.
(h) Compare the flood field images with earlier reference images.
(i) Any non-uniformity should be reported to the maintenance engineer.
(j) On digital camera, acquire flood image on 64 x 64 matrix and total count perpixel of about 4000. Take four images on a hard copy by varying the greyscale. Calculate integral/differential (CFOV/UFOV) uniformity [for detailsplease refer to IAEA-TECDOC-317] using quality control software suppliedby the manufacturer.
(k) A value of 10% or more above the manufacturer's worst case valuewould call for corrective action.
53

CHAPTER 8
Action to be taken in case of non-uniformity
(a) Check photo peak calibration.
(b) Change the orientation setting to 90° and take a flood field picture. If thenon-uniformity does not change position on the film, then, the fault is in the HardCopier or the camera scope and camera lenses.
(c) Clean CRT of the hard copier or camera scope and its optic lenses (in Analoguecamera). Persistent non-uniformity indicates oscilloscope malfunction e.g. burntareas in the CRT screen phosphor can produce dark spots on the image.
(d) If non-uniformity spots do rotate with the image, then the fault is in the detector,possibly a drift in PMT gain.
(e) Obtain two flood fields, above and below the photopeak (approx. 25% ofphotopeak width). If the areas that are bright in one image are dark in the other,or vice versa, - then, all the PMT's are not properly balanced. If one area remainsdark in both images, call the service engineer either for a defective PMT, crystalor optical coupling of the light guide.
Measurement of System Sensitivity and Uniformity
The sensitivity of a camera is measured as the number of detected counts per unit timeper unit source activity for a specified energy window and geometry of measurement. Sincesensitivity varies from collimator to collimator, it is important to know the relativesensitivities of different collimators.
(a) Place flood source ("Co) on collimated detector.
(b) Adjust the intensity to liver scan setting.
(c) Take flood field picture by collecting two million counts and record the time (sees).
(d) Find out the activity of the "Co source on the day of experiment (in Bq).
(e) Calculate the sensitivity:
2 000 000 counts
(- sec) X (- Bq)= Counts / Sec/ Bq
(f) In a worst case, system sensitivity should not be less than 340 counts/min/jiCi.Intrinsic Spatial Linearity and Resolution
54

QUALITY CONTROL OF IMAGING DEVICES
Spatial linearity: It is one of the performance parameters of the gamma camera that describesthe amount of spatial distortion of the image. Spatial linearity can be quantified in terms ofdegree of linearity from the image of linear bars on the 90° bar phantom or line phantomdescribed by NEMA. Spatial distortion and flood field uniformity are closely related. Ifsevere non-linearity is there, the non-uniformity will also be there in the same area.
Spatial resolution: It is the minimum distance between two point sources that can be resolvedseparately. Intrinsic resolution is affected by the energy of gamma ray, crystal thickness,light guide, PHA window width and count rate. Whereas, system resolution is affected bythe type of collimator used and source-to-collimator distance.
The minimum perceptible bar spacing in an image of 90° quadrant bar phantom is usedas an index of camera spatial resolution. Intrinsic spatial resolution can be quantified fromthe full width at half maximum (FWHM) of the line-spread function of a line source or fromthe 90° quadrant bar phantom image, using the following relationship.
FWHM = 1.75 B
where B is the width of the smallest bar that the camera can resolve.
Intrinsic spatial linearity and resolution (Half Yearly Test")
(a) Remove collimator, turn the detector up side down.
(b) Place a bar phantom on top of the detector, with the bars carefully aligned with theX and Y axis of the detector.
(c) Place a source of approximately 1 mCi (37 MBq) of "Tc™ source at a distance, fivetimes the diameter of the crystal.
(d) Set a 20% window and peak the instrument for "Tc™.
(e) Collect two million counts at liver scan intensity.
(f) Rotate the bar phantom by 90°, 180°, 270° and take the pictures andrecord the counting time.
(g) Assess image for spatial linearity and resolution.
Quantification of spatial resolution
55

CHAPTER 8
(a) Analogue image method:
(i) Find out the width of the bar in a 90° bar quadrant phantom whichthe camera can resolve (say 'B').
(ii) Resolution; FWHM = 1.75 B.
(ill) Average the FWHM values in the X and Y directions.
(b) On Digital Camera-Computer System:
Instead of bar phantom, Intrinsic resolution phantom having two line parallel collimatedline source can be used [for more details please refer to IAEA-TECDOC-317].
System spatial linearity and resolution
(a) For system linearity and resolution the collimator is not removed. Otherwise, thesteps (a) and (b) are the same as above.
(b) Place "Co flood source having 185 MBq (5 mCi) on the top of a 90° quadrant barphantom. If a 57Co flood source is not available, then use a flood phantomcontaining about 185 MBq (5 mCi) "TC".
(c) Set a 20% window and peak the camera.
(d) Repeat steps (e) to (g) and quantitation steps as described above.
Quantitation of performance parameters of gamma camera by densitometer
An IAEA Research Project (RB-3356) on Quality Camera was initiated in 1983, forcarrying out quality control studies of gamma cameras installed in various places in India.During the survey it was felt that the standard performance measurement tests were notsuitable for the following reasons:
(a) The recommended protocol involves the use of computer or a multichannelanalyzer which are not available in some of the nuclear medicine departments,
(b) The standard performance measurement tests recommended by NEMA are simplefor those, who are well trained but are too complicated for an average technologist,
(c) Quality control protocols suggested by NEMA and IAEA-TECDOC-317 areprimarily based on digitised data from Anger Camera and by-passes the camerascope and photographic imaging system which are usually used to obtain hardcopies of the clinical images on X-ray film.
56
QUALITY CONTROL OF IMAGING DEVICES
We have developed a densitometric technique for evaluation of gamma camera'sperformance. It is a modification of NEMA protocols and also based on recommendationsmade by IAEA [IAEA-TECDOC-317]. Most important aspect of this technique is that itevaluates total performance, inclusive of the display imager and photographic hard copier, -a total performance evaluation, which is more meaningful to the user.
Technique
The technique essentially consists of obtaining images on X-ray films. Furtherquantitation of various performance parameters is done in terms of film densities and not interms of count rates per pixel obtained from the computer. In our method, point by pointanalysis of the image is carried out with a densitometer. An automatic scanning micro-densitometer, interfaced to PDP-11/34 computer, is used for scanning the film densities onquality control X-ray films. The film density distribution histogram represents the uniformityresponse of the detector. Various performance parameters, which can be assessed by thisdensitometric technique, are uniformity, spatial distortion and system spatial resolution.
Uniformity: The central field of view (CFOV) and useful field of view (UFOV) areexpressed as percent variation (PV; SD/Mean x 100) of film density values obtained byscanning (scan increment in x and y direction and aperture size 100 micron) the flood imageon microdensitometer.
The second parameter for the intrinsic uniformity which describes the asymmetry (AS)of the frequency distribution of film densities (FD) values. Asymmetry (AS) is determinedby estimating the deviation of mid-points of total range of FD from the median values in thedistribution. The following relationship is used to determine the asymmetry, which is alsoa useful parameter for intrinsic uniformity.
AS = ( L + R/2) - M
where L is the lowest value of FD, R is the range of FD and M is the median value.
Longer tail or low FD values will result in negative value of 'AS' (shows localised coldarea) and the positive value of 'AS' represents a higher end of the FD spectrum (shows focalhot area). Flood field images of five different gamma cameras and their film densityfrequency distribution curves are shown in Figs. 8.1 and 8.2 respectively. It is obvious thatbroader the distribution, poorer is the uniformity of the flood field. Thus the entire curverepresents the extent of non-uniformity.
These two parameters, percent variation T V and asymmetry 'AS' are complimentaryto each other, the former being more sensitive to generalised non-uniformity and the lattermore sensitive to focal non-uniformity (e.g. PMT defective or crystal crack). Specialprograms are written for analysis of the flood field images.Spatial Linearity: The parameters used for measuring non-linearity are the same asrecommended in IAEA-TECDOC-317 manual. Absolute linearity, which measures themaximum deviation from the object grid of the pattern, is obtained from the maximum
57
CHAPTER 8
displacement of the line of object grid on the image. This can be done on the densitometerby scanning the image of the pattern of parallel lines (3 cm apart) equal spacing (2.5 mm)phantom on a densitometer. The density (FD) values recorded on scan line are analyzed bya special software written for absolute linearity measurement. Distance between theconsecutive peaks is measured and from all such distances, the mean peak to peak distanceand its standard deviation (SD) are computed and printed out. From the print out, themaximum peak to peak distance is found, converted to real distance on the detector by usingconversion factor and subtracted from the actual distance between the two grids on thephantom.
Other parameter that can be evaluated with this technique is differential linearity, whichmeasures the short range deviations from the straight line and is given by the SD in mms, foradjacent peak separations between all peaks in a specified field of view. The SD obtainedin mm, converted to real distance, is the differential linearity.
System Spatial Resolution: System spatial resolution is measured as full width at halfmaximum (FWHM) of the line spread function obtained with two parallel line sources(5 cm apart). Image of the two line sources is obtained on X-ray film and scanned on adensitometer. The density values on the peaks is converted to intensity setting values (fromthe characteristic curve of the film) and the LSF is plotted with respect to intensity values inarbitrary units. The new LSF curves are then used to calculate FWHM in mm which isconverted to absolute distance by using a conversion factor.
The quantitative method of analyzing densitometric data for defining the performanceparameters of scintillation camera as described above is very simple. The basic flood fieldimages required for further quantitative analysis can be obtained in any hospital withoutdifficulty by following a standard protocol. Analysis of these images can be done at acentralised institution on a service basis, a system similar to that of a film badge service. Thepotential of this method is:
(a) in survey of large number of scintillation cameras;
(b) in acceptance testing after installation of the system and
(c) in a long term follow-up of scintillation camera performance as described below.
Sequential evaluation of Performance Characteristics of Gamma Cameras by DensitometricTechniques
One of the application of densitometric technique is sequential study of the performancecharacteristics of scintillation camera at regular intervals. We had carried out such studieson two gamma cameras. Camera A, installed in 1978, did not have uniformity correctioncircuit and Camera B. installed in 1984, had built-in uniformity as well as linearity correctioncircuits. From the log books, old data and flood field films from 1982 to 1987 of bothgamma cameras were taken out. Quantitation of various performance parameters werecarried out on these films by microdensitometry, by the methods described above.
58
QUALITY CONTROL OF IMAGING DEVICES
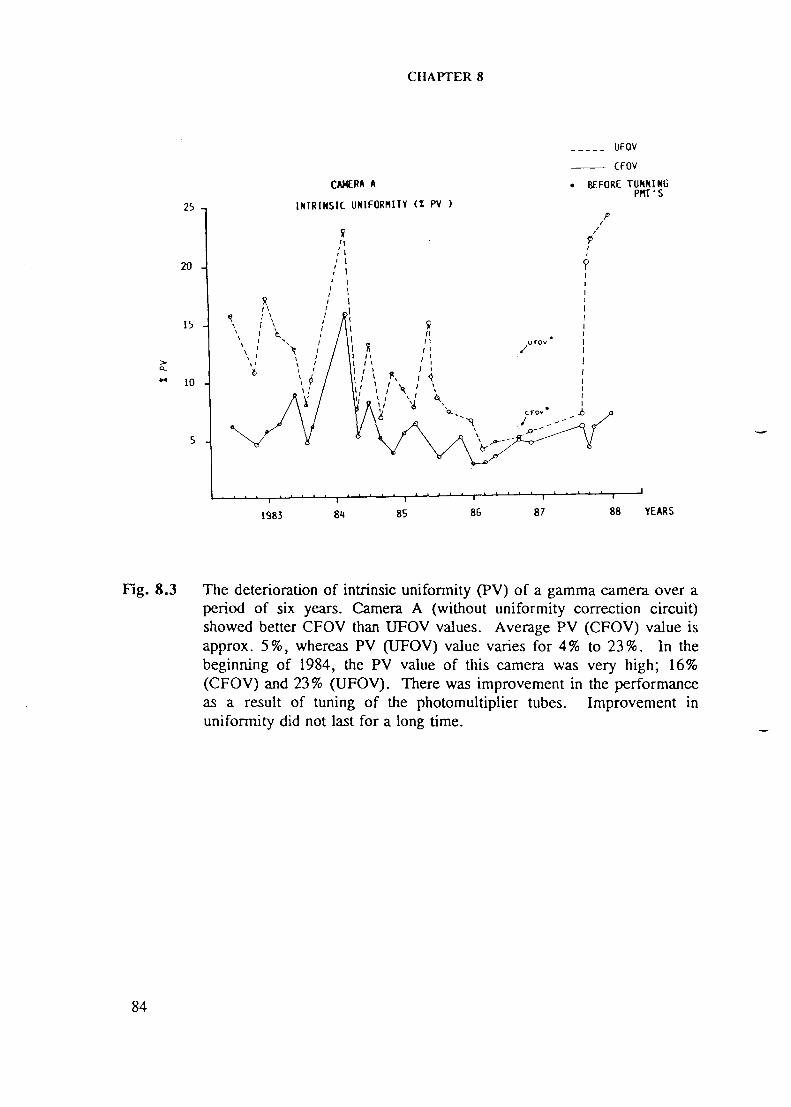
The deterioration of intrinsic uniformity (PV and AS) of the two gamma cameras overa period of six and four years respectively, are shown in Figs. 8.3 to 8.6. Camera A(without uniformity correction circuit) showed better CFOV than UFOV values (Fig. 8.3).Average PV (CFOV) value is approximately 5%, whereas PV (UFOV) value varies for 4.0%to 23%. In the beginning of 1984, the PV value of this camera was very high; 16% (CFOV)and 23.0 (UFOV). There was improvement in the performance as a result of tuning of thephotomultiplier tubes (Fig. 8.3). Improvement in uniformity did not last for a long time.
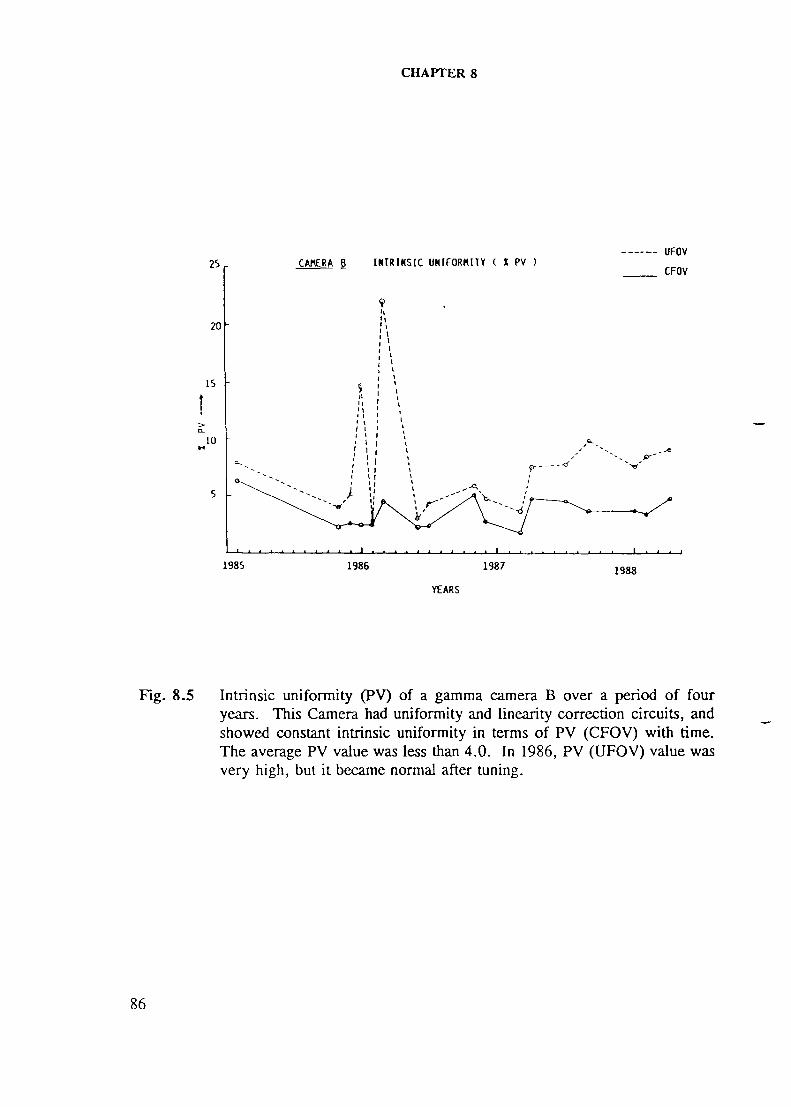
Camera B, with uniformity and linearity correction circuit, showed constant intrinsicuniformity in terms of PV (CFOV) with time (Fig. 8.5) and the average PV value was lessthan 4.0. In 1986, PV (UFOV) value was very high, but it became normal after tuning.
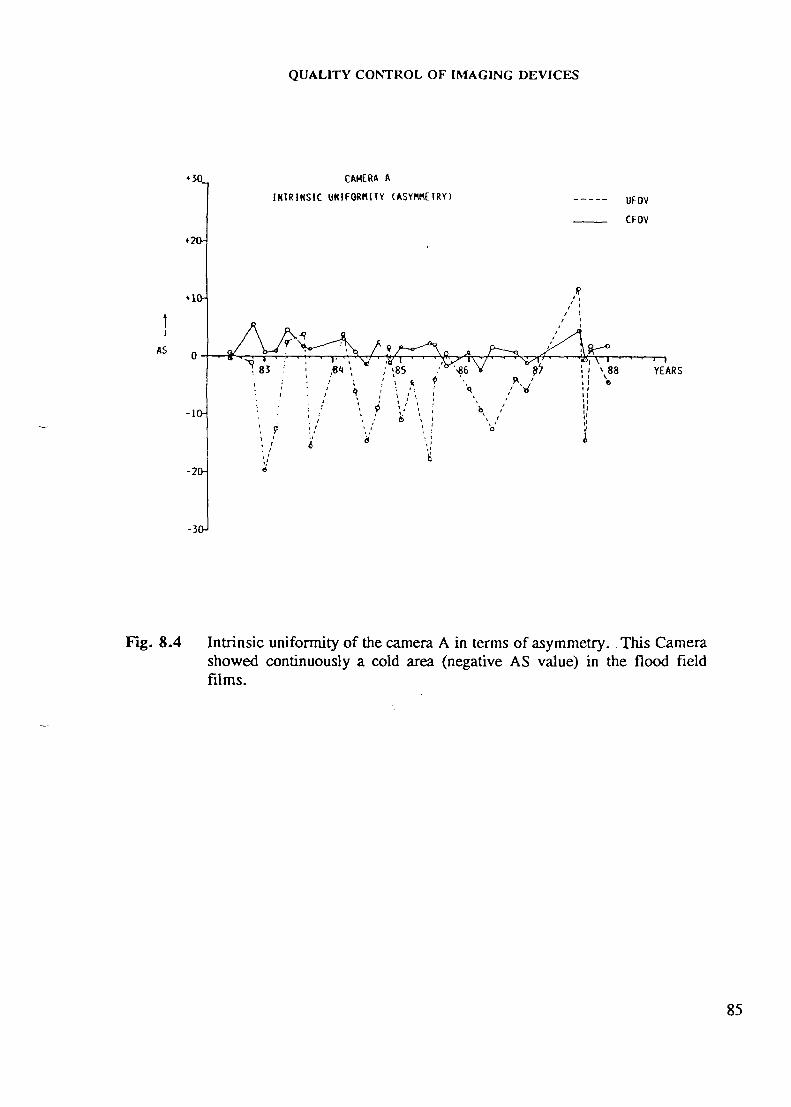
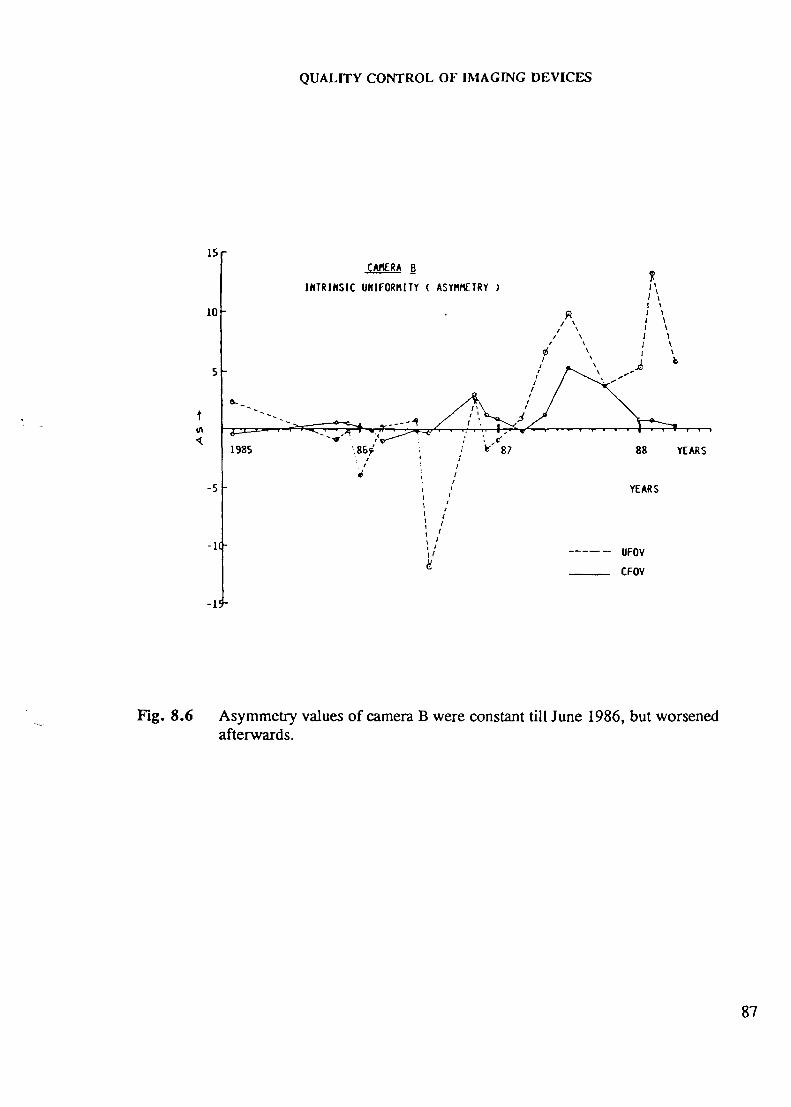
Asymmetry values of camera B (Fig. 8.6) were constant till June 1986, but worsenedafterwards. On the other hand, Camera A showed continuously a cold area (negative ASvalue) in the flood field films (Fig. 8.4).
In conclusion, Camera A without uniformity correction circuit showed poorer uniformitythan camera B which had automatic uniformity - linearity correction.
Count rate performance tests
The ability of a camera system to operate successfully at high count rates can beevaluated in terms of:
(a) Maximum count rate capability
(b) Dead time (T) and
(c) count rate at 20% counting losses.
Maximum count rate capability
(a) Remove collimator. Place the ring to restrict the field to useful field ofview (UFOV).
(b) Bring a point source (approximately 800 /xCi) of "Tc"1 from a certain distance, tothe detector face in steps, along an axis. Measure the count rate at every step andfind out the maximum acceptable count rate.
(c) Compare this value with the manufacturer's specifications. In a worst situation,it should not be less than 60 000 cps.
59
CHAPTER 8
Dead Time
It is the time interval for which the system is insensitive after every recorded event inthe electronic system. It can be categorised either as paralysable or non-paralysable systemdepending upon electronics involved in it.
Paralysable System is unable to record a second event unless there is a time interval ofat least Tp between the two successive events. The period of insensitivity is further extendedby any additional true event taking place before full recovery.
Non-Paralysable System is insensitive after each observed event. The period ofinsensitivity is not affected by any additional true counts.
A technique for measuring the dead time of the camera by a two source method isdescribed in TECDOC-317, under the assumption that the system is fully paralysable in therange where a 20% data loss is expected.
Measurement of dead time CTp) by two source method
(a) Use two sources A and B, with 2 MBq (54 /iCi) of "Tcm. Remove all otherradioactive sources from the room.
(b) Place both sources (A + B) at a distance greater than 1 meter, along the axis infront of a bare crystal with a lead ring. The count rate should be 20 000 cps.
(c) At this distance, measure A, A + B, B, B+A, A in sequence (20% windowcounting).
(d) Find the mean of A (Rl), B(R2) and A+B (R12).
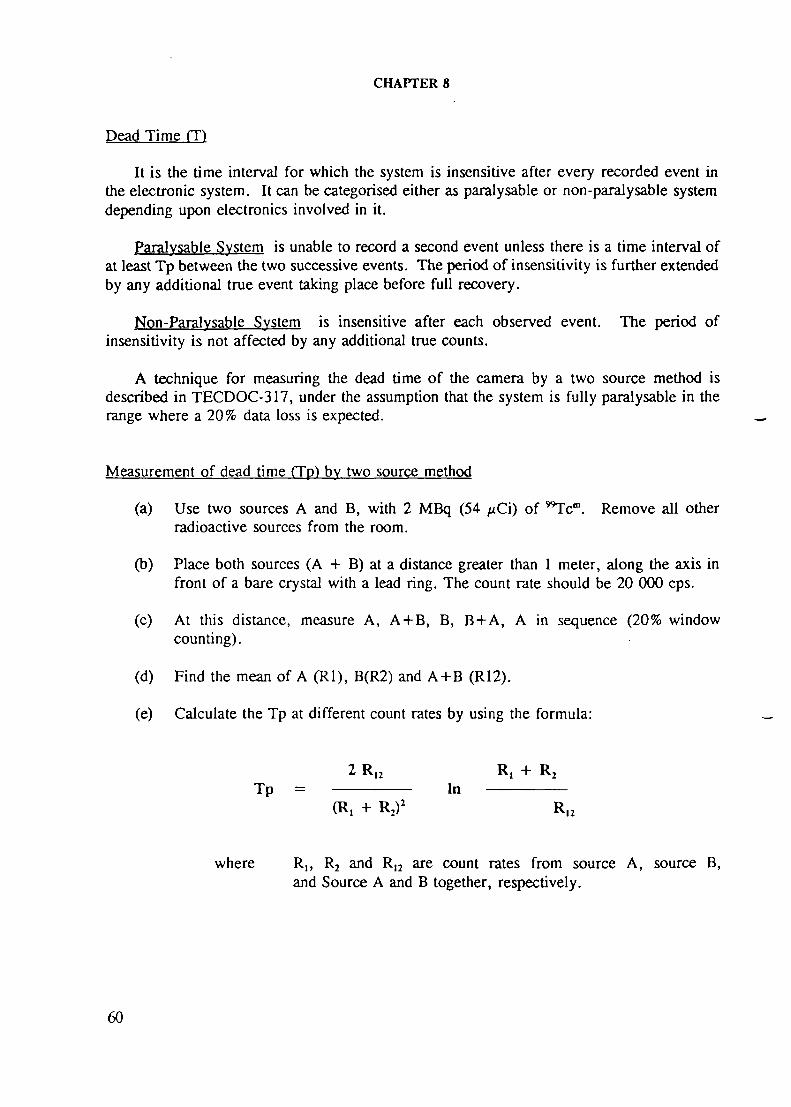
(e) Calculate the Tp at different count rates by using the formula:
2 R12 R,Tp = In
(R, + R2)2
where R,, R2 and R,2 are count rates from source A, source B,and Source A and B together, respectively.
60

QUALITY CONTROL OF IMAGING DEVICES
(f) Calculate the input count rate for a 20% loss (R.20»)i by
1 10 0.2231R-20% = — 1" — =
Tp 8 Tp
(g) Calculate the observed count rate for a 20% count loss Qo*. by
0.2231 0.17848C10% = 0.8xR.IMfc = 0.8 x =
Tp Tp
(h) At routine testing, a change in the value of R.2O* by more than ±20% from thereference value would call for follow-up action.
Alternative Method
Measurement of counting losses (copper absorber plates method):
(a) Remove the collimator and place the ring to mask the camera to UFOV.
(b) Calibrate the instrument for "Tc1" (Peak 140 Kev, 20% window).
(c) Take background count for a preset time of 100 seconds and note the backgroundcount rate.
(d) Take approximately, 5 mCi (185 MBq) of "Tcm in a collimated vial (shield thesource with a lead pot having thickness of 6 mm and fill the vial with water so thatthere are no air bubbles) and place it at a distance greater than 1.5 m along thedetector axis. The count rate should be approximately 75 000 cps.
(e) Take the counts by increasing number of absorber plates in front of the source tillbackground counts are recorded, approximately 2000 ± 500 (N[).
(f) Assuming that at this low count rate, counting losses are negligible, the incidentcount rate, No, given out by the source and falling on the absorber having totalthickness 'X1 (no. of plates x thickness of single plate) is obtained from theformula:
— AJ - «N, =
where u is absorption coefficient of copper at 140 Kev energy.
61
CHAPTER 8
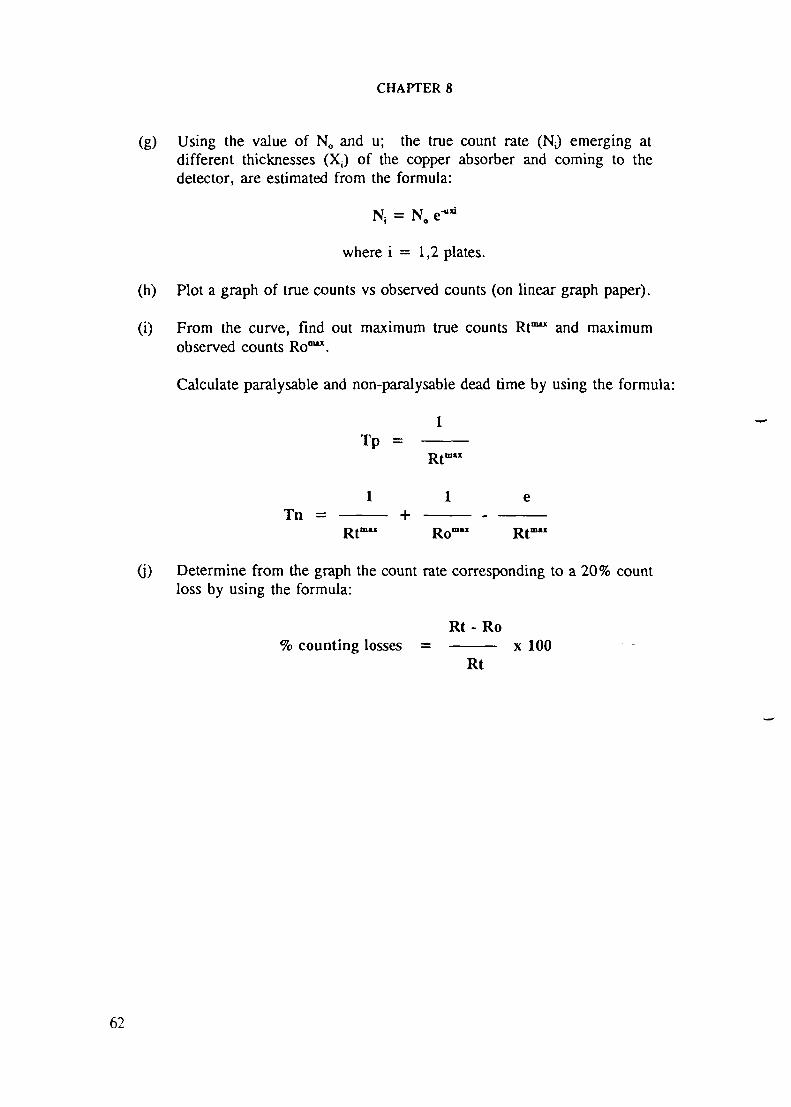
(g) Using the value of No and u; the true count rate (NJ emerging atdifferent thicknesses (X;) of the copper absorber and coming to thedetector, are estimated from the formula:
N, = No e-ri
where i = 1,2 plates,
(h) Plot a graph of true counts vs observed counts (on linear graph paper).
(i) From the curve, find out maximum true counts Rt"" and maximumobserved counts Ro1"".
Calculate paralysable and non-paralysable dead time by using the formula:
1T p =
Rtm"
1 1Tn = +
Rtm" Rom" Rtm"
(j) Determine from the graph the count rate corresponding to a 20% countloss by using the formula:
R t - Ro% counting losses = x 100
Rt
62
QUALITY CONTROL OF IMAGING DEVICES
QUALITY CONTROL OF SPECT SYSTEM
Planar imaging provides only a two-dimensional image of a three-dimensional distributionof activity within the body, whereas single photon emission computerized tomography(SPECT), gives 3-D information about an organ, by removing the super-imposition ofoverlying structures. Unlike conventional planar imaging, SPECT imaging is quite intolerantof poor camera performance and bad patient positioning. Image defects present in the planarviews are amplified by the reconstruction process. A good quality assurance program isessential to minimize the adverse effects of various artefacts on the quality of SPECT studies.
Flood Uniformity
Any gamma camera, even when properly tuned, exhibits some non-uniformities, whilethese variations in field uniformity are acceptable for planar images, they can cause severeartefacts in reconstructed SPECT images due to variations caused by local magnetic fieldinfluences on photomultiplier tubes during detector rotation (which is not a serious problemwith improved version of PMT - shielding designs), slippage of PM tubes, shift of thecollimator, and differential non-linearities in the computer interface (ADC). Defects in thecollimator, even minor ones, may introduce further non-uniformities due to regionalsensitivity variations. During the reconstruction of an image, any non-uniformity defect isback projected throughout the 360° radius of rotation, and will produce a circular patternaround the centre of rotation which is known as a "ring artefact" or "bull's eye". If thenon-uniformity is due to "hot area", the pattern formed will be a ring of increased activity.If the non-uniformity is due to a photopenic area, the outcome will be a ring of decreasedactivity.
The ring artefact depends on:
(a) the amplitude and location of non-uniformity (e.g. non-uniformity defects close tothe centre of rotation produce small and intense ring artefacts and those at theperiphery of the field of view, large and diffuse ring artefacts) and
(b) the size of the object (proportional to the ratio of size of object to size ofnon-uniformity) and
(c) image counting statistics. For that reason, ring artefacts are more prominent inSPECT liver or lung imaging than in heart imaging, since a small organ will createless problems than large objects.
63

CHAPTER 8
Uniformity Correction
Non-uniformity can be corrected by acquiring a flood field with infinite statistics, e.g. fora matrix 64, the total number of counts required is 30 million counts. For the matrix size128, 120 million counts are required. The general rule is that the standard deviation per pixelof the flood should be around 1.0%.
Procedure for Uniformity Correction
(a) The SPECT software available on the system enables the user to collect andretrieve a flood-correction matrix.
(b) Fill the commercially available refillable transmission source phantom withapproximately 25 mCi "Tc™.
(c) Mix the activity uniformly; care should be taken to avoid air bubbles and bulgingof the phantom as this would introduce a non-uniformity across the field of view.
(d) Clamp the flood source to the collimator face.
(e) Acquire a flood field correction matrix with acquisition parameters - 360° rotation,180 number of views, radius of rotation of LEAP collimator and total counts perstudy 30 million for 64 x 64 matrix or 120 million for 128 x 128 matrix. Ingeneral, the rule of the thumb is to have at least 10 000 counts/pixel so thatstatistical error is around 1.0%.
(f) If necessary, an overnight collection of the flood counts can be done.
(g) Store flood correction matrix coefficients in save area as described inmanufacturer's operating manuals.
(h) Flood correction can be applied either to each projection frame duringacquisition of a clinical study or to the complete data projection at theend of the study.
(i) Repeat step (a) to (d) for various collimators.
Centre of Rotation (COR)
Back projections of a point source, located on the axis of rotation (mechanical COR) ofthe detector, will be at the centre of each of image matrix at all angles (electrical COR). Ifmechanical and electrical centre of rotation are well adjusted the reconstructed imagerepresents accurately a point source without any distortion. In practice, it is very difficultto align perfectly the centre of rotation of the camera detector with the centre of the imagematrix. With any misalignment or offset, the SPECT image of the point source is a ring
64

QUALITY CONTROL OF IMAGING DEVICES
rather than a point. This offset is not important for planar imaging but can degrade thequality of the reconstructed SPECT images. A ring, produced by a small offset, may not beresolved, but will blur the reconstructed image. In the case of 180° acquisition(e.g. myocardial imaging) the back projection lines will intersect at a semi-circle instead ofa full circle, as is the case for a 360° acquisition and the point source reconstructed imagewill produce a crescent pattern.
Causes of COR Artefacts
COR artefacts, or misalignments, may be the result of gradual wear and tear of the gearsof the rotating gantry, discrete changes in crystal packing or change in the ADC gain etc.Software available in the system can calculate the value of offset correction to the dataacquisition matrix before back projecting to the image matrix.
The COR correction is performed after the uniformity correction; otherwise thesensitivity map would not match the shifted images.
Procedure (To measure the offset of the COR - Weekly)
(a) Place a point source or line source near the centre of rotation.
(b) Acquire a SPECT study with 60 projections (every 6°), with a matrix of 64 and ifnecessary with matrix 128 (as suggested by the manufacturer's operating manuals)to improve the resolution for small offset values.
(c) Display the data in cine mode and examine the quality of sinogram. Calculate theCOR factors by the software.
(d) Store the value of offset correction for later acquisitions.
(e) If a significant change in the COR plot is observed, then remount the collimatorand repeat the above procedure.
(f) The offset value should be less than 14 pixel. A deviation of more thanxh pixel would require a call to the service engineer to inspect ADC andgantry.
(g) Repeat the study with different collimators.
Alignment of Detector/Table with the axis of Rotation
The detector must be parallel to the axis of rotation (i.e. collimator holes areperpendicular to the detector and thus the axis of rotation). Since reconstructed images aremade up of data from other planes, images will be blurred if the camera head is not parallel
65

CHAPTER 8
to the axis of rotation. Check built-in bubble level prior to acquisition, to make sure that thedetector head is perfectly levelled.
Adjustment of X-Y Gains
The gains over the two axis of the detector should be matched so that pixel cross-sectionareas are square.
66

QUALITY CONTROL OF IMAGING DEVICES
QUALITY CONTROL OF NUCLEAR MEDICINE COMPUTER
Quality Control of Computer Hardware
Computer used in Nuclear Medicine has several important components viz.camera-computer interface (ADC); central processing unit (CPU); memory devices; displayunit; operating system etc.
Analogue digital converter (ADC) is the one which interfaces gamma camera to thecomputer and converts the analogue signals from the camera to digital numbers. The outputof the camera normally consists of three analogue signals. The X and Y position signalscarry the position information of the detected event and Z unblank signal indicates that a validevent has been detected. If the camera is an "all-digit" type, the image data may betransferred to the computer through a direct digital interface.
The X, Y and Z (unblanking) signals must arrive at the camera scope in exactly the rightsequence. Most computers allow adjustment of the Z unblank pulse length to ensure that Xand Y signals are converted into digital form at an optimum time. If conversion is carriedout too early, position signals will not have sufficient time to settle and hence loss ofresolution will occur. Very long unblank pulse will also cause invalid position signalresulting in loss of resolution and sometimes image distortion. By adjusting the pulse lengthof unblank signal and simultaneously observing clinical and quality control images will alertthe user to this problem.
Z-pulse length adjustment of ADC
(a) Remove collimator and place a resolution phantom on the detector.
(b) Place a point source ("Tcm) at a distance five times the diameter of the crystal.
(c) Adjust activity in such a way as to have count rates of 25 000 to 30 000 cps with20% PHA window width.
(d) Locate ADC and Z control boards.
(e) Connect channel A of scope (CRO) to 'X' test point and channel B to Z test pointon the board.
(f) Adjust trigger level of channel A and B, on the scope, for a stable display.
(g) Monitor the image of bar lines on the display.
67
CHAPTER 8
(h) Observe the X signal on the scope and adjust Z pulse length to the optimum.
(i) The X signal must be perfectly flat during the unblanking pulse length. Adjust theZ pulse length in such a way so that its falling edge occurs before any change inthe X signal.
(j) During adjustment of the unblanking pulse length, observe the image of thephantom on the display. The optimum unblanking pulse length is the one whereimage shows best resolution.
(k) Repeat steps (f) to (j) by connecting channel A of the scope to 'Y' test point.
X/Y Position signal gain adjustment
In ADC, the gain of X and Y position signals should be adjusted properly to give equalamplification so that object to image relationship remains constant in both X and Y directions.In that case a round object will give a round image. A drift in one of the amplifier will showa round object as an oval image. To ensure that the position signals cover the full field ofview of the computer, it is common to provide gain and offset adjustments in the ADC.
(a) Remove collimator and place a protective cover on the crystal.
(b) Repeat step (b) to (f) as described above.
(c) Locate the X gain and X offset adjustments in ADC board.
(d) Draw a square region of interest (Rol) of maximum size to define thefield of view of the computer.
(e) Adjust X gain and offsets in such a way that the flood image touches the boxgenerated by Rol horizontally left and right.
(f) Repeat step (c) to (e) for Y gain and offset.
(g) Check that the flood image touches the box on the top, bottom, left and right side.If not, then readjustments of X/Y gains and offsets are required.
(h) If the gains over two axis of the detector are not equal, pixel cross-section areasover the matrix will not be square, which is a pre-requisite for accuratereconstruction of a SPECT image.
Note: It is recommended that the above tests are performed in the presenceof a service engineer.
68

QUALITY CONTROL OF IMAGING DEVICES
Quality Control of Clinical Application Software
Computer software: A nuclear medicine computer system consists of hardware componentswith software elements to form a functioning unit. The software components in a nuclearmedicine computer system are:
(a) Acquisition;
(b) Display;
(c) Analysis;
(d) Reporting programs;
(e) Operating system;
(f) Quality assurance programs to assess the validity ofinformation received, the system calibration and finallyquality control of application software and
(g) application programs written by the user.
All manufacturers of nuclear medicine camera-computer systems offer a wide range ofclinical application software. In addition, a large number of user-written programs are alsoin clinical use. It has been found that the results obtained with various programs on the samestudy differ considerably. It is important to evaluate all new software obtained from thevendors or other users. Even a so called perfect software may not be free of bugs, whichmay be subtle and may occur only under specific circumstances. In short, apart from routinequality control of imaging devices, it is of utmost importance to do quality control of clinicalapplication software.
Software validation: The term quality assurance or quality control in the context of nuclearmedicine should be restricted to the performance of the hardware and the same term shouldnot be extended to software. Instead of quality control of software, it is more appropriateto call it 'software validation' since there is no hardware breakdown associated with this. Forexample, non-uniformity of a gamma camera could be due to drift in the gain of the PMTor breakdown of the electronic circuits. In contrast to this, software 'failure1 may occur ifthe input data is improper.
Efforts have been made to define the quality control protocol for the software. However,no standardized methods are yet available, due to the dissimilarities between the hardware andsoftware of nuclear medicine computers. Recently, an attempt has been made in Europe bythe establishment of a project within the frame work of COST (Co-operation in Science andTechnology) entitled "quality control of nuclear medicine software".
69
CHAPTER 8
Software Phantoms: A Software Phantom is simply a typical set of studies (static ordynamic) of a particular type, which can be analyzed on computer systems having differenthardware and software packages. The results obtained with different computers should becomparable. Once a software phantom is established, it can serve as a "gold standard" tovalidate different software to ensure that the results obtained match the expected results. Themain objectives of software phantoms are:
(a) To check the performance of the data analysis software of different computersystems i.e. software validation.
(b) To check the intra-variation results of institutions, and operators.
(c) To familiarize the new users to a wide range of analysis software.
Development of software phantoms: A software phantom can be developed from threetypes of data:
(a) Validated clinical patient data (real).
(b) Data generated from hardware phantom i.e. Pseudo patient data.
(c) Mathematical phantoms.
First two software phantoms i.e. software phantoms derived from real clinical data andpseudo patients are based on the assumption that the acquisition is performed without anyerror. In contrast to this, a mathematical phantom does not depend upon the performance ofa scintillation gamma camera and acquisition software.
Validated clinical patient data: It is a typical clinical study in a patient with a confirmeddiagnosis. These studies are usually collected from a reputed institution and the diagnosticconfirmation is by other "gold standard" techniques. A set of clinical studies (having normaland abnormal physiological conditions) are used as input to the software system to beevaluated and the results compared with what would be expected.
A major difficulty in the development of this type of software phantom is to ensure thatthe results obtained from it do meet expectations. One has to be absolutely sure of thediagnostic validation. For example, a gated cardiac study (MUGA) that demonstrates an EFof 20.0% is included as a software phantom, the question arise is how sure one can say thatthe EF is 20.0%? It is difficult to comment on the accuracy of the result, unless it isconfirmed by some other modality or "gold standard". Also, sometimes it is difficult tocollect data that will test the software for a variety of conditions which may be expected tooccur in clinical practice.
Hardware Phantom (Pseudo patient data): A pseudo patient data can be obtained from somesimple physical model or hardware phantom, something similar to the 90° bar quadrant
70

QUALITY CONTROL OF IMAGING DEVICES
phantom used to assess the resolution of gamma camera. For dynamic studies, more complexsoftware phantoms may be derived from data collected from hardware phantoms withmechanical motion simulating physiological conditions such as cardiac motion. One of thistype of phantom is a cardiac phantom used to evaluate EF software.
Such a phantom, not only assesses analysis software but also acquisition software,whereas "real patient data phantom" is independent of acquisition software. At the sametime, the drawback of this type of phantom is that if acquisition of data is not perfect, theresult derived from it may be bizarre. Also, the phantom may not simulate all conditionslikely to be encountered in clinical practice e.g. arrhythmia or premature heart beats.
Mathematical Phantoms: This type of phantom is derived from an algorithm having thedesired input characteristics i.e. patient study is made from a set of mathematical equationse.g. left ventricular curve generated from cosine wave equation. Such a phantom is free frompossible errors imposed by data acquisition. Recently, several mathematical phantoms havebeen tested for validating the EF and Fourier phase analysis software packages but thesesoftware phantoms have been found lacking in several respects.
Problems encountered in the Development of Software Phantoms: Software phantoms arevery useful for validating analysis software, especially centres in developing countries wouldhave an opportunity to compare their results directly with those obtained in more developedcentres. Though, the idea seems to be very simple but the testing of a software, is ingeneral, a complicated task and a number of problems encountered during validation of asoftware are:
(a) File structure of patient files varies from system to system, which imposeslimitations on the free exchange of clinical data between institutions,
(b) The non-standard recording of administrative data on different computers is anotherproblem e.g one system may record the data and may increment the image arrayin a matrix from top left to bottom right, whereas another system may incrementfrom bottom left to top right. Similarly, one computer records the ECG R-Rinterval and another system records only the frame time.
Solution to this problem is either, all manufacturers should change over to a commonimage data file format or they provide software for conversion of one format to a commonformat. Recently, American Association of Physicists in Medicine (AAPM) hasrecommended a standard format for image data exchange on magnetic tape. Using this as afile structure for intermediary storage and distribute of software phantoms may be the solutionto the problems that have been encountered to date.
Software phantom for Dynamic Cardiac Phantoms:
Recently, IAEA has initiated a number of projects to develop a software phantom forgated blood pool study with the objective that the latter can be used in developing countries
71

CHAPTER 8
for validation of their EF analysis software. In one of the project, a random set of MUGAstudies consisting of normal and several abnormal cardiac situations were collected. Theoriginal studies were in DEC-GAMMA-11 file format and later on efforts were made toconvert these studies to five different computer systems. The software phantoms were thenanalyzed on each of the six computer systems using the available EF analysis software.There were number of initial problems encountered during transfer of file from one to anothermagnetic media and reformatting the file structure for image and administrative records inorder to make the studies readable as patient files on different systems. Later on, the analysissoftware either failed to analyze the studies or could only provide incomplete results. Thenon-standard file structure and administrative data are some of the initial teething problemscausing hindrance in achieving perfect software phantoms which are totally compatible fordifferent computer systems.
Test of Computer acquisition timing:
In static mode:
(a) Remove the collimator and place 300 /xCi (10 MBq) "Tcm point source in front ofthe open crystal in such a way as to have count rate of 5000 cps.
(b) Set the real-time clock of the computer to the correct time of the day.
(c) Acquire a static image in the computer for 1000 seconds and simultaneously startstop-watch.
(d) Record the stop-watch time at the end of the data acquisition.
(e) Record the elapsed time recorded by the computer (difference of real time clockat the end and beginning of the study).
(0 Repeat step (c) to (e) with a higher count rate (40 000 cps).
(g) Compare the requested collection time (1000 sec in this case) with the timesindicated by the stop-watch and the real time clock of the computer.
(h) In ideal conditions, there should not be any difference in time and anerror of more than 1.0% is not acceptable.
In dynamic mode:
(a) Place 300 /xCi (10 MBq) ^Tc"1 point source in front of the open crystalin such a way as to give a count-rate of 25 000 to 30 000 cps,
(b) Acquire a static image in normal mode for 20 sec.
72
QUALITY CONTROL OF IMAGING DEVICES
(c) Also, set up a dynamic acquisition study with the largest frame rate available(say 500 to 1000 frames per sec).
(d) Acquire the data and start stop-watch simultaneously.
(e) Record the elapsed stop-watch time at the end of the acquisition.
(f) Repeat steps (c) to (e) for different matrix (e.g. 32 x 32 word,64 x 64 byte, 64 x 64 word etc.) and also for list mode acquisition.
Data Analysis:
(a) Determine total count in the static image (say Cs) and in each frame of thedynamic (say Cf).
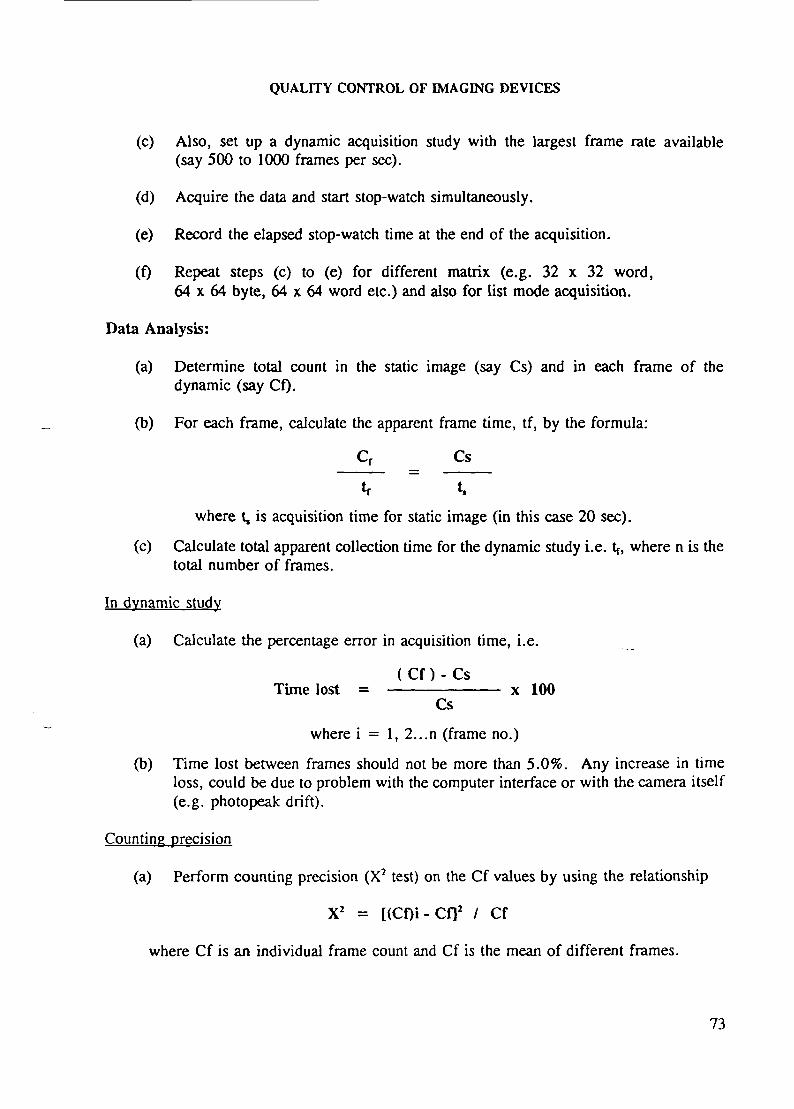
(b) For each frame, calculate the apparent frame time, tf, by the formula:
Cf Cs
tr t,
where t, is acquisition time for static image (in this case 20 sec).
(c) Calculate total apparent collection time for the dynamic study i.e. tf, where n is thetotal number of frames.
In dynamic study
(a) Calculate the percentage error in acquisition time, i.e.
( C f ) - C sTime lost = x 100
Cs
where i = 1, 2...n (frame no.)
(b) Time lost between frames should not be more than 5.0%. Any increase in timeloss, could be due to problem with the computer interface or with the camera itself(e.g. photopeak drift).
Counting precision
(a) Perform counting precision (X2 test) on the Cf values by using the relationship
X2 = [(COi-CfJ2 / Cf
where Cf is an individual frame count and Cf is the mean of different frames.
73
CHAPTER 8
(b) Check whether the variation in counts is within that expected by countingstatistics.
Check of ECG-Gated Acquisition:
In gated studies, it is necessary to ensure that the timing of the ECG R wave is correct.Gating requires a constant heart rate and cannot be applied effectively in the presence of anarrhythmia or false ECG triggered R wave. With the result, the End Systolic (ES) point willbe shifted on the LV time activity curve. IAEA-TECDOC-317 has described a simple test tocheck the performance of ECG gating system, as given below:
Procedure:
(a) Place the "Tcm point source (approximately 3 mCi) in front of the detector.
(b) Connect ECG leads to a normal volunteer (ensure constant heart rate).
(c) Acquire data in computer according to MUGA frame mode protocol.
(d) Repeat the acquisition in list mode.
(e) Repeat the study with the volunteer occasionally moving arm, to producespikes on the ECG to check the beat rejection system.
(f) Select region of interest and plot time-activity curve (TAC). In perfectECG gating signal the time activity curve will be a horizontal line.
(g) Calculate the mean ± S.D. of the data points in the first three quarters ofthe TAC.
(h) Any deviation of more than three S.D. of the TAC curve from a horizontal linemay indicate a failure in ECG gating system and should be investigated further.
74

QUALITY CONTROL OF IMAGING DEVICES
QUALITY CONTROL OF RECTILINEAR SCANNER
Introduction
Since rectilinear scanner is a slow imaging device, it is better to keep a number ofperformance parameters for quality control to a minimum, so that the time involved in doingquality control will not interfere with the normal routine of the department. Many of thecomponents of a scanner are not subject to change during operation. These includecollimator, motor speed of scanner, rate meter time constant and linearity of spectrometer.
Few quick daily/weekly tests to ensure that the scanner components are operatingcorrectly, are given below:
(a) Test of function of scaler-timer/parameter.
(b) Photopeak-to-total count ratio.
(c) Step-wedge response.
(d) Density calibration.
Test of function of sealer-timer ratemeter (Daily)
(a) Switch on the scanner and put on 'test' position, so that 50 cycles per secondexternal signal is counted for 60 sec.
(b) If 3000 (50 x 60) counts are registered, proper functioning of the timer-sealer isindicated. '
(c) If electric line frequency is 60 cycles per sec, then the rate meter should show3600 counts per min.
(d) Presence of noise in the electrical line will increase the count rate.
Photopeak-to-total count ratio (Weekly)
(a) Remove collimator.
(b) Place a sealed "Co (122 Kev) disc source at a distance of three feet from thecrystal surface. Always use the same distance for follow-up studies.
(c) Calibrate the PHA by keeping one volt window.
75

CHAPTER 8
(d) Open three volts window above the peak (lower base line 107, upper base line125 Kev).
(e) Collect minimum of 10 000 counts. Note the time and record the count rate(counts/min).
(0 Open the upper window to maximum and lower window to 60 Kev(Integral counting).
(g) Again collect 10 000 counts and record the count rate,
(h) Calculate photopeak-to-total count ratio
Peak Counts/min (Step e)
Total counts/min (Step g)
(i) Any change in photopeak-to-total count ratio indicates loss of resolutionand sensitivity.
(j) For comparison, the test should be carried out weekly under identical conditionsi.e. source to collimator distance, window width, gain and H.V.
Test of contrast enhancement/film density of photodisplay/ background subtraction bystep-wedge phantom
Contrast enhancement (Weekly)
(a) Take 2.5 mCi of "Tcm in a Emission-type step wedge phantom [Please, refer toIAEA-TECDOC-317].
(b) Place the phantom horizontally under the scanner and perform scanning using acommonly employed routine setting.
(c) Repeat step (b) using different contrast enhancements.
(d) Compare the images with the reference images.
(e) A change in the step-wedge image is an indication of change in contrastenhancement or intensity.
Film Density of Photo Display (Weekly)
(a) If a film densitometer is available, measure film density (FD) at the centre of eachsection of the image of step-wedge phantom.
76
QUALITY CONTROL OF IMAGING DEVICES
(b) Plot a graph of film density vs wedge thickness for various settings of contrastenhancement.
(c) Compare results with reference curves.
(d) File curves in the log book.
Alternative Method:
If step-wedge phantom is not available, Film density of photodisplay can be calibratedby a simple method as given below:
(a) Invert the detector head and place a container with radioactive source on top of thecollimator and fix it with adhesive tape.
(b) Adjust the detector voltage and switch on the integral mode.
(c) Select proper range and adjust the discriminator level in such a way that the pointerin a ratemeter shows 100% deflection.
(d) Set range differential at 100%.
(e) Keep high time constant (approx. 1 sec) and select one way mode on the scanner.
(f) Start the scan motor and obtain a full line corresponding to 100% density on aphotographic film. During the return of a scanner, when it does not record (sinceit is scanning one way mode), adjust the discriminator level in such a way that thecount rate is reduced to 90%. In the next line, when the scanner will record, 90%line will be obtained. In a similar way obtain 80%, 70%, 60%, 50%, 40%, 30%,20%, 10% and0% lines.
(g) By varying light source voltage and film density obtain various sets of tenlines tests.
(h) From these various sets, decide the optimum light source voltage and film density.
Test of Background Subtraction
(a) Repeat step (a) and (b) using different settings of the backgroundsubtraction control.
(b) Compare the image with the reference image.
Note: It must be emphasized that the above simple tests are adequate only forassurance of correct operation or identification of gross malfunction.
77

CHAPTER 8
QUALITY CONTROL OF DOSE CALIBRATOR
Dose calibrator is not an imaging device, but it is still included here because every dosethat is injected into a patient or used for filling a phantom is measured in a dose calibratorprior to its use. If the dose calibrator is faulty, none of the calibration studies or the clinicalinvestigations would give reliable results.
The majority of dose calibrators consist of ionization chambers coupled to circuits thatconvert the ionization current produced by radioactive sources, and display it in a digital formin units of activity. The accuracy and working performance of dose calibrator depend uponmany factors and regular quality control parameters, viz. precision, accuracy and linearityof its response to activity and operational checks of reproducibility and background needs tobe done daily.
Materials required for Quality Control
(a) Sealed low, medium and high energy gamma radiation sources calibrated to ± 5%overall accuracy or less, e.g. "Co (approx. 1 mCi; 37 Bq), 137Cs(approximately 100 /xCi; 3.7 Bq) and ^Co (approx. 50 /*Ci; 1.85 Bq).
(b) Unsealed radionuclides e.g. "Tcm, 113Inm, 131I in solution.
(c) Sample vials, syringes, pipettes, source holder and remote handling device forsources.
Test of Precision and Accuracy (Quarterly)
This test will provide information about random errors or loss of precision due tobackground changes, scatter (due to extra shielding), change in the pressure of the chambergas and slow electronic drift, etc.
Procedure
(a) Note the background reading.
(b) Measure the activity and record the background subtracted reading.
(c) Perform to replicate readings (Ai), where i=l ,2 . .n
78

QUALITY CONTROL OF IMAGING DEVICES
(d) Calculate Mean, S.D. and percentage of variation by using the following formula:
SD% P V = x 100
Mean
(e) Repeat step (a) to (d) for each gamma-radiation source.
(f) % PV value should be ± 5%.
(g) A quality control chart on which the % PV readings are plotted willhighlight the trend in instrument performance.
Accuracy
To assess accuracy, calculate for each source the percentage difference between the meanmeasured activity 'A' , and the activity of the source after applying decay correction on theday of measurement, A i.e.:
(A - 'A')Accuracy = x 100
A
(a) Repeat tests of accuracy for a wide energy range by using different radionuclides,such as "Co, 137Cs and wCo.
(b) Accuracy for each source should be within ±5%.
Measurement of Linearity of Dose Calibration (Quarterly)
(a) Elute "Tc™ from the generator.
(b) Transfer 100 mCi or more 9*Tcm activity (initial activity should be equal to orgreater than the highest activity for which the instrument is being used) in a samplevial and cap it firmly.
(c) Insert the sample vial into the dose calibrator.
(d) Measure and record the net activity (after subtracting the background) at one hourintervals up to 36 hours or more.
(e) Draw the line of decay of "Tcm on a semi-log graph paper.
(f) Fit the line by least square method.
79
CHAPTER 8
(g) Also plot net activity on a semi-log paper readings obtained in Step (d) forevery hour.
(h) Compare the data points plotted to a constructed straight line. In case, theinstrument is linear, all these points (Step d) should fall on this straight line.
(i) Any discrepancies indicate non-linearity of the activity response ofthe instrument.
(j) All individual activities measured in the test should be within ± 10% of the valuescorresponding to the straight line fitted to the data points.
Note: Care should be taken that "Tc™ solution is not contaminated withother radionuclides and there is no "Mo breakthrough.
Operational checks
(1) Background Response:
Record the background reading in activity units of a low gamma radiation K factor; Keepthe K factor same every day and take reading. Any increase in the background response ofmore than 20% requires necessary action.
(2) Reproducibility of Performance of a Calibrator:
(a) Measure the background corrected activity of a long lived sealedmedium energy gamma ray source (e.g. 137Cs, "Co etc. daily.
(b) Draw the line of decay of a standard source.
(c) Draw the limits of acceptability ( + 5% of expected activity) bytwo other straight lines parallel to the above line.
(d) Plot readings obtained in Step (a).
(e) If any individual reading lies outside these limits, it may be due tothe faulty performance of the instrument.
80

QUALITY CONTROL OF IMAGING DEVICES
SUGGESTED READINGS
[1] NATIONAL ELECTRICAL MANUFACTURER'S ASSOCIATION,NEMA 1: Performance measurements of scintillation cameras,Standards publication No. NUI-1980, Washington (1980).
[2] INTERNATIONAL ATOMIC ENERGY AGENCY, Quality Control ofNuclear Medicine Instruments, IAEA-TECDOC-317, Vienna (1984). .
[3] SORENSON J.A., Dead time characteristics of Anger Cameras,JNM, Vol.16, No.4, (1974) 534-535.
[4] RAIKAR U.R., DESHPANDE S.M., SONI P.S., GANATRA R.D.,Dead time of scintillation cameras with and without computer,International Journal of Nuclear Medicine and Biology,Vol.6 (1979) 181-182.
81

CHAPTER 8
Fig. 8.1 Flood field images of five different gamma cameras.
82

QUALITY CONTROL OF IMAGING DEVICES
075 0-85 O95 105 0-85 0-95 <05 1-15 075
FILM OENSITY
0-85 0-95 -(05
Fig. 8.2 The film density frequency distribution curves of the flood films shown inFig. 8 . 1 . It is obvious that broader the distribution, poorer is theuniformity of the flood field. Thus the entire curve represents the extentof non-uniformity.
83
CHAPTER 8
25 -,
20 -
15 -
10
CAMERA A
INTRINSIC UNIFORMITY (I PV )
UFOV
CFOV
. BEFORE TUNNINGPKT'S
1983 81—r85 86 87 88 YEARS
Fig. 8.3 The deterioration of intrinsic uniformity (PV) of a gamma camera over aperiod of six years. Camera A (without uniformity correction circuit)showed better CFOV than UFOV values. Average PV (CFOV) value isapprox. 5%, whereas PV (UFOV) value varies for 4% to 23%. In thebeginning of 1984, the PV value of this camera was very high; 16%(CFOV) and 23% (UFOV). There was improvement in the performanceas a result of tuning of the photomultiplier tubes. Improvement inuniformity did not last for a long time.
84
QUALITY CONTROL OF IMAGING DEVICES
• 50
•20-
•10-
i
AS
-10-
-20-
-30-1
CftHERA ft
INTRINSIC UNIFORMITY (ASYMMETRY)
83 :
', 9
<• / \ A :', •' 6 \ *
\ • v
"a
UFOV
CFOV
! i ' 8 8i i e
YEARS
Fig. 8.4 Intrinsic uniformity of the camera A in terms of asymmetry. This Camerashowed continuously a cold area (negative AS value) in the flood fieldfilms.
85
CHAPTER 8
2S
20
15
10
INTRINSIC UNIFORMITY ( I PV )UFOV
CFOV
1985 1988 1987 1988
YEARS
Pig. 8.5 Intrinsic uniformity (PV) of a gamma camera B over a period of fouryears. This Camera had uniformity and linearity correction circuits, andshowed constant intrinsic uniformity in terms of PV (CFOV) with time.The average PV value was less than 4.0. In 1986, PV (UFOV) value wasvery high, but it became normal after tuning.
86
QUALITY CONTROL OF IMAGING DEVICES
I S r
10 -
-5
-19
CAMERA B
INTRINSIC UNIFORMITY ( ASYMMETRY
1985 88
YEARS
YEARS
Fig. 8.6 Asymmetry values of camera B were constant till June 1986, but worsenedafterwards.
87