x-ray powder transmission diffractometry determination of...
TRANSCRIPT

Clay Minerals (1985) 20, 231-248
X - R A Y P O W D E R T R A N S M I S S I O N D I F F R A C T O M E T R Y D E T E R M I N A T I O N OF M I C A
P O L Y T Y P E S : M E T H O D A N D A P P L I C A T I O N TO N A T U R A L S A M P L E S
A. W l E W l O R A AND Z. W E I S S *
Institute of Geological Sciences, Polish Academy of Sciences, 02-089 Warszawa, Poland, and *Coal Research Institute, 71607 Ostrava Radvanice, Czechoslovakia
(Received 2 September 1983; revised 15 February 1985)
A B S T R A C T : Transmission powder patterns of random and of highly oriented samples of natural micas have been recorded and compared with those calculated from structural data with the aid of the DIFK computer program modified to correct for preferred orientation. Intensities calculated from structural data for random and for highly oriented samples (symmetrical and oblique settings) are presented for 1M, 2M~, 2M2, 3T polytypes of muscovite, 1M, 2M~, 3T polytypes of paragonite and 1M (C2/m and C2 space groups), 2M~, 2M 2, 3T polytypes of lepidolite.
Among theoretically-derived simple mica polytypes the 1M, 2M 1, 2M 2 and 3 T structures are frequently identified in both natural (Bailey, 1980) and synthetic specimens (Velde, 1965a,b; Munoz, 1968; Kotov et al., 1980). Micas are abundant in igneous and in pneumatolytic rocks, where they form megascopic crystals, and are widespread in sedimentary rocks down to clay-size flakes. It is important to have a quick and reliable method for..their identification.
The application of single-crystal methods for identification of phyllosilicate polytypes is limited to coarsely crystalline materials. Highly dispersed minerals must be studied by powder methods. The most effective is oblique-texture electron diffraction (Zvyagin, 1964, 1979), although this is not in general use as few research laboratories have access to high-voltage electron diffraction units specially designed for structure studies. Conversely, powder X-ray diffractometers are routinely used for identification of some layer-silicate polytypes in geological samples, but this type of approach is handicapped by technical inconveniences. Apart from overlapping, several important low-intensity reflections disappear due to partial particle orientation, which cannot be avoided during sample preparation. Thus determination of polytypes is difficult, especially in mixtures; for example, in micas it is necessary to take great care in distinguishing the 2M 2 form from a mixture of 1M + 2M 2 (Bailey, 1980).
The optical system of the transmission diffractometer (Klug & Alexander, 1954; Guinier, 1964) is suitable for recording patterns in the small to medium diffraction angle range (it precludes back reflection). With randomly-oriented aggregates of phyllosilicates, diffraction patterns may be recorded which exhibit standard intensities. Preferred orientation of mineral particles changes relative diffraction intensities in a way totally
�9 1985 The Mineralogical Society

232 A. Wiewi6ra and Z . Weiss
different from the reflection technique, where orientation results in an increase in intensities of basal reflections. On the contrary, in the transmission technique, preferred orientation results in a decrease in intensity or in complete elimination of basal reflections~but it may be used to enhance intensity of other reflections selectively (Krinari, 1975).
The aim of the work recorded in this paper was to facilitate polytype determinations in powder samples using transmission diffractometry and oriented aggregates. Applications of the developed procedure will be demonstrated for micas.
A G G R E G A T E S F O R X - R A Y T R A N S M I S S I O N W O R K
In transmission diffractometry the X-ray beam passes through a flat sample and is dispersed to give rise to diffracted beams. These are significantly affected by absorption.
The absorption of X-rays in transmission aggregates has been described by Decker et
al. (1948), Schultz (1948), Croche (1976), Courville et al. (1977), Planqon (1980) and Planqon et al. (1982). All presented an essentially equivalent formula:
A (4) = (1//]~t) [sin qJ/(sin # -- sin V)] [exp (--~Q/sin 4) -- exp (--faCt~sin ~,)] (1)
where: /] = mass attenuation coefficient, (t = unit mass (~ = specific gravity, t = sample thickness), # = incidence angle (Fig. 1), qJ = {b -- 20 (0 = Bragg angle). For the symmetrical setting (4 = n/2 + O, ~, = n /2 - 0), equation 1 takes the form:
A s = (1/cos 0) [exp (-- f l~t /cosO)] (2)
It is important to prepare transmission parallelpipedal powder samples of correct thickness for a given phyllosilicate in order that decrease of diffraction intensities by too small a sample volume is avoided. The same must hold for absorption by a thick layer of the sample, as an optimum value of absorption and sample thickness occurs when /]~t = cos 0. In the measuring range 0-31~ cos 0 values range from 1 to 0-9. Using mass attenuation coefficients and specific gravities of several phyllosilicates, it is possible to calculate optimal values of sample thickness for these two extreme Bragg angles (Table 1). However, direct use of a t value for preparation of powder aggregates is not feasible, not
\ FIG. 1. X ray path in transmission sample. 0 incidence angle, q/= 0 -- 20 (0 = Bragg angle).

X-ray powder transmission diffractometry o f micas
TAaLE 1. Optimal thickness and unit mass for transmission specimens.
233
t c m
~t Mineral ~ g/cm 3 9.9 ~ 31 ~ Average g/cm 2
Kaolinite 30-8 2.6 0.0123 0.0107 0.0115 0.030 Pyrophyllite 33.7 2-8 0.0104 0.0910 0.0098 0.027 Talc 32-9 2.7 0.0111 0.0960 0.0104 0.028 Muscovite 43.9 2-9 0-0077 0.0067 0-0072 0-021 Al-celadonite 50.6 2- 8 0.0070 0.0061 0.0065 0.018 Phlogopite 53.8 2-8 0.0065 0.0057 0.0061 0.017 Mg,Fe-chlorite 99.6 2-8 0.0035 0.0031 0.0033 0.009 Fe-biotite 138-3 3.0 0.0024 0.0021 0.0022 0.007
only because it is difficult to measure thin powder layers experimentally but also because t changes with the powder packing density. Therefore, in addition to t, unit mass values were calculated and are listed in Table 1. Unit mass has a physical significance and does not depend on packing density of the powder. The unit masses listed in Table 1 multiplied by the area of the X-ray window used for transmission give the optimal mass of powder necessary to obtain maximum intensities.
Fully oriented self-supporting samples of micas were prepared according to the optimal (t value (Table 1) by sedimentation from a dilute ultrasonically-treated slurry onto Mylar foil in a 32-ram diameter glass cylinder. (Filtration on to a plastic filter did not give satis- factory oriented aggregates, nor did the formation of X-ray specimens under stress.) The suspension was allowed to settle on the foil, supernatant water was sucked out and the sample film was left to dry at room temperature. After drying the film was separated from the glass tube and mounted in a standard window for transmission.
C O R R E C T I O N OF I N T E N S I T I E S F O R P R E F E R R E D O R I E N T A T I O N
Distribution of particle orientation plays an important role in petrofabric studies (Fayed, 1967), in quantitative mineralogical analysis (Taylor & Norrish, 1966; Wiewi6ra et al., 1981), and in estimating intensity distribution interferences (Ruland & Tompa, 1968; Plan~on & Tchoubar, 1977; Courville et al., 1979; Planqon, 1980, Planqon et al., 1982). It may be represented by an orientation distribution function, Ne(e), which is an expression of the fraction of particles whose (001) planes form an angle e with the flat aggregate surface. According to Planqon (1980) the function may be evaluated from the formula:
Ne(e) = Ie(e)/ I~(e) 2~ sin ed
in which the intensity Ic(c ) is corrected for absorption. Oriented samples enable selection of the correct angle of incidence of the X-ray beam
with respect to the sample surface (Fig. 1) to record maximum intensity of a given hkl reflection (0k0 type in Fig. 2). To achieve such a sample position one must calculate the angle I)hk I between the texture axis [001] and the [hkl] axis of a given family of planes.

234 A. Wiewi6ra and Z. Weiss
~m 3'2 ' 30 ' 2'8 ' 2'6 ' ; 2'4 2'2 ' 2 '0 ' 1 '8 ' 1'6 ' 1 4 ' 1'2 ' 1 '0 ' 8 ' 6 ' ~. ~
FIG. 2. Transmission diffraction pattern of very highly oriented sample of 2M 1 + 1M illite from Wi~ni6wka, Poland; symmetrical setting.
These v values were used to orientate the sample with respect to the primary X-ray beam. Diffraction conditions presented in Fig. 3 were fulfilled by adjustment of the sample surface on angle v (turning the sample around the goniometer axis by an angle v with a pulse counter fixed at 20 = 0~
The intensity distribution, I(e) was measured after further turning the sample only, step by step, with the pulse counter fixed at the diffraction position. For clockwise sample rotation the incidence angle is 4 ' - ( v + 0 ) - - e ' , and for counterclockwise rotation, ~" = (v + 0) + e"; respectively ~,' = (v - 0) - e' and ~," = (v - 0) + e". 4, ~' angles and /~r measured for each transmission aggregate (Planqon, 1980; Wiewi6ra, 1984) were used to calculate A (O)/A, on an integrated scale (Fig. 4) to correct the measured intensities for absorption (Planqon, 1980).
For this method of intensity measurement using the 001 reflection, Planqon & Tchoubar (1977), Courville et al. (1979) and Planqon (1980) determined particle orientations in non-oriented and partly oriented transmission aggregates. But the 001 reflection cannot be used for highly oriented aggregates as high particle orientation precludes recording of basal reflections. This is clear in Fig. 2, which shows a transmission pattern of illite in
O01 001"
~ 0 1 0
20
O01
FIG. 3. Geometry of the oblique setting (explanation in text).
X-ray powder transmission diffractometry o f micas 235
180.
160
140.
120-
100 -
80 '
6 0 -
4~ 1 2 0
0
5
7'0
j ; \
8; 9% loo 1~o 12o 11o 1~o 1;o 1;o do
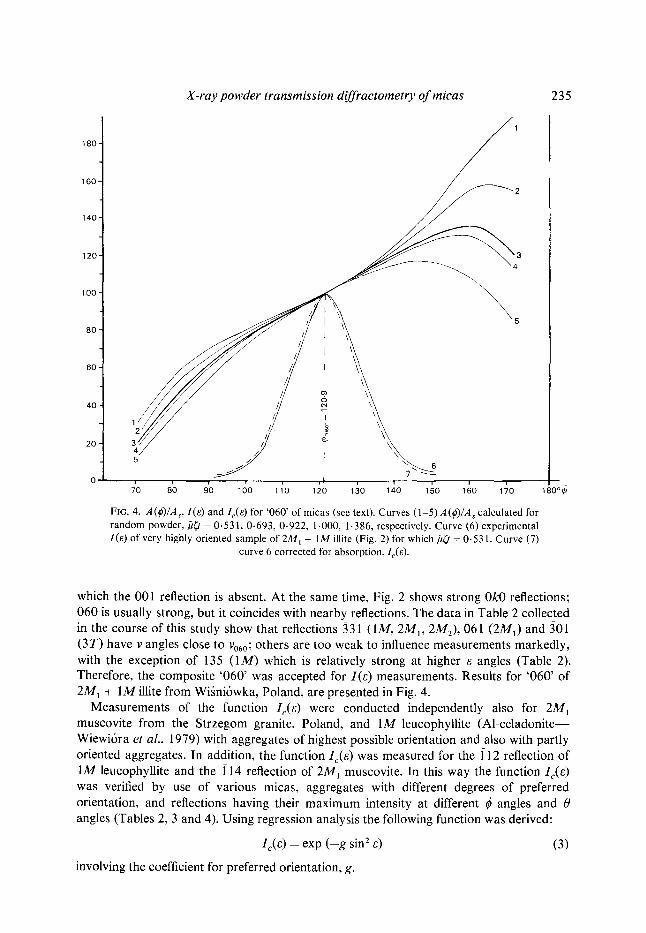
Fro. 4. A (O)/A,, l(e.) and I,.(e) for '060' of micas (see text). Curves (1-5)A (~)/A s calculated for random powder, ~Q 0-531, 0.693, 0.922, 1.000, 1.386, respectively. Curve (6) experimental I(e) of very highly oriented sample of 2 M l + IM illite (Fig. 2) for which/~Q = 0.531. Curve (7)
curve 6 corrected for absorption, l,.(e).
180~
which the 001 reflection is absent. At the same time, Fig. 2 shows strong 0k0 reflections; 060 is usually strong, but it coincides with nearby reflections. The data in Table 2 collected in the course of this study show that reflections 331 (1M, 2Ml, 2M2), 061 (2M1) and 301 (3 T) have v angles close to V06o; others are too weak to influence measurements markedly, with the exception of 135 (1M) which is relatively strong at higher e angles (Table 2). Therefore, the composite '060' was accepted for I(e) measurements. Results for '060' of 2M1 + 1M illite from Wi~nidwka, Poland, are presented in Fig. 4.
Measurements of the function Ic(e ) were conducted independently also for 2M 1 muscovite from the Strzegom granite, Poland, and IM leucophyllite (Al-celadonite-- Wiewiora et al., 1979) with aggregates of highest possible orientation and also with partly oriented aggregates. In addition, the function Ic(e) was measured for the 112 reflection of 1M leucophyllite and the [ 14 reflection of 2M 1 muscovite. In this way the function Ic(e ) was verified by use of various micas, aggregates with different degrees of preferred orientation, and reflections having their maximum intensity at different ~ angles and 0 angles (Tables 2, 3 and 4). Using regression analysis the following function was derived:
Ie(c) - exp ( - g sin 2 e) (3)
involving the coefficient for preferred orientation, g.
236 A . W i e w i 6 r a a n d Z . W e i s s
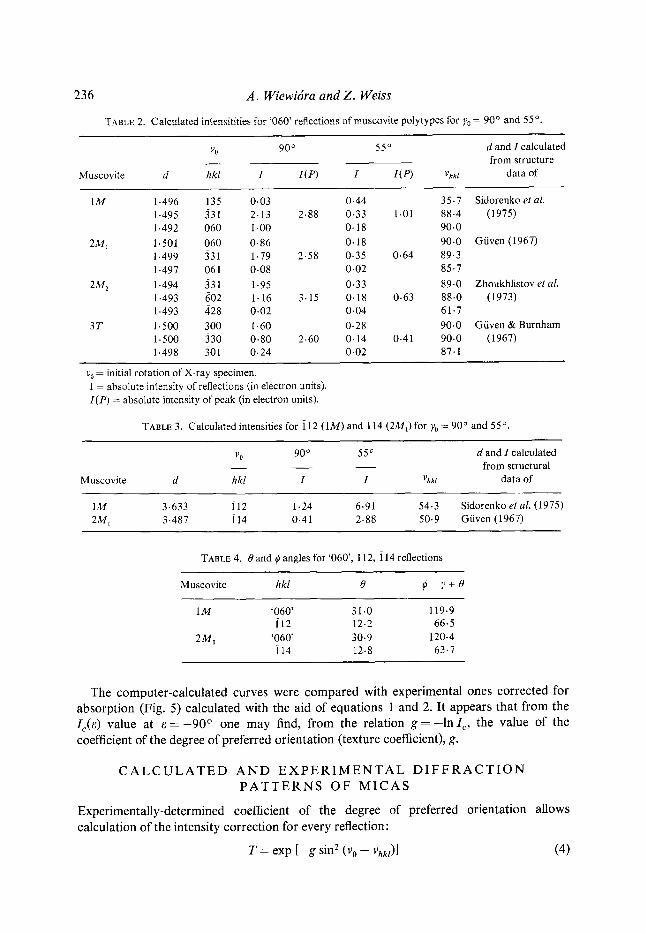
TABLE 2. Calculated intensitities for '060' reflections of muscovite polytypes for ?0 = 90~ and 55 ~
v o 90 ~ 55 ~ d and 1 calculated _ _ from structure
Muscovite d hkl 1 I (P) I I (P) Vhkt data of
1M 1.496 135 0.03 0.44 35.7 Sidorenko et al. 1.495 331 2-13 2.88 0.33 1.01 88.4 (1975) 1.492 060 1.00 0.18 90.0
2M~ 1.501 060 0.86 0-18 90-0 G/iven (1967) 1.499 331 1.79 2.58 0.35 0-64 89.3 1.497 061 0.08 0.02 85.7
2M z 1.494 331 1-95 0.33 89.0 Zhoukhlistov et al. 1-493 602 1-16 3.15 0.18 0.63 88.0 (1973) 1.493 428 0.02 0.04 61.7
3T 1.500 300 1-60 0.28 90.0 G(iven & Burnham 1.500 330 0.80 2.60 0.14 0.41 90.0 (1967) 1.498 301 0.24 0.02 87.1
v 0 = initial rotation of X ray specimen. I = absolute intensity of reflections (in electron units). I (P) = absolute intensity of peak (in electron units).
TABLE 3. Calculated intensities for 112 (1M) and 114 (2M1)for ?0 = 90~ and 55 ~
v o 90 ~ 55 ~
Muscovite d hkl I I vhkt
d and I calculated from structural
data of
1M 3.633 [12 1-24 6.91 2M~ 3-487 [14 0.41 2.88
54.3 Sidorenko et al. (1975) 50.9 G/iven (1967)
TABLE 4. 0and r angles for '060', 112, i14 reflections
Muscovite hkl 0 r - y + 0
1M '060' 31.0 119.9 [12 12.2 66.5
2M~ '060' 30.9 120.4 i14 12-8 63-7
The c o m p u t e r - c a l c u l a t e d cu rves were c o m p a r e d wi th e x p e r i m e n t a l ones c o r r e c t e d for
a b s o r p t i o n (Fig. 5) c a l c u l a t e d wi th the aid o f e q u a t i o n s 1 a n d 2. I t a p p e a r s t h a t f r o m the
I t (e ) va lue at e = - 9 0 ~ one m a y find, f r o m the r e l a t ion g = - l n I c, t he va lue of t he
coeff ic ient o f the degree o f p re fe r r ed o r i e n t a t i o n ( t ex tu re coefficient) , g.
C A L C U L A T E D A N D E X P E R I M E N T A L D I F F R A C T I O N
P A T T E R N S O F M I C A S
E x p e r i m e n t a l l y - d e t e r m i n e d coeff ic ient o f the degree o f p re fe r r ed o r i e n t a t i o n a l lows
ca l cu l a t i on o f the in tens i ty c o r r e c t i o n for eve ry ref lec t ion:
T = exp [ - g sin 2 (v 0 - Vhkt)] (4)

X - r a y p o w d e r t r a n s m i s s i o n d i f f r a c t o m e t r y o f m i c a s 23 7
1.0
0.8
0.6
0.4
0.2
0.0 - 9 0 - 8 0 --70 - 6 0 50 --40 --30 - 2 0 - 1 0 0
FiG. 5. Calculated Ic(e ) represented as solid lines, experimental Ic(e ) represented as dashed lines ( ' - - - lll, x - - x '060'). It(s) were measured for: (1) very highly oriented (g = 46) sample of 2M~ muscovite; (2) very highly oriented (g = 39) sample of 1M leucophyllite; (3) very highly oriented (g = 28) sample of 2M 1 + 1M illite; (4) highly oriented (g = 9) sample of 2M1 muscovite, i 14; (5) highly oriented ( g - 9) sample of 2M~ muscovite, '060'; (6) well oriented
(g = 3) sample of 2M~ muscovite, '060'.
where: v o - Vhk t stands for e (equation 3) and v 0 is the initial rotation of the sample (with counter fixed at 0 ~
The preferred orientation intensity correction coefficient greatly influences intensities of all reflections and v o - vhk t acts selectively. If this difference is small the reduction of intensity is negligible, if it is appreciable the reduction is significant.
Equation 4 was inserted in the computer programme D I F K (Weiss et al., 1983) and diffraction patterns were calculated for random (Fig. 6) and for high sample orientation for v 0 = 90 ~ (Fig. 7d). They are compared with experimental patterns taken on a focusing transmission X-ray diffractometer (made by CGR, France). To facilitate direct comparison, the recorded patterns were computer-normalized and drawn on an integrated scale (Fig. 7a,c). Neglecting minor discrepancies in 001 intensities caused by non-identical g value and/or in some cases variable chemical composition, the comparison is promising because it allows the application of computer simulation for calculation of the oblique-texture transmission diffraction patterns from structure data.
I D E N T I F I C A T I O N O F M I C A P O L Y T Y P E S
Calculated transmission diffraction patterns of randomly-oriented specimens of muscovite polytypes are presented in Fig. 6. A direct comparison of the experimental and calculated

238 A. Wiewidra and Z. Weiss
1 O0
80
6 0 -
40
2 0 -
0 10 20 30 40 50 60 20
1 0 0
8 0
60
40
20
!
10 20 30
J~ E
40 50 60 ,20
1 O0
80
60
40
20
0 10 20 30 40 50 60
20
1 O0 -
80 -
6O
4 0
20 �84
0 0
J 2O t 0 20 30 40 50 60
FIc. 6. Transmission diffraction patterns calculated from structure data for randomly oriented samples of polytypes of muscovite. (a) 1M (Sidorenko et aL, 1975). (b) 2M 1 (G/iven, 1967). (c)
2M 2 (Zhoukhlistov et aL, 1972). (d) 3T (G/iven & Burnham, 1967).

X-ray powder transmission diffractometry of micas 239
diffraction patterns (Fig. 7) proves that random aggregates may be helpful in identification. The presence or absence of the significant reflections in the experimental pattern as compared to the calculated one may be used to distinguish the muscovite polytypes. However, changes in intensity caused by particle preferred orientation introduce an uncertainty, which makes the determinations somewhat unreliable.
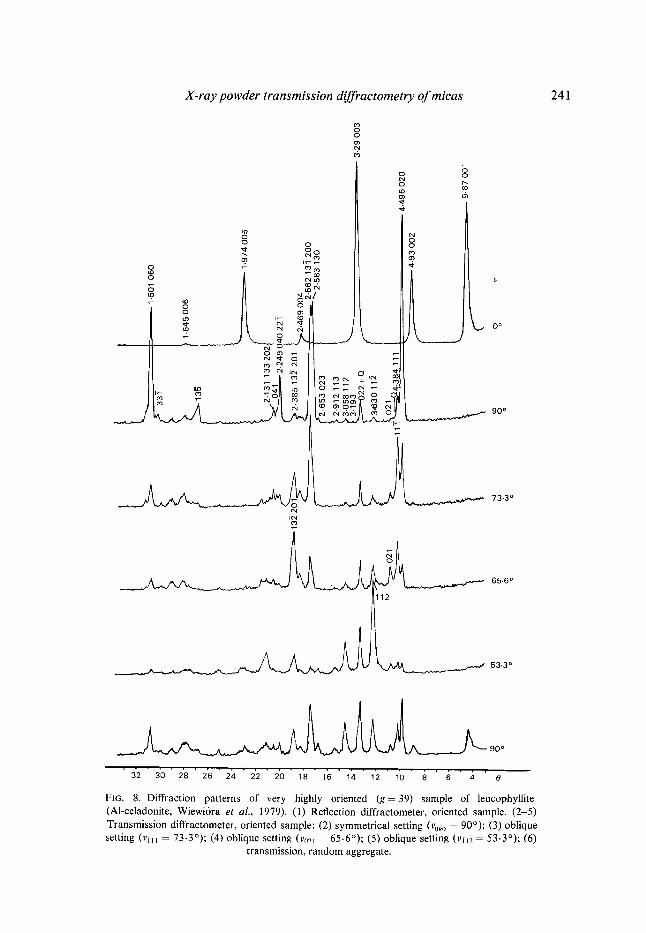
A better possibility of identification arises by application of highly-oriented aggregates and the oblique setting. An example is given in Fig. 8, which contains several diffraction patterns of leucophyllite from Barcza recorded on highly oriented samples. Each diffraction pattern was taken with sample settings appropriate to the definite type of hkl reflection. The uppermost pattern presents only 001 reflections and was recorded using a reflection diffractometer. The four following patterns represent those obtained using a transmission diffractometer, with sample settings suitable for maximum intensity of the reflections 0kO (v 0 = 90~ 111 (v 0 = 73.3~ 021 and 201 (v 0 = 65.6 ~ ) and 112 (v 0 = 53.3~ They show that identification of this particular mica may be well based on the angle of incidence, 4, at which the intensity of a given reflection is highest. The i12 reflection is thus the most suitable for identification of this mica. Examination of the diffraction patterns calculated from structure data also shows that the best resolution of hkl diffraction intensities characteristic for polytypes is attained with an oblique setting of ~ 55 o and a highly-oriented sample (Fig. 9).
To make identification of polytypes by transmission diffractometry easier, the computed intensities for mica species are summarized in a series of Tables. Such data for the random (R) samples and for highly-oriented samples with symmetrical (90 ~ and oblique (55 ~ settings of naturally occurring polytypes of muscovite are presented in Table 5; similar data for lepidolites are in Table 6 and for paragonite in Table 7.
Identification of individual polytypes may be based, first of all, on presence or absence of individual reflections in the random pattern. If this is not satisfactory, oriented samples should be used. Comparison of the data for symmetrical and oblique patterns (90 ~ and 55 o) shows very marked changes in intensity from one to the other setting; in an extreme case from 0 to 100, as for the 106 reflection of 3T muscovite in Table 5. It follows that the 3 T polytype of muscovite may be easily identified by the absence of the 2.93-3-04 A line and by an increase in intensity from 0 up to a significant value of the 3.10 ,~ line. This example shows that identification may be performed very effectively using highly-oriented aggregates and their settings--one favourable for the strong reflections 201, 131 characteristic of the superposition structure (Weiss et al., 1985) and the other one most favourable for the 02l, 11l reflections characteristics of polytypes.
Polytypes may be determined quite well by use of the oblique data alone. For example, in the case of muscovite, the 11i reflections of the 1M polytype distinguish it from the 2M 1 polytype and the 02l reflections of the 1M polytype distinguish it from the 2M 2 polytype. The 023 and 112 reflections of the 2M 1 polytype may be used to distinguish it from the other three polytypes.
Identification of natural mica polytypes conducted with the aid of the oblique diffraction patterns recorded at angles v 0 calculated from unit-cell parameters of a given species is illustrated by the diffraction patterns of 2M 1 muscovite, 3T paragonite and 1M leucophyllite (Fig. 10) and by patterns of 1M phlogopite and 1M biotite (Fig. 11). In the dioctahedral series the differences are remarkably large, and polytypes may be easily recognized. The differences between 1M phlogopite and 1M biotite lies in the loss of the

240 A. Wiewi6ra and Z. Weiss
1 O0 -
80
6 0 -
4 0 -
0 10 20 30 40 50 60 20
IO0
80
60
4 0
2 0
10 20 30 40 50 60 20
1 O0
80
60
4 0 -
20
10 20 30 40 50 60 20
1 O0 d
8O
6 0 -
, o
2O
10 20 30 40 50 60
FIG. 7. Transmission diffraction patterns of 2M 2 muscovite. (a) Experimental for random sample. (b) Calculated for random sample. (c) Experimental for well oriented (g = 3) sample,
symmetrical setting. (d) Calculated for highly oriented (g = 5.2) sample, symmetrical setting.
X-ray powder transmission diffractometry of micas 241
o
o
J
o o Oo
o
~ ,q ~ , , 0 o
o~. g ,= it,, ~ ~ [ tn r I~ 0 ~"
i ~ c0 "7. o oO ('9 e4 00eo~,~ 0
tq c~ 6~c',5 m o / 9 0 ~
,g
lg
_ ~ 90 ~
' {2 ' 3'0 ' 2'8 ' 2'6 " 24 ' 2'2 " 2'0 " 1"8 " 1"6 " ~4 " 12 " ~0 " & ' 6 " 4 ' e
FIG. 8. Diffraction patterns of very highly oriented (g 39) sample of leucophyllite (AI celadonite, Wiewi6ra et al., 1979). (1) Reflection diffractometer, oriented sample. (2-5) Transmission diffractometer, oriented sample: (2) symmetrical setting (v0k 0 = 90~ (3) oblique setting (vhl -- 73.3~ (4) oblique setting (Vo21 65-6~ (5) oblique setting (Vh2 = 53-3~ (6)
transmission, random aggregate.

242 A. Wiewi6ra and Z. Weiss
100
8O
60
40
2O
0
3T
10 2O 30 40 50 6O 20
100
80,
60.
40.
20,
0 0
2M2
30 40 50 60 20
100
8O
60
4O
2 0
0 0
1M
_A, ~10 20 30 40 50 60
20
100
8oi 6oi 4 0
20 0
FIG.
2M~
A10 20 20 30 40 50 60
9. Diffraction patterns of 3T, 2M2, 2M~, and I M polytypes of muscovite calculated from structure data (references are in caption to Fig. 6); oblique setting, v = 5 5 ~

TABLE 5. Diffraction intensities calculated f rom structure da ta of muscovi te polytypes.
1M 2 M 1 2 M 2 3 T
d hkl R 90 ~ 55 ~ hkl R 90 ~ 55 ~ hkl R 90 ~ 55 ~ hkl R 90 ~ 55 ~
9 . 9 1 - 9 . 9 9 001 46 - - 2 002 53 - - 3 002 62 - - 3 003 58 - - 6
4 . 9 5 - 4 . 9 9 002 22 - - 0 004 23 - - 2 004 29 - - 2 006 26 - - 3
4 - 4 5 - 4 . 4 8 020 65 100 12 020 82 93 56 110 83 88 39 100 75 91 40
110 111 101
111
021
4 .34 511 36 42 19 - - 202 25 21 18 - -
4 .29 - - 111 19 15 22 - - 102 9
4-27 - - - - 111 29 22 25 - -
4 . 0 8 - 4 . 1 0 021 27 19 22 022 15 8 24 - - 103 22 13 24
3 .96 - - 112 11 4 19 - - - -
3 . 8 6 - 3 . 8 8 - - 113 41 14 74 113 36 12 49 104 56 20 72
3 . 7 8 - 3 . 7 9 111 6 2 6 - - 202 8 2 12 - -
3-73 - - 023 42 11 78 - - - -
3 . 6 0 - 3 . 6 5 i12 100 29 100 - - 204 67 14 96 105 49 - - 66
3.57 - - 113 7 1 11 - -
3 .49 - - 114 57 10 100 514 72 12 100 - -
3 . 3 1 - 3 . 3 4 022 50 6 31 024 66 5 67 006 44 - - 5 106 100 - - 100
003 006 009
3 . 1 8 - 3 . 2 0 - - 114 54 6 83 114 62 6 77 - -
3 - 1 0 - 3 . 1 3 - - 115 8 1 12 115 11 1 13 107 63 - - 74
3 .04 112 93 10 77 - - 204 54 4 62 - -
2 . 9 3 - 2 - 9 9 - - 025 54 4 73 206 15 1 16 - -
2 .90 113 28 3 21 - -
2 . 8 5 - 2 . 8 8 - - 115 36 3 45 115 37 2 38 108 69 - - 72
2 . 7 9 - 2 . 8 0 - - 116 29 2 34 i16 37 2 36 - -
2 . 6 6 - 2 . 6 8 023 36 4 22 - - - - 109 9 - - 11
2 .59 - - 130 49 55 - - 111 44 55 22
i31
200
2 . 5 7 - 2 . 5 6 130 68 96 24 116 100 100 80 312 100 100 83 112 86 100 49
131 202 021
2 .52 - - - - 517 13 - - 8 - -
2 . 4 8 - 2 . 5 0 004 15 10 6 117 12 0 9 022 12 - - - - 0012 10 - - 5
202 008 008
2 .46 - - i33 22 16 28 - -
2 . 4 3 - 2 . 4 4 113 16 13 10 202 15 10 20 314 28 17 27 114 28 22 24
131 027
2.41 - - - - 023 24 14 25 - -
2 . 3 8 - 2 . 3 9 132 21 16 16 204 27 15 42 312 25 13 28 115 28 17 29
133 208
2 . 3 3 - 2 . 3 5 114 16 9 13 - - 315 5 2 5 - -
201
2 .30 - - - - 024 8 4 10 - -
2 .27 - - - - 313 8 4 9 - -
2 . 2 4 - 2 . 2 5 221 13 20 4 0 4 0 . 11 12 13 221 18 16 6 200 - - 6 - -
040 221 402
220 220
041
135
2 . 2 0 - 2 . 2 1 220 10 13 4 221 13 11 14 316 11 10 8 203 12 12 8
132 204 400
042 221

TABLE 6. Diffraction intensities calculated from structure data oflepidolite polytypes.
1M (C2/m) 1M (C2) 2M 1 2M z 3 T
d hkl R 90 ~ 55 ~ hkl R 90 ~ 55 ~ hkl R 90 ~ 55 ~ hkl R 90 ~ 55 ~ hkl R 90 ~ 55 ~
9 .97-9 .92 001 37 - - 2 001 33 - - 2 002 36 - -
4 .98-4 .96 002 24 - - 2 002 30 - - 2 004 35 - - 4 .53-4 .40 020 33 47 6 020 46 59 15 110
110 110 i l l 41 49
021 4.36-4-31 111 18 18 10 111 29 26 17
2 002 30 - - 2 0 0 3 69
2 004 25 - - 2 006 9 17 110
i l l 34 35 21
11 200
202 10 8 10 102 100 100 100
3-73 023 49 13 72
3.64-3.63 i12 94 23 100 112 89 20 100 }04 43 8 85 113
3 .59-3.58 113 15 3 22 105 32 - - 19 3 .49-3.47 314 69 12 100 i14 51 8 100
3.34-3.31 022 86 11 73 022 89 11 89 024 42 4 44 006 28 - - 3 009 55 - - 52
003 52 - - 2 006 48 106 3 .21-3 .20 114 73 8 98 114 51 5 11 3.12-3.11 i15 20 2 25 i15 19 2 32
3.08 112 100 10 11 112100 9 95 204 43 3 22 2 .98-2 .90 113 50 4 40 113 60 4 52 025 64 5 78 206 21 1 39
2.87-2-86 115 24 2 27 115 23 2 34
2 .79-2.78 i16 36 3 38 i16 26 2 36 2.67 023 36 5 25 023 38 - - 27 026 7 - - 6 109 11 - - 8
2 .60-2 .59 130 73 91 22 130 81 100 25 731 84 100 33 020 100 100 63 iO 1 }01 200 311
021 312
310
116
2 .58-2 .56 131 79 100 30 i31 84 96 33 116 100 99 55 112 28 15 7
200 200 202
131 2.49-2-47 004 21 13 12 202 22 9 - - 008 12 - - 7 117
113 004 117 008 i02 113
2.46-2.45 131 25 20 17 131 22 14 15 133 27 20 24 i14 68 38 46 202
2.43
2.42
2.40-2-39 i32 27 18 22 i32 42 25 36 027 40 23 44
201 204
133 2.38 201 20 13 17
2.33
2.31 2.30
2-26-2.25 040 20 27 5 040 21 27 5 040 19 23
}21 }21 220
9 - - 60110 30 11 20
314 29 17 41 023 312 27 - - 38
115 34 11 20
}08 6 3 9 315
024 6 3 9 313 6 3 10
7 }21 14 15 7 200 7 402
111 4 .12-4-10 021 12 8 10 021 15 8 13 022 2
3 .98-3 .97 112 12 5 15 112 9 3 17
3.88-3-84 111 17 6 17 111 26 8 27 i13 22 7 30 i13 19 6 36 202

X-ray powder transmission diffraetometry o f micas
o 7-
g 5 0 . 9 ~
1
w o
5 3 . 3 ~ 2
7
o
eq "-" ~ .YT- o
g oo ~ g 3 W, 53.3o
i i i i i i , i i I , , i , i i i i �9 i I . , i
3 2 3 0 2 8 2 6 2 4 2 2 2 0 18 16 14 12 10 ~
FIG. 10. Transmission oblique-texture diffraction patterns of dioctahedral micas. (1) 2M 1 muscovite (Strzegom granite). (2) 3T paragonite (Ural, Zvyagin et al., 1973; Sidorenko et al.,
1977). (3) 1M leucophyllite (Wiewi6ra et al., 1979).
245
c o c o r
o "-- ~-. l~ 7- o
5 2 . 5 0
' 3'2 ' 3 0 ' 2 '8 ' 2 '6 ' 2 '4 ' 2 '2 ' 2 0 ' 1"8 ' 1'6 ' 14 ' 1'2 ' 1(3 ' ' ~
FIG. 11. Transmission oblique-texture diffraction traces of trioctahedral micas. (1) 1M phlogopite (Korea). (2) lMd biotite (Strzegom granite).
polytypic reflections with h :~ 3n A k ~ 3n of biotite, due to disordering of the structure, which is more common in biotites than in phlogopites (Bailey, 1980).
The oblique-texture method bridges difficulties in the identification procedure. It should be noted, however, that the method cannot be used to distinguish 1M and 3 T polytypes of
2 4 6 A. W i e w N r a a n d Z . W e ~ s
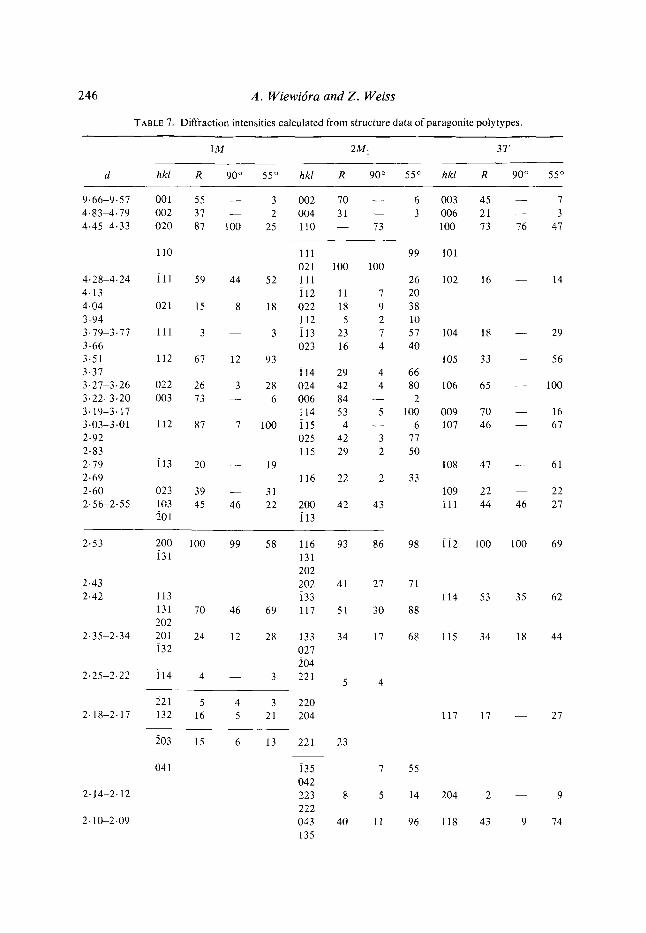
TAHOE 7. D i ~ a c t i o n intensities c a l c u l ~ e d f rom s t ruc tu re d a t a o f p a r a g o n i t e p o l ~ y p e s .
I M 2 M 1 3 T
d hkl R 90 ~ 55 ~ hkl R 90 ~ 55 ~ hkl R 90 ~ 55 ~
9 . 6 6 - 9 . 5 7 001 55 - - 3 002 70 - - 6 003 45 - - 7
4 . 8 3 - 4 . 7 9 0 0 2 37 - - 2 004 31 - - 3 006 21 - - 3
4 . 4 5 4 - 3 3 0 2 0 87 100 25 110 - - 73 100 73 76 47
110 [11 99 101
021 100 100
4 . 2 8 - 4 . 2 4 111 59 44 52 111 26 102 16 - - 14
4 . 1 3 112 11 7 20
4 . 0 4 021 15 8 18 0 2 2 18 9 38
3 . 9 4 112 5 2 10
3 . 7 9 3 .77 111 3 - - 3 [13 23 7 57 104 18 - - 29
3 . 6 6 023 16 4 40 3-51 112 67 12 93 105 33 - - 56
3 -37 114 29 4 66
3 . 2 7 - 3 . 2 6 022 26 3 28 024 42 4 80 106 65 - - 100
3 . 2 2 - 3 . 2 0 003 73 - - 6 006 84 - - 2
3 . 1 9 - 3 - 1 7 114 53 5 100 0 0 9 70 - - 16 3 . 0 3 - 3 - 0 1 112 87 7 100 115 4 - - 6 107 46 - - 67
2 . 9 2 025 42 3 77
2 .83 115 29 2 50
2 . 7 9 113 20 - - 19 108 47 - - 61
2 . 6 9 116 22 2 33
2 . 6 0 023 39 - - 31 109 22 - - 22
2 . 5 6 - 2 . 5 5 103 45 46 22 2 0 0 4 2 43 111 44 46 27
}01 [13
2 -53 200 100 99 58 116 93 86 98 112 131 131
202 2 .43 2 0 2 41 27 71
2 -42 113 i33 114
131 70 46 69 117 51 30 88 202
2 . 3 5 - 2 . 3 4 201 24 12 28 133 34 17 68 115
132 027
204 2 . 2 5 - 2 . 2 2 [14 4 - - 3 221
5 4
2 - 1 8 - 2 . 1 7
2 .14-2 .12
2 - 1 0 - 2 . 0 9
221 5 4 3 220
132 16 5 21 204
}03 15 6 13 221 23
041 135 7 55
0 4 2 223 8 5 14 204
222
043 4 0 11 96 118
135
100 100 69
53 35 62
34 18 44
117 17 - - 27
2 - - 9
43 9 74

X - r a y p o w d e r t ransmiss ion di f f raetometry o f micas
TABLE 7--continued
247
1M 2M 1 3T
d hkl R 90 ~ 55 ~ hkl R 90 ~ 55 ~ hkl R 90 ~ 55 ~
2.08 133 42 12 57 206 19 4 46
221 223 6 3 2.02 042 3 - - 4 044 7 3 15 206 2 - - 9 1.98 225 5 - - 7
119 1.95 223 12 4 15 1.93 206 25 1 23
0010 1.92-1.91 005 33 2 17 137 9 - - 15 1110 28 20
p h t o g o p i t e b e c a u s e o f s u c h smal l d i f fe rences in the i r p o w d e r ob l ique - t ex tu re d i f f r ac t ion
pa t t e rns . N a t u r a l p o l y t y p e s o f o t h e r t r i o c t a h e d r a l a n d o f d i o c t a h e d r a l m i c a s m a y well be
d i s t i ngu i shed by c a l c u l a t e d d i f f rac t ion p a t t e r n s f r o m real s t r u c t u r e d a t a (Tab le s 5, 6, 7).
T h e s y s t e m a t i c X - r a y iden t i f i ca t ion o f t heo re t i ca l ly -de r ived m i c a p o l y t y p e s is d e s c r i b e d
e l sewhere (Wei s s et al., 1985). O f course , the bes t m e t h o d s for iden t i f ica t ion o f p o l y t y p e s
a re s ing le -c rys ta l m e t h o d s , bu t the a d v a n t a g e o f ob l ique - t ex tu re p o w d e r d i f f r a c t o m e t r y
ove r s ing le -c rys ta l W e i s s e n b e r g p h o t o g r a p h s is t h a t it t akes less t ime a n d l abour . Of ten ,
layer -s i l ica tes a re ava i l ab le on ly in powder s .
A C K N O W L E D G M E N T S
The authors are greatly indebted to Dr. M. Biekovskii for a sample of 3Tparagonite, to Dr. A. Kozlowski for a sample of phlogopite and to Mr. A. Pelc for a sample of 2M 1 muscovite. Thanks are also due to Dr. M. Rieder for improvements to the English presentation of this paper. The paper has been partly completed within the framework of project M.R.I. 16.
R E F E R E N C E S
BAILEY S.W. (1980) Structures of layer silicates. Chapter 1 in: Crystal Structures of Clay Minerals and their X-ray Identification. Mineralogical Society, London.
COURVlLLE DE J., TCHOUBAR D. & TCHOUBAR C. (1979) Determination expbrimentale de la function d'orientation--son application dans les calcul des bandes de diffraction. J. Appl. Cryst. ! 2, 322-338.
CROCHE R. (1976) Etude expdrirnentales et thdoriques des corrections d'aberration instrumentales d'un diagramme de diffraction des rayons X. These, Conservatoir National des Arts at Metiers, Paris.
DECKER B.F., ASP E.T. & HAaI,:Eg D. (1948) Preferred orientation determination using a Geiger counter X-ray diffraction goniometer. J. Appl. Phys. 19, 388-392.
FAYED L.A. (1967) An X ray diffractometry technique for preferred orientation studies in rocks, lnt. J. Rock Mech. Sci. 4, 101-114.
GUINIER A. (1964) Th~orie et Technique de la Radiocrvstallographie. Dunod, Paris. G0VEN N. (1967) The crystal structures of 2M~ phengite and 2M 1 muscovite. Carn. Inst. Wash., Year Book
66, 487-492. G0VEN N. & BURHAM W. (1967) The crystal structure of one-layer phlogopite and annite. Am. Miner. 58,
889-900. KLUG H.P. & ALEXANDER L.E. (1954) Xray Diffraction Procedures. J. Wiley, New York.

248 A. Wiewi6ra and Z . Weiss
KOTOV A.V., SOBOLEVA S.V., GOJLO E.A., ZVYAGIN B.B. & FRANK-KAMENETSKIJ (1980) Strukturnaya preemstvennost pri sludoobrazovanii po kaolinovym mineralam v gidrotermalnykh usloviyakh. Izv. AN SSSR, ser. geol. 12, 68-80.
KRINARI G.A. (1975) O vozmozhnostyakh ispolzovaniya orientirovannykh preparatov dlya registracie nebazalnykh rentgcnovskikh otrazhenie v tonkodispersnykh sloistykh silikatakh. Pp. 132-138 in: Kristallokhimiya Mineralov i Geologitheskije Probleme. Izd. Nauka, Moscow.
MuNoz J.L. (1968) Physical properties of synthetic lepidolites. Am. Miner. 53, 1490-1512. PLANqON A. (1980) The calculation of intensities diffracted by a partially ordered powder with a layer
structure. J. Appl. Cryst. 13, 524-528. PLANqON A. & TCHOUBAR C. (1977) Determination of structural defects in phyllosilicates by X-ray powder
diffraction. I. Principle of calculation of the diffraction phenomenon. Clays Clay Miner. 25, 430-435. PLANqON A., ROUSSEAUX F., TCHOUBAR D., TCHOUBAR C., KRIYARI G. & DRIXS V.A. (1982) Recording and
calculation of hk rode intensities in case of diffraction by highly oriented powders of lamellar samples. J. Appl. Cryst. 15,509-512.
RULAND W. & TOMPA H. (1968) The effect of preferred orientation on the intensity distribution of hk interferences. Acta Cryst. A24, 93-99.
SIDORENKO O.V., ZVYAGIN B.B. & SOBOLEVA S.V. (1975) Utothnienije krystalytheskoi struktury dioktaedritheskoi sludy 1M. Kryst. 20, 543-549.
SIDORENKO O.V., ZVYA~IN B.B. & SOBOLEVA S.V. (1977) Krystallytheskaya struktura paragonita 3T. Krist. 22, 976-981.
SCHULTZ L.G. (1949) Determination of preferred orientation in flat transmission samples using a geiger counter X ray spectrometer. J. Appl. Phys. 20, 1033-1036.
TAYLOR R.M. & NORRISH K. (1966) The measurement of orientation distribution and its application to quantitative X-ray diffraction analysis. Clay Miner. 6, 127-142.
VELDE B. (1965a) Experimental determination of muscovite polymorph stabilities. Am. Miner. 50, 436-449. VELDE B. (1965b) Phengite micas: synthesis, stability and natural occurrences. Am. J. Sci. 263, 886-913. WEISS Z., KRAJICEK J., SMRCOK L. & FIALA J. (1983) A computer X-ray quantitative phase analysis. J. Appl.
Cryst. 16, 493-497. WEISS Z., WIEWIORA A. & DUROVIC S. (1985) Polytypism of micas. IIL X-ray identification. Clays Clay
Miner. (in press). WIEWIORA A. (1984) X-ray quantitative phase analysis by transmission method with orientation correction for
layer silicates. Arch. Miner. 40, 5-19. WIEWIORA A., LA, CKA B. & SZCZYRBA J. (1979) Celadonite, glauconite and skolite: nomenclature and
identification problems. Proc. 8th Conf. Clap Mineral. Petrol., Teplice. Geologica, 47-58. WIEW1ORA A., WEISS Z. & KRAJICEK J. (1981) Simulation method for X-ray quantitative analysis of clay
samples. Miner. Polon. 12, 3-13. ZHOUKHLISTOV A.P., ZVYAGIN B.B., SOBOLEVA S.V. t~. FEDOTOV A.F. (1973) The crystal structure of the
dioctahedral mica 2M 2 determined by high voltage electron diffraction. Clays Clay Miner. 21,465-470. ZVYAGIN B.B. (1964) Electron Diffraction Analysis of Clay Minerals Structures (English translation, 1967).
Plenum Press, New York. ZVYAGIN B.B. (1979) Vesokovolntaya Elektronographiya v Issledovanij" Sloistykh Mineralov. Izd. Nauka,
Moscow. ZVYAGIN B.B., SOBOLEVA S.V. & BIELKOVSKIJ A.J. (1973) O strukturnom diffraktyonnom svoeobrazii
paragonita. Izv. AN USSR, ser. geol., Moscow 5, 63-67.