x-ray determination of the thermal expansion coefficient ... · refers to the macro thermal...
TRANSCRIPT
1corresponding author: [email protected]; [email protected], [email protected]
X-ray Determination of the Thermal ExpansionCoefficient of Nylon 6,6 Fibers
Abstract: The thermal behavior of commercially available nylon 6,6 fibres has been analysed usingwide angle X-ray diffraction data, collected in the temperature range 25 - 225 °C. The three axialdirections a, b and c- characterized by concentrations of hydrogen bonds, van der Waal’s interactionsand covalent bonds respectively, respond differently to heat treatment. The crystallographic c- axiscorresponding to the fiber axis, registers a contraction during heating and an expansion in thereturn cooling cycle. In a single heating and cooling cycle, a residual contraction of ~1.8% in the c-length is observed. The a- length manifests little change with heat treatment and in contrast, the b-axial length of the basal plane increases during heating, within the respective structure, be it triclinicor hexagonal. The unit cell volume increases with heating. The increase in crystallinity observedduring heating matches with the suggested growth of crystallites and/or reduction in microstrain.All the structural parameters manifest a thermally induced hysteresis and also a sudden largechange at ~125°C and 75°C respectively during heating and cooling respectively. The latter featurehas been associated with structural transformations.Keywords: Nylon 6,6, X-ray diffraction, thermal expansion coefficient.
1. INTRODUCTION
Nylon 6,6 is among the very early set of man-made fibers developed1 in the 30’s. Nylons,in general have a range of applications, which includes limited use at high temperaturesalso. The service temperatures recommended for nylons range from 69 - 235°C2.Thermal expansion coefficient is an important property of any material, more so, formaterials recommended for use at elevated temperatures. For a materialcommercialized nearly seven decades ago, data on the value of thermal expansioncoefficient can be expected to be text book information and is indeed so. For nylon 6,6the coefficient of linear thermal expansion reported in literature is ~1.0�10-4/°C 3,4 and itrefers to the macro thermal expansion. There could, however, be difference betweenthe macro thermal expansion and the behavior at the level of crystal lattice. Such adifference is, understandable because the macro value refers to the polymeric sampleas a whole, which invariably includes a less crystalline or amorphous fraction, defectsof various types etc., whereas the X-ray data pertain to the crystalline fraction. Acomparison between the crystalline and macro thermal expansion coefficients willindeed be useful in understanding the correlation between the two. It must be
International Journal of Electrospun Nanofibers and Applications, Vol. 4, No. 1 (January-June, 2018)ISSN : 0973-628X
mentioned that our earlier X-ray investigations5 on the aromatic polyamide Kevlar,established the difference in the thermal expansion behaviors of the polymer chains inthe crystal lattice and the macro fibre. The axial thermal expansion coefficient of thepolymer chains in the crystal lattice of Kevlar was found to be more negative than thevalue reported for the entire fiber.
The high temperature behavior of nylons, in general, has been a topic of interestand a large number of high temperature X-ray investigations on nylon 6,6 in particular,have been reported6-17. At this juncture, it may be appropriate to mention very brieflyabout few of these high temperature X-ray investigations. The oft-quoted work ofBrill6 concerns the triclinic (Tr) to hexagonal (H) structural transformation for melt-crystallized samples. Schichter7 reports the thermally induced distortion of the unitcell. Colclough and Baker8 describe the polymorphism in nylon 6,6. Itoh and Konishi9
and Itoh et al.10 have studied the solution grown crystals at elevated pressures andtemperatures. Ramesh et al.’s 11 work concern the role of crystallization temperatureon the Brill transition. A comparison of the temperature induced structural changes infew nylons has been reported by Radusch12. Hsiao et al.13 have carried out synchrotron,online investigation on the structure and morphology development during continuousdrawing of nylon 6,6 fibers at various temperatures. Murthy et al.14,15 have studied thepre-melting crystalline relaxations, interactions between amorphous and crystallinedomains. Ishikawa et al.16 have examined the temperature dependence of crystalstructures of several even-even nylons. Jain and Vijayan have analysed the effect ofthermal aging on the crystal structural characteristics17.
Much of the earlier work concerns the Tr – H structural change associated withthe Brill transition. Influence of parameters like draw ratio, crystallization temperatureetc on the structural characteristics have also been studied11, 13. Explicit analysis of theX-ray thermal expansion behaviour, however, seems to have received comparativelyless attention. Murthy et al.15 have derived the thermal expansion coefficient of theamorphous segments of nylon 6,6 in a semi crystalline sample, as 5.9�10-4/°K, usingsmall angle X-ray data. Jayanna and Subramanyam18 have examined the thermalexpansion behavior of gamma-irradiated nylon 6,6 in the temperature range 10 to340° K. The present study is concerned with the elucidation of X-ray thermal expansioncoefficient of commercially available, nylon 6,6 fibers using wide angle X-ray diffractiondata collected with in situ heating, in the temperature range 25 to 225°C. In particular,attention has been focused on the behavior of the axial lengths of the crystallographicunit cell. Few other crystal structural changes, which accompany thermal treatment,have also been examined. It may be pointed out that although Ramesh et al11 andMurthy et al15 have dealt with both heating and cooling parts of a thermal cycle, the X-ray thermal expansion coefficients during both heating and cooling of nylon6,6 fibershave been compared for the first time, only in the present study.
2. EXPERIMENTAL
Nylon 6,6 fibers were obtained from M/s Goodfellow. A bundle of fibers ~ 0.3mmthick was held taut in the high temperature attachment for fibers supplied by M/s
Rigaku International Corporation, Japan, for the D/MAX 2200 Ultima X-ray powderdiffractometer. CuK� radiation, scintillation counter and a monochromator in thediffracted beam were used to record the patterns at room temperature (~25°C) and attemperatures (T) 50, 75,100,125, 150, 175, 200 and 225°C, both during heating andcooling. The heater assembly consisted of a semi cylindrical metal foil surroundingthe fibre sample. A chromel - alumel thermocouple placed near the sample measuredthe temperature. Heating rate was 5 °C per minute and after reaching the desiredtemperature, 10 minutes were allowed to stabilize. Fluctuation in temperature duringthe recording of any pattern was ±0.5°C. To distinguish between the two roomtemperature patterns viz., recorded prior to heating and that after a heating and coolingcycle respectively, the notations RT1 and RT2 are used.
Presence of the heater assembly necessitated the use of the �fixed
mode for recordingthe patterns. All the patterns were recorded with �
fixed = 5°. Equatorial and meridional
patterns were confined to the 2� ranges of 14 to 31° and 34 to 43° respectively. Selectionof such limited ranges was primarily to focus attention only on the intense reflectionsexpected from nylon 6,6. Indexing of reflections was based on the crystal structurereported earlier19. Characteristics of individual diffraction profiles were derived byusing the multi peak separation package utilizing a pseudo-Voigt function, suppliedwith the Rigaku diffractometer. In the case of some of the equatorial patterns wherethe initially distinct diffraction profiles merged into a single profile, multipeakseparation could be effected only with the package Sigmaplot, version 9.020. Theequatorial and meridional patterns included three reflections each in the chosen 2�ranges. Although the number of observed reflections was low, it was neverthelesssufficient to derive all the parameters of a triclinic unit cell, by combining theexperimentally derived parameters with appropriate formulae21. The estimatedstandard deviations for the 2� values range from 0.02 to 0.09°. The higher values ofthe standard deviations are in general, for the angles obtained by deconvolution of asingle profile into three independent ones, by using the Sigma plot package. Althoughthe standard deviation is rather high for these data sets, they appear reliable enoughto indicate the trend.
It must be mentioned that the data used in the present study pertain to a singleheating and cooling cycle (RT1�T�RT2) with no intermediate excursion to ambientconditions. Thus, the influence of abrupt drop to room temperature, often accidental,on the sample has been consciously avoided.
3. RESULTS AND DISCUSSION
3.1. Shift and Merging of Profiles
(a) EquatorialFigure 1 shows some of the equatorial profiles. Based on the triclinic (Tr) unit cell ofdimensions a = 4.9, b = 5.4, c = 17.2 Å, ��= 48.5, ��= 77 and ��= 63.5° given by Bunn andGarner19, the observed maxima at 2��� 20.2 and 23.3° in Figure 1 have been indexed as(100) and ((010)+(110)) respectively. Here, the + sign refers to overlap of reflections.The patterns corresponding to T = 50, 75 and 100 °C during heating and 75, 50 °C and
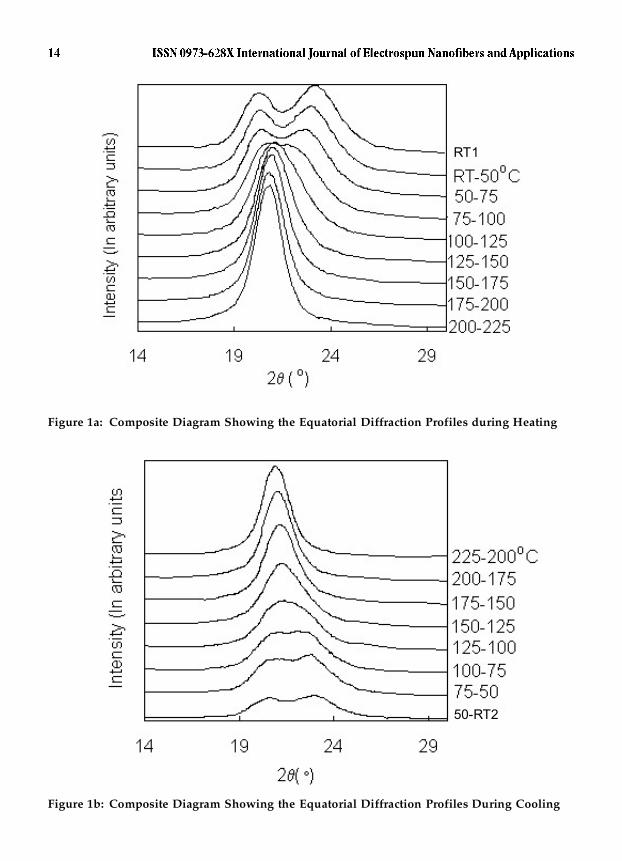
Figure 1a: Composite Diagram Showing the Equatorial Diffraction Profiles during Heating
Figure 1b: Composite Diagram Showing the Equatorial Diffraction Profiles During Cooling
RT1
50-RT2
RT2 during cooling are similar to the pattern recorded at RT1 thereby suggesting thatthe initial structure is substantially retained at these temperatures. At the rest of thetemperatures, the two diffraction maxima characteristic of RT1, merge into a singlepeak. Major contribution to the merger arises from the shift towards lower angle ofthe second reflection at 2��� 23.3°. During heating, the merger observed first at 125°Cpersists up to 225 °C and while cooling, the single profile is retained upto 100 °Cbeyond which , it splits into two different maxima, similar to the pattern at RT1. Themerging of reflections, which is part of both the heating and cooling cycles, conformswell with the structural transformation to a hexagonal (H) crystal system, reportedearlier for nylon 6,6. This is also the well-known Brill transition mentioned earlier6. Ahexagonal system necessitates the merging of (100), (010) and (110) reflections. Thus,in a single heating and cooling cycle, the nylon 6,6 sample gets characterized by twocrystal systems Tr and H in the order Tr (heating) � H (cooling) � Tr. It is interestingto note that the temperature at which the merger corresponding to the Tr � Htransformation takes place during heating, viz., 125 °C is higher than the temperature,75 °C, at which the demerger or splitting corresponding to the reverse, H � Trtransformation takes place during cooling. Such a difference suggests thermallyinduced hysteresis indicative of different rates at which the changes occur duringheating and cooling respectively. Ramesh et al 11 have also reported a hysteresis in thed-spacings recorded from samples crystallized at various temperatures where theydeal with an initial hexagonal Brill structure changing to triclinic during cooling.
Some of the earlier studies 9,10,12,13,16 contend that the merger of reflections is notdue to a Tr � H structural, Brill transition but is a result of anisotropic thermalexpansion of the triclinic unit cell. According to Hsiao et al, the initial triclinic structurepersists above the Brill transition temperature also. Ishikawa et al also mention thatthe Brill transition reported for nylons is not a phase transition, but an abrupt thermalexpansion. Although such anisotropic thermal expansion of a triclinic cell leading toan ideal hexagonal symmetry appears rather fortuitous, it is not impossible becausethe crystal structure of nylon 6,6 is characterized by concentration of distinctly differenttypes of bonds along the axial directions of the unit cell. It is found that the axialdirections a, b and c correspond to concentration of hydrogen bonds, van der Waal’sinteractions and covalent bonds respectively. Such a structural anisotropy can indeedevoke differences in their response to changes in temperature and � consequentanisotropy in the thermal expansion behaviour. In particular, the �-directioncorresponding to concentration of inter layer, van der Waal’s interactions can beexpected to expand more than the a- or c- dimensions. The comparatively higher shiftobserved in the present study, for the reflection (010) towards lower angle, does indeedfavour this view. However, the unit cell dimensions, to be described subsequently inthis paper, do not provide conclusive evidence that an anisotropic thermal expansionhas led to an ideal hexagonal structure and a consequent merger of the equatorialreflections. The present study has therefore been carried out based on the former viewviz., the thermally induced Tr (heating) � H (cooling) � Tr transformations areresponsible for the merger and demerger of the equatorial reflections respectively.
(b) MeridionalThe meridional patterns include the reflections (017), (127) and (027) occurring at 2�values of 37.5, 38.6 and 40.4° respectively. The first two reflections overlap to form asingle, broad profile. In contrast with the equatorial pattern, there is no temperature-induced merger of meridional reflections. However, the angular separation betweenthe two observed maxima registers changes, which could be attributed, primarily, tothermally induced variations in the unit cell parameters. It may be mentioned that inthe case of the aramid fiber Kevlar, similar changes in angular separation of equatorialreflections were correlated with variations in the tensile strength of the fiber22.
3.2. Axial Dimensions – Anisotropic Behavior
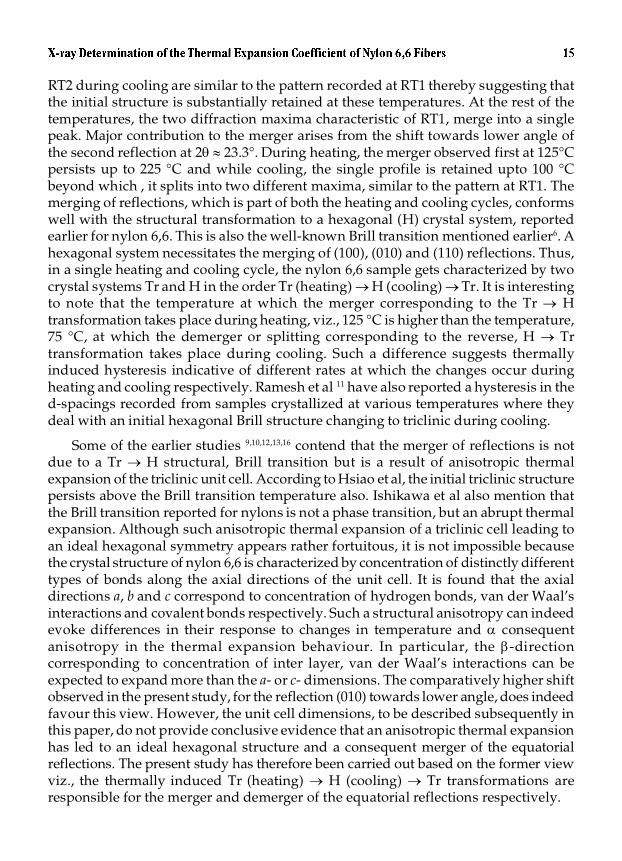
In the crystal structure of nylon 6,6, the crystallographic c-axis is the fiber axis. Figure2 shows the variation of the c-axial length with temperature. Heating and cooling areaccompanied by contraction and expansion respectively, along with a suggestedhysteresis. The c-lengths corresponding to the two room temperatures RT1 and RT2differ by ~1.8%, which is the residual effect of a single heating and cooling cycle.Decrease of this order in the axial dimension of the polymer suggests that minor,localized changes from the initial all trans conformation of the poly (hexa methyleneadipamide) or PHMA chains of which nylon 6,6 is made of, are perhaps introducedduring the heating and/or cooling cycle and the changes are not fully recovered onreturning to ambient conditions. Conformational changes of this type can indeed affect
Figure 2: Variation of The c-axial Length with T. The Discontinuity in The Line Correspondsto The Region of Large Change
the initial tensile characteristics of the fiber. Our earlier studies on the effect of thermalaging of nylon 6,6 provide evidence for such a correlation between deterioration intensile properties and heat treatment17. It may also be mentioned that in the case of thearamid fiber Kevlar, excursion to low temperatures up to -100 °C led to ~ 2.5% reductionin the initial, fiber axial length of the polymer23. Thus, the temperature inducedhysteresis in the fiber axial length seems to be a feature common to both aliphatic andaromatic polyamides.
Figure 2 also shows that in the course of heating as well as cooling, a sudden,large change in the c-value occurs in the region 100 � 125 °C and 100 � 75 °Crespectively. Such behaviour suggests possible structural changes, which as mentionedearlier, are of the Tr - H type, occurring at these temperatures. Hsiao et al13 have alsoobserved such large changes in unit cell dimensions during heating and they attributesuch ‘step-changes’ to a pre melting of small crystals and a subsequent anisotropicexpansion of the remaining larger crystals. It must be pointed out that as per the presentdata, step-changes are characteristic not only of heating but also of cooling. Associatingthe concept of premelting to cooling does not appear quite acceptable. In contrast, areverse H � Tr transition accompanying cooling can well account for the observedlarge change in the cell dimension.
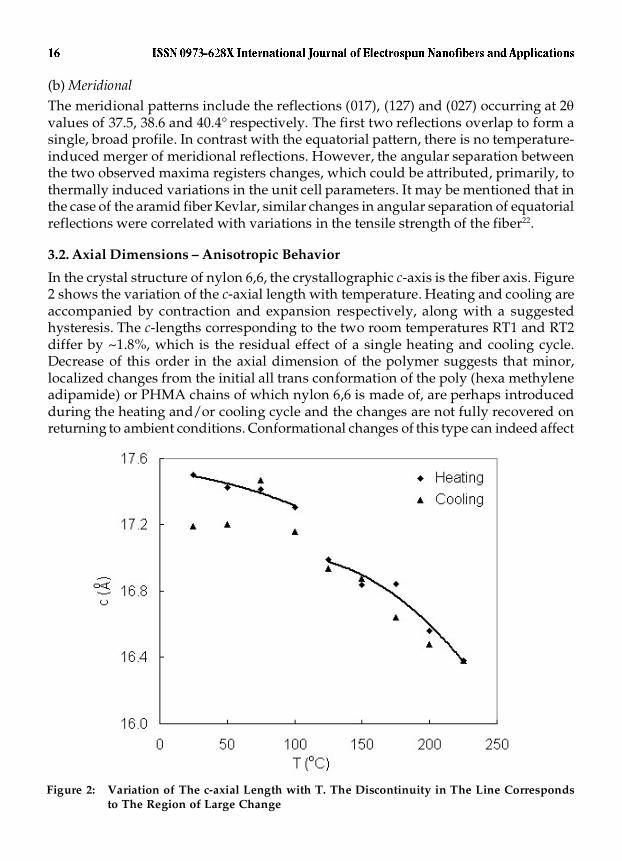
Figure 3 presents the variation of the thermal expansion coefficient, �c, with
T calculated using the c-values depicted in Figure 2. The �c values pertaining to theheating and cooling parts of the cycle are calculated with respect to the values c (RT1)and c (225°C) respectively.
Interestingly, �c
is not constant during either heating or cooling.As could be expected, during heating, �c is negative. It gets more negative with increasein temperature and then nearly stabilizes at ~200 – 225°C. Cooling is characterized by aprogressive increase in the �c value. The average values of �c during heating and coolingare -2.5 � 10-4 / °C and 3.4 � 10-4 / °C respectively. The thermal expansion coefficient of~1 � 10-4 / °C reported3,4 for the entire fiber, during heating, is indeed different andcould be attributed to the presence of less crystalline fraction, impurities etc in the fiber,whose response to temperature could vary from that of the crystalline fraction. The �cvalues presented here represent the behavior of the crystalline fraction only. There isalso a remarkable similarity in the behavior of nylon 6,6 and the aramid fiber Kevlar. Inboth the cases, the X-ray thermal expansion coefficient during heating is more negativethan the macro thermal expansion coefficient.
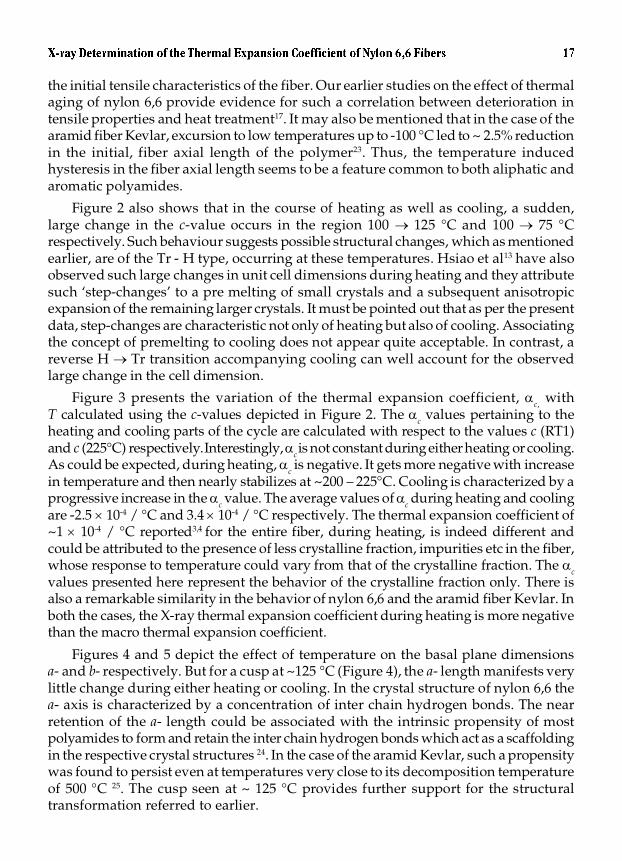
Figures 4 and 5 depict the effect of temperature on the basal plane dimensionsa- and b- respectively. But for a cusp at ~125 °C (Figure 4), the a- length manifests verylittle change during either heating or cooling. In the crystal structure of nylon 6,6 thea- axis is characterized by a concentration of inter chain hydrogen bonds. The nearretention of the a- length could be associated with the intrinsic propensity of mostpolyamides to form and retain the inter chain hydrogen bonds which act as a scaffoldingin the respective crystal structures 24. In the case of the aramid Kevlar, such a propensitywas found to persist even at temperatures very close to its decomposition temperatureof 500 °C 25. The cusp seen at ~ 125 °C provides further support for the structuraltransformation referred to earlier.
Figure 3: Variation of c with T
-0.00075
-0.00025
0.00025
0.00075
0 50 100 150 200 250
T (oC)
αc (/
o C)
Heatingcooling
Figure 4: Variation of a- length with T
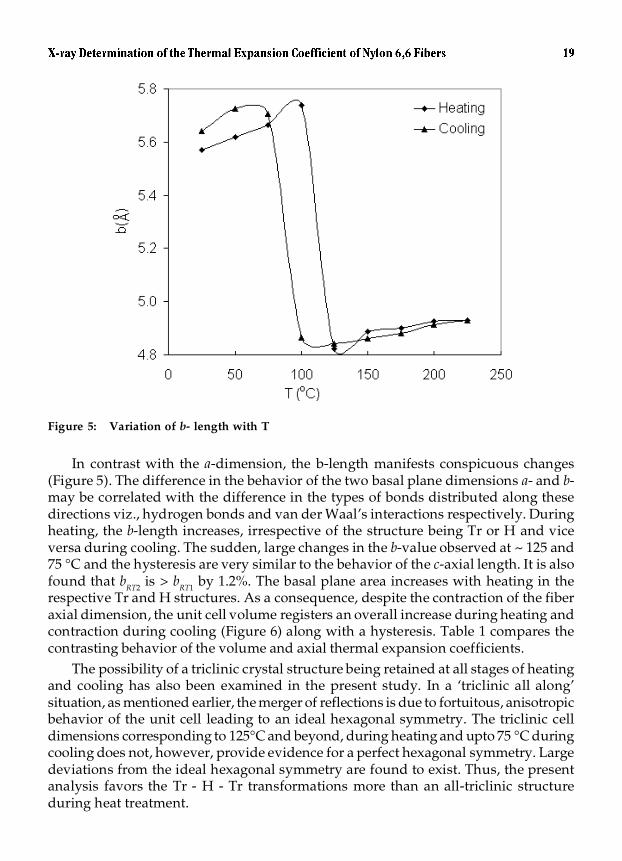
Figure 5: Variation of b- length with T
In contrast with the a-dimension, the b-length manifests conspicuous changes(Figure 5). The difference in the behavior of the two basal plane dimensions a- and b-may be correlated with the difference in the types of bonds distributed along thesedirections viz., hydrogen bonds and van der Waal’s interactions respectively. Duringheating, the b-length increases, irrespective of the structure being Tr or H and viceversa during cooling. The sudden, large changes in the b-value observed at ~ 125 and75 °C and the hysteresis are very similar to the behavior of the c-axial length. It is alsofound that bRT2 is > bRT1 by 1.2%. The basal plane area increases with heating in therespective Tr and H structures. As a consequence, despite the contraction of the fiberaxial dimension, the unit cell volume registers an overall increase during heating andcontraction during cooling (Figure 6) along with a hysteresis. Table 1 compares thecontrasting behavior of the volume and axial thermal expansion coefficients.
The possibility of a triclinic crystal structure being retained at all stages of heatingand cooling has also been examined in the present study. In a ‘triclinic all along’situation, as mentioned earlier, the merger of reflections is due to fortuitous, anisotropicbehavior of the unit cell leading to an ideal hexagonal symmetry. The triclinic celldimensions corresponding to 125°C and beyond, during heating and upto 75 °C duringcooling does not, however, provide evidence for a perfect hexagonal symmetry. Largedeviations from the ideal hexagonal symmetry are found to exist. Thus, the presentanalysis favors the Tr - H - Tr transformations more than an all-triclinic structureduring heat treatment.
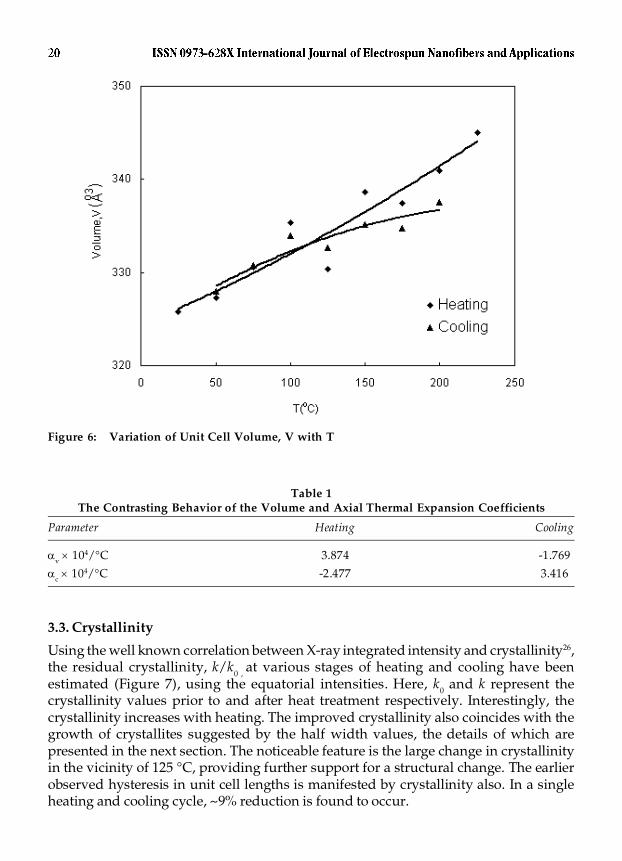
Figure 6: Variation of Unit Cell Volume, V with T
Table 1The Contrasting Behavior of the Volume and Axial Thermal Expansion Coefficients
Parameter Heating Cooling
�v � 104/°C 3.874 -1.769
�c � 104/°C -2.477 3.416
3.3. Crystallinity
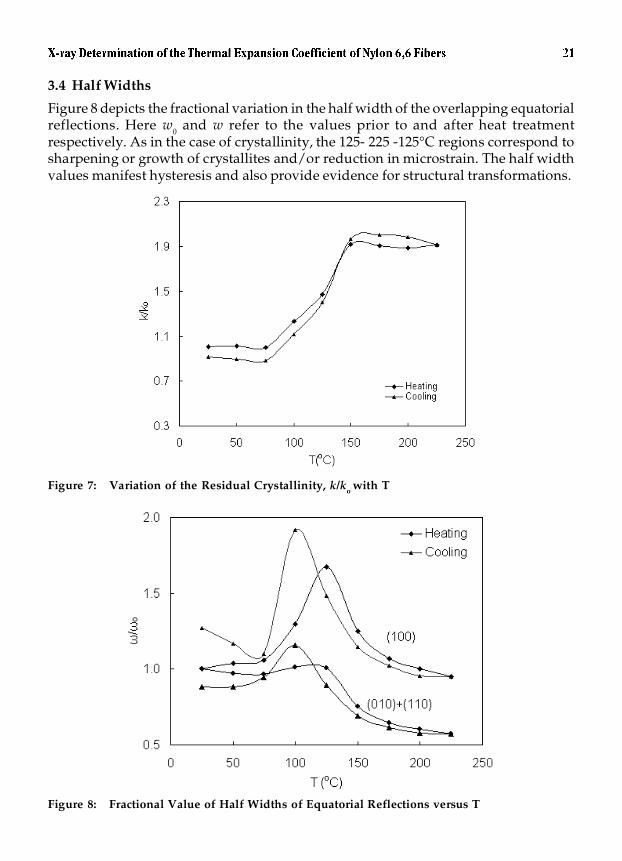
Using the well known correlation between X-ray integrated intensity and crystallinity26,the residual crystallinity, k/k0 , at various stages of heating and cooling have beenestimated (Figure 7), using the equatorial intensities. Here, k0 and k represent thecrystallinity values prior to and after heat treatment respectively. Interestingly, thecrystallinity increases with heating. The improved crystallinity also coincides with thegrowth of crystallites suggested by the half width values, the details of which arepresented in the next section. The noticeable feature is the large change in crystallinityin the vicinity of 125 °C, providing further support for a structural change. The earlierobserved hysteresis in unit cell lengths is manifested by crystallinity also. In a singleheating and cooling cycle, ~9% reduction is found to occur.
3.4 Half Widths
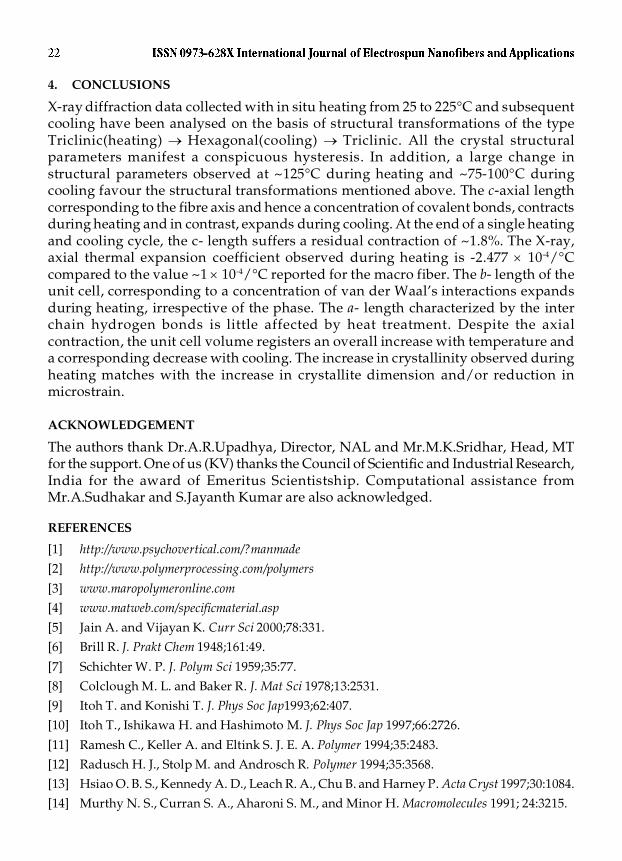
Figure 8 depicts the fractional variation in the half width of the overlapping equatorialreflections. Here w0 and w refer to the values prior to and after heat treatmentrespectively. As in the case of crystallinity, the 125- 225 -125°C regions correspond tosharpening or growth of crystallites and/or reduction in microstrain. The half widthvalues manifest hysteresis and also provide evidence for structural transformations.
Figure 7: Variation of the Residual Crystallinity, k/ko with T
Figure 8: Fractional Value of Half Widths of Equatorial Reflections versus T
4. CONCLUSIONS
X-ray diffraction data collected with in situ heating from 25 to 225°C and subsequentcooling have been analysed on the basis of structural transformations of the typeTriclinic(heating) � Hexagonal(cooling) � Triclinic. All the crystal structuralparameters manifest a conspicuous hysteresis. In addition, a large change instructural parameters observed at ~125°C during heating and ~75-100°C duringcooling favour the structural transformations mentioned above. The c-axial lengthcorresponding to the fibre axis and hence a concentration of covalent bonds, contractsduring heating and in contrast, expands during cooling. At the end of a single heatingand cooling cycle, the c- length suffers a residual contraction of ~1.8%. The X-ray,axial thermal expansion coefficient observed during heating is -2.477 � 10-4/°Ccompared to the value ~1 � 10-4/°C reported for the macro fiber. The b- length of theunit cell, corresponding to a concentration of van der Waal’s interactions expandsduring heating, irrespective of the phase. The a- length characterized by the interchain hydrogen bonds is little affected by heat treatment. Despite the axialcontraction, the unit cell volume registers an overall increase with temperature anda corresponding decrease with cooling. The increase in crystallinity observed duringheating matches with the increase in crystallite dimension and/or reduction inmicrostrain.
ACKNOWLEDGEMENT
The authors thank Dr.A.R.Upadhya, Director, NAL and Mr.M.K.Sridhar, Head, MTfor the support. One of us (KV) thanks the Council of Scientific and Industrial Research,India for the award of Emeritus Scientistship. Computational assistance fromMr.A.Sudhakar and S.Jayanth Kumar are also acknowledged.
REFERENCES
[1] http://www.psychovertical.com/?manmade
[2] http://www.polymerprocessing.com/polymers
[3] www.maropolymeronline.com
[4] www.matweb.com/specificmaterial.asp
[5] Jain A. and Vijayan K. Curr Sci 2000;78:331.
[6] Brill R. J. Prakt Chem 1948;161:49.
[7] Schichter W. P. J. Polym Sci 1959;35:77.
[8] Colclough M. L. and Baker R. J. Mat Sci 1978;13:2531.
[9] Itoh T. and Konishi T. J. Phys Soc Jap1993;62:407.
[10] Itoh T., Ishikawa H. and Hashimoto M. J. Phys Soc Jap 1997;66:2726.
[11] Ramesh C., Keller A. and Eltink S. J. E. A. Polymer 1994;35:2483.
[12] Radusch H. J., Stolp M. and Androsch R. Polymer 1994;35:3568.
[13] Hsiao O. B. S., Kennedy A. D., Leach R. A., Chu B. and Harney P. Acta Cryst 1997;30:1084.
[14] Murthy N. S., Curran S. A., Aharoni S. M., and Minor H. Macromolecules 1991; 24:3215.
[15] Murthy N. S., Wang Z. G. and Hsiao O. B. S. Macromolecules 1999; 32:5594.[16] Ishikawa H., Itoh T., Hashimoto M. and Fujiwara S. J. Phys Soc Jap 2004; 73:303.[17] Jain A. and Vijayan K. J. Mat Sci 2002; 37:2623.[18] Jayanna H. S. and Subramanyam S. V. J. Mat Sci Lett 1994; 13:1190.[19] Bunn C. W. and Garner E. Proc Roy Soc Lond Ser A 1947; 39:189.[20] Sigmaplot 9.0. Systat Software, Inc, CA USA 2004.[21] Buerger M. J, in X-Ray Crystollagraphy. John Wiley & Sons, Inc New York 1958:360.[22] Parimala H. V., Shubha M. and Vijayan K. J. Mat Sci Lett 1991;10:1377.[23] Iyer R. V., Sooryanarayana K., Guru Row T. N. and Vijayan K. J. Mat Sci 2003;38:133.[24] Jain A. Ph D Thesis, Mangalore Univ, India 2001.[25] Iyer R. V. and Vijayan K. Bull Mat Sci 1999;22:1013.[26] Wakelin J. H., Virgin H. S. and Crystal E. J. Appl Phys 1959;30:654.
