w.x.b.6/28/20151 production of metabolic energy mitochondrial diseasesmitochondrial diseases...
Post on 21-Dec-2015
217 views
TRANSCRIPT

W.X.B.W.X.B. 04/18/2304/18/23 11
Production of Metabolic EnergyProduction of Metabolic Energy
• Mitochondrial Diseases Mitochondrial Diseases
• Oxidation Reduction ReactionsOxidation Reduction Reactions
• Electron Transport Electron Transport • Oxidative PhosphorylationOxidative Phosphorylation

W.X.B.W.X.B. 04/18/2304/18/23 22
Mitochondrial DiseasesMitochondrial Diseases• Rare genetic diseases with
maternal inheritance patterns• Etiology is inability to produce ATP• Diseases vary in severity with a
broad range of clinical symptoms. • Tissues most prominently affected
are those that require the most energy:
– brain– heart– liver– skeletal muscle
• Presently no cures, but understanding of these disease has progressed to the point where we can manage the pathologies associated with these diseases
• There are physicians who specialize in treating mitochondria based diseases.
• Mitochondrial DNA (mtDNA) codes for Mitochondrial DNA (mtDNA) codes for 13 mitochondrial proteins,13 mitochondrial proteins,
• most mtDNA proteins are functionally most mtDNA proteins are functionally involved in aerobic mitochondrial ATP involved in aerobic mitochondrial ATP production. production.
• mtDNA is easily mutated and poorly mtDNA is easily mutated and poorly repaired causing rapid accumulation repaired causing rapid accumulation of mutations of mutations
• Because mitochondria are essential to Because mitochondria are essential to aerobic production of ATP mutations aerobic production of ATP mutations in mtDNA can be catastrophic to a in mtDNA can be catastrophic to a cell.cell.
• High oxygen consuming tissues do so High oxygen consuming tissues do so because of their large numbers of because of their large numbers of mitochondria mitochondria
• Mitochondria produce high levels of Mitochondria produce high levels of ATP needed to support their ATP needed to support their physiological function. The most physiological function. The most prominent of the oxygen using tissues prominent of the oxygen using tissues are brain, heart liver kidney and are brain, heart liver kidney and skeletal muscle.skeletal muscle.

W.X.B.W.X.B. 04/18/2304/18/23 33
Selected Mitochondrial DiseasesSelected Mitochondrial Diseases
• Mytochondrial MyopathiesMytochondrial Myopathies– Postviral Fatigue SyndromePostviral Fatigue Syndrome– MERRF- Myoclonic epilepsy with ragged red fibersMERRF- Myoclonic epilepsy with ragged red fibers
• Neurodegenerative DiseasesNeurodegenerative Diseases– Glutamate Toxicity: Glutamate Toxicity: – Leber Hereditary Optic Neuropathy (LHON)Leber Hereditary Optic Neuropathy (LHON)– Parkinsons SyndromeParkinsons Syndrome

W.X.B.W.X.B. 04/18/2304/18/23 44
Hypothyroid Hypothyroid Function and Function and Mitochondrial Mitochondrial InsufficiencyInsufficiency

W.X.B.W.X.B. 04/18/2304/18/23 55
Humans use less oxygen as they ageHumans use less oxygen as they age
• Basal metabolic oxygen Basal metabolic oxygen consumption declines consumption declines with age.with age.
• Basal metabolism has 2 Basal metabolism has 2 components:components:– 1. ATP using reactions.1. ATP using reactions.
– 2 Mitochondrial ATP 2 Mitochondrial ATP generating reactions.generating reactions.

W.X.B.W.X.B. 04/18/2304/18/23 66
Lactic Acidosis in Mitochondrial InsufficiencyLactic Acidosis in Mitochondrial Insufficiency
• Inhibited e- transport Inhibited e- transport causes high mito NADH causes high mito NADH and an lack of mito ATP. and an lack of mito ATP.
• High mito NADH inhibits High mito NADH inhibits shuttle activity, but low ATP shuttle activity, but low ATP stimulates glycolysis.stimulates glycolysis.
• Result is production of Result is production of glycolytic ATP and high glycolytic ATP and high cytosolic NADH.cytosolic NADH.
• Continuation of glycolysis Continuation of glycolysis with ATP and NADH with ATP and NADH production leads to production leads to conversion of pyruvate to conversion of pyruvate to lactate and ultimately lactic lactate and ultimately lactic acidosisacidosis
NAD H O2
NADH O2
M ito c ho nd ria lEle c tro n Tra nsp o rt
M ITOCHONDRION
NADH
NAD
Pyruva te
G luc o seNAD
La c ta te
La c tic a c id o sis
N AD H Shuttle s
G UC O LYSIS

W.X.B.W.X.B. 04/18/2304/18/23 77
Development of Metabolic EnergyDevelopment of Metabolic EnergyM i t o c h o n d r i a l E n e r g y T r a n s d u c t i o n
e -
e -
e -
2 e -
1 / 2O2
O- 2
I n t r a m i t o c h o n d r i a lp o o l o f f r e e p r o t o n s d e r i v e d f r o m d i s s o c i a t i o no f p r o t o n a t e d m o l e c u l e sa n d f r o m d i s s o c i a t i o n o f w a t e r
H+
H+
H+
A D P + P i
A T PH+
+
ATP SynthaseATP Synthase
Electrons from donors like Succinat or NADHe.g. Succinate Fumarate + 2e- + 2H+

W.X.B.W.X.B. 04/18/2304/18/23 88
Electron Transport and Oxidative Phosphorylation: Electron Transport and Oxidative Phosphorylation: Processes of Inner Mitochondrial MembranesProcesses of Inner Mitochondrial Membranes
• Inside the inner membrane is the "mitochondrial matrix". This appears moderately Inside the inner membrane is the "mitochondrial matrix". This appears moderately dense and one may find strands of DNA, ribosomes, or small granules in the dense and one may find strands of DNA, ribosomes, or small granules in the matrix. The mitochondria are able to code for part of their proteins with these matrix. The mitochondria are able to code for part of their proteins with these molecular tools. The following cartoon shows the diagram of the mitochondrial molecular tools. The following cartoon shows the diagram of the mitochondrial membranes and the enclosed compartments. In the right hand view, the membranes and the enclosed compartments. In the right hand view, the membrane of the crista is shown with "lollipop-like" figures on their inner surface. membrane of the crista is shown with "lollipop-like" figures on their inner surface. These are elementary particles that generate ATP with its high energy bonds. We These are elementary particles that generate ATP with its high energy bonds. We cannot see them in routine electron micrographs (see above figure). Their cannot see them in routine electron micrographs (see above figure). Their structure and significance will be discussed below. structure and significance will be discussed below.
Internal membrane
DNA
MitochondrialRibosone
F1 ATPaseExternal membrane
Matrix Space
Matrix
External Membrane
granule

W.X.B.W.X.B. 04/18/2304/18/23 99
Mitochondria: Structural CharacteristicsMitochondria: Structural Characteristics
• Mitochondria are the cells' power Mitochondria are the cells' power sources. They are distinct sources. They are distinct organelles with two membranes. organelles with two membranes. Usually they are rod-shaped, Usually they are rod-shaped, however they can be round. The however they can be round. The outer membrane limits the outer membrane limits the organelle. The inner membrane is organelle. The inner membrane is thrown into folds or shelves that thrown into folds or shelves that project inward. These are called project inward. These are called "cristae mitochondriales". "cristae mitochondriales". from from Fawcett, A Textbook of Histology, Fawcett, A Textbook of Histology, Chapman and Hall, 12th edition, Chapman and Hall, 12th edition, 19941994..

W.X.B.W.X.B. 04/18/2304/18/23 1010
Oxidation Reduction Half CellsOxidation Reduction Half Cells

W.X.B.W.X.B. 04/18/2304/18/23 1111
The Standard The Standard HH22 1/2Cell is a 1/2Cell is a
Reference Reference Standard Standard

W.X.B.W.X.B. 04/18/2304/18/23 1212
Free Energy of NADH OxidationFree Energy of NADH Oxidation
• Conventions:Conventions:– electric potential is in voltselectric potential is in volts– n = # of electronsn = # of electrons– F = Faraday 23 kcal/volt/molF = Faraday 23 kcal/volt/mol– algebraic differences are: algebraic differences are:
• (e- acceptor) - (e- donor)(e- acceptor) - (e- donor)
• CalculationsCalculations– Standard Free Energy (Standard Free Energy (GGoo’) is ’) is
about -52.6 kcal/mol.about -52.6 kcal/mol.– Std. Free Energy of ATP Std. Free Energy of ATP
hydrolysis is about -7.3 hydrolysis is about -7.3 kcal/molkcal/mol
– 3 ATPs are made per NADH 3 ATPs are made per NADH oxidized oxidized
– Efficiency of energy Efficiency of energy conversion is about 42%!conversion is about 42%!
– Actual available Free Energy Actual available Free Energy depends on molar depends on molar concentrations of reactants concentrations of reactants and products.and products.
W.X.B.W.X.B. 04/18/2304/18/23 1313
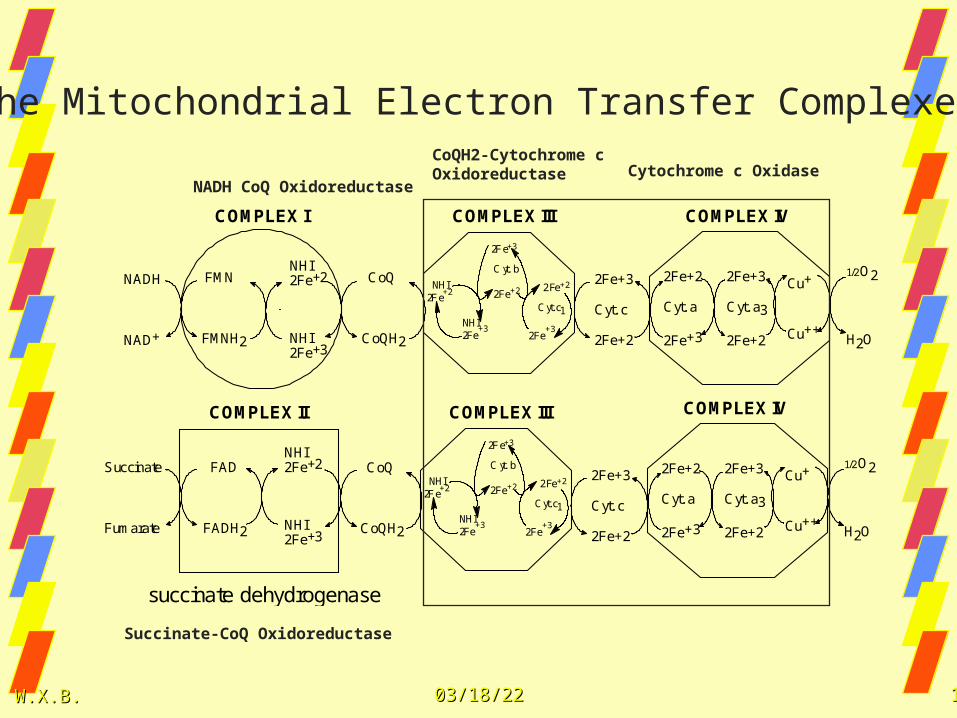
CoQ
CoQH2
NHI2Fe+2
NHI2Fe+3
Succinate
Fumarate
FAD
FADH2
COMPLEX II
2Fe+3
Cyt. c
2Fe+2
COMPLEX III
2Fe+3
C yt. b
2Fe+2 NHI2Fe
+2
NHI 2Fe
+3
2Fe+2
Cyt. c1
2Fe+3
2Fe+3
Cyt. a3
2Fe+2
2Fe+2
Cyt. a
2Fe+3
COMPLEX IV
Cu+
Cu++
NADH
NAD+
FMN
FMNH2
NHI2Fe+2
NHI2Fe+3
CoQ
CoQH2
COMPLEX I
2Fe+3
Cyt. c
2Fe+2
COMPLEX III
2Fe+3
C yt. b
2Fe+2 NHI2Fe
+2
NHI 2Fe
+3
2Fe+2
Cyt. c1
2Fe+3
1/2O2
H2O
2Fe+3
Cyt. a3
2Fe+2
2Fe+2
Cyt. a
2Fe+3
COMPLEX IV
Cu+
Cu++
1/2O2
H2O
succinate dehydrogenase
The Mitochondrial Electron Transfer Complexes
NADH CoQ Oxidoreductase
CoQH2-Cytochrome c Oxidoreductase Cytochrome c Oxidase
Succinate-CoQ Oxidoreductase
W.X.B.W.X.B. 04/18/2304/18/23 1414
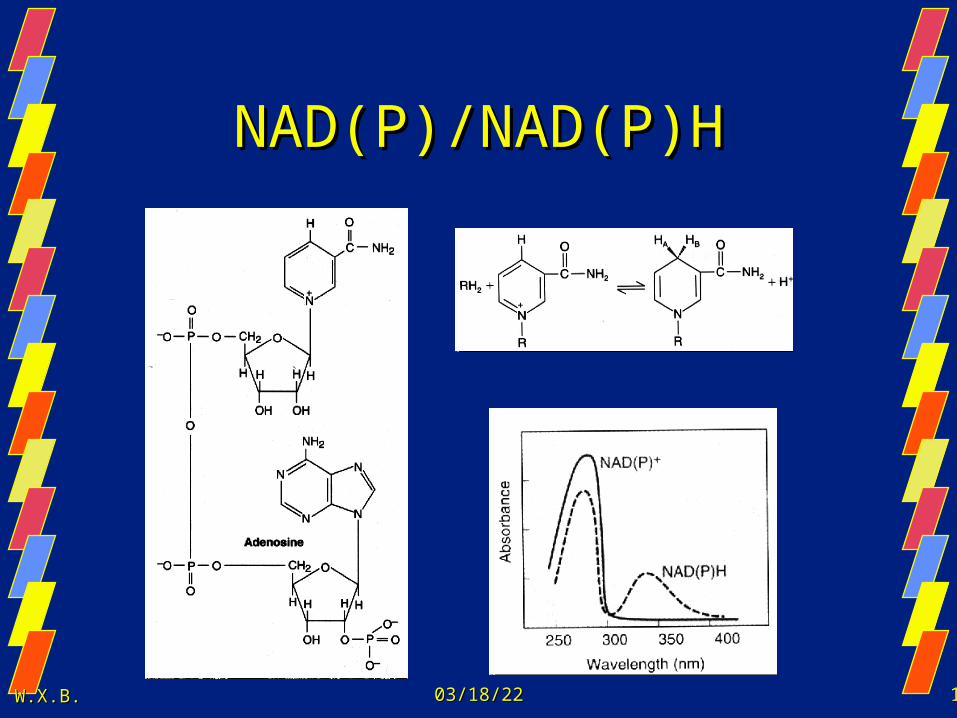
NAD(P)/NAD(P)HNAD(P)/NAD(P)H

W.X.B.W.X.B. 04/18/2304/18/23 1515
Functional Redox Forms of Flavin Nucleotides

W.X.B.W.X.B. 04/18/2304/18/23 1616
Functional forms of Coenzyme QFunctional forms of Coenzyme Q

W.X.B.W.X.B. 04/18/2304/18/23 1717
Nonheme Iron or Iron Sulfur CentersNonheme Iron or Iron Sulfur Centers

W.X.B.W.X.B. 04/18/2304/18/23 1818
Simplified view of Electron Transport through Complex I
NAD
SH2
S
NADH+H+
FMN
FMNH2
NHI2( Fe+3)
NHI2( Fe+2)
CoQ
CoQH2
Eo' = 0.42 Vor
G'o = -19 kcal/mole
Complex I

W.X.B.W.X.B. 04/18/2304/18/23 1919
Iron-Protoporphyrins (Heme) Found in Mammalian Cells

W.X.B.W.X.B. 04/18/2304/18/23 2020
Electron Transport Through Complex III

W.X.B.W.X.B. 04/18/2304/18/23 2121
Heme binding in the globin pocket of cytochrome Heme binding in the globin pocket of cytochrome cc

W.X.B.W.X.B. 04/18/2304/18/23 2222
Complex IV (cyt. a+a3 or cyt. oxidase)

W.X.B.W.X.B. 04/18/2304/18/23 2323
Free Energy Changes in Electron Transport
UQUQ

W.X.B.W.X.B. 04/18/2304/18/23 2424

W.X.B.W.X.B. 04/18/2304/18/23 2525
Malate Aspartate Shuttle P:2e- = 2.5

W.X.B.W.X.B. 04/18/2304/18/23 2626
Glycerol Phosphate Shuttle, P:2e- = 1.5
CH2OPO3-
CH2-0H
CH2OH
glyceraldehye-3-P
dihydroxy acetonephosphate
CH2OPO3-
CH2-0H
C=O
NADH + H+
NAD+
CYTOSOLICglycerol phophate dehydrogenase
CoQ
CoQH2
12 O2
H2O
electrontransport
MITOCHONDRIALglycerol phosphate dehydrogenase FAD containing
CytosolicSide
MitochondrialMatrix Side
InnerMitochondrial Membrane