www.walsall.gov.uk area 2: aldridge & beacon march 2015 version 1.2 area partnership profile
TRANSCRIPT
www.walsall.gov.uk
Area 2: Aldridge & Beacon
March 2015Version 1.2
Area Partnership Profile
www.walsall.gov.uk
Profile Structure
1. Geography, Demographics, Deprivation & Social Segmentation
2. Economy & Employment3. Education & Young People4. Health & Wellbeing5. Crime & Community SafetyAnnex A: Guidance notes, useful links and acknowledgements (Includes help with interpreting charts that reference confidence intervals)
2

www.walsall.gov.uk
1 Geography, Demographics, Deprivation & Social Segmentation

www.walsall.gov.uk
Key Issues• Relatively older population profile, with a higher than borough
average proportion of adults above retirement age and a lack of young children and young working age adults
• Low level of ethnic diversity• High levels of life expectancy for males and females across the Area
Partnership• Very high proportion of owner occupied housing• Above average proportion of older people (65+) living alone• Low multiple deprivation across majority of the Area—with the
exception of a couple of neighbourhoods which are amongst the most deprived nationally
• High proportion of residents within the most affluent social groups

www.walsall.gov.uk
Geography
• Covers 34.59 sq km (3,459 ha)• Makes up 33.4% of the area of
Walsall borough• Population density of 15 people per
hectare (much lower than borough average of 26)
Source: Ordnance Survey; ONS, Mid-2013 Population Estimates
Wards and Community Areas

www.walsall.gov.uk
17.0
20.9
59.2
61.5
23.8
17.6
0% 20% 40% 60% 80% 100%
Area 2
WalsallChildren (0-15)
Working age (16-64)
Older people (65+)
Population Structure
Source: ONS, Mid-2013 Population Estimates
• Total Population: 52,300• Much older age profile
than borough overall• Fewer children and
younger working age adults
• More older working age and above (45+)
90+
85 - 89
80 - 84
75 - 79
70 - 74
65 - 69
60 - 64
55- 59
50 - 54
45 - 49
40 - 44
35 - 39
30 - 34
25 - 29
20 - 24
15 - 19
10 - 14
5 - 9
0 - 4

www.walsall.gov.uk
Ethnicity
Source: ONS, 2011 Census
• Indian: 3.6%• White Irish: 1.0%• Mixed White/Black
Caribbean: 0.9%• AP has below
borough average proportion of minority ethnic residents (Walsall av. 23.1%)
White British; 89.5
White Other; 1.2
Mixed; 1.6
Asian; 5.4
Black; 1.2
Other; 0.5
Minority Ethnic; 10.6

www.walsall.gov.uk
Female Life Expectancy• Average life
expectancy (LE) for females in Walsall is 82.7 years
• All wards within Aldridge & Beacon have higher LE for females than the borough average.
Source: PHMF 2007-11, Life Expectancy Tool

www.walsall.gov.uk
Male Life Expectancy
Source: PHMF 2007-11, Life Expectancy Tool
• Average life expectancy (LE) for males in Walsall is 77.8 years
• All wards within Aldridge & Beacon have higher male LE than the borough average.

www.walsall.gov.uk
Household Composition Total
Family: Couple
Family : Lone parent
One person: Below 65
One person: Over 65
Other household types
3,313 15.2 12.8 12.4
4,074 18.7 16.1 16.1
1,911 8.8 12.0 10.6
2,536 11.7 15.7 17.8
AP % Walsall % E&W %
9,898 45.5 43.4 43.0
Household Composition• 21,732 households (with at least 1 usual resident)• Increase of 8.2% since 2001 (Walsall av. 6.0%)• Average household size: 2.4 (Walsall av. 2.5)
Source: ONS, Census 2011
• Above average proportion of older people (65+) living alone

www.walsall.gov.uk
Tenure Total
Owned outright
Owned mortgage
Socially rented
Privately rented
Living rent-free 185 0.9 1.3 1.4
1,707 7.9 11.7 16.7
1,900 8.7 24.1 17.6
8,411 38.7 31.9 33.5
9,529 43.8 31.1 30.8
AP % Walsall % E&W %
Housing Tenure
Source: ONS, Census 2011 *ONS measure – based on (room) occupancy rating of -1 or less
• High levels of owner occupation (inc without a mortgage)• Very low proportion of socially and privately rented properties
• 3.3% of households ‘overcrowded’* (Walsall av. 6.5%)• 1.9% of households without central heating (Walsall av. 2.8%)
82.5 8.7 7.9
Owned Social rented Private rented
www.walsall.gov.uk
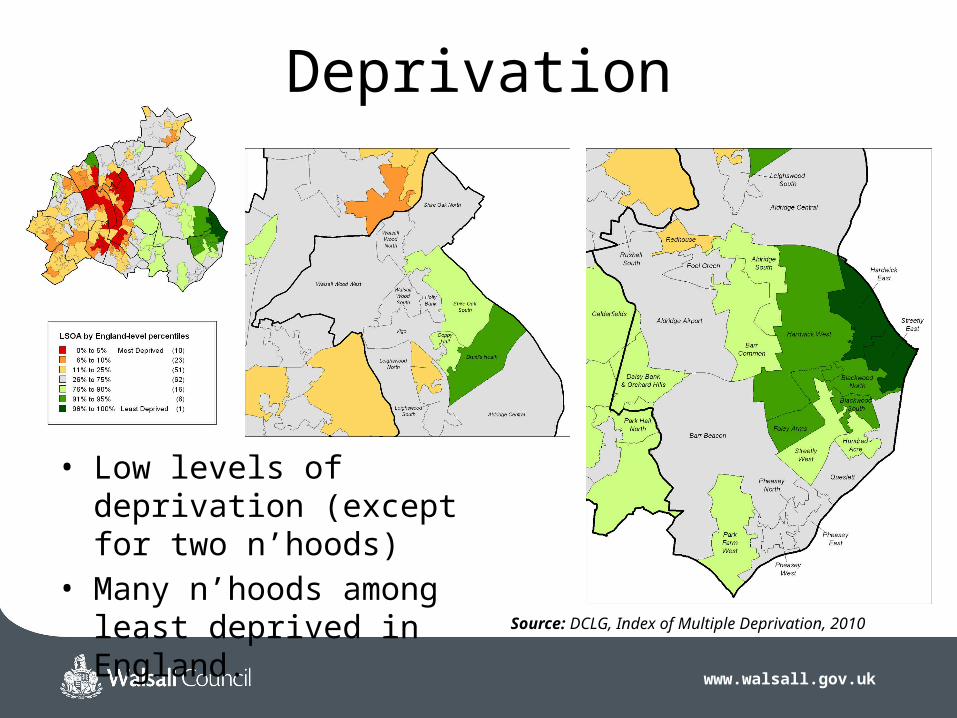
Deprivation
• Low levels of deprivation (except for two n’hoods)
• Many n’hoods among least deprived in England.
Source: DCLG, Index of Multiple Deprivation, 2010
www.walsall.gov.uk
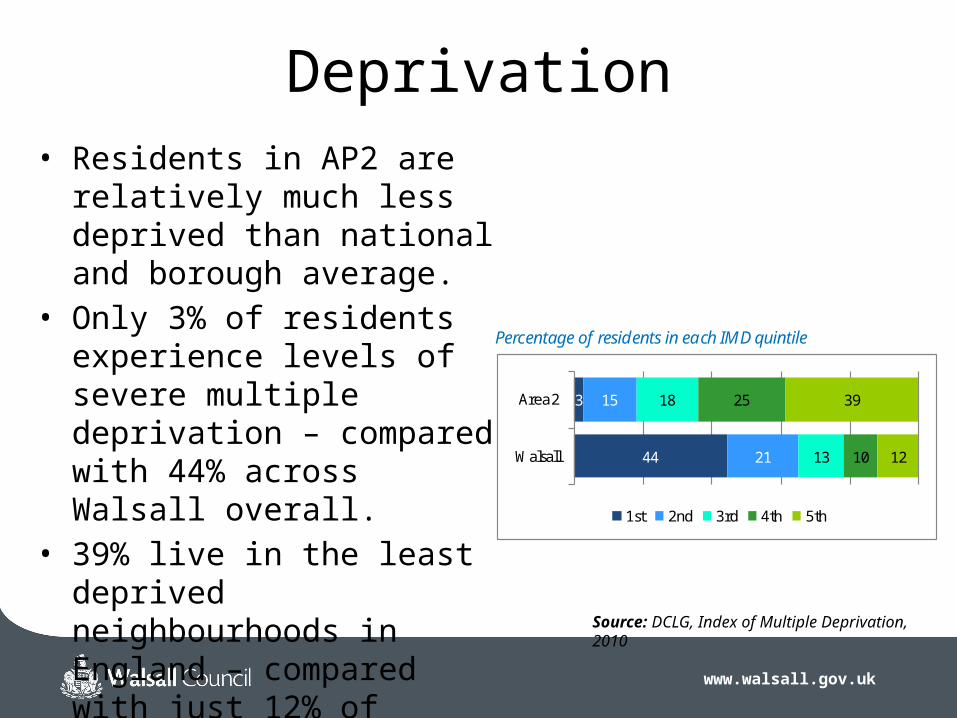
Deprivation• Residents in AP2 are relatively
much less deprived than national and borough average.
• Only 3% of residents experience levels of severe multiple deprivation – compared with 44% across Walsall overall.
• 39% live in the least deprived neighbourhoods in England – compared with just 12% of Walsall residents overall.
Source: DCLG, Index of Multiple Deprivation, 2010
44
3
21
15
13
18
10
25
12
39
Walsall
Area 2
1st 2nd 3rd 4th 5th
Percentage of residents in each IMD quintile

www.walsall.gov.uk
Social SegmentationA quarter of households (25.5%) are classified as group F – Senior Security: ‘Elderly people with assets who are enjoying a comfortable retirement’
Key Features• Elderly singles and
couples• Homeowners• Comfortable homes• Additional pensions above
state• Don’t like new technology• Low mileage drivers
Source: Experian, Mosaic Public Sector 2014

www.walsall.gov.uk
2 Economy and Employment
15

www.walsall.gov.uk
Key Issues• Higher number of workplaces than borough average density,
but below national average.• Construction and Profession, Scientific & Technical sectors
important locally.• Much higher level of economically active adults than Walsall
average, especially in full-time employment and self-employed.
• Much lower than borough and national average levels of out‐of work benefit dependency.‐
• Levels of adult basic skills (literacy, numeracy and ICT) and qualifications above borough average.

www.walsall.gov.uk
England 68
Walsall 46
Area 2 56
Businesses per 1,000 residents 0 80
83%
14%3%
Micro (0 to 9)
Small (10 to 49)
Medium (50 to 249)
Large (250+)
Businesses
1,735workplaces*
Source: ONS, BRES 2014
*A workplace is a ‘local unit’: an individual site (for example a factory or shop) associated with an enterprise.
• 98% of workplaces are private sector / 2% public sector.
• The Area has a higher density of businesses per resident than the borough average, but remains below national levels.

www.walsall.gov.uk
14.4
13.8
10.4
8.4
7.8
6.6
5.8
5.2
5.2
4.9
4.6
4.0
3.2
Cons
truc
tion
Prof
essi
onal
, sci
entifi
c &
tec
hnic
al
Reta
il
Man
ufac
turi
ng
Busi
ness
adm
in &
sup
port
srv
s
Art
s, e
nter
tain
men
t, re
crea
tion
Who
lesa
le
Hea
lth
Acc
omm
odati
on &
food
srv
s
Info
rmati
on &
com
mun
icati
on
Tran
spor
t & s
tora
ge
Mot
or tr
ades
Prop
erty
Industrial Sectors
Source: ONS, BRES 2014
Above average for:• Construction
(Walsall 11.8%)• Professional, scientific &
technical(Walsall 9.6%)
Strategically important companies include:• Bullock Construction
(Construction)• Azzuri Communications
(Communications)• RMD Kwikform
(Construction)
www.walsall.gov.uk
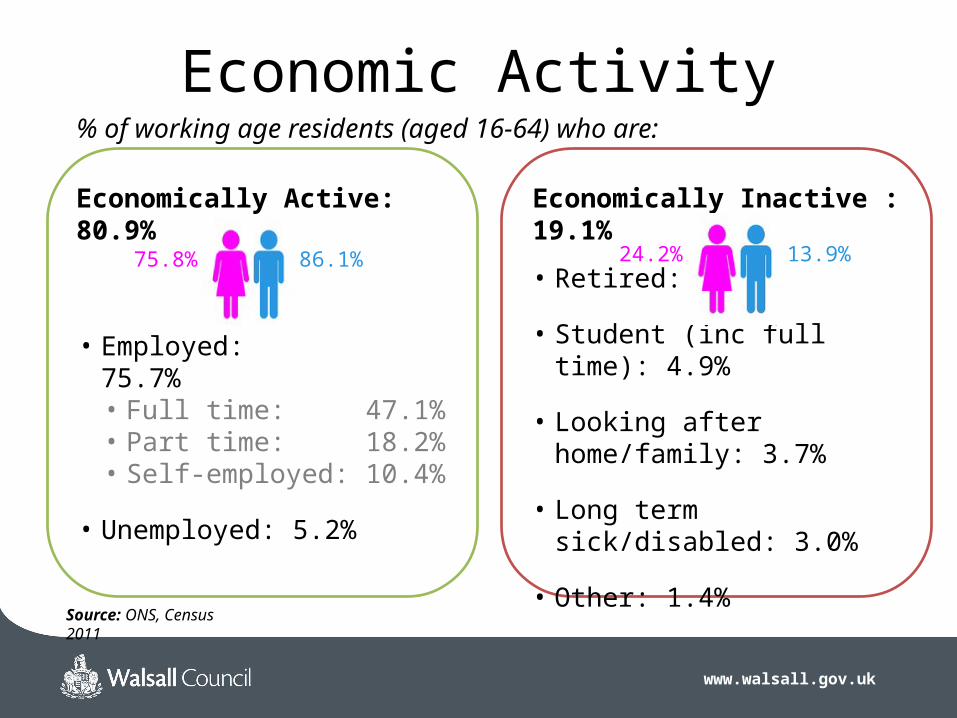
• Retired: 6.0%
• Student (inc full time): 4.9%
• Looking after home/family: 3.7%
• Long term sick/disabled: 3.0%
• Other: 1.4%
• Employed:75.7%
• Full time:47.1%
• Part time:18.2%
• Self-employed: 10.4%
• Unemployed: 5.2%
Economic Activity
Economically Active: 80.9% Economically Inactive : 19.1%
86.1%75.8% 13.9%24.2%
% of working age residents (aged 16-64) who are:
Source: ONS, Census 2011
www.walsall.gov.uk
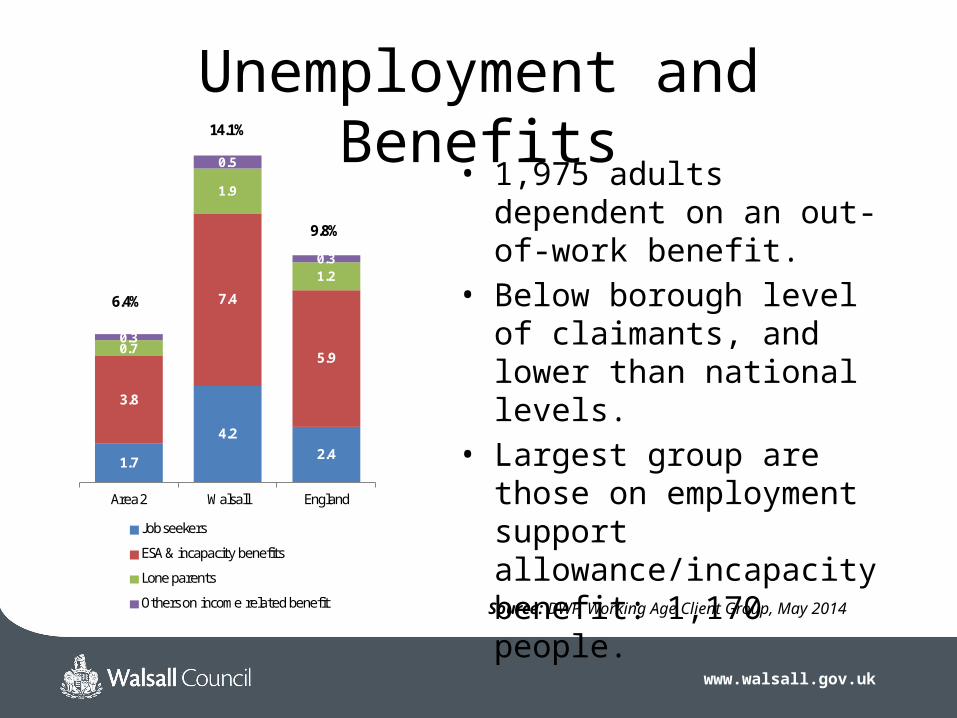
1.7
4.22.4
3.8
7.4
5.90.7
1.9
1.2
0.3
0.5
0.3
Area 2 Walsall England
Job seekers
ESA & incapacity benefits
Lone parents
Others on income related benefit
6.4%
14.1%
9.8%
Unemployment and Benefits
• 1,975 adults dependent on an out-of-work benefit.
• Below borough level of claimants, and lower than national levels.
• Largest group are those on employment support allowance/incapacity benefit: 1,170 people.
Source: DWP, Working Age Client Group, May 2014

www.walsall.gov.uk
0.0
2.0
4.0
6.0
8.0
Jan-08 Jan-09 Jan-10 Jan-11 Jan-12 Jan-13 Jan-14 Jan-15
JSA
Cla
iman
t Ra
te
Area 2 Walsall England
Jobseekers
• JSA claimant count Jan15: 402 claimants
• JSA claimant rate: 1.3% of 16-64 yr olds (Walsall 3.1%, England 1.9%)
• Young claimants (18-24): 2.6% (Walsall 5.4%, England 2.9%)
• Average (median) length of claims: 15.4 weeks (Walsall 22.5, England 19.5)
Source: ONS, Jobseeker’s Allowance Claimant Count, Jan 2008 – Jan 2015
www.walsall.gov.uk
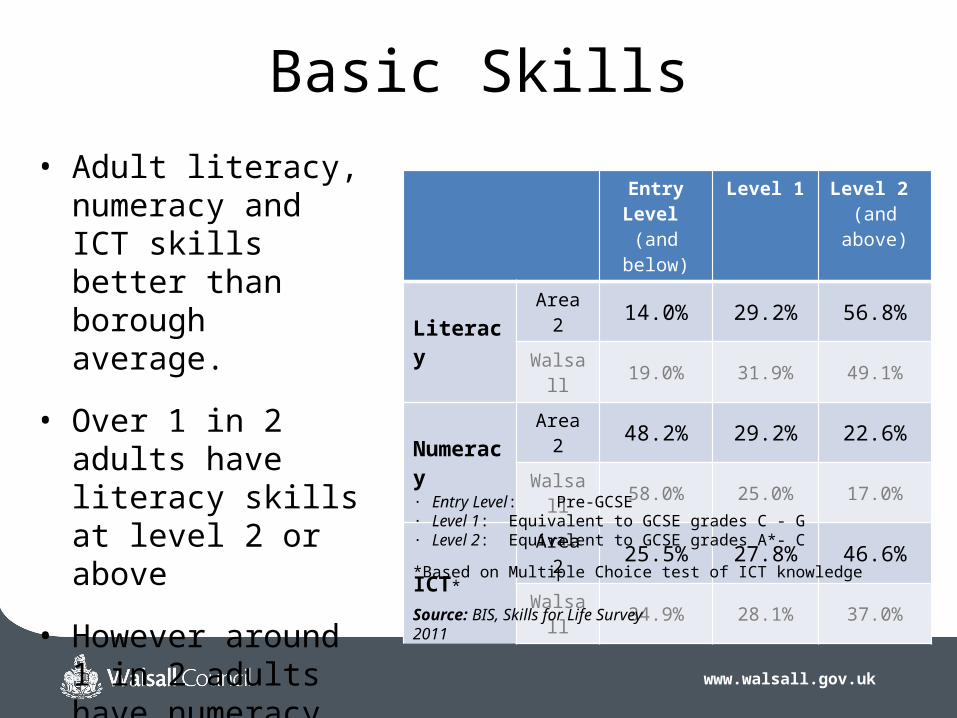
Basic Skills
Entry Level (and below)
Level 1 Level 2 (and above)
LiteracyArea 2 14.0% 29.2% 56.8%
Walsall 19.0% 31.9% 49.1%
NumeracyArea 2 48.2% 29.2% 22.6%
Walsall 58.0% 25.0% 17.0%
ICT*Area 2 25.5% 27.8% 46.6%
Walsall 34.9% 28.1% 37.0%
· Entry Level: Pre-GCSE· Level 1: Equivalent to GCSE grades C - G· Level 2: Equivalent to GCSE grades A*- C
*Based on Multiple Choice test of ICT knowledge
Source: BIS, Skills for Life Survey 2011
• Adult literacy, numeracy and ICT skills better than borough average.
• Over 1 in 2 adults have literacy skills at level 2 or above
• However around 1 in 2 adults have numeracy skills below GCSE grade G
www.walsall.gov.uk
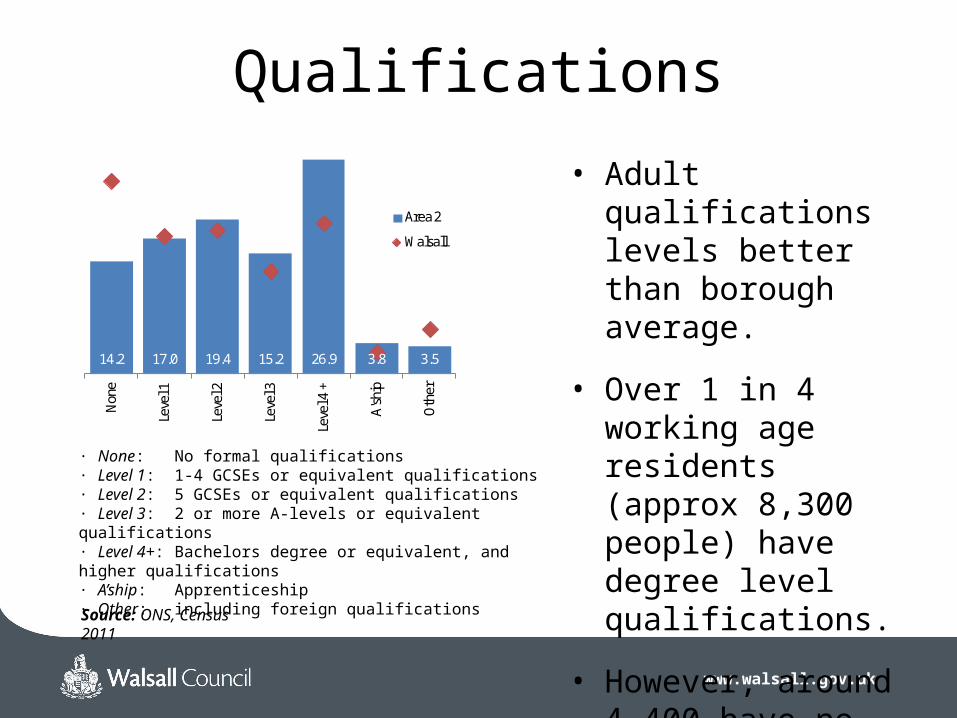
14.2 17.0 19.4 15.2 26.9 3.8 3.5
Non
e
Leve
l 1
Leve
l 2
Leve
l 3
Leve
l 4 +
A'sh
ip
Oth
er
Area 2
Walsall
Qualifications
· None: No formal qualifications· Level 1: 1-4 GCSEs or equivalent qualifications· Level 2: 5 GCSEs or equivalent qualifications· Level 3: 2 or more A-levels or equivalent qualifications· Level 4+: Bachelors degree or equivalent, and higher qualifications· A’ship: Apprenticeship· Other: including foreign qualifications
Source: ONS, Census 2011
• Adult qualifications levels better than borough average.
• Over 1 in 4 working age residents (approx 8,300 people) have degree level qualifications.
• However, around 4,400 have no formal qualifications.
www.walsall.gov.uk
3 Education and Young People
(Note: See Annex A for guidance on interpreting slides containing confidence intervals)
24

www.walsall.gov.uk
Key Issues• Very good educational attainment at all levels, with low levels of
persistent school absence• Child Health issues in the Area include:
• Perinatal mortality,• Childhood obesity (Year 6)
25

www.walsall.gov.uk
Perinatal / Infant Mortality
Source: Child Death Overview Panel, 2010-14
All areas within AP2 have lower rates of infant mortality from 2010 to 2014 in comparison to the Walsall average (7.6).
Pheasey has higher perinatal mortality rates (babies who are still born or die within 7 days of birth) than the Walsall average (4.16).

www.walsall.gov.uk
Low Birth Weight
All communities within Area 2 are below Walsall average with Aldridge, Aldridge North and Streetly areas being statistically significantly lower.
Source: Walsall Healthcare NHS Trust, Care Plus

www.walsall.gov.uk
Breastfeeding
All communities within Area 2 is above Walsall average except Walsall Wood. Aldridge and Aldridge North communities within Area 2 are statistically significantly higher than the Walsall average.
Source: Walsall Healthcare NHS Trust, Care Plus
www.walsall.gov.uk
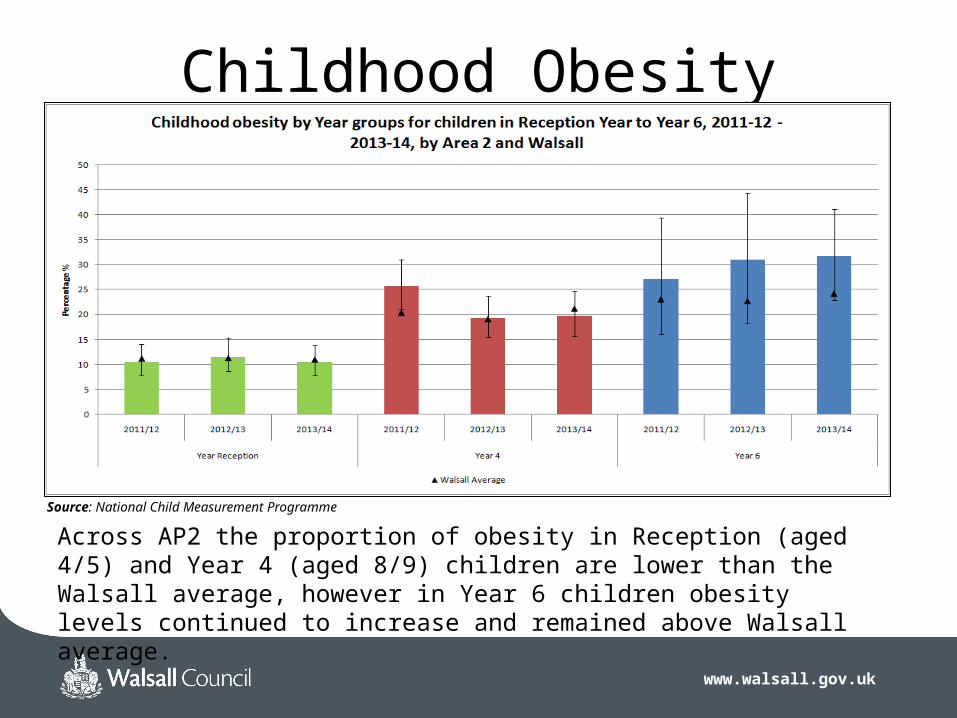
Childhood Obesity
Across AP2 the proportion of obesity in Reception (aged 4/5) and Year 4 (aged 8/9) children are lower than the Walsall average, however in Year 6 children obesity levels continued to increase and remained above Walsall average.
Source: National Child Measurement Programme

www.walsall.gov.uk
Births to Teenage Mothers 13-17 years
Most communities in area 2 did not have births to teenage mothers between 2010/11 and 2013/14 and those that did were lower than the Walsall average (1.5%).
Data source: Walsall Healthcare NHS Trust, Care Plus

www.walsall.gov.uk
Emergency Admissions Unintentional / Deliberate Injuries in Children 0 to 4 Years
Aldridge North and Pheasey community areas in the area 2 have higher emergency admissions than the Walsall average (32.3).
Source: Secondary Uses Service dataset and Public Health Outcome Framework
www.walsall.gov.uk
4 Health & Wellbeing
(Note: See Annex A for guidance on interpreting slides containing confidence intervals)
32

www.walsall.gov.uk
Key Issues• Adult Health issues in the Area include:
• Trauma related to falls and hip fractures aged 65 or over• Prevention and early detection of long term conditions (Cancer,
CHD and stroke)• Circulatory mortality• Smoking
33

www.walsall.gov.uk
Admissions to Hospital for Falls Aged 65 Years
Source: Secondary Uses Services (SUS) dataset 2011/12 – 2013/14 and Census 2011 population estimates for Walsall communities. Caveat: Community estimations were derived by using SUS patient postcode sector and allocating postcode sectors to each community area with greatest number of postcode sectors.
Aldridge and Pheasey areas have the highest rates of admissions to hospital for falls in people aged 65+ in Area 2 and Aldridge is statistically significantly higher than Walsall average (33.9 per 1,000).

www.walsall.gov.uk
Brow
nhill
s
Pels
all
Rush
all-S
helfi
eld
Aldr
idge
Cen
tral
& S
outh
Aldr
idge
Nor
th &
Wal
sall
Woo
d
Phea
sey
Park
Far
m
Stre
etly
Birc
hills
Lea
mor
e
Blak
enal
l
Blox
wic
h Ea
st
Blox
wic
h W
est
Padd
ock
Palfr
ey
Plec
k
St M
atthe
w's
Bent
ley
& D
arla
ston
Nor
th
Dar
last
on S
outh
Shor
t Hea
th
Will
enha
ll N
orth
Will
enha
ll So
uth
75.085.095.0
105.0115.0125.0135.0145.0
Rate of Clients with an identified Carer by Ward – 01/04/14 – 31/01/15
Area 1 Area 2 Area 3 Area 4 Area 5 Area 695
100
105
110
115
120
125
Rate of Clients with an identified Carer by Area Partnership – 01/04/14 – 31/01/15
Residents with identified Carers
The charts show the number of service users who have an identified, informal carer per 1,000 clients resident within the Ward or Area. There are differences between areas of the borough which identifies where a need to support carers exists.

www.walsall.gov.uk
Hip Fracture Hospital Admissions
Aldridge and Pheasey communities within AP2 have a higher rate of admissions due to hip trauma in people aged 65 and over than Walsall average (22.7 per 1,000).
Source: Secondary Uses Services (SUS) dataset 2011/12 – 2013/14 and Census 2011 population estimates for Walsall communities. Caveat: Community estimations were derived by using SUS patient postcode sector and allocating postcode sectors to each community area with greatest number of postcode sectors.

www.walsall.gov.uk
Dementia Prevalence
Source: Quality and Outcomes Framework 2013/14 and Public Health Outcome Framework Caveat: GP practice location used as estimate for corresponding community area prevalence rather than patient location only indication.
Most community areas within AP2 have higher estimated prevalence of dementia than Walsall (0.6%) and national average (0.62%), with the exception of Pheasey.
This indicator is based on Walsall GP aggregated data, there are several communities for which there will be no data. Neighbouring communities should be used as a guide to the level of uptake in those empty communities.

www.walsall.gov.uk
Diabetes Prevalence
Source: Quality and Outcomes Framework 2013/14 and Public Health Outcome Framework Caveat: GP practice location used as estimate for corresponding community and area partnership prevalence rather than patient location.
All communities within area 2 have statistically significantly lower estimated prevalence of diabetes than Walsall (8.7%) and national average (6.2%).
This indicator is based on Walsall GP aggregated data, there are several communities for which there will be no data. Neighbouring communities should be used as a guide to the level of uptake in those empty communities.
www.walsall.gov.uk
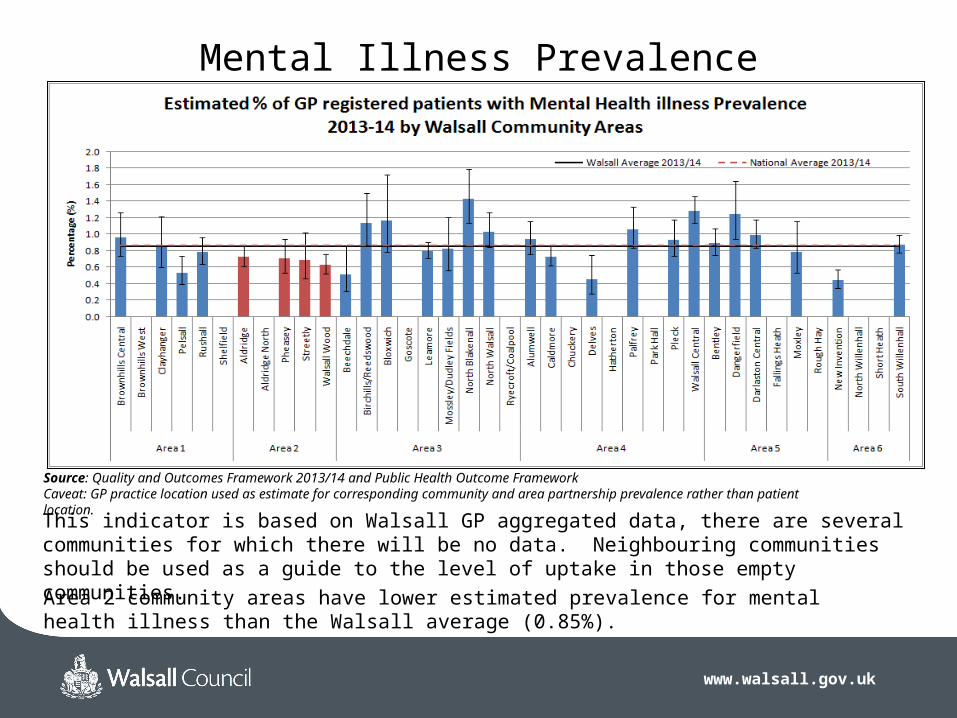
Mental Illness Prevalence
Source: Quality and Outcomes Framework 2013/14 and Public Health Outcome Framework Caveat: GP practice location used as estimate for corresponding community and area partnership prevalence rather than patient location.
Area 2 community areas have lower estimated prevalence for mental health illness than the Walsall average (0.85%).
This indicator is based on Walsall GP aggregated data, there are several communities for which there will be no data. Neighbouring communities should be used as a guide to the level of uptake in those empty communities.

www.walsall.gov.uk
Depression Prevalence
Source: Quality and Outcomes Framework 2013/14 and Public Health Outcome Framework Caveat: GP practice location used as estimate for corresponding community and area partnership prevalence rather than patient location.
Most area communities in Area 2 have lower estimated prevalence of Depression than the Walsall (7.0%) and national average (6.5%) except Pheasey.
This indicator is based on Walsall GP aggregated data, there are several communities for which there will be no data. Neighbouring communities should be used as a guide to the level of uptake in those empty communities.
www.walsall.gov.uk
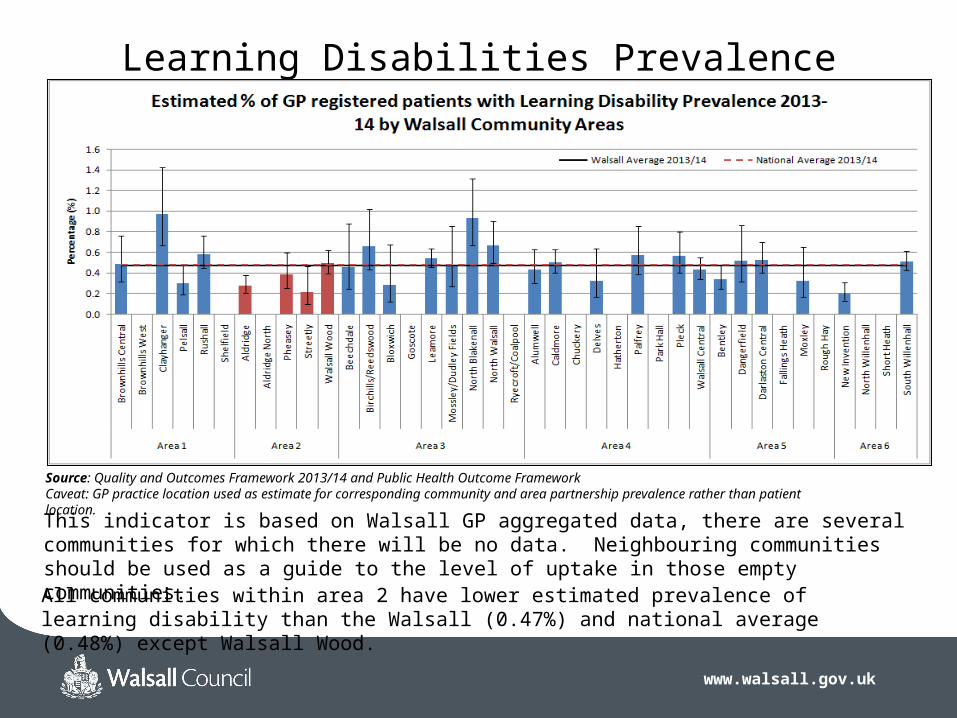
Learning Disabilities Prevalence
Source: Quality and Outcomes Framework 2013/14 and Public Health Outcome Framework Caveat: GP practice location used as estimate for corresponding community and area partnership prevalence rather than patient location.
All communities within area 2 have lower estimated prevalence of learning disability than the Walsall (0.47%) and national average (0.48%) except Walsall Wood.
This indicator is based on Walsall GP aggregated data, there are several communities for which there will be no data. Neighbouring communities should be used as a guide to the level of uptake in those empty communities.

www.walsall.gov.uk
Coronary Heart Disease Prevalence
Source: Quality and Outcomes Framework 2013/14 and Public Health Outcome Framework Caveat: GP practice location used as estimate for corresponding community and area partnership prevalence rather than patient location.
Aldridge community has a statistically significantly higher estimated prevalence of coronary heart disease than the Walsall (4.1%) and national average (3.3%).
This indicator is based on Walsall GP aggregated data, there are several communities for which there will be no data. Neighbouring communities should be used as a guide to the level of uptake in those empty communities.

www.walsall.gov.uk
Stroke Prevalence
Source: Quality and Outcomes Framework 2013/14 and Public Health Outcome Framework Caveat: GP practice location used as estimate for corresponding community and area partnership prevalence rather than patient location.
All communities within AP2 have higher estimated prevalence of Stroke than the Walsall (1.8%) and national average (1.7%) except Pheasey. Aldridge community is statistically significantly higher than the Walsall average.
This indicator is based on Walsall GP aggregated data, there are several communities for which there will be no data. Neighbouring communities should be used as a guide to the level of uptake in those empty communities.

www.walsall.gov.uk
% Health Check Uptake 40 to 74 Years
Source: Health IntelligenceCaveat: GP practice location used as estimate for corresponding community and area partnership prevalence rather than patient location.
Pheasey uptake is higher than the Walsall average while Streetly, at 100% is significantly higher. Aldridge and Walsall Wood are lower than average.
This indicator is based on Walsall GP aggregated data, there are several communities for which there will be no data. Neighbouring communities should be used as a guide to the level of uptake in those empty communities.

www.walsall.gov.uk
Alcohol Admissions Rate
Source: Secondary Uses Service (SUS) - NHS Midlands and Lancashire CSU
All communities in this area have lower alcohol admission rates than the Walsall average.

www.walsall.gov.uk
Cancer Mortality
46
Aldridge and Aldridge North communties within Area 2 have cancer mortality rate statistically significantly higher than Walsall average (7.5 per 1,000).
Source: Open Exeter, 2010-2012 (ICD10 Codes C00 –C99) and Office of national statistics census 2011 community areas estimatesCaveat: All age cancer mortality crude rates with 95% confidence intervals.

www.walsall.gov.uk
Circulatory Disease Mortality
47
Source: Open Exeter, 2010-2012 (ICD10 Codes J00 – J99) and Office of national statistics census 2011 community areas estimatesCaveat: All age cancer mortality crude rates with 95% confidence intervals.
Aldridge and Aldridge North communities within AP2 have a higher rate of circulatory mortality compared with Walsall average (8.8 per 1,000).
www.walsall.gov.uk
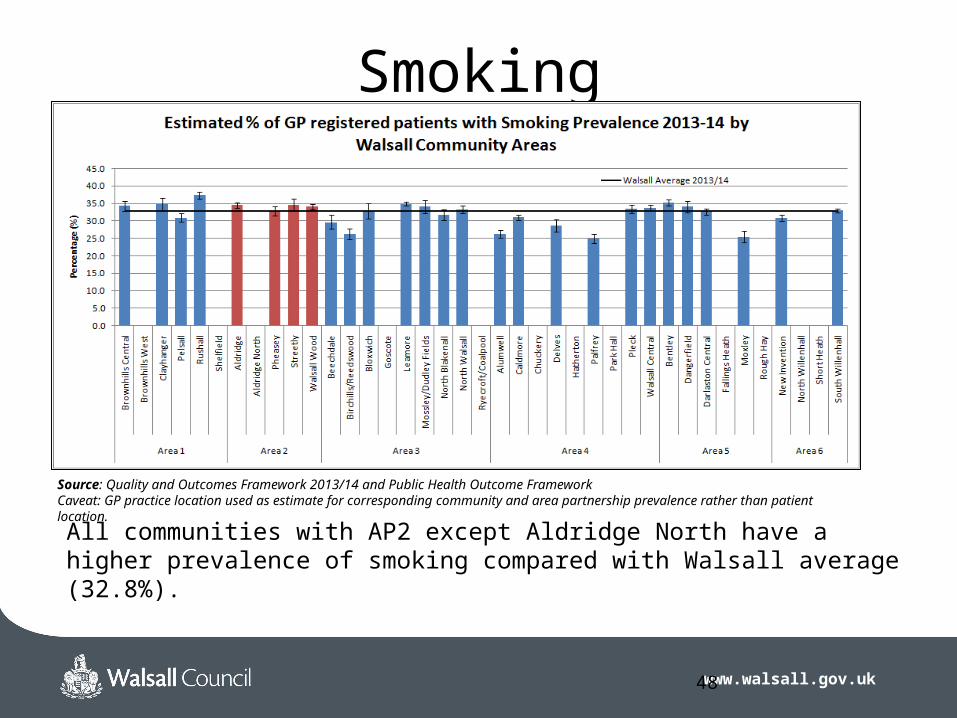
Smoking
48
All communities with AP2 except Aldridge North have a higher prevalence of smoking compared with Walsall average (32.8%).
Source: Quality and Outcomes Framework 2013/14 and Public Health Outcome Framework Caveat: GP practice location used as estimate for corresponding community and area partnership prevalence rather than patient location.

www.walsall.gov.uk
5 Crime & Community Safety
49

www.walsall.gov.uk
Key Issues• Relatively low level of crime in the Area as a whole (with
crime across the borough currently at an all time low) but ‐with theft from motor vehicles the most frequently recorded crime
50

www.walsall.gov.uk
GeographyThe Area Partnership is within the Aldridge and Brownhills Police Sector
It is covered by the following 4 Police Neighbourhoods (which are coextensive with ward boundaries)• Aldridge North and Walsall Wood• Aldridge Central and South• Pheasey Park Farm• Streetly
There are three areas in Walsall that have been identified as priority areas for crime and community safety issues, based on an analysis of key datasets. These areas have been identified by a range of local partnership services as they experience a relatively high number of repeat incidents that create multiple demands. Whilst short and medium term plans and activity take place, a longer term partnership wide approach is seen as necessary to resolve key issues in these areas.
1. Walsall Town Centre2. Bloxwich3. Birchills
www.walsall.gov.uk
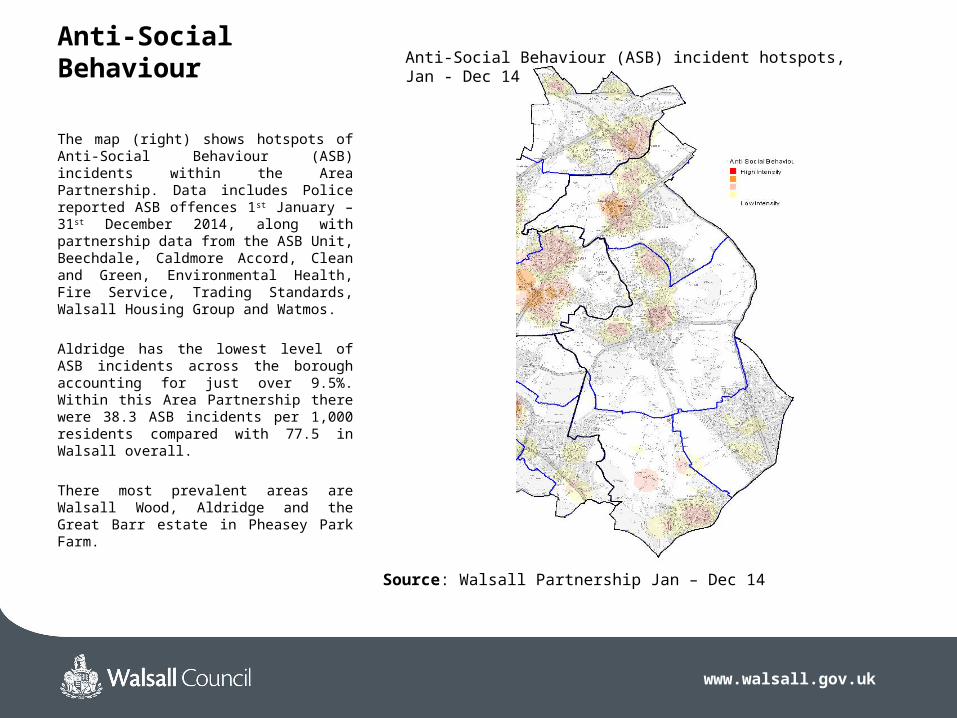
Anti-Social Behaviour
The map (right) shows hotspots of Anti-Social Behaviour (ASB) incidents within the Area Partnership. Data includes Police reported ASB offences 1st January – 31st December 2014, along with partnership data from the ASB Unit, Beechdale, Caldmore Accord, Clean and Green, Environmental Health, Fire Service, Trading Standards, Walsall Housing Group and Watmos.
Aldridge has the lowest level of ASB incidents across the borough accounting for just over 9.5%. Within this Area Partnership there were 38.3 ASB incidents per 1,000 residents compared with 77.5 in Walsall overall.
There most prevalent areas are Walsall Wood, Aldridge and the Great Barr estate in Pheasey Park Farm.
Anti-Social Behaviour (ASB) incident hotspots, Jan - Dec 14
Source: Walsall Partnership Jan – Dec 14

www.walsall.gov.uk
Crime Rates
Crime across the borough has seen a slight increase of 7.6% comparing Jan13 – Dec13 against the period of Jan14 - Dec14. This was an increase of 1,205 victims of crime.
Of the six AP’s, Aldridge and Beacon has the lowest overall Total Recorded Crime with 9.5% of all offenses in the borough committed here. There are over 31 less crimes committed per 1,000 residents than in Walsall overall (30.55 in Aldridge and Beacon compared to 62.06 in Walsall). The chart above shows that rates for all types of crime are below the Walsall average with violent crime and criminal damage showing significantly below the borough average.
Recorded crimes by type, per 1,000 residents (mid-2013) population, Jan 14 – Dec 14
Source: West Midlands Police, 2014
Violent Crime
Assault with injury
Domestic Burglary
BOB Robbery Vehicle Crime
Criminal Damage
0
2
4
6
8
10
12
14
16
18
Area 2 Walsall
Total Recorded Crime Anti Social Behaviour0
10
20
30
40
50
60
70
Area 2
Walsall
www.walsall.gov.uk
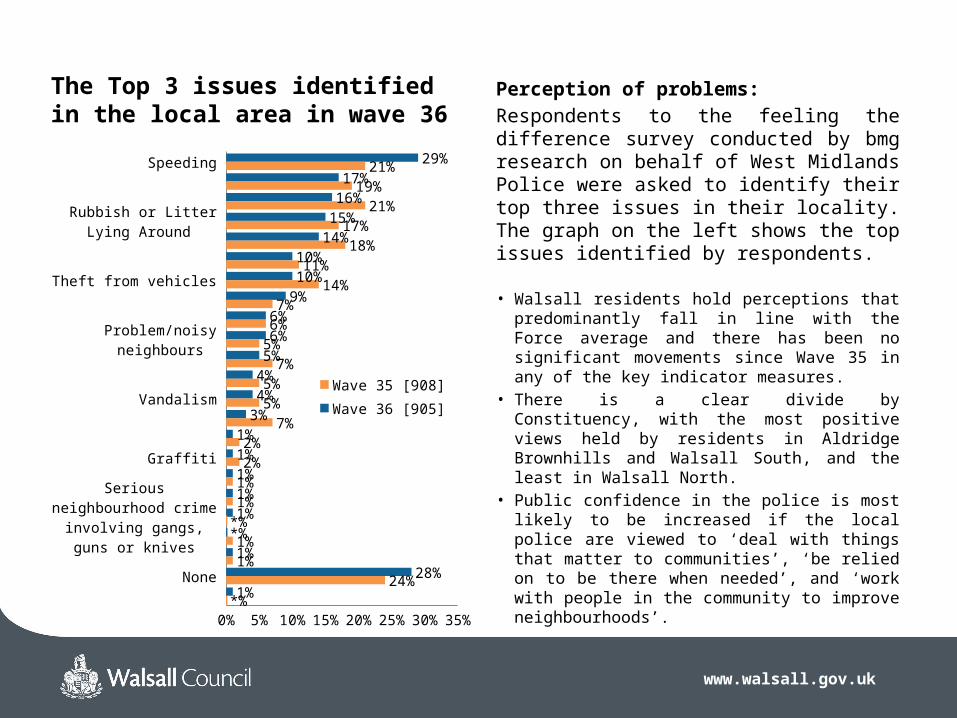
The Top 3 issues identified in the local area in wave 36 Perception of problems:
Respondents to the feeling the difference survey conducted by bmg research on behalf of West Midlands Police were asked to identify their top three issues in their locality. The graph on the left shows the top issues identified by respondents.
• Walsall residents hold perceptions that predominantly fall in line with the Force average and there has been no significant movements since Wave 35 in any of the key indicator measures.
• There is a clear divide by Constituency, with the most positive views held by residents in Aldridge Brownhills and Walsall South, and the least in Walsall North.
• Public confidence in the police is most likely to be increased if the local police are viewed to ‘deal with things that matter to communities’, ‘be relied on to be there when needed’, and ‘work with people in the community to improve neighbourhoods’.
Speeding
Teenagers hanging around
Burglaries
Theft from vehicles
Noise nuisance (barking dogs, loud music)
Theft of vehicles
Vandalism
Dangerous Dogs
Hate Crime
Serious neighbourhood crime involving gangs, guns or
knives
Other
Don't know0% 5% 10% 15% 20% 25% 30% 35%
29%17%
16%15%
14%10%10%
9%6%6%
5%4%4%
3%1%1%1%1%1%
*%1%
28%1%
21%19%
21%17%
18%11%
14%7%
6%5%
7%5%5%
7%2%2%
1%1%
*%1%1%
24%*%
Wave 35 [908]Wave 36 [905]

www.walsall.gov.uk
Annex A: Guidance notes, useful links & acknowledgements

www.walsall.gov.uk56
Understanding Confidence Intervals (CI)
Below is an explanation of charts that include 95% confidence intervals (CI) to help you understand how to interpret their meanings.
The example chart shows Respiratory mortality per 1,000 population. The results relating to the AP for which this profile relates are coloured red.
The dotted line running through the chart shows the average rate of respiratory mortality across the whole of Walsall.
The Confidence Interval symbol I represents how sure we are in the actual result within a +/- margin of error at 95% CI .1. Statistically significantly higher:If the overall CI -/+ range lies entirely above comparison average line then the result is seen as statistically significantly higher than the borough average. Example #1 North Walsall.2. Statistically significantly lower If it lies entirely below the comparison average line then the result is seen as statistically significantly lower than the borough average. Example # 2 Chuckery.3. Within normal rangeIf the CI -/+ range crosses the average line at any point then the result is not seen as statistically significant but the actual result maybe still be higher or lower than the average. Example # 3 Moxley.NB in this example a lower rate is better, in some charts a higher rate is better.
1
23

www.walsall.gov.uk
• Walsall Intelligence: Data and intelligence portal for Walsall Partnership, including links to profiles, needs assessments and additional resources www.walsallintelligence.org.uk
• 2011 Census: Information related to the release of the latest census results, including analysis and reports for Walsall and links to official ONS websites www.walsall.gov.uk/census
• Neighbourhood Statistics: Office for National Statistics website providing a wealth of small area data on people, health, work, ‐education, housing, crime and the environment. www.neighbourhood.statistics.gov.uk
• Nomis: detailed and up to date UK labour market and economic ‐ ‐statistics from official sources www.nomisweb.co.uk
Useful Links

www.walsall.gov.uk
Mapping used in this profile is reproduced from the Ordnance Survey mapping with the permission of Her Majesty’s Stationery Office. ©Crown Copyright. Unauthorised reproduction infringes Crown Copyright and may lead to prosecution or civil proceedings.Crown copyright and database rights (2015) Ordnance Survey 100019529
A Z Mapping is reproduced by permission of Geographers' A Z Map Co. Ltd. © Crown Copyright 2015. All rights reserved.‐ ‐Walsall Council licence number 100017302
Produced by : Walsall Intelligence Network (WIN) – Analytical / Performance GroupContact: [email protected] or call 01922 652509March 2015
ACKNOWLEDGEMENTSThese profiles have been compiled by core analysts from across the WALSALL INTELLIGENCE NETWORK (WIN):Liz Connolly (Strategic Regeneration, Walsall Council), Martin Ewin (Public Health – Walsall Council), Karen Marcroft (Children’s Quality Assurance and Performance – Walsall Council) Kevin Slater (Social Care Performance – Walsall Council), Richard Rawlinson (Business & Partnership Intelligence, Walsall Council),Contents are informed by input from analysts and service information specialists across WIN, including:Sarbjit Uppal, Ben Watkins, Angela Woodley