www.usask.ca dietary intake and overweight in children aged 10-14 years in saskatoon canada public...
TRANSCRIPT
www.usask.ca
Dietary Intake and Overweight in children aged 10-14 years in Saskatoon
Canada Public Health Association, Annual ConferenceToronto May 26-29, 2014
Ha Le, PhD candidateCommunity Health and Epidemiology

www.usask.ca
Overview
• Background• Purpose• Methods• Results• Conclusions

www.usask.ca
Background
The global burden of obesity among children and aldolescents is estimated to be 1 in 10 (Lobstein T et al, 2014)
Dramatic temporal increases in the prevalence of overweight and obesity in Canadian children (31.5% for children 5-17 years old, CCHS 2009-2011)
Dietary intake is a corner stone of weight management across the life cycle and play important role in influencing the likelihood of being overweight during childhood and adolescence.

www.usask.ca
The purpose of this study is to examine dietary intake and the association between overweight and nutrition-related factors among children aged 10-14 years old in Saskatoon who participated in the ‘Smart Cities and Healthy Kids – Food environment Study’
Purpose
www.usask.ca
Methods (1)
1408 children, ages of 10 -14 years, from all residential neighbourhoods in Saskatoon (n=61) were surveyed at school in March/April 2012.
Survey instrument included• questions on socio-demographic characteristics• the Harvard Youth and Adolescent Food Frequency
Questionnaire (YAQ) for dietary assessment (147 items)
www.usask.ca
Methods (2)
We assessed students’ dietary intake and compared this with the Canadian food group and nutrient recommendations.
Children’s height and weight were measured and BMI calculated using the age and sex specific BMI calculator from the WHO (2007), AnthroPlus version 3.1.
Using WHO reference (2007), we classified children as normal weight (+/-1SD), overweight or obese (greater than +1SD) and obese (greater than +2SD).
www.usask.ca
Methods (3)
Data was evaluated using SPSS version 18 Logistic regression was performed using 3 models to
determine the associations between overweight and frequency of consumption for the four food groups
• Model 1 included overweight and frequency of consumption of a food group controlling for socio-demographic variables
• Model 2 was the same as Model 1 but included additional simulteneous adjustments for the frequency of comsumption of all other 3 food groups
• Model 3 included all significant variables at p-value<0.05

www.usask.ca
Results
www.usask.ca
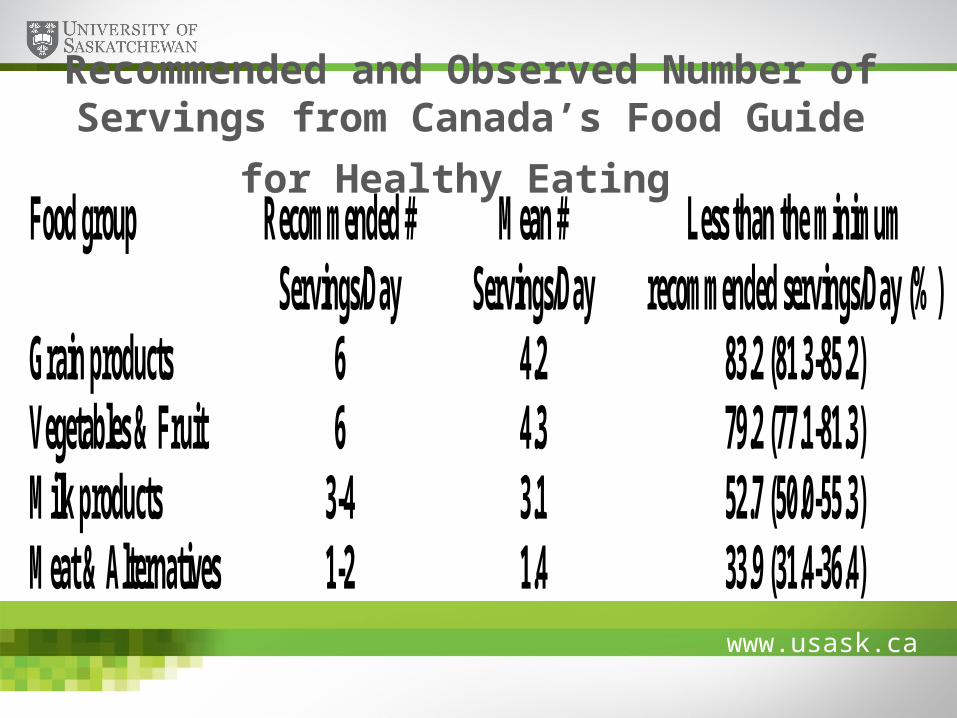
Food group Recommended # Servings/Day
Mean # Servings/Day
Less than the minimum recommended servings/Day (%)
Grain products 6 4.2 83.2 (81.3-85.2) Vegetables & Fruit 6 4.3 79.2 (77.1-81.3) Milk products 3-4 3.1 52.7 (50.0-55.3) Meat & Alternatives 1-2 1.4 33.9 (31.4-36.4)
Recommended and Observed Number of Servings
from Canada’s Food Guide for Healthy Eating
www.usask.ca
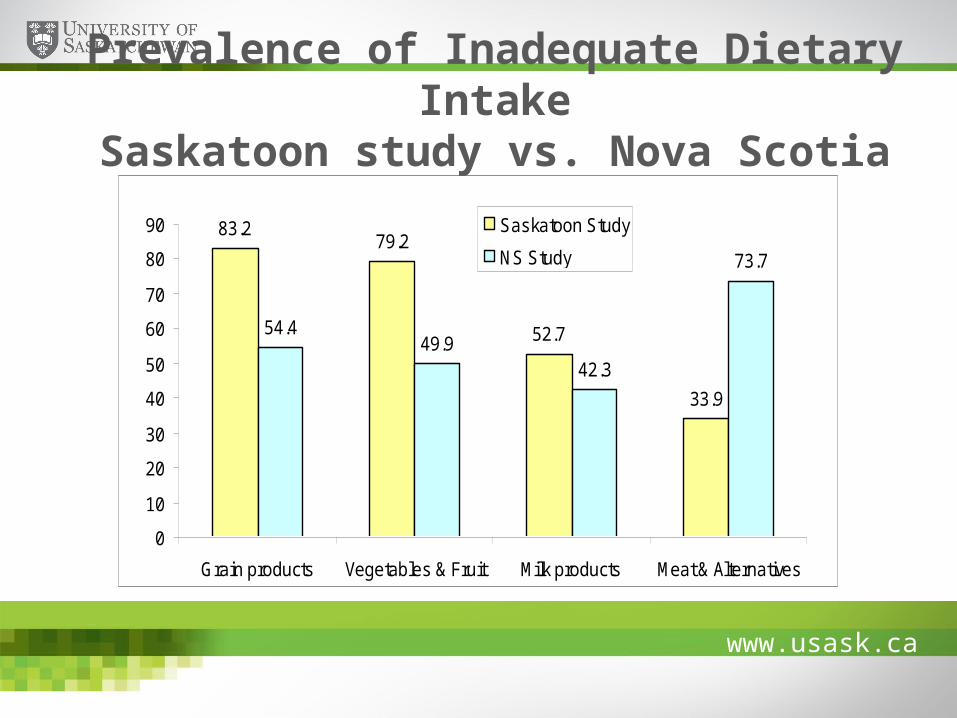
Prevalence of Inadequate Dietary IntakeSaskatoon study vs. Nova Scotia study
83.279.2
52.7
33.9
54.449.9
42.3
73.7
0
10
20
30
40
50
60
70
80
90
Grain products Vegetables & Fruit Milk products Meat & Alternatives
Saskatoon Study
NS Study

www.usask.ca
Macronutrient intake DRI Category Reference Value Mean (SD) % of Inadequacy Carbohydrate (%) AMDR 45-65 56.6 (6.2) 10.2 (2.3 + 7.9) Protein (%) AMDR 10-30 16.5 (3.2) 1.6 (1.6+0) Fat (%) AMDR 25-35 28.0 (5.0) 29.9 (24.4+5.5) Fibre (g) AI
Males 31 15.6 (8.9) Females 26 14.8 (7.6)
DRI: Dietary Reference Intakes. AMDR: Acceptable Macronutrient Distribution Range. AI: Adequate Intake
Macronutrient intake

www.usask.ca
Vitamins and Minerals DRI Category Reference Value
Mean (SD) % of Inadequacy
Vitamin A (RAE) EAR Males 445 910.0 (530.2) 18.7
Females 420 858.4 (469.3) 16.5 Vitamin D (IU) EAR 400 238.5 (161.4) 83.7 Vitamin C (mg) EAR 39 118.2 (85.1) 12.6 Folate (DFE) EAR 250 325.4 (167.7) 36.1 Calcium (mg) EAR 1100 1063.9 (574.3) 56.0 Iron (mg) EAR
Males 5.9 12.3 (6.7) 10.3 Female 5.7 11.2 (5.3) 10.8
Zinc (mg) EAR 7.0 9.3 (4.6) 32.3 Sodium (mg) UL 2200 2218.3 (1114.0) EAR: Estimated Average Requirement. AI: Adequate Intake. UL: Upper Limit
Vitamins and Minerals
www.usask.ca
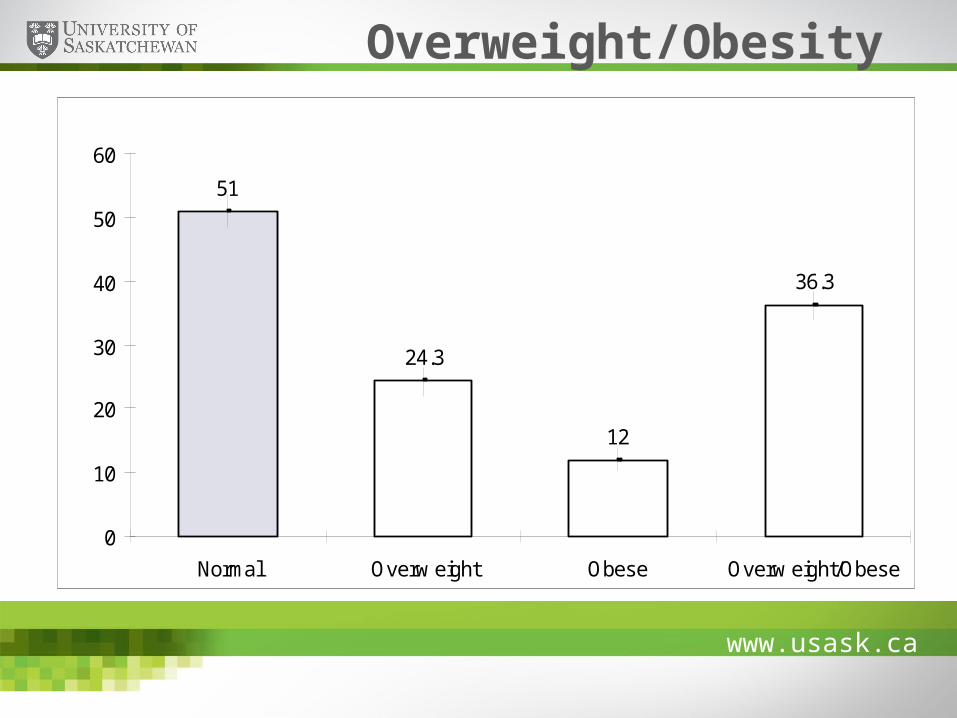
51
24.3
12
36.3
0
10
20
30
40
50
60
Normal Overw eight Obese Overw eight/Obese
Overweight/Obesity
www.usask.ca
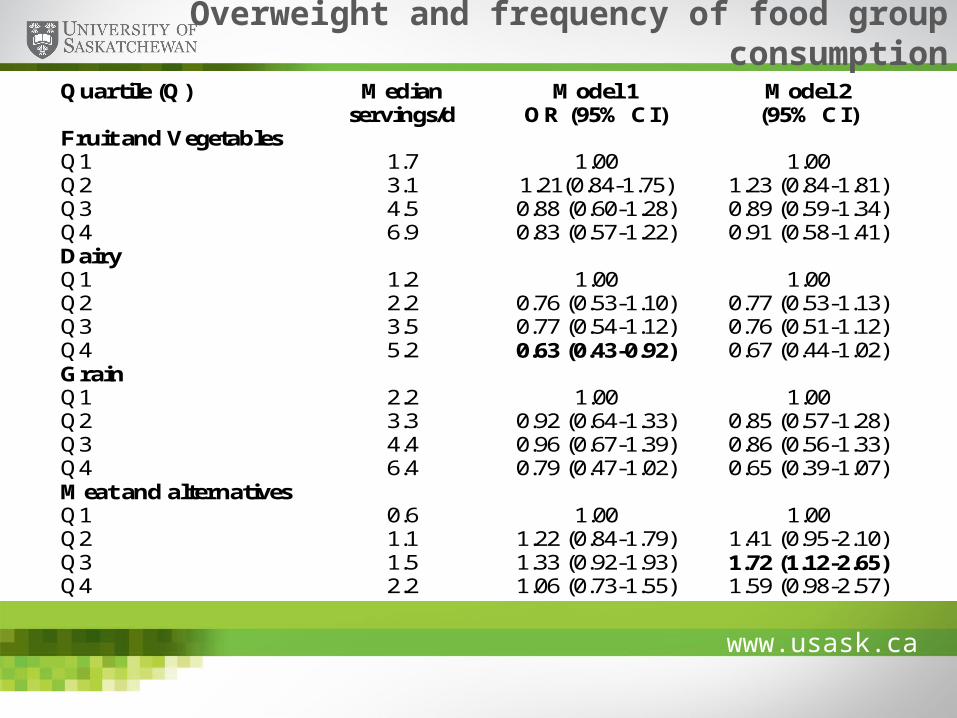
Overweight and frequency of food group consumption
Quartile (Q) Median servings/d
Model 1 OR (95% CI)
Model 2 (95% CI)
Fruit and Vegetables Q1 1.7 1.00 1.00 Q2 3.1 1.21(0.84-1.75) 1.23 (0.84-1.81) Q3 4.5 0.88 (0.60-1.28) 0.89 (0.59-1.34) Q4 6.9 0.83 (0.57-1.22) 0.91 (0.58-1.41) Dairy Q1 1.2 1.00 1.00 Q2 2.2 0.76 (0.53-1.10) 0.77 (0.53-1.13) Q3 3.5 0.77 (0.54-1.12) 0.76 (0.51-1.12) Q4 5.2 0.63 (0.43-0.92) 0.67 (0.44-1.02) Grain Q1 2.2 1.00 1.00 Q2 3.3 0.92 (0.64-1.33) 0.85 (0.57-1.28) Q3 4.4 0.96 (0.67-1.39) 0.86 (0.56-1.33) Q4 6.4 0.79 (0.47-1.02) 0.65 (0.39-1.07) Meat and alternatives Q1 0.6 1.00 1.00 Q2 1.1 1.22 (0.84-1.79) 1.41 (0.95-2.10) Q3 1.5 1.33 (0.92-1.93) 1.72 (1.12-2.65) Q4 2.2 1.06 (0.73-1.55) 1.59 (0.98-2.57)
www.usask.ca
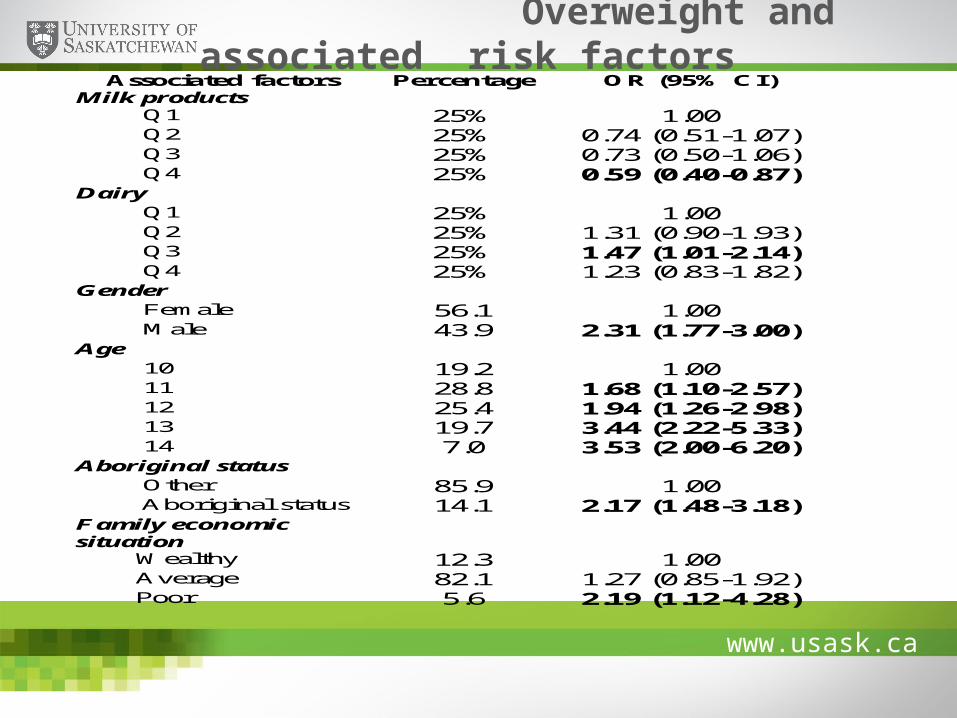
Overweight and associated risk factors Associated factors Percentage OR (95% CI)
Milk products Q1 25% 1.00 Q2 25% 0.74 (0.51-1.07) Q3 25% 0.73 (0.50-1.06) Q4 25% 0.59 (0.40-0.87) Dairy Q1 25% 1.00 Q2 25% 1.31 (0.90-1.93) Q3 25% 1.47 (1.01-2.14) Q4 25% 1.23 (0.83-1.82) Gender Female 56.1 1.00 Male 43.9 2.31 (1.77-3.00) Age 10 19.2 1.00 11 28.8 1.68 (1.10-2.57) 12 25.4 1.94 (1.26-2.98) 13 19.7 3.44 (2.22-5.33) 14 7.0 3.53 (2.00-6.20) Aboriginal status Other 85.9 1.00
Aboriginal status 14.1 2.17 (1.48-3.18) Family economic situation
Wealthy 12.3 1.00 Average 82.1 1.27 (0.85-1.92) Poor 5.6 2.19 (1.12-4.28)

www.usask.ca
Conclusions
Dietary intake among adolescent children in Saskatoon is relatively poor.
The proportion of children who are overweight/obese in Saskatoon (36.3%) is higher than that of Canadian children (31.5%).
Significant differences observed in prevalence of overweight across gender, age, aboriginal status and SES.
A protective association for consumption of dairy and a neagative association for consumption of meats and alternatives was observed among children living in Saskatoon
The development of evidence-based policies and prevention initiatives targeting children and their families may improve dietary quality and prevent obesity.

www.usask.ca
Reference
Lobstein T, Baur L, Uauy R: Obesity in children and young people: A crisis in public health. Obes Rev 2004, 5(Suppl 1):4-104
Matthews, V. L., Wien, M., & Sabaté, J. (2011). The risk of child and adolescent overweight is related to types of food consumed. Nutr J, 10(1), 71-74.
Veugelers, P. J., Fitzgerald, A. L., & Johnston, E. (2005). Dietary intake and risk factors for poor diet quality among children in
Nova Scotia. Canadian Journal of Public Health, 96(3).

www.usask.ca
Acknowledgement
Dr. Nazeem Muhajarine Dr. Rachel Engler-Stringer Tracy Ridalls and SCHK research team

www.usask.ca
Thank you