- volume 1; issue 3 manuscript - 3 (an evaluation of remuneration scheme in relation to staff...
TRANSCRIPT

Volume 1; Issue 3
Paper- 3
“An Evaluation of Remuneration Scheme In Relation To Staff
Turnover in Kenyan Private Universities: Case Study Of The
Kenya Methodist University”
www.ijmst.com May, 2013
International Journal for Management Science
And Technology (IJMST)
ISSN: 2320-8848 (Online)
ISSN: 2321-0362 (Print)
Dr. Kimani Chege
Lecturer- Jomo Kenyatta
University of Agriculture
and Technology
Dr.Musiega Dougluas
Director- Jomo Kenyatta
University of Agriculture and
Technology
Kakamega Campus
Gerishom Wafula
Manase
MBA Student/ Mount
Kenya University-
Kakamega Campus
MD/CEO Rural Urban
Management (RUM) Ltd
Morris Kirimi Mutuma
MSC- Human Resource
Management
Jomo Kenyatta University
of Agriculture and
Technology

International Journal for Management Science and Technology (IJMST) Vol. 1; Issue 3
ISSN: 2320-8848(O.)/2321-0362(P.) Page 2 May, 2013
Abstract The study evaluated employee perception on remuneration scheme on staff turnover in
Kenyan Private Universities with the Kenya Methodist University as the case study. The
objective of the study was to evaluate remuneration scheme in relation to staff turnover in
Kenyan Private Universities and to ultimately come up with appropriate recommendations
that would facilitate the reduction of staff turnover in private universities. It is hoped
university administration, government and other human resource policy makers and
employees will greatly benefit from the findings. The descriptive research design was used to
obtain data from the targeted and accessible population which comprised of teaching and
non-teaching staff at the Nairobi and Nakuru Methodist University campuses. 136
respondents were selected purposively. Self-developed questionnaires were administered
personally to respondents to gather the information. The data collected was analyzed using
tables, frequency distributions and percentages. The statistical package for social sciences
(SPSS) was used to assist in the analysis process. Remuneration is key in retaining workers in
any organization and it must be the purpose of any human resource management to design a
competitive remuneration package which will serve to attract, retain, and motivate staff so as
to ensure the ultimate organization’s commercial and financial viability.
Key Words: Employee Turnover;Morale; Remuneration
1.0 Introduction 1.1Background
Organizations invest a lot on their employees in terms of induction and training, developing,
maintaining and retraining them in their organization. Therefore, managers at all costs must
minimize employee’s turnover. Although, there is no standard framework for understanding
the employees turnover process as a whole, a wide range of factors have been found useful in
interpreting employee turnover (Kevin et al 2004). Therefore there is need to develop a fuller
understanding of their employee turnover, more especially, the sources-what determines
employee turnover, effects and strategies that managers can put in place to minimize
turnover.
With globalization which is heightening competition, organizations must continue to develop
tangible products and provide services which are based on strategies created by employee.
These employees are extremely crucial to the organization since their value to the
organization is essentially intangible and not easily replicated (Meagher et al, 2003).
Therefore, managers must recognize that employees are major contributors to the efficient
achievement of the organization’s success. Abbasi et al (2000). Managers therefore should
control employee turnover for the benefit of the organization success.
Employee turnover is a much studied phenomenon, Shaw et al (1998). But there is no
standard reason why people leave organizations, Employee turnover is the rotation of
workers around the labour market, between firms, jobs and occupations, and between the
states of employment and unemployment, Abbasi et al (2000). The term “turnover” is defined
by Price (1977) as the ratio of the number of organizational members who have left during
the period being considered divided by average number of people in that organization during
the period . Frequently managers refer turnover as entire process associated with filling
vacancy; each time apposition is vacated, either voluntary or involuntary anew employee
used to be hired or trained. This replacement cycle is known as turnover. (Woods,1995).
Although a moderate level staff of turnover is good for business, every organization needs to
have a strategy in place to retain the high performers that give it a competition edge. The

International Journal for Management Science and Technology (IJMST) Vol. 1; Issue 3
ISSN: 2320-8848(O.)/2321-0362(P.) Page 3 May, 2013
cost of not doing so can be severe, as high employee turnover can be very costly. It lowers
internal morale and it could harm an organizations external reputation and costs it business.
Turnover costs for many organizations are very high and can significantly affect the financial
performance of an organization. Direct costs include recruitment, selection and training of
new people. Much time and expense go into this process. Indirect costs include increased
workloads and overtime expenses for coworkers as well as reduced productivity associated
with low employee morale. There are many potential causes for turnover. Area economic
conditions and labour market conditions affect general turnover rates and can be very
difficult to manager. However, certain causes associated with turnover in any specific job or
organization can be managed. These causes include non-competitive compensation, high
stress, poor working conditions, monotony, poor supervision, poor fit between the employee
and the job, inadequate training, poor communications, and organization practices
A certain degree of turnover maybe desirable, expected and accepted since it creates
opportunities to induce wider experience, new ideas to the organization and reduce
inbreeding as well as providing career development opportunities/ paths for existing workers.
However, persistently high levels of labour turnover are costly to both individual
organizations and to the economy of a country as a whole as it adversely affects efficiency,
productivity and morale. High labour turnover has impacts on organizations in relation to
organizational costs, morale, training and customer services.
The analysis of labor turnover is a vital role of the Human Resource Development as the data
may be used to forecast future recruitment and training requirements and also assist an
organizations retention strategy. By measuring labour turnover on a regular basis (Usually
annually) organizations can immediately recognize a change in levels and implement
strategies for dealing with this. Once employees leave an organization, there is need to
replace them with new recruits. Hall (2006) identifies the main reasons that make workers
leave an organization as: resignations (both voluntary and due to incapacity pregnancy and
ill-health, dismissal (including redundancy), retirement, inadequate wage levels leading to
employees moving to competitors, poor morale and low levels of motivation within the
workforce, recruiting and selecting the wrong employees in the first place, meaning they
leave to seek more suitable employment, a buoyant local labour market offering more (and
per harps more attractive) opportunities to employees.
Hall (2006) further noted that voluntary resignations which are not foreseen by management
can have particular cultural disruptive effects. He also adds that management has varying
degrees of control over other reasons for leaving, for example an unusually high proportion
of dismissals, calls for an examination of selection, disciplinary and planning procedures.
Torrington (2005) also noted that turnover always rises when the economy is strong and jobs
are plentiful because there are more opportunities available for people to charge employers.
In Kenya, the era of industrialization and liberalization of the economy resulted in the
emergence of many institutions of higher learning. Today, Kenya is home to 7 Public
Universities, 24 Public University Colleges, 1 chartered private Universities, 4 Private
University constituent colleges, 11 Universities with letters of interim authority, 2 registered
private universities (CHE, 2012). This state of affairs has led to authority competition for
students as well as employees. As a result of this competition, staffs keep on moving from
one employer to the other. Many organizations have now resolved to the poaching technique

International Journal for Management Science and Technology (IJMST) Vol. 1; Issue 3
ISSN: 2320-8848(O.)/2321-0362(P.) Page 4 May, 2013
as a way of recruiting their staff. Staff turnover is indeed a tricky phenomenon that demands
attention.
1.2 Statement of the problem
Employee turnover is expensive from the view of the organization. Voluntary quits which
represents an exodus of human capital investment from organizations, Fair (1992) and the
subsequent replacement process entails manifold costs to the organizations. These
replacement costs include search of the external labour market for a possible substitute,
selection between competing substitutes, induction of the chosen substitute, and formal and
informal training of the substitute until he or she attains performance levels equivalent to the
individual who quit John (2000). Output would be affected to some extend or maintained at
the cost of overtime payment. Turnover has some significant effects on organizations
(Darricco and Giridharan, 1987; Dyke and Strick, 1990; Contrell and Sararakh,1991; Denvir
and Mcmahon, 1992). Many researchers argue that high turnover rates might have negative
effects on the profitability of organizations if not managed properly (Barrows, 1990; Hogan,
1992; Wasmuth and Davis, 1993). Hogan (1992) opines that nearly twenty years ago, the
direct and indirect cost of a single hire employee quitting was between $ 1400 and $ 4000.
Turnover has many hidden or invisible costs. Phillips (1990) and these invisible costs are as a
result of incoming employees, co-workers closely associated with departing employees and
position being filled while vacant. And all these affect the profitability of the organization.
On the other hand turnover affects customer’s services and satisfaction (Kamal et al, 2002).
Catherine (2002) argues that turnover include other costs, such as lost productivity, lost sales,
and managements time. She estimates that the turnover costs of an hourly employee to be $
3,000 to 10,000 each. This clearly demonstrates that turnover affects the profitability of the
organization and if it is not managed properly it would have the negative effects on profits.
Research estimates indicate that hiring and training a replacement worker for a lost employee
costs approximately 50 percent of the workers annual salary (Johnson et al, 2000) but the
costs do not stop there. Each time an employee leaves the firm, we presume that productively
drops due to the leaving curve involved in understanding the job and the organization.
Furthermore, the loss of intellectual capital adds to this cost, since not only do organizations
lose the human capital and relational capital of the departing employee, but also competitors
are potentially gaining these assets. Meaghan et al (2002). Therefore if employee turnover is
not managed properly it would affect the organization adversely in terms of personal costs
and in the long run it would affect its liquidity position. In order to manage turnover properly
entails appreciating the factors that influence the turnover.
The Methodist University is a private university in a highly competitive industry. The issue
of staff turnover is an ever present reality that must be coped with. The question posed in
“does remuneration influence staff turnovers in Kenyan Private Universities with the
Methodist University as the case study? This research study will endeavor to determine this.
1.3 Objective of the study
The aim of the study was to evaluate remuneration in relation to staff turnover at the Kenya
Methodist University.

International Journal for Management Science and Technology (IJMST) Vol. 1; Issue 3
ISSN: 2320-8848(O.)/2321-0362(P.) Page 5 May, 2013
1.4 Research question
What is the influence of remuneration on staff turnover at the Kenya Methodist University?
1.5 Justification and significance of the study
The Kenya Vision 2030 and its First Millennium Term Plan (2008-2012) identify education
and training as key sectors under the social pillar that would enable the country develop
requisite human capital for sustainable development (GOK 2007 and 2008) University
education has always been a centre piece in nation building and economic development. It is
universally conceded to be a critical engine for prosperity and growth (CHE, 2012).
Upon the implementation of the study recommendation it is hoped that Private universities
and other organizations in Kenya will realize that measuring of staff turnover is important in
strategic corporate planning and forecasting, hence these organization will adopt a proactive
posture in dealing with the issue of staff turnovers. The universities management will benefit
from the feedback given by the respondents as the reasons why they quit jobs. This in turn
will avail then the platform from which to design strategic staff remuneration plans in order
to remain competitive in the job market by making their employers of choice. The study will
provide material to the Human Resource Departments at the private universities to model
their remuneration policies. The study will provide material to enable the government to plan
for higher education needs in the long-term. Employees will benefit because once the
universities implement the recommendation arising from the study, they will enjoy improved
working conditions hence improved work and hiring standards. The research findings will
benefit society at large because once there is an improvement in the remuneration for
employees at private universities; the workers will be in a position to invest in development
projects that will result in overall societal development. Finally research findings will satisfy
the researcher’s curiosity to know exactly how remuneration influence staff turnover at
private universities in Kenya and thus be in a position to have appropriate recommendations.
1.6 Scope of the study
The study focused on remuneration’s influencing on staff turnovers in private universities.
The case study of the Methodist University (KEMU) - a chartered private university founded
by the Methodist Church in Kenya with the main campus in Meru. It has campuses in
Nairobi, Nakuru, Mombasa and Nyeri and centers at Maua Meru Town and Marimanti,
Kakamega. The study was carried out at the Meru, Nakuru and Nairobi units and will
involved university management staff, teaching staff and non-teaching staff who will be
selected purposively.
1.7 Limitation of the study
The findings generated from the study at the Kenya Methodist may not be applicable to
public Universities or such other settings because operational circumstances are different.
The environment and practices at the private Universities is generally different from those at
public University.
2.0 Review Of Literature 2.1 Introduction
The paper is informed by the Expectancy and the Equity theories

International Journal for Management Science and Technology (IJMST) Vol. 1; Issue 3
ISSN: 2320-8848(O.)/2321-0362(P.) Page 6 May, 2013
2.1.1 Expectancy Theory (1964)
Expectancy Theory formulated by Vroom (1964) states that, effort to satisfy needs will
depend on the person’s perception that he or she can expect the effort to be followed by a
certain outcome which will bring desirable rewards. According to Vroom (1964), an
individual behavior will be affected by; what the person wants to happen, his or her estimate
of the probability of the things happening and how strongly the person believes that the event
will satisfy a need. Individuals normally base their predictions of what will happen in the
future of what has occurred in the past. New situations that workers have not previously
experienced like job changes or succession, new working conditions and environment cause
uncertainty and thus may reduce employee motivation because the individuals involved have
no prior knowledge of the likely consequences of altered circumstances. For Vroom
management should make clear to employees what exactly it expects from new working
practices, workers should be able to see a connection between their efforts and the rewards
these efforts generates, rewards should satisfy workers needs and complicated reward
schemes are unlikely to increase employee’s efforts because workers cannot relate hard work
to higher wages. According to Armstrong (2006), succession management makes meaning
when accompanied by rewards and work excitement. Okumbe (2001), on his part believed
that employees will increase their productivity with the expectation of receiving appropriate
rewards from their employers. The performance of employees, therefore, depends on both
their expectation that the increased productivity will lead to increased rewards and the value
they attach to the rewards. Satisfaction is highest when rewards meet expectations of
employees and when the value of the reward is commensurate with effort and skill expended
in obtaining it. All organizational expectations is making profits which is an indicator of
organizational performance.
2.1.2 Equity Theory and the Workplace (as Developed by Adams 1965)
Equity theory is concerned with the perception people have about how they are being treated
compared with others. To be dealt with equitably is to be treated fairly in comparison with
other group or workers. Armstrong (2006), on equity theory stated that people will be
motivated well if they are treated equitably and de-motivated if they are treated inequitably.
This can lead to job satisfaction and will boost morale. It is the top management’s role to treat
workers fairy if they expect to retain them. Okumbe (2001), noted that, compensation levels
must be perceived to be fair and just to all participants. He further stated that equity is
concerned with felt justice according to natural law. For compensation to be fair, it must be
felt to match the level of work and the capacity of the individual to do work. It should be
noted that workers have feelings of discomfort and guilt resulting from inequitably higher
pay. And this in turn causes them to act in a manner that reduces dissonance. Thus, if the law
of natural justice is followed, then staff turnover will not be a priority as employees will be
willing to continue working at KeMU.
2.2 Costing staff turnover
When deciding what kind of measures to put in place in order to improve staff retention
generally or retention of particular individuals, organizations need to balance the costs
involved against those that are incurred as a direct result of voluntary resignations. Although
it is difficult to cost turnover accurately, it is possible to reach a fair estimate by taking into
account the range of expenses involved in replacing one individual with another. Once a
figure has been calculated for a job, it is relatively straight forward to compute the savings to
be gained from a given percentage reduction in annual turnover rates. Figure 2.2 below shows
the approach to turnover costing recommended (Fair, 1992)

International Journal for Management Science and Technology (IJMST) Vol. 1; Issue 3
ISSN: 2320-8848(O.)/2321-0362(P.) Page 7 May, 2013
Figure 2.2 Costing Turnover
Enter number of employees __________ (a)
Enter average weekly wage £ __________ (b)
Multiply (a) x (b) £ __________ (c )
Multiply (c) x 52 £ __________ (d) = total pay bill
Enter current turnover rate __________ % (e)
Multiply (e) x (a) __________ (f) = staff loss per annum
Enter average number of days to __________ (g)
Multiply rate for overtime/turnips __________ (h)
Multiply (b) x (h) £ __________ (i)
Multiply (f) x (g) x (i/5) £ __________ (j) –immediate cover
Preparation and interview time per applicant
(days)
__________ (k)
Short listed applicants per position ___________ (l)
Enter average manager weekly wage £ ___________ (m)
Multiply (f) x (k) x (l) x (m/s) £ ___________ (n) = interview cost
Enter average recruitment fees ___________ % (0)
Multiple (d) x (o) £ _________ (p) recruitment fee cost
Length of induction training (days) ________ (q)
Frequency of this training (p-a) ________ (r)
Multiply (h/s) x (q) X (t + r) £ _____ (s)= induction training cost
Duration of learning curve (months) _______ (t)
Enter non-productive element ________ % (u)
Multiply (d) x (e) x (t/12) x (u) £ ________ (v) = non productive cost
Multiply (t) x (u) (months) £ ________ (w)
Multiply (d) x (e) x (h) x ((w)/12) £ ________ (x)= containing cover costs
Multiply (g) (b/5) x (t) £ _______ (y) salary savings

International Journal for Management Science and Technology (IJMST) Vol. 1; Issue 3
ISSN: 2320-8848(O.)/2321-0362(P.) Page 8 May, 2013
Add (j) + (n) + (p) + (s) + (v)+(x)–(y) £ _______ (z) = turnover cost p.a
Potential cost saving
Enter expected turnover reduction
________ % (1)
Multiply (z) x ((1)/(e) £ ____ 2) = labour turnover savings
Enter reduction in replacement time £ ______ % (3)
Multiply (j) x (3) £ _______ (4)=Added cost savings
Add: (2) + (4) £ ______ (5) = Total savings p.a
Source: H. Fair (1992) Costing turnover each year permits organizations to state with some confidence how much
money is being saved as a result of ongoing staff turnover programmes. It can also be used as
a means of persuading finance directors of the case for investing money in initiatives which
can be shown to improve retention. An example of an organization which has done this is
positive steps oldhan, a note-for-profit company set up when two local careers service
organizations merged (IDS 2005). The new organization employs 205 people and at the time
it was formed had an overall staff turnover rate of 38 percent over a three year period as a
result of various targeted initiatives, turnover fell to a much healthier.14 percent. Not only did
this make the organization much more effective, it also substantially reduced overload
(Torrington 2008)
2.3 Measuring staff turnover
Graham and Bennet (2006), defined staff turnover as the movement of people into and out of
the firm. They further noted that it is usually convenient to measure turnover by recording
movement of staff from the firm on the assumption that a new employee fills vacancies
created due to normal labour wastage (Cole, 1998). The simplest measure involves
calculating the number of leavers in a period (Usually a year) as a percentage of the number
of employees during the same period. This is known as the “separation rate” or crude waste
rate. For purposes of this study the following formula has been adopted
Separation rate = Number of leavers x 100
Average number working
2.4 Factors influencing staff turnover in organization
Armstrong (2009) stated that employee turnover should be analyzed in order in to forecast
future loses and identify reasons for people leaving the organization. Plans can then be made
to attack the problems causing unnecessary wastage and replace uncontrollable losses. The
human resource planner, therefore has to know how to measure wastage and analyze the
census of staff turnover in his/her organization.
Blunt (1990) stated that in order to estimate the organization manpower retention capacity,
it’s not usually sufficient to calculate current labour figures and extrapolate these into the
future. An organization ability to retain its employees is a function of many factors, most of
which change with the passage of time. Even in cases where today’s labour turnover figures
out to be the same as or similar to turnover, the underlying causes may differ.

International Journal for Management Science and Technology (IJMST) Vol. 1; Issue 3
ISSN: 2320-8848(O.)/2321-0362(P.) Page 9 May, 2013
Blunt(1990) gives the following factors as having been found influencing staff turnover in
organizations leaving for higher earnings, leaving for better career prospects/career
progression, leaving to reduce strains in interpersonal conflicts, the induction crisis, leaving
to reduce work under load or overload and leaving for alternative roles,/change of jobs.
Taylor at al (2000) interviewed 2000 people who had recently changed employers about why
they left their last jobs. They found a mix of factors at work in most cases but concluded that
push factors were a great deal more prevalent that pull factors as causes of voluntary
resignations. Very few people appear to leave jobs in which they are broadly happy in search
of something even better. Instead the picture is overwhelmingly one in which dissatisfied
employers serve alternatives because they no longer enjoy working for their current
employer.
Interestingly this study found relatively few examples of people leaving for financial reasons
indeed more of the interviewees took pay cuts in order to move from one job to another than
said that a pay rise was their principal reason for switching employers. Other factors played a
much bigger role:
a) Dissatisfaction with the conditions of work especially hours
b) A perception that they were not being given sufficient career development
opportunities
c) A bad relationship with their immediate supervisor
The third facto was by far the most commonly mentioned in the interviews, lending support
to the often stated point that people leave their managers and not their organizations
Branhan (2005) drawing on research undertaken by the Saratoga institute, reached similar
conclusions. His seven “hidden reasons employees leave” are the job or workplace not living
up to expectations; a mismatch between the person and the job; too little coaching and
feedback; too few growth and advancement opportunities; feeling devolved and
unrecognized; stress from overwork and work-life imbalance; loss of trust and confidence in
senior leaders
Charter fee (1992) argued that when an organization loses the services of a competent
employee, it is certainly a matter of concern to the organization. He further argues that every
effort should be made to look into reasons and make necessary changes in fundamental
policies to improve the climate of working for the remaining staff. He says that firms which
have got a well organized performance appraisal system experience low rates of turnover.
The appraisal system should, therefore, include a survey of the future needs of the
organization, identify the future job needs and conspire the skills and capability of different
workers so as to fit them in different areas of work in due course.
According to Flippo (2008), the movement of staff into and out of the organization is an
index of the stability of the workforce. However, an excessive movement is undesirable and
expensive. High turnover from certain categories of staff suggests a need for improvement in
working conditions and /or supervision. He concluded by stating that the reasons given for
employee leaving must be analyzed carefully to ascertain their truth.
Leap (1993) noted that turnover maybe voluntary or involuntary. Voluntary turnover recurs
when the employee has an option to remain with the present employee but decides to accept a
job elsewhere or leaves the labor force altogether. Involuntary turnover occurs when the

International Journal for Management Science and Technology (IJMST) Vol. 1; Issue 3
ISSN: 2320-8848(O.)/2321-0362(P.) Page 10 May, 2013
employee is discharged or must resign for reasons outside his/her control (Layoffs, illness,
permanent disability, dismissals, retirement, redundancy, death etc.
Mobley (2003) referred to the causes of turnover as determinants of turnover,. He states that
the general classes or determinants of turnover are: - The state of the economy (for example,
the availability of alternative jobs); organizational variables such as leadership, reward
system, job design etc and individual variables. He further noted that there are various types
of cessations. “A frequently used distraction is between voluntary separation (employee-
initiated) and involuntary separation (organization-initiated plus death and mandatory
retirement. The US Bureau of labour statistics (1980) classifies separation in three (3) ways:
“Quit”, “Lay off”, and “others”. Mobley further summarizes the variable related to turnover
as the causes and correlates or determinants of turnover. The variables are related to turnover
either directly, indirectly, causally, or correlationally.
According to Tretty (2006), people are ever joining and leaving organizations all the time.
But some organizations find it more difficult to keep their staff than others. There are a
number of reasons why organization might suffer high staff turnover. Rates of turnover from
industry to another. The main factors, therefore, influencing high staff turnover are as:-
a)Reward schemes – Every industry has organizations that pay well and some that pay
badly. There will always be a few employers who try to get away with paying as little as
possible and high staff turnover is the inevitable result. Employees might stay a little longer
in times of recession because no other work is available but they know they are being
exploited and will be looking for a way out (Mobley 1998).
b)Staff training policy – asking someone to do a job but not giving them adequate training is
de-motivating .Some people pick it up quickly and may even thrive on the challenge, but they
are the exception. Often there are good intentions to train but others, apparently more
important things keep getting in the way. Managers continually under estimate the value of
training staff (Armstrong, 2009).
c) Weak leadership – In most organizations, people work as teams alongside colleagues
performing complementary roles. Between them, they run a process or deliver a solution or
product, whether in a coffee shop or a bank. Teams perform at their best under clear
leadership, where someone has a vision of how the team should work and the level at which it
should perform. Weak leadership can lead to disagreements about purpose and direction,
disharmony and employee discontent (Torrington 2008).
d) Unrealistic expectations – Some managers expect too much from their staff, often
because they don’t know how to do the job themselves and don’t understand why it takes
longer than they think it should. Or they want an unreasonable level of commitment to unpaid
overtime or working through breaks. This is often accompanied by the absence of positive
feedback and encouragement (Bernstein 1998)
e) Organizational culture – It can be difficult to break the cycle of high turnover. When new
employees join an organization, they soon become aware of the culture and they quickly pick
up on expectations about length of service. This will affect their own career planning and
unless serious effort is put into breaking cycle, high turnover will continue. (Sigima
Assessment Systems (2007)

International Journal for Management Science and Technology (IJMST) Vol. 1; Issue 3
ISSN: 2320-8848(O.)/2321-0362(P.) Page 11 May, 2013
The HR Chally group (2007) noted that a certain amount of employee turnover in a company
is natural and desirable. Desirable turnover occurs when, for instance, it creates an
opportunity for good candidates for managerial and leadership positions to be promoted into
higher positions of responsibility. Another example is when poorly performing employees
leave or one let to go, ideally to be replaced by more productive ones. Thus an acceptable
amount of turnover prevents stagnation and brings in new and fresh talent.
The group further argued that undesirable turnover is another matter especially when good
talents leaves, the replacement costs are often quite high due to loss of productivity,
recruitment costs to find and select new candidates, training costs for new replacements that
are hired. The group therefore identified the causes of undesirable employee turnover as: Job
mismatch (the right people, but the wrong jobs for their talent). Poor job engagement,
inadequate training in critical skills for the job, inadequate compensation plans, including
incentive plans for sales people.
In conclusion, new starters are likely to leave; turnover is often high in expanding
organizations, which have high proportions of new status. Turnover may also be high in
organizations which hire staff on contract basis as workers tend to move to employers
offering greater job security. Pay is perhaps most frequently assumed to be reason for
workers leaving but is rarely the only reason. Where workers can compare their earnings
unfavorable with those of others in the same industry, level, or the same locality, then pay
levels do influence staff turnover. Even so people remain in jobs they like although higher
paid work is available. Labour turnover will vary in different groups of employees and
measurement is more useful if broken down by department or section or according to such
factors as length of service, age or occupation.
2.5 Effects of remuneration schemes on staff turnover.
Remuneration or Reward is clearly central to the employment relationship (Torrington 2008).
While there are plenty of people who enjoy working and who claim that they would not stop
working even if they were to win a large lottery, most of us work because it is our only way
of earning the money we need to sustain our families in the life style to which we are
accustomed. How much we are paid and in what form is therefore an issue which matters
largely to us.(Torrington 2008). This therefore suggest that a worker will be willing to stay in
a job where the remuneration has been set at the right level otherwise they will be persuaded
to leave to a better paying job.
According to Okumbe (2001), an effective remuneration system is one that enables an
organization to attract, retain and motivate its employees. The base compensation ,which is
the cash payment or salary paid to employees in return for their standard (optimum)
performance, enables organizations to attract and retain employees(Okumbe 2001).The
objectives of a well –thought –out remuneration system include to i) enable organizations to
attract and retain competent career personnel; ii) motivate personnel so as to attain optimum
performance; iii) enable organizations to gain maximum return in service from the
employees; iv) help minimize staff turnover and v) enable the personnel to develop
confidence in organizations with respect to equity and objectivity.
It is clear from the above narrative that remuneration has an effect on staff turnover
especially in a situation where competitors are able to offer competitive pay.

International Journal for Management Science and Technology (IJMST) Vol. 1; Issue 3
ISSN: 2320-8848(O.)/2321-0362(P.) Page 12 May, 2013
2.5 Conceptual Framework
A conceptual framework consists of independent and dependent variable. An independent
variable is the presumed cause of change in the dependent variable. It is caused or influenced
by independence variables. Dependent variable(s) is the variable the researcher wishes to
explain. In this study it is turnovers. This study considers remuneration to be the variable that
influence turnover of staff at the Methodist University, and thereafter have recommendations
to reduce the problem (turnovers). It is worth noting that staff turnover is usually influenced
by a combination of various factors each one of which may vary from organization to
organization. In this study we focused on remuneration.
Independent variable Dependent variable
(Source: Author 2013)
Figure 2.5 Relationships of the Independent and Dependent Variables
Organization invests a lot in their employees in terms of induction and training developing,
maintaining and retraining them in their organizations. Therefore, managers at all cost must
minimize employee’s turnover (Kevin et al 2004). Turnover is measured for individual
companies and for their industry as a whole. If an employer is said to have a high turnover
relative to its competitors, it means that employees of that company have a shorter average
turnover than those of other companies in the same industry. High turnover may be harmful
to a company’s productivity if skilled workers are often leaving and the worker population
contains a high percentage of novice workers (Wikipedia 2013).
In figure 2.2 staff turnover is determined by remuneration. The level of staff turnover is the
dependent variable. Remuneration offered and paid can cause high or low turnover.
High turnover often means that employees are unhappy with compensation. Low turnover
indicates that none of the above is true: employees are satisfied with the remuneration.
3.0 Research Methodology 3.1 Introduction.
The study sought to investigate factors influencing staff turnover in Kenyan private
universities using KEMU as the case study. This chapter therefore gives a framework for
conducting the research. It gives details and procedures necessary for obtaining information
needed to test and answer the research questions. The chapter contains description of the
study, sampling design, research instruments, data collection methods and analysis procedure
and interpretation.
3.2 Research design
This study adopted the descriptive research design. This research design was used to
accurately portray the characteristics of a particular individual, situation or even a group
taking Kenya Methodist University as a case for this study. Descriptive research design is a
scientific method which involves observing and describing the behavior of a subject without
influencing it in any way (Shuttle Worth, Martyn, 2008)
Remuneration Staff
Turnover

International Journal for Management Science and Technology (IJMST) Vol. 1; Issue 3
ISSN: 2320-8848(O.)/2321-0362(P.) Page 13 May, 2013
Descriptive research design is advantageous due to the following reasons: Firstly, it often
yields accurate results since the subject under study is always observed in a completely
natural environment without affecting their normal behavior in any way.
Secondly, compared to quantitative experiments, descriptive research designs is inexpensive
and less time-consuming. The case study approach was used because since private
universities in Kenya are geographically scattered, the decision to use KEMU as case study
was to save on costs and time bearing in mind the limited time and financial resources
available for the study. However, the findings from the study could be inferred to the other
private universities.
3.2 Target population
The study population is as presented in table 3.1
Location Category Frequency
MERU
70 160
Management
Teaching
Non- teaching
Sub-total
20
70
70
160
NAIROBI Management
Teaching
Non- teaching
Sub-total
10
65
65
140
NAKURU Management
Teaching
Non- teaching
Sub-total
10
65
65
140
GRAND TOTAL 440
(Source: Author 2013)
Table 3.2 Target Population
Population is basically the universe of units from which a sample is selected (Allan, 2007). It
could be an entire group of people, events or things of interest that a researcher wishes to
investigate. With regard to this study, the target population will comprise of individuals with
some common characteristics from which the researcher would make a generalization of the
study. The Kenya Methodist University will form the target population. The management,
teaching staff and non-teaching staff at the Meru, Nairobi and Nakuru establishments will be
involved in the study for the purposes of affordability and convenience.
3.3 Sampling Strategy
Sampling is the process of selecting a subset of people or social phenomena to be studied
from a larger universe to which they belong. The size of a sample to be used is determined by
a balance of resources available, anticipated techniques of analysis, how much variation is
believed to be in the universe and the level of precision needed in the estimates to be made
about the universe on the basis of data from the sample (Geoff, 2007). By selecting a

International Journal for Management Science and Technology (IJMST) Vol. 1; Issue 3
ISSN: 2320-8848(O.)/2321-0362(P.) Page 14 May, 2013
studying sufficient number of elements from the population, the researcher will be able to
generalize these properties and characteristics to the entire population. The sample
characteristics /statistics will be used to estimate the characteristics of the population and
comprises some elements from the population.
Stratified random sampling method will be used to ensure that representatives from each
department within the population will be represented in the sample. This will involve
grouping the population that has similar characteristics together .In this case, the
Using stratified random sampling method, the researcher worked out a sampling size of 10%
selected from each category /stratum as shown in the following table.
Table 3.2 Sample size
3.4 Data collection instruments
The data collection tools that were used in this study were self-developed questionnaires,
interviews and document analyses. These methods yielded two types of data collected for the
study: primary and secondary data.
3.4.1 Primary data
This included raw data that was collected from teaching and non-teaching staff through
randomly distributed questionnaires and interviews (both face to face for the existing staff
and exit interviews). Questionnaires were used to facilitate individual opinion and specific
information respectively. The questions were administered to respondents randomly by the
researcher with the assistance of the line managers. The respondents were required to
complete the questionnaire in one week’s time after which the researcher collected them.
Questionnaire validity and reliability was be determined through piloting afterward. In
addition exit interviews was conducted to 6(six) employees, 2 persons from each job group,
that have left KEMU since January 2010 to find out exactly the reasons that made them quit
KEMU. The researcher also observed the trend of turnover especially by studying the
statistics from personnel data records so as to get a rough idea of the magnitude of the
problem.
3.4.2 Secondary data
This involved visiting the library to get information on literature review, browsing the
internet, analyzing documents like personnel data, training manuals, welfare manuals and
other KEMU publications.
3.5 Validity and Reliability of instruments
3.5.1Validity
Validity refers to the degree to which an instrument measures what it is supposed to measure
for a particular purpose and a particular group (Hay, 1981). The instruments for this study
were questionnaire and interview schedule that were validated through the application of
content analysis determined by expert judgment. It was expected that content validity of the
items in the questionnaire and interview schedule was ensured following the researcher’s
consultation with peers and the supervisors. Again, it was hoped that through scholarly
criticism and advice on draft instruments for data collection, polished instruments which can
stand validity tests was obtained.
International Journal for Management Science and Technology (IJMST) Vol. 1; Issue 3
ISSN: 2320-8848(O.)/2321-0362(P.) Page 15 May, 2013
3.5.2 Reliability
According to Coolican (1994) the reliability of an instrument is the measure of the degree of
which a research instrument produces the same results when retested on the same people at
different times (so long as nothing significant has happened to them between tests). A pilot
study was carried out to pre-test the reliability of the instruments to be used in data collection.
The researcher sought advice from experts to ensure that the tools for data collection were
reliable.
3.6 Data analysis methods
The goal of data analysis according to (Ngau, 2004) is to clarify problems, identify
alternatives and provide a sense of direction. Data collected from questionnaires and
interviews was recorded in a diary for final tabulation and analysis using both qualitative and
quantitative techniques. Editing was done to the questionnaires to check for any blank
responses. Tabulation involved counting the number of cases that fell into each category.
Data analysis helped the researcher to check how well coding and entering of data was done.
This was done by checking the central tendency and dispersion of data (mean, range, mode,
median, standard deviation and variance of the data). Thematic approach was used to analyze
qualitative data. Statistical Packages for Social Sciences (SPSS) was used for interpretation to
make conclusions and finally draw effective recommendations.
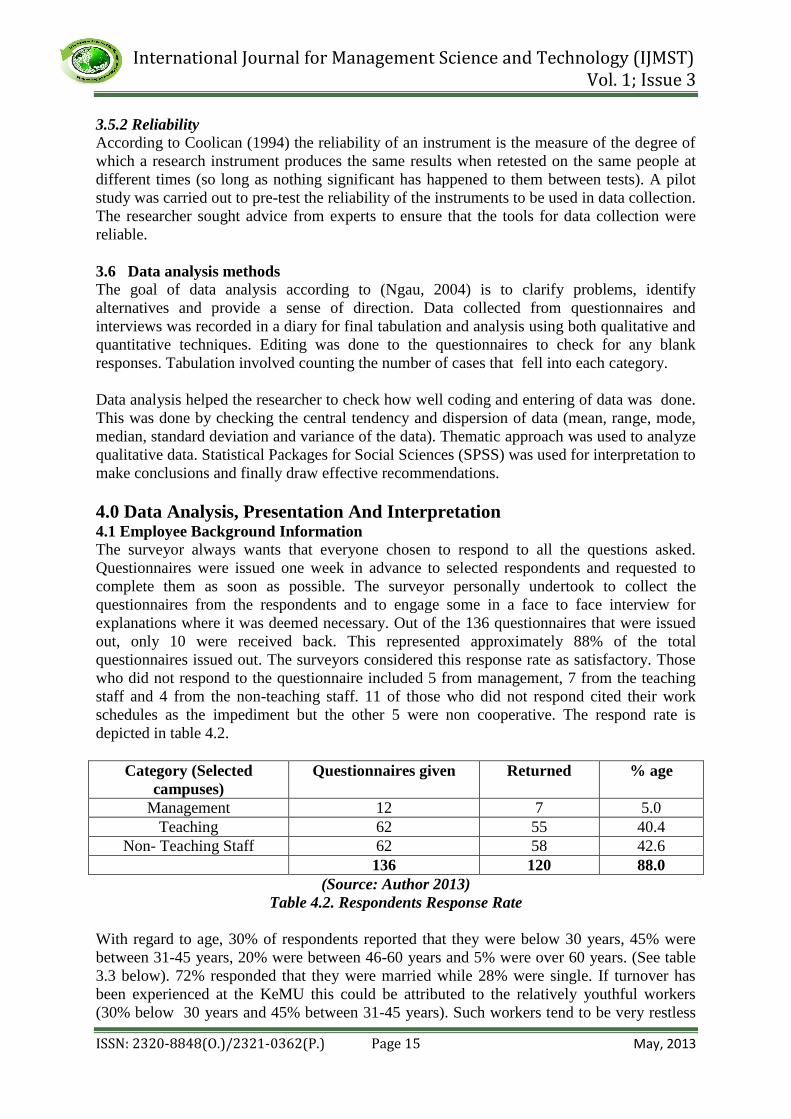
4.0 Data Analysis, Presentation And Interpretation 4.1 Employee Background Information
The surveyor always wants that everyone chosen to respond to all the questions asked.
Questionnaires were issued one week in advance to selected respondents and requested to
complete them as soon as possible. The surveyor personally undertook to collect the
questionnaires from the respondents and to engage some in a face to face interview for
explanations where it was deemed necessary. Out of the 136 questionnaires that were issued
out, only 10 were received back. This represented approximately 88% of the total
questionnaires issued out. The surveyors considered this response rate as satisfactory. Those
who did not respond to the questionnaire included 5 from management, 7 from the teaching
staff and 4 from the non-teaching staff. 11 of those who did not respond cited their work
schedules as the impediment but the other 5 were non cooperative. The respond rate is
depicted in table 4.2.
Category (Selected
campuses)
Questionnaires given Returned % age
Management 12 7 5.0
Teaching 62 55 40.4
Non- Teaching Staff 62 58 42.6
136 120 88.0
(Source: Author 2013)
Table 4.2. Respondents Response Rate
With regard to age, 30% of respondents reported that they were below 30 years, 45% were
between 31-45 years, 20% were between 46-60 years and 5% were over 60 years. (See table
3.3 below). 72% responded that they were married while 28% were single. If turnover has
been experienced at the KeMU this could be attributed to the relatively youthful workers
(30% below 30 years and 45% between 31-45 years). Such workers tend to be very restless

International Journal for Management Science and Technology (IJMST) Vol. 1; Issue 3
ISSN: 2320-8848(O.)/2321-0362(P.) Page 16 May, 2013
and active and will be looking to more other opportunities that present themselves elsewhere.
And all KeMU campuses are within or close proximity to settings like Nairobi, Nakuru, and
Mombasa which potentially can offer alternative job opportunities. Also, there has been
tendency for institutions including private universities to prefer offering non-teaching staff
jobs on a temporary, contract or casual terms. When this is the case that happens, the affected
workers will be less attached and committed to their work because most of the time they will
be looking for a quick exit to more to more secure jobs openings.
Age Brackets (yrs) Frequency % age
Below 30 36 30
31-45 54 45
46-60 24 20
Over 60 6 5
120 100
(Source : Author 2013)
Table 4.2.1 Age of respondents
4.2.2 Number of years Worked
The number of years worked by an employee in an organization is a good and reliable
measure of the staff retention policy. Staff retention is the process of ensuring that employees
are kept within the departments especially employees with valued or needed skills or
experience in scarce/critical fields (where recruitment is difficult). The aim of any staff
retention is to prevent the loss of competent staff from the department, which could have an
adverse effect on overall performance especially in a very competitive private higher
education sector which boasts 14 chartered private universities, 4 private universities
constituent colleges, 11 universities with letters of interim authority and 2 registered private
universities. Staff retention stems from the employment process. Employment process is a
crucial process that should receive careful and sufficient attention to ensure that its objectives
and goals are achieved. The three employment processes (recruitment, selections, and
placement) pre-determine the effectiveness of the retention strategy of the department. For
staff retention to be successful, it has to be linked positively with the processes and practices
of recruitment, selection, placement, training and development, remuneration and
performance appraisal.
The researcher/ surveyor through the questionnaire asked respondents to indicate the period
they had served at the university and the findings are tabulated in table 4.2.2.
n= 120 Years worked Frequency % age
Below 1 year 5 5
2-5 years 62 20
6-10 years 24 52
Over 10 years 6 23
Total 120 100
(Source: Author 2013)
Table 4.2.2. Response on number of years worked

International Journal for Management Science and Technology (IJMST) Vol. 1; Issue 3
ISSN: 2320-8848(O.)/2321-0362(P.) Page 17 May, 2013
The Methodist University had been in existence since 1997 when a letter of interim authority
was granted by the commission for higher education. It became a fully fledged chartered
university in June 2006. It is therefore a relatively young institution of higher education. It
started off with a batch of 9 students in 1997 and the population had grown tremendously to
over 10,000, in 2013. It had 440 staff. The university also uses adjunct/part-time staff.
From the data tabulated in table 3.4, 75 of the sampled respondents indicated that they had
been in employment from 6 to over 10 years. The institution is only 16 years old. This means
that most workers have remained with the university since its inception and only 5% have
been employed recently in less than one year. The newly employed were mostly due to
expanding universities with increased activities. That most workers have chosen to work at
KeMU for long is due, according to findings to relatively good working conditions based on a
relatively sufficient retention policy. Field work also suggested that the ecumenical character
that the university maintains helps to create conducive working environment. Field work also
suggest that the few who left cost the university indirect financial of replacing them and also
other repercussions were suffered such as the loss of very skills, knowledge and experienced,
description to operation and the negative effect on workforce morals. There were also
increased overload on the remaining staff which tend to reduce the productivity of the
institution.
4.2.3 An Appreciation of Concept of Turnover
The quality of the research finding dependent on the respondents grasp of the research topic.
Therefore, the level of education was crucial. Out of the 120 respondent that participated in
the exercise, all the 7 management staff had a bachelor’s degree or above, all of the 55
teaching staff had a bachelor’s degree or above, 18 had a diploma, and 30 had certificate
qualification. This reality is depicted in table 3.5. All the respondents indicated that they
appreciated what the concept staff turnover is. The researcher/surveyor had the opportunity to
have a face to face interview session with three lecturers at different times whether the matter
of turnover was tackled in depth. It came out very clearly from them that overall high
turnover often means that employees are unhappy with the work or compensation, but it can
also indicate unsafe or unhealthy conditions, or that too few employees give satisfactory
performance (due to unrealistic expectations, inappropriate process or tools, or poor
candidate screening). The lack of career opportunities and challenges, dissatisfaction with the
job or conflict with the management were cited as predictors of high turnover.
From the interview with the three, low turnover indicate that none of the above is true:
employees are satisfied, healthy and safe, and their performance is satisfactory to the
employer. However, the predictors of low turnover may sometimes differ from those of high
turnover. Aside from the fore-mentioned, career opportunities, salary corporate culture,
management recognition, and a comfortable workforce seemed to have given the total picture
on the subject of causes of high or low turnover. The respondent involved in the exercise
contributed the high gravity of discourse and research findings by virtue of their academic
qualification and grasp of the subject matter of them.

International Journal for Management Science and Technology (IJMST) Vol. 1; Issue 3
ISSN: 2320-8848(O.)/2321-0362(P.) Page 18 May, 2013
Category No. of bachelors
degree and above
Diploma holder Certificate
holder
Total
Management 7 - - 7
Teaching staff 55 - - 55
Non- teaching
staff
18 10 30 58
Total 80 10 30 120
(Source: Author 2013)
Table 4.2.3 Academic Qualification of respondents
4.3 Remuneration And Staff Retention
Respondents involved in the study were to answer question relating to the influence of
remuneration on staff turnover at the Methodist university .They agreed that remuneration is
helpful in reducing staff turnover and findings were as tabulated in table 4.3.
Response Frequency %Age
Definitely agree 90 75.0
Probably agree 20 16.7
Neutral 10 8.3
Probably don’t agree - -
Definitely don’t agree - -
120 10.0
(Source: Author 2013)
Table 4.3 Remuneration and turnover
75% of the respondents definitely agreed that a good well structured remuneration package
will reduce staff turnover.
Asked whether a well administered remuneration system would boost the morale of the
employees and reduce the staff turnover at KeMU, the findings in table 4.4indicated
that83.3% of the respondents agreed that a well administered remuneration system enhances
the morale of workers and tended to reduce the turnover of workers. Hence remuneration is
central in retaining workers in an organization. Human resource management should design a
competitive remuneration package which will serve to attract, retain, and motivate staff while
minimizing cost so as to ensure commercial and financial viability.
Response Frequency %Age
Definitely Yes 100 83.3
Probably Yes 20 16.7
Neither Yes nor No - -
Probably No - -
Definitely No - -
120 100
Table 4.4 Remuneration and Morale

International Journal for Management Science and Technology (IJMST) Vol. 1; Issue 3
ISSN: 2320-8848(O.)/2321-0362(P.) Page 19 May, 2013
5.0 Summary Of Findings, Conclusions And Recommendations
5.1 Introduction
The results highlighted that the quality of any research findings depends on the respondents
grasp of the research topic. The level of education and experience contributed immensely to
the satisfactory quality of the research findings. Reward or remuneration is always central to
employment relationship. The amount and form paid is therefore an issue which matters
hugely. Remuneration is key in retaining workers in any organization and the human
resource management needs to design a competitive remuneration package which will serve
to attract, retain, and motivate staff while minimizing costs ensuring ultimately commercial
and financial viability. At KeMU, the remuneration system seems to be relatively competitive
and has apparently reduced employee turnover.
5.2 Conclusion
The Methodist University is a relatively new entity that came into being some 16 years ago. It
has grown very rapidly from a population of 8 in 1997 to over 10,000 currently, because of
its relatively short lifespan, and the fact that it is growing rapidly in competitive private
higher education sector, it has generally adopted measures that seem to have contained
turnover, at least so far. And it is important to pay attention to certain realities relating to
turnover. Research has uncovered a moderately inverse relationship between satisfaction and
turnover.
According to T.W Lee and T. Richard (1987), high job satisfaction will not in and of itself,
keep turnover low, but it does seem to help. On the other hand, if there is considerable job
satisfaction, there is likely to be high turnover, obviously, other variables enter into an
employee’s decision to quit besides job satisfaction. For example, age, tenure in the
organization and commitment to the organization may play a role. Some people remain
regardless of how dissatisfied they feel. Also, when the general economy is performing well
and be there can be an increase in turnover because people will begin looking for better
opportunities elsewhere. On the other hand, if jobs are tough to get, dissatisfied will
voluntarily stay where they are. Research findings verify that unemployment rates directly
affect turnover.
Overall however, our conclusions from the review of literature and the filed study at the
Methodist University indicate that remuneration influence staff turnover.
5.2 Recommendations
It will always be incumbent upon management to design the appropriate staff retention
management policy aimed at minimizing potential staff turnover. University management
needs to motivate employees to stay. It is absolutely necessary for management to
compensate employees adequately. They should pay employees based on their performance
and in addition, they should give employees incentives like individual bonus, lamp sum
bonus, and other benefits. If these are put in place, they would minimize employee turnover.
5.3 Recommendation For Further Research On Turnover
Seminal literature on private higher education in Africa identifies Kenya to have a larger
sector of private religious institutions. These institutions still account for the largest number
of private universities in the country. All of them base their curricula on some ecclesiastical
beliefs and teachings. Besides some like the catholic university of East Africa, Africa

International Journal for Management Science and Technology (IJMST) Vol. 1; Issue 3
ISSN: 2320-8848(O.)/2321-0362(P.) Page 20 May, 2013
Nazarene University, and the Kenya Methodist University that offer both religious and
secular curricula, the reset in this category offer purely religious syllabi for those of their
followers who want to join the university as preachers. It is suggested that research be
conducted to determine the influence of the ecclesiastical foundations at private religious
universities on staff’s turnover at the universities. A part from remuneration, there are many
other factors that influence employee turnover. Research needs to be done on these other
factors and compare their effect with that of remuneration and amongst themselves.
Appendix 1
Reference
Abassi, S.M., Hollman K.W. (2000). “Turnover: The real bottom line”, public
personnel
management, 2(3) :333-342
Armstrong, M.(2009). A hand book of Human Resource Management and practice.
Pentamville: Kogan page.
Allan, B and Emma, B (2007), Business Research Methods USA Oxford University
Press Asian Development Bank. Vol 3, Pp. 20
Bell, V. and Harrison. (1987). People in organization. The needs of people at work.
crydon. Terk Ltd.
Bernstein, A. (1998). We want you to stay. Really Business week, vol. 22, pp 67.
Blan G, Bral, K (1989). “Using job involvement and organizational commitment
iteractively to predict turnover.” J. Manage. 15 (1): 115-127.
Brook et al (1988), “discuss validation of measures of job satisfaction, job
involvement and organizational commitment,” J. Appl psychology 73 (2): 139-145
Bwg , W. A. and Gall, M.D (1983). Educational research: an introduction, fifth E.d
New York: Appleton-century-crafts.
Chatterfee, S.K. (1992). Personnel management and Industrial relations. Delhi:
surfeit
o publications.
Luthans, F. (2008) organizational behavior Boston: Mchran – Hill
Meaghan stovel, Nick Bontis (2002), voluntary turnover: knowledge management-
friendly and foe? J. intellect. Cap. 3(3):303-322
McNally , Chicago, IL, pp 1297-1349.
Porter et al (1974) “organizational commitment, Job satisfaction, and turnover among
psychiatric technicians,” J. apll. Psychology 59:603-609
Mwiria, K. and Wamahiu, S.P. (1998). Issues in educational research in Africa
Nairobi: E.A.E.P
Mugenda, O and Mugenda, A. (1999). Research Methods; Quantitative and
qualitative
Approaches, African centre for Technology study. Nairobi Kenya.
Mobley.W.H. (2003). Employee Turnover: Causes, consequences and control. 5th
Ed.
Michigon state university: Addis-Wesley publishing companyMulinge, M.& Mueller
C.W. (1998). Employee job satisfaction in developing countries: The case of Kenya.
A journal of world Development. Vol 5, pp.6
Mandaluyong city. 6 ADB Avenue. Accessed on 26/11/2010
Monappa, A. (1985). Industrial Relations. New Delhi: Tata Meliraw Hill
Ngau, P. and Kuwasa, A. (2004) Research Design, Data collection and analysis: A

International Journal for Management Science and Technology (IJMST) Vol. 1; Issue 3
ISSN: 2320-8848(O.)/2321-0362(P.) Page 21 May, 2013
training manual. Nairobi: UNCRD – Africa office.Olivier, S. (2010). Engaging staff
in the workplace.
Porter et al (1974) “organizational commitment, Job satisfaction, and turnover among
psychiatric technicians,” J. apll. Psychology 59:603-609
Prince, J.L. (1977). The study of turnover, 1 edition, I owe a state: university press,
1A
pp 10-25 Prentice-hall: upper saddle river.
Rosa Z., (2008), Factors determining rate of employee turnover in companies,
Accessed on 22/8/2010
Rogers, J. D, Clow, K.E. & Kash, T. J. (1994) Increasing Job satisfaction of service
personnel. Journal of services marketing vol. 5 pp.1
SchuHZ, D, S.E, Schutz (2006) Psychology & work today London: pearson
International. Steers, R.M. (1981).Organizational effectiveness: A behavioural view
Greenwich: JAI press Saleemi (2008), Management: Principals and practice Nairobi:
N.A Saleemi publisher Torrington, D. Laura, H and Stephen T.(2008). Human
Resource Management England: Pearson Education Limited Edinburgh Gate
Weihrich, H., Canmice, M.V and Koontz H. (2008). Management. New Delhi
Mechran Hill.
Wehrich, H, M.V. Cannile, & H. Koontz (2008) Management: A global and
entrepreneurial perspective. New Dehi; Maaran-Hill publishing ltd.
Williams LJ, Hazes JT (1986), “Antecedents and consequences of satisfaction and
commitment in turnover models: a reanalysis using latent variable structural equation
methsi” Appl psychology 71(2): 219-231