www.geoinformatics.upol.cz on shape metrics in landscape analyses vít pÁszto department of...
TRANSCRIPT

www.geoinformatics.upol.cz
On Shape Metrics in Landscape Analyses
Vít PÁSZTO
Department of Geoinformatics, Faculty of Science, Palacký University in Olomouc
Reg. č.: CZ.1.07/2.3.00/20.0170

www.geoinformatics.upol.cz
Presentation schedule
• Introduction
• Data used
• Study area
• Methods
• Case study 1 (Results)
• Case study 2 (Results)
• Case study 3 (Initial idea)
• Conclusions

www.geoinformatics.upol.cz
Introduction
• Computer capabilities used by landscape ecologists
• Quantification of landscape patches
• Via various indexes and metrics
• Prerequisite to the study pattern-process relationships (McGarigal and Marks, 1995)
• Progress faciliated by recent advances in computer processing and GIT
www.geoinformatics.upol.cz
Introduction
• Shape and spatial metrics are exactly those methods for quantitative description
• In combination with multivariate statistics, it is possible to evaluate, classify and cluster patches
• Available metrics were used (as many as possible)
• Unusual approach in CLC and city footprint analysis
www.geoinformatics.upol.cz
Methods - Shape & spatial metrics
• Fundamentally based on patch area, perimeter and shape
• Easy-to-obtain metrics & complex metrics
• Software used:o FRAGSTATS 4.1o Shape Metrics for ArcGIS for Desktop 10.x
• EXAMPLE/EXPLANATION
www.geoinformatics.upol.cz
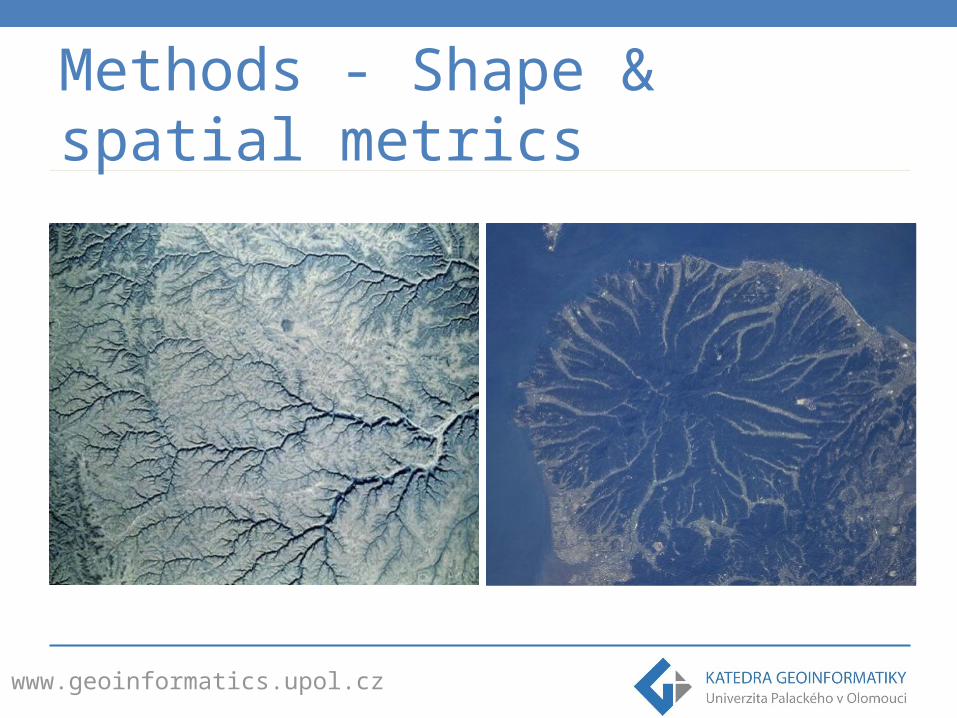
Methods - Shape & spatial metrics

www.geoinformatics.upol.cz
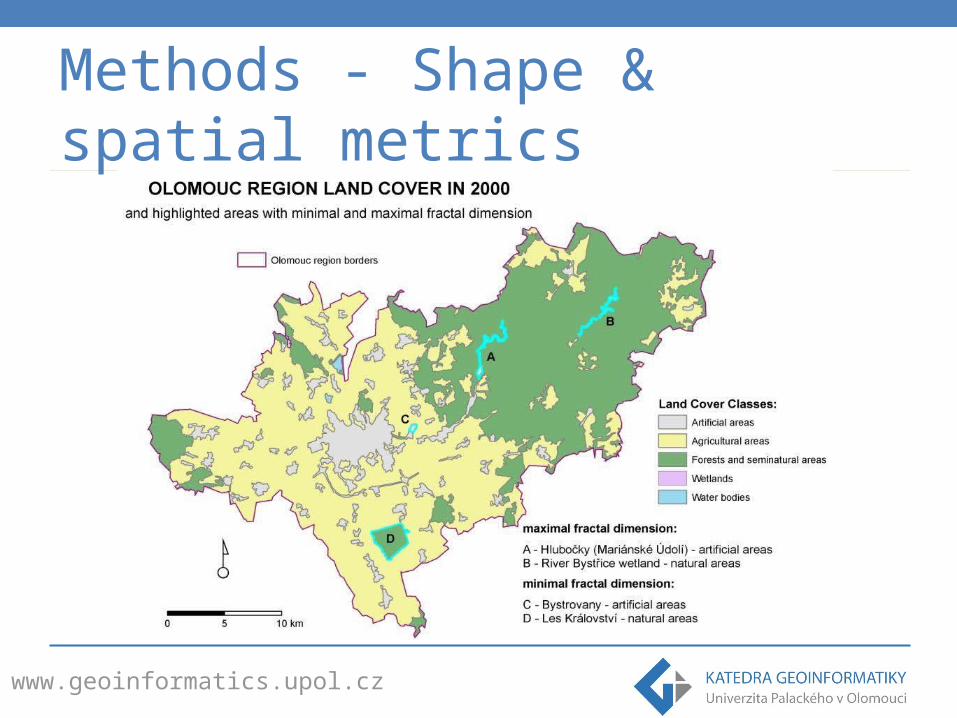
Methods - Shape & spatial metrics
www.geoinformatics.upol.cz
Methods - Shape & spatial metrics

www.geoinformatics.upol.cz
Methods - Shape & spatial metrics

www.geoinformatics.upol.cz
Methods - Shape & spatial metrics
Convex hull
Detour index
www.geoinformatics.upol.cz
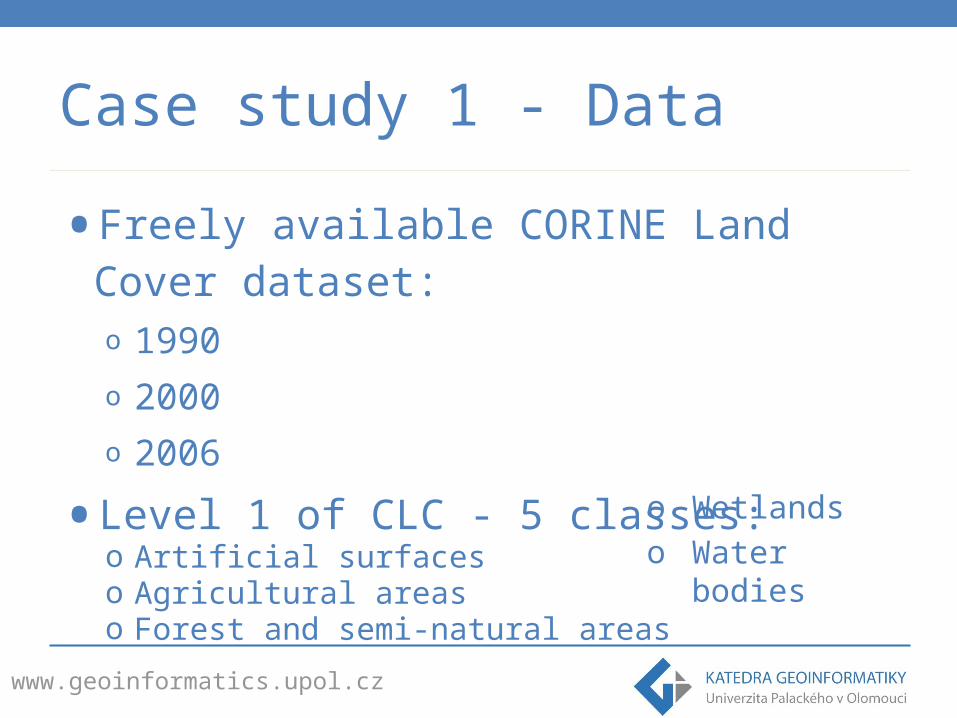
Case study 1 - Data
• Freely available CORINE Land Cover dataset:o 1990o 2000o 2006
• Level 1 of CLC - 5 classes:o Artificial surfaceso Agricultural areaso Forest and semi-natural areas
o Wetlandso Water bodies

www.geoinformatics.upol.cz
Case study 1 - Study area
• Olomouc region (800 km2) - 1/2 of London
• More than 944 patches analyzed

www.geoinformatics.upol.cz
Case study 1 - Methods
• Principal Component Analysis (PCA) for consequent clustering
• Cluster analysis:o DIvisive ANAlysis clustering (DIANA)o Partitioning Around Medoids (PAM)
• Software - Rstudio environment using R programming language
www.geoinformatics.upol.cz
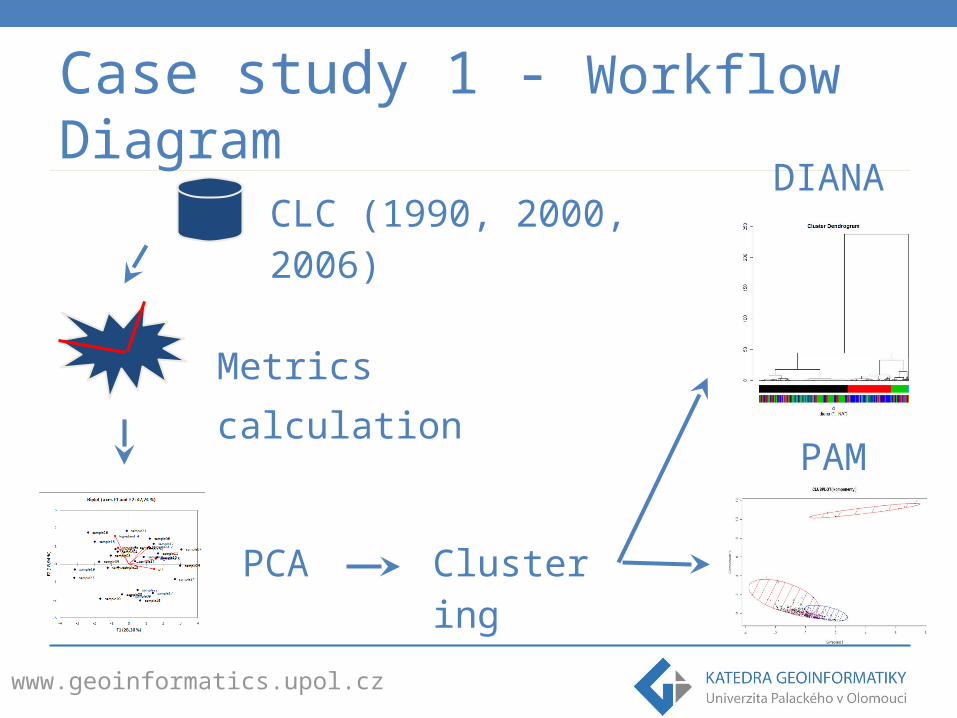
Case study 1 - Workflow Diagram
CLC (1990, 2000, 2006)
Metrics calculation
PCA Clustering
DIANA
PAM

www.geoinformatics.upol.cz
Case study 1 – no. of clusters

www.geoinformatics.upol.cz
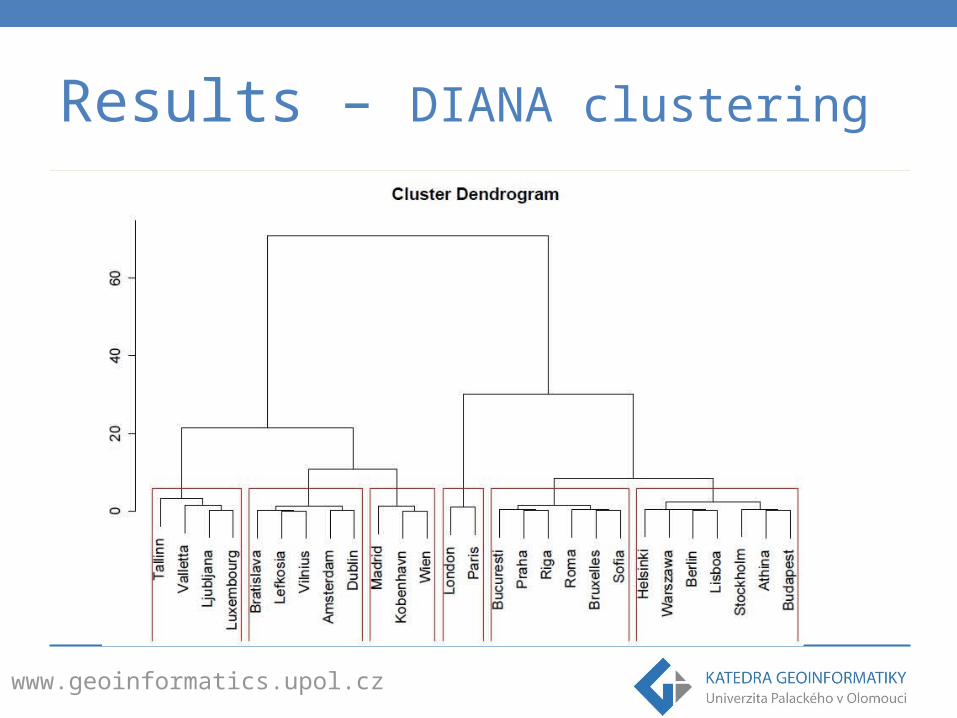
Results – DIANA clustering
• Hierarchichal clustering
• Tree structured dendrogram
• One starting cluster divided until each cluster contains one single object

www.geoinformatics.upol.cz
Results – DIANA clustering

www.geoinformatics.upol.cz
Results – Diana clustering

www.geoinformatics.upol.cz
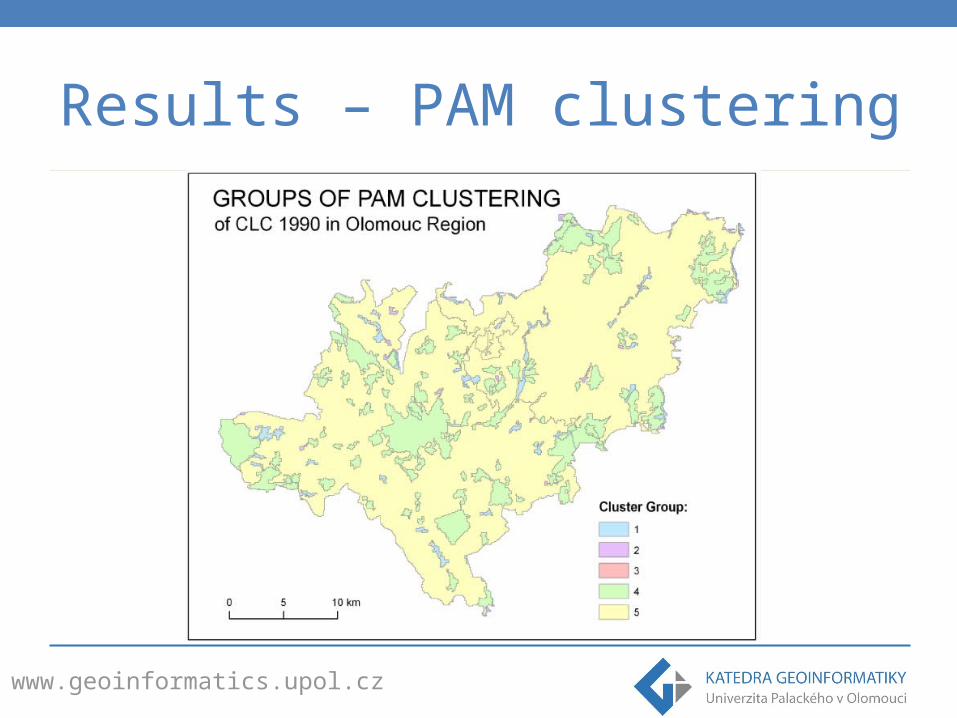
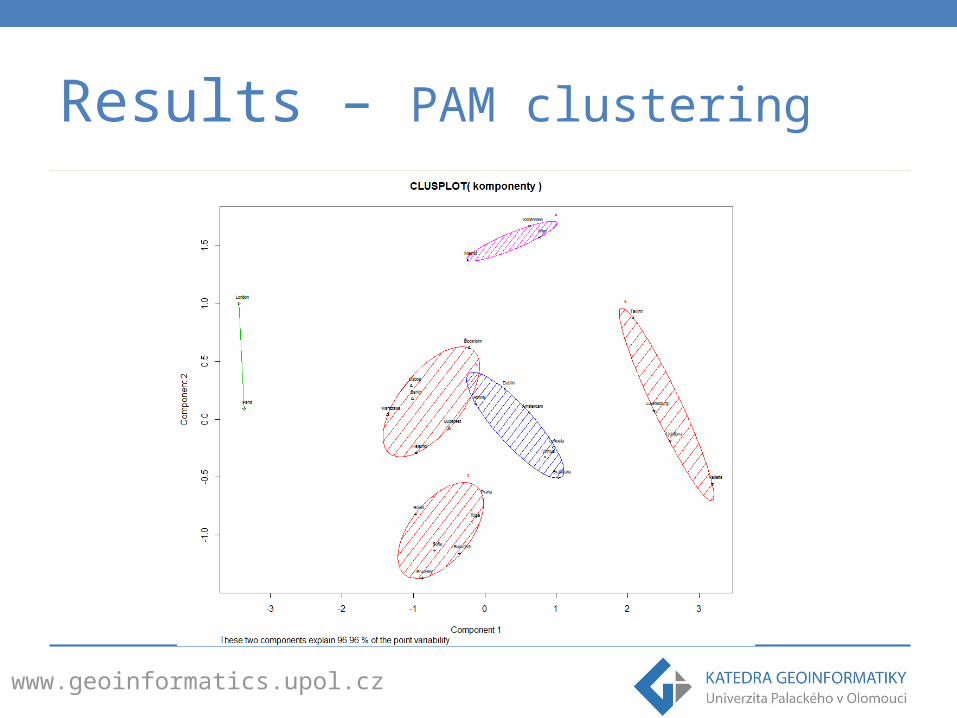
Results – PAM clustering
• Non-hierarchichal clustering
• „Scatterplot“ groups• Using medoids• Similar to K-means• More robust than K-
means

www.geoinformatics.upol.cz
Results – PAM clustering
www.geoinformatics.upol.cz
Results – PAM clustering
www.geoinformatics.upol.cz
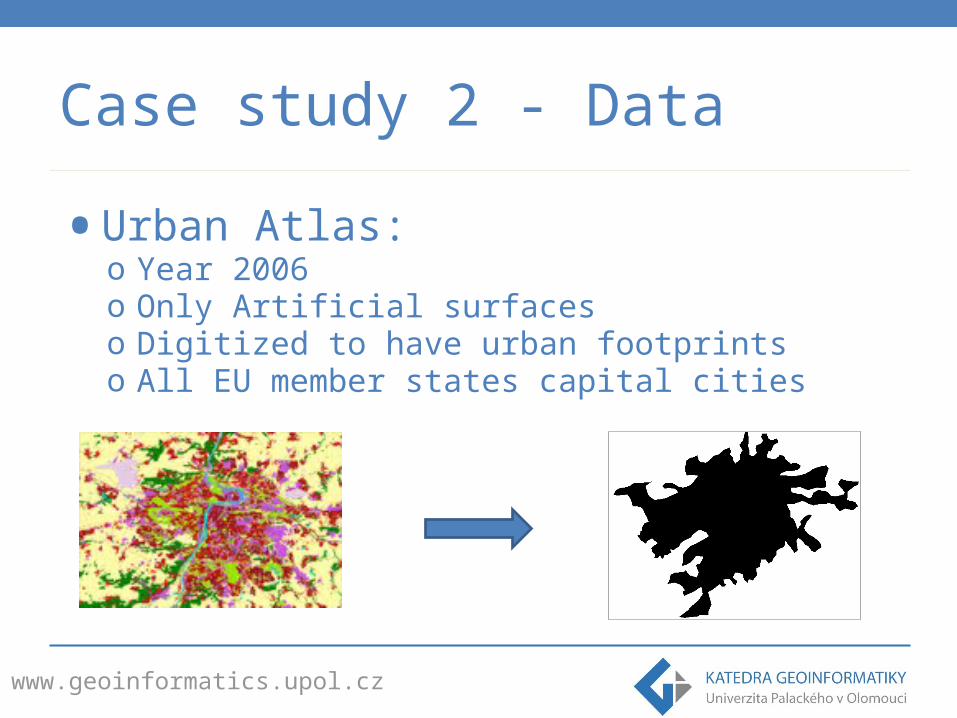
Case study 2 - Data
• Urban Atlas:o Year 2006o Only Artificial surfaceso Digitized to have urban footprintso All EU member states capital cities

www.geoinformatics.upol.cz
Case study 2
www.geoinformatics.upol.cz
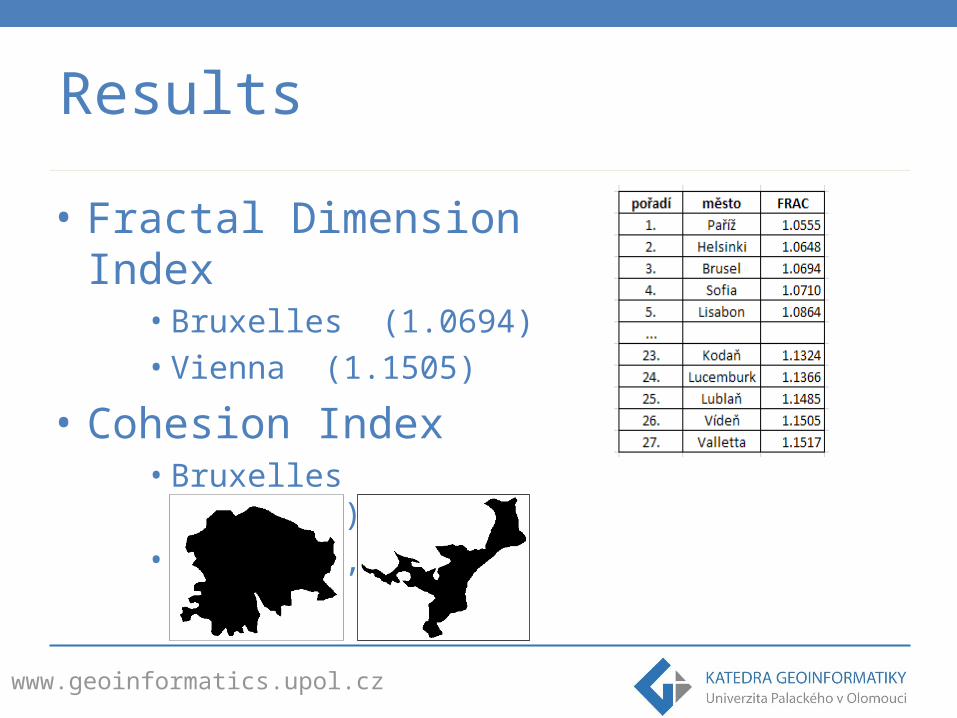
• Fractal Dimension Index• Bruxelles (1.0694) • Vienna (1.1505)
• Cohesion Index• Bruxelles (0,948875) • Tallin (0,636262)
Results

www.geoinformatics.upol.cz
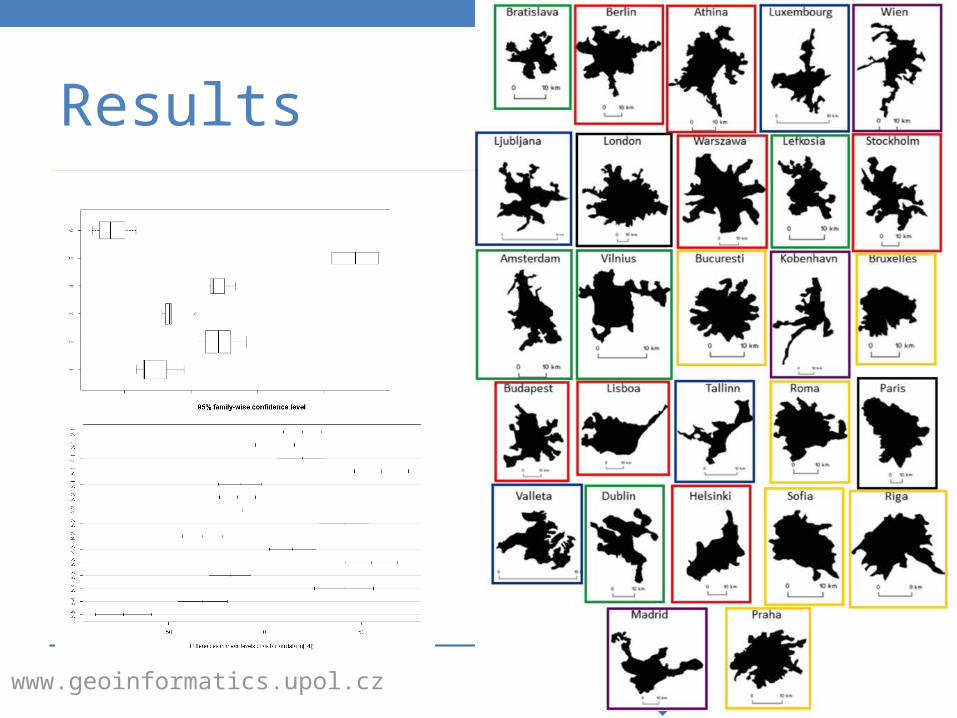
Results
• Elbow diagram (no. of clusters):
www.geoinformatics.upol.cz
Results – DIANA clustering
www.geoinformatics.upol.cz
Results – PAM clustering
www.geoinformatics.upol.cz
Results

www.geoinformatics.upol.cz
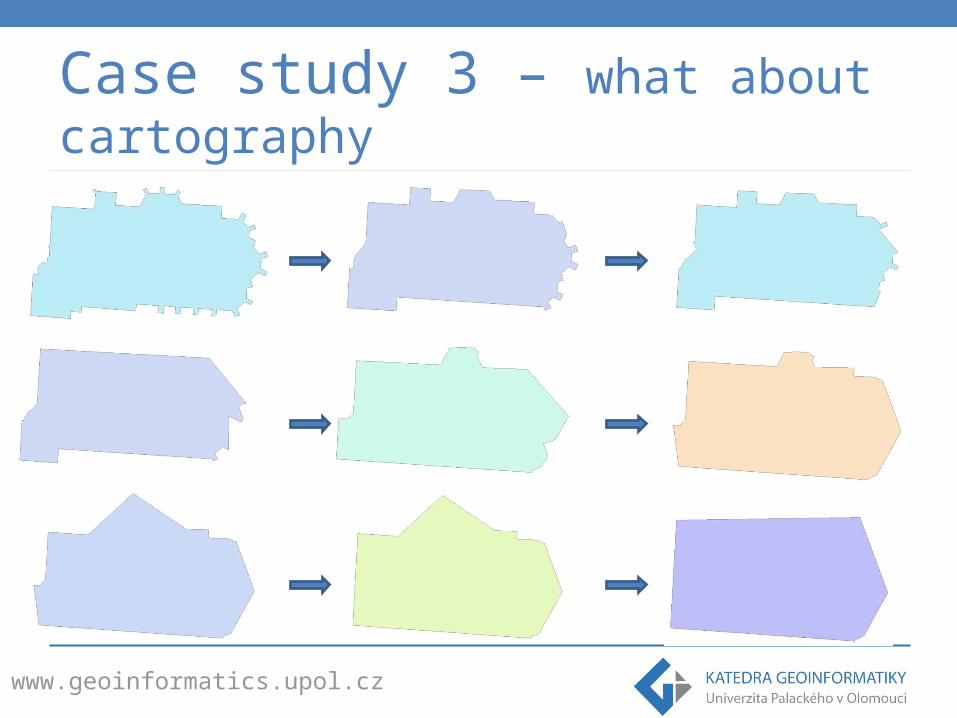
• An idea (to be done)• Church of st. Maurice
Case study 3 – what about cartography
www.geoinformatics.upol.cz
Case study 3 – what about cartography

www.geoinformatics.upol.cz
Case study 3 – what about cartography

www.geoinformatics.upol.cz
Conclusions & Discussion
• Shape Metrics are useful from quantitative point of view
• Tool for (semi)automatic shape recognition via clustering
• Double-edged and difficult interpretation• Strongly purpose-oriented• Geographical context is needed• Input data (raster&vector) sensitivity

www.geoinformatics.upol.cz
Conclusions & Discussion
• Not many reference studies to validate the results
• Shape metrics correlations• There is no consensus about shape metrics
use among the scientists• Proximity and Cohesion index – for centrality
analysis• Fractal dimension, Perim-area, Shape Index –
for line complexity evaluation
