www.diahome.org analytical comparability of a human igg1 from different manufacturing sites after...
TRANSCRIPT
www.diahome.org
Analytical comparability of a human IgG1 from different manufacturing sites after cell line switch and process changes: A case study
Dr. Margit Jeschke
Head Analytical R&D
Novartis Biologics

www.diahome.org
Disclaimer
The views and opinions expressed in the following PowerPoint slides are those of the individual presenter and should not be attributed to Drug Information Association, Inc. (“DIA”), its directors, officers, employees, volunteers, members, chapters, councils, Special Interest Area Communities or affiliates, or any organization with which the presenter is employed or affiliated.
These PowerPoint slides are the intellectual property of the individual presenter and are protected under the copyright laws of the United States of America and other countries. Used by permission. All rights reserved. Drug Information Association, DIA and DIA logo are registered trademarks or trademarks of Drug Information Association Inc. All other trademarks are the property of their respective owners.

3 | 2009 DIA Comparability | Jeschke M | 4-Feb-09
Outline
Introduction Molecular Challenges with mAb1NVS Results
• Purification Process Performance• Physicochemical tests• Biological characterization• Accelerated Stabilty Study• Preclinical & PK/PD
Summary Conclusions & Discussion Acknowledgements

4 | 2009 DIA Comparability | Comparability | Jeschke M | 4-Feb-09
Dru
g p
rod
uct hPoChPoC PhIIPhII PhIIIPhIII MarketMarket
DP
Prod. Site
50mg Lyo i.v. 150mg Lyo i.v. & s.c
Basel PharmOps
Site
Cell line
Launch site
SP2/0 CHO
Major change
Type A PoC quality
Type B PoC quality
Type CPrototype
Type EFinal market qualityQualities
Dru
g s
ub
stan
ceOverview mAb1NVS Drug Substance & Product
Type DPrototype
5 | 2009 DIA Comparability | Jeschke M | 4-Feb-09
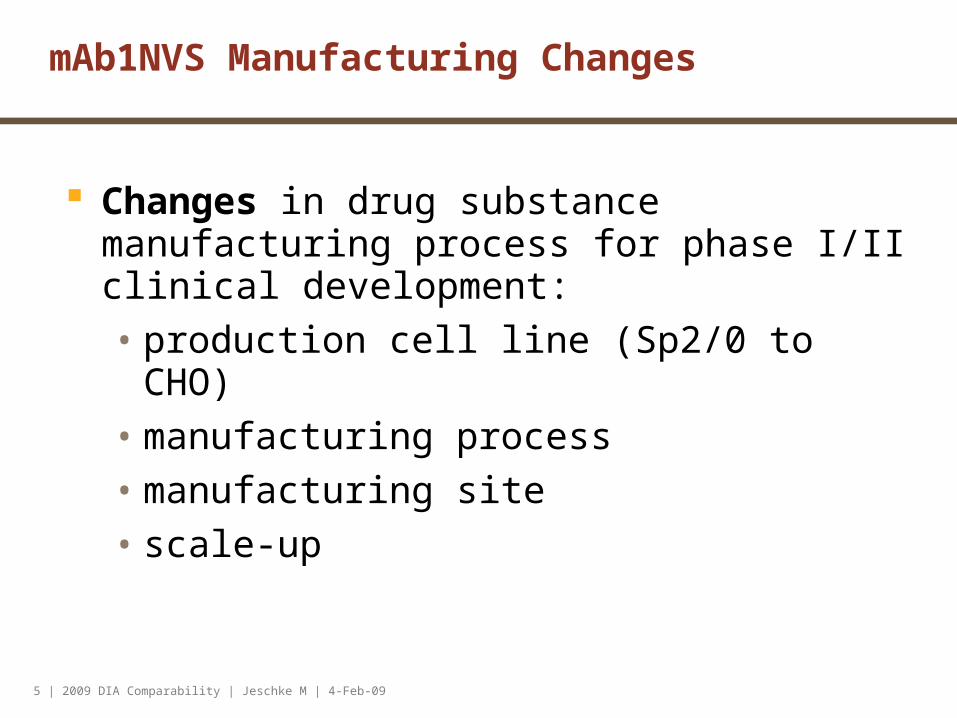
mAb1NVS Manufacturing Changes
Changes in drug substance manufacturing process for phase I/II clinical development:
• production cell line (Sp2/0 to CHO)
• manufacturing process
• manufacturing site
• scale-up

6 | 2009 DIA Comparability | Jeschke M | 4-Feb-09
Summary of Changes
Process 2 Process 3 Process 4 Process 5
Cell Sp2/0 Sp2/0 CHO CHO
Site
Scale 3’000L 3’000L 1’500L 13’000L
USP hTransferrin: Celliance
hTransferrin: Millipore
w/ yeastolate no transferrin
w/ yeastolate no transferrin
Harvest
DSP
Centrifugation + microfiltration
AEX CEX
Centrifugation + microfiltration
AEX CEX
Microfiltration
selective red. CEXAEX
Centrifugation + microfiltration
selective red. CEXAEX
Nanofiltration
at the end of purification
at the end of purification
at the end of purification
at early state Process 1: SP2/0

7 | 2009 DIA Comparability | Jeschke M | 4-Feb-09
Free thiol group required for biological activity
H-CDR3H-CDR1
H-CDR2
L-CDR3
L-CDR1
L-CDR2
LC-Cys-SH
Heavy chain (HC)
Light chain (LC)
X-ray structure of the mAb1NVS Fab fragment (2.80Å resolution)
Molecular Challenges

8 | 2009 DIA Comparability | Jeschke M | 4-Feb-09
production of biologically active antibody:
A: fermentation of active mAb, e.g. by reduction of the cystine concentration
B: modulation of activity during protein purification by treatment with reducing agents
cysteinylation interferes with antigen binding
Medium dependent biological activity
Medium A Prod.Komponenten mg/l mg/l
D-Glucose 2000 4500
Cupric sulfate (CuSO4-5H2O) 240nMFe(III)citrate 50uMNickel(II) Chloride 0.25Zinc sulfate (ZnSO4-7H2O) 225nM
Glutathione Reduced 1 5Mercaptoethanol 50uM 50uML-Cystine-2HCl 65.15 325.75
0
100
200
300
1 2 3 4 5
Tit
er
(mg
/L)
human IgGactive
108%
102%46%
17%10% active
medium: 2055 2071
0
100
200
300
1 2 3 4 5
Tit
er
(mg
/L)
human IgGactive mAB
108%
102%46%
17%10% active
medium: A Prod.

9 | 2009 DIA Comparability | Jeschke M | 4-Feb-09
More mAb1NVS idiosyncrasies
pre
sta
ine
d M
ark
er
3‘/
85
°C
no
t h
ea
ted
2‘
/ 6
0°C
1‘
/ 8
5°C
2‘
/ 8
5°C
10
‘/ 8
5°C
10
‘/ 8
5°C
- I
A
Xo
lair
3‘/
85
°C
Xo
lair
3‘/
85
°C -
IA
IA = treated with Iodoacetamide
Intact antibodyBy- and degradation products by SDS-PAGE (non-reducing)
Disulfide scrambling

10 | 2009 DIA Comparability | Jeschke M | 4-Feb-09
Overview mAb1NVS comparability exercise
Comparison of post-change product to pre-change product at different levels:
Com
para
bilit
y Safety and efficacy
PK/PD
Preclinical
Biological characterization
Physicochemical level
Not done
PK/PD in healthy volunteers
Tox studies in monkeys Tissue crossreactivity studies
Target binding & potency Fc Receptor binding
Comprehensive analytical characterization

11 | 2009 DIA Comparability | Jeschke M | 4-Feb-09
Batches for analytical comparability
Two representative drug substance batches from each process were chosen to assess:
the process performance (incl. IPC) physicochemical properties biological characterization: antigen binding, Fc receptor
binding, and potency accelerated stability (6 months)
Sp2/0 P2 Sp2/0 P3 CHO P4 CHO P5
SP2/0-S06 SP2/0-S07 CHO-B07 CHO-S07

12 | 2009 DIA Comparability | Jeschke M | 4-Feb-09
Outline
Introduction Molecular Challenges with mAb1NVS Results
• Purification Process Performance• Physicochemical tests• Biological characterization• Accelerated Stabilty Study• Preclinical & PK/PD
Summary Conclusions & Discussion Acknowledgements

13 | 2009 DIA Comparability | Jeschke M | 4-Feb-09
Purification Process Performance
Process performance - ProtA, HCP, DNA and yields:
• The single step efficiency is different
• Overall removal successful for all process related impurities
• Single step yields are different

14 | 2009 DIA Comparability | Jeschke M | 4-Feb-09
Test Requirement CHO-B07 A CHO-B07 B CHO-B07 C CHO-B07 D CHO-B07 E CHO-B07 F CHO-S07 A CHO-S07 B
Appearance of the solution: Turbidity
Clear to opalescent Opalescent Opalescent
Clear
Slightly opalescent
Slightly opalescent
Slightly opalescent
Slightly opalescent
Slightly opalescent
pH value 5.5 – 6.5 6.2 6.3 6.0 6.1 6.2 6.1 6.1 6.3
Assay by SEC [mg/ml]
60.0 64.9 64.6 66.0 66.6 65.2 64.4 71.6 69.4
free SH-groups [Mol/Mol]
≥ 2.0 2.6 2.6 2.5 2.5 2.5 2.6 2.3 2.2
Impurity by SDS-PAGE (reducing)
Sum of impurities ≤ 5.0 %
0.3 % <0.25 % <0.25 % <0.25 % 0.5 % 0.4 % 1.0% 1.0%
Related substances by SEC
aggregates: ≤ 5.0 % fragments: ≤ 5.0 %
0.3 % <0.1%
0.4 % <0.1%
0.4 % <0.1%
0.4 % <0.1%
0.5 % <0.1%
0.5 % 0.3%
0.3 % 0.0 %
0.2 % 0.0 %
Inhibition of IL-x release
80% - 125 % 97 % 96 % 108 % 99 % 98 % 99 % 94% 92 %
CHO HCPs Not yet defined n.p. < 1 ng/mg < 1 ng/mg < 1 ng/mg < 1 ng/mg < 1 ng/mg < 1 ng/mg < 1 ng/mg.
Protein A ELISA ≤ 5 [ng/mg AIN457] <1 <1 <1 <1 <1 <1 <1 <1
Residual DNA ≤ 8.3 pg/mg AIN457 n.p. < 2 < 2 < 2 < 2 < 2 < 2 < 2
MLT ≤ 10 [cfu/ml] n.p. <1 <1 <1 1 <1 0 0
BET ≤ 0.1 [EU/mg] < 0.0033 < 0.0033 < 0.0033 < 0.0033 < 0.0033 < 0.0033 < 0.01 0.02
Physicochemical characterization Release tests
All release requirements were met
Comparison of release data for mAb1NVS drug substance batches (CHO processes)
15 | 2009 DIA Comparability | Jeschke M | 4-Feb-09
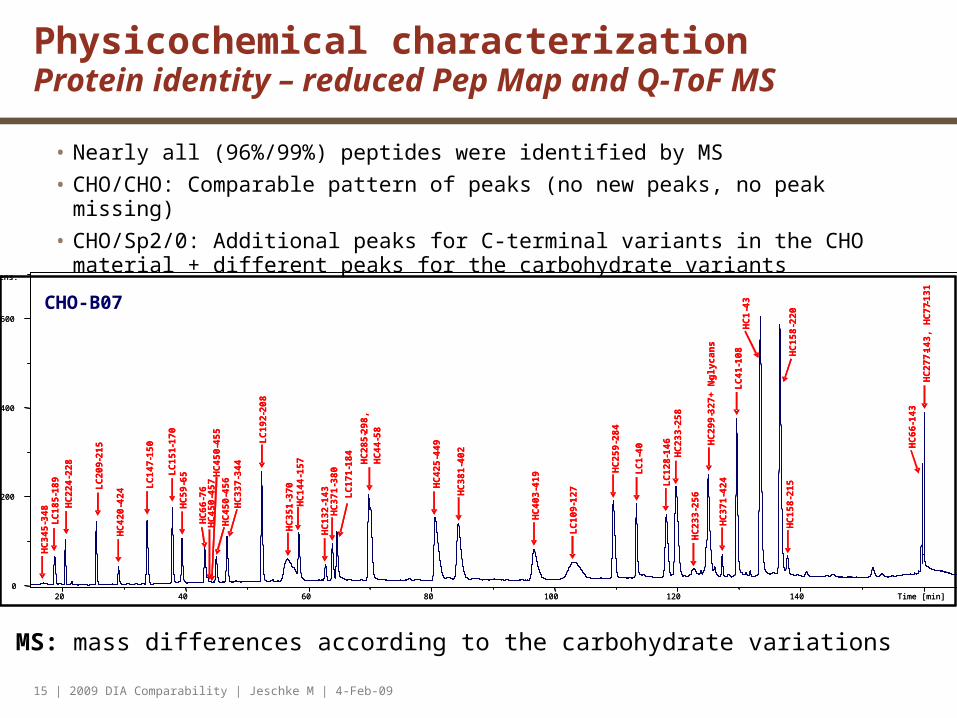
• Nearly all (96%/99%) peptides were identified by MS
• CHO/CHO: Comparable pattern of peaks (no new peaks, no peak missing)
• CHO/Sp2/0: Additional peaks for C-terminal variants in the CHO material + different peaks for the carbohydrate variants
Q-ToF MS: mass differences according to the carbohydrate variations
Physicochemical characterization Protein identity – reduced Pep Map and Q-ToF MS
20 40 60 80 100 120 140 Time [min]0
200
400
600
Intens.
CHO-B07
LC
147
-150
HC
224
-228
LC
209
-215
HC
420
-424
LC
185
-189
HC
345
-348
LC
151
-170
HC
59-6
5
HC
66-7
6
HC
450
-456
HC
450
-457
HC
450
-455 LC
192
-208
HC
144
-157
HC
132
-143
HC
285
-298
,H
C44
-58
HC
337
-344
HC
351
-370
HC
371
-380
LC
171
-184
HC
425
-449
HC
381
-402
HC
403
-419
LC
109
-127
HC
259
-284
LC
1-4
0
LC
128
-146
HC
233
-258
HC
233
-256
HC
299
-327
+ N
-gly
can
s
LC
41-1
08H
C1
-43
HC
158
-220
HC
158
-215
HC
371
-424
HC
66-1
43
HC
277
-143
, HC
77-1
31
20 40 60 80 100 120 140 Time [min]0
200
400
600
Intens.
LC
147
-150
HC
224
-228
LC
209
-215
HC
420
-424
LC
185
-189
HC
345
-348
LC
151
-170
HC
59-6
5
HC
66-7
6
HC
450
-456
HC
450
-457
HC
450
-455 LC
192
-208
HC
144
-157
HC
132
-143
HC
285
-298
,H
C44
-58
HC
337
-344
HC
351
-370
HC
371
-380
LC
171
-184
HC
425
-449
HC
381
-402
HC
403
-419
LC
109
-127
HC
259
-284
LC
1-4
0
LC
128
-146
HC
233
-258
HC
233
-256
HC
299
-327
+ N
-gly
can
s
LC
41-1
08H
C1
-43
HC
158
-220
HC
158
-215
HC
371
-424
HC
66-1
43
HC
277
-143
, HC
77-1
31
16 | 2009 DIA Comparability | Jeschke M | 4-Feb-09
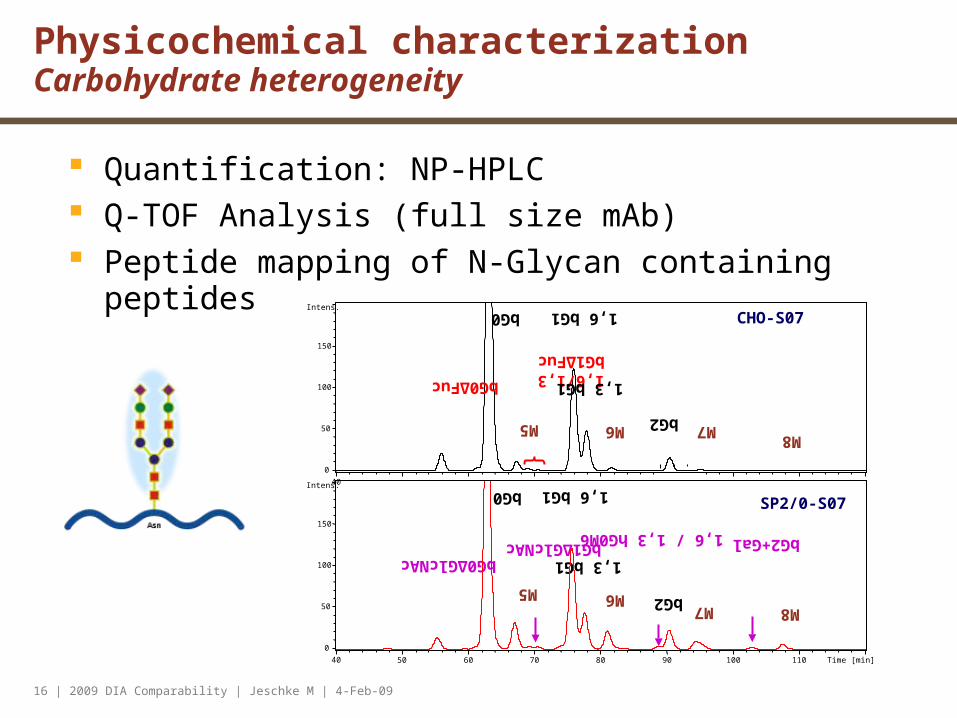
Quantification: NP-HPLC Q-TOF Analysis (full size mAb) Peptide mapping of N-Glycan containing peptides
Physicochemical characterization Carbohydrate heterogeneity
1,6 bG1
1,6 bG1
1,6 / 1,3 hG0M6
SP2/0-S07
bG0ΔGlcNAc
bG0
M5
bG1ΔGlcNAc 1,3 bG1
bG2 M6 M7 M8
bG2+Gal
50 60 70 80 90 100 110 Time [min]40
0
50
100
150
Intens.
1,6/1,3 bG1ΔFucCHO-S07
bG0ΔFuc
bG0
M5
1,3 bG1
bG2 M6 M7 M8
40
0
50
100
150
Intens.

17 | 2009 DIA Comparability | Jeschke M | 4-Feb-09
Only CHO material contains bG0/1/2 ΔFucose CHO material contains less high mannose forms Only Sp2/0 material contains bG0 ΔGlcNAc, bG1 ΔGlcNAc
0
5
10
15
20
25
bG
0-[F
uc]
bG
0-[G
lcN
Ac]
bG
0
Man
5
bG
1-[G
lcN
Ac]
1,3/
1,6
bG
1-[F
uc]
1,3/
1,6
bG
1-[F
uc]
1,6
bG
1
1,3
bG
1
Man
6
bG
2-[F
uc]
1,3/
1,6
hG
0M6
bG
2
Man
7
bG
2+G
al
M8
Sp2/0-S06
Sp2/0-S07
CHO-B07
CHO-S07
Physicochemical characterization Carbohydrate heterogeneity

18 | 2009 DIA Comparability | Jeschke M | 4-Feb-09
10.0 11.0 12.0 13.0 14.0 15.0 16.0 17.0 18.0 19.0 20.0 21.0 22.0 23.0 24.0 25.0 26.0 27.0 27.7
0.0
1.0
2.0
3.0
4.0
5.0
6.0
7.0
8.0
9.0
min
4
3
2
1
CHO -B07
Sp2/0 - S06
CHO -S07
Sp2/0 - S07
Aggregate – AP1
Monomer
Degradation products
10.0 11.0 12.0 13.0 14.0 15.0 16.0 17.0 18.0 19.0 20.0 21.0 22.0 23.0 24.0 25.0 26.0 27.0 27.7
0.0
1.0
2.0
3.0
4.0
5.0
6.0
7.0
8.0
9.0
min
4
3
2
1
CHO -
Sp2/0 -
CHO -
Sp2/0 -
Aggregate – AP1
Monomer
Degradation products
Physicochemical characterization Protein impurities - SEC
Same impurity profile

19 | 2009 DIA Comparability | Jeschke M | 4-Feb-09
0712
02
0712
03
0712
04
0712
05
0712
06
0621
01
0722
03
0722
04
Uns
tain
ed M
WM
40-5
00 K
Da
Uns
tain
ed M
WM
40-5
00 K
Da
500 KDa
290 KDa240 KDa
160 KDa
116 KDa
97 KDa
66 KDa
55 KDa
40 KDa
0712
02
0712
03
0712
04
0712
05
0712
06
0621
01
0722
03
0722
04
Uns
tain
ed M
WM
40-5
00 K
Da
Uns
tain
ed M
WM
40-5
00 K
Da
500 KDa
290 KDa240 KDa
160 KDa
116 KDa
97 KDa
66 KDa
55 KDa
40 KDa
07
120
2
07
120
3
07
120
4
07
120
5
07
120
6
06
210
1 S
p2
/0
07
220
3
07
220
4
Un
sta
ine
d M
WM
40-
50
0 K
Da
HHLL
HHL
HH
HL
H
07
120
2
07
120
3
07
120
4
07
120
5
07
120
6
06
210
1 S
p2
/0
07
220
3
07
220
4
Un
sta
ine
d M
WM
40-
50
0 K
Da CHO-S07CHO-
CHO-B07CHO-
HHLL
HHL
HH
HL
H
non blocked/non-reduced blocked/non-reduced
Physicochemical characterization Protein impurities - SDS-PAGE non-red. / silver stain
CHO-B07CHO- CHO-S07CHO-
20 | 2009 DIA Comparability | Jeschke M | 4-Feb-09
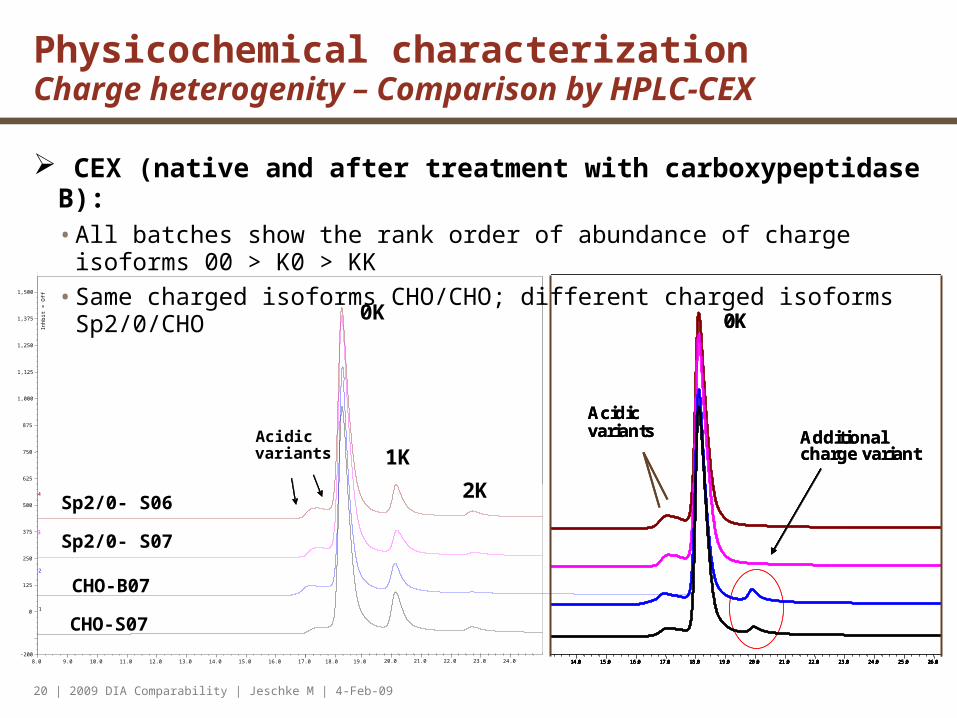
CEX (native and after treatment with carboxypeptidase B): • All batches show the rank order of abundance of charge isoforms 00 > K0 > KK
• Same charged isoforms CHO/CHO; different charged isoforms Sp2/0/CHO
Physicochemical characterization Charge heterogenity – Comparison by HPLC-CEX
Inhb
it =
Off
8.0-200
0
125
250
375
500
625
750
875
1,000
1,125
1,250
1,375
1,500
4
3
2
1
Sp2/0- S06
Acidic variants
CHO-B07
CHO-S07
9.0 10.0 11.0 12.0 13.0 14.0 15.0 16.0 17.0 18.0 19.0 20.0 21.0 22.0 23.0 24.0
Sp2/0- S07
0K
1K
2K
8.0 9.0 10.0 11.0 12.0 13.0 14.0 15.0 16.0 17.0 18.0 19.0 20.0 21.0 22.0 23.0 24.0 25.0 26.0 27.0 28.0 29.0 30.0-200
0
125
250
375
500
625
750
875
1,000
1,125
1,250
1,375
1,500
1,625
1,750
1,875
2,000mAU
min
WVL:220 nm
Acidicvariants
0K
Additional charge variant
8.0 9.0 10.0 11.0 12.0 13.0 14.0 15.0 16.0 17.0 18.0 19.0 20.0 21.0 22.0 23.0 24.0 25.0 26.0 27.0 28.0 29.0 30.0-200
0
125
250
375
500
625
750
875
1,000
1,125
1,250
1,375
1,500
1,625
1,750
1,875
min
8.0 9.0 10.0 11.0 12.0 13.0 14.0 15.0 16.0 17.0 18.0 19.0 20.0 21.0 22.0 23.0 24.0 25.0 26.0 27.0 28.0 29.0 30.0-200
0
125
250
375
500
625
750
875
1,000
1,125
1,250
1,375
1,500
8.0 9.0 10.0 11.0 12.0 13.0 14.0 15.0 16.0 17.0 18.0 19.0 20.0 21.0 22.0 23.0 24.0 25.0 26.0 27.0 28.0 29.0 30.0-200
0
125
250
375
500
625
750
875
1,000
1,125
1,250
1,375
1,500
1,625
1,750
1,875
2,000mAU
min
WVL:220 nm
Acidicvariants
0K
Additional charge variant
8.0 9.0 10.0 11.0 12.0 13.0 14.0 15.0 16.0 17.0 18.0 19.0 20.0 21.0 22.0 23.0 24.0 25.0 26.0 27.0 28.0 29.0 30.0-200
0
125
250
375
500
625
750
875
1,000
1,125
1,250
1,375
1,500
8.0 9.0 10.0 11.0 12.0 13.0 14.0 15.0 16.0 17.0 18.0 19.0 20.0 21.0 22.0 23.0 24.0 25.0 26.0 27.0 28.0 29.0 30.0-200
0
125
250
375
500
625
750
875
1,000
1,125
1,250
1,375
1,500
1,625
1,750
1,875
min

21 | 2009 DIA Comparability | Jeschke M | 4-Feb-09
Far UV Near UV
Physicochemical characterization Higher order structure – Circular dichroism spectroscopy
CD spectra of the four mAb1NVS batches are comparable

22 | 2009 DIA Comparability | Jeschke M | 4-Feb-09
Theoretical activity (%) of mAb1NVS drug substance batches based on cystamine derivatization
Sp2/0- S06 Sp2/0-S07 CHO-B07 CHO-S07
Total calculated activity [%] 96.7 97.3 96.7 97.8
Free SH group – calculated activityCystamine labeling / CEX
50
100
150
200
250
300
350
400
450
500
CHO-B07
Sp2/0 - S07
CHO-S07
Sp2/0 - S06
400
450
0.0 2.0 4.0 6.0 8.0 10.0 12.0 14.0 16.0 18.0 20.0 22.0 24.0 26.0 28.0 30.0 32.0 34.0 36.0 38.0 40.0 42.0 45.0-20 minmin
-
Sp2/0 -
-
-20.1 21.0 21.5 22.0 22.5 23.0 23.5 24.0 24.5 25.0 25.5 26.0 26.5 27.0 27.5 28.0 28.5 29.0 29.5 30.0 30.5 31.0 31.5 32.0 32.6
1.4
5.0
7.5
10.0
12.5
15.0
17.5
20.0
22.5
25.0
27.5
30.0
32.5
35.0
37.5
min
432
1
WVL:220 nm
50%
active
inactive
active
20.1 21.0 21.5 22.0 22.5 23.0 23.5 24.0 24.5 25.0 25.5 26.0 26.5 27.0 27.5 28.0 28.5 29.0 29.5 30.0 30.5 31.0 31.5 32.0 32.6
1.4
5.0
7.5
10.0
12.5
15.0
17.5
20.0
22.5
25.0
27.5
30.0
32.5
35.0
37.5
40.0
50%
active
inactive
active
23 | 2009 DIA Comparability | Jeschke M | 4-Feb-09
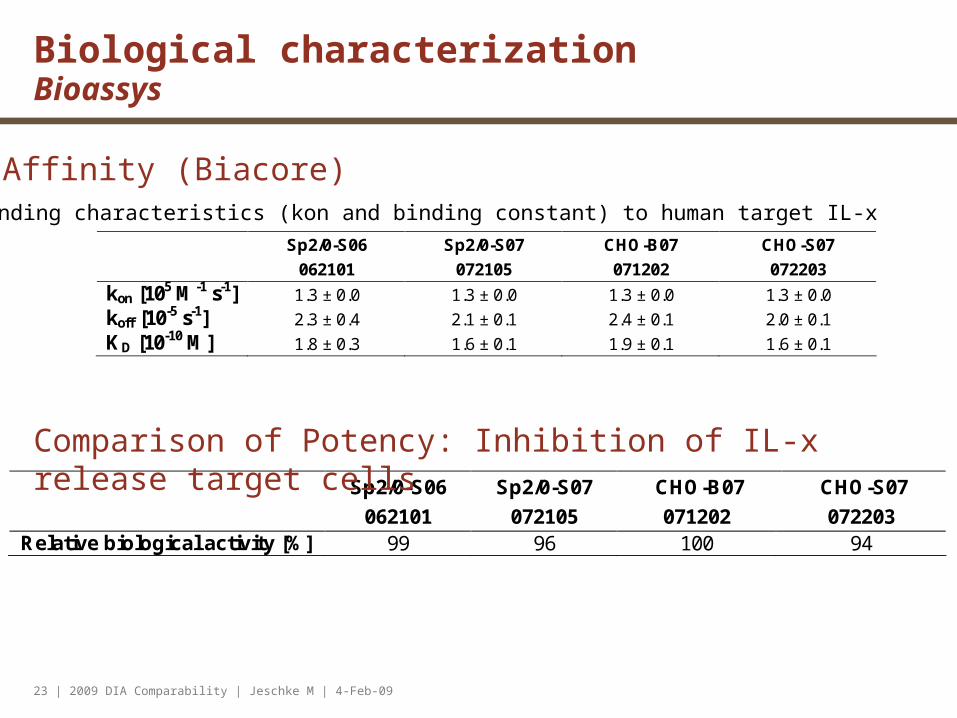
Sp2/0-S06 Sp2/0-S07 CHO-B07 CHO-S07
062101 072105 071202 072203
kon [105 M-1 s-1] 1.3 ± 0.0 1.3 ± 0.0 1.3 ± 0.0 1.3 ± 0.0
koff [10-5 s-1] 2.3 ± 0.4 2.1 ± 0.1 2.4 ± 0.1 2.0 ± 0.1
KD [10-10 M] 1.8 ± 0.3 1.6 ± 0.1 1.9 ± 0.1 1.6 ± 0.1
Binding characteristics (kon and binding constant) to human target IL-x
Sp2/0-S06 Sp2/0-S07 CHO-B07 CHO-S07
062101 072105 071202 072203 Relative biological activity [%] 99 96 100 94
Affinity (Biacore)
Comparison of Potency: Inhibition of IL-x release target cells
Biological characterization Bioassys
24 | 2009 DIA Comparability | Jeschke M | 4-Feb-09
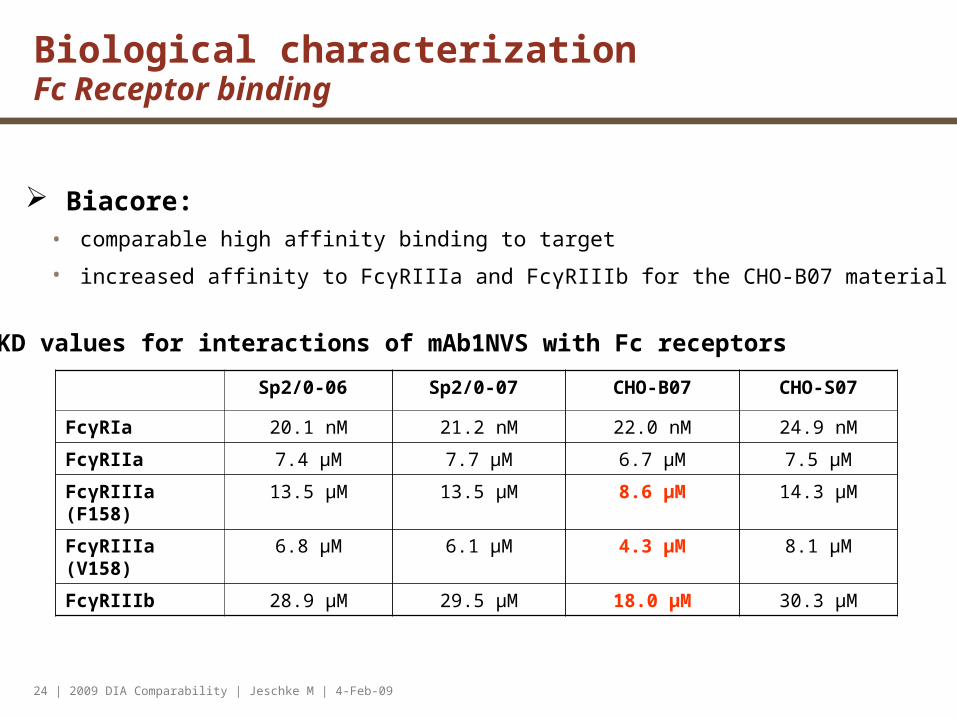
Biacore: • comparable high affinity binding to target
• increased affinity to FcγRIIIa and FcγRIIIb for the CHO-B07 material
Sp2/0-06 Sp2/0-07 CHO-B07 CHO-S07
FcγRIa 20.1 nM 21.2 nM 22.0 nM 24.9 nM
FcγRIIa 7.4 µM 7.7 µM 6.7 µM 7.5 µM
FcγRIIIa (F158) 13.5 µM 13.5 µM 8.6 µM 14.3 µM
FcγRIIIa (V158) 6.8 µM 6.1 µM 4.3 µM 8.1 µM
FcγRIIIb 28.9 µM 29.5 µM 18.0 µM 30.3 µM
KD values for interactions of mAb1NVS with Fc receptors
Biological characterization Fc Receptor binding

25 | 2009 DIA Comparability | Jeschke M | 4-Feb-09
Physicochemical and Biological characterization Comparability - summary
Analytical technique
Requirement
Result
CHO/CHO Sp2/0/CHO
Identity Non-reduced molecular weight by Q-ToF MS
Same molecular mass
Reduced Lys-C Pep Map Same peptides
Carbohydrates HPLC of enzymatically cleaved and derivatized glycan residues
Same carbohydrates
Bioactivity Inhibition of IL-x release Same inhibition Affinity constants for binding to target (Biacore)
Same binding constants
Binding to soluble Fc-receptors Biacore
Same binding constants
26 | 2009 DIA Comparability | Jeschke M | 4-Feb-09
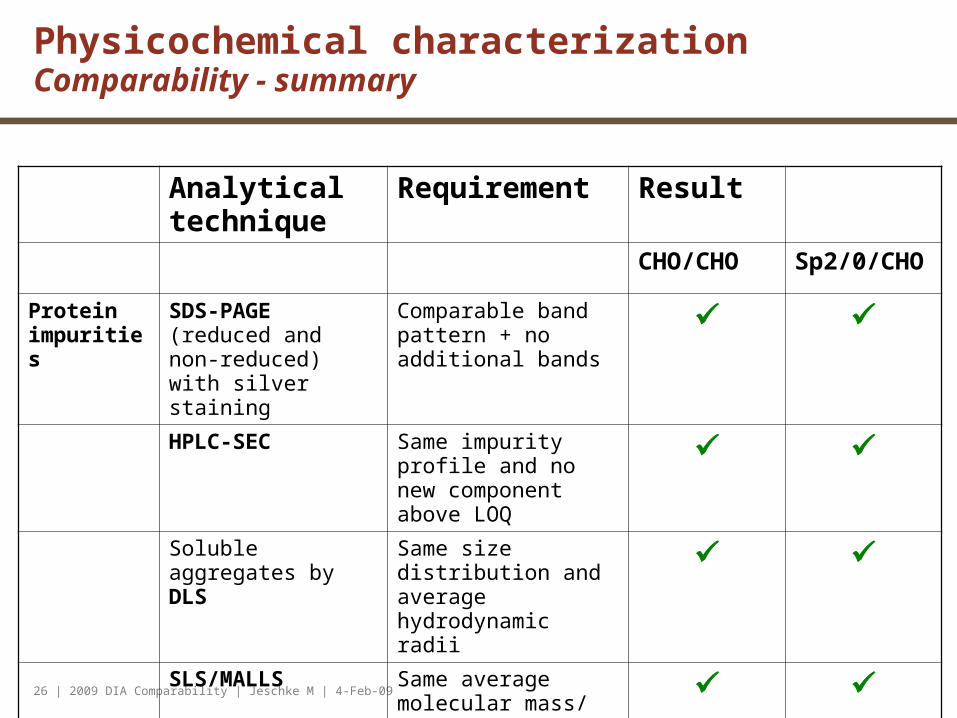
Physicochemical characterization Comparability - summary
Analytical technique
Requirement Result
CHO/CHO Sp2/0/CHO
Protein impurities
SDS-PAGE (reduced and non-reduced) with silver staining
Comparable band pattern + no additional bands
HPLC-SEC Same impurity profile and no new component above LOQ
Soluble aggregates by DLS
Same size distribution and average hydrodynamic radii
SLS/MALLS Same average molecular mass/ same distribution

27 | 2009 DIA Comparability | Jeschke M | 4-Feb-09
Physicochemical characterization Comparability - summary
Analytical technique
Requirement Result
CHO/CHO Sp2/0/CHO
Charge heterogenity
CEX undigested Same charge variants CEX digested Same charge variants IEF Same isoelectric points
Free SH-group Cystamine CEX Theoretical activity ≥ 90% for each batch
Ellman’s assay 2.2 to 2.8 Mol/Mol
Higher order structure
CD spectroscopy Same spectra

28 | 2009 DIA Comparability | Jeschke M | 4-Feb-09
storage condition
<-60°C (for comparison)
25°C / 60% RH 40°C/75% RH
6 weeks x x x
3 months - x x
6 months - x x
Short term stability program
Test performed for the head to head stability:
• SDS-PAGE
• SEC – Assay and Purity
• CEX
• Free SH groups
• Appearance / Color / pH
• Bioassay
Accelerated stability study Program and analytical Tests
29 | 2009 DIA Comparability | Jeschke M | 4-Feb-09
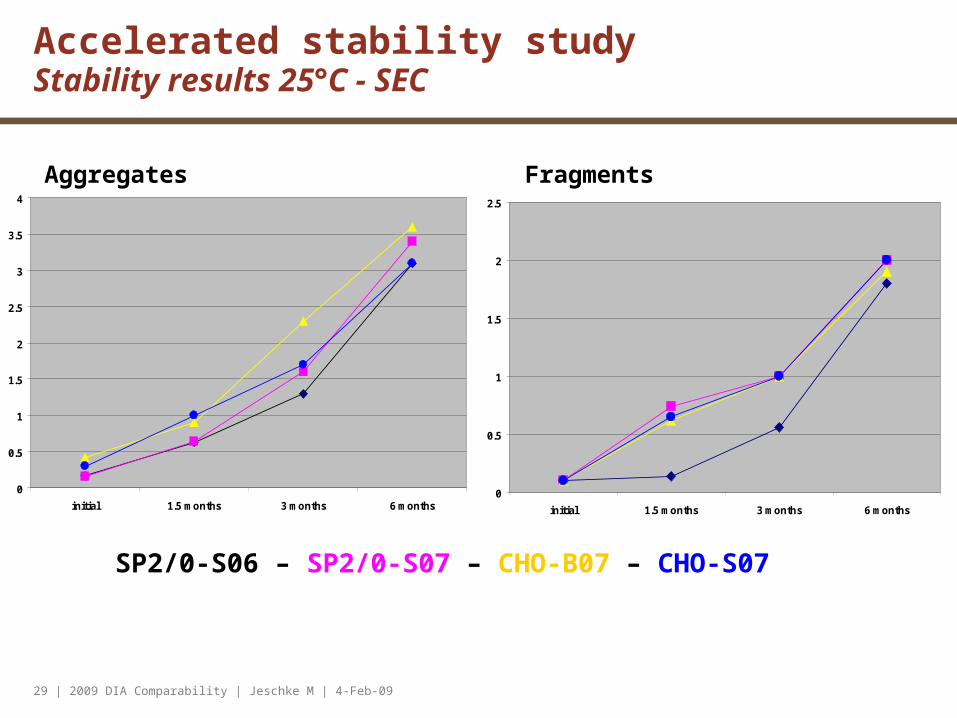
Accelerated stability study Stability results 25°C - SEC
SP2/0-S06 – SP2/0-S07 – CHO-B07 – CHO-S07
0
0.5
1
1.5
2
2.5
3
3.5
4
initial 1.5 months 3 months 6 months0
0.5
1
1.5
2
2.5
initial 1.5 months 3 months 6 months
Aggregates Fragments
30 | 2009 DIA Comparability | Jeschke M | 4-Feb-09
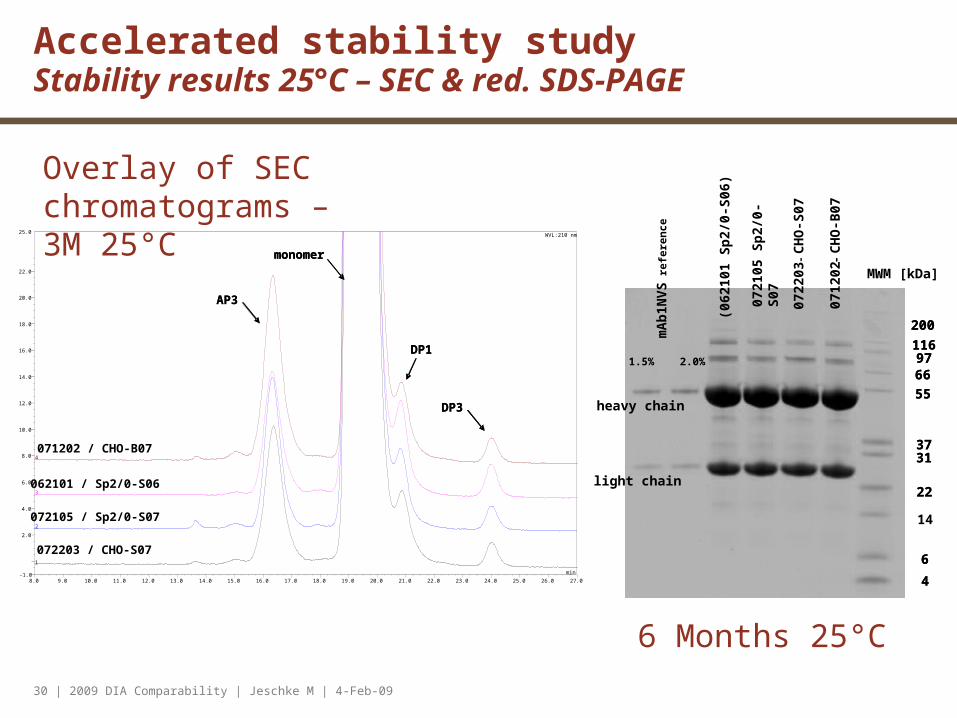
Accelerated stability study Stability results 25°C – SEC & red. SDS-PAGE
MWM [kDa]
light chain
heavy chain
mA
b1N
VS
ref
eren
ce
1.5% 2.0%
--
200
1169766
55
3731
22
14
6
4
200
1169766
55
3731
22
6
4
-
0721
05 S
p2/
0-S
07
(062
101
Sp
2/0-
S06
)
0722
03 C
HO
-S07
0712
02 C
HO
-B07
6 Months 25°C
062101 / Sp2/0-S06
AP3
DP3
DP1
monomer
8.0 9.0 10.0 11.0 12.0 13.0 14.0 15.0 16.0 17.0 18.0 19.0 20.0 21.0 22.0 23.0 24.0 25.0 26.0 27.0-1.0
2.0
4.0
6.0
8.0
10.0
12.0
14.0
16.0
18.0
20.0
22.0
25.0
min
4
3
2
1
WVL:210 nm
071202 / CHO-B07
072105 / Sp2/0-S07
072203 / CHO-S07
AP3
DP3
DP1
monomer
Overlay of SEC chromatograms – 3M 25°C

31 | 2009 DIA Comparability | Jeschke M | 4-Feb-09
5.0 6.0 7.0 8.0 9.0 10.0 11.0 12.0 13.0 14.0 15.0 16.0 17.0 18.0 19.0 20.0 21.0 22.0 23.0 24.0 25.0 26.0-30
100
200
300
400
500
600
700
800
900
1,000
1,100
1,200
1 - DM_080318_01 #11 [modified by mezzodo1]
min
4
3
2
1
CHO-B07 / 071202
Sp2/0 - 07 / 072105
CHO-S07 / 072203
Sp2/0 - S06 / 062101
700
800
900
1,000
1,100
1,200
1 - DM_080318_01 #11 [modified by mezzodo1]
min
4
3
2
1
samples stored for 3 months at 25°C/60% RH
Acidic variants Basic variants
0K
Accelerated stability study Stability results 3 months 25°C – CEX

32 | 2009 DIA Comparability | Jeschke M | 4-Feb-09
Accelerated stability study Stability results 25°C – Cell based functional bioassay
40
50
60
70
80
90
100
110
initial 1.5 months 3 months 6 months
Storage time [months]
Sp2/0-S06
Sp2/0-S07
CHO-B07
CHO-S07
initial 91 100 96 94
Storage at 25°C / 60% RH
1.5 74 95 95 105
3 76 85 92 103
6 55 68 85 88
Storage at 40°C / 75% RH
1.5 62 66 76 94
3 45 45 58 71
6 26 21 62 65 SP2/0-S06 – SP2/0-S07
CHO-B07 – CHO-S07
Bioassay

33 | 2009 DIA Comparability | Jeschke M | 4-Feb-09
Comparability – Summary & Conclusion
Process performance - ProtA, HCP and DNA: • The single step efficiencies are different especially for DNA
• Overall removal successful for all processes
Release testing: • All release requirements and additional comparability requirements met
Stability testing: • no critical observation for any stability parameter tested
Additional testing:• CHO-CHO: differences in amount of carbohydrates
• CHO-Sp2/0:
• Differences in amount and kind of carbohydrates
• Differences in binding strength to soluble Fc receptors
• Variations in charge heterogeneity
Analysis of the materials (CHO-CHO and CHO-Sp2/0) shows some differences

34 | 2009 DIA Comparability | Jeschke M | 4-Feb-09
Differences Sp2/0 process CHO CHO
Charge variants - Δ Lys – Gly variant- remaining charge variant after Lys digest
Carbohydrates - non-fucosylated variants
Higher amounts of ΔFucose variant
Binging to soluble FcRIIIb receptor
- slightly higher binding affinity
Processes Different efficiency in process impurity removal
Slightly lower efficiency in process impurity removal
Clinical studies PhI (Ph II) (Ph II)
Tox studies No immunogenicity was detected
No immunogenicity was detected
No immunogenicity detected
PK/PD x x x
Comparability – Summary Overview

35 | 2009 DIA Comparability | Jeschke M | 4-Feb-09
Additional studies
Tissue crossreactivity studies• Comparison of positive staining from human tissues treated with SP2/0 and CHO derived mAB1NVS
In vivo repeated dose toxicity studies• 4 week intravenous toxicity studies in cynomolgus monkeys (incl. 8 or 10 weeks recovery)
• All serum samples were analyzed for mAB1NVS by target-based and anti-idiotype competitive ELISA
PK and TK in cynomolgus monkey• pharmacokinetic single dose PK and 4 weeks tox studies in
cynomolgus monkeys (iv dosing) with SP2/0-derived material and CHO-derived material)

36 | 2009 DIA Comparability | Jeschke M | 4-Feb-09
Comparison of PK profiles of CHO- and Sp2/0-derived mAB1NVS Comparison of target-based and anti-idiotype ELISA assays
Similar profiles obtained with CHO- and Sp2/0-derived mAB1NVS
Co
nce
ntr
atio
n (
ug
/mL
)
PK - CHO cell
-50
50
150
250
350
450
1 2 3 4 7 10 14 21 28 36 42
Time after injection in days
Animal 1-Anti ID
Animal 1-Target
Animal 2 -Anti-ID
Animal 2 -Target
PK - SP2/O cell
0
50
100
150
200
250
300
350
400
450
0.003 1 2 3 4 7 10 14 21 28 36 42
Time after injection in days
con
cen
tart
ion
(u
g/m
l) Animal 3-Anti ID
Animal 3 -Target
Animal 4 -Anti-IDAnimal 4-Target
Single dose cyno PK study (10 mg/kg i.v.)

37 | 2009 DIA Comparability | Jeschke M | 4-Feb-09
Toxicokinetics
(SP2/0): doses: 0, 10, 30, 100 mg/kg
(CHO): doses: 0, 15, 50, 150 mg/kg
D1
iv
D8
iv
D22
iv
D15
iv
8 (SP2/0) or 10 (CHO) week recovery
D29
TK profile TK profile
2M+2F (dose groups 0 and 100/150 mg/kg)
4 weeks cyno tox studies (3M + 3F /group)

38 | 2009 DIA Comparability | Jeschke M | 4-Feb-09
Mean concentrations of mAb1NVS in cynomolgus serum and recovery phase
recovery males
Recovery females
SP2/0 CHO
t1/2, males = 13.7 dayst1/2, females = 20.0 days
t1/2, males = 11.6 dayst1/2, females = 14.6 days
Toxicokinetics
100
1000
10000
0 91
18
2
27
4
36
6
45
6
54
7
63
9
73
1
82
1
91
2
10
04
10
96
11
86
12
77
13
69
14
61
Time (h)
mA
b1N
VS
co
nce
ntr
atio
n (
µg
/mL
)
10
100
1000
10000
0 200 400 600 800 1000 1200 1400 1600 1800 2000
Time (hours)m
Ab
1N
VS
(u
g/m
L) Animal # 404 (M)
Animal # 405 (M)
Animal # 454 (F)
Animal # 455 (F)

39 | 2009 DIA Comparability | Jeschke M | 4-Feb-09
Are they comparable ???
„comparable does not mean identical“FDA. August 16, 2004 (Vol 69, # 157, Pages 50386ff); Scientific Considerations
Related to Developing Follow-on Protein Products

40 | 2009 DIA Comparability | Jeschke M | 4-Feb-09
- Paul-Ehrlich-Institute (2008)
“During characterization of the drug substance a change to the glycosylation pattern was observed during the comparability exercise. Although it was demonstrated, that the difference in glycosylation obviously had no effect on the biological function, one can not exclude that there might be an immunogenic potential of the new glycans, which were identified in the CHO-derived material and therefore glycosylation should currently be part of the release specifications in order to demonstrate batch to batch consistency.”

41 | 2009 DIA Comparability | Jeschke M | 4-Feb-09
In-depth analytical characterization and understanding of critical quality attributes is key to successful comparability
Perform risk assessment for planned changes and discuss implications upfront
Release Specs alone are inadequate to show no impact of change. Perform side-by-side analysis whenever possible
Keep retain samples of all batches and as long as possible
overload IEF / SDS-PAGE or silver stain to see low amount impurities.
Use exact same samples used for IPC analysis
Same test methods – otherwise describe differences
Explain differences well (incl. variation of methods used)
In the discussion of differences consider intended purpose
Lessons learned

42 | 2009 DIA Comparability | Jeschke M | 4-Feb-09
ACKNOWLEDGEMENTS
Manuela SchärpfChristoph BächlerCornelius FritschGeorg HölzlSteffen PahlichIso LengwilerManuel DiezMarc HasselHui Zhao Gerard BruinMarkus BlümelMichaela DehioYuan Xu

43 | 2009 DIA Comparability | Jeschke M | 4-Feb-09
Novartis Biologics, Basel, Switzerland
Basel
Novartis