www.cuny.edu/energy cuny energy institute city college of new york 160 convent avenue, st-329 new...
TRANSCRIPT

www.cuny.edu/energyCUNY Energy InstituteCity College of New York160 Convent Avenue, ST-329New York, NY 10031
Sustainable Energy Futures
Sanjoy BanerjeeDistinguished Professor of Chemical Engineering
Director, the CUNY Energy InstituteThe City College of New [email protected]

US Bulk Energy Flows: 80% Energy Fossil Fuel
© 2011 All Rights Reserved

US Bulk Carbon Flow: Fossil Fuels Generate Almost 100% Energy-Related Emissions
© 2011 All Rights Reserved

Global Need for Affordable Energy: Growth in Demand Concentrated in Non-OECD Countries
© 2011 All Rights Reserved
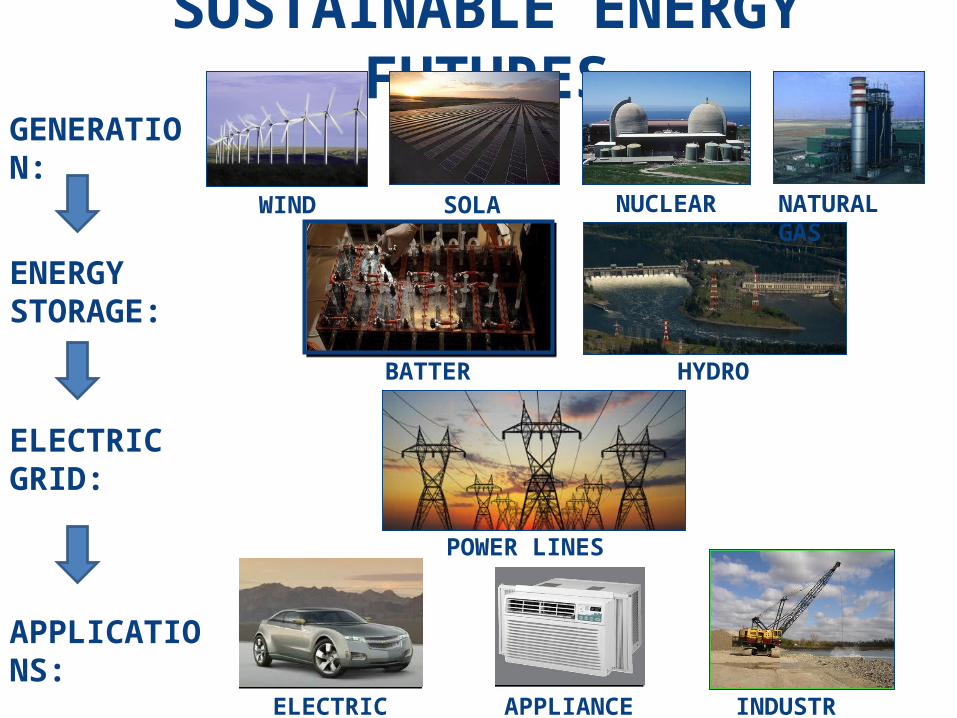
SUSTAINABLE ENERGY FUTURES
WIND SOLAR NUCLEAR
GENERATION:
ENERGY STORAGE:
HYDROBATTERY
ELECTRIC CAR INDUSTRYAPPLIANCES
APPLICATIONS:
ELECTRIC GRID:
POWER LINES
NATURAL GAS

A Potential Energy Strategy (With a Reduced Carbon Footprint)
• Production side: new electricity generation capacity with ‘clean’ coal, nuclear and renewable sources (intermittent!)
• Demand side: more efficient energy and capacity use via storage technologies for load leveling/peak shaving and to enable use of renewable sources


Energy Cost Estimates
© 2011 All Rights Reserved
Global GDP: $63,000,000,000,000Energy Consumption: 517,000,000 TJMaximum $/E: $120/TJ = $0.44/kWh
Energy Costs at 10% of GDP (Usually Ideal)US: $.043/kWhGermany: $.068/kWhIndia/China: $.018/kWh
These figures represent an desirable bound on the acceptable cost of energy generation. Renewable energy may be somewhat more expensive in special circumstances.
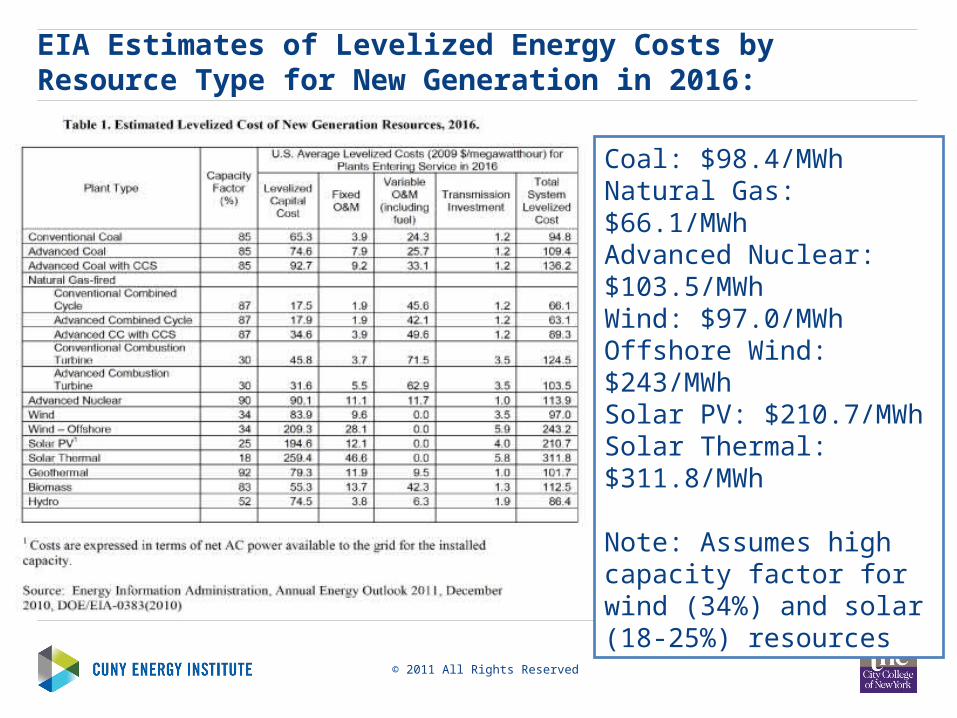
EIA Estimates of Levelized Energy Costs by Resource Type for New Generation in 2016:
© 2011 All Rights Reserved
Coal: $98.4/MWhNatural Gas: $66.1/MWhAdvanced Nuclear: $103.5/MWhWind: $97.0/MWhOffshore Wind: $243/MWhSolar PV: $210.7/MWhSolar Thermal: $311.8/MWh
Note: Assumes high capacity factor for wind (34%) and solar (18-25%) resources
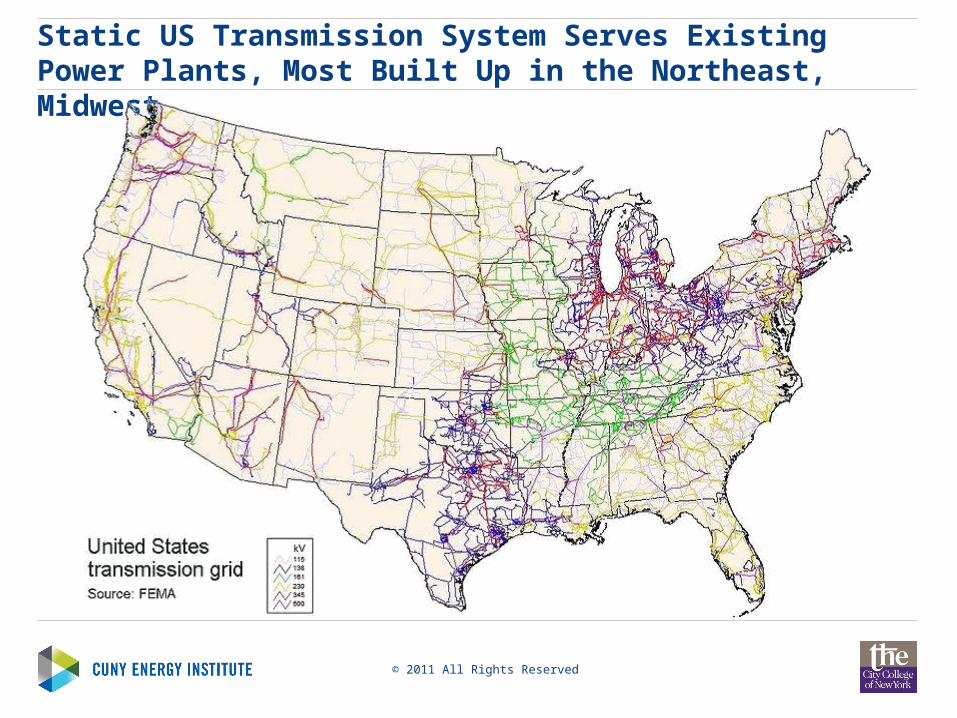
Static US Transmission System Serves Existing Power Plants, Most Built Up in the Northeast, Midwest
© 2011 All Rights Reserved

Diffuse Renewables Do Not Coincide with Existing Grid: Solar Resources in South, West
© 2011 All Rights Reserved
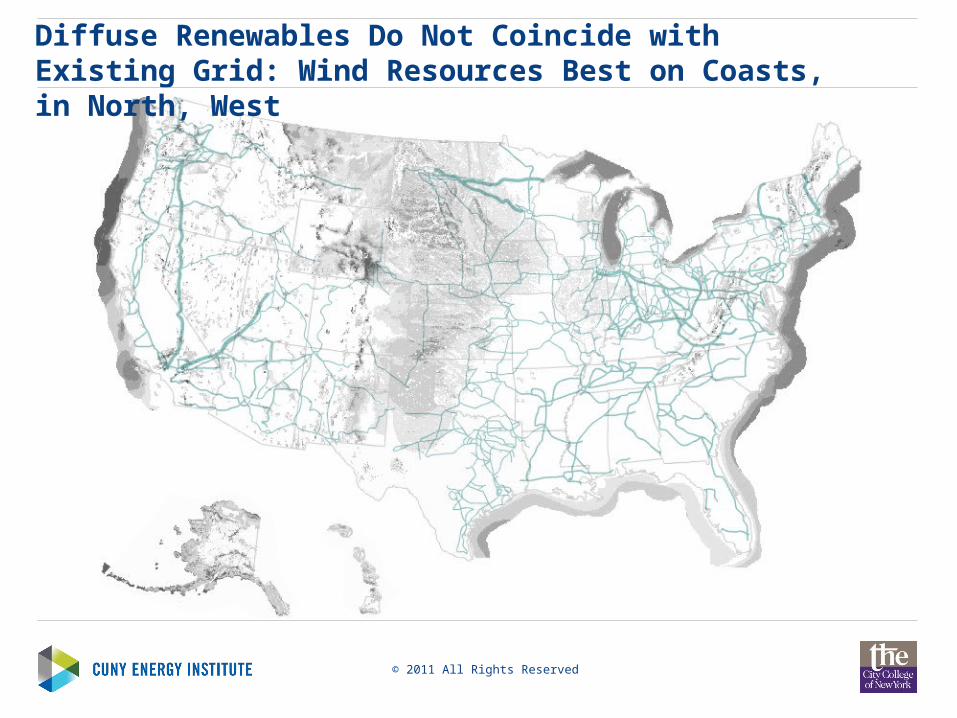
Diffuse Renewables Do Not Coincide with Existing Grid: Wind Resources Best on Coasts, in North, West
© 2011 All Rights Reserved

Carbon Sequestration: Deep Saline Aquifers, Oil and Gas Fields, and Coal Beds for Geological Storage of CO2
James R. Katzer, “The Future of Coal-Based Power Generation” Chem. Eng. Progress, 104 (3), pp. S15-S22 (Mar. 2008). Copyright AIChE. Used with permission.

Battery review: what is a rechargeable battery ?

Electricity Storage Technologies
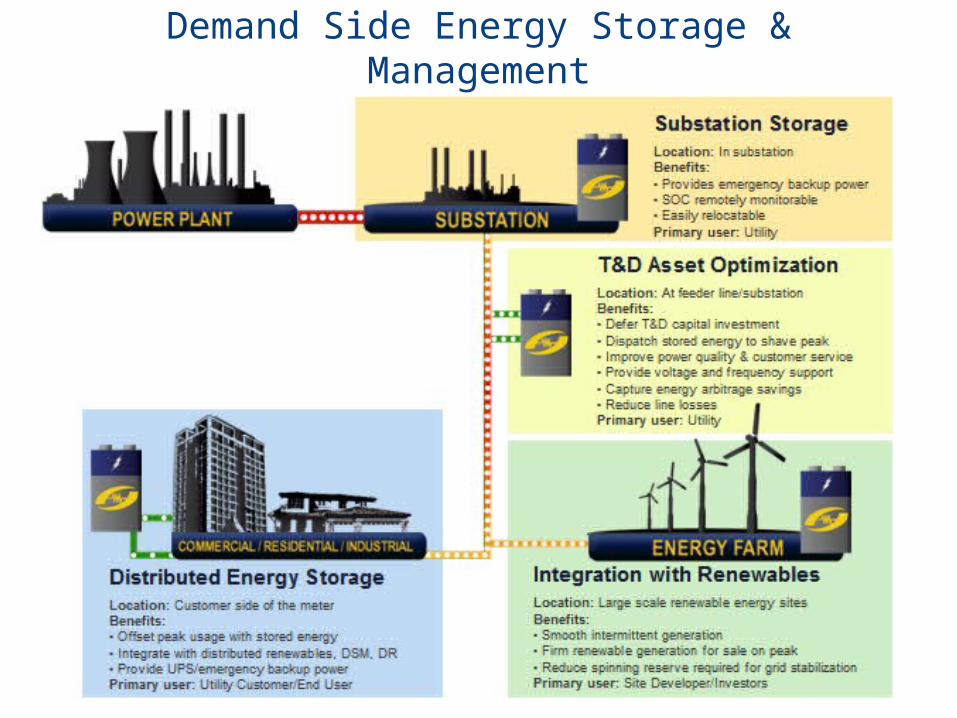
Demand Side Energy Storage & ManagementLoad Leveling, Peak Shaving, Enabling Renewables

Cost comparison per unit energy (2008)
© 2011 All Rights Reserved
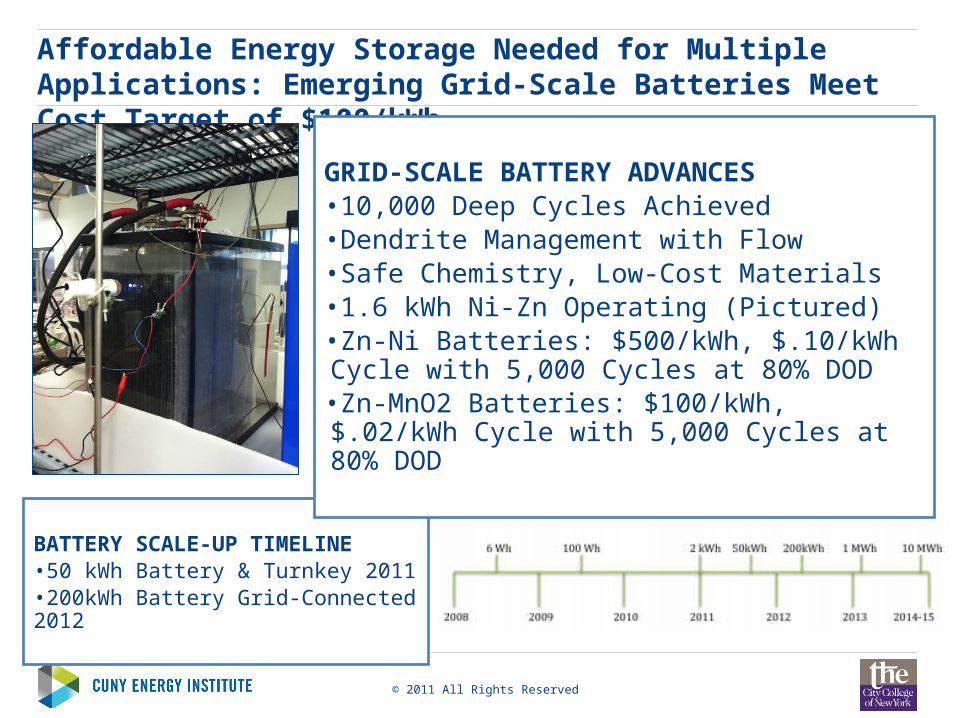
Affordable Energy Storage Needed for Multiple Applications: Emerging Grid-Scale Batteries Meet Cost Target of $100/kWh
BATTERY SCALE-UP TIMELINE•50 kWh Battery & Turnkey 2011•200kWh Battery Grid-Connected 2012
GRID-SCALE BATTERY ADVANCES•10,000 Deep Cycles Achieved•Dendrite Management with Flow•Safe Chemistry, Low-Cost Materials•1.6 kWh Ni-Zn Operating (Pictured)•Zn-Ni Batteries: $500/kWh, $.10/kWh Cycle with 5,000 Cycles at 80% DOD•Zn-MnO2 Batteries: $100/kWh, $.02/kWh Cycle with 5,000 Cycles at 80% DOD

© 2011 All Rights Reserved
Zinc Anode Rechargeable Batteries: Safe, Non-Flammable, Low-Cost, Long Cycle Life Energy Storage Solutions

CONCLUSIONS
• oil use must be reduced for a sustainable future• substitution of oil by electricity generated from
diverse sources is a viable alternative• renewable sources are attractive but must be
reduced in cost • requires developments of electricity storage
technologies to also be reduced in cost and of increased reliability
• Development/deployment of new electrochemical storage technologies both for mobile assets and stationary assets is essential.

ENERGY CONSUMPTION & CO2PROD)/$GDP (PURCHASING POWER PARITY)
BTU & (MT.E-3)/US $ (2000)
COUNTRY 1980 2004
USA 15.72/.92 9.336/.55SWEDEN 13.63/.57 9.356/.24ITALY 6.818/.41 6.044/.35CHINA 23.54/1.9 9.080/.72INDIA 4.341/.31 4.205/.30

Wind, heat pumps,…
Biofuels
Coal
Oil
Hydroelectric
Nuclear
Largest changes since 1970:
- Total increase by almost 50%
- Large reduction of oil
- Large increase of nuclear
- Large increase of bio
Changes in energy supply in Sweden 1970 - 2004
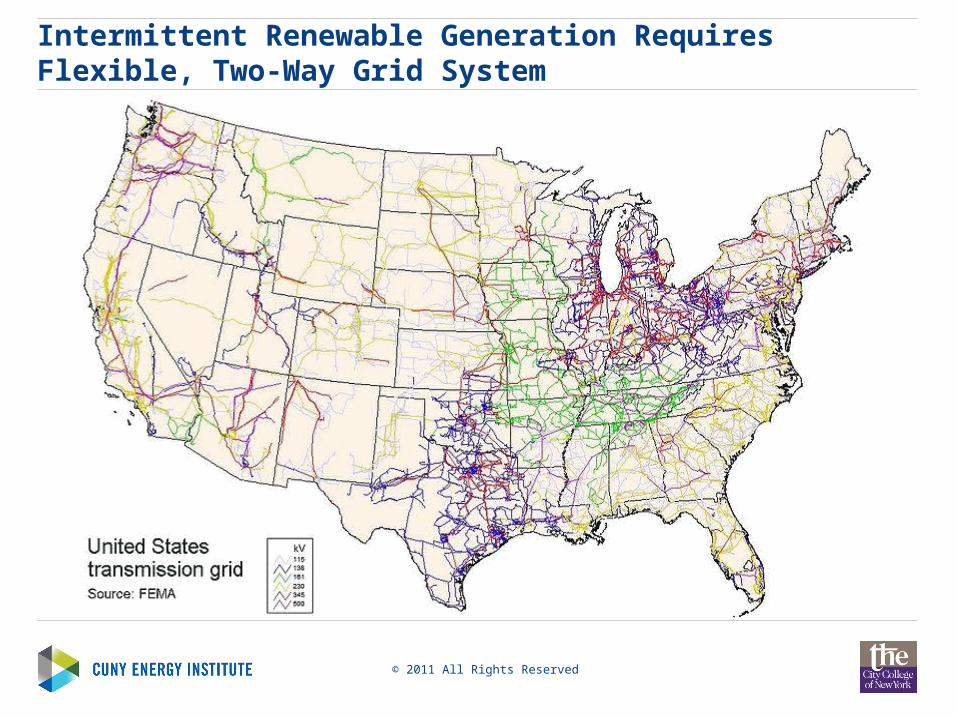
Intermittent Renewable Generation Requires Flexible, Two-Way Grid System
© 2011 All Rights Reserved

Increased Generation from Renewables and Natural Gas
© 2011 All Rights Reserved

Comparison of Flow batteries
Vanadium Zinc Bromine PSB Cerium
Typical power range (MW) < 3 < 1 < 15 n/a
Typical size range (MWh) 0.5 - 5 0.001 - 5 0 - 120 n/a
Energy density (Wh/l) 16 - 33 60 - 90 20 – 30 25 -40
Cycle efficiency 70 - 85 65 - 75 60 - 75 n/a
Cycle life (cycles) > 12,000 > 2,000 n/a n/a
Life time (years) 5 - 10 5 - 10 15 n/a
Stage of development Demonstration/ commercial
Demonstration/ commercial
Demonstration Demonstration
Companies involved VRB, SEI, Pinnacle, Cellenium
ZBB, Premium Power
TVA, VRB Plurion
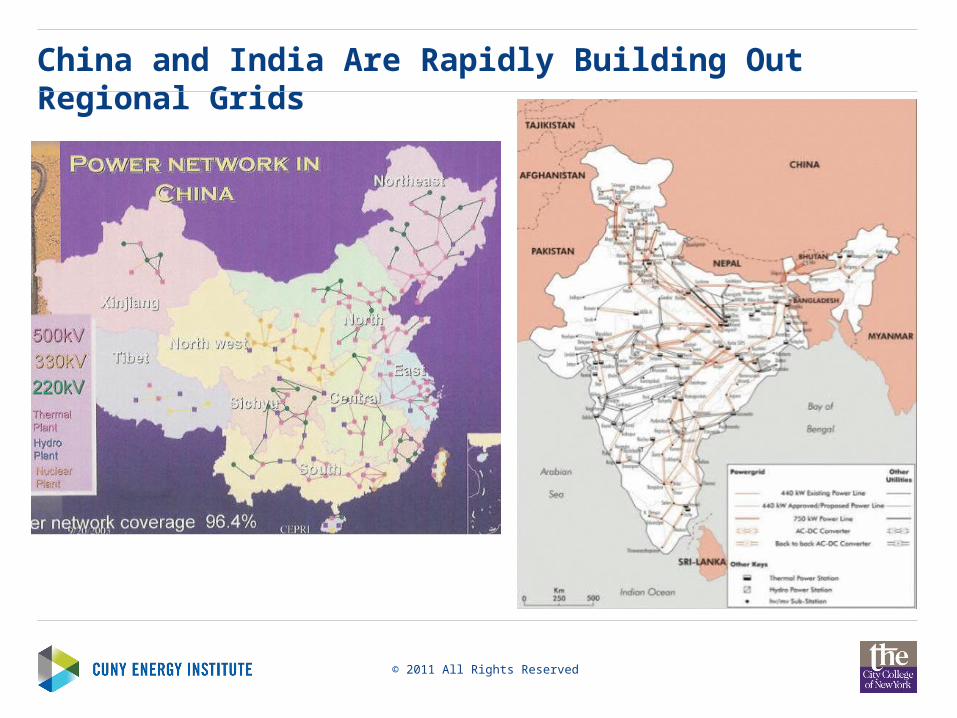
China and India Are Rapidly Building Out Regional Grids
© 2011 All Rights Reserved
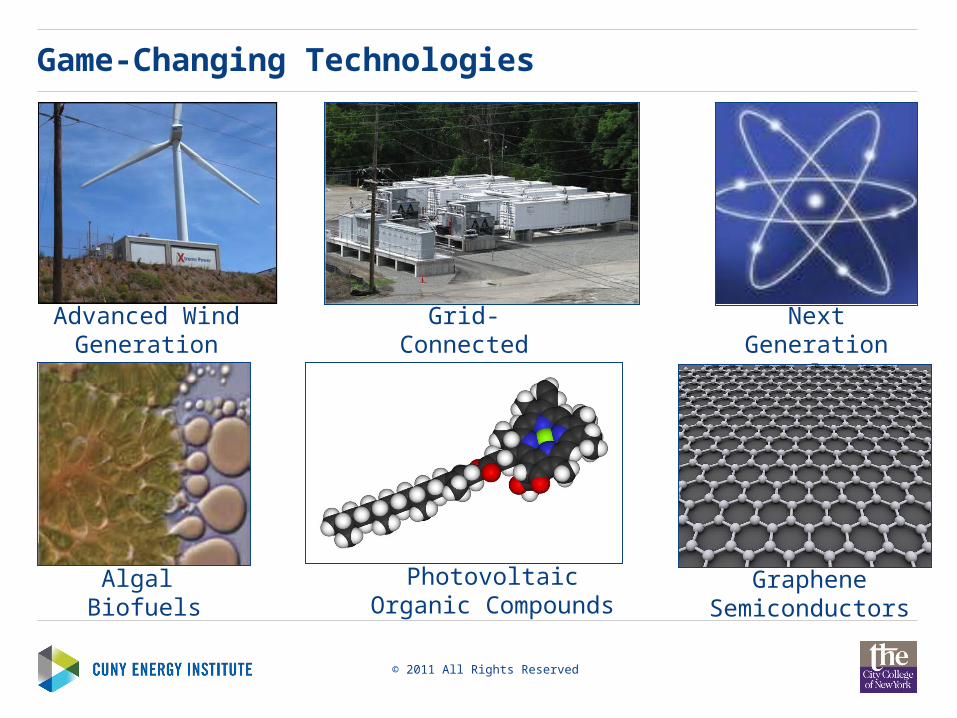
Game-Changing Technologies
© 2011 All Rights Reserved
Next Generation Nuclear Power
Grid-Connected Electricity Storage
Advanced Wind Generation
Photovoltaic Organic Compounds
Graphene Semiconductors
Algal Biofuels