www.broward.org/climatechange climate change and water resources presentation to the west palm beach...
TRANSCRIPT
www.broward.org/climatechange
Climate Change and Water Resources
Presentation to the West Palm Beach Green Task ForceMay 6, 2010
Nancy J. Gassman, Ph.D.Natural Resources Administrator
Broward County Environmental Protection and Growth Management Department
www.broward.org/climatechange
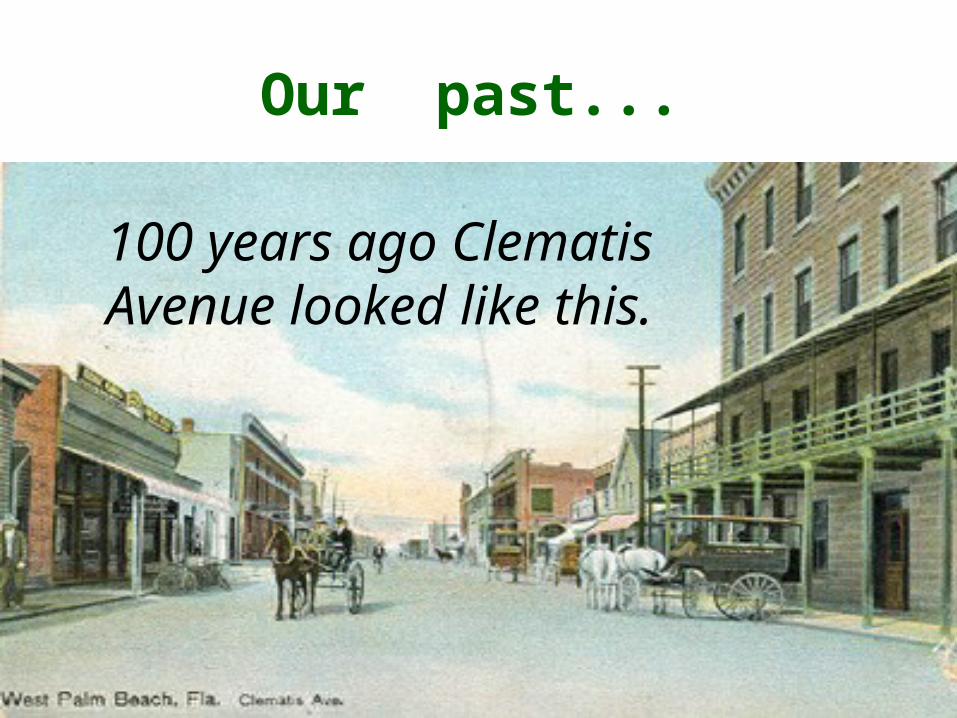
Our past...
100 years ago Clematis Avenue looked like this.
www.broward.org/climatechange
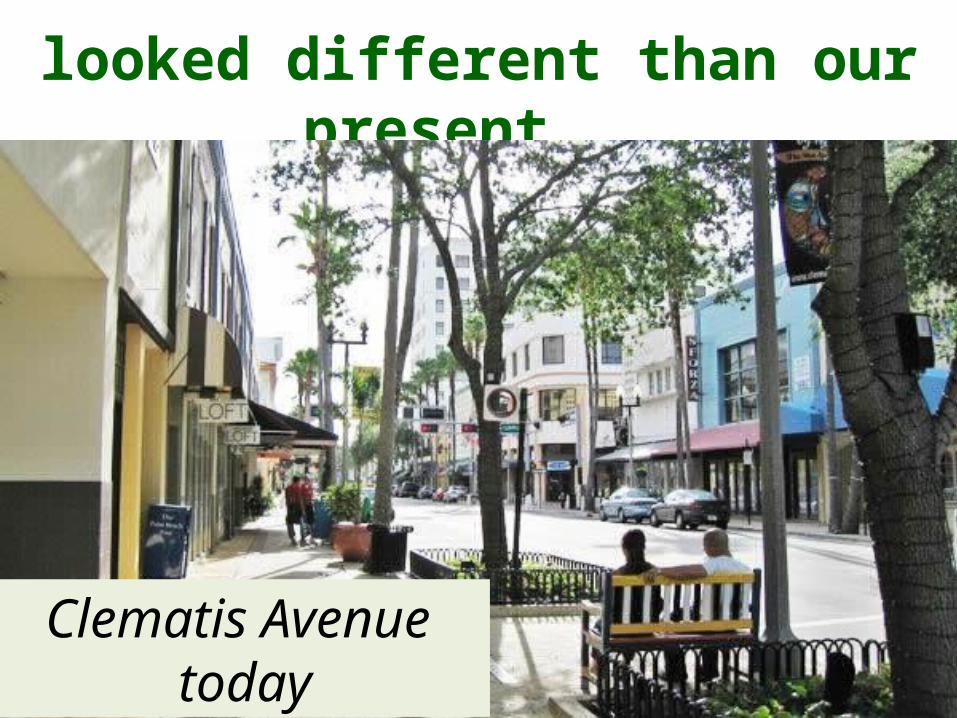
looked different than our present...
Clematis Avenue today
www.broward.org/climatechange
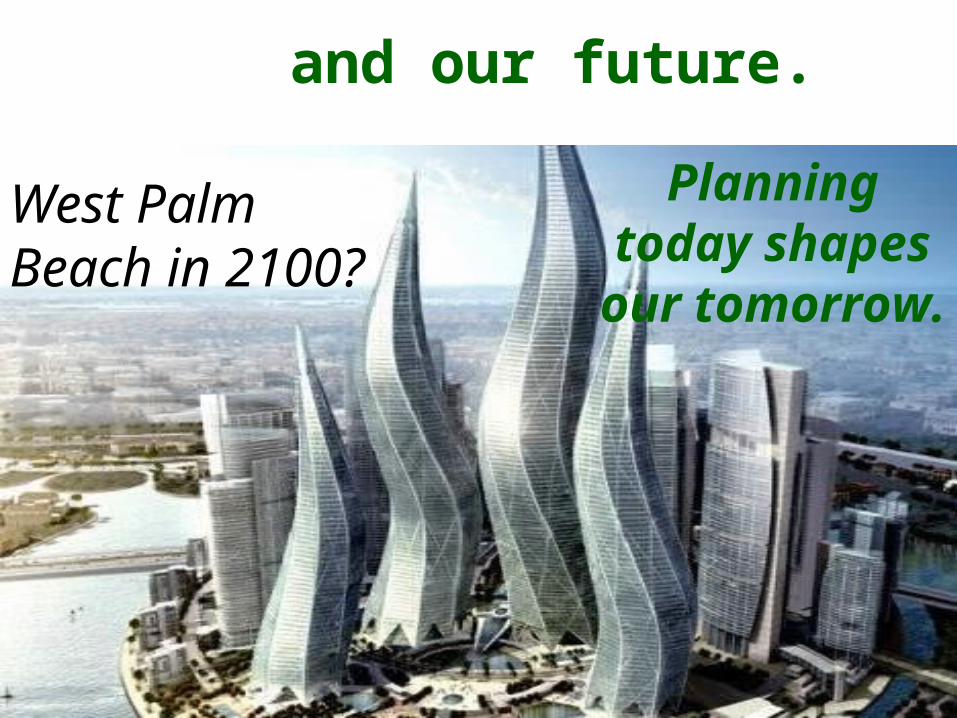
and our future.
West Palm Beach in 2100?
Planning today shapes our tomorrow.

www.broward.org/climatechange
Looking Forward• Climate Change and its impacts will be a
dominant agent of change in SE Florida.
• Action including careful coordinated planning is needed to sustain our economy and to ensure a climate-resilient SE FL community.
• Adaptation to water resource issues are central to sustainability…and are already being impacted.

www.broward.org/climatechange
a) Drinking water
a) Demand
b) Availability of existing and future water supply
c) Treatment requirements
b) Predictability of Rainfall/Storm events
c) Drainage
d) Utility carbon footprint
Critical Water Resource Concerns

www.broward.org/climatechange
Development, even in high risk areas, is expected to continue

www.broward.org/climatechange
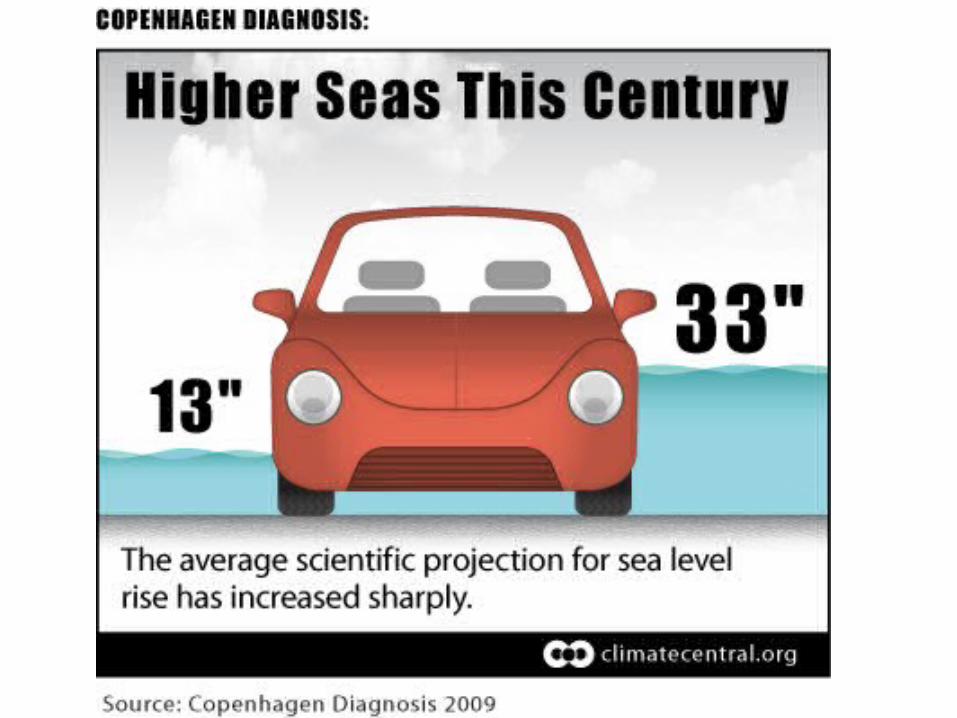
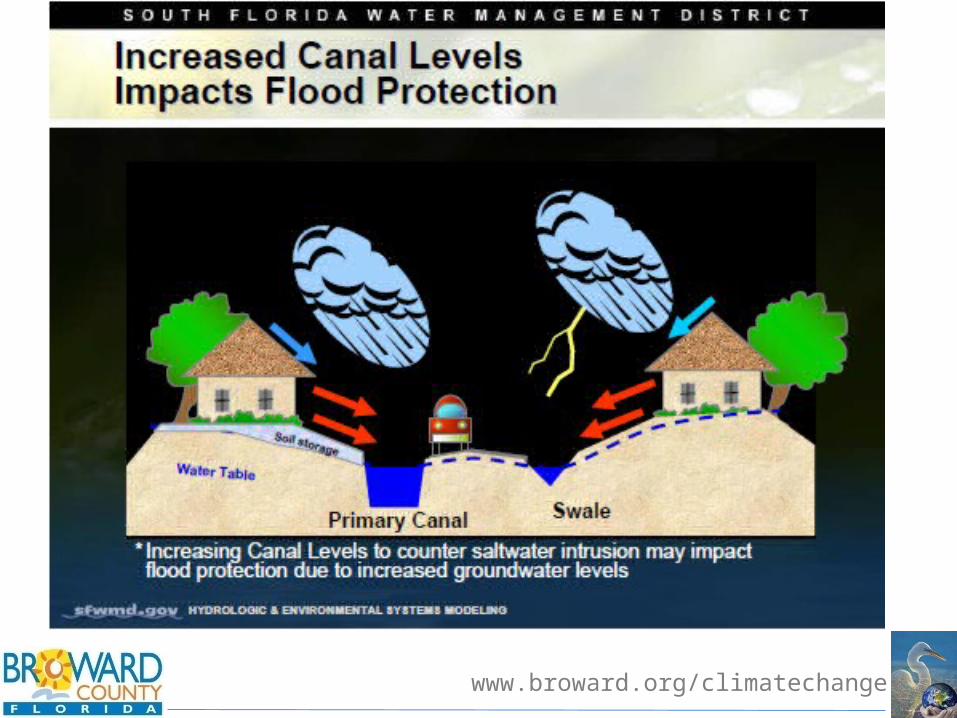
Sea Level Rise Implications
• Saltwater intrusion into the
aquifer
• Drainage and flood control compromised

www.broward.org/climatechange
a) Drinking water
a) Demand
b) Availability of existing and future water supply
c) Treatment requirements
b) Predictability of Rainfall/Storm events
c) Drainage
d) Utility carbon footprint
Critical Water Resource Concerns
www.broward.org/climatechange
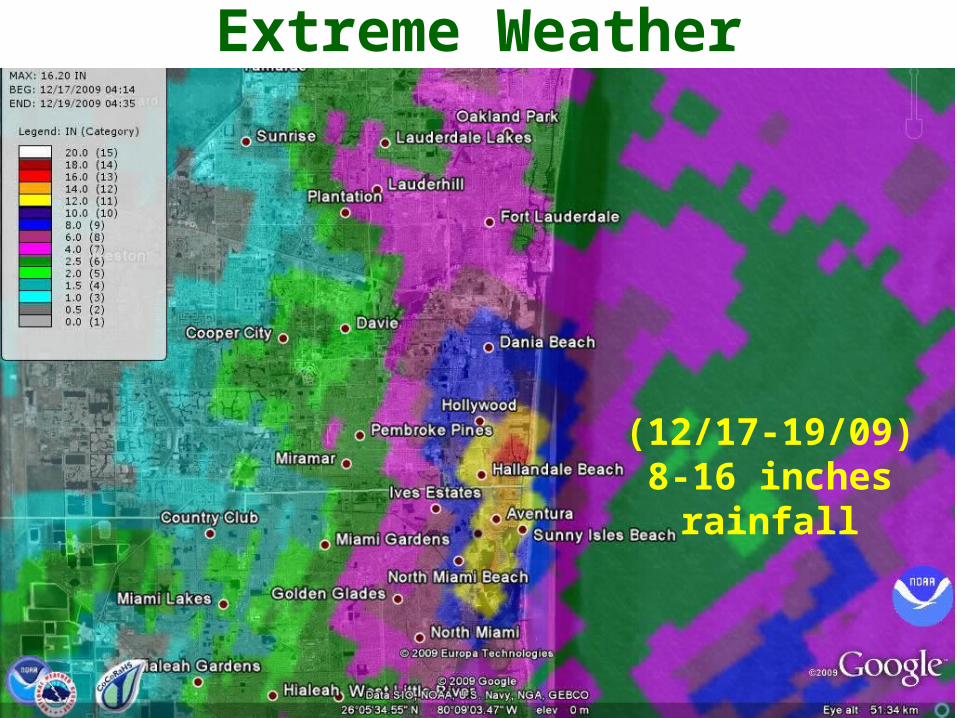
Extreme Weather
(12/17-19/09)8-16 inches rainfall

www.broward.org/climatechange
Extreme Rain Event Hollywood/Hallandale
Photo: Sun Sentinel
(12/17-19/09) 8-16 inches rainfall
www.broward.org/climatechange
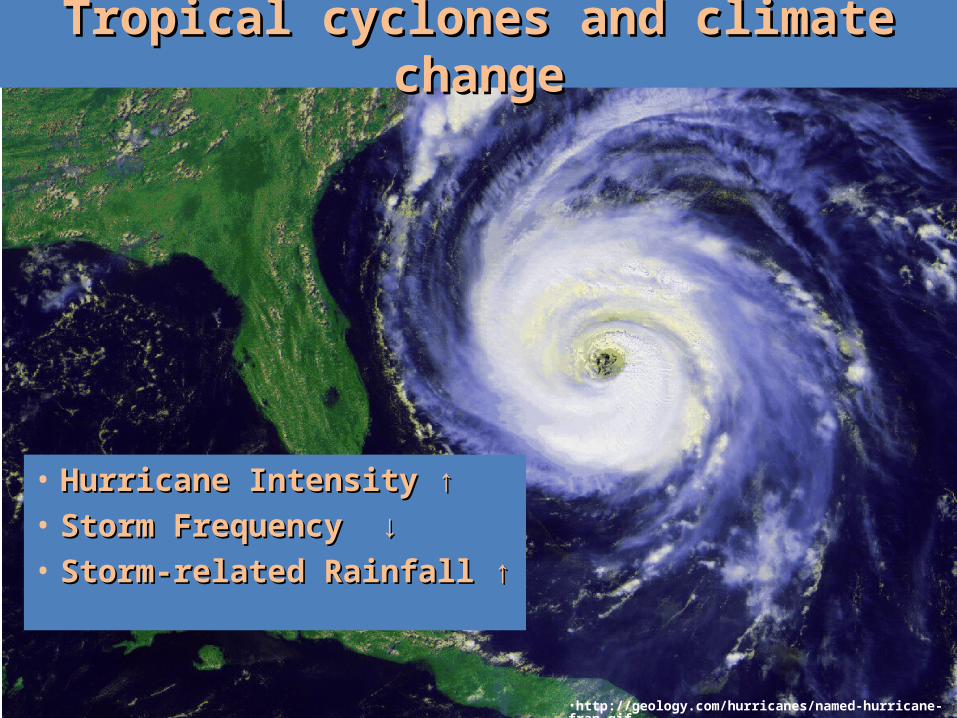
Tropical cyclones and climate changeTropical cyclones and climate change
• Hurricane Intensity ↑Hurricane Intensity ↑• Storm Frequency ↓Storm Frequency ↓• Storm-related Rainfall ↑Storm-related Rainfall ↑
•http://geology.com/hurricanes/named-hurricane-fran.gif

www.broward.org/climatechange
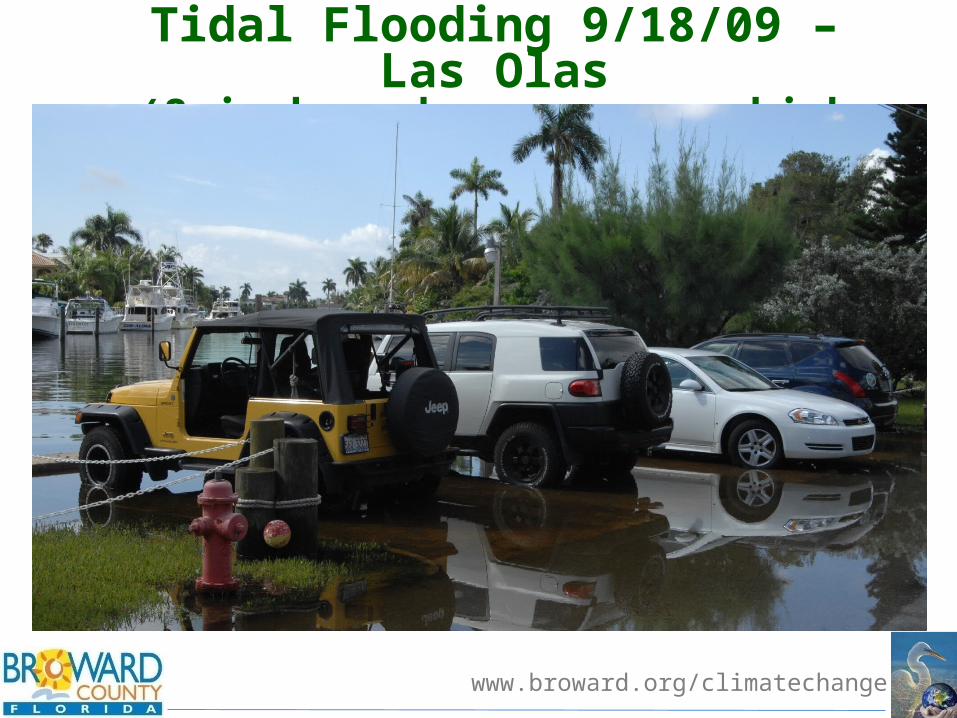
Tidal Flooding 9/18/09 – Las Olas(8 inches above average high tide)
www.broward.org/climatechange
Tidal Flooding 9/18/09 – Las Olas(8 inches above average high tide)
www.broward.org/climatechange
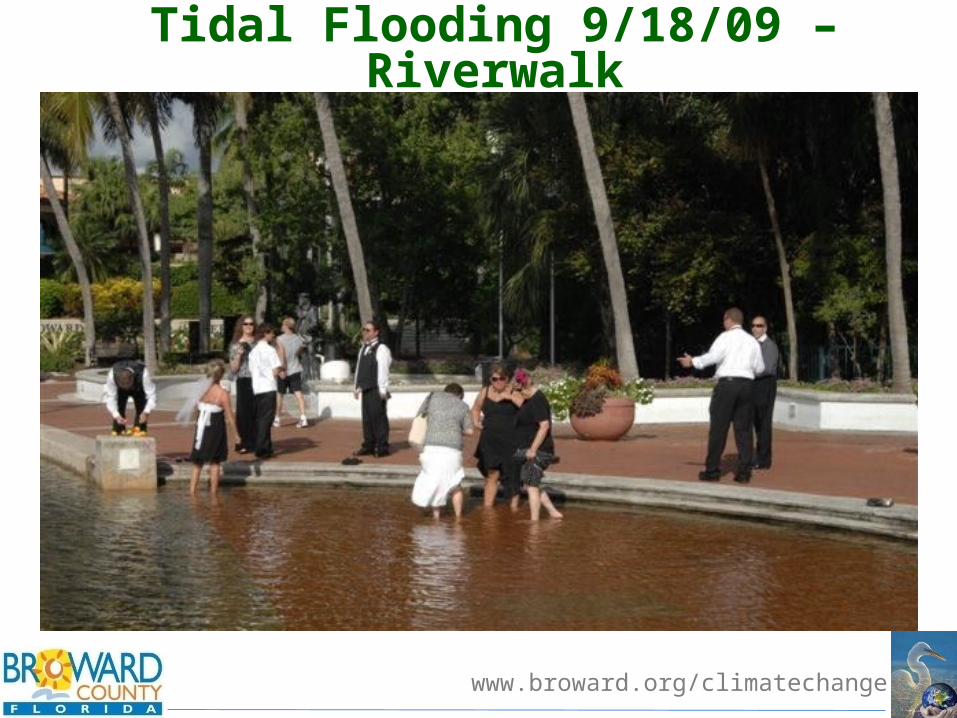
Tidal Flooding 9/18/09 – Riverwalk(8 inches above average high tide)

www.broward.org/climatechange
www.broward.org/climatechange

www.broward.org/climatechange
Drainage in the Face of Sea Level Rise

www.broward.org/climatechange
StormwaterSaltwater
Flood Control
Structure
Drainage Challenge with Sea Level Rise
Drainage Capacity
CURRENT CONDITION
StormwaterSaltwater
Flood Control
Structure
Drainage Capacity
FUTURE CONDITION
www.broward.org/climatechange
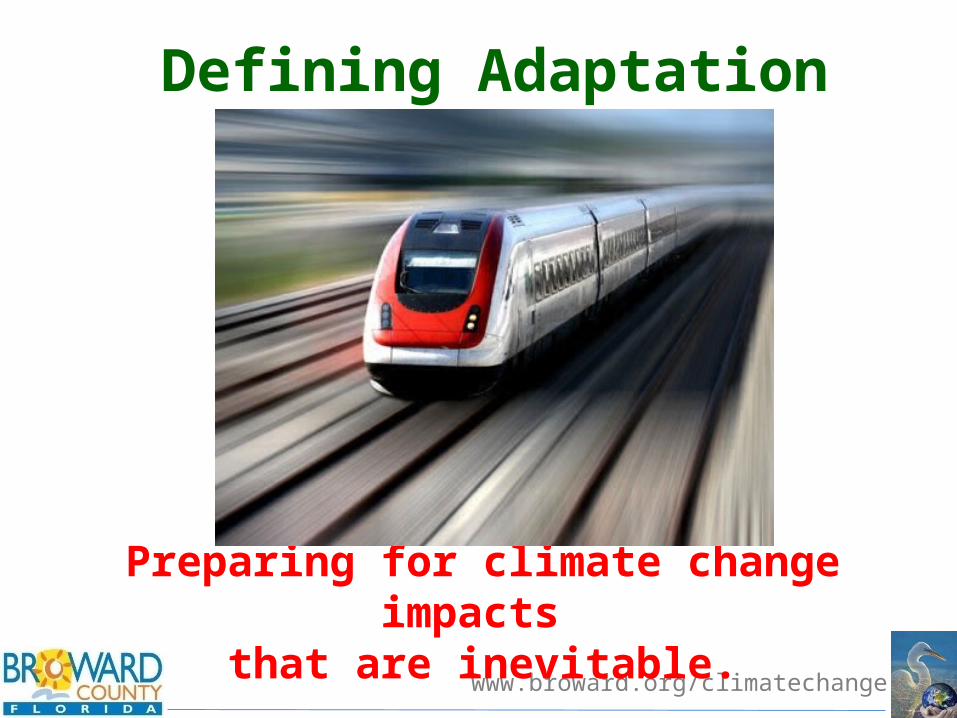
Defining Adaptation
Preparing for climate change impacts that are inevitable.
www.broward.org/climatechange
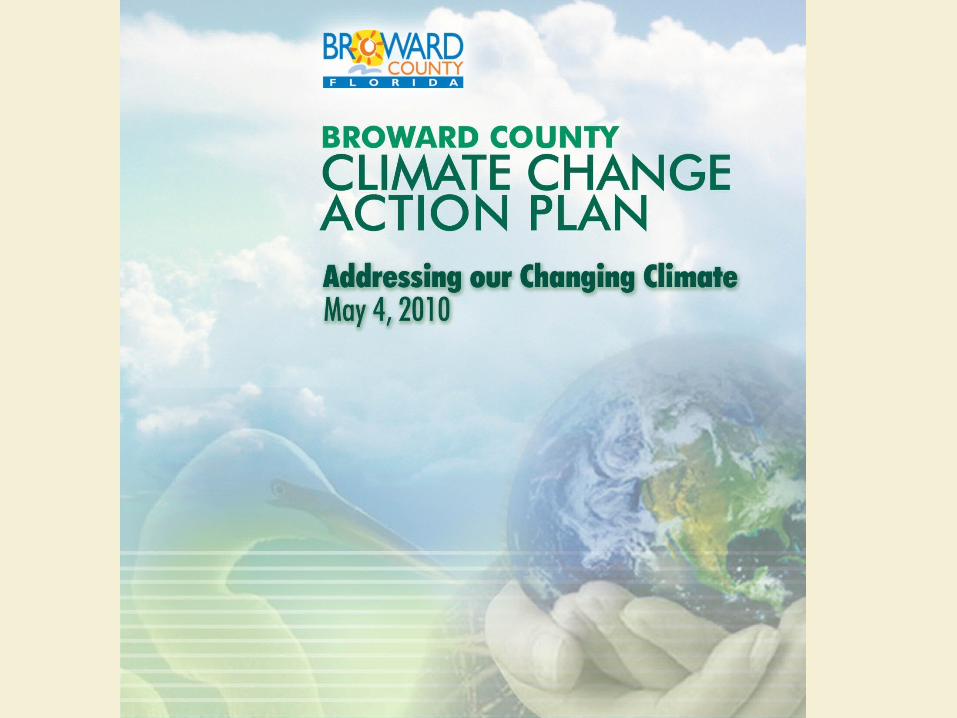
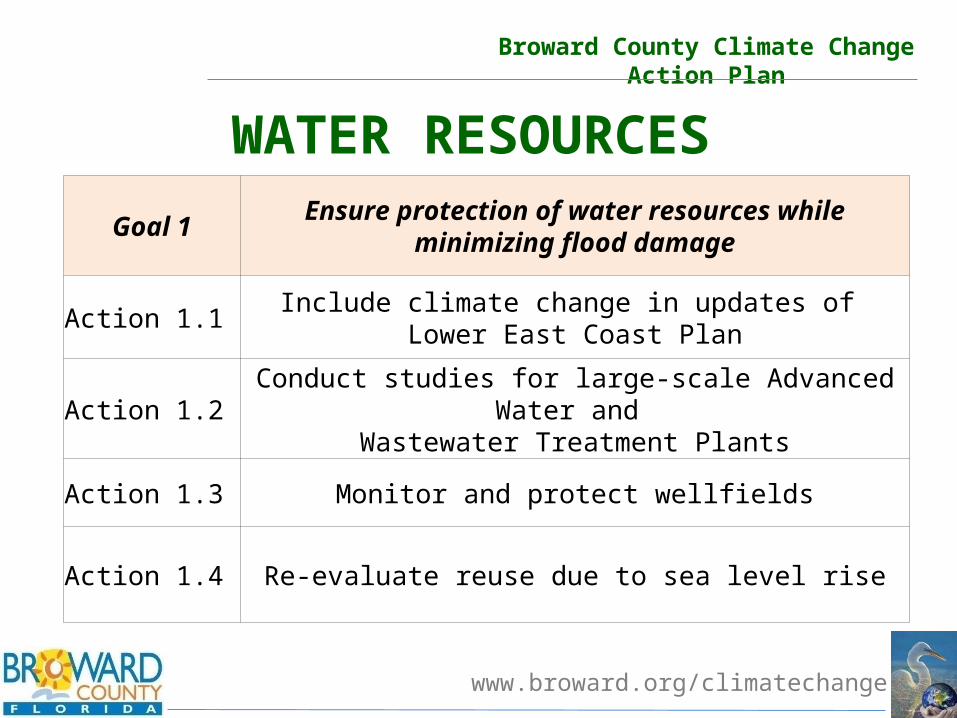
Broward County Climate Change Action Plan
WATER RESOURCES
Goal 1Ensure protection of water resources while
minimizing flood damage
Action 1.1 Include climate change in updates of
Lower East Coast Plan
Action 1.2 Conduct studies for large-scale Advanced Water and
Wastewater Treatment Plants
Action 1.3 Monitor and protect wellfields
Action 1.4 Re-evaluate reuse due to sea level rise

www.broward.org/climatechange
Climate Change Action PlanWater Resources
www.broward.org/climatechange
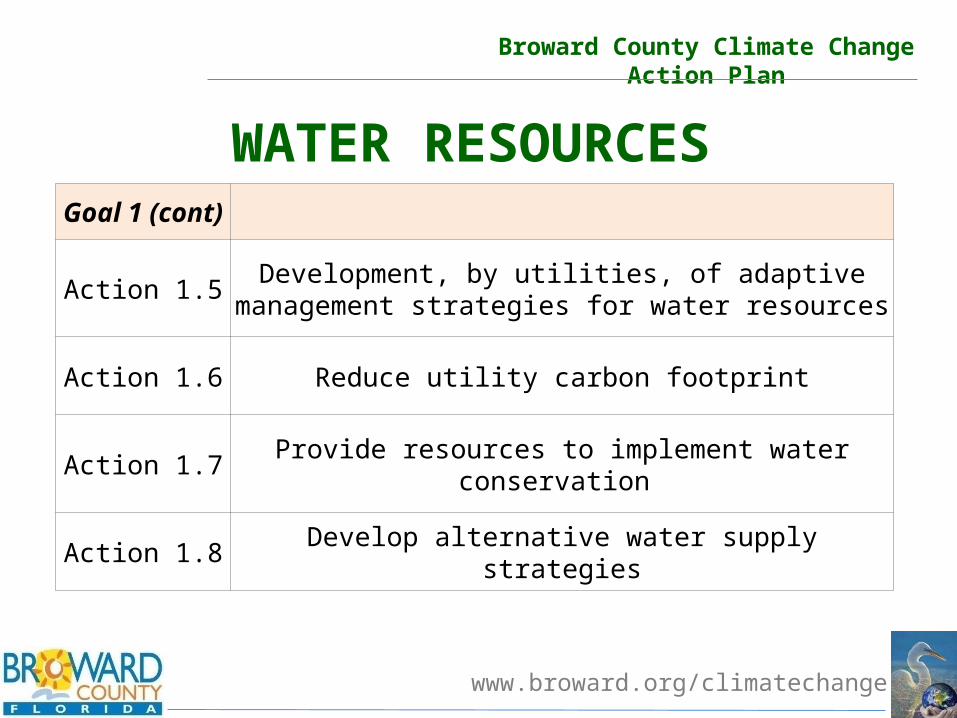
Broward County Climate Change Action Plan
WATER RESOURCESGoal 1 (cont)
Action 1.5 Development, by utilities, of adaptive management
strategies for water resources
Action 1.6 Reduce utility carbon footprint
Action 1.7 Provide resources to implement water conservation
Action 1.8 Develop alternative water supply strategies

www.broward.org/climatechange
Water Resources

www.broward.org/climatechange
Broward County Climate Change Action Plan
WATER RESOURCESGoal 1 (cont)
Action 1.9 Protect Wastewater Treatment System from
Infiltration and Inflow
Action 1.10Convene a regional workshop to enhance resilience of
water resources to Climate Change
Action 1.11 Require construction to include a percentage of
pervious areas to enhance water resources

www.broward.org/climatechange
Broward County Climate Change Action Plan
MODELING, MONITORING, AND MAPPING
Goal 8Ensure the use of current modeling information in developing adaptation and mitigation strategies
Goal 9Develop and maintain monitoring for environmental benchmarks that indicate impacts of climate change
Goal 10Ensure the use of current mapping information in developing adaptation and mitigation strategies
www.broward.org/climatechange
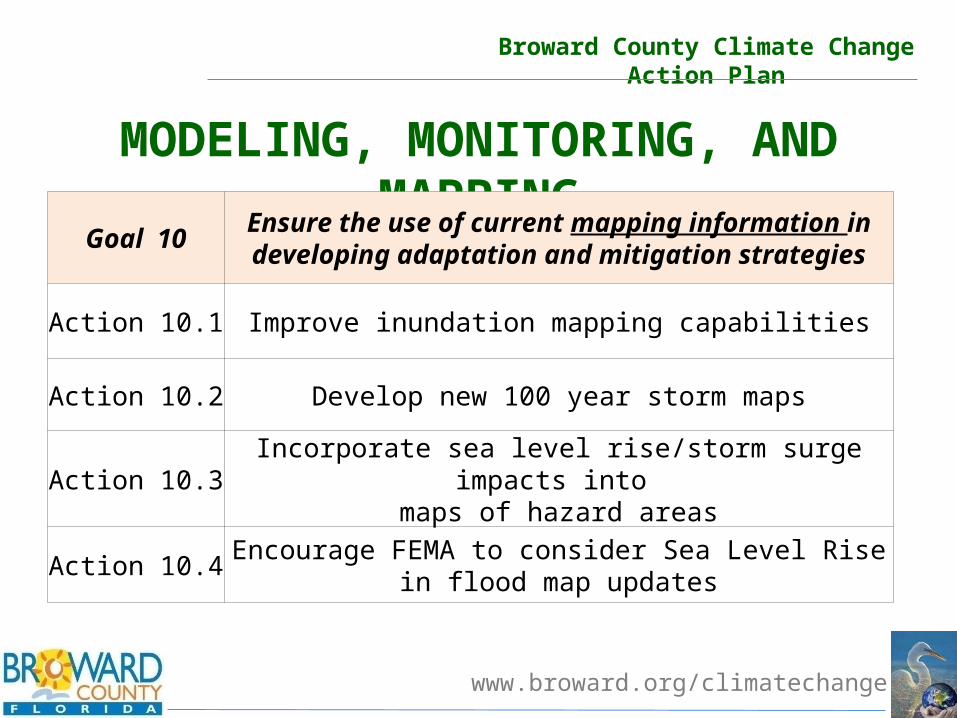
Broward County Climate Change Action Plan
MODELING, MONITORING, AND MAPPING
Goal 10Ensure the use of current mapping information in developing adaptation and mitigation strategies
Action 10.1 Improve inundation mapping capabilities
Action 10.2 Develop new 100 year storm maps
Action 10.3 Incorporate sea level rise/storm surge impacts into
maps of hazard areas
Action 10.4 Encourage FEMA to consider Sea Level Rise in flood
map updates

www.broward.org/climatechange
1 ft rise
0 84
Miles
At Risk in Broward:
1934 households
182 business
Property worth ~ $469M
Critical Infrastructure: Library/park/natural area
4 major roads including:Hollywood Blvd
Ocean Dr / A1ADania Beach Blvd
Sheridan St
Sea level rise is based on additional water above themean higher-high water (MHHW) value. MHHW isdefined as the average of the higher high water heightof each tidal day. MHHW was calculated from tidalstation data along the coast of Broward County duringthe 1983-2001 epoch and represents approximately 6inches of elevation on the LiDAR. This value wasprovided by NOAA Tide and Currents.
LiDAR point elevation error: +/- 0.21 feet (2.52 inches)LiDAR flown: 2007 - 2008H: North American Datum 1983 HARN FeetV: North American Vertical Datum 1988 (NAVD88) Feet
LiDAR point elevations provided by:Florida Division of Emergency Management
Area at Risk
LEGEND
General area directly affected by tides
Broward County Salinity Control Structures#

www.broward.org/climatechange
a) Future water supply source planning
b) Future water supply treatment planning
c) Contingency planning for extreme drought and rainfall
d) Coordinated retrofit of drainage infrastructure
b) Investigation into reducing utility carbon footprint
Municipal Considerations