stevenson
TRANSCRIPT

STEVENSON SHORELINE MASTER PROGRAM
City of Stevenson Cumulative Impact Analysis & No Net Loss Report
December 2018 Ecology Grant # G1200-044
Tasks 3.6, 4.2, 4.3
Exhibit C

Page Intentionally Left Blank
Exhibit C

i
Acknowledgements
City Council
Scott Anderson, Mayor Paul Hendricks
Matthew Knudsen Robert Muth Jenny Taylor
Amy Weissfeld
Planning Commission
Karen Ashley Valerie Hoy-Rhodehamel
Shawn Van Pelt Auguste Zettler
Local Advisory Committee
Brian Birkenfeld Joe Birkenfeld Gerald Doblie
Eran and Gloria Howell Mary Repar Tim Todd
Bernard Versari Ken Wieman
City Staff
Leana Kinley, City Administrator Ben Shumaker, Community Development Director, Primary Author
Ken Woodrich, City Attorney
State Staff
Michelle McConnell, Regional Shoreline Planner
Exhibit C

City of Stevenson Adopted 2018 Cumulative Impacts Analysis & No Net Loss Report December 2018
ii
Page Intentionally Left Blank
Exhibit C

City of Stevenson Adopted 2018 Cumulative Impacts Analysis & No Net Loss Report December 2018
iii
Table of Contents
ACKNOWLEDGEMENTS I
TABLE OF CONTENTS 3
LIST OF FIGURES 4
EXECUTIVE SUMMARY 1
CHAPTER 1 – INTRODUCTION 3 1.1 TITLE 3 1.2 INTRODUCTION 3 1.3 PURPOSE 3 1.4 METHODOLOGY 5
1.4.1 Relationship to Inventory & Characterization Report 5 1.4.2 Relationship to Restoration Plan 5 1.4.3 Impacts Analysis 6
CHAPTER 2 – IMPACTS ANALYSIS 7 2.1 REASONABLY FORESEEABLE DEVELOPMENT ACTIVITIES 7 2.2 SHORELINE DEVELOPMENT AND PROTECTIVE PROVISIONS 9
2.2.1 Shoreline Environment Designation Use Allowances 9 2.2.2 Shoreline Setbacks 11 2.2.3 Impacts of Regulated Activities 15 2.2.4 No Net Loss Protections 15
2.3 IMPACTS OF EXEMPT AND UNREGULATED ACTIVITIES 15 2.4 IMPACTS OF RESTORATION ACTIVITIES 16
CHAPTER 3 – CUMULATIVE IMPACTS ANALYSIS 19 3.1 NET EFFECT OF IMPACTS 19 3.2 GAINED ECOLOGICAL FUNCTIONS 19
3.2.1 Available Floodplain Area 19 3.2.2 Riparian Vegetation 19 3.2.3 Shoreline Stability 19 3.2.4 Fish-Blocking Culverts 19 3.2.5 Permanently Protected Areas 20 3.2.6 PHS Listings 20 3.2.7 Wetland Acreage 20 3.2.8 Overwater Roads & Structures 20 3.2.9 Urban Runoff 20
3.3 LOST ECOLOGICAL FUNCTIONS 20 3.3.1 303(d) Listings 20 3.3.2 Impervious Surface Area 20 3.3.3 Setbacks to OHWM 20
3.4 ACHIEVEMENT OF NO NET LOSS 21 3.4.1 Key Programmatic Protections 21 3.4.2 Degraded Indicators vs. Loss of Function 21 3.4.3 Conclusion 22
Exhibit C

City of Stevenson Adopted 2018 Cumulative Impacts Analysis & No Net Loss Report December 2018
iv
List of Figures FIGURE 1-1 STEVENSON’S ECOSYSTEM-WIDE PROCESSES, ECOLOGICAL FUNCTIONS, AND REACH-SCALE INDICATORS 4 FIGURE 1-2 RATING INDICATORS OF ECOLOGICAL FUNCTION 5 FIGURE 1-3 CATEGORIES OF REASONABLY FORESEEABLE SHORELINE USE & MODIFICATION BY REACH 6 FIGURE 1-4 RATING PROJECTED CHANGES TO INDICATORS 6 FIGURE 2-1 SUMMARY OF PROJECTED INDICATOR CHANGES 7 FIGURE 2-2 DISTRIBUTION OF SHORELINE ENVIRONMENT DESIGNATIONS 9 FIGURE 2-3 SHORELINE ENVIRONMENT DESIGNATION USE & MODIFICATION ALLOWANCES 10 FIGURE 2-4 DEVELOPMENT IMPACTS & REGULATORY CONTROLS 13 FIGURE 2-5 ECOLOGICAL IMPACTS OF EXEMPT AND UNREGULATED ACTIVITIES 16 FIGURE 2-6 ECOLOGICAL IMPACTS OF RESTORATION PLAN 17
Exhibit C

City of Stevenson Adopted 2018 Cumulative Impacts Analysis & No Net Loss Report December 2018
1
Executive Summary
This report provides a summary and analysis of the cumulative impacts that can be expected to occur over time as the City of Stevenson (City) implements its updated Shoreline Master Program (SMP) (Chapter 18.08 – Shorelines Management of the Stevenson Municipal Code). The City is updating its SMP in order to comply with the Washington State Shoreline Management Act (SMA) and the 5 Washington Administrative Code (WAC) implementing rules (WAC 173-26, also called the Shoreline Master Program Guidelines and referred to in this report as the SMP Guidelines).
The City is developing an updated locally approved SMP (Draft SMP), which contains policies and regulations to protect the City’s shorelines from potential negative effects caused by future development. The City is also developing a Restoration Plan (RP) to identify opportunities to improve 10 or restore ecological functions that have been impaired as a result of past development activities. This report compares the impacts expected through Draft SMP policies to the improvements expected through the Restoration Plan. This comparison is necessary to assess whether the City’s proposal is consistent with the state SMP Guidelines and the policy goals of the SMA related to no net loss of shoreline ecological functions. Early drafts of this report excluded No Net Loss from the title as an 15 indication of the iterative review being conducted. The final report includes this title and statements related to the program’s achievement of the state’s no net loss standard.
The conclusions of this report indicate that 9 of the City’s 12 indicators of ecological function will show improvement based on the Draft SMP and Restoration Plan. For the 3 indicators where decline is expected, improvements to other indicators are expected to offset the likely impacts to the underlying 20 ecological functions through:
• Shoreline environment designations to protect or enhance the current or desired character of shorelines.
• A system of Prohibited, Conditional, and Permitted uses that provides additional controls leading to the current or desired character of shorelines. 25
• General policies and regulations intended to protect the shoreline functions, as well as policies designed to protect specific shoreline functions, such as water quality, water quantity, vegetation, and habitat.
• Specific vegetation conservation standards combined with use setbacks and reach-specific riparian area buffers to protect shoreline ecological functions. 30
• Critical areas regulations to provide protections for wetlands, fish and wildlife habitat, critical aquifer recharge areas, flood hazard areas, and geologically hazardous areas.
• Local, state, and federal regulations to ensure that shoreline impacts are avoided, minimized, and/or mitigated.
• Restoration activities and programs that are expected to improve shoreline functions. These 35 non-regulatory enhancement and restoration activities are likely to offset or minimize potentially adverse unanticipated and/or incremental cumulative impacts within the County’s shoreline jurisdiction.
Given the policy guidance and regulatory requirements proposed, including the implementation of the shoreline restoration plan and the key vegetation removal and setback features listed above, the 40
Exhibit C

City of Stevenson Adopted 2018 Cumulative Impacts Analysis & No Net Loss Report December 2018
2
implementation of the Draft SMP is anticipated to achieve no net loss of ecological functions in the city’s shorelines. Stevenson’s robust vegetation standards are more specific and require greater mitigation than what most rural communities require, and account for temporal losses and the possibility of failure of mitigation efforts. In the long term, a net gain in functions is likely in many instances, because the mitigation ratios exceed 1:1 and will eventually result in larger, better 45 functioning resources than those impacted. Additionally, monitoring and conservation covenant requirements will ensure the success of mitigation sites and their protection from future development in perpetuity. Therefore, the SMP policies and regulations will result in no net loss of ecological functions or values of shorelines.
50
Exhibit C

City of Stevenson Adopted 2018 Cumulative Impacts Analysis & No Net Loss Report December 2018
3
Chapter 1 – Introduction
1.1 Title This document shall be known and may be cited as the Stevenson 2018 Cumulative Impacts Analysis (CIA).
1.2 Introduction 5
This cumulative impacts analysis supports the City of Stevenson (City) Comprehensive Shoreline Master Program (SMP) update. The City’s long-standing SMP is being updated in order to comply with updates to Washington’s Shoreline Management Act (SMA), the Revised Code of Washington (RCW) 90.58, and the Washington Administrative Code (WAC) 173.26 adopted in 2003 by the state legislature. The City’s SMP was first adopted in June 1974 and was revised in August 1975. 10
This report assesses the potential cumulative impacts of shoreline development under the Draft SMP. The analysis contained in this report relies on the existing condition information provided in the City’s “Final Shoreline Inventory & Characterization Report” (ICR), which evaluated ecosystem processes and included an inventory and analysis of shoreline conditions related to land use, public access, and environmentally sensitive areas and habitat. This analysis also utilizes the Inventory & Characterization 15 Report to assess development potential based on proposed shoreline environment designations (SEDs) contained in the Draft SMP.
1.3 Purpose This report was generated to address the requirements for a cumulative impacts analysis that are contained in the Shoreline Master Program Guidelines (WAC 173-26; referred to in this report as the 20 SMP Guidelines). Cumulative impact analyses are conducted while drafting SMP provisions as part of the comprehensive update process. The City is required to evaluate the cumulative impacts of “reasonably foreseeable” future development. Typically, this means full build-out for a 20-year planning horizon and the methodology below describes the development expected. This evaluation verifies that the proposed SMP’s shoreline management policies and regulations are adequate to ensure “no net 25 loss” of shoreline functions compared to “baseline” conditions. “No net loss” means that impacts may occur, but adequate measures are in place within the overall shoreline program to mitigate them such that the post development conditions are no worse overall than pre-development conditions.
The findings of this report inform decisions on SMP policies, programs, and regulations to address adverse cumulative impacts and protect shoreline ecological functions. This analysis is not proposed 30 for inclusion as part of the Stevenson Comprehensive Plan or the development regulations of the Stevenson Municipal Code (SMC), but may serve as a useful reference during SMP implementation.
According to the SMP guidelines, the assessment of cumulative impacts occurs at both the planning stage and at the permitting stage when individual development proposals are reviewed (a site-specific effort once the SMP is adopted and implemented). The Guidelines recommend assessing the impacts 35 of “commonly occurring and planned development” at the planning stage “without reliance on an individualized cumulative impacts analysis.” In contrast, developments that have un- anticipatable impacts that cannot be reasonably identified at the time of SMP development should be evaluated via
Exhibit C
City of Stevenson Adopted 2018 Cumulative Impacts Analysis & No Net Loss Report December 2018
4
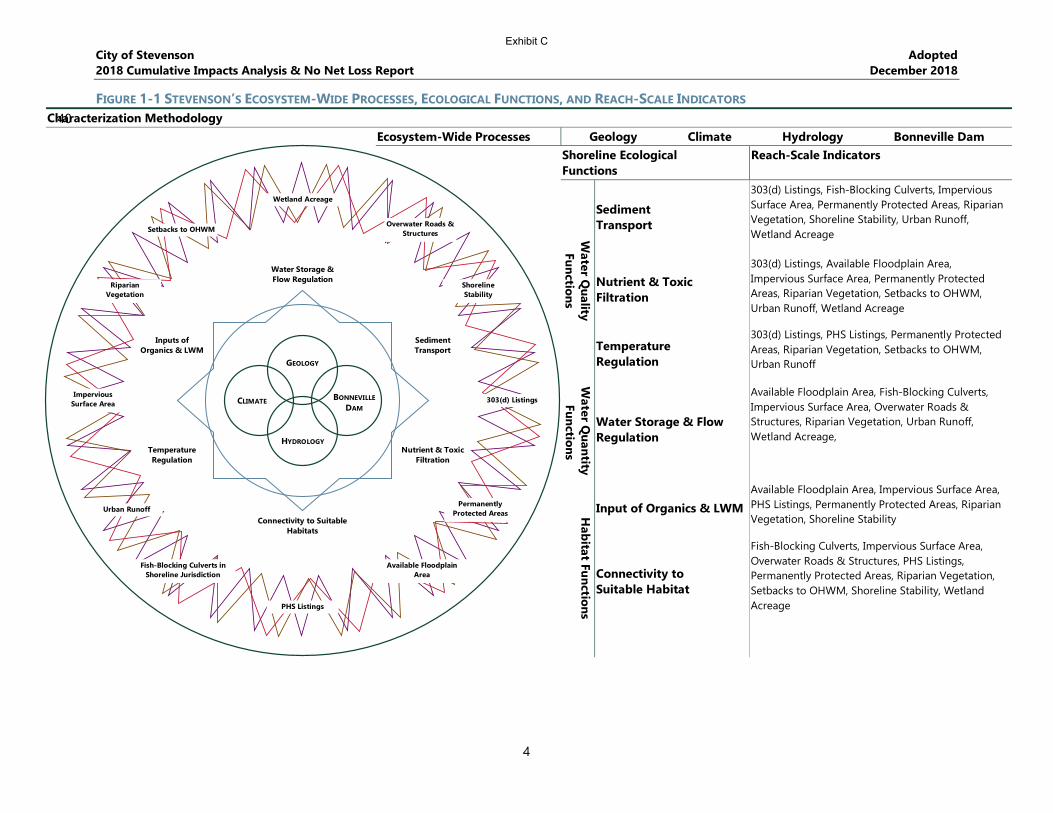
FIGURE 1-1 STEVENSON’S ECOSYSTEM-WIDE PROCESSES, ECOLOGICAL FUNCTIONS, AND REACH-SCALE INDICATORS 40 Characterization Methodology
Ecosystem-Wide Processes Geology Climate Hydrology Bonneville Dam Shoreline Ecological Functions
Reach-Scale Indicators
Water Q
uality Functions
Sediment Transport
303(d) Listings, Fish-Blocking Culverts, Impervious Surface Area, Permanently Protected Areas, Riparian Vegetation, Shoreline Stability, Urban Runoff, Wetland Acreage
Nutrient & Toxic Filtration
303(d) Listings, Available Floodplain Area, Impervious Surface Area, Permanently Protected Areas, Riparian Vegetation, Setbacks to OHWM, Urban Runoff, Wetland Acreage
Temperature Regulation
303(d) Listings, PHS Listings, Permanently Protected Areas, Riparian Vegetation, Setbacks to OHWM, Urban Runoff
Water Storage & Flow Regulation
Available Floodplain Area, Fish-Blocking Culverts, Impervious Surface Area, Overwater Roads & Structures, Riparian Vegetation, Urban Runoff, Wetland Acreage,
Habitat Functions
Input of Organics & LWM Available Floodplain Area, Impervious Surface Area, PHS Listings, Permanently Protected Areas, Riparian Vegetation, Shoreline Stability
Connectivity to Suitable Habitat
Fish-Blocking Culverts, Impervious Surface Area, Overwater Roads & Structures, PHS Listings, Permanently Protected Areas, Riparian Vegetation, Setbacks to OHWM, Shoreline Stability, Wetland Acreage
Water Q
uantity Functions
GEOLOGY
HYDROLOGY
BONNEVILLE DAM
CLIMATE
Connectivity to Suitable Habitats
Water Storage & Flow Regulation
Temperature Regulation
Inputs of Organics & LWM
Sediment Transport
Nutrient & Toxic Filtration
Impervious Surface Area 303(d) Listings
Urban Runoff Permanently
Protected Areas
Shoreline Stability
Riparian Vegetation
Wetland Acreage
PHS Listings
Fish-Blocking Culverts in Shoreline Jurisdiction
Available Floodplain Area
Setbacks to OHWM Overwater Roads &
Structures
Exhibit C

City of Stevenson Adopted 2018 Cumulative Impacts Analysis & No Net Loss Report December 2018
5
the shoreline substantial development and conditional use permit processes to ensure that there is no net loss of ecological function after mitigation (WAC 173-26-201(3)(d)(iii)).
1.4 Methodology Although flexible, WAC 173-26 requires the use of a particular framework to evaluate the potential cumulative impacts on shoreline functions and processes that may result from activities or 45 development under the City’s proposed SMP over time. The framework includes the following factors.
• Current circumstances affecting the shorelines and relevant natural processes; • Reasonably foreseeable future development and use of the shoreline; and • Beneficial effects of any established regulatory or facilitative programs under other local,
state and federal laws. 50
1.4.1 Relationship to Inventory & Characterization Report To address the first 2 bullet points above, this analysis relies on the City’s Shoreline Inventory & Characterization Report (ICR), which evaluated ecosystem-wide processes, shoreline ecological functions, and land uses within shoreline jurisdiction. To address the first bullet point, the existing condition information provided in ICR Chapter 4 is used. Figure 1-1 on the preceding page is taken 55 from the ICR to describe how the 4 ecosystem-wide processes, 6 ecological functions, and 12 reach-scale indicators interact within the snapshot of existing conditions. In ICR Chapter 4 each of the 12 reach-scale indicators were qualitatively rated based on a 5-point scale (Figure 1-2).
FIGURE 1-2 RATING INDICATORS OF ECOLOGICAL FUNCTION
60 To assess the physical and biological resources of Stevenson’s shorelines, the ICR broke them into 7 manageable units based on geographic location along Ashes Lake, the Columbia River, Rock Cove and Rock Creek, the only streams or lakes in the City considered part of shoreline jurisdiction. A summary of the evaluation performed in ICR Chapter 4 is included as part of CIA Figure 2-1. The ICR rating for each indicator of ecological function is included in the first row of each of these before anticipated 65 changes are listed.
The projection of future shoreline development and use in ICR Table 5.3-1 provides the basis of analysis under the second bullet point. The potential use changes/conflicts listed in that table are included in CIA Figure 1-3, as the reasonably foreseeable future development and use of the shoreline.
1.4.2 Relationship to Restoration Plan 70 The third bullet point above relies on the description of restoration strategies and projects in the City’s Shoreline Restoration Plan, especially Restoration Plan Figure 3-1 which identifies the shoreline reaches and shoreline ecological functions where improvements are expected based on the implementation of the actions. Each of the projects listed in that table are transferred to CIA Figure 2-6, below.
Excellent Good Fair Poor Very Poor
Qualitative Scale for Indicators of Ecological Function Figure Credit: Ben Shumaker (2017) after Consumer Reports.
Exhibit C

City of Stevenson Adopted 2018 Cumulative Impacts Analysis & No Net Loss Report December 2018
6
FIGURE 1-3 CATEGORIES OF REASONABLY FORESEEABLE SHORELINE USE & MODIFICATION BY REACH 75
CR1 CR2 CR3 RC1 RC2 RCo AL Use
Boating Facilities & Overwater Structures
Commercial & Industrial Forest Practices Institutional Land Division Recreational Residential Transportation & Parking Facilities Utilities
Modifications Vegetation Removal Fill Shoreline Stabilization Shoreline Restoration Dredging Breakwaters, Jetties, Groins & Weirs
1.4.3 Impacts Analysis In order to analyze the impacts of reasonably foreseeable shoreline development, use, and restoration, an assessment of development types and projects has been performed. This assessment rates how each interacts with the 12 indicators of shoreline ecological functions. The degree to which any specific 80 project degrades or improves the indicators of shoreline ecological functions is qualitative and based on several factors, including proximity, duration and scale of the project or the project’s impacts. The anticipated changes to the indicators of ecological functions are represented using another 5-point rating system (Figure 1-4) that ranges from Much Worse to Much Better.
FIGURE 1-4 RATING PROJECTED CHANGES TO INDICATORS 85
Relative Change of Ecological Functions Figure Credit: Ben Shumaker (2018)
Much Worse
Much Better
Somewhat Worse
Somewhat Better
No Change
Exhibit C

City of Stevenson Adopted 2018 Cumulative Impacts Analysis & No Net Loss Report December 2018
7
Chapter 2 – Impacts Analysis
The state SMP guidelines require that Shoreline Environment Designations be assigned to shoreline areas according to their function, existing land uses, and the goals and aspirations of the community. For those unfamiliar with the Shoreline Management Act (SMA), a Shoreline Environment Designation (SED) is similar to the concept of a zoning district. Consistent with the City’s requirements under the 5 SMA, SMP Chapter 3 provides a system of SEDs which reflect those outlined in the SMP guidelines and apply in addition to other city zoning district requirements. The locations of the City’s SEDs are depicted on the map of shoreline jurisdiction and environment designations in SMP Appendix A.
2.1 Reasonably Foreseeable Development Activities Together SMP Table 5.1 and SMP Table 6.1 list 17 high-level categories of shoreline use and 10 modification. These high-level categories are then separated by water-orientation and other specific types of development activities warranting regulatory consideration. In total at least 53 individual types of shoreline uses and modifications are specifically regulated in the SMP. Of these, 42 (from 16 of the high-level categories) either 1) currently exist, 2) are referenced in ICR Table 5.3-1 or 3) are reasonably foreseeable as associated with existing or anticipated uses. The high-level categories are listed in CIA 15 Figure 1-3. Their impacts and the protective provisions of the SMP are analyzed in CIA Section 2.2.
FIGURE 2-1 SUMMARY OF PROJECTED INDICATOR CHANGES PHYSICAL
ENVIRONMENT BIOLOGICAL ENVIRONMENT ALTERED CONDITIONS
Available
Floodplain Area
Riparian Vegetation
Shoreline Stability
Fish-Blocking Culverts
Permanently
Protected Areas
PHS Listings
Wetland A
creage
303(d) Listings
Impervious Surface
Area
Overw
ater Roads &
Structures
Setbacks to OH
WM
Urban Runoff
Columbia River Reach 1 (Predesignated)
Changes anticipated in 2.2.2
Changes anticipated in 2.2.3
Changes anticipated in 2.2.4
Changes anticipated in 2.3
Changes anticipated in 2.4
Columbia River Reach 2
Changes anticipated in 2.2.2
Changes anticipated in 2.2.3
Changes anticipated in 2.2.4
Changes anticipated in 2.3
Changes anticipated in 2.4
Exhibit C

City of Stevenson Adopted 2018 Cumulative Impacts Analysis & No Net Loss Report December 2018
8
Figure 2-1 Summary of Projected Indicator Changes, cont. PHYSICAL
ENVIRONMENT BIOLOGICAL ENVIRONMENT ALTERED CONDITIONS
Available
Floodplain Area
Riparian Vegetation
Shoreline Stability
Fish-Blocking Culverts
Permanently
Protected Areas
PHS Listings
Wetland A
creage
303(d) Listings
Impervious Surface
Area
Overw
ater Roads &
Structures
Setbacks to OH
WM
Urban Runoff
Columbia River Reach 3 (Predesignated)
Changes anticipated in 2.2.2
Changes anticipated in 2.2.3
Changes anticipated in 2.2.4
Changes anticipated in 2.3
Changes anticipated in 2.4
Rock Creek Reach 1
Changes anticipated in 2.2.2
Changes anticipated in 2.2.3
Changes anticipated in 2.2.4
Changes anticipated in 2.3
Changes anticipated in 2.4
Rock Creek Reach 2 (Predesignated)
Changes anticipated in 2.2.2
Changes anticipated in 2.2.3
Changes anticipated in 2.2.4
Changes anticipated in 2.3
Changes anticipated in 2.4
Rock Cove
Changes anticipated in 2.2.2
Changes anticipated in 2.2.3
Changes anticipated in 2.2.4
Changes anticipated in 2.3
Changes anticipated in 2.4
Exhibit C

City of Stevenson Adopted 2018 Cumulative Impacts Analysis & No Net Loss Report December 2018
9
Figure 2-1 Summary of Projected Indicator Changes, cont. PHYSICAL
ENVIRONMENT BIOLOGICAL ENVIRONMENT ALTERED CONDITIONS
Available
Floodplain Area
Riparian Vegetation
Shoreline Stability
Fish-Blocking Culverts
Permanently
Protected Areas
PHS Listings
Wetland A
creage
303(d) Listings
Impervious Surface
Area
Overw
ater Roads &
Structures
Setbacks to OH
WM
Urban Runoff
Ashes Lake
Changes anticipated in 2.2.2
Changes anticipated in 2.2.3
Changes anticipated in 2.2.4
Changes anticipated in 2.3
Changes anticipated in 2.4
2.2 Shoreline Development and Protective Provisions The protective provisions of the SMP primarily rely on several types of regulatory tools, including: 20 Shoreline Environment Designations (SEDs), required setbacks from the OHWM, regulations that are applicable to all uses (including No Net Loss Standards), and regulations applicable to specific uses. When working in concert, CIA Figure 2-1 summarizes the effects these protective provisions are expected produce on the ICR’s 12 indicators of ecological function at the reach scale.
2.2.1 Shoreline Environment Designation Use Allowances 25
FIGURE 2-2 DISTRIBUTION OF SHORELINE ENVIRONMENT DESIGNATIONS
Location Natural Shoreline Residential
Urban Conservancy
Active Waterfront
TOTAL
City Jurisdiction 16.7 ac 17.7 ac 28.3 ac 34.4 ac 97 ac
17% 18% 29% 35%
Predesignated Area 19.4 ac 14.0 ac 32.6 ac 20.2 ac 86 ac
23% 16% 38% 23%
TOTAL 36.1 ac 31.7 ac 60.9 ac 54.6 ac 183 ac
20% 17% 33% 30%
*Total acreage in this table differs from the ICR, which considered the Piper Road Landslide Area as part of the preliminary shoreline jurisdiction.
The types of development allowed on Stevenson’s shorelines will vary subject to the SED assigned to each shore segment. In order to guide development appropriately, Ecology’s SMP Guidelines require that SEDs be assigned to shoreline areas according to their ecological function, existing land uses, and 30 the goals and aspirations of the community. These designations will help protect ecological functions
Exhibit C

City of Stevenson Adopted 2018 Cumulative Impacts Analysis & No Net Loss Report December 2018
10
and values and accommodate preferred and water-dependent shoreline uses. Stevenson’s SMP proposes 5 SEDs, listed in order from most protective to most permissive: Aquatic, Natural, Shoreline Residential, Urban Conservancy, Active Waterfront. The approximate acreage of the non-Aquatic SEDs is included in Figure 2-2, below. 35
SMP Table 5.1 lists common shoreline uses and whether they are prohibited, are allowed, or may be conditionally allowed. CIA Figure 2-3, below summarizes the relative restrictiveness/permissiveness of each SED. An analysis of the impacts of reasonably foreseeable development based on these allowances is conducted in greater detail in CIA Section 2.2.3.
FIGURE 2-3 SHORELINE ENVIRONMENT DESIGNATION USE & MODIFICATION ALLOWANCES 40
Aquatic* Natural Shoreline Residential
Urban Conservancy Active Waterfront
20 Prohibited 28 Prohibited 12 Prohibited 5 Prohibited 5 Prohibited
10 Conditional 17 Conditional 24 Conditional 19 Conditional 14 Conditional
3 Permitted 8 Permitted 17 Permitted 29 Permitted 34 Permitted
*The Aquatic SED contains 20 fewer categories were allowances for Boating Facilities & Overwater Structures and Shoreline Modifications are determined by upland SED.
Columbia River Reach 1 – Predesignated East Urban Area
Most foreseeable development in the CR1, could allowed by obtaining a Shoreline Conditional Use Permit. In addition to satisfying the other protective provisions of the Draft SMP, the conditional use criteria of SMP Section 2.7.1 require heightened analysis of proposal’ effects to the environment and 45 the overall public interest. Key conditional uses listed for the Shoreline Residential and Urban Conservancy SEDs that dominate this reach include the most impactful Boating and Transportation facilities. Reasonably foreseeable development that would be allowed in this reach without a conditional use permit include most Recreational and Residential uses and Boating and Transportation facilities where lesser impacts are anticipated. Impacts to specific indicators of ecological function 50 related to reasonably foreseeable development are dealt with in greater detail in CIA Section 2.2.3, below. Columbia River Reach 2 – Downtown Waterfront
The CR2 Reach is dominated by the Active Waterfront SED and includes a small section of Shoreline Residential. Key conditional use protections for foreseeable development in the Active Waterfront SED 55 are primarily related to non-water-oriented development. See also CIA Section 2.2.3. Columbia River Reach 3 – Predesignated West Urban Area
Similar impacts are expected in the CR3 reach where the Active Waterfront SED is the primary designation proposed. Rock Creek Reach 1 – City Reach 60
The RC1 reach includes all 4 land-based SEDs and the full range of reasonably foreseeable development types are expected in this reach. An analysis of impacts from the conditional and permitted uses related to this reach must rely on CIA Section 2.2.3. Rock Creek Reach 2 – Predesignated County Reach
Exhibit C

City of Stevenson Adopted 2018 Cumulative Impacts Analysis & No Net Loss Report December 2018
11
The primary SED’s applied to the RC2 reach are Natural and Shoreline Residential. Key protections for 65 reasonably foreseeable development in the Natural SED of this reach include prohibitions against Commercial & Industrial, Residential and most Institutional uses. Where Transportation and Utility uses are not prohibited, they are listed as conditional uses. In the Shoreline Residential, conditional use protections involve limited allowances for Water-Oriented Commercial, Transportation and Utility uses. The impacts of the permitted Residential and Recreational uses are dealt with in CIA Section 2.2.3. 70 Rock Cove Reach
The impacts from reasonably foreseeable development in the Urban Conservancy and Active Waterfront SEDs of the RCo reach are similar to those anticipated in CR2. This reach also notably includes the Natural SED’s application to the islands of Rock Cove where conditional use protections will control much of the Boating Facilities and Institutional uses that may be proposed. The impacts of 75 the permitted Recreational uses are dealt with in CIA Section 2.2.3, below. Ashes Lake Reach – Predesignated
Reasonably foreseeable development in this reach is limited to maintenance of existing Transportation and Utility uses and is dealt with in CIA Section 2.3, below.
2.2.2 Shoreline Setbacks 80 Setbacks to OHWM and Overwater Roads & Structures are the primary indicators of ecological function directly affected by the use of SEDs and the only indicators where the indicator is expected to become Better or Worse. Setbacks from the OHWM are also displayed in SMP Table 5.1. Riparian Vegetation, Permanently Protected Areas, PHS Listings, and Impervious Surface Area are indicators that might become Somewhat Better or Worse based on the SED-specific setbacks. 85 Columbia River Reach 1 – Predesignated East Urban Area
For Reach CR1, the Shoreline Residential and Urban Conservancy SED will apply to most foreseeable development. The 50 ft setback required for residential, cemetery, water-related recreational and roads in these SEDs is likely to increase the overall mean (39 ft) and median (24 ft) setbacks for structures in that area. As a result, ecological functions based on this indicator can be expected to be Somewhat 90 Better if developed under the City’s proposed SMP. However, because these provisions are not likely to affect existing development, the 5 related indicators could be expected to get Somewhat Worse in this reach if setbacks were the only protective provision applied. Columbia River Reach 2 – Downtown Waterfront
In Reach CR2, the allowed setbacks for reasonably foreseeable development in the proposed Shoreline 95 Residential and Active Waterfront designations are much closer than the current mean (98 ft) and median (87 ft) setbacks for existing structures. Implementation of the SMP according to the proposed SEDs is expected to make this indicator Much Worse. Riparian Vegetation in this reach is already Very Degraded, and the designation of SEDs will likely result in No Change to the degree of degradation of the reach. The remaining 4 indicators for this reach could be expected to get Somewhat Worse. 100 Columbia River Reach 3 – Predesignated West Urban Area
In Reach CR3, the Urban Conservancy and Active Waterfront designations’ allowed setbacks for foreseeable development would be greater than the mean (24 ft) and median (15 ft) setback for existing structures in the reach and make this indicator Much Better. Allowances for development of replacement bridges in the Urban Conservancy designation is likely to make the Overwater Roads & 105
Exhibit C

City of Stevenson Adopted 2018 Cumulative Impacts Analysis & No Net Loss Report December 2018
12
Structures indicator Somewhat Better. Similar to CR2, the lack of existing shoreline vegetation is a factor in determining that there would be No Change in the Riparian Vegetation indicator under this proposal. The remaining 3 indicators would likely become Somewhat Worse in this reach. Rock Creek Reach 1 – City Reach
In Reach RC1, the allowed setbacks in the Urban Conservancy and Active Waterfront and Shoreline 110 Residential designations will likely decrease the mean (88 ft) and median (77 ft) existing setbacks for structures. As a result, this indicator will become Somewhat Worse based on reasonably foreseeable development. Allowances for development of replacement bridges in the Urban Conservancy designation is likely to make the Overwater Roads & Structures indicator Somewhat Better. The 4 other indicators related to SEDs would likely become Somewhat Worse. 115 Rock Creek Reach 2 – Predesignated County Reach
Except for the changes related to Overwater Roads & Structures, anticipated impacts in Reach RC2, are similar in all ways to RC1. Mean (95 ft) and median (89 ft) existing setbacks would likely decrease based on residential setback requirements of the Shoreline Residential SED. All related indicators would likely become Somewhat Worse. 120 Rock Cove Reach
In Reach RCo, the allowed setbacks for reasonably foreseeable development in the proposed Urban Conservancy and Active Waterfront designation are much closer than the current mean (88 ft) and median (92 ft) setbacks for existing structures. Implementation of the SMP according to the proposed SEDs is expected to make this indicator Much Worse. The remaining 5 indicators for this reach could be 125 expected to get Somewhat Worse if SEDs and setbacks are the only protections considered. Ashes Lake Reach – Predesignated
In Reach AL, the Natural and Urban Conservancy designations and the limited reasonably foreseeable development will likely result in No Change to any indicator of ecological function. Recommendations 130
• Do not rely on Shoreline Environment Designation management policies and setback requirements as the sole controls for impacts to Riparian Vegetation, Permanently Protected Areas, PHS Listings, Impervious Surface Area, or Overwater Roads & Structures.
Exhibit C

City of Stevenson Adopted 2018 Cumulative Impacts Analysis & No Net Loss Report December 2018
13
FIGURE 2-4 DEVELOPMENT IMPACTS & REGULATORY CONTROLS Development Activity & Associated Uses Uncontrolled Impact of Development Proposed Development Controls Anticipated Net Effect/ Recommendations
Construction, Generally
Description: This category of impacts is among the most noticeable and includes the construction materials (such as windows, construction practices (such as fill, grading, and machinery) and the buildings and structures that result.
Associated Uses: All.
Reach Affected: CR1, CR2, CR3, RC1, RC2, RCo
Ground disturbance during fill and grading activities can result in dust and excess sediment in runoff waters.
Machinery used during construction can both destabilize soils and result in their compaction. These impacts are similar, though less severe, as those discussed under impervious surfaces. The leaks and noise associated with machinery can degrade water quality and disturb nesting and rearing of sensitive species.
If sited inappropriately or constructed using inappropriate materials for their setting, inwater and overwater structures can destabilize shorelines and leach pollutants which degrade water quality. Streamside windows and outdoor lighting can lead to glare that disturbs the nesting and rearing habitats of some birds, disrupts salmon migration and feeding, and interferes with other shoreline species.
Fill, buildings, and structures in floodways and floodplains reduce the overall capacity of the system to carry water and can alter natural channel migration practices. These actions also supplant and reduce the suitability of habitat, including priority habitats and species and wetlands.
The linear nature of fences, roads and utility corridors can affect wildlife movement and survival. Roads and their culverts create major barriers for terrestrial, amphibious and aquatic species and increase mortality all species. Overhead utilities can increase bird and bat strikes and affect their mortality.
SMP Section 6.4.2 deals specifically to fill as a shoreline modification. This section applies to fill that “raises the elevation or creates dry land”. All proposals for fill require minimization and avoidance of ecological impacts. In upland areas, fill is subject to the setbacks and procedures of the allowed use or modification it supports. In more sensitive areas, fill activities are limited to those that support specific scenarios and/or priority uses.
SMP Sections 5.4.3 and 5.4.8 include siting and construction provisions relating to the avoidance of ecological impacts.
SMP Section 4.6.3-6 applies to all construction materials coming in contact with water and requires use of suitable and certified materials. SMP Section 5.4.3-3.c reiterates and strengthens this for boating facilities & overwater structures.
SMP Section 4.4.5 deals with development in flood hazard areas where the existing regulations of SMC 15.24 continue to apply. The SMP places additional limits on structural flood hazard reduction measures and requires additional analysis and certification for development in channel migration zones.
SMP Section 5.4.11 avoiding new transportation and parking facilities in shorelines and sharing them in order to reduce impacts from redundant uses. Similarly SMP Section 5.4.12 requires utility lines to cross shorelines in the least impactful manner, be placed underground, and collocated on bridges or other structures.
See also, CIA Section 2.2.1 Shoreline Environment Designations Use Allowances, CIA Section 2.2.2 Shoreline Setbacks, CIA Section 2.2.4 No Net Loss Protections, and SMC 15.24 Floodplain Management Regulations.
Indicators Projected to be Much Better: None
Indicators Projected to be Somewhat Better: 303(d) Listings, Permanently Protected Areas
Indicators where No Change is Projected: Available Floodplain Area, Shoreline Stability, Fish Blocking Culverts, Wetland Acreage, Urban Runoff
Indicators Projected to be Somewhat Worse: Riparian Vegetation, PHS Listings, Impervious Surface Area, Overwater Roads & Structures, Setbacks to OHWM
Indicators Projected to be Much Worse: None
Recommendations:
-Do not rely on development controls as the only protection from impacts to indicators of ecological function.
-Maintain access to a list of materials certified for contact with water.
-Consider adding requirements for machinery leak and spill prevention and remediation.
-Consider adding Construction as a type of shoreline modification.
-Better reference existing City, State, and federal requirements for temporary erosion and sediment control plans and BMPs at SMP Sections 6.4.2.
Impervious Surfaces & Stormwater
Description: Impervious surfaces include rooftops, paved areas, and compacted gravels and soils, prevent precipitation from infiltrating into the ground where it falls, and create stormwater runoff.
Associated Uses: Boating Facilities & Overwater Structures, Commercial & Industrial, Institutional, Recreational, Residential, Transportation & Parking, Fill, Shoreline Stabilization.
Stormwater runoff can have significant negative impacts to shorelines and the ecological health of a watershed. During rain events, large volumes of stormwater runoff can be carried to waterbodies and cause flooding and erosion and wash away habitats.
Stormwater runoff can pick up pollutants commonly found on impervious surfaces, including sediment, oil and grease, trash, and pesticides and carry them to waterways or into the groundwater. The deposition of sediments can decrease fish passage and reduce viability of habitat areas and wetlands.
As the amount of impervious surfaces increases in a watershed, the likelihood of sufficient groundwater recharge and hyporheic transfer decreases, a greater volume of stormwater runoff is generated, and a higher potential of watershed and water quality degradation exists.
The treatment of stormwater can impact shoreline ecological functions. If not located below the OHWM, stormwater outfalls may lead to scouring. If improperly designed or constructed, new outfalls and modifications to existing outfalls could impact existing native riparian vegetation or aquatic vegetation attached to, or rooted in, the substrate.
In river and stream shorelines, stormwater outfall structures may require permanent bank hardening to prevent failure of the outfall structure or erosion of the shoreline.
SMP Section 4.7 applies to all regulated activities that “affect the water quality or quantity of Stevenson shorelines”. This section requires compliance with all existing City, State, and federal stormwater laws, including the Stormwater Management Manual for Western Washington. Stormwater facilities must adhere to the setback provisions of SMP Table 5.1 and discussed in CIA 2.2.2. Existing septic systems that fail are required to connect to sewer if feasible. New septics for “any new development, business, or multifamily unit” are not allowed where sewer is available.
See also, CIA Sections 2.2.1 Shoreline Environment Designation Use Allowances, 2.2.2 Shoreline Setbacks, and 2.2.4 No Net Loss Protections.
Indicators Projected to be Much Better: None
Indicators Projected to be Somewhat Better: 303(d) Listings, Urban Runoff, Wetland Acreage
Indicators where No Change is Projected: Available Floodplain Area, Impervious Surface Area, Permanently Protected Areas, Shoreline Stability, Fish Blocking Culverts, Overwater Roads & Structures
Indicators Projected to be Somewhat Worse: Riparian Vegetation, Permanently Protected Areas, PHS Listings, Setbacks to OHWM
Indicators Projected to be Much Worse: None
Recommendations:
-Reference the Stormwater Management Manual for Western Washington (SMMWW) sooner in SMP Section 4.7.3.
-Consider removing Use-specific references to the SMMWW. -Consider development incentives for projects incorporating highly desirable low impact development strategies.
Exhibit C

City of Stevenson Adopted 2018 Cumulative Impacts Analysis & No Net Loss Report December 2018
14
Reach Affected: CR1, CR2, CR3, RC1, RC2, RCo
-Consider clarifying the specific shoreline uses and developments where sewer connection is required.
Normal Usage
Description: Though sometimes unintentional, incremental impacts from day-to-day use, maintenance practices, and ancillary usage of shoreline areas can have the most persistent and largest effect on shorelines.
Associated Uses: Boating Facilities & Overwater Structures, Commercial & Industrial, Institutional, Recreational, Residential, Transportation & Parking, Fill, Shoreline Stabilization.
Reach Affected: All
Noise and light can disrupt salmon migration and feeding, disturb the nesting and rearing habitats of some birds, and interfere with other shoreline species.
The spread of invasive and non-native species often accompanies normal use through deliberate planting and inadvertent seeding. These species can interfere with the native plant and animal species that are adapted to Stevenson particular ecological setting. When fertilizers, pesticides, herbicides and other chemical lawn/garden treatments are used for these species it can degrade water quality and health of native species and habitats in shoreline areas.
Turbidity and erosion can increase as a result of boating and heightened wave action, propeller scour, and the launching nonmotorized watercraft. The increased sediment in the water can disrupt salmon migration and feeding areas, and, where contamination previously existed in those sediments, water quality can be degraded anew.
Trash, trampling, pets, solid waste, compost, and increased foot- and vehicular-traffic results from human presence in shoreline areas. This can increase the incidents of conflict between humans and wildlife, concentrate scavengers and predators, disturb the nesting and rearing habitat of some birds, reduce air and water quality, and prevent stormwater infiltration through compacted soils.
Application of pesticides, fertilizer and other chemicals is included within the definition of regulated activities. When applied to recreational uses, these chemicals must not directly drain or runoff into surface waters.
The location of boating facilities must be chosen or developed in a way that considers turbidity- and erosion-related impacts.
The Critical Areas protections of SMP Section 4.4 are applicable to all properties and will prevent impacts to those 5 state-mandated areas.
The use-specific protective provisions of SMP Section 5.4 require site plan reviews, impervious surface limitations, and other protections that will limit impacts under this category.
See also, CIA Sections 2.2.1 Shoreline Environment Designation Use Allowances, 2.2.2 Shoreline Setbacks, and 2.2.4 No Net Loss Protections.
Indicators Projected to be Much Better: None
Indicators Projected to be Somewhat Better: 303(d) Listings, Urban Runoff
Indicators where No Change is Projected: Available Floodplain Area, Permanently Protected Areas, Shoreline Stability, Fish Blocking Culverts, Overwater Roads & Structures
Indicators Projected to be Somewhat Worse: Riparian Vegetation, , Impervious Surface Area, PHS Listings, Setbacks to OHWM, Wetland Acreage
Indicators Projected to be Much Worse: None
Recommendations:
-Consider protective controls for pesticides, fertilizers, and other chemicals associated to a broader list of shoreline uses.
Vegetation Removal
Description: Shoreline vegetation is a key component of the ecosystem, and its removal includes clearing, pruning, chemical control, and forestry practices.
Associated Uses: All.
Reach Affected: All
The removal of shoreline vegetation reduces terrestrial food supply, shade and large woody material (LWM) recruitment potential and other organic inputs which provide important habitat and food web support functions. When removed through chemical treatment, there is an effect on water quality and habitat health for other species.
Vegetation reduction warms the water, decreases in-stream and riparian habitat complexity, and decreases protection from overhead predators.
Habitat become more fragmented and wildlife travel corridors become limited.
The loss of bank vegetation can result in channel widening and affect sediment supply, which in turn affects the floodplain—needed for habitat and high flow attenuation—and the stability of the shoreline.
Shoreline vegetation also plays a role in trapping and removing sediments, nutrients and other pollutants, so the loss of vegetation can also have adverse effects on water quality. Failure to maintain vegetation or plant vegetation after site disturbance can lead to increased incidence of nonnative, invasive species. When this occurs along bluffs it can decrease root strength, create unstable slopes, and increase the likelihood of future landslides.
While Vegetation Removal is permitted in all shoreline environment designations, SMP Section 6.4.1 provides specific policies and regulation that prioritize avoidance and protection prior to removal.
All types of vegetation removal must be mitigated according to SMP Table 6.2, which requires more mitigation for high priority native species and locations closer to the OHWM. Mitigation ratios range from 1:1 to 3:1 and require planting of 2 trees and 5 shrubs per 400 sq ft. Mitigation areas must be monitored for 5 years and contingency planting is required.
Specific regulations facilitate removal of noxious aquatic and terrestrial weeds while protecting against degradation of other ecological functions.
Indicators Projected to be Much Better: Riparian Vegetation, Permanently Protected Areas, PHS Listings
Indicators Projected to be Somewhat Better: 303(d) Listings, Wetland Acreage
Indicators where No Change is Projected: Available Floodplain Area, Shoreline Stability, Fish Blocking Culverts, Impervious Surface Area, Overwater Roads & Structures, Setbacks to OHWM, Urban Runoff
Indicators Projected to be Somewhat Worse: None.
Indicators Projected to be Much Worse: None
Recommendations:
-Consider adding a stronger requirement for conservation covenants related to Habitat Conservation Areas and better connecting it with the Vegetation Removal Mitigation requirements of SMP Table 6.2 and SMP Section 6.4.1.
135
Exhibit C

City of Stevenson Adopted 2018 Cumulative Impacts Analysis & No Net Loss Report December 2018
15
• Consider increasing setbacks for reasonably foreseeable development in the Urban Conservancy, Active Waterfront and Shoreline Residential SEDs.
• Consider where additional Natural SEDs could be applied instead of Shoreline Residential, Urban Conservancy, and/or Active Waterfront.
2.2.3 Impacts of Regulated Activities 140 Many types of shoreline use and modification involve the same development activities. This analysis relies on the descriptions in Figure 2-4 below to evaluate the impacts of reasonably foreseeable development. These descriptions include analyses of 1) the uncontrolled impacts of development activities, 2) the reasonably foreseeable uses associated with the development activities, 3) the proposed regulatory controls of the Draft SMP, and 4) the expected effects of the impact controls. 145
2.2.4 No Net Loss Protections Where the development controls described above can allow loss of shoreline ecological functions if implemented alone, the Environmental Protection & No Net Loss provisions of SMP Section 4.3 fill the gap to ensure new regulated activities do not result in a loss of ecological function. Like all provisions in SMP Chapter 4, these protections apply to all uses and require a Mitigation Sequence to Avoid, 150 Minimize, Rectify, Reduce over time, Compensate, and Monitor impacts to ecological functions. Furthermore, this section requires new regulated activities to consider cumulative impacts of other reasonably foreseeable development affecting the same shoreline. Projected Changes to Indicators
On their own, the provisions of SMP Section 4.3 will prevent overall loss or degradation of ecological 155 functions at the project level, however, they will ensure that each regulated project does not degrade ecological functions. This will effectively prevent any of the potential negative impacts on ecological functions identified in CIA Sections 2.2.1 through and 2.2.3. does not occur, however, The No Net Loss provisions of SMP Section 4.3 do not alter the SMP’s improvement of ecological functions are any other beneficial effects identified above. 160 Recommendations
The No Net Loss section places the burden of proof on the proponent that ecological functions will not be lost based on their proposal. The recommendations included in CIA Section 2.2.1 and Figure 2-4 may be an effective way reduce that burden for the proponent. Alternatively, if any other part of this program is determined to cause net loss of ecological function, those recommendations may be 165 helpful remedies.
2.3 Impacts of Exempt and Unregulated Activities As a small and slow growing community, the biggest losses of shoreline ecological functions are expected to occur as a result of existing shoreline development and development that is outside of shoreline jurisdiction or otherwise exempt under the SMP. These impacts are expected in much the 170 same way that impacts from normal usage are considered in CIA Figure 2-4. However, impacts anticipated from this category must rely on existing programs for their control.
There are several local, state, and federal regulations implemented by a variety of agencies that may provide beneficial effects for both development and protection within and affecting Stevenson’s shoreline jurisdiction. An incomplete list of such programs is included in ICR Section 1.3. As a result of 175
Exhibit C

City of Stevenson Adopted 2018 Cumulative Impacts Analysis & No Net Loss Report December 2018
16
implementation of these programs some of the preventative effects of SMP regulations will also be realized. Some additional degradation, however, is also expected as displayed in CIA Figure 2-5.
FIGURE 2-5 ECOLOGICAL IMPACTS OF EXEMPT AND UNREGULATED ACTIVITIES
Much Worse
Somewhat Worse
No Change
Somewhat Better
Much Better
None Available Floodplain Area, Riparian Vegetation, Permanently Protected Areas, PHS Listings, 303(d) Listings, Impervious Surface Area, Urban Runoff
Shoreline Stability, Fish-Blocking Culverts, Wetland Acreage, Overwater Roads & Structures Setbacks to OHWM,
None None
Recommendations 180
• Encourage coordination with other local, state, and federal authorities related to review of projects that are either exempt from shoreline compliance or outside of shoreline jurisdiction.
• Encourage retrofitting existing stormwater collection and treatment located outside of shoreline jurisdiction to improve water quantity and quality expectations before it reaches the shoreline. 185
• Consider enhancement projects for riparian corridors outside of shoreline jurisdiction.
2.4 Impacts of Restoration Activities While detrimental impacts are the primary concern of the preceding sections, the Shoreline Restoration Plan (RP) focuses on actions that can be taken to benefit ecological functions in shoreline areas. Figure 2-6, details the reach-level impacts expected by implementation of the Shoreline Restoration Plan. 190
Exhibit C

City of Stevenson Adopted 2018 Cumulative Impacts Analysis & No Net Loss Report December 2018
17
FIGURE 2-6 ECOLOGICAL IMPACTS OF RESTORATION PLAN
Shoreline Reach Impact Narrative
Projected Indicator Changes
Ava
ilabl
e Fl
oodp
lain
Are
a
Ripa
rian
Vege
tatio
n
Shor
elin
e St
abili
ty
Fish
-Blo
ckin
g Cu
lver
ts
Perm
anen
tly
Prot
ecte
d Ar
eas
PHS
List
ings
Wet
land
Acr
eage
303(
d) L
istin
gs
Impe
rvio
us
Surf
ace
Are
as
Ove
rwat
er R
oads
&
Str
uctu
res
Setb
acks
to
OH
WM
Urb
an R
unof
f
All Reaches Some level of improvement in indicators is expected based on the following general projects: R.0 – Identifying that future restoration projects are likely but have not been identified will improve the effectiveness of the Restoration Plan in all reaches. R.10 – Identifying restoration partners will improve the implementation of restoration projects in all reaches. R.11 – Implementing the CAO is dealt with in CIA Section 2.3, above. R.12 – Promoting statewide improvements in the regulation of wetlands will ensure impacts are avoided whenever wetlands exist in shoreline areas. R.14 – Providing incentives for restoration projects will benefit ecological functions in all reaches.
Columbia River Reach 1 – East Urban Area
R.5 – Invasive aquatic, riparian and terrestrial species exist along all shoreline reaches and their removal will benefit water quality, water quantity and habitat functions. R.7 – Kanaka Creek separates Columbia River Reaches 1 & 2. This fish-bearing stream has passage barriers along its length. Correction of these barriers will benefit water quantity and habitat functions for these 2 reaches.
Columbia River Reach 2 – Downtown Waterfront
R.5, R.7, R.10, R.15 – See descriptions in CR1, above. R.3 – By completing its Stevenson Shoreline Restoration & Enhancement Project the Port of Skamania County will soften riprap armoring and eliminate excessive erosion in the Downtown Waterfront reach. This will benefit water quality, water quantity, and habitat.
Columbia River Reach 3 – West Urban Area
R.5 – See description in CR1, above.
Shoreline Reach Impact Narrative Projected Indicator Changes
Exhibit C

City of Stevenson Adopted 2018 Cumulative Impacts Analysis & No Net Loss Report December 2018
18
Ava
ilabl
e Fl
oodp
lain
Are
a
Ripa
rian
Vege
tatio
n
Shor
elin
e St
abili
ty
Fish
-Blo
ckin
g Cu
lver
ts
Perm
anen
tly
Prot
ecte
d Ar
eas
PHS
List
ings
Wet
land
Acr
eage
303(
d) L
istin
gs
Impe
rvio
us
Surf
ace
Are
as
Ove
rwat
er R
oads
&
Str
uctu
res
Setb
acks
to
OH
WM
Urb
an R
unof
f
Rock Creek Reach 1 – City Reach
R.5 – See description in CR1, above. R.1 – Continued implementation of this project will help this reach recover a steady-state after being overwhelmed with sediment from the Piper Road landslide. R.2 – Removal of this bridge and all associated pilings will benefit flood and fish passage through the system and greatly improve water quantity and habitat functions. R.8 – Removal of this derelict near-stream structure will improve water quality, water quantity, and habitat functions. R.13 – Replacing the direct stormwater outfall with an engineered treatment system will improve water quality from this outfall, which drains a substantial portion of the city’s residential core.
Rock Creek Reach 2 – County Reach
R.1, R.2 – See description in RC1, above. R.5 – See description in CR1, above.
Rock Cove Reach R.1 – See description in RC1, above. R.5 – See description in CR1, above. R.4 – Rehabilitating Rock Cove involve removing invasive species, improving depth-to-width ratios, removing derelict creosote piles, and removing other remnants of the waterbody’s industrial past. Doing so will improve water quality, water quantity, and habitat functions. R.6 – Replacing the culvert for Foster Creek, which provides a fresh source of surface water to Rock Cove will remove a fish-passage barriers and will benefit water quantity and habitat functions for this reach R.9 – Redevelopment of the Old Hegewald Mill site could involve removal of invasive species and recolonization by native species and improvement of water quality measures for the largely impervious site. This will improve water quality and habitat functions.
Ashes Lake Reach No specific restoration projects are identified for this reach.
Exhibit C

City of Stevenson Adopted 2018 Cumulative Impacts Analysis & No Net Loss Report December 2018
19
Chapter 3 – Cumulative Impacts Analysis
3.1 Net Effect of Impacts The combination of the projected changes in indicators of shoreline ecological functions based on the CIA Figure 2-1, above enables a cumulative impacts analysis. In most cases, as described below, implementation of the draft SMP as it relates to foreseeable development as well as implementation of 5 the Restoration Plan, will likely lead to improved ecological functions in Stevenson’s shoreline areas. While 3 indicators of ecological function are expected to decline after SMP implementation, there are protections in place to ensure the decline of the indicator will not lead to a decline of the underlying ecological function. Chapter 2 of this report identifies some additional protections and changes that could help improve interpretation and implementation and avoid any declines. These 10 recommendations should be considered 1) as part of the ongoing review and amendment of the SMP documents and 2) during review of some individual permits identifying impacts that were not anticipated as part of this cumulative impacts analysis.
3.2 Gained Ecological Functions The following indicators of ecological function are expected to improve if this draft SMP is 15 implemented.
3.2.1 Available Floodplain Area In general shoreline use and development will not change the available floodplain area, however, the projects of the restoration plan will lead to improvements in several reaches. As a result, the ecological functions related to this indicator are likely to see the greatest improvement. 20
3.2.2 Riparian Vegetation The vegetation conservation, removal and mitigation requirements of the SMP are likely to lead to another of the greatest improvements in indicators of ecological function expected through this SMP. The inclusion of restoration projects furthers the benefit and improvement of ecological functions related to this indicator is expected in all reaches. 25
3.2.3 Shoreline Stability The Restoration Plan projects are the primary determinants for improved ecological functions based on the Shoreline Stability indicator, and the expected improvements are limited to both Rock Creek reaches.
3.2.4 Fish-Blocking Culverts 30 Fish-blocking culverts should largely be a concept of the past based on existing permit requirements. Where they currently exist, the Restoration Plan projects prioritize removal, and this should lead to an improvement of ecological functions, especially based on the Kanaka Creek, Foster Creek, and Rock Creek Drive Bridge projects.
Exhibit C

City of Stevenson Adopted 2018 Cumulative Impacts Analysis & No Net Loss Report December 2018
20
3.2.5 Permanently Protected Areas 35 Where development is expected, the designation of permanently protected areas can also be expected based on SMP provisions requiring conservation covenants for critical areas protection. Ecological functions related to this indicator are likely to improve in all reaches except Ashes Lake.
3.2.6 PHS Listings Wherever Riparian Vegetation and Permanently Protected Areas are improved, the quality habitat for 40 PHS Listings should also improve based on the critical areas protections of SMP Section 4.4.
3.2.7 Wetland Acreage Protections for wetlands are included in SMP Section 4.4, and the Restoration Plan considers projects that will enhance the City’s ability to protect and improve wetland functions in shoreline areas.
3.2.8 Overwater Roads & Structures 45 Protections related to new Overwater Roads & Structures together with Restoration Plan projects to remove them where they currently exist will lead to an improvement of ecological functions related to this indicator, especially in the Downtown Waterfront, Rock Cove, and Rock Creek reaches.
3.2.9 Urban Runoff Citywide implementation of the Stormwater Management Manual for Western Washington along with 50 voluntary retrofitting and stormwater treatment identified in the Restoration Plan will improve the quality and quantity of runoff received by Stevenson Shorelines. Ecological functions related to this indicator are likely to improve as a result.
3.3 Lost Ecological Functions Based on the current draft SMP, some reduction in ecological function is expected through the 55 following indicators.
3.3.1 303(d) Listings The most variable of the indicators analyzed, 303(d) Listings are largely based on ecosystem-wide processes beyond the scope of this SMP. Protections and restoration related to the SMP and the Restoration Plan exist, but are unlikely to change downward water quality trends, especially in the 60 Columbia River and Rock Cove reaches.
3.3.2 Impervious Surface Area Continued development is expected to occur in shoreline areas and will have an unavoidable impact on total impervious surface coverage. The draft SMP includes some offsets for the underlying ecological functions, but there is expected to be a decrease in rating for this indicator. 65
3.3.3 Setbacks to OHWM Similarly, continued development is expected to increase the number of structures in the shoreline area and in all but Columbia River Reach 1, this indicator is expected to decrease. However, the draft SMP includes some offsets to the underlying ecological functions impacted by this decrease.
Exhibit C

City of Stevenson Adopted 2018 Cumulative Impacts Analysis & No Net Loss Report December 2018
21
3.4 Achievement of No Net Loss 70
Per the SMA guidance, an SMP must allow “the utilization of shorelines for economically productive uses that are particularly dependent on shoreline location and provides preferential accommodation of single-family uses” while achieving “no net loss” of ecological functions. As this analysis shows, Stevenson’s Draft SMP balances standards of protection to shorelines while allowing and accommodating appropriate shoreline uses and developments justifying that the no net loss standard 75 has been satisfied.
3.4.1 Key Programmatic Protections The Draft SMP protects shorelines while still accommodating preferred shoreline uses and recognizing private property rights. The proposed regulations are based on a detailed inventory of ecosystem-wide and shoreline reach conditions as well as detailed knowledge about threats facing shoreline resources. 80
• Shoreline environment designations to protect or enhance the current or desired character of shorelines.
• A system of Prohibited, Conditional, and Permitted uses that provides additional controls leading to the current or desired character of shorelines.
• General policies and regulations intended to protect the shoreline functions, as well as policies 85 designed to protect specific shoreline functions, such as water quality, water quantity, vegetation, and habitat.
• Specific vegetation conservation standards combined with use setbacks and reach-specific riparian area buffers to protect shoreline ecological functions.
• Critical areas regulations to provide protections for wetlands, fish and wildlife habitat, critical 90 aquifer recharge areas, flood hazard areas, and geologically hazardous areas.
• Local, state, and federal regulations to ensure that shoreline impacts are avoided, minimized, and/or mitigated.
• Restoration activities and programs that are expected to improve shoreline functions. These non-regulatory enhancement and restoration activities are likely to offset or minimize 95 potentially adverse unanticipated and/or incremental cumulative impacts within the County’s shoreline jurisdiction.
One of the primary ways that no net loss is achieved in the SMP is through vegetation removal and mitigation provisions. The SMP relies on reach-specific shoreline buffers to determine appropriate riparian habitat buffers where heighted standards exist for all types of vegetation removal. Outside of 100 buffer areas, the mitigation requirements of SMP Table 6-2 also apply to removal of all trees in shoreline jurisdiction.
3.4.2 Degraded Indicators vs. Loss of Function This analysis relies on the several indicators of ecological functions that where established in the Inventory & Characterization Report. These indicators provide measurable comparisons for certain 105 aspects of ecological functions, but changes in-and-of-themselves are not a direct statement of ecological functions. The assessment of indicators related to altered conditions is particularly troublesome in making direct comparisons to net loss of functions, because, as stated above the establishment of economically productive uses in shoreline areas is encouraged. As a result, a balancing act is necessary to ensure additional altered conditions are coupled with improvements to 110
Exhibit C

City of Stevenson Adopted 2018 Cumulative Impacts Analysis & No Net Loss Report December 2018
22
the indicators related to the physical and biological environment, and more importantly, the water quality, water quantity, and habitat functions of the shoreline. CIA Section 3.2 and 3.3 demonstrate the success of this balancing act within Stevenson’s shoreline jurisdiction.
3.4.3 Conclusion Given the policy guidance and regulatory requirements proposed, including the implementation of the 115 shoreline restoration plan and the key vegetation removal and setback features listed above, the implementation of the Draft SMP is anticipated to achieve no net loss of ecological functions in the city’s shorelines. Stevenson’s robust vegetation standards are more specific and require greater mitigation than what most rural communities require, and account for temporal losses and the possibility of failure of mitigation efforts. In the long term, a net gain in functions is likely in many 120 instances, because the mitigation ratios exceed 1:1 and will eventually result in larger, better functioning resources than those impacted. Additionally, monitoring and conservation covenant requirements will ensure the success of mitigation sites and their protection from future development in perpetuity. Therefore, the SMP policies and regulations will result in no net loss of ecological functions or values of shorelines. 125
Exhibit C

Page Intentionally Left Blank
Exhibit C

Stevenson Planning Department PO Box 371 Stevenson, WA 98648 www.ci.stevenson.wa.us
Exhibit C