wwtp effluent violation corrective actions - saws.org€¦ · 2.0 leon creek waste water treatment...
TRANSCRIPT
SSO Reduction Program
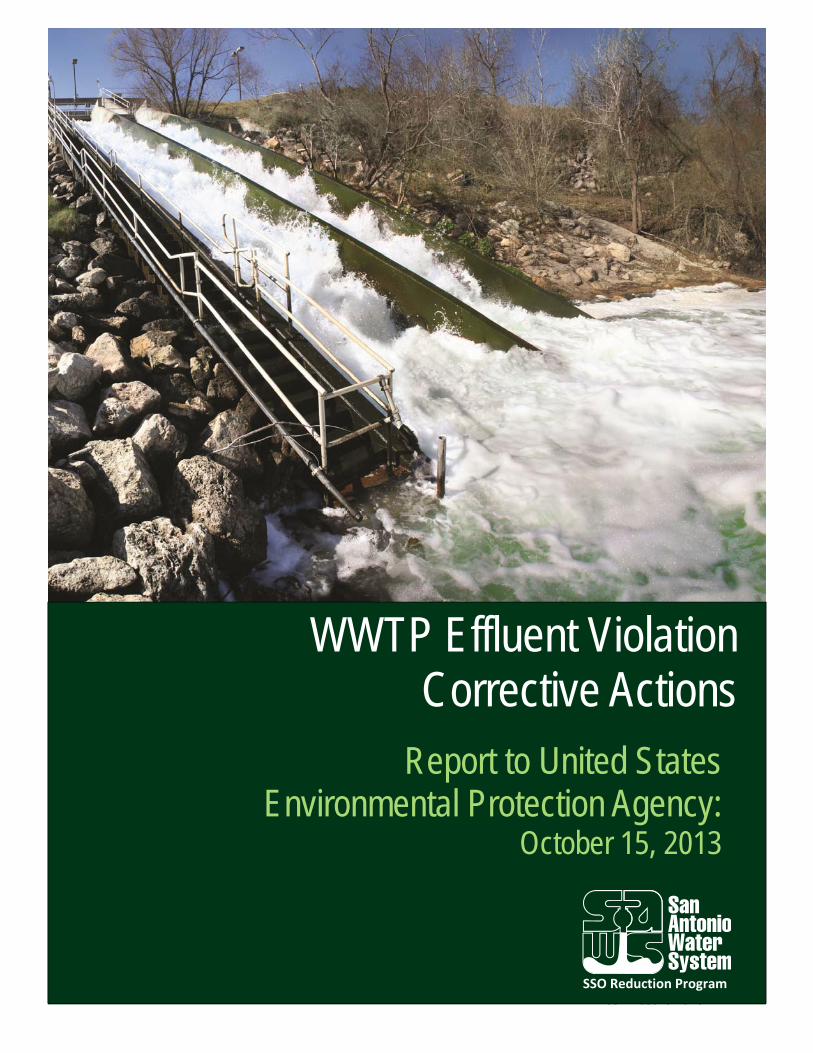
Report to United States Environmental Protection Agency:
October 15, 2013
WWTP Effluent Violation Corrective Actions
SSO Reduction Program

October 15, 2013
WWTP Effluent Violation Corrective Actions
This page intentionally left blank
October 15, 2013
i WWTP Effluent Violation Corrective Actions
WWTP Effluent Violation Corrective Actions
Report to United States Environmental Protection Agency TABLE OF CONTENTS
Section Pages
1.0 INTRODUCTION ............................................................................................................. 1
2.0 Leon Creek Waste Water Treatment Plant (TX0052639) ............................................. 2
3.0 Salado Creek Waste Water Treatment Plant (TX0052647) .......................................... 6
4.0 Medio Creek Waste Water Treatment Plant (TX0055689) .......................................... 8
5.0 Dos Rios Waste Water Treatment Plant (TX0077801) ............................................... 11
6.0 CERTIFICATION ............................................................................................................ 19
LIST OF TABLES
Table 2-1: October 2003 Violations ................................................................................................ 2
Table 2-2: October 2005 Violations ................................................................................................ 2
Table 2-3: December 2005 Violations ............................................................................................. 3
Table 2-4: September 2008 Violations ........................................................................................... 3
Table 2-5: February 2009 Violations ............................................................................................... 4
Table 2-6: December 2009 Violations ............................................................................................. 4
Table 2-7: June 2011 Violations ...................................................................................................... 5
October 15, 2013
ii WWTP Effluent Violation Corrective Actions
Table 2-8: December 2011 Violations ............................................................................................. 5
Table 3-1: March 2003 Violations ................................................................................................... 6
Table 3-2: May 2003 Violations ...................................................................................................... 6
Table 3-3: July 2006 Violations ....................................................................................................... 7
Table 4-1: July 2007 Violations ....................................................................................................... 8
Table 4-2: August 2007 Violations .................................................................................................. 9
Table 4-3: March 2009 Violations ................................................................................................... 9
Table 5-1: December 2006 Violations ........................................................................................... 11
Table 5-2: January 2007 Violations ............................................................................................... 11
Table 5-3: August 2007 Violations ................................................................................................ 12
Table 5-4: December 2007 Violations ........................................................................................... 12
Table 5-5: March 2008 Violations ................................................................................................. 12
Table 5-6: January 2009 Violations ............................................................................................... 13
Table 5-7: September 2009 Violations ......................................................................................... 13
Table 5-8: January 2010 Violations ............................................................................................... 14
Table 5-9: January 2011 Violations ............................................................................................... 15
Table 5-10: January, September and October 2011 Violations .................................................... 15
Table 5-11: January 2012 Violations ............................................................................................. 17
Table 5-12: March 2012 Violations ............................................................................................... 17
Table 5-13: May 2012 Violations .................................................................................................. 18
Table 5-14: October 2012 Violations ............................................................................................ 18
October 15, 2013
1 of 19 WWTP Effluent Violation Corrective Actions
1.0 INTRODUCTION
On July 23, 2013, a Consent Decree between the San Antonio Water System (“SAWS”), the United States of America and the State of Texas was lodged in Civil Action No. 5:13-cv-00666; United States of America and State of Texas v. San Antonio Water System, in the United States District Court for the Western District of Texas, San Antonio Division (the “Consent Decree”). Paragraph 48 of the Consent Decree provides as follows:
H. WWTP EFFLUENT VIOLATION CORRECTIVE ACTIONS
48. Appendix H contains a list of SAWS reported effluent limitation violations during the period between March 1, 2003 and December 31, 2012 at its Dos Rios, Salado Creek, Medio Creek and Leon Creek WWTPs and at Mitchell Lake. Within 3 months from Date of Lodging, SAWS shall complete an analysis of the causes of effluent violations at its WWTPs, listed in Appendix H, and implement all corrective actions necessary to prevent future effluent violations. No later than 3 months from Date of Lodging, SAWS shall submit a report to EPA that summarizes the findings of the analysis and the corrective actions implemented by SAWS to prevent future effluent violations.
PURPOSE
This Report is submitted to the United States Environmental Protection Agency in compliance with this requirement of the Consent Decree.

October 15, 2013
2 of 19 WWTP Effluent Violation Corrective Actions
2.0 LEON CREEK WASTE WATER TREATMENT PLANT (TX0052639)
The causes of the effluent violations listed in Appendix H for the Leon Creek Waste Water Treatment Plant (WWTP) and the corrective actions implemented by SAWS to prevent future violations are described hereafter. All Tables that appear hereafter present data taken from Appendix H.
Table 2-1: October 2003 Violations
Date Outfall Parameter Violations Permit Limit No. of Violations
10/03 001 DO, min. 4.1 mg/l 5.0 mg/l 1
10/03 001 NH3-N, max. 17.64 mg/l 7 mg/l 2
10/03 001 CBOD, max. 53.0 mg/l 17 mg/l 1
These three violations were caused by a total power failure at the Leon Creek WWTP. Emergency generators at the headworks and at the chlorination/dechlorination facilities continued to operate properly during the period of power loss.
A short or cross phase occurred in the switch mechanism at the facility that supplied power to one of the main process blowers at the plant. Extensive electrical equipment damage was caused that required repair. CPS Energy, the utility supplying electricity to the Leon Creek WWTP, completed improvements to the substation providing electricity to the plant to prevent future occurrences.
Table 2-2: October 2005 Violations
Date Outfall Parameter Violations Permit Limit No. of Violations
10/05 001 NH3-N, max. 7.42 mg/l 7 mg/l 1

October 15, 2013
3 of 19 WWTP Effluent Violation Corrective Actions
This violation occurred when a painting contractor closed off the aeration basin air headers without SAWS’ knowledge or permission. Shutting off the air headers resulted in lower than normal dissolved oxygen in the aeration basins. As soon as SAWS became aware of the problem the air headers were turned on. Operating procedures were revised to prevent future occurrences.
Table 2-3: December 2005 Violations
Date Outfall Parameter Violations Permit Limit No. of Violations
12/05 001 NH3-N, avg. 2.03 mg/l 2 mg/l 31
12/05 001 NH-3-N, max. 7.25 mg/l 7 mg/l 1
On December 27, 2005, SAWS reported results of analysis in excess of permit limits for daily maximum of NH3-N. This single event also caused the facility to exceed its monthly average limit. SAWS suspects that the sample container used to collect the final effluent sample was contaminated and that the results of analysis were erroneous. Sampling protocols have been implemented to prevent the recurrence of erroneous results.
Table 2-4: September 2008 Violations
Date Outfall Parameter Violations Permit Limit No. of Violations
09/08 002 pH, min. 5.9 s.u. 6.0 mg/l 1
Despite investigation, SAWS was not able to determine a cause for this reported violation. Normal plant operations corrected the violation and no further action was taken. Note the units for the permit limit were reported as mg/l in Appendix H. The units should have been s.u.
October 15, 2013
4 of 19 WWTP Effluent Violation Corrective Actions
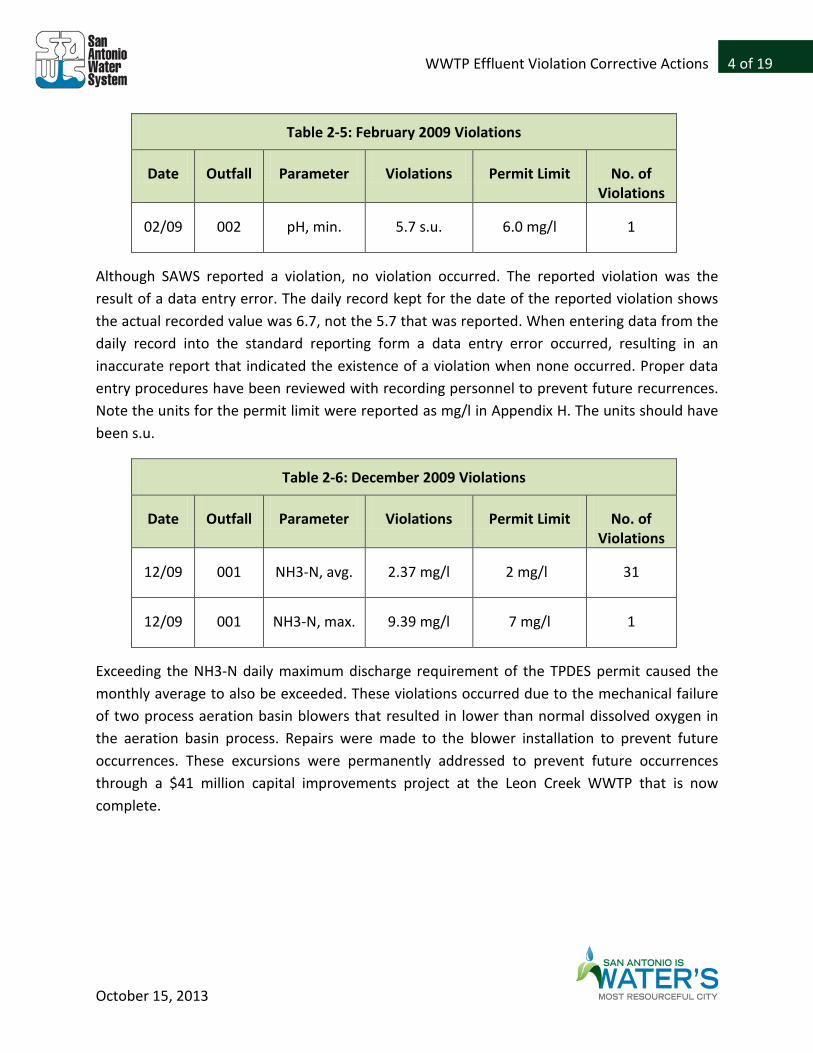
Table 2-5: February 2009 Violations
Date Outfall Parameter Violations Permit Limit No. of Violations
02/09 002 pH, min. 5.7 s.u. 6.0 mg/l 1
Although SAWS reported a violation, no violation occurred. The reported violation was the result of a data entry error. The daily record kept for the date of the reported violation shows the actual recorded value was 6.7, not the 5.7 that was reported. When entering data from the daily record into the standard reporting form a data entry error occurred, resulting in an inaccurate report that indicated the existence of a violation when none occurred. Proper data entry procedures have been reviewed with recording personnel to prevent future recurrences. Note the units for the permit limit were reported as mg/l in Appendix H. The units should have been s.u.
Table 2-6: December 2009 Violations
Date Outfall Parameter Violations Permit Limit No. of Violations
12/09 001 NH3-N, avg. 2.37 mg/l 2 mg/l 31
12/09 001 NH3-N, max. 9.39 mg/l 7 mg/l 1
Exceeding the NH3-N daily maximum discharge requirement of the TPDES permit caused the monthly average to also be exceeded. These violations occurred due to the mechanical failure of two process aeration basin blowers that resulted in lower than normal dissolved oxygen in the aeration basin process. Repairs were made to the blower installation to prevent future occurrences. These excursions were permanently addressed to prevent future occurrences through a $41 million capital improvements project at the Leon Creek WWTP that is now complete.

October 15, 2013
5 of 19 WWTP Effluent Violation Corrective Actions
Table 2-7: June 2011 Violations
Date Outfall Parameter Violations Permit Limit No. of Violations
06/11 001 NH3-N, max. 8.18 mg/l 7 mg/l 1
06/11 002 NH3-N, max. 8.18 mg/l 7 mg/l 1
These violations occurred during construction of new air piping for the aeration system and new blowers for the treatment plant. The process blowers were turned off to connect the new above-ground air distribution system that supports the biological treatment process in the aeration basins. This resulted in insufficient reaction time and elevated ammonia concentrations. These excursions were addressed to prevent future occurrences through a $41 million capital improvements project at the Leon Creek WWTP that is now complete.
Table 2-8: December 2011 Violations
Date Outfall Parameter Violations Permit Limit No. of Violations
12/11 001 E. Coli, max. 1160 CFU/100 394 CFU/100 1
This reported violation was the result of a sampling error by the operator taking the compliance sample. Sampling procedures were reviewed with SAWS staff to prevent future recurrences.

October 15, 2013
6 of 19 WWTP Effluent Violation Corrective Actions
3.0 SALADO CREEK WASTE WATER TREATMENT PLANT (TX0052647)
The causes of the effluent violations listed in Appendix H for the Salado Creek WWTP and the corrective actions implemented by SAWS to prevent future violations are described hereafter.
Table 3-1: March 2003 Violations
Date Outfall Parameter Violations Permit Limit No. of Violations
03/03 001 TRC, min. 0.95 mg/l 1.0 mg/l 1
03/03 004 TRC, min. 0.95 mg/l 1.0 mg/l 1
The two violations reported arose out of a single event that affected two outfalls of the Salado Creek WWTP. The chlorine cylinders that were on line ran out of chlorine. The chlorine feeding mechanism was switching to backup cylinders at the time that the sampling occurred for chlorine residual. Analysis of a sample taken 20 minutes after the feed was switched demonstrated a return to a chlorine residual above 1.0 mg/l, achieving permit compliance. Equipment adjustments were made to ensure that the minimum chlorine residual required by the TPDES permit was maintained.
Table 3-2: May 2003 Violations
Date Outfall Parameter Violations Permit Limit No. of Violations
05/03 004 TRC, min. 0.60 mg/l 1.0 mg/l 1
This violation occurred because evaporator pressure regulator valve filters were clogged with debris, resulting in insufficient chlorine feed. SAWS amended its operating procedures to rotate equipment on the first day of each month to perform maintenance and filter inspection and cleaning to prevent future occurrences of the condition causing this excursion.

October 15, 2013
7 of 19 WWTP Effluent Violation Corrective Actions
Table 3-3: July 2006 Violations
Date Outfall Parameter Violations Permit Limit No. of Violations
07/06 001 NH3-N, avg. 3.24 mg/l 2 mg/l 31
07/06 001 NH3-N, max. 8.18 mg/l 7 mg/l 1
07/06 002 NH3-N, avg. 3.24 mg/l 2 mg/l 31
07/06 002 NH3-N, max. 8.18 mg/l 7 mg/l 1
07/06 002 TRC, max. 1.10 mg/l .099 mg/l 31
07/06 004 NH3-N, avg. 3.24 mg/l 2 mg/l 31
07/06 004 NH3-N, max 8.18 mg/l 7 mg/l 1
The NH3-N daily maximum, and weekly average and monthly average discharge limitation violations occurred during the process of plant shutdown immediately before termination of all treatment operations at this facility. Repeated power failures caused severe damage to the aeration system that caused these excursions.
All sewage flow was transferred from the Salado Creek WWTP to the Dos Rios WWTP on July 14, 2006. The Salado Creek WWTP was subsequently demolished and no sewage treatment (other than bar screens to remove trash) has occurred at the plant since July 2006.

October 15, 2013
8 of 19 WWTP Effluent Violation Corrective Actions
4.0 MEDIO CREEK WASTE WATER TREATMENT PLANT (TX0055689)
The causes of the effluent violations listed in Appendix H for the Medio Creek WWTP and the corrective actions implemented by SAWS to prevent future violations are described hereafter.
Table 4-1: July 2007 Violations
Date Outfall Parameter Violations Permit Limit No. of Violations
07/07 001 Flow, avg. 15,573 gpm 14,757 gpm 1
On July 21, 2007 the Medio Creek WWTP recorded a two hour peak flow event that was in excess of permit limits. The influent pump station to the plant is equipped with three 8-inch and two 12-inch pumps. The larger pumps are required to manage high flow events. On July 21, 2007 one of the 12-inch pumps was out of service being repaired. During the night of July 20, 2007 a heavy rainfall event occurred that damaged the variable speed drive of the one operable 12-inch pump, rendering it inoperable. Electricians performed temporary repairs to the pump during the storm event, but the temporary repairs required that the pump be run at 100% of the flow rate instead of the variable flow rate as designed. During the high flow event resulting from heavy rainfall, the inability to use the variable speed capacity of the 12-inch pumps impacted SAWS ability to manage flow. The additional flow did not impact plant processes or cause any effluent discharge excursions. SAWS subsequently repaired all pumps to prevent future occurrences.
As part of a $49.8 million capital improvements project to the Medio Creek WWTP that was completed in 2010, SAWS TPDES permit has been amended to provide a peak two hour flow of 27,778 gpm that will prevent future occurrences.

October 15, 2013
9 of 19 WWTP Effluent Violation Corrective Actions
Table 4-2: August 2007 Violations
Date Outfall Parameter Violations Permit Limit No. of Violations
08/07 001 Flow, avg. 16,506 gpm 14,757 gpm 1
On August 16, 2007 the Medio Creek WWTP recorded a two hour peak flow event that was in excess of permit limits. The peak flow was caused by heavy rainfall from tropical storm Erin that deposited approximately 9.6 inches of rain during a three to four hour period. The additional flow did not impact plant processes or cause any effluent discharge excursions.
As part of a $49.8 million capital improvements project to the Medio Creek WWTP that was completed in 2010, SAWS TPDES permit has been amended to provide a peak two hour flow of 27,778 gpm that will prevent future occurrences.
Table 4-3: March 2009 Violations
Date Outfall Parameter Violations Permit Limit No. of Violations
03/09 001 CBOD, max. >10 mg/l 25 mg/l 1
03/09 001 NH3-N, avg. 2.28 mg/l 2 mg/l 31
03/09 001 TSS, max. 119 mg/l 40 mg/l 1
The CBOD value reported -- 10mg/l -- did not exceed the regulatory maximum of 25 mg/l. The violation reported for CBOD resulted from the use of laboratory techniques that were not sufficient to determine regulatory compliance. Corrective action has been taken to ensure that laboratory procedures will permit determination that the regulatory maximum permit limit has not been exceeded.
The reported violations for NH3-N and TSS resulted from construction activities during a major capital improvements program at the Medio Creek WWTP. The Plant experienced sludge settling problems caused by the flushing of new lines and tanks as part of a 7.5 MGD expansion

October 15, 2013
10 of 19 WWTP Effluent Violation Corrective Actions
project. The continuous process of draining and washing the post-aeration chamber and the stirring of the contents to remove the sludge build up caused the TSS violation.
The draining and washing activities led to a higher incidence of filamentous organisms requiring process adjustments that brought the NH3-N concentrations back into regulatory compliance. The capital improvements project is complete and there have not been further violations.
October 15, 2013
11 of 19 WWTP Effluent Violation Corrective Actions
5.0 DOS RIOS WASTE WATER TREATMENT PLANT (TX0077801)
The causes of the effluent violations listed in Appendix H for the Dos Rios WWTP and the corrective actions implemented by SAWS to prevent future violations are described hereafter.
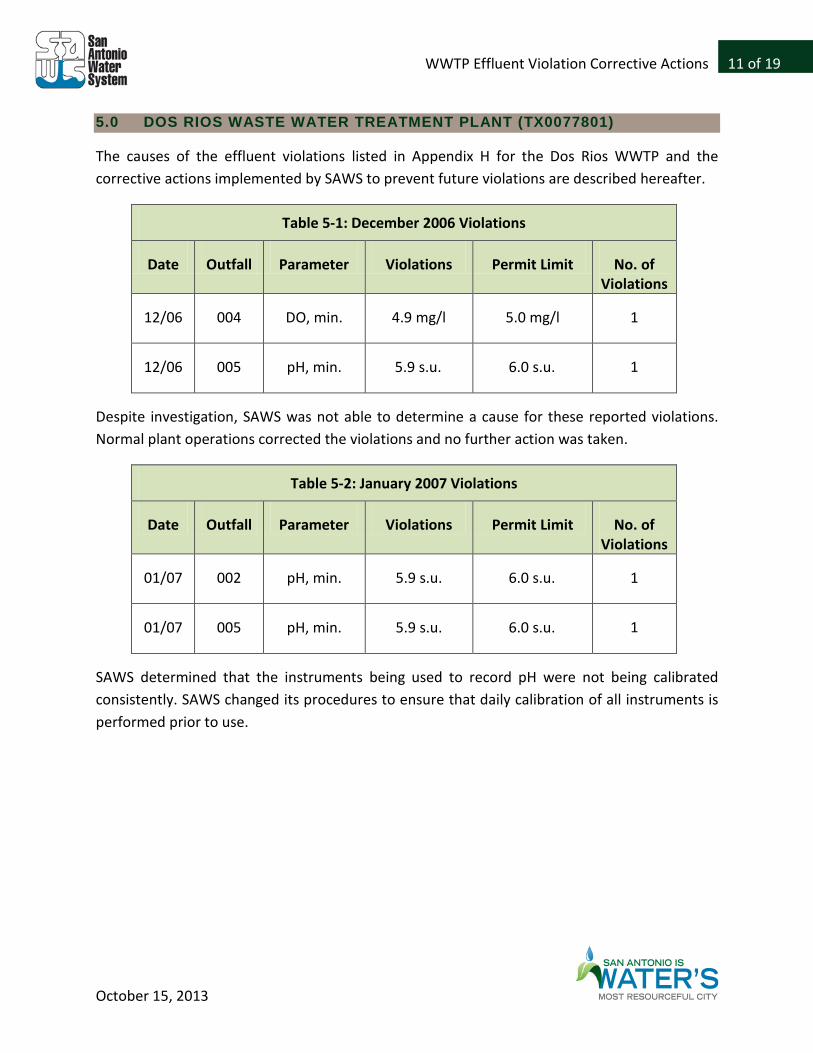
Table 5-1: December 2006 Violations
Date Outfall Parameter Violations Permit Limit No. of Violations
12/06 004 DO, min. 4.9 mg/l 5.0 mg/l 1
12/06 005 pH, min. 5.9 s.u. 6.0 s.u. 1
Despite investigation, SAWS was not able to determine a cause for these reported violations. Normal plant operations corrected the violations and no further action was taken.
Table 5-2: January 2007 Violations
Date Outfall Parameter Violations Permit Limit No. of Violations
01/07 002 pH, min. 5.9 s.u. 6.0 s.u. 1
01/07 005 pH, min. 5.9 s.u. 6.0 s.u. 1
SAWS determined that the instruments being used to record pH were not being calibrated consistently. SAWS changed its procedures to ensure that daily calibration of all instruments is performed prior to use.

October 15, 2013
12 of 19 WWTP Effluent Violation Corrective Actions
Table 5-3: August 2007 Violations
Date Outfall Parameter Violations Permit Limit No. of Violations
08/07 001 Flow, avg. 202,431 gpm 173,611 gpm 31
SAWS reported a violation of the two hour peak flow permit limit, not a violation of average flow limits. The peak flow was caused by heavy rainfall from tropical storm Erin that deposited approximately 9.6 inches of rain during a three to four hour period. The additional flow did not impact plant processes or cause any effluent discharge excursions.
Table 5-4: December 2007 Violations
Date Outfall Parameter Violations Permit Limit No. of Violations
12/07 004 TRC, max. .79 mg/l .099 mg/l 1
The chemical pump that supplied dechlorination agent failed. By the time that repairs to the pump could be completed the excursion at this outfall occurred. Pump repairs restored proper dechlorination of treated effluent.
Table 5-5: March 2008 Violations
Date Outfall Parameter Violations Permit Limit No. of Violations
03/08 001 TRC, max. 1.4 mg/l .099 mg/l 1
The sulfur dioxide injector system failed. During the time it took to make repairs the excursion occurred. SAWS has implemented a method that will allow plant personnel to manually redirect non-potable water to create a vacuum in the injector system that will allow manual introduction of sulfur dioxide in the event of any future failure. The injector system was repaired and permit compliant TRC concentrations were achieved.
October 15, 2013
13 of 19 WWTP Effluent Violation Corrective Actions
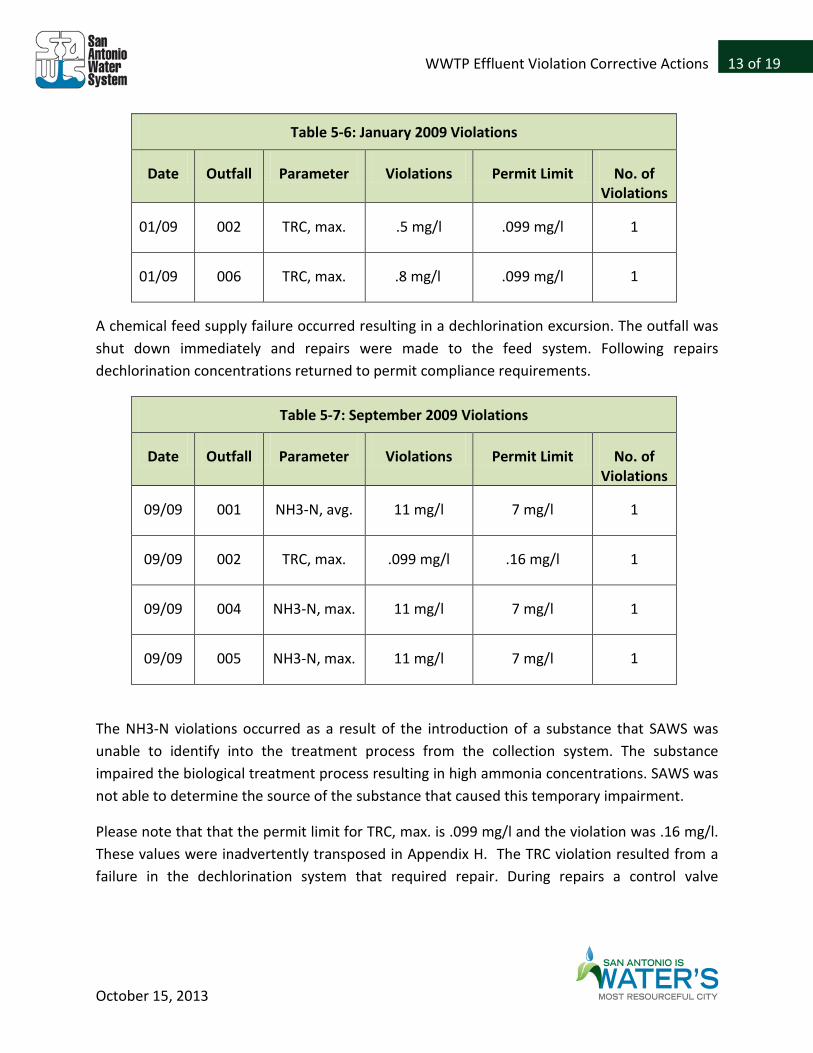
Table 5-6: January 2009 Violations
Date Outfall Parameter Violations Permit Limit No. of Violations
01/09 002 TRC, max. .5 mg/l .099 mg/l 1
01/09 006 TRC, max. .8 mg/l .099 mg/l 1
A chemical feed supply failure occurred resulting in a dechlorination excursion. The outfall was shut down immediately and repairs were made to the feed system. Following repairs dechlorination concentrations returned to permit compliance requirements.
Table 5-7: September 2009 Violations
Date Outfall Parameter Violations Permit Limit No. of Violations
09/09 001 NH3-N, avg. 11 mg/l 7 mg/l 1
09/09 002 TRC, max. .099 mg/l .16 mg/l 1
09/09 004 NH3-N, max. 11 mg/l 7 mg/l 1
09/09 005 NH3-N, max. 11 mg/l 7 mg/l 1
The NH3-N violations occurred as a result of the introduction of a substance that SAWS was unable to identify into the treatment process from the collection system. The substance impaired the biological treatment process resulting in high ammonia concentrations. SAWS was not able to determine the source of the substance that caused this temporary impairment.
Please note that that the permit limit for TRC, max. is .099 mg/l and the violation was .16 mg/l. These values were inadvertently transposed in Appendix H. The TRC violation resulted from a failure in the dechlorination system that required repair. During repairs a control valve
October 15, 2013
14 of 19 WWTP Effluent Violation Corrective Actions
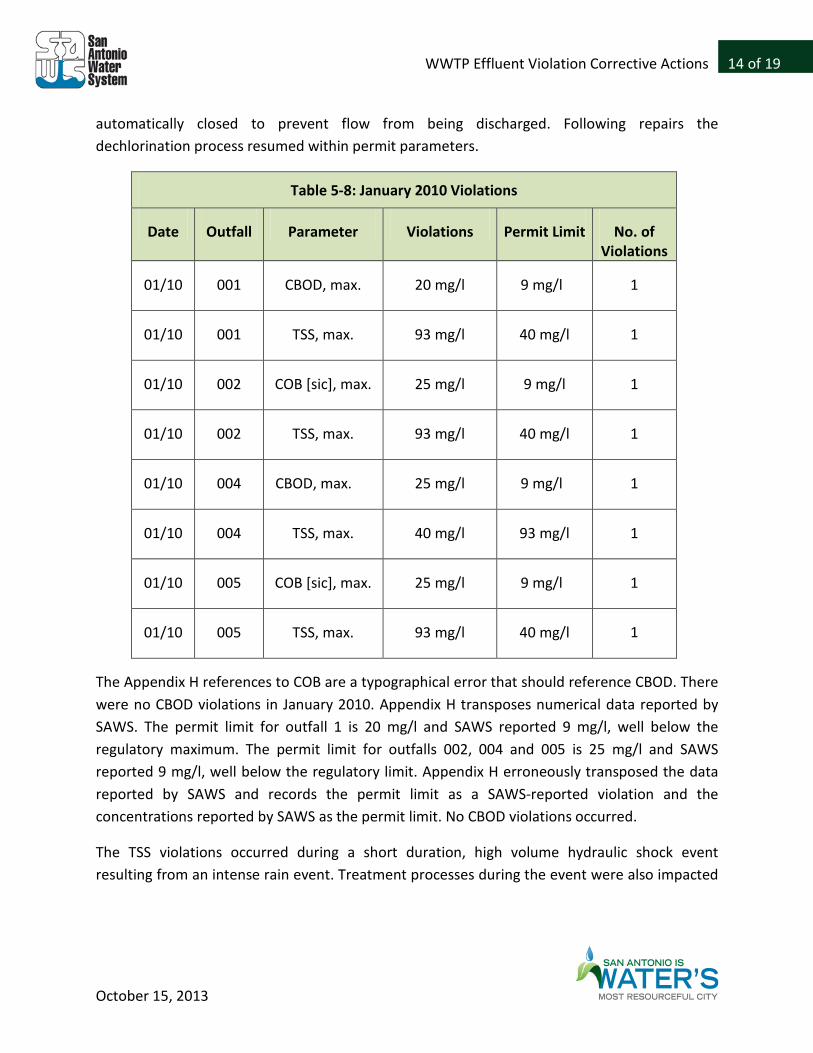
automatically closed to prevent flow from being discharged. Following repairs the dechlorination process resumed within permit parameters.
Table 5-8: January 2010 Violations
Date Outfall Parameter Violations Permit Limit No. of Violations
01/10 001 CBOD, max. 20 mg/l 9 mg/l 1
01/10 001 TSS, max. 93 mg/l 40 mg/l 1
01/10 002 COB [sic], max. 25 mg/l 9 mg/l 1
01/10 002 TSS, max. 93 mg/l 40 mg/l 1
01/10 004 CBOD, max. 25 mg/l 9 mg/l 1
01/10 004 TSS, max. 40 mg/l 93 mg/l 1
01/10 005 COB [sic], max. 25 mg/l 9 mg/l 1
01/10 005 TSS, max. 93 mg/l 40 mg/l 1
The Appendix H references to COB are a typographical error that should reference CBOD. There were no CBOD violations in January 2010. Appendix H transposes numerical data reported by SAWS. The permit limit for outfall 1 is 20 mg/l and SAWS reported 9 mg/l, well below the regulatory maximum. The permit limit for outfalls 002, 004 and 005 is 25 mg/l and SAWS reported 9 mg/l, well below the regulatory limit. Appendix H erroneously transposed the data reported by SAWS and records the permit limit as a SAWS-reported violation and the concentrations reported by SAWS as the permit limit. No CBOD violations occurred.
The TSS violations occurred during a short duration, high volume hydraulic shock event resulting from an intense rain event. Treatment processes during the event were also impacted

October 15, 2013
15 of 19 WWTP Effluent Violation Corrective Actions
by first stage treatment equipment failures that required repair. On completion of repair, plant operations were within permit requirements. Please note for Outfall 4, the permit limit violation and permit limit were inadvertently transposed in Appendix H.
Table 5-9: January 2011 Violations
Date Outfall Parameter Violations Permit Limit
No. of Violations
01/11 001 CBOD, avg. 11,988 lb/d 5,213 lb/d 31
Appendix H incorrectly reports that SAWS reported 11,988 lb/d. SAWS reported 1198 lb/d. A data entry error occurred in the creation of Appendix H by the addition of an additional numeral 1. There was no CBOD permit violation reported.
Table 5-10: January, September and October 2011 Violations
Date Outfall Parameter Violations Permit Limit
No. of Violations
01/11 001 NH3-N, avg. 2.35 mg/l 2 mg/l 1
01/11 001 NH3-N, max. 7.62 mg/l 7 mg/l 1
01/11 002 NH3-N, max. 2.84 mg/l 2 mg/l 1
01/11 002 NH3-N, max. 7.62 mg/l 7 mg/l 1
01/11 004 NH3-N, avg. 2.35 mg/l 2 mg/l 31
01/11 004 NH3-N, max. 7.62 mg/l 7 mg/l 1
01/11 005 NH3-N, avg. 3.06 mg/l 2 mg/l 31
October 15, 2013
16 of 19 WWTP Effluent Violation Corrective Actions
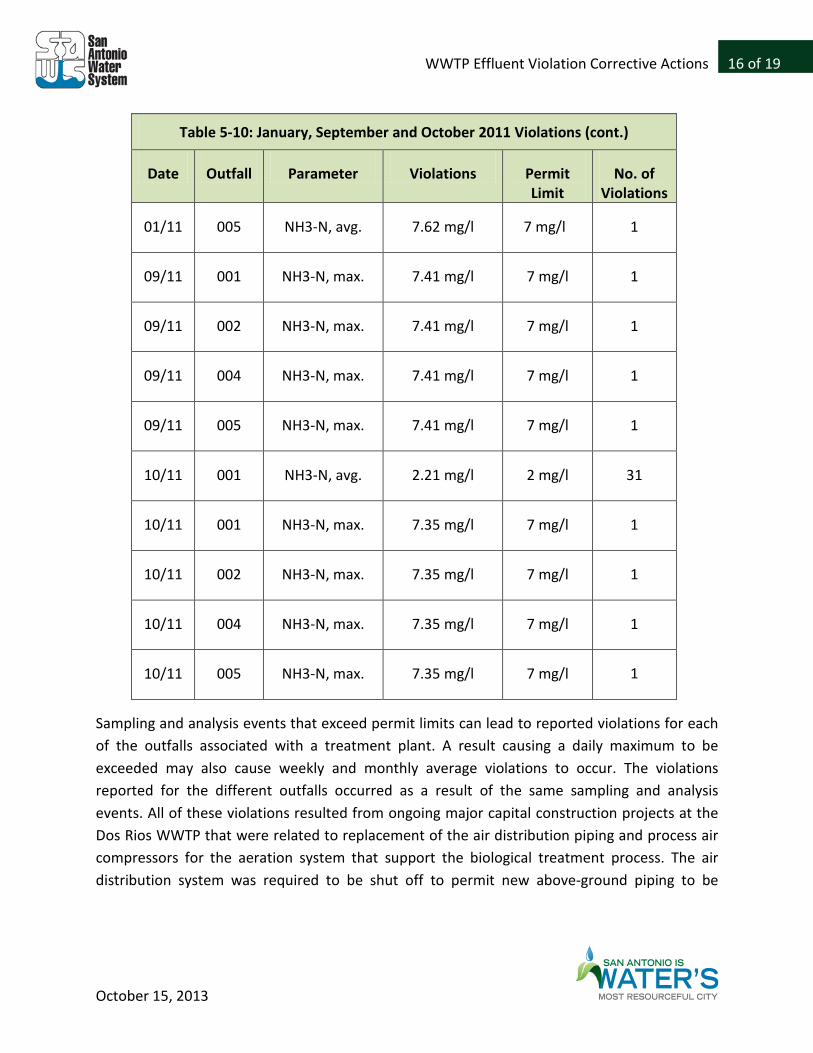
Table 5-10: January, September and October 2011 Violations (cont.)
Date Outfall Parameter Violations Permit Limit
No. of Violations
01/11 005 NH3-N, avg. 7.62 mg/l 7 mg/l 1
09/11 001 NH3-N, max. 7.41 mg/l 7 mg/l 1
09/11 002 NH3-N, max. 7.41 mg/l 7 mg/l 1
09/11 004 NH3-N, max. 7.41 mg/l 7 mg/l 1
09/11 005 NH3-N, max. 7.41 mg/l 7 mg/l 1
10/11 001 NH3-N, avg. 2.21 mg/l 2 mg/l 31
10/11 001 NH3-N, max. 7.35 mg/l 7 mg/l 1
10/11 002 NH3-N, max. 7.35 mg/l 7 mg/l 1
10/11 004 NH3-N, max. 7.35 mg/l 7 mg/l 1
10/11 005 NH3-N, max. 7.35 mg/l 7 mg/l 1
Sampling and analysis events that exceed permit limits can lead to reported violations for each of the outfalls associated with a treatment plant. A result causing a daily maximum to be exceeded may also cause weekly and monthly average violations to occur. The violations reported for the different outfalls occurred as a result of the same sampling and analysis events. All of these violations resulted from ongoing major capital construction projects at the Dos Rios WWTP that were related to replacement of the air distribution piping and process air compressors for the aeration system that support the biological treatment process. The air distribution system was required to be shut off to permit new above-ground piping to be

October 15, 2013
17 of 19 WWTP Effluent Violation Corrective Actions
connected to the air distribution system. Construction process safeguards were implemented during construction to minimize the extent of disruption. Construction of the new system is now complete.
Table 5-11: January 2012 Violations
Date Outfall Parameter Violations Permit Limit No. of Violations
01/12 001 NH3-N, avg. 2.31 mg/l 2 mg/l 31
01/12 001 NH-N, max. 13 mg/l 7 mg/l 1
01/12 005 NH-N, max. 13 mg/l 7 mg/l 1
During construction of major capital improvements to the Dos Rios WWTP multiple disruptions occurred to the air distribution piping and process air compressors. These disruptions impaired the biological treatment process, resulting in the reported excursions. SAWS instituted operational practices during construction to minimize process disruption. Construction of a new air distribution system for the biological process is now complete.
Table 5-12: March 2012 Violations
Date Outfall Parameter Violations Permit Limit No. of Violations
03/12 001 E. Coli., max. 680 CFU/100 394 CFU/100 1
The reported excursion occurred as a result of operator error in taking a compliance sample. Refresher training on quality control procedures to prevent future recurrences has been implemented.

October 15, 2013
18 of 19 WWTP Effluent Violation Corrective Actions
Table 5-13: May 2012 Violations
Date Outfall Parameter Violations Permit Limit No. of Violations
05/12 001 TRC, max. .12 mg/l .1 mg/l 1
05/12 001 TRC, min. .8 mg/l 1 mg/l 1
05/12 002 TRC, min. .8 mg/l 1 mg/l 1
05/12 004 TRC, min. .8 mg/l 1 mg/l 1
These excursions were caused when the setpoint on the auto control loop was set too low to adjust rapidly to spikes in flow. The setpoints were adjusted to provide for an adequate adjustment period when flow changes rapidly in the plant.
Table 5-14: October 2012 Violations
Date Outfall Parameter Violations Permit Limit No. of Violations
10/12 001 E. Coli, max. 770 CFU/100 394 CFU/100 1
10/12 002 E. Coli, max. 770 CFU/100 394 CFU/100 1
10/12 005 E. Coli, max. 770 CFU/100 394 CFU/100 1
Despite investigation, SAWS was not able to determine a cause for these reported violations. Normal plant operations corrected the violations and no further action was taken.
