wti & brent: the two giants of the crude oil market
TRANSCRIPT

WTI & Brent: The Two
Giants of the Crude Oil
Market
Rahul Daryanani [FIN3560-01], Mattias Huebner [FIN3560-01], Morgan
Keith [FIN3560-01], Varun Sachdeva [FIN3560-01] Financial Markets &
Instruments
December 6, 2013
I pledge my honor that I have neither received nor provided any unauthorized
assistance during the completion of this work. (12/6/2013)
X___Rahul Daryanani________________________
X___Mattias Huebner________________________
X___Morgan Keith__________________________
X___Varun Sachdeva________________________

1
Executive Summary The underlying mechanisms of the oil market can be defined and affected by many factors
including what classification of oil is being discussed, the volatility of the price spreads, environmental
and geo-political issues, and the fluctuations of futures prices. Oil as a general good is classified as a
commodity due to its status as a primary, natural good that is attained through the utilization of
agricultural excavation. In addition to this definition, crude oil is considered to be a hard commodity as it
is obtained through a method of mining. Within the oil market, the good is classified even further through
the definition of light, heavy, sweet, and sour, the definitions of which will be explored in the paper
through the specific examination of West Texas Intermediate (WTI) and Brent Crude oil.
The paper will compare the spread in spot prices between the two classifications of crude oil,
which after achieving parity this year, have begun to widen. In addition to examining the spreads of WTI
and Brent, factors determined to affect their spot prices include natural disasters, geopolitical events, the
influence of OPEC, and the existence of USO & BNO, ETFs that are linked to the two types of crude oil.
The correlation between the percentage change of net asset value for the Exchange Traded Funds
(USO & BNO) and the spot prices of WTI and Brent is calculated and shows that the percentage change
in net asset value of both funds does in fact closely follow the percentage change in the spot price of their
underlying commodities, proving that ETF is doing what it is meant to. Finally, a time series model is
run to see if there is a way to identify a trend in the spot prices of oil futures prices and then predict future
prices. Upon constructing the model it was found that the movements in price are so random that a true
prediction of oil price cannot be made with a high level of confidence. This can be attributed to the fact
the price of oil relies heavily on determinants that are highly unpredictable.

2
Table of Contents
Introduction……………………………………………………………………………………………….3
What are Commodities?.............................................................................................................3
Commodities in the Market………………………………………………………………………3
Oil as a Commodity………………………………………………………………………………3
Spreads…………………………………………………………………………………………………….5
Determinants of Oil Price Movements……………………………………………………………………7
Supply & Demand………………………………………………………………………………..7
USO & BNO: TWO New Financial Instruments within the Oil Market……………………….9
Natural Disasters & Oil Prices……………………………………………………………………10
OPEC and Global Oil Supply and Demand………………………………………………………11
Geopolitical Events & Oil Prices…………………………………………………………………11
Statistical Analysis………………………………………………………………………………………...12
USO&WTI……………………………………………………………………………………….12
BNO & Brent……………………………………………………………………………………..12
What Affects the Spread Between WTI & Brent…………………………………………………13
Time Series Forecasting…………………………………………………………………………..14
Conclusion………………………………………………………………………………………………...15
References………………………………………………………………………………………………...17
Exhibits…………………………………………………………………………………………………....19
*The authors of this paper hereby give permission to Professor Michael Goldstein to distribute this paper
by hardcopy, to put it on reserve at Horn Library at Babson College, or to post a PDF version of this
paper on the internet
3
Introduction
What are commodities?
Commodities and commodity trading have to do with goods procured from agriculture, mining,
and other means of acquiring a primary good. Rather than manufactured, commodities are natural goods
that are the inputs for more complicated manufacturing. Within the commodities market are two
subclasses of commodities: hard commodities, and soft commodities. Hard commodities include such
products as gold, oil, and other resources that are considered to be “mined”. Soft commodities are
agricultural and include such products as sugar, coffee, corn, wheat, and many others.
Commodities in the Market
Trading of commodities is broken into four different sectors: energy, metals, agriculture, and a
group of “other” that includes such things as rubber and palm oil among other items. Each has its own
infrastructure and trading methods with unique pricing and market sizes. The commodity market in the
past has been mainly focused on futures trading as the harvesters of commodities use such trading to
reduce risk within the market. For example, if a wheat farmer in North Dakota harvests his crop of spring
wheat in the late summer, and due to past knowledge of price trends the farmer feels as if the price at the
selling point will be lower than he needs to support himself. He would most likely opt for a futures
contract that would secure the current price and delivery of his goods in order to make sure that his
product is not only sold, but that he turns a reasonable profit until the next harvest. The farmer could also
consider a forward contract but this is less likely as wheat is a heavily traded product and futures are
marked to market and would better represent current movements in wheat.
Oil as a commodity
Due to the fact that it must be mined, oil is considered to be a “hard” commodity. It is also
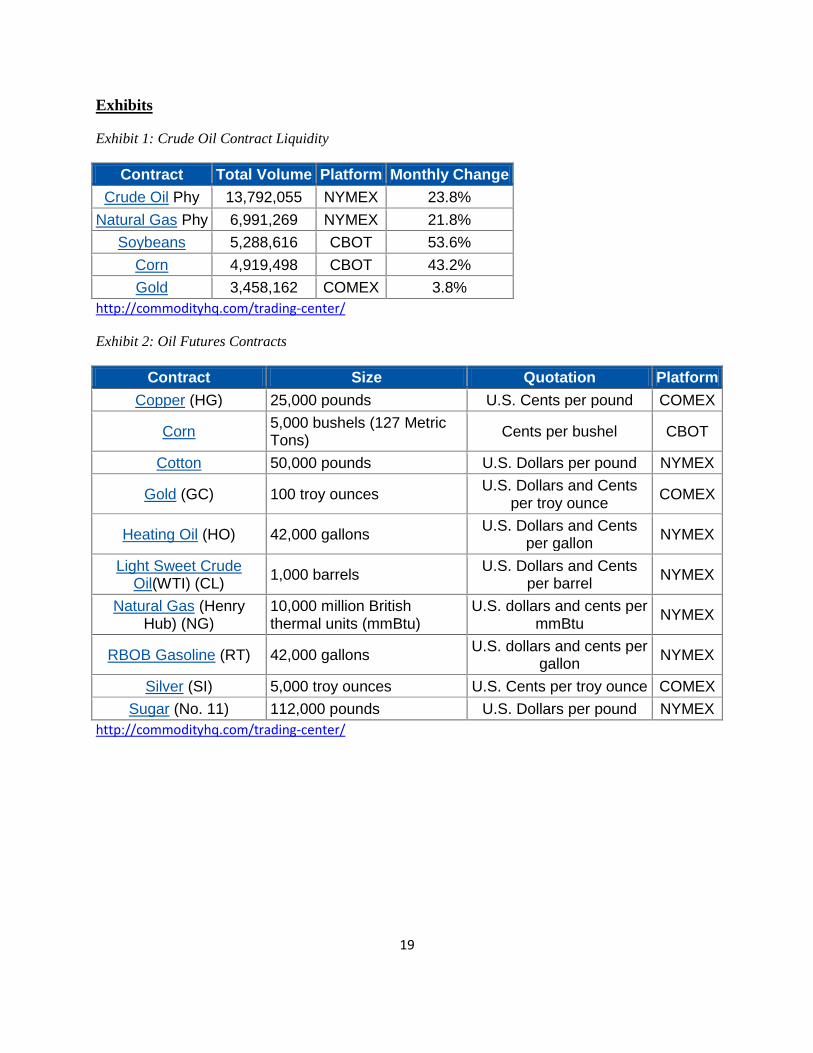
considered to be an “energy” commodity and is the one actively traded commodities (Exhibit 1).1 Oil
futures contracts are thus highly liquid. Oil is used in some of our most important energy sources and it is
1 "Commodity ETF and Futures Trading Center." Commodity HQ. http://commodityhq.com/trading-center/

4
estimated that around eighty-nine million barrels are consumed a day, worldwide.2 Therefore, as a
commodity, it is globally very valuable. Oil is broken up into different classifications based on location,
sulfur content, and other important factors. There are two main sets of descriptors for oil classifications
that are used in the market: light vs. heavy (having to do with oil density), and sweet vs. sour (having to
do with sulfur content). Oil is quoted in price per barrel and each futures contract represents 1000 barrels
of crude oil (Exhibit 2). The two types of crude oil that will be discussed in this paper are Brent and WTI.
Brent Crude
Brent Crude is a classification of sweet, light crude oil from the North Sea region and is traded
out of London. It is comprised of Brent Blend, Forties Blend, Oseberg, and Ekofisk crudes. It is now used
as the international benchmark for crude oil, a title held originally by WTI until recently. In its Annual
Energy Outlook for 2013, the EIA announced that for the first time, it would be using Brent as the
benchmark for crude oil prices as opposed to WTI as the agency felt that the Brent spot price more
closely represented global oil prices and its movements3.
West Texas Intermediate
More commonly referred to as “WTI” West Texas Intermediate is also a lighter and sweeter
crude oil than BRENT. It originates from the US Midwest, and Gulf Coast areas. It is stored in Cushing,
Oklahoma thus making Cushing, OK the delivery point for all futures contracts and the site of ultimate
price settlement. The storage levels in Cushing help to determine the spot price of WTI. When the storage
tanks fill up the price falls and when they are kept low, the price tends to increase. To go into more
specifics, we will compare various aspects of each type of crude:
2 "FAQs: Oil." International Energy Agency. n. page. Web. 1 Dec. 2013. http://www.iea.org/aboutus/faqs/oil/
3 Energy Information Administration, (2012). Aeo2013 early release overview. Retrieved from Thomson Reuters
website: http://www.eia.gov/forecasts/aeo/er/index.cfm

5
WTI Brent Dubai Crude
API Gravity* 39.6 38.06 31
Specific Gravity* 0.827 0.835 0.871
Sulfur Content* 0.24% 0.37% 2%
*API (American Petroleum Institute) gravity is a measure of how much lighter or heavier an oil or petroleum is compared to
water.
*Specific gravity is a ratio of the density of a substance to a certain reference substance. For oil and other liquids, this reference
substance would be pure water, which therefore has a specific gravity of 1.000.
*Sulfur content: The less sulfur that is in the oil, the larger the amount that can be processed into other useful forms. Sulfur is
pretty much a dilution of the crude oil.
Spreads
In the past, the spread between WTI & Brent has been relatively stable but has seen steep falls
and sharp climbs in the past two years. Geo-political events like war in the Middle East, Hurricane
Katrina, and the Great Recession of 2008 greatly affected the spread in the futures spot price for the two
crudes. After January of this year, price movements have taken place at a much more leisurely rate rising
and falling but not making any dramatic movements, usually correcting and stabilizing when there are
significant changes that take place4.
In 2012, the average spread between WTI and Brent was $19 per barrel. The year (2013) opened
with an average spread of $18 per barrel in January, close to the 2012 average. That spread significantly
narrowed during 2013 and achieved parity as of July 19, 2013, and by July 30th, the spread had only
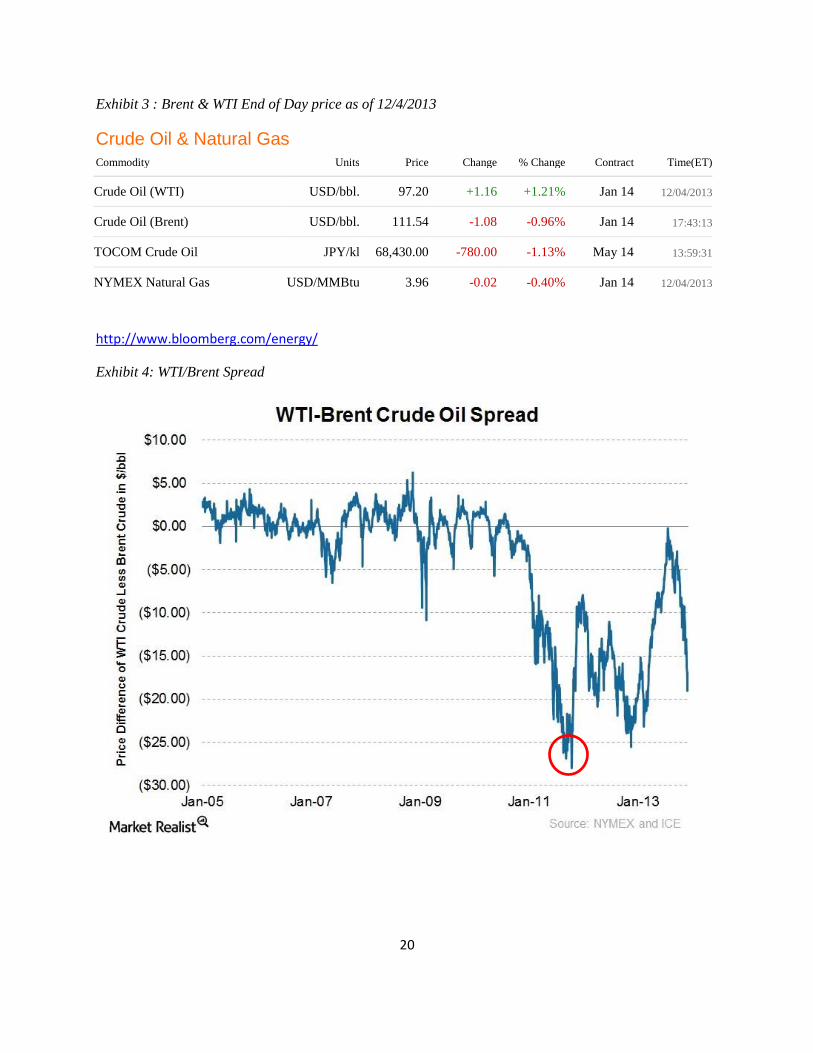
slightly widened to $4 per barrel5. As of December 4th, the spread between Brent and WTI was $14.34
per barrel with Brent at $111.54 and WTI at $97.20 according to Bloomberg (Exhibit 3).
Spreads had remained rather narrow after the financial crisis in 2008 and so when they started to
widen in 2012, the widening was seen as short-term and many major investors bet on the spreads
4 Flynn, A. (2013, November 15). Oil futures: More guess than good judgement. The Wall Street Journal. Retrieved
from http://blogs.wsj.com/moneybeat/2013/11/15/oil-futures-more-guess-than-good-judgement/?KEYWORDS=wti+and+brent+spread 5 Energy Information Administration, (2013). Spread narrows between brent and wti crude oil benchmark prices.
Retrieved from Thomson Reuters website: http://www.eia.gov/todayinenergy/detail.cfm?id=12391

6
narrowing, only to be sorely disappointed. In the past, spreads between WTI and Brent had remained
narrow as the spot prices tended to move together. WTI has long been the heavier traded between the two
in terms of volume but was overtaken by BRENT in the summer of 20126. BRENT has been favored as a
more accurate representation of global oil prices and as a result has seen an increase in trading volume7.
The spot prices of Brent and WTI had traded very close to each other until developments in US oil
production drastically increased the supply of crude oil. One technological advancement known as
Hydraulic Fracturing or “Fracking” has played the lead role in WTI’s increasing supply. Fracking is a
process by which chemicals and water are blasted into shale rock far below the ground at high pressures,
releasing gasses and liquids such as gas and petroleum8.The pipeline infrastructure of the past could not
handle the capacity thus resulting in the filling of the storage tanks in Cushing, Oklahoma, increasing the
spread. The supply of domestically produced crude oil so greatly overpowered the transportation
capabilities available that the WTI/BRENT spread reached more than $25 dollars per barrel in
2011(Exhibit 4)9. With 2013 came the approval or advancements in the approval of many pipeline
projects like the Keystone XL pipeline and Seaway pipeline allowing for increased transportation
capabilities and the easing of supply bottlenecks. Oil refineries also began operating at higher levels
closer to capacity. Both of these actions together resulted in the narrowing and relative stabilizing of the
spread to its current levels10
.
With the addition of different pipelines inventory levels in Cushing have been decreasing as more
processed oil has been able to make its way through the pipelines, and is either distributed domestically or
6 Nguyen, L. (2012, August 1). London overtakes new york as brent oil beats wti. Retrieved from
http://www.bloomberg.com/news/2012-08-01/brent-beats-wti-oil-trading-as-ice-eclipses-nymex.html 7 Smith, G. (2012, November 26). Brent poised to depose wti as most-traded oil futures. Retrieved from
http://www.bloomberg.com/news/2012-11-26/brent-poised-to-oust-wti-as-most-traded-oil-futures.html 8 Propublica. (n.d.). Retrieved from http://www.propublica.org/special/hydraulic-fracturing-national
9 Fontacchia, A. (2011, July -8). Oil price:brent-wti spread above $22 and here to stay. Retrieved from
http://www.forbes.com/sites/afontevecchia/2011/07/08/oil-prices-brent-wti-spread-above-22-and-here-to-stay/2/ 10
Philbin, B., & Strumph, D. (2013, September 16). Syria widening wti-brent spread. The Wall Street Journal. Retrieved from http://online.wsj.com/news/articles/SB10001424127887323342404579079384003657794?KEYWORDS=wti+and+brent+spread

7
exported abroad. However, production is still increasing at quickening rates and inventories have started
increasing. Bloomberg estimates that crude inventories in the United States increased by 800,000 barrels
to 386.2 million barrels in the week ending November 8th11
. Additionally, if problems in countries like
Syria continue to take place, the price of Brent will increase at a rate possibly greater than that of WTI,
widening the spread.
Determinants of Oil Price Movements
Since movements in the oil market can cause a disruption in the economy, it is vital to understand
what causes the spot price of crude oil to rise or fall. A few determinants of oil prices have been identified
and are explored below.
Supply and Demand
One of the determinants of changes in spot prices is simply supply and demand. Oil production is
not solely dictated by supply and demand in the market, prices are driven by geo-political events, natural
disasters, and mass speculation.
The rapid economic expansion as seen in developing countries such as China and India has
increased the demand for oil, driving up oil prices but also making these prices more sensitive to geo-
political or weather related events in these countries. There are numerous factors that influence the
movements of oil prices. Global supply is a factor that very heavily affects crude oil prices. The
uncertainty in the availability or access to oil inversely affects the price; as the supply of oil decreases, the
price increases, and vice-versa. Alongside supply, oil prices are affected by the demand for oil, which
today largely comes from emerging markets with growing economies that demand industrial
commodities. This increase in the demand for oil pushes the aggregate world demand for oil, making it a
more valuable commodity. With uncertainty in regards to the supply levels of oil, there is greater
incentive in storing oil. Additionally, expected deficits, driven by geo-political events prompt the storage
11
Nguyen, L. (2013, November 13). Brent-wti spread expands to seven-month high on libya. Retrieved from http://www.bloomberg.com/news/2013-11-13/brent-oil-gains-as-protests-in-libya-disrupt-supply.html

8
of oil to account for future consumption. This shortage in oil can be as a result of production deficits due
to geo-political conflicts in oil producing regions or from a spike in demand. The increase in demand for
storing oil increases the price. 12
The price of oil is determined in the futures market. In an oil futures contract, the buyer agrees to
purchase oil by the barrel from the seller at a predetermined price and on a predetermined day in the
future. Both buyers and sellers are bound by the contract to fulfill the terms of the agreement on the
predetermined date in the future. The futures contracts are traded largely by traders on the floor of the
Chicago Mercantile Exchange registered with the Commodity Future Trading Commission (CTFC).
Within the futures market exist two types of future traders: hedgers and speculators. Hedging is
the practice of establishing a futures contract as a means of protecting against an increase or decrease in
prices. Using oil futures as a hedge could create speculation in the market and greatly affect the spot
price. The other side of a commercial hedger’s trade is often taken by a speculator or another commercial
hedger seeking protection in the opposite direction. An example of both hedging and speculation comes
from a trade by Southwest Airlines that greatly reduced the price they paid for oil. 13
Southwest Airlines
entered a futures contract and prevailed from hedging in 2007 while other airline companies suffered as a
result of oil trading at above $90/ barrel. Southwest locked in rates as low as $51/ barrel through 2009,
avoiding the high fuel costs, which allowed it to remain profitable. In this example, Southwest used
hedging as a means of protecting itself from a spike in the price of oil. 14
Speculation involves the purchase of a commodity with the expectation that the price of the
commodity will increase or decrease at a later time and can thus be sold for a profit. In the oil market,
traders purchase oil futures, sell it before the delivery date and reinvest further in other futures contracts.
12
Fawley, Brett W., Luciana Juvenal, and Ivan Petrella. "When Oil Prices Jump, Is Speculation To Blame?" Federal Reserve Bank of St. Louis. 7 Nov. 2013 <http://www.stlouisfed.org/publications/re/articles/?id=2232>.
13 Bailey, Jeff. "Southwest Airlines gains advantage by hedging on long-term oil contracts." The New York Times. 28
Nov. 2007. <http://www.nytimes.com/2007/11/28/business/worldbusiness/28iht-hedge.4.8517580.html?pagewanted=all&_r=0>.
14 Bailey, Jeff. "Southwest Airlines gains advantage by hedging on long-term oil contracts." The New York Times. 28
Nov. 2007. <http://www.nytimes.com/2007/11/28/business/worldbusiness/28iht-hedge.4.8517580.html?pagewanted=all&_r=0>.
9
A speculator plays the role of contemplating the direction of the price of crude oil in the future without
any intent to purchase oil. For example, in March 2012, speculators pounced at the possibility of war as a
result of tension regarding the Iran nuclear program. As a country that exports 2.2 million barrels of oil a
day, concern rose around shortage in supply in the event of military action. At this news, money managers
(speculators) flooded the market, betting the price of oil will increase, driving the price of oil up without
the shot of a single bullet. With the expectation that oil prices will increase in the future, investment firms
purchase future contracts with the motive to make a profit. This increase in the demand for the futures
contracts increases the price of the futures, which then drives the price of oil up. 15
There are numerous factors that cause speculation and thus result in fluctuating oil prices. One of
the factors that play a role in the volume, amount and frequency of traders’ bids is the supply of crude oil
that exists. This is accomplished by understanding the production quota established by OPEC. If traders
believe that the supply will decrease, a bid for an increase in price will be placed. If there is speculation of
an increase in supply, traders will bid for a decrease in the price. Oil demand is also a factor that is
observed to forecast the price of oil. Historically, demand increases during the summer season when
people are out driving as well as during the winter season to cater to the increase of home heating. Both
the demand and supply factors are utilized by analysts and traders to either bid the price for oil up or
down. 1617
USO & BNO: TWO New Financial Instruments within the Oil Market
In the past decade, the financial markets have turned its focus to the commercialization of
commodity index trading. “Estimates indicate that assets allocated to commodity index trading rose from
15
Phillips, Matthew. "Have Oil Speculators Already Priced In War With Iran?" Bloomberg Businessweek. 7 Mar. 2012. <http://www.businessweek.com/articles/2012-03-07/have-oil-speculators-already-priced-in-war-with-iran>.
16 "What Affects Oil Prices?" What Affects Oil Prices? 24 July 2009. 14 Nov. 2013 <http://oilprice.com/Energy/Oil-
Prices/What-Affects-Oil-Prices.html>. 17
"What Drives Crude Oil Prices?" Energy & Financial Markets. U.S. Energy Information Administration. 5 Nov. 2013 <http://www.eia.gov/finance/markets/supply-opec.cfm>.
10
$13 billion in 2004 to $260 billion in March 2008.”18
Crude oil plays a very significant role in
commodities trading (Exhibit 5). Traditionally, the financial instruments commodities like crude oil
consisted largely of futures and options. Commodities like crude oil were seen as entire asset classes on
their own, traded by Financial Institutions through the Chicago Mercantile Exchange. Within the past
decade however, came the creation of Exchange Traded Funds like USO in 2006 and BNO in 2010 that
brought these commodities to the common investor and made trading oil as easy as trading stock1920
. The
USO or “United States Oil Fund” is a fund that aims to have its percentage change in price mirror that of
the underlying commodity which in this case is WTI. The same is true for BNO or the “United States
Brent Oil Fund” and Brent crude oil. With the increased ease of trading came an increase in speculation in
the price of these commodities. These financial instruments can be seen to affect the demand of the
underlying commodity because the futures contracts are being brought to the market by Financial
Institutions and opening them (futures contracts) to trade.
Natural Disasters and Oil Prices
Natural disasters such as Hurricane Katrina and the tsunami in Japan also greatly contribute to oil
prices. Not only did Hurricane Katrina cause a rise in the price per barrel, but it also temporarily shut
down oil production along the Gulf Coast, affecting 12% of the United States oil production. Prior to
Hurricane Katrina, no natural disaster had ever had this big of an effect on US production. “No hurricane
has ever destroyed as much of the entire value-chain of energy infrastructure, from offshore rigs to
underwater pipelines to refineries and power lines on shores.”21
The hurricane led to a substantial
increase in the price of the barrel, causing President Bush to make the decision to release barrels from the
18
Fawley, Brett W., Luciana Juvenal, and Ivan Petrella. "When Oil Prices Jump, Is Speculation To Blame?" Federal Reserve Bank of St. Louis. 7 Nov. 2013 <http://www.stlouisfed.org/publications/re/articles/?id=2232>.
19 (2013, December 04). Retrieved from http://www.bloomberg.com/quote/USO:US
20 (2013, December 04). Retrieved from http://www.bloomberg.com/quote/BNO:US
21 Esterbrook, John. "Katrina Wreaks Havoc On Oil Market." CBSNews. CBS Interactive. 15 Nov. 2013
<http://www.cbsnews.com/news/katrina-wreaks-havoc-on-oil-market/>.

11
U.S. oil reserves as a means of bringing the price back down. The Department of Energy had to tap into
30 million barrels of the oil reserve to mitigate the shortage in supply and normalize oil prices. This
disaster did not have a lasting effect on the world crude- oil market as the markets were over supplied
with the crude oil at the time of the event. The oil prices had risen, but within days fell back down to due
to the release of the oil reserve. 2223
OPEC and Global Oil Supply and Demand
The global oil production is regulated by OPEC (Organization of the Petroleum Exporting
Countries). OPEC aims to maintain a stable price-per-barrel for crude oil, which has been difficult over
the years with the instability in the market and the arising of various geo-political events across the world.
In the past, there has been an increase in the crude oil prices when OPEC reduces its production figures.
Geopolitical Events and Oil Prices
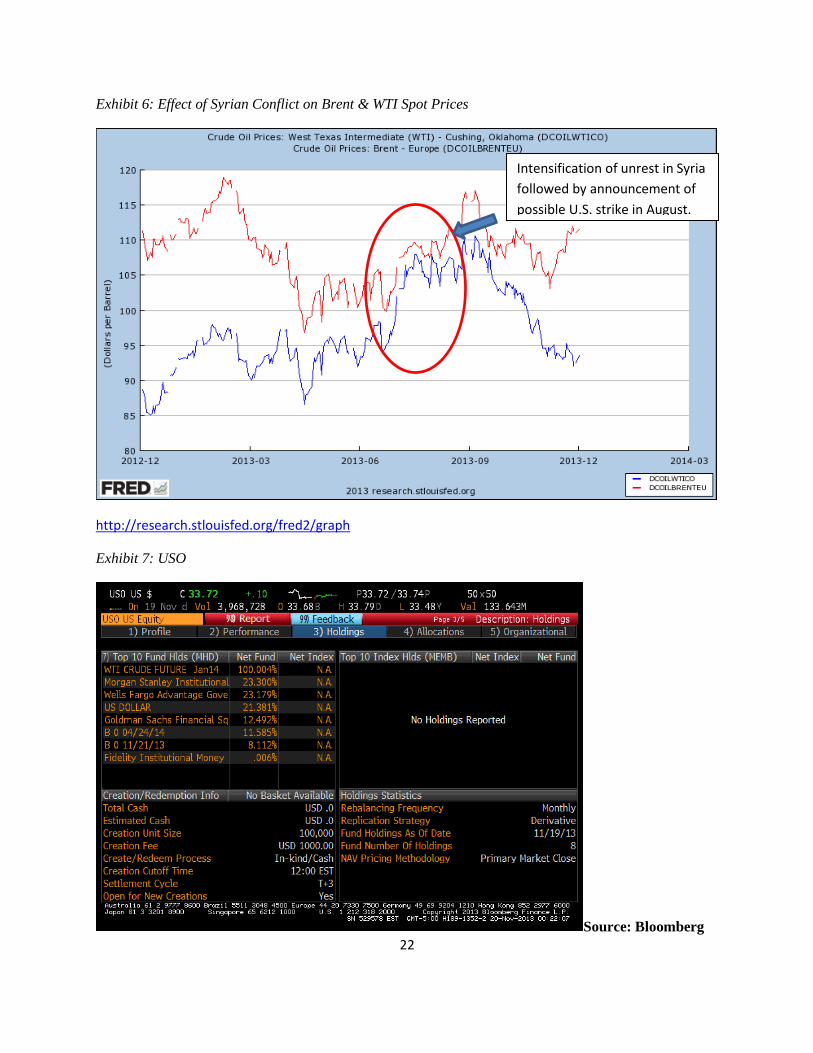
Arguably the biggest influencer of oil prices, geo-political events have been responsible for many
major rises and falls in global oil prices. This past summer, the conflict in Syria heightened when
chemical weapons were used to mitigate the ongoing civil war. As using chemical weapons is inhumane
and against international law, the United States contemplated intervening in Syria through means of
military action. Although Syria is not a major oil producer in the Middle East, there was fear in the
market that military action could cause a supply shock in other major oil producing nations within the
Middle East like Saudi Arabia and Iraq. Investors were worried that military action in Syria could lead to
disruption in the oil production and transportation process in Iraq and Saudi Arabia, resulting in the
inability to meet global demand. This caused an increase in price. This increase in price took place
without any military strikes from the U.S. Speculation that the U.S. may intervene, drove prices up as oil
22
Esterbrook, John. "Katrina Wreaks Havoc On Oil Market." CBSNews. CBS Interactive. 15 Nov. 2013 <http://www.cbsnews.com/news/katrina-wreaks-havoc-on-oil-market/>.
23 "No Safety Net." The Economist. 8 Sept. 2005. <http://www.economist.com/node/4377398>.

12
is traded in the futures market (Exhibit 6). After the United States decided to not strike Syria, there was
greater certainty in the market, and prices corrected, falling to a more normalized price. 24
Statistical Analysis
USO& WTI
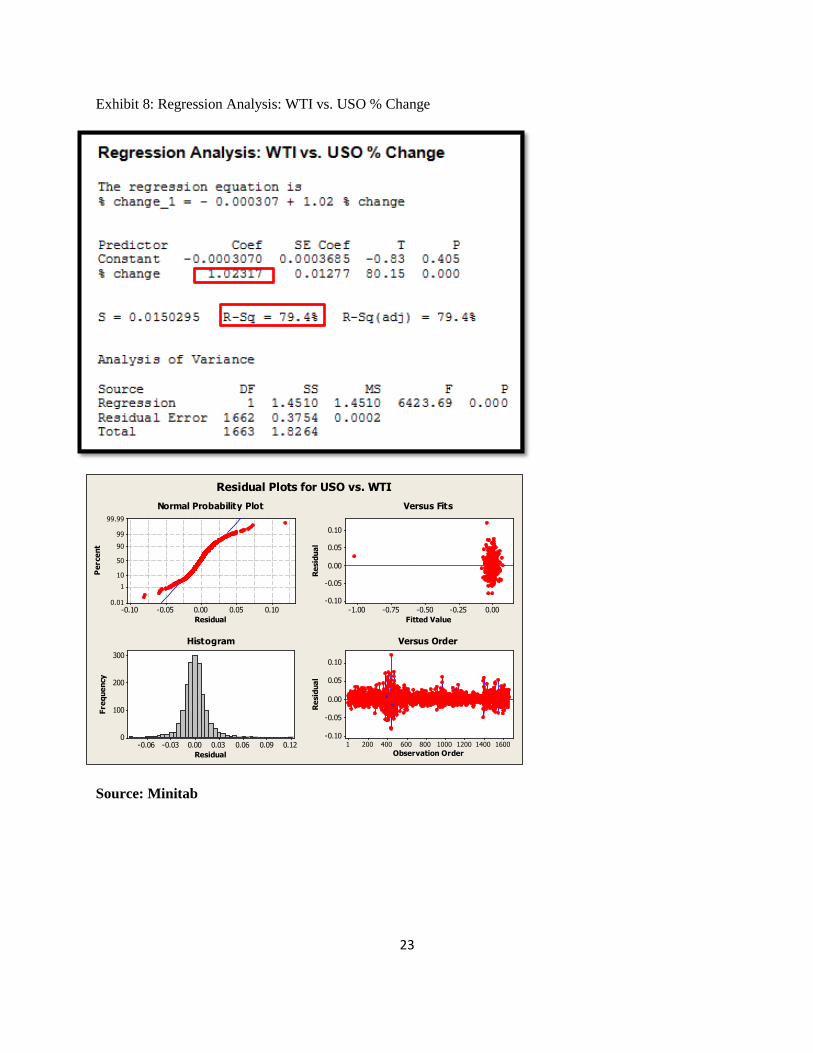
The United States Oil Fund (USO) is an Equity Traded Fund with the objective of having the
percentage change of its net asset value reflect the percentage change in the spot price of WTI Crude Oil.
The United States Oil Fund ranks 32nd
within the top 50 most traded ETFs by volume.25
The portfolio
currently consists completely of WTI futures and is collateralized with a range of debt instruments
including US Currency (Exhibit 7). When compared to WTI in terms of percentage price change, it can be
concluded that USO does achieve its goal in reflecting the percentage of price change in WTI. Upon
running a Minitab regression for the maximum amount of time available (April 17th, 2007 – November
20th, 2013) for USO and WTI, we found the standard coefficient (beta coefficient) to be 1.02317 with an
R-Squared of 79.4%. This shows that a close positive correlation exists and that the percentage change of
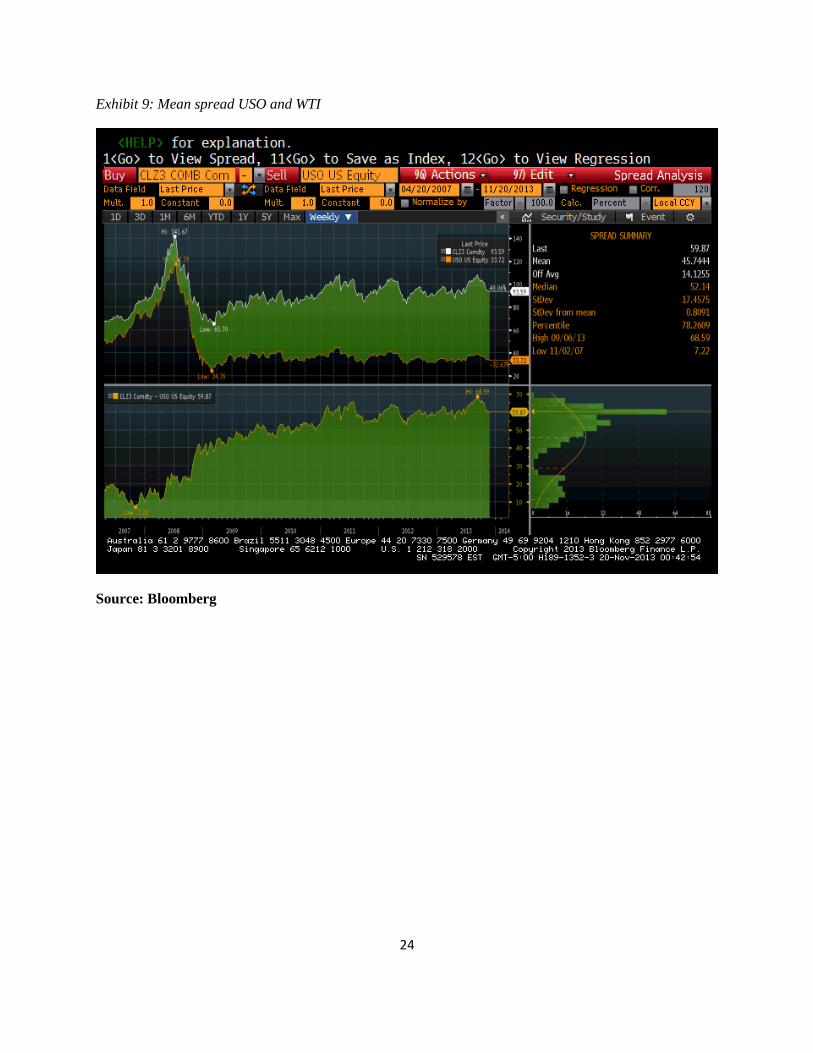
its net asset value does closely follow the percentage change of WTI crude oil (Exhibit 8). The mean
spread for the period ranging from 2007 to 2013 for USO and WTI is $45.7444 with the high taking place
on the sixth of September in 2013 and the low taking place on the second of February in 2007 (Exhibit 9).
BNO & BRENT
Being that the United States Oil Fund is meant to closely follow WTI and not BRENT, as a
source of comparison to USO&WTI, we chose to analyze BNO&BRENT. The United States Brent Oil
Fund (BNO), similar to the USO has an objective of having the percentage of change in the net asset’s
value reflect the percentage change of the price of Brent Crude Oil. When running a regression analysis
for the maximum amount of time available (June 2nd
, 2010 – November 14th, 2013) of the spread between
24
Pan, Ingrid. "Brief background on why the Syrian conflict affects oil prices." Yahoo Finance. 10 Nov. 2013 <http://finance.yahoo.com/news/brief-background-why-syrian-conflict-205303897.html>.
25
Most popular etfs: Top 100 etfs by trading volume. (2013). Retrieved from http://etfdb.com/compare/volume/

13
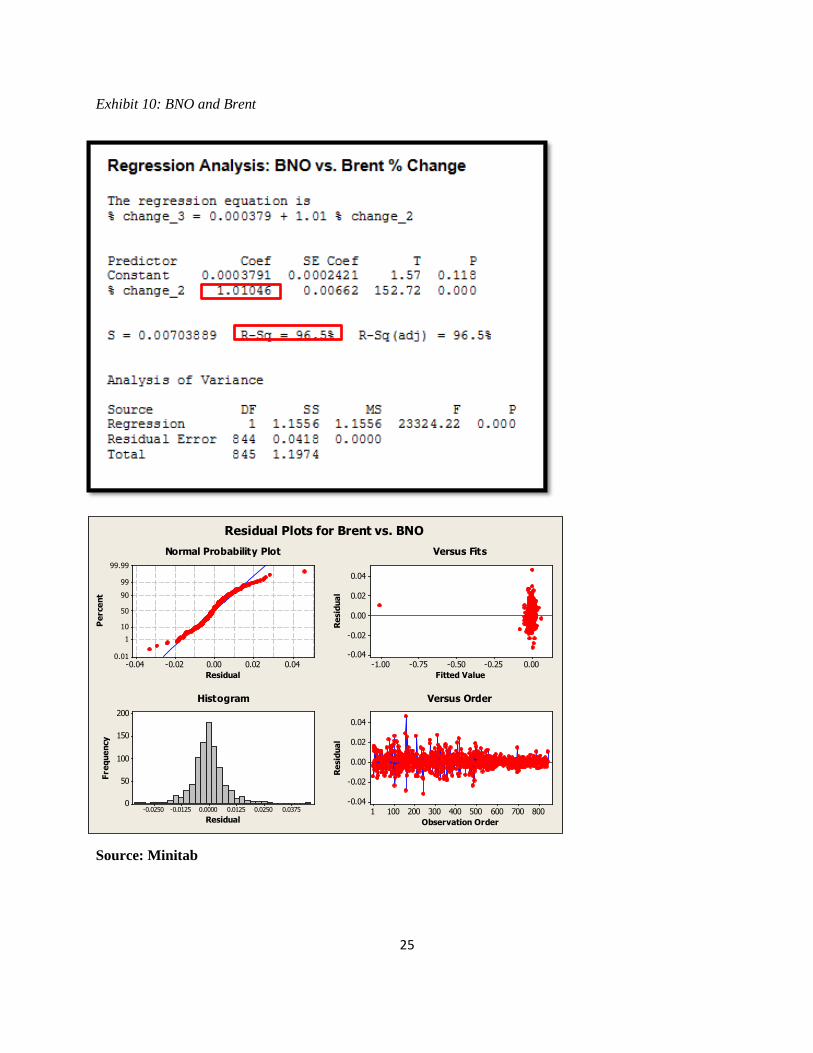
BNO & BRENT, we found a standard coefficient of 1.01046 and an R-squared of 96.5 %(Exhibit 10).
Similar to the relationship between USO &WTI, the standard coefficient of 1.01046 shows a close
relationship between the percentage change of net asset value in BNO and the percentage change in spot
price of WTI.
Both of these Exchange Traded Funds fulfill achieve their goal of closely following the changes
in the spot price of their underlying commodity.
What affects the spread between WTI and BRENT?
Over the past decade, the spread of WTI and BRENT has widened rapidly and then narrowed
rapidly at times often going against the predictions of analysts. As previously stated, it has been deduced
that the major determinants of the spread between WTI and BRENT are geo-political events and weather,
both of which usually lead to speculation that in turns moves the prices of the two crudes at
disproportionate levels, thus affecting the spread. When comparing the movements in price during various
geo-political events and weather we found that events in the Middle-East affect both of the spot prices in
the same general manner, either resulting in a drop or an increase in spot price. However, Geo-political
events in the Middle East and extreme weather in areas outside of the United States, like Asia, tend to
move BRENT spot prices more than WTI spot prices. Similarly, geo-political events in the United States
and extreme weather in the United States moved the spot prices of WTI more than those of BRENT. Two
examples have been chosen to illustrate this point.
The first event we are going to examine is the conflict in the Middle East between Israel and
Palestine. On August 26th, 2013, the Wall Street Journal reported that the Palestinians had put off peace
talks with the Israeli’s after Israeli forces killed three Palestinians in a raid. Oil prices responded
drastically because conflict in the Middle East could result in major supply setbacks. It could also cause
fighting that may spill over into other Middle Eastern nations like Egypt and Saudi Arabia, further
affecting overall supply. BRENT would be affected more than WTI would and the changes in spot price
on August 26th show this. Spot prices increased 3.04% rising from $108.57 to $111.87. WTI spot prices

14
on the other hand, increased .88% rising from $104.16 to $106.90. BRENT’s spot price increased more
because BRENT crude has a bigger presence outside of the United States while WTI dominates the
domestic oil markets. BRENT’s disproportional rise in relation to WTI’s spread lead to a widening of the
overall spread from $4.41 to $4.97.
An example of a case of severe weather within the United States that also affected the spread was
Hurricane Katrina. During the week of August 23rd
to August 30th, 2005 the spot price of WTI increased
6.2% from $65.81 to $69.91 while BRENT only marked a 1.5% increase moving from $65.16 to $66.15.
Being that Hurricane Katrina was a tragic event of severe circumstances that was focused within the
United States, WTI’s spot price increased dramatically because the production of oil was interrupted and
it was speculated that supply would lessen, leading to a higher demand-to-supply ratio and in return, a
higher price. In order to determine whether the drastic movement in the spot price of oil was unique, and
not in tandem with the market, we compared the movement in both spot prices (WTI & BRENT) to the
movements in the S&P500. During the 7 days from August 23rd
to August 30th the S&P 500 Index ticked
up .2% from $1205.10 to $1208.41.
When considering the aforementioned data and comparing it to historical data, it was found that
in recent years the returns of crude oil futures have more closely related to the returns on the S&P 500
(Exhibit 11). We have found that during the times of many geo-political events or periods of severe
weather, the spot prices of WTI and BRENT tend to follow the same general trend of the S&P 500 but
moves at a magnified rate.
Time Series Forecasting
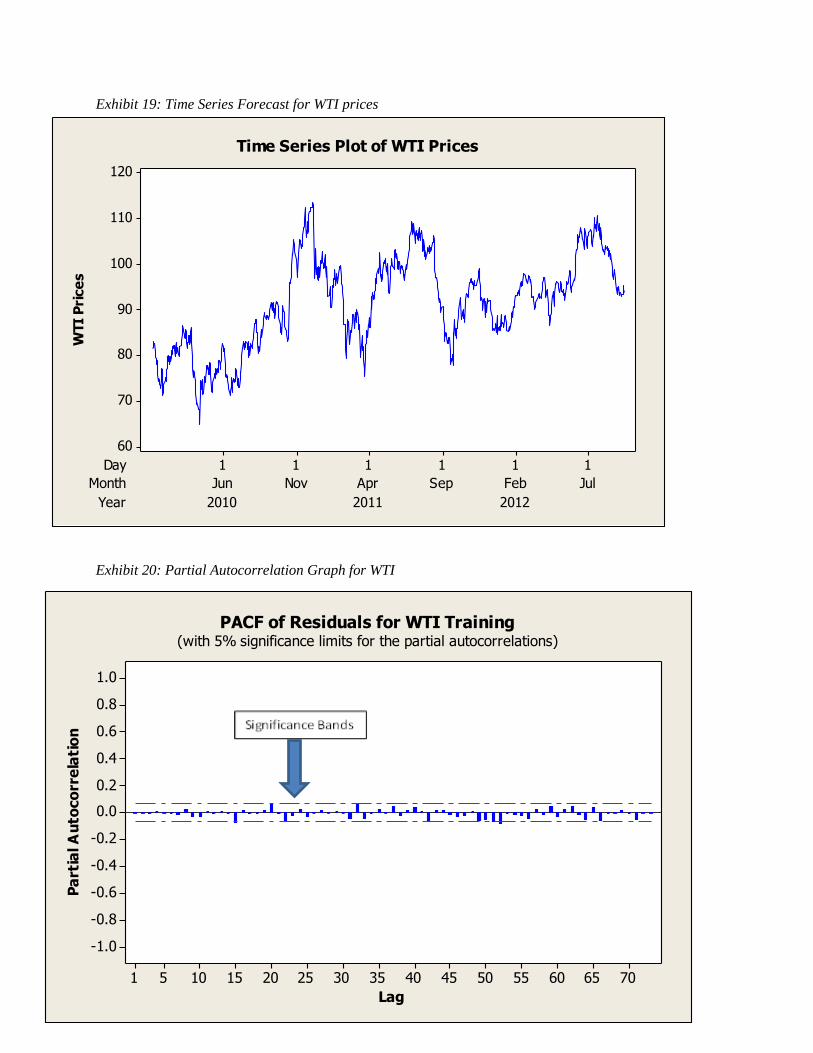
With the available historical WTI and Brent prices, Time Series methods were used as a means to
forecast future spot prices. When performing a preliminary analysis, all of the available data from 1987
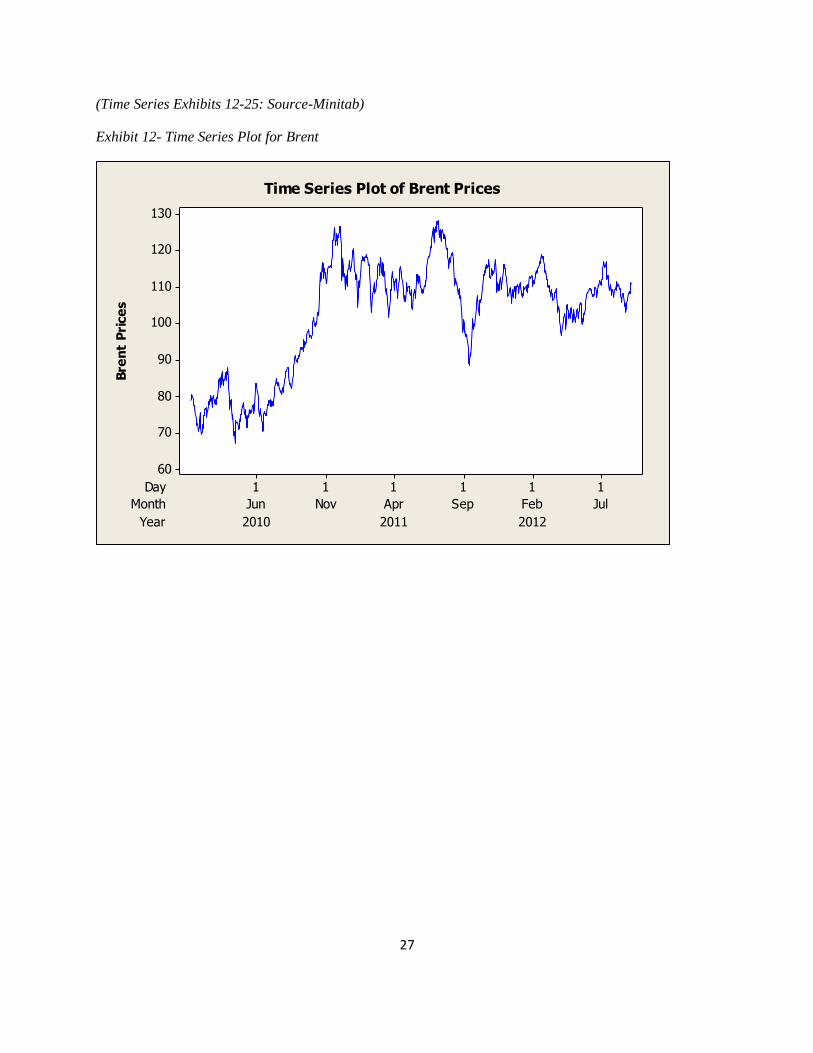
onwards was used to better gauge a forecast. Due to the high volatility in the prices, especially due to
spikes in prices that occurred in 2008, it was important to eliminate outlying data. To avoid any
discrepancies when forecasting the prices, stock prices post the financial crisis was used. Data after 2010
15
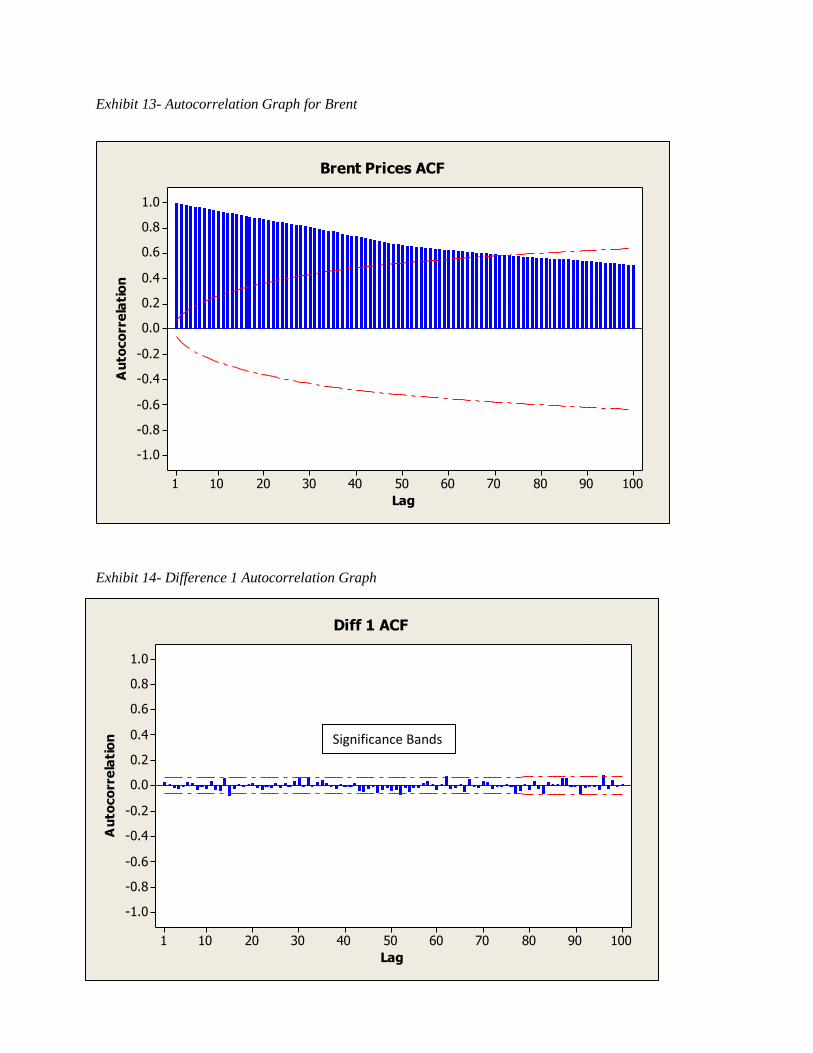
was used for the forecasting as by then markets had steadied (Exhibit 12&19). When observing the
autocorrelation function graph (ACF), it is seen that data points did not extend past the significance bands
(Exhibit 13). Additionally, the data in the ACF was exponentially decreasing which is indicative of non-
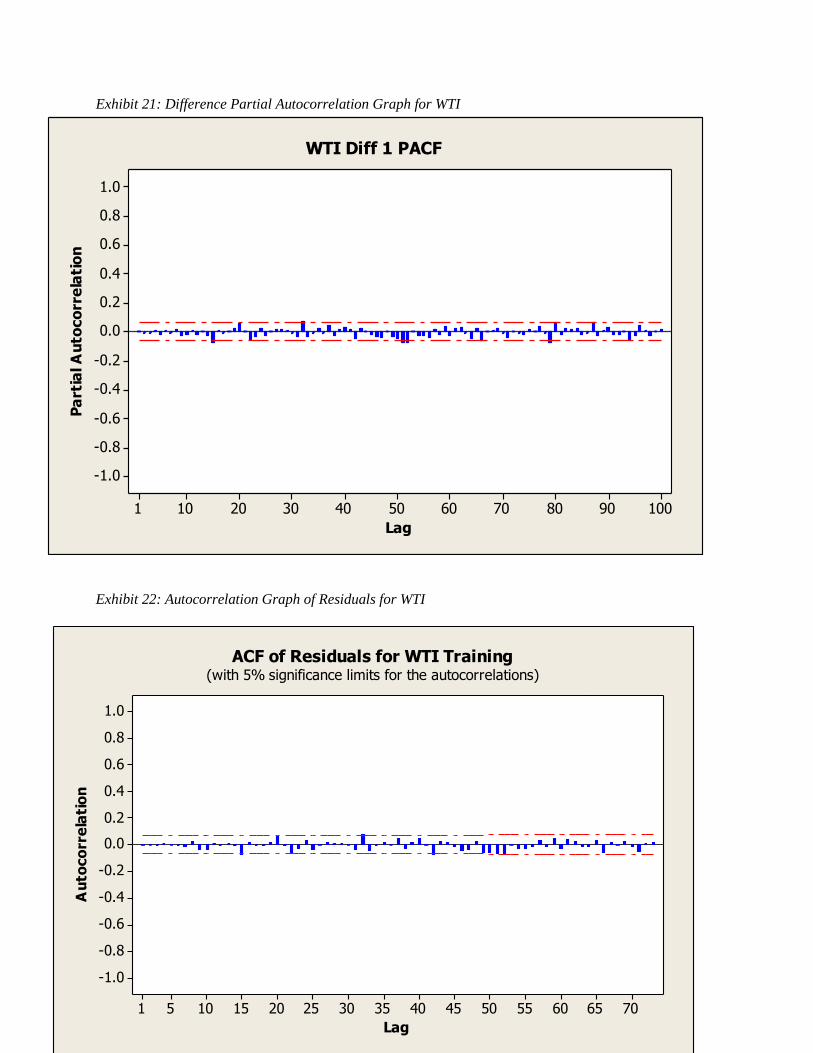
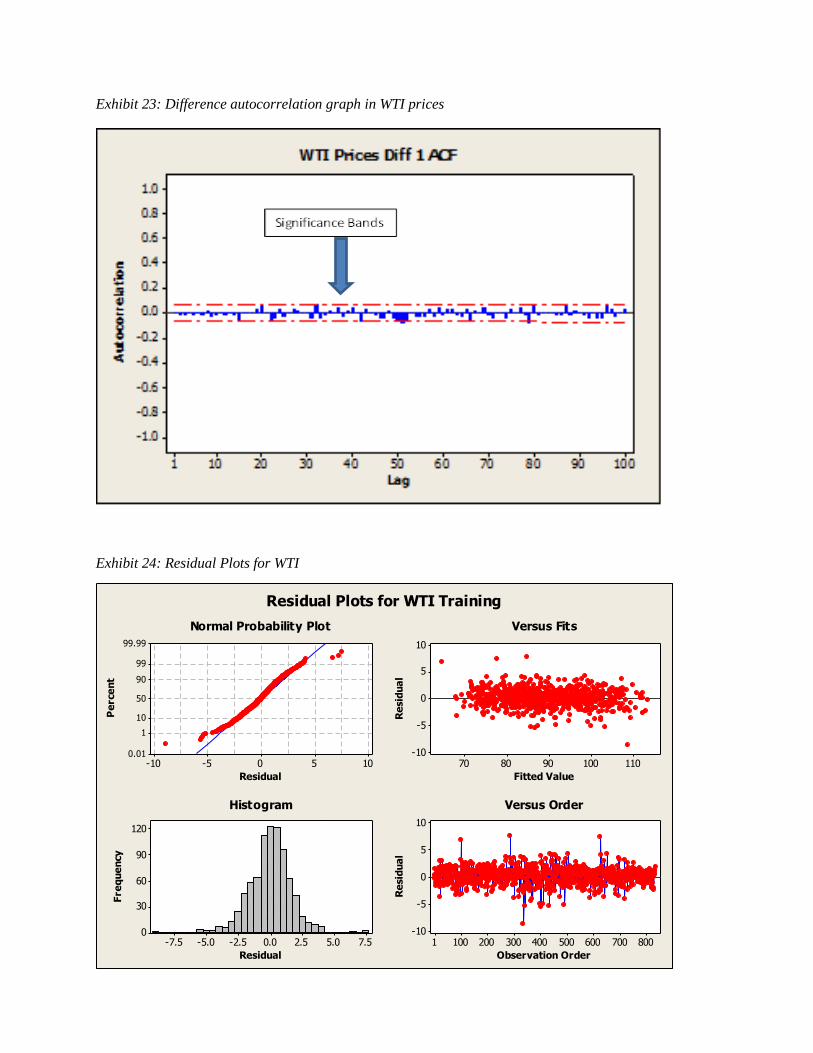
stationary data. To make this data stationary, a difference of the data was taken. To understand what
predictor model could be used, the ACF and the partial autocorrelation (PACF) of the difference graph
was observed (Exhibit 14&15). Based on these graphs, there is a spike that extends past the significance
band in the ACF and the PACF. After a great deal of trial and error, the best fitting model was an ARIMA
(0,1,1). When a forecast was run based on the model, it returned a future average Brent price of $110.819
and WTI price of $91.0678. The residuals for this model were strong because there was white noise as
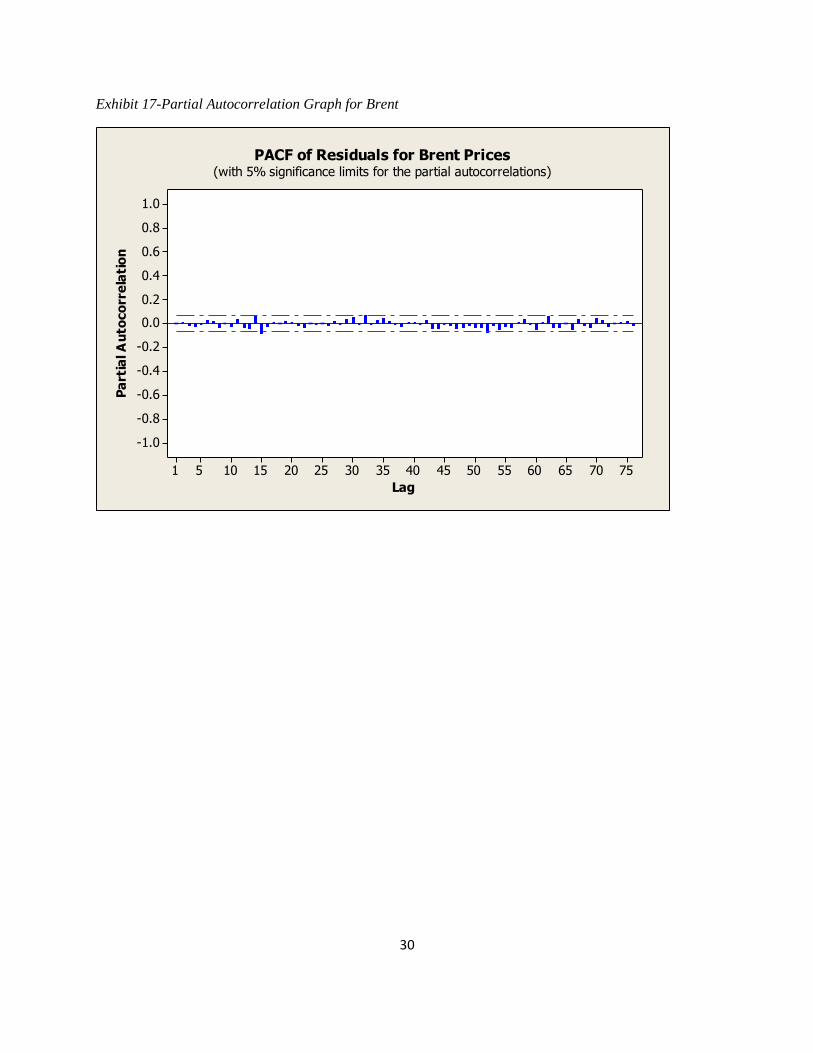
depicted by the data within the significance bands (Exhibits 16&17). Additionally, the p-values as
depicted in the Ljung-Box were significant as it was well above the 0.05. Though this is the case, the
parameters were not significant because it was well above the 0.05 (Exhibit 25). Due to the randomness
of the data, the system automatically implemented a naïve no change method. A naïve no change forecast
entails using the price of the stock today and predicting that it will remain the same tomorrow. Since the
data bars do not extend past the significance bands for both the Brent and WTI projections, it can be
concluded that the data is far too random to accurately forecast. It is important to note that it is not
practical to create a forecasting model for oil prices due to the high volatility and the large number of un-
predictable determinants (geo-political events, weather, etc.) that affect the price of oil.
CONCLUSION
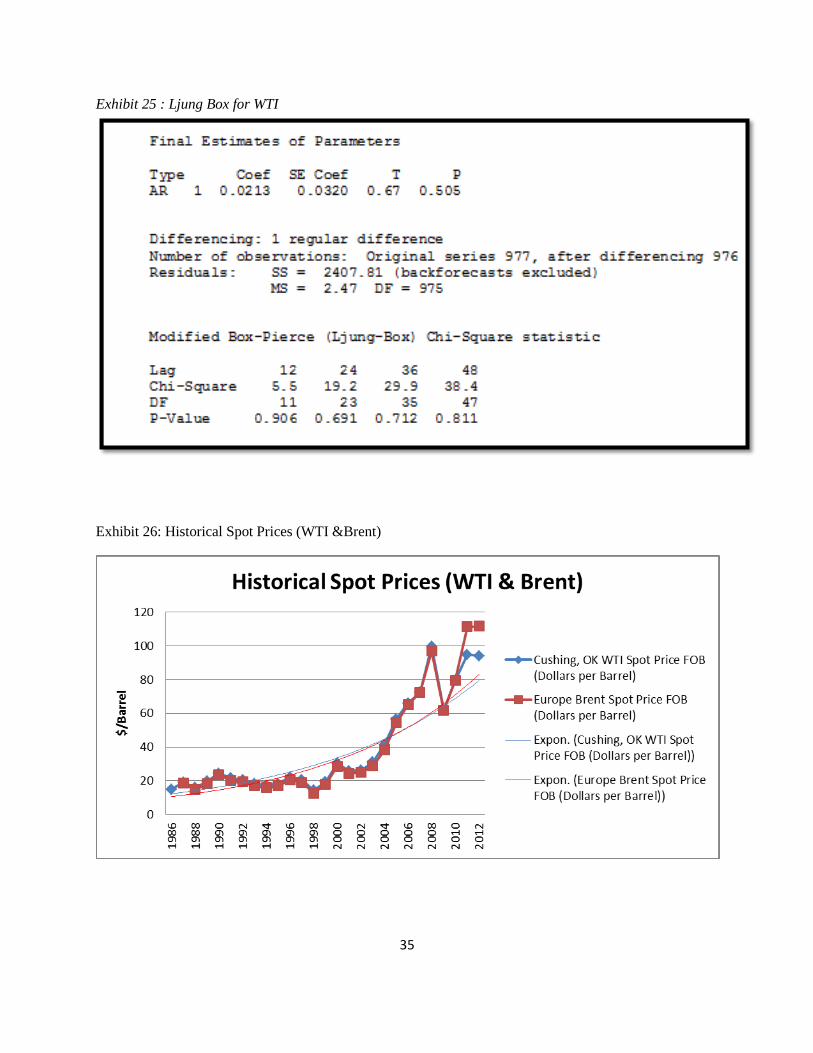
Looking at the spot prices for WTI and Brent over the past 25 years, the prices follow a general
upward trend. They have increased in price dramatically in the past 10 years as the availability of oil has
diminished, war in oil rich zones has broken out, and political positions have impacted the oil market.
Examining the data for WTI, the difference in price from 1987 to 2012 increased 79.58% from
$19.20/barrel to $94.05 per barrel. Brent prices have experienced even larger increases in price with an

16
83.40% increase from $18.53/barrel in 1987 to $111.63/barrel in 2012.26
This is without accounting for
inflation (Exhibit 27).
The spot prices for both WTI and Brent from before 2002 experienced relative price hikes as well
as price drops keeping a steady average hovering near $20/barrel, while the prices beginning in 2002 and
continuing on to 2012 experience only significant price increases with every year, effectively growing at
least $10/barrel every year (with the exception of 2008-2009 during the worst of the US economic
recession). This change in prices from a relatively steady price fluctuation to a steep rise in prices exhibits
an exponential growth trend for both WTI and Brent (plotted on included graph in Exhibit 26).
While the aforementioned data concretely points to a futures projection of infinitely increasing oil
prices, there exist external factors that may suddenly prove these predictions to be false. As discussed in
the paper, the spot prices of WTI & Brent are affected by everything from geo-political events and the
storage levels in Cushing, Oklahoma to instances of severe weather. These determinants are extremely
unpredictable and thus do not allow for oil price predictions that are significant enough to produce
predictions with strong confidence. This is displayed in the time series model completed. As one of the
highest traded commodities in the world, crude oil is one that has proven to be both highly profitable at
times and highly unpredictable. As the introduction of Exchange Traded Funds like USO & BNO has
allowed for heavier trading activity and more speculation due to ease of access to the market, WTI &
Brent are sure to experience many more unpredictable changes in price. As two of the main types of crude
oil, nobody knows what lies in the future of WTI and Brent, all we can do is wait and watch.
26
Energy Information Administration, (2013). Spot prices for crude oil and petroleum products. Retrieved from Thomson Reuters website: http://www.eia.gov/dnav/pet/pet_pri_spt_s1_a.htm

17
References
Bailey, Jeff. "Southwest Airlines gains advantage by hedging on long-term oil contracts." The New York Times.
28 Nov. 2007. <http://www.nytimes.com/2007/11/28/business/worldbusiness/28iht-
hedge.4.8517580.html?pagewanted=all&_r=0>.
(2013, December 04). Retrieved from http://www.bloomberg.com/quote/USO:US
"Commodity ETF and Futures Trading Center." Commodity HQ. http://commodityhq.com/trading-center/
Commodity futures price quotes for light crude oil (nymex). (2013). Retrieved from
http://futures.tradingcharts.com/marketquotes/CL_.html
Denning, L. (2013, November 15). Fracking the fear trade in oil and gas. The Wall Street Journal. Retrieved from
http://online.wsj.com/news/articles/SB10001424052702303559504579199781135303794
Energy Information Administration, (2012). Aeo2013 early release overview. Retrieved from Thomson Reuters
website: http://www.eia.gov/forecasts/aeo/er/index.cfm
Energy Information Administration, (2013). Spot prices for crude oil and petroleum products. Retrieved from
Thomson Reuters website: http://www.eia.gov/dnav/pet/pet_pri_spt_s1_a.htm
Energy Information Administration, (2013). Spread narrows between Brent and wti crude oil benchmark prices.
Retrieved from Thomson Reuters website: http://www.eia.gov/todayinenergy/detail.cfm?id=12391
Esterbrook, John. "Katrina Wreaks Havoc On Oil Market." CBSNews. CBS Interactive. 15 Nov. 2013
<http://www.cbsnews.com/news/katrina-wreaks-havoc-on-oil-market/>.
"FAQs: Oil." International Energy Agency. n. page. Web. 1 Dec. 2013. http://www.iea.org/aboutus/faqs/oil/
Fawley, Brett W., Luciana Juvenal, and Ivan Petrella. "When Oil Prices Jump, Is Speculation To Blame?" Federal
Reserve Bank of St. Louis. 7 Nov. 2013 <http://www.stlouisfed.org/publications/re/articles/?id=2232>.
Flynn, A. (2013, November 15). Oil futures: More guess than good judgement. The Wall Street Journal.
Retrieved from http://blogs.wsj.com/moneybeat/2013/11/15/oil-futures-more-guess-than-good-
judgement/?KEYWORDS=wti+and+Brent+spread
"Hurricane Katrina Underscores Tenuous State of U.S. Oil Refining Industry." PBS. 9 Sept. 2005. PBS.
Nov. 2013 <http://www.pbs.org/newshour/bb/weather/july-dec05/katrina/oil_background.html>.
hydraulic fracturing. (n.d.). Dictionary.com Unabridged. Retrieved November 19, 2013, from Dictionary.com
website: http://dictionary.reference.com/browse/hydraulic fracturing
Law of supply and fundamental analysis of commodity markets. (2013). Retrieved from
http://futures.tradingcharts.com/learning/law_of_supply.html
Most popular etfs: Top 100 etfs by trading volume. (2013). Retrieved from http://etfdb.com/compare/volume/
Murphy, Cait. "Why Oil Prices Are So Volatile." CBSNews. CBS Interactive. Nov. 2013
<http://www.cbsnews.com/news/why-oil-prices-are-so-volatile/>.
"No Safety Net." The Economist. 8 Sept. 2005. <http://www.economist.com/node/4377398>.

18
Nguyen, L. (2013, November 13). Brent-wti spread expands to seven-month high on libya. Retrieved from
http://www.bloomberg.com/news/2013-11-13/Brent-oil-gains-as-protests-in-libya-disrupt-supply.html
Nguyen, L. (2012, August 1). London overtakes new york as Brent oil beats wti. Retrieved from
http://www.bloomberg.com/news/2012-08-01/Brent-beats-wti-oil-trading-as-ice-eclipses-nymex.html
Pan, Ingrid. "Brief background on why the Syrian conflict affects oil prices." Yahoo Finance. 10 Nov. 2013
<http://finance.yahoo.com/news/brief-background-why-syrian-conflict-205303897.html>.
Philbin, B., & Strumph, D. (2013, September 16). Syria widening wti-Brent spread. The Wall Street Journal.
Retrieved from
http://online.wsj.com/news/articles/SB10001424127887323342404579079384003657794?KEYWORDS
=wti+and+Brent+spread
Phillips, Matthew. "Have Oil Speculators Already Priced In War With Iran?" Bloomberg Businessweek. 7 Mar.
2012. <http://www.businessweek.com/articles/2012-03-07/have-oil-speculators-already-priced-in-war-
with-iran>.
Propublica. (n.d.). Retrieved from http://www.propublica.org/special/hydraulic-fracturing-national 1
Fontacchia, A. (2011, July -8). Oil price:Brent-wti spread above $22 and here to stay. Retrieved from
http://www.forbes.com/sites/afontevecchia/2011/07/08/oil-prices-Brent-wti-spread-above-22-and-here-to-
stay/2/
Shenk, Mark. "WTI Crude Rises on Planned Gulf Pipeline Completion." Bloomberg. (2013): n.page. Web. 1 Dec.
2013. http://www.bloomberg.com/news/2013-10-02/wti-crude-drops-amid-u-s-government-
shutdown.html
Smith, G. (2012, November 26). Brent poised to depose wti as most-traded oil futures. Retrieved from
http://www.bloomberg.com/news/2012-11-26/Brent-poised-to-oust-wti-as-most-traded-oil-futures.html
United States. Energy Information Administration. Hurricane Katrina's Impact on the U.S. Oil and Natural Gas
Markets . 2005. Web. http://www.eia.gov/oog/special/eia1_katrina_091505.html
United States. Energy Information Administration. Short-Term Energy Outlook . 2013. Web.
http://www.eia.gov/forecasts/steo/
US Environmental Protection Agency, (2012). Hydraulic fracturing background information. Retrieved from
website: http://water.epa.gov/type/groundwater/uic/class2/hydraulicfracturing/wells_hydrowhat.cfm
Werber, Cassie. "Brent Crude Higher Amid Mixed Middle East Signals ." Wall Street Journal. (2013): n. page.
Web. 1 Dec. 2013. http://online.wsj.com/article/BT-CO-20131112-704142.html
"What Affects Oil Prices?" What Affects Oil Prices? 24 July 2009. 14 Nov. 2013 <http://oilprice.com/Energy/Oil-
Prices/What-Affects-Oil-Prices.html>.
"What Drives Crude Oil Prices?" Energy & Financial Markets. U.S. Energy Information Administration. 5 Nov.
2013 <http://www.eia.gov/finance/markets/supply-opec.cfm>.
19
Exhibits
Exhibit 1: Crude Oil Contract Liquidity
Contract Total Volume Platform Monthly Change
Crude Oil Phy 13,792,055 NYMEX 23.8%
Natural Gas Phy 6,991,269 NYMEX 21.8%
Soybeans 5,288,616 CBOT 53.6%
Corn 4,919,498 CBOT 43.2%
Gold 3,458,162 COMEX 3.8%
http://commodityhq.com/trading-center/
Exhibit 2: Oil Futures Contracts
Contract Size Quotation Platform
Copper (HG) 25,000 pounds U.S. Cents per pound COMEX
Corn
5,000 bushels (127 Metric Tons)
Cents per bushel CBOT
Cotton 50,000 pounds U.S. Dollars per pound NYMEX
Gold (GC) 100 troy ounces U.S. Dollars and Cents
per troy ounce COMEX
Heating Oil (HO) 42,000 gallons U.S. Dollars and Cents
per gallon NYMEX
Light Sweet Crude Oil(WTI) (CL)
1,000 barrels U.S. Dollars and Cents
per barrel NYMEX
Natural Gas (Henry Hub) (NG)
10,000 million British thermal units (mmBtu)
U.S. dollars and cents per mmBtu
NYMEX
RBOB Gasoline (RT) 42,000 gallons U.S. dollars and cents per
gallon NYMEX
Silver (SI) 5,000 troy ounces U.S. Cents per troy ounce COMEX
Sugar (No. 11) 112,000 pounds U.S. Dollars per pound NYMEX
http://commodityhq.com/trading-center/
20
Exhibit 3 : Brent & WTI End of Day price as of 12/4/2013
Crude Oil & Natural Gas
Commodity Units Price Change % Change Contract Time(ET)
Crude Oil (WTI) USD/bbl. 97.20 +1.16 +1.21% Jan 14 12/04/2013
Crude Oil (Brent) USD/bbl. 111.54 -1.08 -0.96% Jan 14 17:43:13
TOCOM Crude Oil JPY/kl 68,430.00 -780.00 -1.13% May 14 13:59:31
NYMEX Natural Gas USD/MMBtu 3.96 -0.02 -0.40% Jan 14 12/04/2013
http://www.bloomberg.com/energy/
Exhibit 4: WTI/Brent Spread

21
Exhibit 5: Crude Oil’s Role in Commodity Trading
http://www.eia.gov/finance/markets/reports_presentations/eia_what_drives_crude_oil_prices.pdf
22
Exhibit 6: Effect of Syrian Conflict on Brent & WTI Spot Prices
http://research.stlouisfed.org/fred2/graph
Exhibit 7: USO
Source: Bloomberg
Intensification of unrest in Syria
followed by announcement of
possible U.S. strike in August.
23
Exhibit 8: Regression Analysis: WTI vs. USO % Change
Source: Minitab
0.100.050.00-0.05-0.10
99.99
99
90
50
10
1
0.01
Residual
Pe
rce
nt
0.00-0.25-0.50-0.75-1.00
0.10
0.05
0.00
-0.05
-0.10
Fitted Value
Re
sid
ua
l
0.120.090.060.030.00-0.03-0.06
300
200
100
0
Residual
Fre
qu
en
cy
16001400120010008006004002001
0.10
0.05
0.00
-0.05
-0.10
Observation Order
Re
sid
ua
l
Normal Probability Plot Versus Fits
Histogram Versus Order
Residual Plots for USO vs. WTI
24
Exhibit 9: Mean spread USO and WTI
Source: Bloomberg
25
Exhibit 10: BNO and Brent
Source: Minitab
0.040.020.00-0.02-0.04
99.99
99
90
50
10
1
0.01
Residual
Pe
rce
nt
0.00-0.25-0.50-0.75-1.00
0.04
0.02
0.00
-0.02
-0.04
Fitted Value
Re
sid
ua
l
0.03750.02500.01250.0000-0.0125-0.0250
200
150
100
50
0
Residual
Fre
qu
en
cy
8007006005004003002001001
0.04
0.02
0.00
-0.02
-0.04
Observation Order
Re
sid
ua
l
Normal Probability Plot Versus Fits
Histogram Versus Order
Residual Plots for Brent vs. BNO

26
Exhibit 11: Increasing Correlation Between Crude Oil and S&P 500 Returns
Source: www.eia.gov
27
(Time Series Exhibits 12-25: Source-Minitab)
Exhibit 12- Time Series Plot for Brent
Year
Month
Day
201220112010
JulFebSepAprNovJun
111111
130
120
110
100
90
80
70
60
Bre
nt
Pri
ce
s
Time Series Plot of Brent Prices
28
Exhibit 13- Autocorrelation Graph for Brent
Exhibit 14- Difference 1 Autocorrelation Graph
1009080706050403020101
1.0
0.8
0.6
0.4
0.2
0.0
-0.2
-0.4
-0.6
-0.8
-1.0
Lag
Au
toco
rre
lati
on
Brent Prices ACF
1009080706050403020101
1.0
0.8
0.6
0.4
0.2
0.0
-0.2
-0.4
-0.6
-0.8
-1.0
Lag
Au
toco
rre
lati
on
Diff 1 ACF
Significance Bands

29
Exhibit 15- Difference Partial Autocorrelation Graph for Brent
Exhibit 16- Autocorrelation Graph of Residuals for Brent
1009080706050403020101
1.0
0.8
0.6
0.4
0.2
0.0
-0.2
-0.4
-0.6
-0.8
-1.0
Lag
Pa
rtia
l A
uto
co
rre
lati
on
Diff 1 PACF
757065605550454035302520151051
1.0
0.8
0.6
0.4
0.2
0.0
-0.2
-0.4
-0.6
-0.8
-1.0
Lag
Au
toco
rre
lati
on
ACF of Residuals for Brent Prices(with 5% significance limits for the autocorrelations)
30
Exhibit 17-Partial Autocorrelation Graph for Brent
757065605550454035302520151051
1.0
0.8
0.6
0.4
0.2
0.0
-0.2
-0.4
-0.6
-0.8
-1.0
Lag
Pa
rtia
l A
uto
co
rre
lati
on
PACF of Residuals for Brent Prices(with 5% significance limits for the partial autocorrelations)

31
Exhibit 18: Residual Plots for Brent Prices
50-5-10
99.99
99
90
50
10
1
0.01
Residual
Pe
rce
nt
120105907560
5
0
-5
-10
Fitted Value
Re
sid
ua
l
420-2-4-6-8
200
150
100
50
0
Residual
Fre
qu
en
cy
9008007006005004003002001001
5
0
-5
-10
Observation Order
Re
sid
ua
l
Normal Probability Plot Versus Fits
Histogram Versus Order
Residual Plots for Brent Prices
32
Exhibit 19: Time Series Forecast for WTI prices
Exhibit 20: Partial Autocorrelation Graph for WTI
7065605550454035302520151051
1.0
0.8
0.6
0.4
0.2
0.0
-0.2
-0.4
-0.6
-0.8
-1.0
Lag
Pa
rtia
l A
uto
co
rre
lati
on
PACF of Residuals for WTI Training(with 5% significance limits for the partial autocorrelations)
Year
Month
Day
201220112010
JulFebSepAprNovJun
111111
120
110
100
90
80
70
60
WTI
Pri
ce
s
Time Series Plot of WTI Prices
33
Exhibit 21: Difference Partial Autocorrelation Graph for WTI
Exhibit 22: Autocorrelation Graph of Residuals for WTI
7065605550454035302520151051
1.0
0.8
0.6
0.4
0.2
0.0
-0.2
-0.4
-0.6
-0.8
-1.0
Lag
Au
toco
rre
lati
on
ACF of Residuals for WTI Training(with 5% significance limits for the autocorrelations)
1009080706050403020101
1.0
0.8
0.6
0.4
0.2
0.0
-0.2
-0.4
-0.6
-0.8
-1.0
Lag
Pa
rtia
l A
uto
co
rre
lati
on
WTI Diff 1 PACF
34
Exhibit 23: Difference autocorrelation graph in WTI prices
Exhibit 24: Residual Plots for WTI
1050-5-10
99.99
99
90
50
10
1
0.01
Residual
Pe
rce
nt
110100908070
10
5
0
-5
-10
Fitted Value
Re
sid
ua
l
7.55.02.50.0-2.5-5.0-7.5
120
90
60
30
0
Residual
Fre
qu
en
cy
8007006005004003002001001
10
5
0
-5
-10
Observation Order
Re
sid
ua
l
Normal Probability Plot Versus Fits
Histogram Versus Order
Residual Plots for WTI Training
35
Exhibit 25 : Ljung Box for WTI
Exhibit 26: Historical Spot Prices (WTI &Brent)

36
Exhibit 27: Historic Crude Oil Prices for WTI & Brent
Source: www.eia.gov
Date
Cushing, OK WTI
Spot Price FOB
(Dollars per
Barrel)
Europe Brent Spot
Price FOB
(Dollars per
Barrel)
1986 15.05
1987 19.2 18.53
1988 15.97 14.91
1989 19.64 18.23
1990 24.53 23.76
1991 21.54 20.04
1992 20.58 19.32
1993 18.43 17.01
1994 17.2 15.86
1995 18.43 17.02
1996 22.12 20.64
1997 20.61 19.11
1998 14.42 12.76
1999 19.34 17.9
2000 30.38 28.66
2001 25.98 24.46
2002 26.18 24.99
2003 31.08 28.85
2004 41.51 38.26
2005 56.64 54.57
2006 66.05 65.16
2007 72.34 72.44
2008 99.67 96.94
2009 61.95 61.74
2010 79.48 79.61
2011 94.88 111.26
2012 94.05 111.63