wssc feasibility study for generating combined heat ... · no excess energy for power production...
TRANSCRIPT

Water & Energy in Maryland Symposium
WSSC Feasibility StudyFor Generating Combined Heat & Power
from WSSC's
Wastewater Biosolids(Converting a Waste Into a Resource)
Kevin Selock, Parkway WWTP Superintendent10/28/10
1.

Water/Wastewater as Users of Power
WSSC’s has $25M annual power budget; actual power usages identified below for major facilities. (Excludes pump stations, tanks, vaults, depots, admin offices).
mgd $/yr Electricity avg dailyavg day (millions) kWh/yr kWh/mg MW
Potomac WTP 116.0 9.5 80,525,000 1,902 9.2Patuxent WTP 49.0 2.4 21,825,000 1,220 2.5
Piscataway WWTP 23.7 2.1 17,270,000 1,996 2.0Western Branch WWTP 21.0 2.8 23,815,000 3,107 2.7Parkway WWTP 6.7 0.8 7,880,000 3,222 0.9Seneca WWTP 16.0 2.1 15,370,000 2,632 1.8Damascus WWTP 0.9 0.2 2,130,000 6,484 0.2
Approx Total = 20 MW daily
3.

Anaerobic Digestion (AD)
What is it?Cc Hh Oo Nn Ss + yH2 O --->- xCH4 + nNH3 + sH2 S + (c-x) CO2
Benefits?• Reduction in biosolids (of approx 50-60%).
• Destruction process can convert a waste into a resource through production of CH4, which can be recovered for combined heat & power (CHP); approx 60% CH4 and 40% CO2 with trace other gases.
4.

Recent U.S. AD/CHP Developments – EPA Report
Opportunities for and Benefits of Combined Heat and Power (CHP) atWastewater Treatment Facilities, EPA, April 2007:
• Typical WWTP processes 100 gpd/person. Can produce approx 1 ft3/day- person biogas, and yield 2.2 W (@30% efficiency). 600 BTU/ft3 biogas. For each 4.5 mgd treated, approximately 100 kW energy can be produced.
• 16,000 U.S. WWTPs & 1,000 >= 5 mgd. EPA assumed if 544 U.S. WWTPs >= 5 mgd w/AD installed CHP, approx 340 MW of electricity could be produced daily.
• CHP is strong technical fit for WWTPs, as well as compelling investment (depending upon local electrical prices); under-utilized to date.
• Some examples where used include: Atlanta, Baltimore**, Boston**, Chicago, Dallas, Denver*, Detroit, Honolulu, Los Angeles*, NYC*, Oakland*, Phoenix, San Diego*, San Jose**, Seattle*, Wilmington
6.
* Signficant history converting biogas to energy. ** Recent addition of CHP systems. All others flare biogas.

Gasification and/or CombustionExample Gasification Process
Sanford FL WWTP, MaxWest gasification system (L); heat then used to dry biosolids used as fuel (R). At present, no excess energy for power production – plans to import additional “dry” solids to augment gasifier.
9.

Co-combustion with Dried Biosolids
• Bituminous coal @ 8,000 - 10,000 Btu/lb vs. dried biosolids @ 6,500 – 7,500 Btu/lb.
• Lehigh Cement’s Union Bridge MD, uses dried biosolids (from Baltimore & Boston) to offset up to 20% coal.
• MDE permits Lehigh to combust up to 30,000 tpy biosolids as fuel.
Drying & pelletization
Dried biosolids for use as fertilizer or fuel
Lehigh Cement Plant at Union Bridge
10.

Co-Combustion by Power Plants• Power plants look to co-combust biomass &
diversify feedstocks beyond fossil fuels (ie. consistent w/ RPS goals).
• Power plants ideal in terms of 24/7/365 (like WWTPs), many near population centers like WWTPs, only 35% efficient so huge quantities of waste heat for available drying, … . Potential for regional drying and combustion of biosolids.
• Drawbacks – huge MW capacities, additional investment, risks (such as: odors, new regulations such as EPA’s “Emission Standards for Hazardous Air Pollutants for Major or Area Sources”, likely public opposition, …).
• 8 million dry metric tonnes biosolids annually in U.S. – potential to produce 1,311 MW/day electricity (35% efficiency), or up to 2,611 MW/day combined heat and power (70% efficiency).
Scottish Power’s Longannet Power Station
Germany’s Heilbronn Power Station11.

WSSC WWTP Biosolids - Convert a Waste Into a Resource?• 5 major plants, rely upon lime
stabilization, (except Western Branch WWTP which incinerates biosolids). Lime stabilized biosolids are land applied, primarily throughout VA.
• Evaluate AD/CHP at Piscataway (P.G.) & Seneca (Montgomery) due to economies of scale – approx 400 kW potential at each.
• Evaluate gasification, drying, and/or combustion as alternatives.
• Consider augmenting selected processes w/ biosolids from other WSSC WWTPs.
• WSSC biosolids have energy potential of 619 MMBtu/day, or 2.6 MW/day @ 35% efficiency. (Piscataway & Seneca account for 60% of total.)
Piscataway WWTP
Seneca WWTP12.

Task I BDocument Existing Treatment Plant Conditions & Planning Assumption
TMs 1-C Parts 1-5
Task I CStep 1: Identify Options for
Anaerobic Digestion & Related Technologies
Step 2: Screen technologies
Task I DStep 1: Identify Options
For Drying Based Alternatives & Related
Technologies
Step 3: Develop and Shortlist Anaerobic
Digestion Alternatives
Project Work Plan
Step 2: Screen technologies
TM 1-B “Basis of Planning”Workshop #1
TMs 1-D Part 1-3
Step 3: Develop and Shortlist Drying Based
Alternatives
Workshop 5Workshops 2 & 3
Workshop 43 AD/CHP Alternatives for
each plant
Workshop 62 Biomass Alternatives
Task 1 – Preliminary Investigations
Task I AConduct Meetings and Site Investigations
& Compile Relevant Data
BalancedTechnical Solution
Viable Alternatives
Shortlist
13.
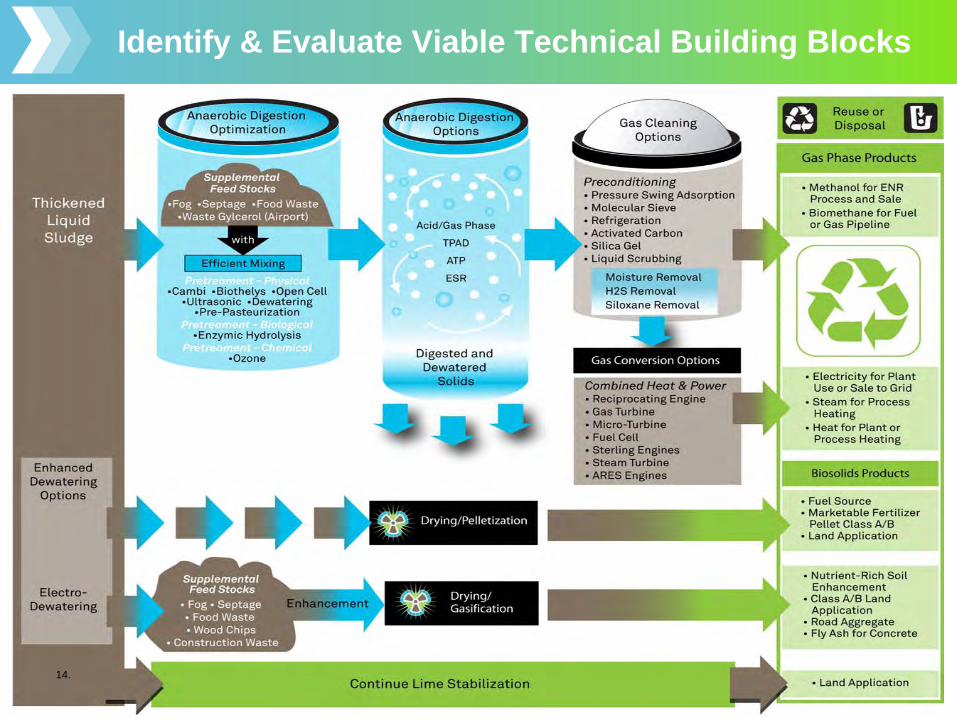
Identify & Evaluate Viable Technical Building Blocks
14.

Task I Preliminary
Investigations
Task II Development & Selection of Alternatives
Task III Technical Memorandum,
Conceptual Design, and Recommendations
Step 1: Evaluate Plant Integration issues
Step 2: Evaluate project Implementation / Execution Options
Workshops 7 TM II A
Step 3: Summarize non-economic benefits and impacts of each alternative
Workshop 9
Workshops 8TM II B
Task II C: Select “Best”Anaerobic Digestion
Alternative
Task IIA: Prepare Non-Economic Evaluation Background Narratives
Task II D: Select “Best”Drying Based Alternative
Task II B: Prepare Cost Opinions
Workshop 10
Task II – Development & Selection Of Alternatives
“Best”Alternative
15.

Task IIIA: Draft Technical Memorandum
Task III B: Prepare Conceptual Designs
Task III C: Finalize and Distribute Report
Workshop 11 & 12
Final Report
Task I Preliminary
Investigations
Task II Development & Selection of Alternatives
Task III Technical Memorandum,
Conceptual Design, and Recommendations
Project Work Flow
Task III – Technical Memorandum, Concept Design & Recommendations
16.

Summary
• Water & Wastewater treatment is a very energy intensive industry. WSSC facilities average approximately 2,000 – 3,000 kWh/mg treated.
• There are opportunities to recover energy from wastewater biosolids – converting a waste into a resource. (Note: Power recovered is fraction of power required to treat.)
• In most cases, significant investment in new facilities (possibly anaerobic digesters, gas cleaning systems, generators, new facilities to treat recycle streams, …) will be required to recover the energy. (Note: EPA AD/CHP report focused on addition of CHP where digesters were already in-place.)
• WSSC has begun comprehensive feasibility evaluation of AD/CHP, gasification, and/or co-combustion. Scheduled completion is Summer 2011.
• Feasibility will be largely driven by cost of power, RPS goals and incentives, political will, public support, … .
17.

Research Needs
• Emerging Technologies for Biosolids Management, EPA 832- R-06-005, September 2006 – see Chapter 9
• “State of Science Report: Energy and Resource Recovery from Sludge”, Global Water Research Coalition, 2008 – see Chapter 8 (Gaps in Knowledge)
• “BioEnergy Research: The Place Where Water Meets Energy”, WEF Residuals & Biosolids Workshop, May 2009
18.

European Experience Converting Wastes Into Resources
• Gryaab & Henriksdal WWTPs (Sweden) digest biosolids & FOG; biogas is compressed and used to fuel transit buses. WWTP effluent used for district heating.
• Vasteras WWTP (Sweden) co-digests biosolids, source separated organics, & FOG. Semi-annually also supplement with Ley crop silage. NH3 rich centrate stored and land applied on farms in lieu of fertilizers.
• CAMBI AS thermal hydrolysis AD/CHP, one of multiple AD alternatives. Facility in Dublin IRE produces up to 4 MW; 1 WWTP.
from “Discussion Paper: Investigation of Examples of Integrated Resource Managementin Sweden”, 031-DP-2, CH2M-Hill, May 2008
19.

European Experience Converting Wastes Into Resources
AD/CHP used even at small scales such as farms.
Country 2001 2002 2003 2004 2005 2006
Germany 600 659 685 1291 1594 1923
United Kingdom 904 1076 1151 1473 1600 1696
Italy 153 155 155 203 344 354
Spain 134 168 257 275 317 334
France 196 302 322 359 220 227
The Netherlands 161 149 154 110 119 119
Austria 56 59 64 42 31 118
EU leaders in biogas production (kilotons of oil equivalent), from www.eubia.org/108.0.html
Farmatic, Hashoj, Danemark
Farmatic, Holsworthy England
MT-Energie Biogas Technologie20.

• Brugge & Brussels, Belgium + Copenhagen Denmark– ZEROFUEL drying and fluidized bed combustion.
• Germany & Netherlands are recognized as leaders in co-firing wastes (including biosolids) at power, WTE, & cement plants.
• AD/CHP of MSW focusing on segregated vegetable, fruit, garden, and paper waste via CAMBI, Dranco, Haase, Monsal, Passavant … systems.
• Renova MSW WTE facility (Sweden) with district heating loop for CHP.
Keppel Seghers drying & combustion facility in Brugge, Belgium
Monsal MSW digester at Kings Lynn, UK
European Experience Converting Wastes Into Resources
from “Discussion Paper: Investigation of Examples of Integrated Resource Managementin Sweden”, 031-DP-2, CH2M-Hill, May 200821.

Water/Wastewater as Users of Power and GHG Contributors
• Many factors – topography, influent water quality and quantity, treatment technology (lagoons, aeration basins, … membranes), levels of treatment (primary, secondary, nitrification, nutrient removal such as BNR or ENR, …), size / age / efficiency of facilities & equipment.
• Majority of power usage is typically associated with pumping and/or aeration, though biosolids handling can also be significant.
• California - 15% of energy used to pump water & wastewater + another 5% to treat – it is the largest energy consumer industry in the state.
• Inventory of U.S. GHG Emissions & Sinks: 1990-2003 reports 95% of CO2(5,500 Tg/year CO2 Eq.) originates from fossil fuel combustion – of which 40% originates from electricity generators; 7% of CH4 (35 Tg CO2 Eq) originates from wastewater treatment; 5% of N2 O (15 Tg CO2 Eq) originates from human sewage.
2.

Drivers of Renewed Interest in U.S. AD/CHP• Increasing cost of power.
• Focus on Green House Gases (GHGs).
• Renewable Portfolio Standards (RPSs).
5.

Recent U.S. AD/CHP Developments
• Millbrae, CA – supplement biosolids AD/CHP with Fats, Oils, & Grease (FOG).
• Oakland, CA (East Bay Municipal District / EBMUD) – supplement biosolids AD/CHP with food waste.
7.

Use of AD/CHP in MD/DC/PA
• Baltimore’s Back River WWTP
• Howard County’s Little Patuxent WRF
• Washington DC’s Blue Plains WWTP
• Hershey PA’sDerry TownshipWWTP
Back River WWTP AD/CHP(Three 1MW Gensets)
Derry Twsp WWTP in Hershey PA(1.5MkWh produced annually)
8.