ws07.02 exponential functions - project maths
TRANSCRIPT
– 4 –
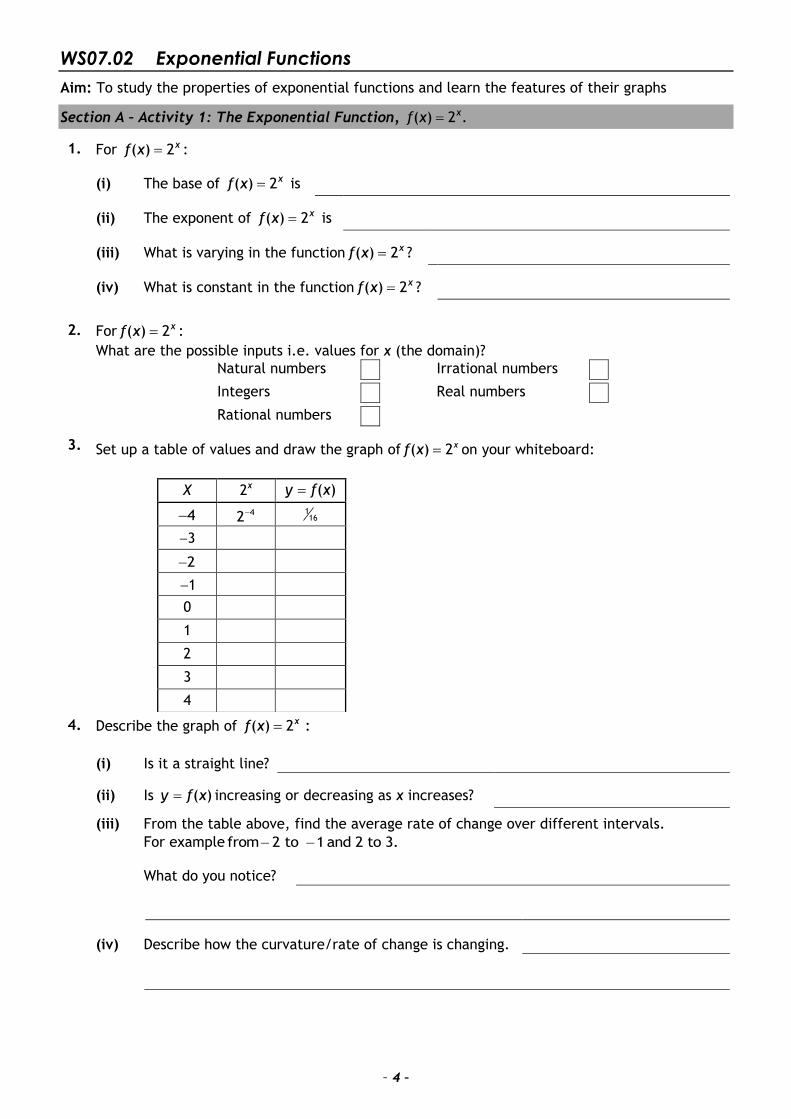
WS07.02 Exponential Functions
Aim: To study the properties of exponential functions and learn the features of their graphs
Section A – Activity 1: The Exponential Function, ( ) 2 .xf x
1. For ( ) 2xf x :
(i) The base of ( ) 2xf x is
(ii) The exponent of ( ) 2xf x is
(iii) What is varying in the function ( ) 2xf x ?
(iv) What is constant in the function ( ) 2xf x ?
2. For ( ) 2xf x :
What are the possible inputs i.e. values for x (the domain)?
Natural numbers Irrational numbers
Integers Real numbers
Rational numbers
3. Set up a table of values and draw the graph of ( ) 2xf x on your whiteboard:
X 2x ( )y f x
4 42 116
3
2
1
0
1
2
3
4
4. Describe the graph of ( ) 2 :xf x
(i) Is it a straight line?
(ii) Is ( )y f x increasing or decreasing as x increases?
(iii) From the table above, find the average rate of change over different intervals.
For example from 2 to 1 and 2 to 3.
What do you notice?
(iv) Describe how the curvature/rate of change is changing.
– 5 –
5. For ( ) 2 :xf x
(i) What are the possible outputs (range) for ( ) 2 .xf x
(ii) Is it possible to have negative outputs? Explain why?
(iii) What happens to the output as x decreases?
(iv) Is an output of 0 possible? Why do you think this is?
(v) What are the implications of this for the x-intercept of the graph?
(vi) What is the y-intercept of the graph of ( ) 2xf x ?

– 6 –
Section A – Activity 2: The Exponential Function, ( ) 3 .xg x
1. For ( ) 3xg x :
(i) The base of ( ) 3xg x is
(ii) The exponent of ( ) 3xg x is
(iii) What is varying in the function ( ) 3xg x ?
(iv) What is constant in the function ( ) 3xg x ?
2. For ( ) 3xg x :
What are the possible inputs i.e. values for x (the domain)?
Natural numbers Irrational numbers
Integers Real numbers
Rational numbers
3. Set up a table of values and draw the graph of ( ) 3xg x on your whiteboard:
X 3x ( )y g x
4 43
181
3
2
1
0
1
2
3
4
4. In relation to the graph of ( ) 3 :xg x
(i) Is it a straight line?
(ii) Is ( )y g x increasing or decreasing as x increases?
(iii) From the table above, find the average rate of change over different intervals.
For example from 2 to 1 and 2 to 3.
What do you notice?
(iv) Describe how the curvature/rate of change is changing.

– 7 –
5. For ( ) 3 :xg x
(i) What are the possible outputs (range) for ( ) 3 .xg x
(ii) Is it possible to have negative outputs? Explain why?
(iii) What happens to the output as x decreases?
(iv) Is an output of 0 possible? Why do you think this is?
(v) What are the implications of this for the x-intercept of the graph?
(vi) What is the y-intercept of the graph of ( ) 3xg x ?

– 8 –
Section A – Activity 3: Compare the graph of ( ) 2xf x with the graph of ( ) 3 .xg x
1. How are they similar and how do they differ?
2. Consider the relations ( , ) , , 2xx y x y y and ( , ) , , 3xx y x y y .
Are they functions? Explain.
3. What name do you think is given to this type of function and why do you think it is given this name?
Section A – Activity 4: Understand the characteristics of ( ) , 1.xf x a a
1. What is the domain of ( ) , 1?xf x a a
2. In relation to the graph of ( ) , 1.xf x a a
(i) Is it a straight line?
(ii) Is ( )y f x increasing or decreasing as x increases?
(iii) Does it have a maximum value?
(iv) Does it have a minimum value?
(v) Describe how its curvature/rate of change is changing.
3. What is the range of ( ) , 1?xf x a a
4. What is the x–intercept of the graph ( ) , 1?xf x a a
5. What is the y–intercept of the graph ( ) , 1?xf x a a

– 9 –
Section B – Activity 1: The Exponential Function, 1
( ) .2
x
f x
1. For 1
( )2
x
f x
:
(i) The base of
1( )
2
x
f x
is
(ii) The exponent of
1( )
2
x
f x
is
(iii) What is varying in the function
1( )
2
x
f x
?
(iv) What is constant in the function
1( )
2
x
f x
?
2. For1
( )2
x
f x
:
What are the possible inputs i.e. values for x (the domain)?
Natural numbers Irrational numbers
Integers Real numbers
Rational numbers
3.
Set up a table of values and draw the graph of1
( )2
x
f x
on your whiteboard:
X 12
x ( )y f x
4 4
12
16
3
2
1
0
1
2
3
4

– 10 –
4. In relation to the graph of1
( ) :2
x
f x
(i) Is it a straight line?
(ii) Is ( )y f x increasing or decreasing as x increases?
(iii) From the table above, find the average rate of change over different intervals.
For example from 2 to 1 and 2 to 3.
What do you notice?
(iv) Describe how the curvature/rate of change is changing.
5. For 1
( ) :2
x
f x
(i) What are the possible outputs (range) for
1( ) .
2
x
f x
(ii) Is it possible to have negative outputs? Explain why?
(iii) What happens to the output as x decreases?
(iv) Is an output of 0 possible? Why do you think this is?
(v) What are the implications of this for the x-intercept of the graph?
(vi) What is the y-intercept of the graph of
1( )
2
x
f x
?

– 11 –
Section B – Activity 2: The Exponential Function, 1
( ) .3
x
g x
1. For 1
( )3
x
g x
:
(i) The base of
1( )
3
x
g x
is
(ii) The exponent of
1( )
3
x
g x
is
(iii) What is varying in the function
1( )
3
x
g x
?
(iv) What is constant in the function
1( )
3
x
g x
?
2. For1
( )3
x
g x
:
What are the possible inputs i.e. values for x (the domain)?
Natural numbers Irrational numbers
Integers Real numbers
Rational numbers
3.
Set up a table of values and draw the graph of 1
( )3
x
g x
below on your whiteboard:
X 13
x ( )y g x
4 4
13
81
3
2
1
0
1
2
3
4

– 12 –
4. In relation to the graph of 1
( ) :3
x
g x
(i) Is it a straight line?
(ii) Is y increasing or decreasing as x increases?
(iii) From the table above, find the average rate of change over different intervals.
For example from 2 to 1 and 2 to 3.
What do you notice?
(iv) Describe how the curvature/rate of change is changing.
5. For 1
( ) :3
x
g x
(i) What are the possible outputs (range) for
1( ) .
3
x
g x
(ii) Is it possible to have negative outputs? Explain why?
(iii) What happens to the output as x decreases?
(iv) Is an output of 0 possible? Why do you think this is?
(v) What are the implications of this for the x-intercept of the graph?
(vi) What is the y-intercept of the graph of
1( )
3
x
g x
?

– 13 –
Section B – Activity 3: Compare the graph of 1
( )2
x
f x
with the graph of1
( ) .3
x
g x
1. How are they the same and how do they differ?
2. Consider the relations 1
( , ) , , 2
x
x y x y y
and 1
( , ) , , 3
x
x y x y y
.
Are they functions? Explain.
3. What name do you think we give to this type of function and why do you think it is given this name?
Section B – Activity 4: Understand the characteristics of ( ) , 0 1.xf x a a
1. What is the domain of ( ) , 0 1?xf x a a
2. In relation to the graph of
( ) , 0 1.xf x a a
(i) Is it a straight line?
(ii) Is ( )y f x increasing or decreasing as x increases?
(iii) Does it have a maximum value?
(iv) Does it have a minimum value?
(iv) Describe how its curvature/rate of change is changing.
3. What is the range of ( ) , 0 1?xf x a a
4. What is the x–intercept of the graph ( ) , 0 1?xf x a a
5. What is the y–intercept of the graph ( ) , 0 1?xf x a a

– 14 –
Section C – Activity 1: Compare the graph of ( ) with the graph of ( ) .
x
x 1f x 2 f x
2
1. How are the graphs similar?
2. How are the graphs different?
3. Rewrite
1( ) in the form ( ) 2 .
2
x
kf x f x
4. What transformation maps the graph of
1( ) 2 onto the graph of ( ) ?
2
x
xf x f x
Section C – Activity 2: Compare the graph of ( ) with the graph of ( ) .
x
x 1g x 3 g x
3
1. How are the graphs similar?
2. How do the graphs differ?
3. Rewrite
1( ) in the form ( ) 3 .
3
x
kg x g x
4. What transformation maps the graph of
1( ) 3 onto the graph of ( ) ?
3
x
xg x g x
Note: For all the following, you should assume that the domain is .

– 15 –
Section C – Activity 3: Now I see...
1. If ( ) , , 1,xf x a a a then the properties of the exponential function are:
2. If ( ) , , 1,xf x a a a then the features of the exponential graph are:
3. If ( ) , , 0 1,xf x a a a then the properties of the exponential function are:
4. If ( ) , , 0 1,xf x a a a then the features of the exponential graph are:

– 16 –
Section C – Activity 4: Which of the following equations represent exponential functions?
Function Is it an exponential
Function? Yes/No
Reason
1( )
2
x
f x
2( )f x x
( ) ( 2)xf x
( ) 2(3)xf x
( ) 2xf x
1
2( ) 3( )f x x
( ) (0.9)xf x

– 17 –
Problem Solving Questions on Exponential Functions
Note: Extension Activities are required to strengthen students’ abilities in the following areas from the syllabus:
Level Syllabus Page
JCHL ( ) 2 and ( ) 3 , where , .x xf x a f x a a x Page 31
LCFL ( ) 2 and ( ) 3 , where , .x xf x a f x a a x Page 32
LCOL ( ) , where , , .xf x ab a b x Page 32
LCHL ( ) , where , , .xf x ab a b x Page 32
1. A cell divides itself into two every day. The number of cells C after D days is obtained from the function:
2DC
(a) Draw a graph of the function for 0 6.D
(b) Find the number of cells after 15 days.
2. The value of a mobile phone M (in cents) after T years can be obtained from the following function:
1,where is a constant.
2
T
M k k
(a) Draw a graph of the function for 0 6.T
(b) Find the value of k given that the value of the mobile phone after 3 years is €100.
(c) Find the value of the phone after 7 years.
3. The number of bacteria B in a sample after starting an experiment for m minutes is given by:
0.0450(3) mB
(a) Find the number of bacteria in the sample at the start of the experiment.
(b) Find the number of bacteria in the sample after starting the experiment for 3 hours.
4. The graph of ( ) xf x ka is shown:
(a) Find the value of k and a.
(b) Hence find the value of ( )f x
when 8.x

– 18 –
Q5. Olive finds that the number of bacteria in a sample doubles every 5 hours. Originally there are 8 bacteria in the sample. Complete the table below:
(a) Express b in terms of h.
(b) Find the number of bacteria in the sample after 13 hours.
(c) How many hours later will the number of bacteria be more than 100.
Q6. When a microwave oven is turned on for x minutes the relationship between the temperature
C inside the oven is given by ( ) 500 480(0.9)xC x where 0x .
(a) Find the value of (0).C
(b) Explain the meaning of (0).C
(c) Can the temperature inside the microwave oven reach 550C ?
Answers
Q1 (b) 32,768 cells, Q2 (b) €800 (c) €6.25, Q3 (a) 50 (b) 136,220 bacteria, Q4 (a) 2, 3k a (b) 13,122, Q5 (b) 58(2)
h
b (c) 48 bacteria
(d) 18.22 hrs., Q6 (a) 20o C (c) No
Number of hours (hrs.)
Number of bacteria (b)
0 8
5
10
15

– 19 –
?
pH
Absorption of drugs in
the body
Sound levels
Comparing earthquake
sizes
Simplifying graphical analysis
Astronomical calculations
Google Ranking of
pages
Compound interest
WS07.03 Looking at Exponential Functions in Another Way
– 20 –
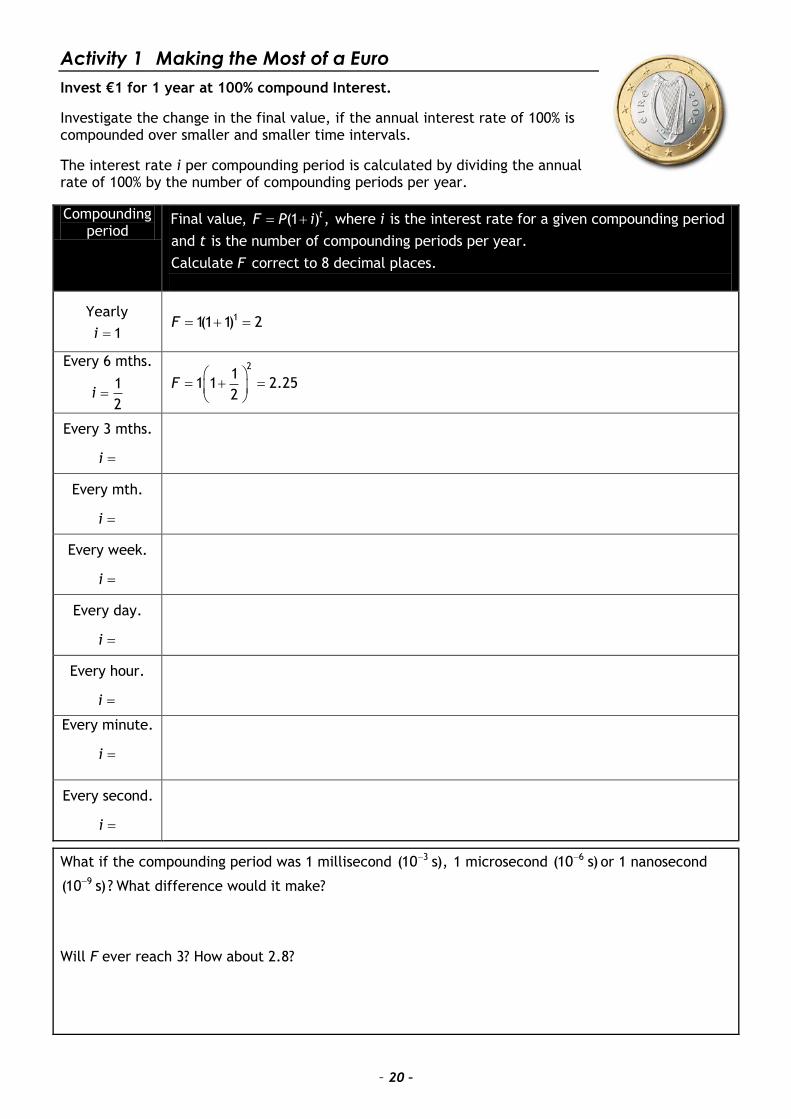
Activity 1 Making the Most of a Euro
Invest €1 for 1 year at 100% compound Interest.
Investigate the change in the final value, if the annual interest rate of 100% is compounded over smaller and smaller time intervals.
The interest rate i per compounding period is calculated by dividing the annual rate of 100% by the number of compounding periods per year.
Compounding period
Final value, (1 ) , where is the interest rate for a given compounding period
and is the number of compounding periods per year.
Calculate correct to 8 decimal places.
tF P i i
t
F
Yearly
1i 11(1 1) 2F
Every 6 mths.
1
2i
21
1 1 2.252
F
Every 3 mths.
i
Every mth.
i
Every week.
i
Every day.
i
Every hour.
i
Every minute.
i
Every second.
i
What if the compounding period was 1 millisecond 3(10 s), 1 microsecond 6(10 s) or 1 nanosecond
9(10 s)? What difference would it make?
Will F ever reach 3? How about 2.8?

– 21 –
Activity 2 Further Exploration of Exponential Functions
1. How long will it take for a sum of money to double if invested at 20% compound interest rate
compounded annually?
2. 500 mg of a medicine enters a patient’s blood stream at noon and decays exponentially at a rate of 15% per hour. (i) Write an equation to express the amount remaining in the patient’s blood stream at after t hours. (ii) Find the time when only 25 mg of the original amount of medicine remains active.
3. x 2x y
0 02 1
1 12 2
2 22 4
3 32 8
4 42 16
5 52 32
6 62 64
7 72 128
8 82 256
9 92 512
10 102 1024
11 112 2048
12 122 4096
(a) Describe the type of sequence formed by the numbers in the first column. (b) Describe the type of sequence formed by the numbers in the second and third columns. (c) Using the table, and your knowledge of indices, carry out the following operations of multiplication and division in the second sequence, linking the answer to numbers in the first sequence.
(i) 32 128
(ii) 4096 512
(iii) 48
x 2x y x 2x y
13 213 8,192 23 223 838,8608
14 214 16,384 24 224 16,777,216
15 215 32,768 25 225 33,554,432
16 216 65,536 26 226 67,108,864
17 217 13,1072 27 227 134,217,728
18 218 262,144 28 228 268,435,456
19 219 524,288 29 229 536,870,912
20 220 1,048,576 30 230 1,073,741,824
21 221 2,097,152 31 231 2,147,483,648
22 222 419,4304 32 232 4,294,967,296

– 22 –
Using Different Bases
x 3x
x 4x x 5x
x 6x
x 10x
0 1
0 1
0 1
0 1
0 1
1 3
1 4
1 5
1 6
1 10
2 9
2 16
2 25
2 36
2 100
3 27
3 64
3 125
3 216
3 1,000
4 81
4 256
4 625
4 1,296
4 10,000
5 243
5 1,024
5 3,125
5 7,776
5 100,000
6 729
6 4,096
6 15,625
6 46,656
6 1,000,000
7 2,187
7 16,384
7 78,125
7 279,936
7 10,000,000
8 6,561
8 65,536
8 390,625
8 1,679,616
8 100,000,000
9 19,683
9 262,144
9 1,953,125
9 10,077,696
9 1,000,000,000
10 59,049
10 1,048,576
10 9,765,625
10 60,466,176
10 10,000,000,000
x 3
log (3 )x
x 4
log (4 )x
x 5
log (5 )x
x 6
log (6 )x
x 10
log (10 )x
1 0
1 0
1 0
1 0
1 0
3 1
4 1
5 1
6 1
10 1
9 2
16 2
25 2
36 2
100 2
27 3
64 3
125 3
216 3
1,000 3
81 4
256 4
625 4
1,296 4
10,000 4
243 5
1,024 5
3,125 5
7,776 5
100,000 5
729 6
4,096 6
15,625 6
46,656 6
1,000,000 6
2,187 7
16,384 7
78,125 7
279,936 7
10,000,000 7
6,561 8
65,536 8
390,625 8
1,679,616 8
100,000,000 8
19,683 9
262,144 9
1,953,125 9
10,077,696 9
1,000,000,000 9
59,049 10
1,048,576 10
9,765,625 10
60,466,176 10
10,000,000,000 10
Formula and Tables Page 21
Séana agus logartaim Indices and logarithms
p q p qa a a log log log a a axy x y log x
aa y y x
pp q
q
aa
a log log log
a a a
xx y
y
log
log ( )
loglog
log
a
x
a
x
ab
a
a x
a x
xx
b
q
p pqa a log logq
a ax q x
0 1a log 1 0a
1 p
pa
a
1log log
a a x
x
1
qqa a
ppq qpqa a a
p p pab a b
p p
p
a a
b b