ws 2014-15 kunibert raffer folien zur vorlesung: grundlagen der entwicklungsökonomie © k. raffer...
TRANSCRIPT

WS 2014-15
Kunibert Raffer
Folien zur Vorlesung:
Grundlagen der Entwicklungsökonomie
© K. Raffer 2014
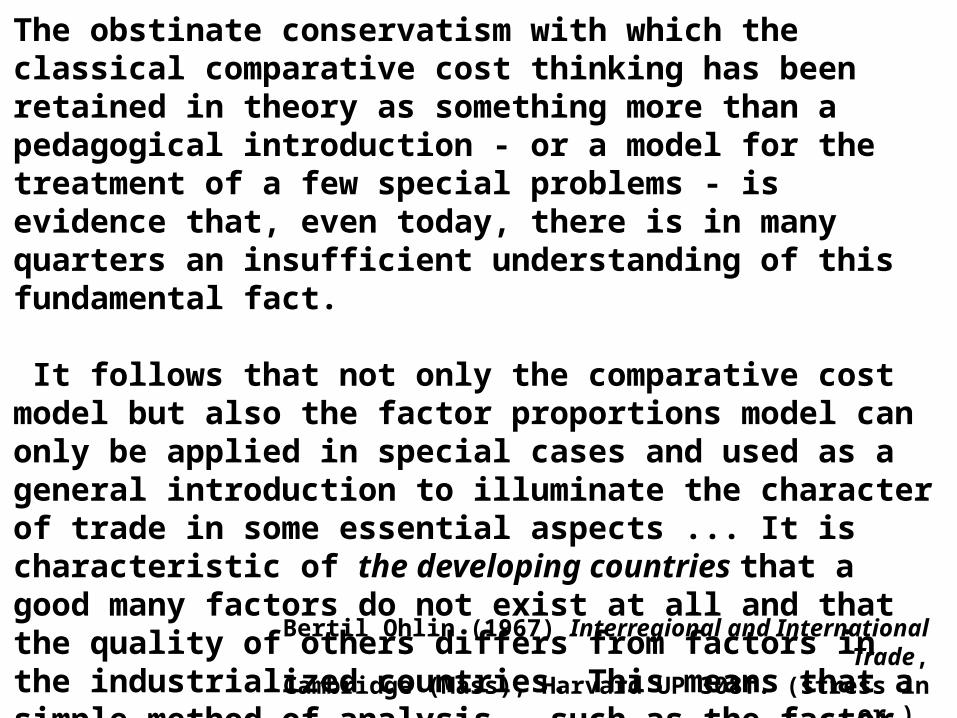
The obstinate conservatism with which the classical comparative cost thinking has been retai ned in theory as something more than a pedagogical introduction - or a model for the treatment of a few special problems - is evidence that, even today, there is in many quarters an insuffi cient understanding of this fundamental fact.
It follows that not only the comparative cost model but also the factor proportions model can only be applied in special cases and used as a general introduction to illuminate the character of trade in some essential aspects ... It is characteristic of the developing countries that a good many factors do not exist at all and that the quality of others differs from factors in the industrialized countries. This means that a simple method of analysis - such as the factor proportions model - which does not take this into account is to some extent unrealistic.
Bertil Ohlin (1967) Interregional and International Trade, Cambridge (Mass), Harvard UP 308f. (stress in or.)

Table 1.a: Graham's Case (Viner's presentation) Basic Assumptions: Countries A and B both have 400 Units of (nationally standardised, or homogeneous) Labour (LU); the international price ( net barter terms of trade) remains at 4C = 3.5W (Pintl = 0.875) 1) Constant Returns (Ricardian-Torrens) Case: A Bproduction per LU ( productivity) C 4 4
W 4 3
Pb = 0.75 (4C = 3W) Pintl = 0.875 Pa = 1
Production Changes (LUs used to produce C and W respectively)
Specialisation I Specialisation II Total SpecialisationCountry A B (A+B) A B Differ*) A B Diff.*)
C 800 800 1600 400 1200 0 0 1600 0(LU) (200) (200) (100) (300) (400) W 800 600 1400 1200 300 +100 1600 0 +200(LU) (200) (200) (300) (100) (400)
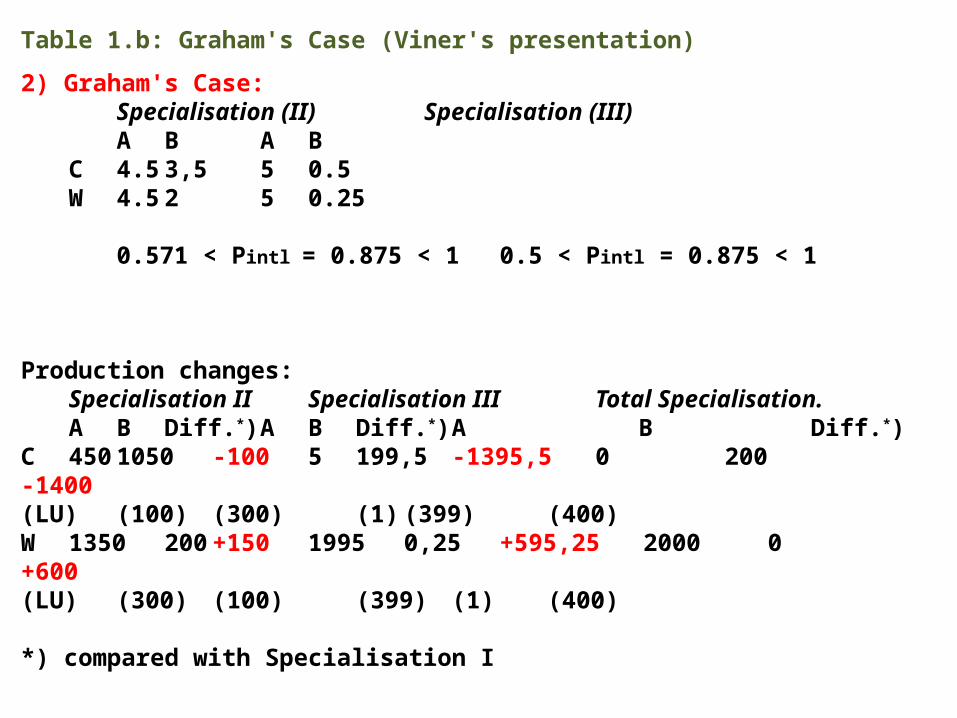
Table 1.b: Graham's Case (Viner's presentation)
2) Graham's Case:Specialisation (II) Specialisation (III)A B A B
C 4.5 3,5 5 0.5W 4.5 2 5 0.25
0.571 < Pintl = 0.875 < 1 0.5 < Pintl = 0.875 < 1
Production changes: Specialisation II Specialisation III Total Specialisation.
A B Diff.*) A B Diff.*) A B Diff.*)C 450 1050 -100 5 199,5 -1395,5 0 200 -1400(LU) (100) (300) (1) (399) (400)W 1350 200 +150 1995 0,25 +595,25 2000 0 +600(LU) (300) (100) (399) (1) (400) *) compared with Specialisation I
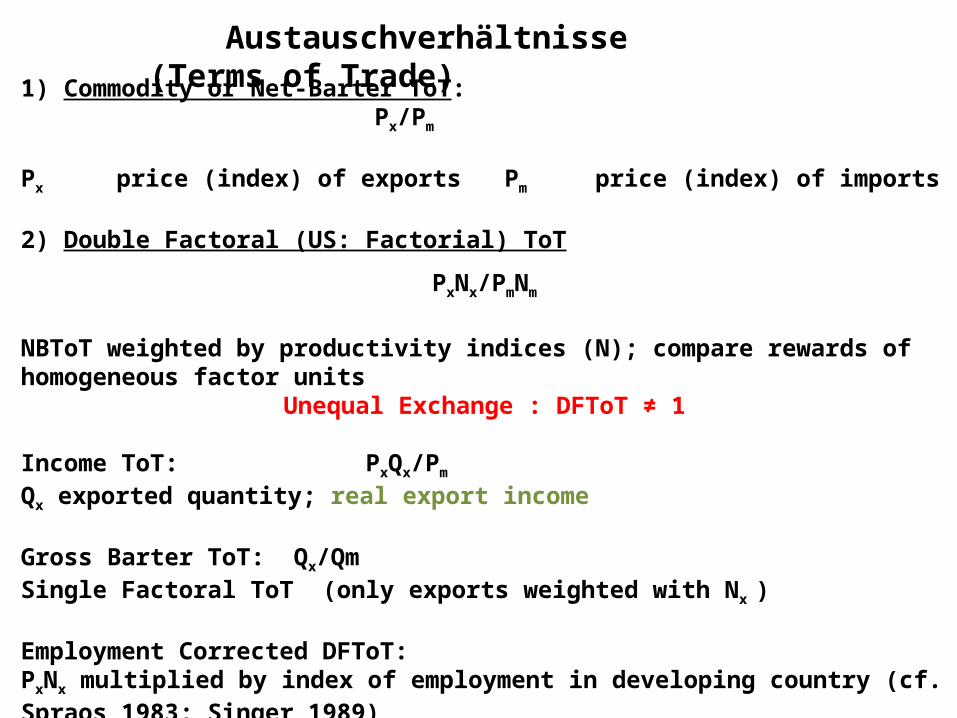
Austauschverhältnisse (Terms of Trade)
1) Commodity or Net-Barter ToT: Px/Pm
Px price (index) of exports Pm price (index) of imports 2) Double Factoral (US: Factorial) ToT
PxNx/PmNm
NBToT weighted by productivity indices (N); compare rewards of homogeneous factor units
Unequal Exchange : DFToT ≠ 1 Income ToT: PxQx/Pm Qx exported quantity; real export income Gross Barter ToT: Qx/Qm Single Factoral ToT (only exports weighted with Nx ) Employment Corrected DFToT:PxNx multiplied by index of employment in developing country (cf. Spraos 1983; Singer 1989)

Factors contributing to falling NBToTs (sometimes wrongly called different "versions" of the PST)
- low income elasticity of commodity exports; initially hotly attacked, meanwhile generally accepted (e.g, IMF, 1987; IBRD 1987) Expanding of raw material exports ▬► excess supply- low elasticities of demand of periphery exports - necessary imports to promote development only produced by Centre – PCs’ income elasticity of imports high. Developmental needs ▬► excess demand
-cultural dependence or wasting resources for luxury consumption
-oversupply of labour in PCs keeping wages down-(absence of) market power of factors of production: workers (trade unions) and entrepreneurs in the North have sufficient market power to keep Northern prices from falling along with technical progress; lack of such power in PCs forces their prices down
- protection by the Centre restricts export outlets ▬► additional force to the deteriorating trend; Centre’s protectionism increases market disequilibria created by the disparity of export possibilities and import needs of SCs
- Singer (1991) added debt pressure
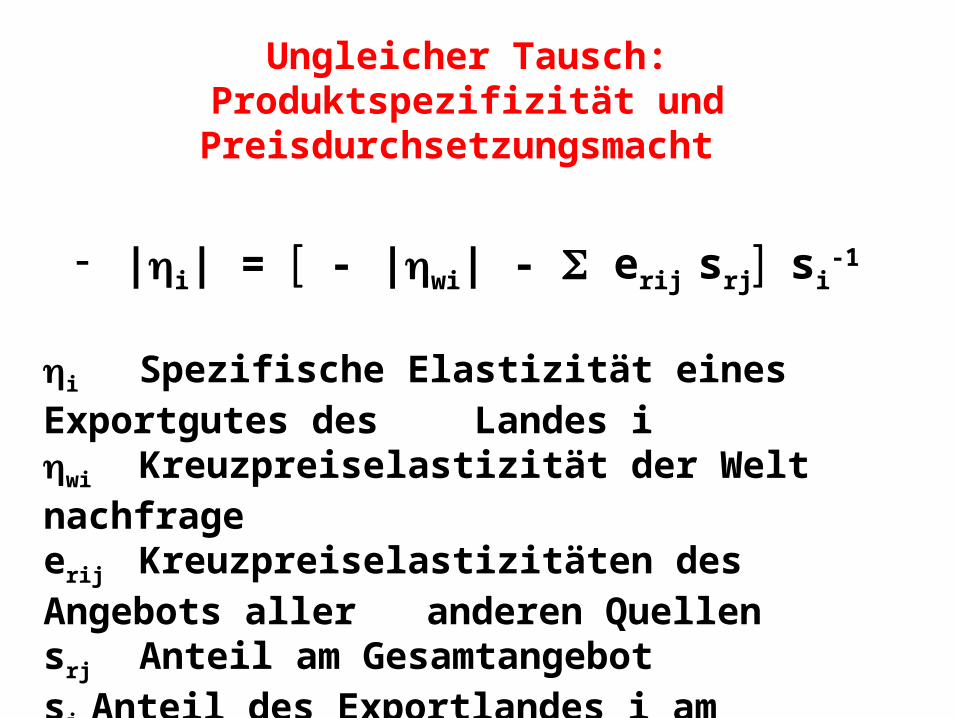
Ungleicher Tausch: Produktspezifizität und Preisdurchsetzungsmacht
- |i| = - |wi| - erij srj si-1
i Spezifische Elastizität eines Exportgutes des Landes i
wi Kreuzpreiselastizität der Welt nachfrage erij Kreuzpreiselastizitäten des Angebots aller
anderen Quellensrj Anteil am Gesamtangebotsi Anteil des Exportlandes i am Weltexport
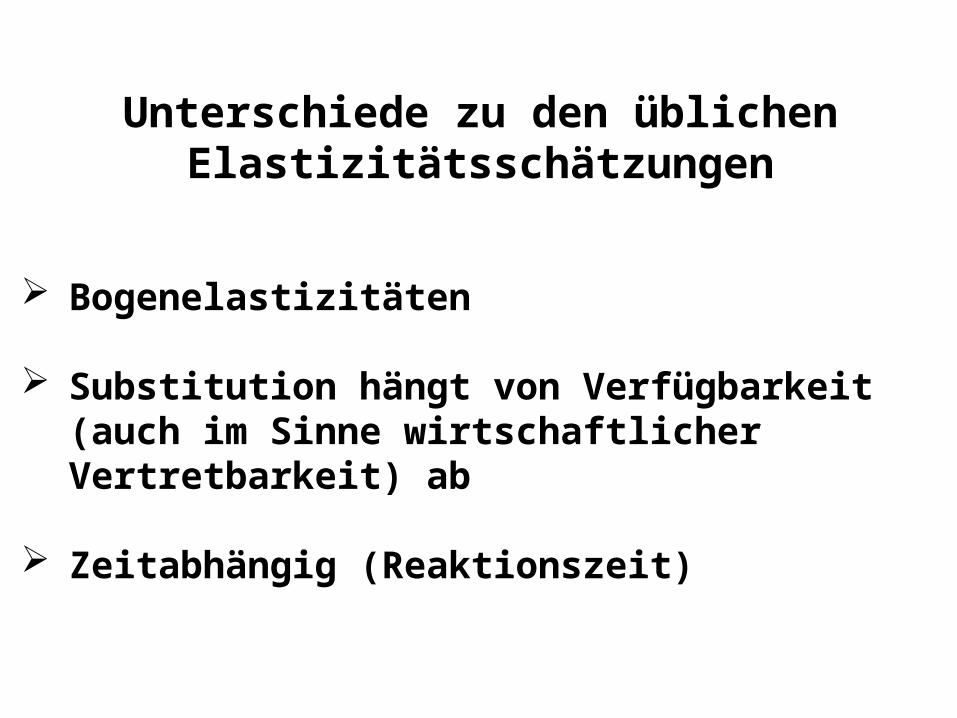
Unterschiede zu den üblichen Elastizitätsschätzungen
Bogenelastizitäten
Substitution hängt von Verfügbarkeit (auch im Sinne wirtschaftlicher Vertretbarkeit) ab
Zeitabhängig (Reaktionszeit)

Definition Official Development Assistance (ODA): "those flows to developing countries and multilateral institutions provided by official agencies, including state and local governments, or by their exe cutive agencies, each tran saction of which meets the following tests:a) it is administered with the promotion of the economic development and welfare of de veloping countries as its main objective, andb) it is concessional in character and contains a grant element of at least 25 per cent."
DAC (Development Assistance Committee) der OECD
Zuschußelement (grant element): Unterschied OEH-Kredit und Kredit mit 10% Zinsen (gemessen in Kapitalwerten)Beispiele, gerade >25% (OECD 1985, p.172): - 4 %, 7 Jahre Laufzeit, 3 Jahre tilgungsfrei - 5 %, 11 Jahre Laufzeit, 4 Jahre tilgungsfrei - 5 %, 15 Jahre Laufzeit, keine tilgungsfreie Zeit

DAC -ODA 1950-2013 (%)
Source: DAC
1950-55 1960 1965 1970 1975 1980 1985 1990 1995 2000 2005 2010 2013
0
0.1
0.2
0.3
0.4
0.5
0.6
Chart Title
Series1

ODA by DAC MembersBroadened and Deflated Totals
(% of GSP)
1989 1990 1991 1992 1993 1994DAC-value 0.32 0.33 0.33 0.33*) 0.31 0.30minusadmin. costs 0.307 0.318 0.317 0.317 0.296 0.286refugees 0.306 0.315 0.311 0.307 0.284 0.274emerg.& dis.relief 0.302 0.311 0.303 0.303 0.278 0.269emergency food aid 0.302 0.310 0.301 0.298 0.274 0.265debt forgiveness 0.297 0.284 0.266 0.282 0.259 0.247capital subscr. 0.271 0.255 0.251 0.245 0.233 0.222contrib. to NGOs 0.264 0.249 0.245 0.240 0.228 0.217students (imputed) 0.260 0.245 0.242 0.236 0.224 0.213former Commun. C. 0.260 0.245 0.239 0.235 0.221 0.211
ODA-Inflator 1.231 1.347 1.381 1.404 1.403 1.424Sources: Raffer (1998), based on OECD-data
(various publications)

ODA by DAC MembersBroadened and Deflated Totals
(% of GSP)
1989 1990 1991 1992 1993 1994Official DAC-value 0.32 0.33 0.33 0.33 0.31 0.30Deflated ODA 0.260 0.245 0.239 0.235 0.221 0.211ODA-Inflator 1.231 1.347 1.381 1.404 1.403 1.424
Source: Raffer 1998a
Table 6.2: Corrected ODA and OA by DAC Members(% of GSP)
1990 1991 1992 1993 1994Deflated ODA 0.25 0.24 0.24 0.22 0.21OA 0.01 0.04 0.04 0.04 0.04Total 0.26 0.28 0.28 0.26 0.25
Quelle: Raffer & Singer 2001/2004, p.89


Country Programmable Aid (CPA)
“is the portion of aid donors programme for individual countries, and over which partner countries could have a significant say. Developed in 2007 in close collaboration with OECD DAC members, CPA is much closer to capturing the flows of aid that go to the partner countries than the concept of Official Development Assistance (ODA).” Source: OECD
CPA:
“(1) inherently unpredictable (such as humanitarian aid and debt relief); or (2) entails no flows to the recipient country (administration, student costs, development awareness and research and refugee spending in donor countries); or (3) is usually not discussed between the main donor agency and recipient governments (food aid, aid from local governments, core funding to international NGOs, aid through secondary agencies, ODA equity investments and aid which is not allocable by country). Finally, (4), CPA does not net out loan repayments, as these are not usually factored into aid allocation decisions.”

ODA Composition 2011
Source: OECD 2013

The Millennium Development Goals Eight Goals for 2015
1. Eradicate extreme poverty and hunger2. Achieve universal primary education 3. Promote gender equality and empower women 4. Reduce child mortality 5. Improve maternal health 6. Combat HIV/AIDS, malaria and other diseases 7. Ensure environmental sustainability 8. Develop a global partnership for development
Goal 1. Eradicate extreme poverty and hunger
Target 1: Reduce by half the proportion of people living on less than a dollar a day
Indicators:1. Proportion of population below $1 (PPP) per day 2. Poverty gap ratio, $1 per day3. Share of poorest quintile in national income or consumption
Target 2: Reduce by half the proportion of people who suffer from hunger
Indicators:4. Prevalence of underweight children under five years of age5. Proportion of the population below minimum level of dietary energy consumption
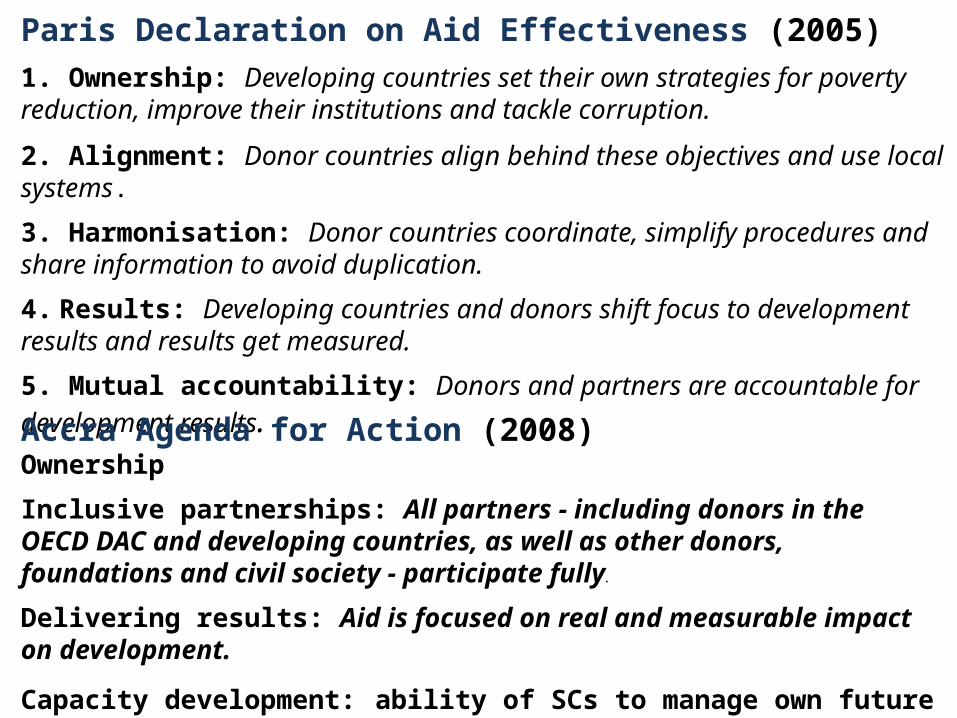
Paris Declaration on Aid Effectiveness (2005)
1. Ownership: Developing countries set their own strategies for poverty reduction, improve their institutions and tackle corruption.
2. Alignment: Donor countries align behind these objectives and use local systems.
3. Harmonisation: Donor countries coordinate, simplify procedures and share information to avoid duplication.
4. Results: Developing countries and donors shift focus to development results and results get measured.
5. Mutual accountability: Donors and partners are accountable for development
results.Accra Agenda for Action (2008)Ownership
Inclusive partnerships: All partners - including donors in the OECD DAC and developing countries, as well as other donors, foundations and civil society - participate fully.
Delivering results: Aid is focused on real and measurable impact on development.
Capacity development: ability of SCs to manage own future - also lies at the heart of AAA
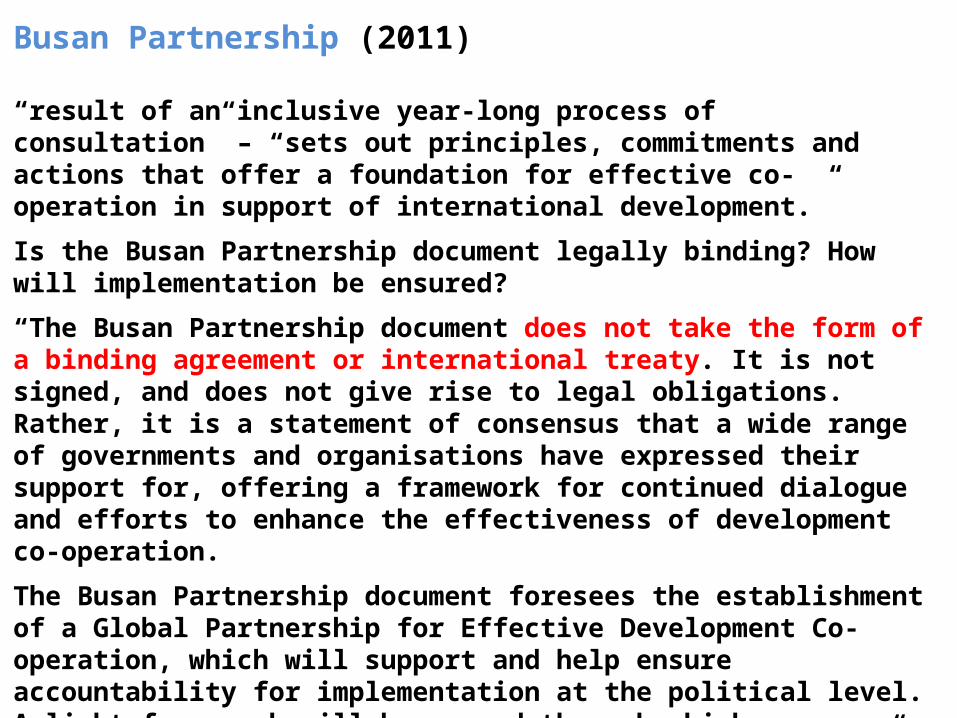
Busan Partnership (2011) “result of an inclusive year-long process of consultation” – “sets out principles, commitments and actions that offer a foundation for effective co-operation in support of international development.”
Is the Busan Partnership document legally binding? How will implementation be ensured?
“The Busan Partnership document does not take the form of a binding agreement or international treaty. It is not signed, and does not give rise to legal obligations. Rather, it is a statement of consensus that a wide range of governments and organisations have expressed their support for, offering a framework for continued dialogue and efforts to enhance the effectiveness of development co-operation.
The Busan Partnership document foresees the establishment of a Global Partnership for Effective Development Co-operation, which will support and help ensure accountability for implementation at the political level. A light framework will be agreed through which progress will be monitored and mutual accountability supported.”

0
5
10
15
20
25
30
35
40
45
%
Year
Graph1: GPG1 and GPG2 as Shares of CRS Totals
GPG1
GPG2
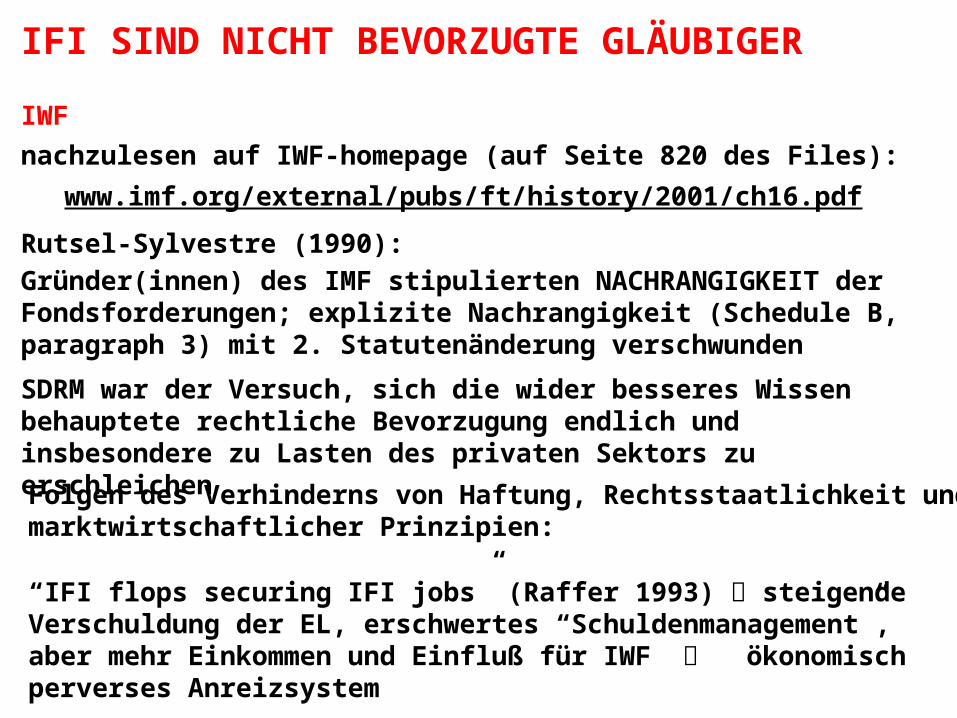
IFI SIND NICHT BEVORZUGTE GLÄUBIGER
IWF
nachzulesen auf IWF-homepage (auf Seite 820 des Files):
www.imf.org/external/pubs/ft/history/2001/ch16.pdf
Rutsel-Sylvestre (1990):
Gründer(innen) des IMF stipulierten NACHRANGIGKEIT der Fondsforderungen; explizite Nachrangigkeit (Schedule B, paragraph 3) mit 2. Statutenänderung verschwunden
SDRM war der Versuch, sich die wider besseres Wissen behauptete rechtliche Bevorzugung endlich und insbesondere zu Lasten des privaten Sektors zu erschleichen
Folgen des Verhinderns von Haftung, Rechtsstaatlichkeit und marktwirtschaftlicher Prinzipien:
“IFI flops securing IFI jobs” (Raffer 1993) steigende Verschuldung der EL, erschwertes “Schuldenmanagement”, aber mehr Einkommen und Einfluß für IWF ökonomisch perverses Anreizsystem