wrrc webinar march 3, 2020 · 2001 2005 2009 2013 2017 2021 2025 2029 2033 2037 2041 2045 2049 2053...
TRANSCRIPT

March 3, 2020The Next 40 Years:
Central Arizona Project Long-Range
WRRC WEBINAR

|
History of Central Arizona Project
2

|
CAP: The Past 40 YearsPatrick Dent, Director of Water Policy

|
1968 & 1980

|
-
250,000
500,000
750,000
1980s1980s Deliveries: 1.6 MAF
Other Excess
Ag Subcontracts
M&I Subcontracts
Federal Contracts

|
-
250,000
500,000
750,000
1,000,000
1,250,000
1,500,000
1990s1990s Deliveries: 8.8 MAF
Full Arizona allocation used
New Waddell Dam & Lake Pleasant
Avra Valley Recharge Project
Other Excess
Ag Subcontracts
M&I Subcontracts
Federal Contracts
Other Excess
Ag Pool
Ag Subcontracts
M&I Subcontracts
Federal Contracts

|
-
250,000
500,000
750,000
1,000,000
1,250,000
1,500,000
Other Excess
Ag Pool
Ag Subcontracts
M&I Subcontracts
Federal Contracts
2000s2000s Deliveries: 15.3 MAF
Agua Fria Recharge Project
CAP Long-Term ContractsTotal = 1.415 MAF
Indian Contracts
46%
Non-Indian Subcontracts
54%
|
-
250,000
500,000
750,000
1,000,000
1,250,000
1,500,000
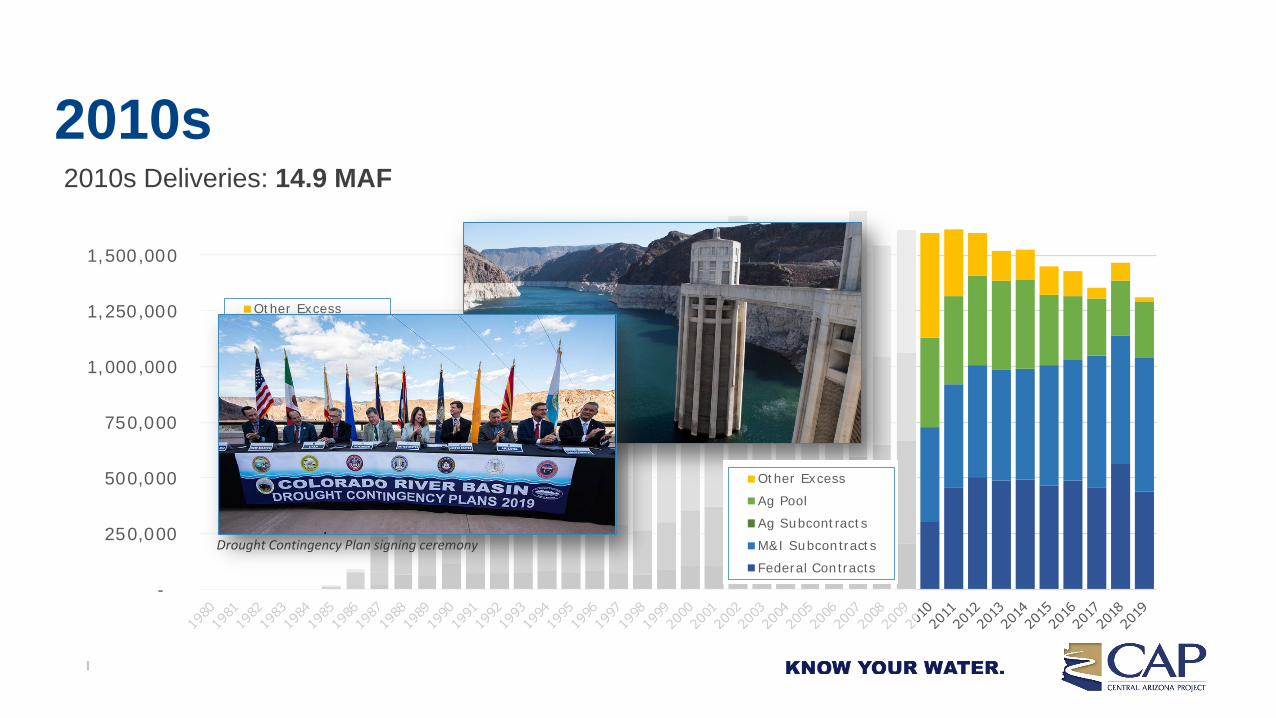
2010s
Other Excess
Ag Pool
Ag Subcontracts
M&I Subcontracts
Federal Contracts
2010s Deliveries: 14.9 MAF
Drought Contingency Plan signing ceremony
Other Excess
Ag Pool
Ag Subcontracts
M&I Subcontracts
Federal Contracts

|
-
250,000
500,000
750,000
1,000,000
1,250,000
1,500,000
1980—2019 Total Deliveries: 40.6 MAF
Other Excess
Ag Pool
Ag Subcontracts
M&I Subcontracts
Federal Contracts

|
Supply & Demand in the CAP Service Territory
10

Supply & Demand Projections in the CAP Service Area
AUSTIN CAREY, PLANNING ANALYST
|12
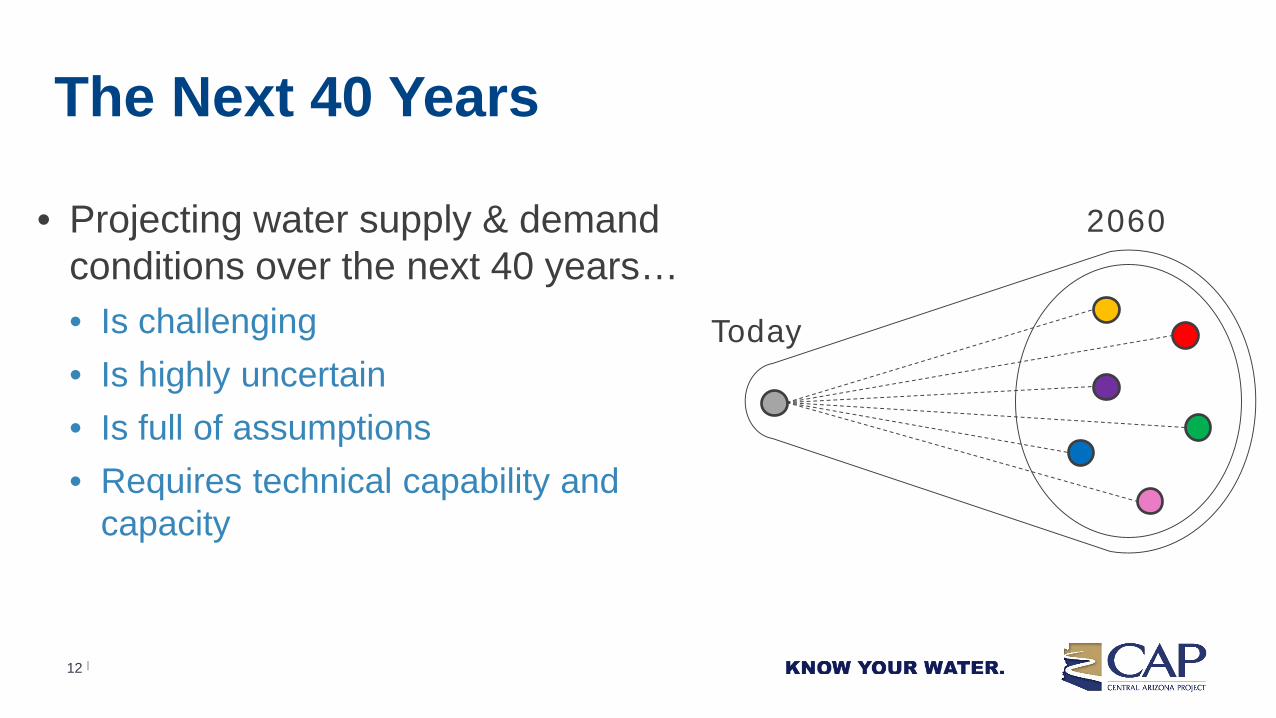
• Projecting water supply & demand conditions over the next 40 years…• Is challenging• Is highly uncertain• Is full of assumptions• Requires technical capability and
capacity
The Next 40 Years
Today
2060
|13
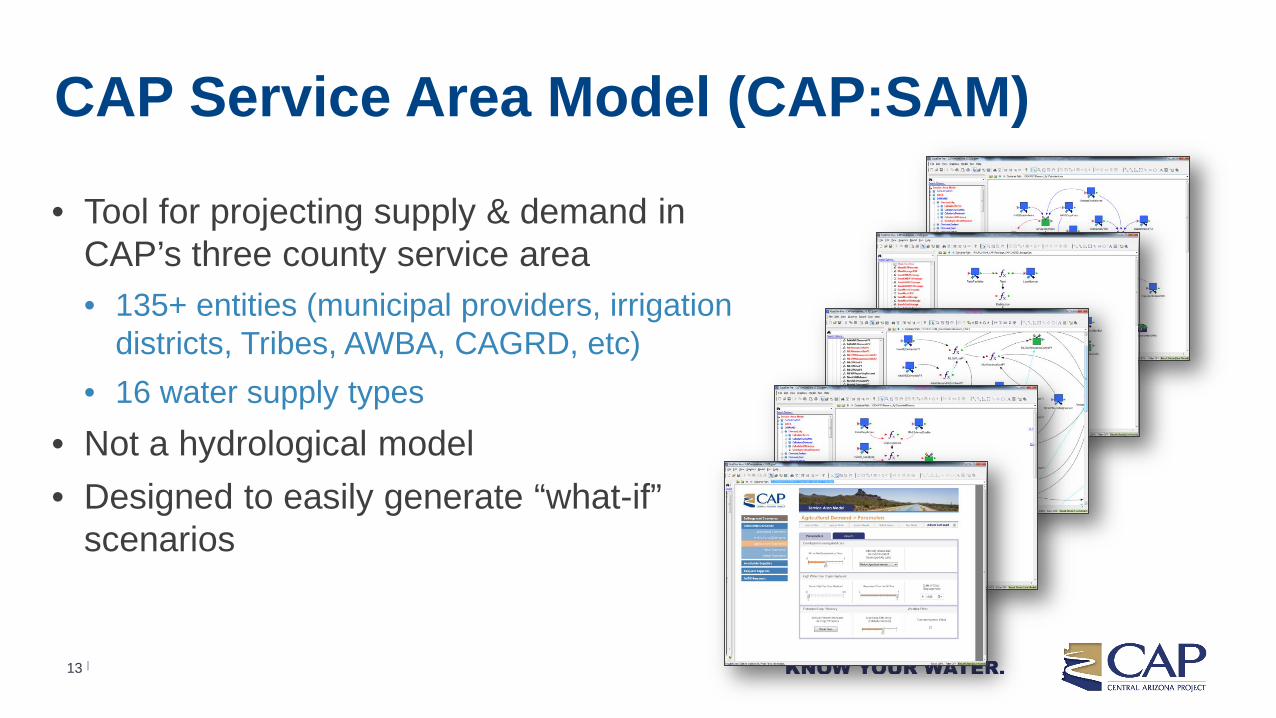
• Tool for projecting supply & demand in CAP’s three county service area• 135+ entities (municipal providers, irrigation
districts, Tribes, AWBA, CAGRD, etc)• 16 water supply types
• Not a hydrological model• Designed to easily generate “what-if”
scenarios
CAP Service Area Model (CAP:SAM)

|14
Basin Studies• Goal: Evaluate future water supply
& demand imbalances in key basins through the year 2060
• Three studies in Arizona:• West Salt River Valley – 2014• Eloy and Maricopa-Stanfield – 2018• Lower Santa Cruz – 2015
• Sector demand varies amongst study areas
Source: ADWR’s AMA Historic Templates and Summaries
Study Tasks
|15
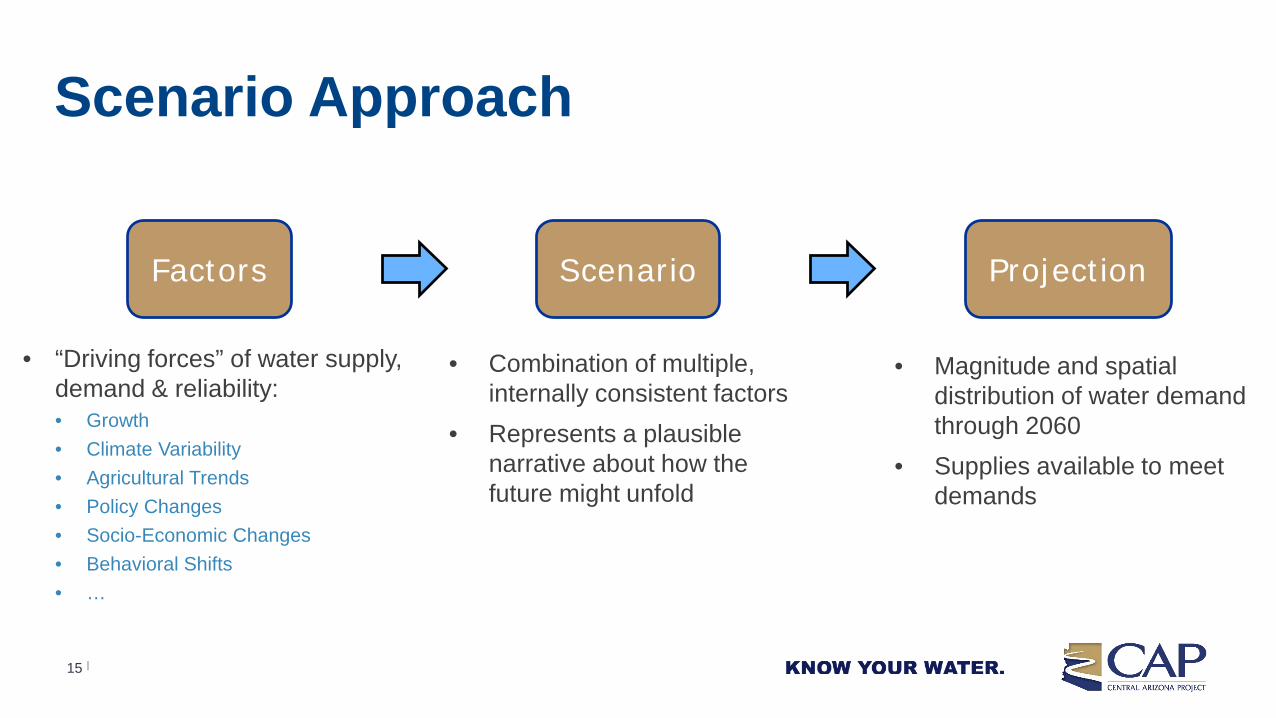
Scenario Approach
Factors Scenario Projection
• “Driving forces” of water supply, demand & reliability:• Growth• Climate Variability• Agricultural Trends• Policy Changes• Socio-Economic Changes• Behavioral Shifts• …
• Combination of multiple, internally consistent factors
• Represents a plausible narrative about how the future might unfold
• Magnitude and spatial distribution of water demand through 2060
• Supplies available to meet demands

|16
• Part of the supply and demand subcommittee process
• Involves collaborative exercises amongst stakeholders
• Results in selection of a handful of unique and plausible scenarios to model
Building Scenarios
|
Eloy and Maricopa-Stanfield Basin Study
SUPPLY AND DEMAND | 07.16.19
25
Pumping• Fully replaces• Partially replaces• Limited to current/planned
Irrigation Efficiency• Rapid • Steady (i.e. current)• Slow
Growth Pattern• Spillover• Official• Dense urbanization• Local growth
Conservation• Rapid • Steady (i.e. current)• Slow
Growth Rate• High • Official • Low
Climate• Hotter and drier• Hot and dry• Historic
Development • Preference for on Ag • No preference• Preserve Ag (bare desert)
Scenario A: Highest Demand

|17
Scenario Examples
Dem
and
Scenario A
Scenario B

|18
GrowthRate:
Water Providers
Spatial Distribution:Official Growth Pattern

|19
Effect of Growth
Eloy
Casa Grande
AZWC PVS
Florence
Housing Unit Projection:Max Redevelopment
2
2
3
3
4
4
5
Hou
sing
Uni
ts
0
20000
40000
60000
80000
2001
2005
2009
2013
2017
2021
2025
2029
2033
2037
2041
2045
2049
2053
2057
Annual Housing Units (3-County)
ProjectedHistoric
Total Housing Units = 133,279
GlobalWater
Picacho WC
Johnson Util.Pinal
Eloy
Casa Grande
AZWC PVS
Florence
Housing Unit Projection:Suburban Growth
0
20000
40000
60000
80000
2001
2005
2009
2013
2017
2021
2025
2029
2033
2037
2041
2045
2049
2053
2057
Annual Housing Units (3-County)
ProjectedHistoric
Total Housing Units = 362,305
GlobalWater
Picacho WC
Johnson Util.Pinal
Housing Units
0
20,000
40,000
60,000
80,000
100,000
120,000
140,000
Vol
ume
[AF]
0
20,000
40,000
60,000
80,000
100,000
120,000
140,000
2018
2021
2024
2027
2030
2033
2036
2039
2042
2045
2048
2051
2054
2057
2060
Vol
ume
[AF]
Municipal Demand
Rate: RapidPattern: Outward
Rate: Slow Pattern: Infill
DRAFT

|20
• Per capita water use• Increase in crop consumptive
use• Shortages to water supply
• Frequency
• Duration
• Severity
Climate
-
250,000
500,000
750,000
1,000,000
2018
2022
2026
2030
2034
2038
2042
2046
2050
2054
2058
AF
Colorado River Shortages
30%
40%
50%
60%
70%
80%
90%
100%
2018
2022
2026
2030
2034
2038
2042
2046
2050
2054
2058
Surface Water Availability
DRAFT

|21
Effect of Climate – Water ProviderDRAFT

|22
Effect of Climate – Irrigation Districts
10,000
15,000
20,000
25,000
30,000
35,000
40,000
45,000
50,000
55,000
60,000
0
50,000
100,000
150,000
200,000
250,000
300,000
Acre
s
Volu
me
(AF)
In-Lieu GW AgPool Acres
No IrrigationIrrigation Intensity
Low
High
Example Irrigation District
DRAFT

|23
• Per capita use has been on the decline but growth rate drives municipal sector demand
• The location of growth is critical for:• Community characteristics• Types of water supplies• Regulatory requirements
• Agriculture demand is influenced by pumping capacity and surface water availability
• Industrial demand is site-specific
-
20,000
40,000
60,000
80,000
100,000
120,000
140,000
Dem
and
Scenario A Scenario B
Growth Rate
Conservation
-
20,000
40,000
60,000
80,000
100,000
120,000
140,000
Dem
and
Medium Provider, Rapid Growth,Some Renewable Supplies, Member Land Provider
CAP
Large Provider, Modest Growth,Renewable Supply PortfolioCAP
Effluent
Small Provider, Rapid Growth,No Renewable Supplies
Effluent
500,000
550,000
600,000
650,000
700,000
750,000
800,000
850,000
2018
2020
2022
2024
2026
2028
2030
2032
2034
2036
2038
2040
2042
2044
2046
2048
2050
2052
2054
2056
2058
2060
Ag
Dem
and
[AF]
Demand
Fulfilled Demand
TakeawaysDRAFT

|
Recovery planning
24

Recovery of Banked WaterPlanning and Implementation
ANGIE LOHSE

|26
• Water banking and recovery is one of Arizona’s strategies for mitigating future shortages on the Colorado River• Storing (banking) water underground• Recharge earns credits tracked by ADWR• More than 12 MAF of water stored
• During shortages, the stored water is pumped (recovered) from wells to supplement (firm) deliveries of Colorado River water
Water Banking and Recovery

|27
• The State established the AWBA in 1996• ABWA has accrued 4.28 MAF
• 3.68 MAF for Arizona uses• .61 MAF for Nevada
• AWBA stores for a variety of purposes• To firm CAP M&I Priority Pool• To firm P4 M&I On-River users• To firm a specific portion of the CAP water
held by tribes• To meet interstate obligations for Nevada
Arizona Water Banking Authority
|28
• Over time there have been a number of separate recovery planning efforts by AWBA, ADWR and CAWCD
• In 2014, a Joint Recovery Plan was developed
• Describes the basic framework, methods timing, volume and potential partnering opportunities
• Recovery Planning Advisory Group was convened by ADWR, AWBA and CAP to further refine recovery implementation
Recovery Planning

|29
Likelihood, Timing and Magnitude

|30
• CAP and Reclamation staff developed a legal framework outlining how non-project water will move through the system
• “Firming Water” is available to satisfy reductions to contract orders due to shortage
• Sources of firming water are identified• Direct recovery into the canal• Exchanges
CAP System Use Agreement
|31
How Recovery will be Implemented• Direct Recovery
• Pump water through wells, treat and introduce directly into the CAP system
• Development of Exchange Agreements and partnerships with cities, irrigation districts and Indian communities• CAP staff have developed exchange partnership agreements
• Exchange partnerships are mutually beneficial• Lower recovery cost• Increased flexibility• May not require new infrastructure

|32
Example of Recovery/Exchange• An M&I subcontractor agrees to exchange 3,000 AF of their CAP
water that would have gone to their water treatment plant for 3,000 AF of recovered LTSCs
• This recovered water could either be pumped from the subcontractor’s wells or a third party that has infrastructure nearby
• The CAP water that would have gone to the M&I subcontractor can be redirected to those who do not have recovery wells or partnerships

|33
• 2009 – Direct Recovery Plan• 2015 – Recovery Plan Update• 2016 – Exploratory Well Drilling• 2017 – Test Well• 2018/19 – Alternative Recovery
Locations• 2019 – Geophysical Studies
Technical Studies – Tonopah Desert Recharge Project

|34
Key Take-away• Arizona has mitigation strategies for Colorado River shortages• On-going recovering planning and implementation will ensure
Arizona is prepared for these shortages

|
CAGRD supplies & mid-plan review
35

Central Arizona Groundwater Replenishment District
Planning and Water Supply Acquisition
CHRIS BROOKS – SENIOR WATER RESOURCES ANALYST

|
o CAGRD Role in Assured Water Supply Programo CAGRD Planning Processeso CAGRD Water Supply Programo Compare currently available supplies to
projected obligationso Need for future water supply acquisitions
37
Focus of Presentation:
|38
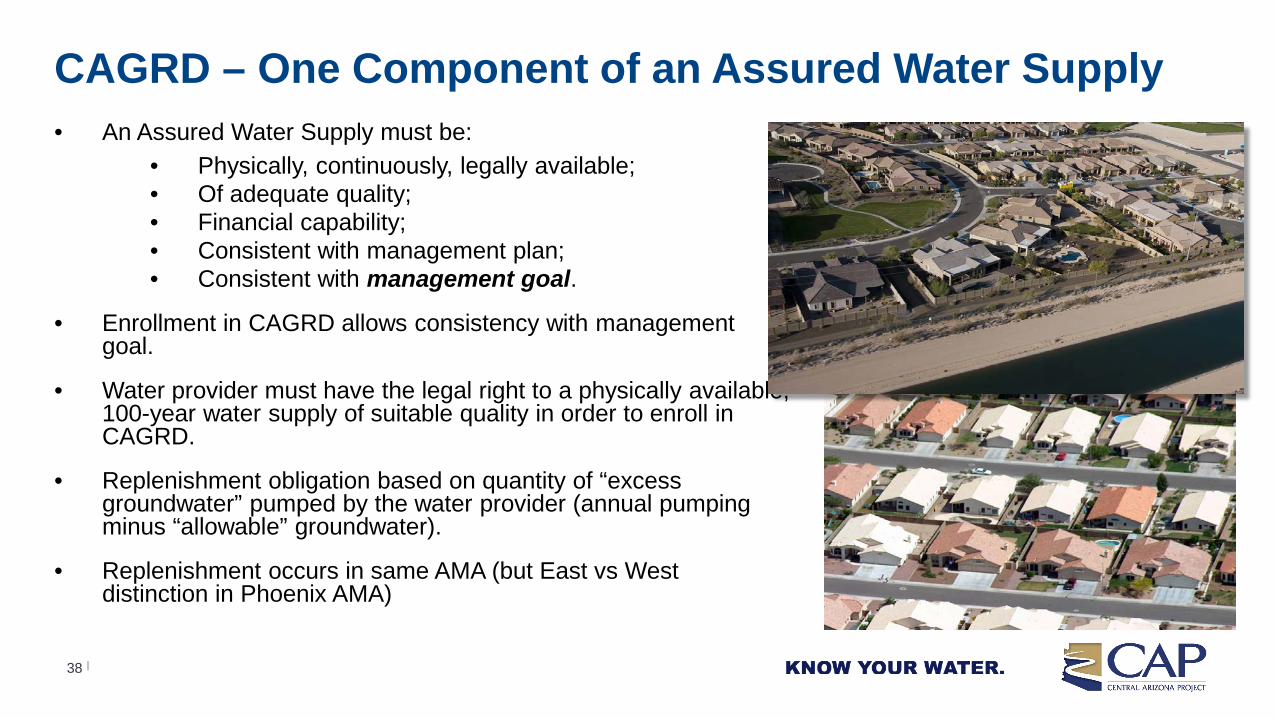
• An Assured Water Supply must be:• Physically, continuously, legally available;• Of adequate quality;• Financial capability;• Consistent with management plan;• Consistent with management goal.
• Enrollment in CAGRD allows consistency with management goal.
• Water provider must have the legal right to a physically available, 100-year water supply of suitable quality in order to enroll in CAGRD.
• Replenishment obligation based on quantity of “excess groundwater” pumped by the water provider (annual pumping minus “allowable” groundwater).
• Replenishment occurs in same AMA (but East vs West distinction in Phoenix AMA)
CAGRD – One Component of an Assured Water Supply

|39
• By statute, CAGRD operates under a 10-year Plan of Operation.
• All Plans developed with public input and approved by ADWR.
• The current 10-year Plan of Operation was approved by ADWR on August 5, 2015.
• Describes the projected obligations and supplies to meet those current and future obligations.
• CAP Board policy also mandates Mid-plan review –completed this year.
• All documents available at: www.cagrd.com/operations/plan-of-operation
CAGRD Plan of Operation

|40
• CAGRD Water Supply Program (WSP) established in 2012 to build robust water supply portfolio to meet future replenishment obligations.
• Water Supply Acquisition Plan in 2012, updated 2015, 2020 update underway.
• 25 agreements to acquire water supplies approved and implemented:
• Incl. LTSCs, effluent, CAP leases, CAP exchange
• Agreements are unique to each particular water supply; designed to provide financial/water supply management benefits to buyer and seller.
Water Supply Program

|41
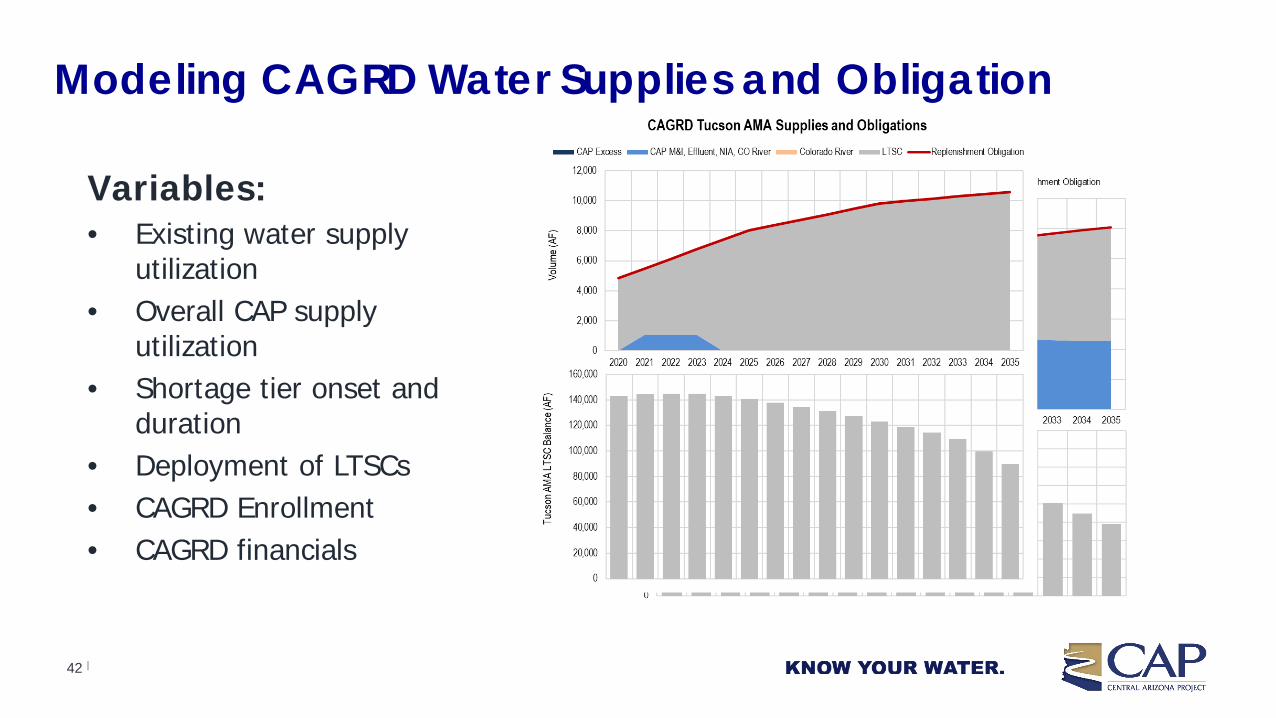
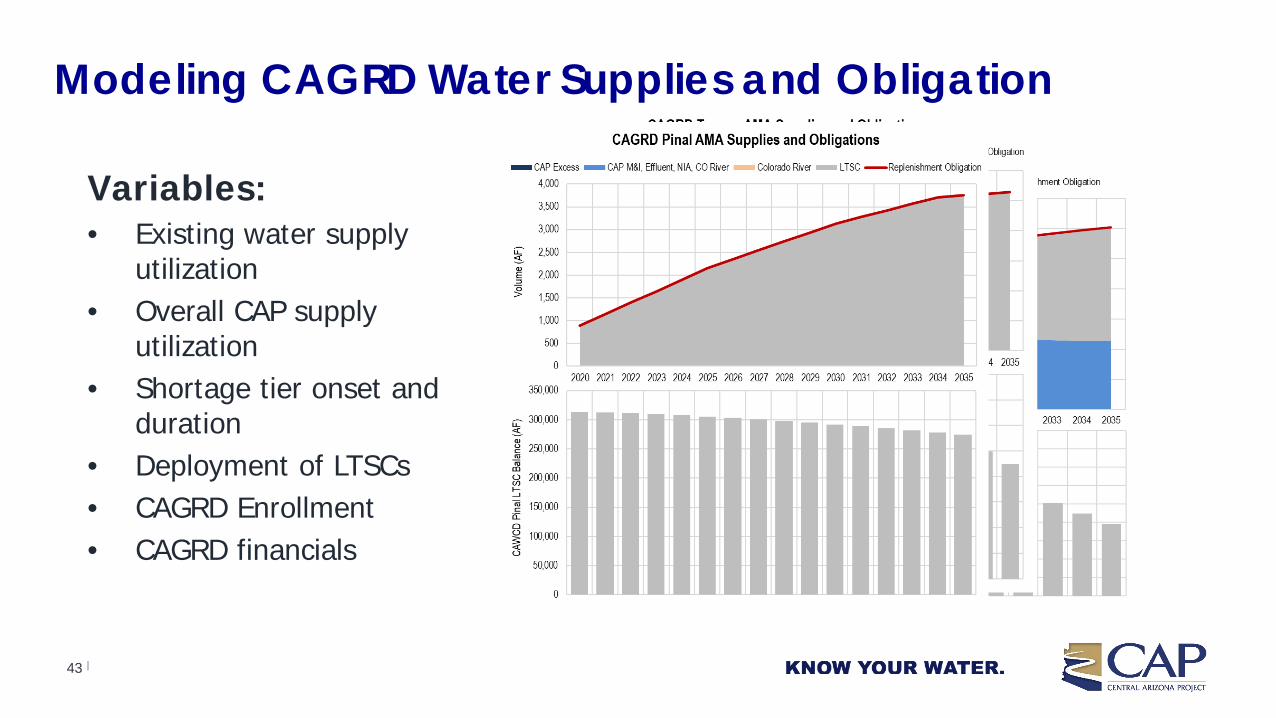
Modeling CAGRD Water Supplies and Obligation
Variables: • Existing water supply
utilization• Overall CAP supply
utilization• Shortage tier onset and
duration• Deployment of LTSCs• CAGRD Enrollment• CAGRD financials
|42
Modeling CAGRD Water Supplies and Obligation
Variables: • Existing water supply
utilization• Overall CAP supply
utilization• Shortage tier onset and
duration• Deployment of LTSCs• CAGRD Enrollment• CAGRD financials
|43
Modeling CAGRD Water Supplies and Obligation
Variables: • Existing water supply
utilization• Overall CAP supply
utilization• Shortage tier onset and
duration• Deployment of LTSCs• CAGRD Enrollment• CAGRD financials

|44 CAGRD – PLANNING & WATER SUPPLY ACQUISITION| 03.03.20
CAGRD Water Supply PortfolioSupply Class Volume (AF) Availability Description
CAP M&I 8,311 Annually Permanent entitlement
CAP Indian (GRIC) 15,000 Annually from 2020 to 2044 25 year lease
CAP NIA (GRIC) 18,185 Annually from 2020 to 2044 25 year lease, subject to shortage reduction
Effluent 2,400 Annually, began 2017 100 year lease
CAP Indian (WMAT) 2,500 Annually from 2024100 year lease, awaiting final authorization; subject to shortage
CAP NIA 18,185 Annually from 2024 Permanent, awaiting final authorization; subject to shortage
TOTAL 64,581Long-term Storage Credits (current) 427,000 As needed
Currently in CAGRD Subaccount; equivalent to 4,270/year for 100 years
Long-term Storage Credits (future) 390,000 2020-2114
To be acquired under existing purchase agreements; equivalent to 3,900/year for 100 years
TOTAL (with current and future credits) 72,751
|45
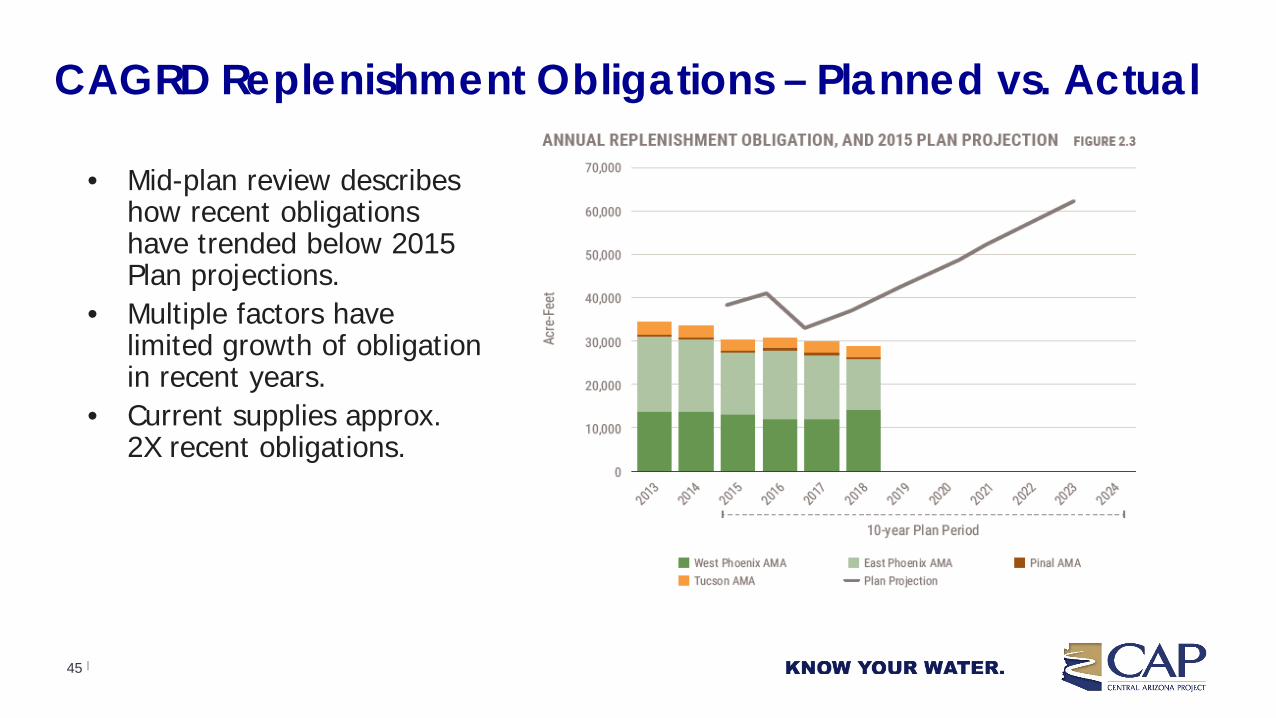
CAGRD Replenishment Obligations – Planned vs. Actual
• Mid-plan review describes how recent obligations have trended below 2015 Plan projections.
• Multiple factors have limited growth of obligation in recent years.
• Current supplies approx. 2X recent obligations.

|46
• Near-term supply outlook is positive• Ample wet water supplies with GRIC/GRWS agreements• Anticipated availability of NIA water• Shortage impacts firmed with LTSCs/Replenishment Reserve• Replenishment obligations trending below projections• No projected reliance on Excess Water
• Future supplies needed to hedge drought risk to CAP NIA supplies, meet longer-term obligations, meet RR targets• Primary need in Phoenix AMA
• Combination of wet water and LTSCs
Future Water Supplies: Need and Availability

|
Colorado River modeling
47

Colorado River ModelingORESTES MORFIN
|49
Goals of Interstate and International Water Management• Reduce Uncertainty, Increase Resiliency• Develop Stable Operations• Provide Opportunities for Collaboration• Balance Upstream and Downstream Risks• Acknowledge Shared Resources/Responsibilities• Cooperatively Respond to Change & Crises
To Build Trust – Use consistent and verifiable interstate and international data with shared models/analytical tools

|50
3 Colorado River Modeling Tools• Used to characterize the supply of Colorado River water available to
CAP• 24-Month Study Model• Mid-Term Operations Model (MTOM)• Colorado River Simulation System (CRSS)
• All models include:• Hydrology (streamflows) – USGS (historical) or NOAA (predicted)• Reservoirs (operating rules, laws, etc.) - USBR• Water uses (diversions, returns, and losses) – USBR (historical) or
predicted

|51
• Deterministic (forecast)• Decision framework model• Rule-based
• 2007 Interim Guidelines + DCP• ≤2 yr operations• Hydrology Inputs
• Colorado Basin River Forecast Center • “min-”, “max-”, and “most probable”
• Run parameters• Duration = 24 mo. • Monthly initial conditions • Monthly time-step
• Outputs of interest• EOM Dec. Lake Mead pool elevation
• Aug 24MS• EOM Sept. & Dec. Lake Powell pool elevation
• Apr & Aug 24MS
Modeling Tools: 24-Month Study Model

|52
• Probabilistic• Planning tool• Rule-based
• 2007 Interim Guidelines + DCP• 1-5 yr planning• Hydrology Input
• UB: unregulated flows as modeled by Colorado River Basin Forecast Center “Calibration Period (1981-2010)” precip. & temp.
• LB: observed side inflows 1981-2010” • Run parameters
• Duration = 5 yrs• Initial conditions: current 24MS results • Monthly time-step
• Outputs of interest• Lake Mead pool elevation• Lake Powell pool elevation• Releases• Shortages
Modeling Tools: Mid-term Probabilistic Operations Model (MTOM)
|53
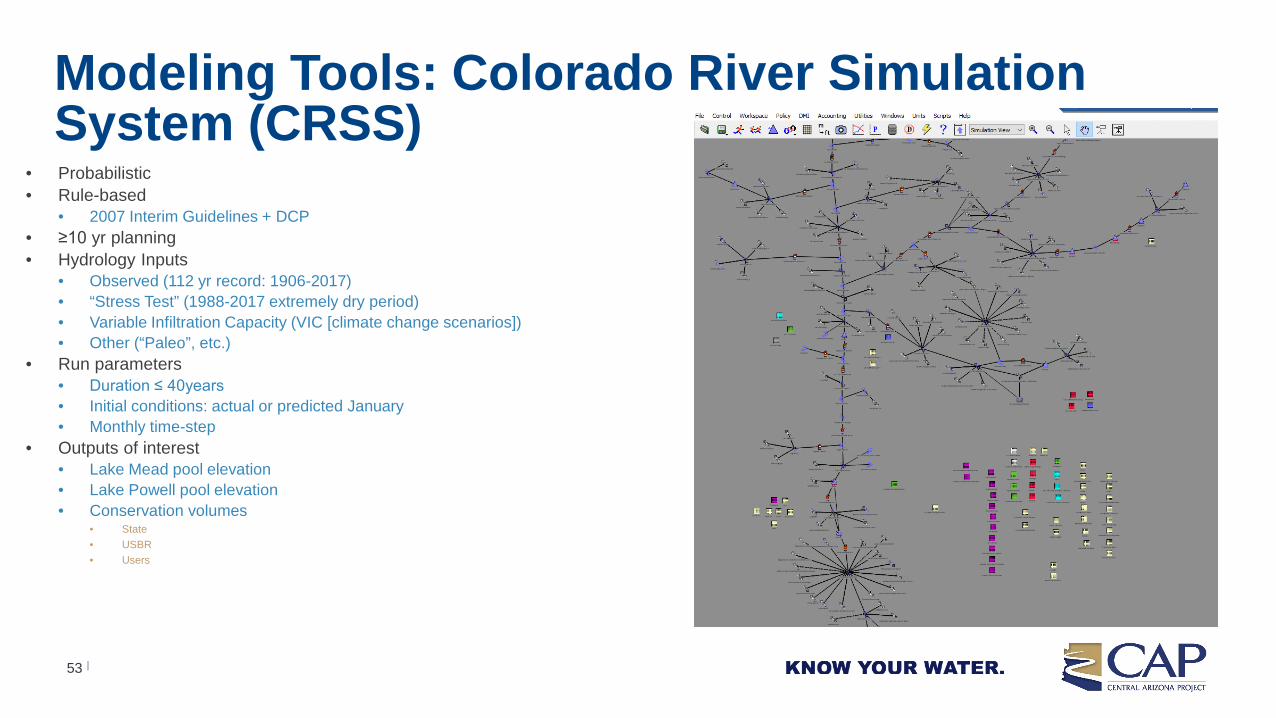
• Probabilistic• Rule-based
• 2007 Interim Guidelines + DCP• ≥10 yr planning• Hydrology Inputs
• Observed (112 yr record: 1906-2017)• “Stress Test” (1988-2017 extremely dry period)• Variable Infiltration Capacity (VIC [climate change scenarios])• Other (“Paleo”, etc.)
• Run parameters• Duration ≤ 40years • Initial conditions: actual or predicted January • Monthly time-step
• Outputs of interest• Lake Mead pool elevation• Lake Powell pool elevation• Conservation volumes
• State• USBR• Users
Modeling Tools: Colorado River Simulation System (CRSS)
|54
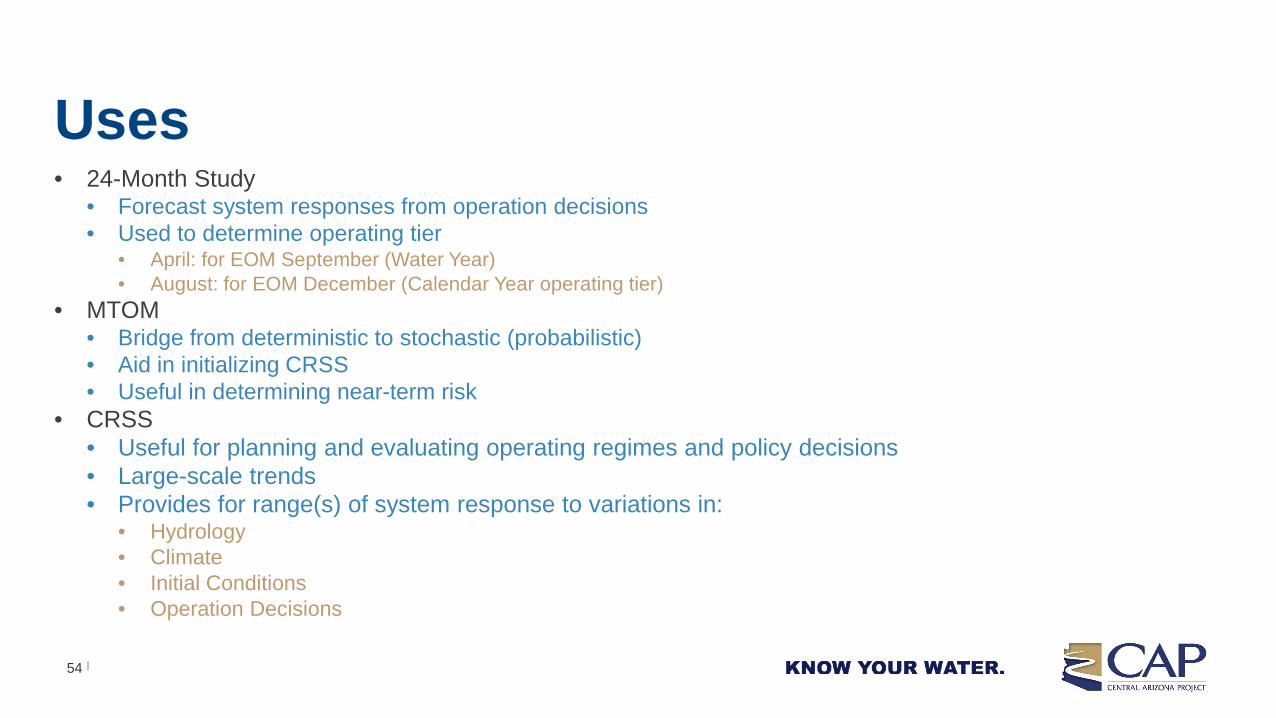
Uses• 24-Month Study
• Forecast system responses from operation decisions• Used to determine operating tier
• April: for EOM September (Water Year)• August: for EOM December (Calendar Year operating tier)
• MTOM• Bridge from deterministic to stochastic (probabilistic)• Aid in initializing CRSS• Useful in determining near-term risk
• CRSS• Useful for planning and evaluating operating regimes and policy decisions• Large-scale trends• Provides for range(s) of system response to variations in:
• Hydrology• Climate• Initial Conditions• Operation Decisions

|55
Summary• Standard issue software (RiverWare™, RiverSmart ™)• Standard issue data
• USGS• USBR• NOAA/CBRFC
• Coordination with USBR• Curated environment• “Refereed” models
• Common set of facts and tools• Fosters relationships• Fundamental to negotiations
• Parties collaborate to improve model tools (e.g. NASA, ASU, Basin States)

|
CAP Climate Adaptation Plan
56

|
CAP Climate Adaptation PlanMohammed Mahmoud, Ph.D., Senior Water Policy Analyst
|
Climate Effect Impact on CAP
Droughtin Upper Colorado River Basin
• Lower Basin Water Shortage: Reduction of annual CAP Water Supply
Increased Warming in the Lower Colorado River Basin
• Higher evaporation: Reduction of CAP water supply in Lake Mead and Lake Pleasant
• Inflated CAP customer water demand• Decreased lifespan of physical assets (e.g. canal
and pumping plants)• Water quality issues in canal (e.g. algae growth and
turbidity)• Health risks for CAP field staff• Increased energy consumption and costs during
peak demand months
Extreme weather events in the CAP Service Area
• Damage to CAP’s physical assets• Safety hazard to all CAP staff
Primary Climate Change Impacts to CAP

|
CAP Climate Adaptation Plan• Prepare the business and function of CAP to be resilient under an
uncertain future impacted by climate change• Explore CAP’s organizational adaptation to climate change using
scenario analysis
How resilient is CAP to climate change?
How do we improve resiliency to climate change?

|
CAP Climate Adaptation Plan Project TeamMulti-disciplinary team composed of staff representing the diverse range of CAP’s organizational functions
The role of the team was to explore:• The impact of climate change to CAP’s water
supply, infrastructure, organization, etc. (Climate Change Implications)
• The suite of adaptation measures that can be implemented in response to these impacts (Climate Adaptation Strategies)

|
Business Mapping and Scenario Planning Approach
Functions:
• Water Policy• Communications• Engineering• Financial Planning• Human Resources• Operational/Information Technology
Define ScenariosSelect Key Drivers
Analyze Impacts of Implications
and Strategies to Functions
Identify Implications
(Challenges and Opportunities)
Develop Adaptation
Strategies and Portfolios
• Legal Services• Public Affairs• Maintenance • Protective Services• Risk Management• Water Operations

|
Most Common Implications
Common scenario implication themes:• Implications that CAP is currently managing or will need to manage in near future• Mostly driven by temperature conditions (warmer future)
• Biological incursions impacting canal system• Health and safety concerns due to higher temperatures• Managing seasonal customer demand due to “lengthening” of summer season
• Maintenance efficiency attributed to technology• Need to manage public image is ongoing implication regardless of driver state

|
No/Low Regrets Strategies25 Strategies that are easy to implement across all scenarios:
• No Regrets (easy to implement, applicable across all scenarios)• Currently being implemented by CAP (e.g. banking water, generating ICS in Lake Mead,
working with others to address water supply/demand imbalance)• Can easily be implemented with little to no additional resources/staff (e.g. increasing
water quality communication, staff and board outreach, prioritizing work activities)

|
Conditional Strategies• 10 Conditional Strategies:
• Difficult to implement, address only one implication each• Only applicable when particular implication or set of conditions arise• Implementation difficulty can limit frequency of their application• Huge financial investments in physical assets (e.g. automating equipment, increasing
system capacity to generate and store power)• Lengthy implementation timelines (e.g. pursuing legislation and regulatory changes)• Time-intensive evaluations and analyses (e.g. increasing staff, reducing or reorganizing
staff duties)

|
Next Steps
Implementation Process:• Review generated adaptation strategies:
• Identify strategies currently implemented (No Regrets)
• Identify new strategies that can be easily implemented (time, resources [cost and manpower], frequency) (Low Regrets)
• Identify difficult strategies to “preserve the option” to implement (Conditional)
• Catalog these subset of strategies as implementation recommendations
• Link the recommended strategies to the CAP’s strategic plan

|
Central Arizona Project Climate Adaptation Plan• www.cap-az.com/departments/planning/climate-adaptation-plan

Questions?
AustinCarey
AngieLohse
ChrisBrooks
OrestesMorfin
MohammedMahmoud
PatrickDent