written assignment # 3enrightc/intro to experimental/written... · written assignment 3 1 written...
TRANSCRIPT
Written Assignment 3 1
Written Assignment # 3
Due Date: Wednesday May 9th by 3:00 p.m. (Late papers will be accepted up until Thursday May 10 at
3:00pm with a 1% penalty off your final semester grade).
You are provided with the Introduction and Method Section for a research paper on the effects of writing letters of
gratitude on subjective happiness (see Attached). For the final written assignment for this course, you are to write
the Results, Discussion sections and Abstract for this study. For this assignment, you must submit:
1) A proper APA formatted Title page.
2) A results section that includes a) a table of the means and standard deviations, b) a figure and c) a statistical
interpretation of the two-way ANOVA.
3) A discussion section
4) An Abstract (no longer than 120 words).
Please remember that all sections of an APA paper are double spaced!
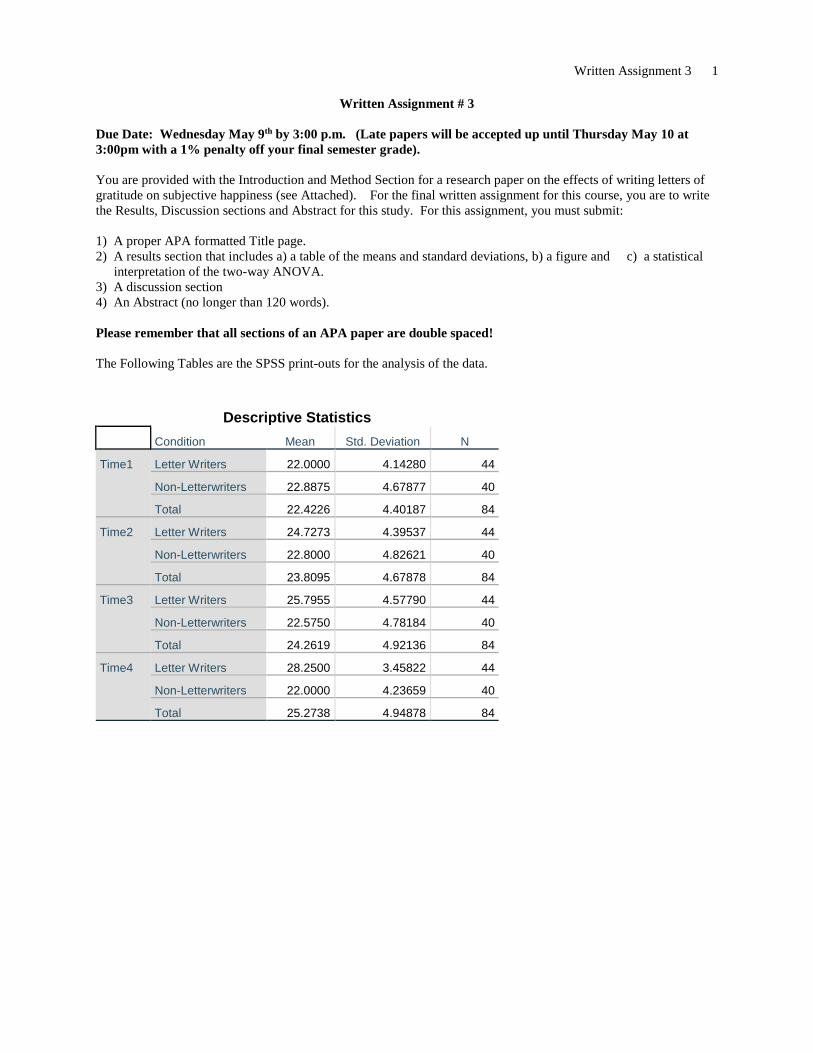
The Following Tables are the SPSS print-outs for the analysis of the data.
Descriptive Statistics
Condition Mean Std. Deviation N
Time1 Letter Writers 22.0000 4.14280 44
Non-Letterwriters 22.8875 4.67877 40
Total 22.4226 4.40187 84
Time2 Letter Writers 24.7273 4.39537 44
Non-Letterwriters 22.8000 4.82621 40
Total 23.8095 4.67878 84
Time3 Letter Writers 25.7955 4.57790 44
Non-Letterwriters 22.5750 4.78184 40
Total 24.2619 4.92136 84
Time4 Letter Writers 28.2500 3.45822 44
Non-Letterwriters 22.0000 4.23659 40
Total 25.2738 4.94878 84
Written Assignment 3 2
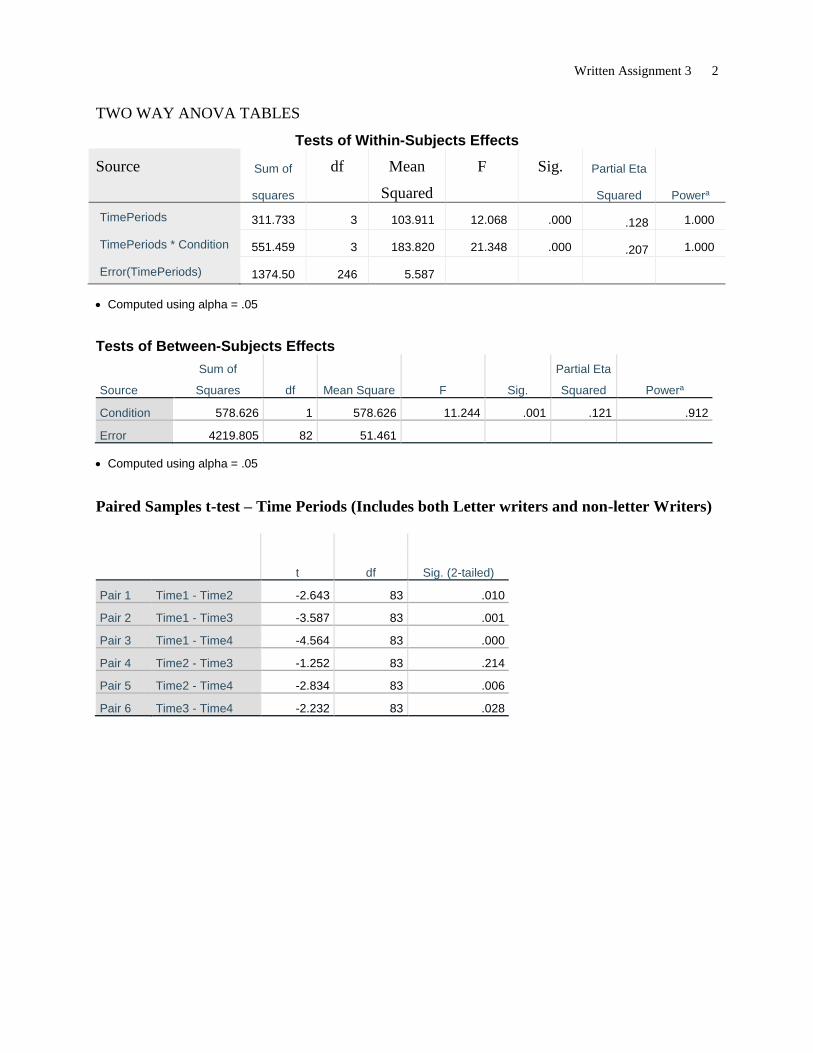
TWO WAY ANOVA TABLES
Tests of Within-Subjects Effects
Source Sum of
squares
df Mean
Squared
F Sig. Partial Eta
Squared
Powera
TimePeriods 311.733 3 103.911 12.068 .000 .128 1.000
TimePeriods * Condition 551.459 3 183.820 21.348 .000 .207 1.000
Error(TimePeriods) 1374.50 246 5.587
Computed using alpha = .05
Tests of Between-Subjects Effects
Source
Sum of
Squares df Mean Square F Sig.
Partial Eta
Squared Powera
Condition 578.626 1 578.626 11.244 .001 .121 .912
Error 4219.805 82 51.461
Computed using alpha = .05
Paired Samples t-test – Time Periods (Includes both Letter writers and non-letter Writers)
t df Sig. (2-tailed)
Pair 1 Time1 - Time2 -2.643 83 .010
Pair 2 Time1 - Time3 -3.587 83 .001
Pair 3 Time1 - Time4 -4.564 83 .000
Pair 4 Time2 - Time3 -1.252 83 .214
Pair 5 Time2 - Time4 -2.834 83 .006
Pair 6 Time3 - Time4 -2.232 83 .028
Written Assignment 3 3
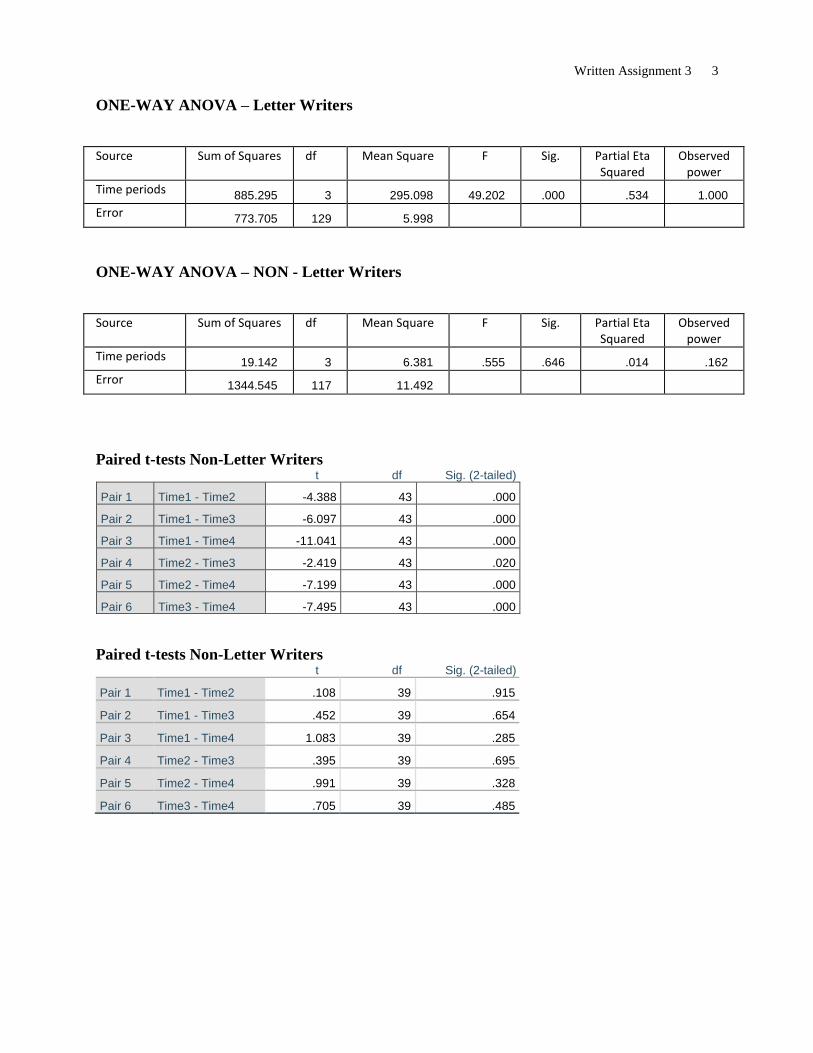
ONE-WAY ANOVA – Letter Writers
Source Sum of Squares df Mean Square F Sig. Partial Eta Squared
Observed power
Time periods 885.295 3 295.098 49.202 .000 .534 1.000
Error 773.705 129 5.998
ONE-WAY ANOVA – NON - Letter Writers
Source Sum of Squares df Mean Square F Sig. Partial Eta Squared
Observed power
Time periods 19.142 3 6.381 .555 .646 .014 .162
Error 1344.545 117 11.492
Paired t-tests Non-Letter Writers t df Sig. (2-tailed)
Pair 1 Time1 - Time2 -4.388 43 .000
Pair 2 Time1 - Time3 -6.097 43 .000
Pair 3 Time1 - Time4 -11.041 43 .000
Pair 4 Time2 - Time3 -2.419 43 .020
Pair 5 Time2 - Time4 -7.199 43 .000
Pair 6 Time3 - Time4 -7.495 43 .000
Paired t-tests Non-Letter Writers t df Sig. (2-tailed)
Pair 1 Time1 - Time2 .108 39 .915
Pair 2 Time1 - Time3 .452 39 .654
Pair 3 Time1 - Time4 1.083 39 .285
Pair 4 Time2 - Time3 .395 39 .695
Pair 5 Time2 - Time4 .991 39 .328
Pair 6 Time3 - Time4 .705 39 .485
Written Assignment 3 4
How to Write the Results Section
The text of the results section presents a clear, comprehensive but non-repetitive presentation of the analysis of data from the study. Do not interpret (i.e., do not explain what the results mean) or discuss implications of the results in this section. Remember, a reader who is not interested in the specific numbers obtained or the analysis should be able to skip this section without missing any information about how or why the data supported, or failed to support the hypothesis tested. Results sections should report all results in a manner that is easiest for the reader to comprehend.
Generally, descriptive statistics (e.g., means and standard deviations) are presented first. Data can
be presented within the text. For example, “The mean scores for males and females were 12.5 sec (s = 1.45) and 15.4 (s = 1.34) respectively.” This is fine if only a few statistics need to be reported. When larger numbers of statistics are presented, it is better to use tables or figures. For this assignment, you must provide both a table and a figure. Generally, only one or the other would be included with the manuscript. This assignment requires both in order to give you experience constructing both according to APA format. Instructions for constructing tables and figures are provided below. Please note that the Tables I have provided you are NOT in APA format. They are SPSS print outs.
Format for constructing a results section:
The first sentence of your results section should direct the reader look at the table of descriptive statistics (i.e., see Table 1). Note that the “t” in table is capitalized.
When referring to factors and dependent variables the names of the variables (e.g., Sex, Marital Status and Happiness) are capitalized. Conditions of the independent variable are not capitalized (e.g., men and women; married, single & divorced).
Next, the type of analysis used and the questions it will answer are defined (see sentence two in the example provided below).
Next, the results of the statistical analysis are presented in an organized manner. For factorial designs we begin with the main effects. From the a two-way ANOVA tables, present the results for one variable completely (i.e., include results of post hoc multiple comparisons when necessary). Be sure to summarize which conditions differ from which other and what the direction of the difference is. After the main effect of the first factor is completely presented, proceed to the second factor.
Report the results of the interaction next. If the interaction is significant, use a separate paragraph to do this.
Because interactions are depicted more clearly in figures than in tables, you should direct the reader to look at the figure in this paragraph.
Provide the simple main effects for each level of the analysis. For the assignment, we are looking separately at the changes over Time Periods for the letter writers and the non-letter writers.
Format for constructing a Table:
Each table is presented on a separate page and placed at the end of the manuscript.
Each table is numbered. (E.g., Table 1.)
The title of the table is given. The format is as follows:
Written Assignment 3 5
o First letter of all major words in the title are capitalized o Entire title is italicized. o Title is left justified and can carry over to as many lines as necessary o Title should be as short as possible, but should also fully define what is in the table.
All rows and columns must be clearly labeled.
APA formatted tables can include horizontal lines but must not include vertical lines.
All numbers in the table should be rounded to 2 decimal points.
The standard deviations are presented in parenthesis under the means and accompanied by a note telling the reader that the numbers in parenthesis are standard deviations.
When referring to the table, the “t” in table is capitalized.
In the text of your manuscript, you need to tell the reader to look at the table (e.g., see Table 1).
The table itself goes at the end of the paper. Since the pattern of results is more clearly depicted in graphic form, for this assignment I am also
requiring you to include a graph. Any non-text (i.e., graphic) material included in the manuscript are referred to as figures. This could include graphs, charts, maps, drawings or photographs. The only figure you will include in this assignment is a graph. Similar to tables, figures are referred to in the text (tell the reader to see Figure 1) but the actual figure is placed at the end of the paper. You do not need to use a computer program for your figure. I will accept a neatly hand drawn figure
Things to keep in mind:
Each figure is given a title which is presented above the figure.
All axis must be labeled.
If the variable along your horizontal axis is a continuous variable, you should use a line graph. If the variable is categorical, you should use a bar graph.
A legend is included to identify the conditions represented by each line or bar.
A figure caption is provided below each figure and should give a brief but comprehensive summary of the results depicted.
The information provided in the figure caption should be sufficient to make the figure understandable on its own.
General Rules for presenting numerical data:
1) All numbers should be rounded to 2 decimal places, with the possible exception of p values. If the p value can be meaningfully expressed with 2 decimal places (i.e., p = .02) than 2 decimal places are fine. If the p value requires a third decimal place to be meaningful (i.e., p = .003) then use three decimal points. If the SPSS computer print-out gives the p value as .000 (which we know is impossible) report it as p < .001.
2) All statistics have abbreviations (usually an alphabet letter, or a Greek symbol) which are used by
convention. When a letter is used to indicate a statistic, the letter is italicized. The letters that statistical abbreviations you are likely to use are M, which refers to Mean, s which refer to standard deviation, F which refers to the F statistic for an ANOVA, p which refers to the probability of making a Type I error and t which refers to a t-test.
Written Assignment 3 6
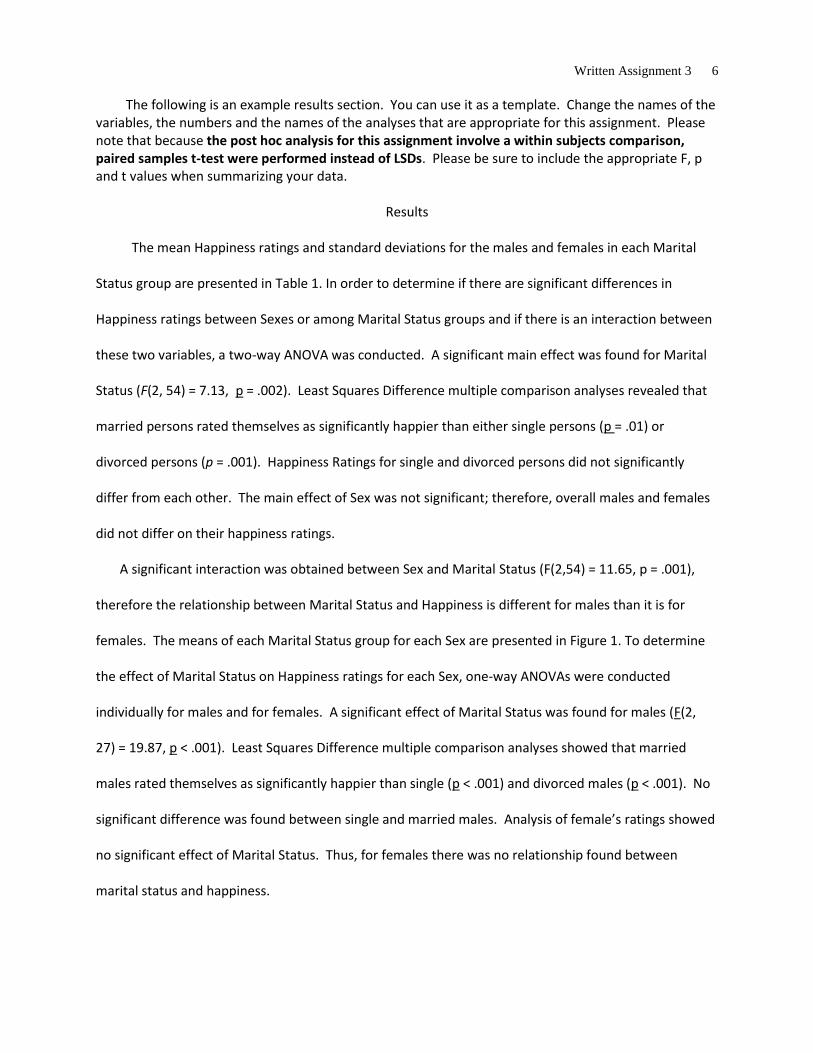
The following is an example results section. You can use it as a template. Change the names of the variables, the numbers and the names of the analyses that are appropriate for this assignment. Please note that because the post hoc analysis for this assignment involve a within subjects comparison, paired samples t-test were performed instead of LSDs. Please be sure to include the appropriate F, p and t values when summarizing your data.
Results
The mean Happiness ratings and standard deviations for the males and females in each Marital
Status group are presented in Table 1. In order to determine if there are significant differences in
Happiness ratings between Sexes or among Marital Status groups and if there is an interaction between
these two variables, a two-way ANOVA was conducted. A significant main effect was found for Marital
Status (F(2, 54) = 7.13, p = .002). Least Squares Difference multiple comparison analyses revealed that
married persons rated themselves as significantly happier than either single persons (p = .01) or
divorced persons (p = .001). Happiness Ratings for single and divorced persons did not significantly
differ from each other. The main effect of Sex was not significant; therefore, overall males and females
did not differ on their happiness ratings.
A significant interaction was obtained between Sex and Marital Status (F(2,54) = 11.65, p = .001),
therefore the relationship between Marital Status and Happiness is different for males than it is for
females. The means of each Marital Status group for each Sex are presented in Figure 1. To determine
the effect of Marital Status on Happiness ratings for each Sex, one-way ANOVAs were conducted
individually for males and for females. A significant effect of Marital Status was found for males (F(2,
27) = 19.87, p < .001). Least Squares Difference multiple comparison analyses showed that married
males rated themselves as significantly happier than single (p < .001) and divorced males (p < .001). No
significant difference was found between single and married males. Analysis of female’s ratings showed
no significant effect of Marital Status. Thus, for females there was no relationship found between
marital status and happiness.
Written Assignment 3 7
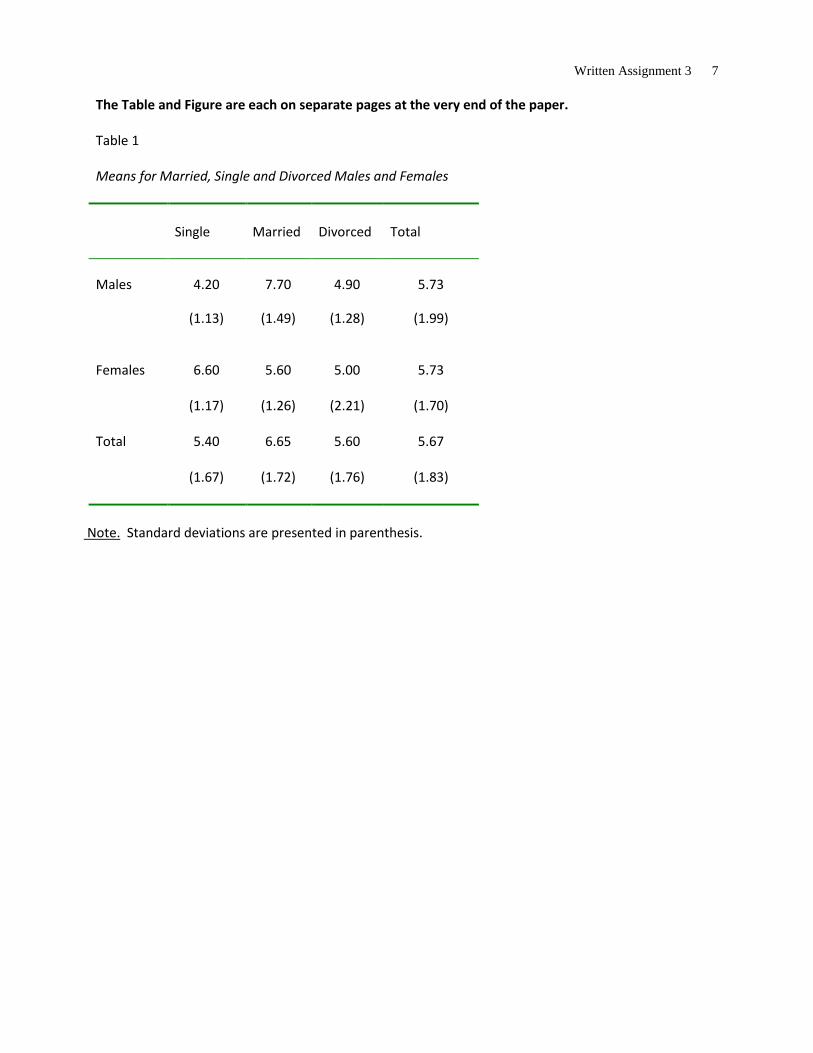
The Table and Figure are each on separate pages at the very end of the paper. Table 1 Means for Married, Single and Divorced Males and Females
Single
Married
Divorced
Total
Males 4.20
(1.13)
7.70
(1.49)
4.90
(1.28)
5.73
(1.99)
Females 6.60
(1.17)
5.60
(1.26)
5.00
(2.21)
5.73
(1.70)
Total 5.40
(1.67)
6.65
(1.72)
5.60
(1.76)
5.67
(1.83)
Note. Standard deviations are presented in parenthesis.
Written Assignment 3 8
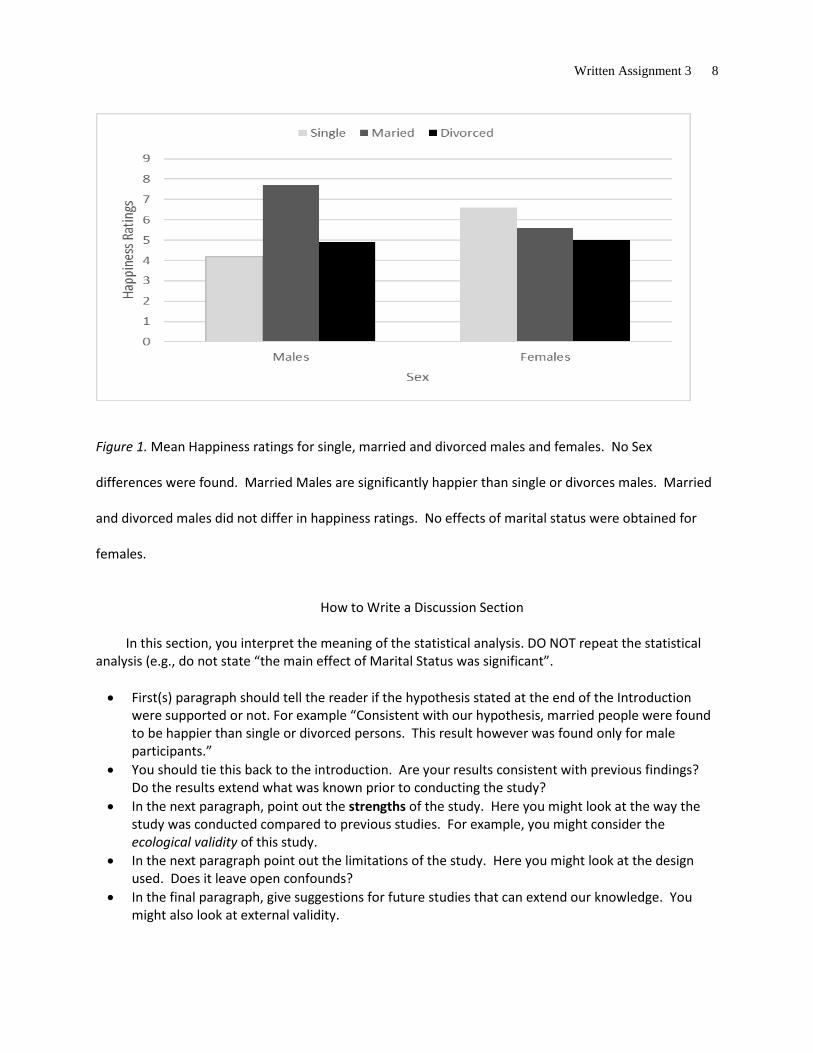
Figure 1. Mean Happiness ratings for single, married and divorced males and females. No Sex
differences were found. Married Males are significantly happier than single or divorces males. Married
and divorced males did not differ in happiness ratings. No effects of marital status were obtained for
females.
How to Write a Discussion Section
In this section, you interpret the meaning of the statistical analysis. DO NOT repeat the statistical
analysis (e.g., do not state “the main effect of Marital Status was significant”.
First(s) paragraph should tell the reader if the hypothesis stated at the end of the Introduction were supported or not. For example “Consistent with our hypothesis, married people were found to be happier than single or divorced persons. This result however was found only for male participants.”
You should tie this back to the introduction. Are your results consistent with previous findings? Do the results extend what was known prior to conducting the study?
In the next paragraph, point out the strengths of the study. Here you might look at the way the study was conducted compared to previous studies. For example, you might consider the ecological validity of this study.
In the next paragraph point out the limitations of the study. Here you might look at the design used. Does it leave open confounds?
In the final paragraph, give suggestions for future studies that can extend our knowledge. You might also look at external validity.
Written Assignment 3 9
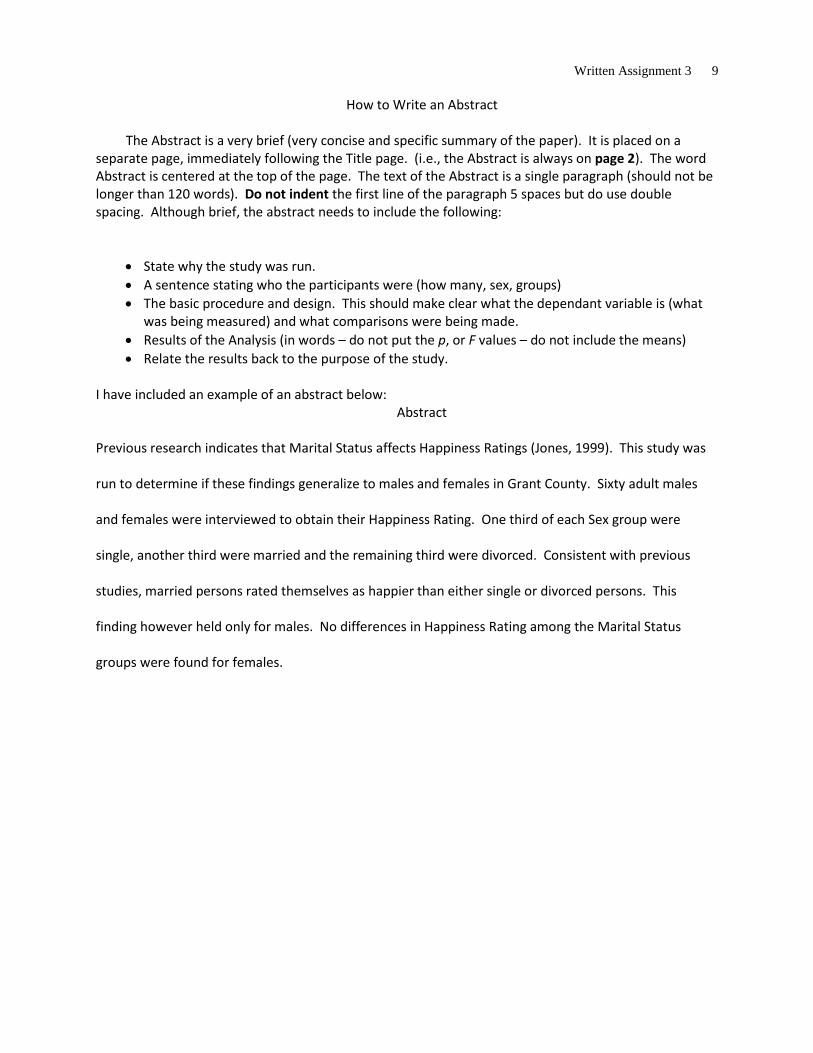
How to Write an Abstract
The Abstract is a very brief (very concise and specific summary of the paper). It is placed on a separate page, immediately following the Title page. (i.e., the Abstract is always on page 2). The word Abstract is centered at the top of the page. The text of the Abstract is a single paragraph (should not be longer than 120 words). Do not indent the first line of the paragraph 5 spaces but do use double spacing. Although brief, the abstract needs to include the following:
State why the study was run.
A sentence stating who the participants were (how many, sex, groups)
The basic procedure and design. This should make clear what the dependant variable is (what was being measured) and what comparisons were being made.
Results of the Analysis (in words – do not put the p, or F values – do not include the means)
Relate the results back to the purpose of the study. I have included an example of an abstract below:
Abstract
Previous research indicates that Marital Status affects Happiness Ratings (Jones, 1999). This study was
run to determine if these findings generalize to males and females in Grant County. Sixty adult males
and females were interviewed to obtain their Happiness Rating. One third of each Sex group were
single, another third were married and the remaining third were divorced. Consistent with previous
studies, married persons rated themselves as happier than either single or divorced persons. This
finding however held only for males. No differences in Happiness Rating among the Marital Status
groups were found for females.
LETTERS OF GRATITUDE 10
Letters of Gratitude: Improving Happiness through Expressive Writing
Researchers have shown that about 40% of our happiness is accounted for by intentional
activity whereas 50% is explained by genetics and 10% by circumstances (Lyubomirsky, Sheldon &
Schkade, 2005). Consequently, efforts to improve happiness might best be focused in the domain of
volitional activity: willful, mindful and self-directed activity (Sheldon & Lyubomirsky, 2007). Such activity
is nested in the “sustainable happiness model” proposed by Lyubomirsky, et al. (2005) which states that
happiness is in part within our ability to manage.
Myers (1992) described happiness, or subjective happiness as it is often called, as a lasting sense
that life is fulfilling, meaningful, and pleasant. Happiness includes emotional states of joy, contentment,
positive well-being, and a perception that one’s life is worthwhile (Lyubomirsky, 2001). Diener and
Seligman (2002) have shown that individuals with high levels of happiness possess an abundance of
factors such as joy, contentment, and the perception that life is valuable. Conversely, unhappy people
report fewer satisfying relationships and less gratitude (Park, Peterson, Martin & Seligman, 2004).
Happiness and fulfillment is an important and increasingly common pursuit of people around the world
(Diener, 2000; Diener, Suh, Smith & Shao, 1995).
Earlier work (Fordyce, 1977; 1983) supports the premise that individuals can sustain levels of
happiness through volitional behavior. One such volitional action is through examining and expression
of positive emotion, specifically, by focusing attention on those things in one’s life for which you
experience gratitude. Gratitude is typically comprised of appreciation and thankfulness (Emmons &
Shelton, 2002). Positive emotions such as gratitude contribute to more favorable judgments of life-
satisfaction and overall well-being (Diener & Larsen, 1993; Buss, 2000; Diener, 2000; Stack, Argyle &
Schwarts, 1991; Suh, Diener, Oishi & Triandis, 1998) and experiencing or expressing those emotions
have been shown to further improve well-being and happiness (Fredrickson & Joiner, 2002).
LETTERS OF GRATITUDE 11
Watkins, Grimm and Kolts (2004) suggested the hallmark of a grateful person is the appreciation
of the simple things in life. Numerous studies have shown that personal gratitude contributes to
subjective happiness (Emmons & Crumpler, 2000; McCullough et al., 2002; Peterson & Seligman, 2004).
This was evidenced in a study that showed subjective happiness was increased simply by counting one’s
acts of kindness during the past week (Otake, Shimai, Tanaka-Matsumi, Otsui & Fredrickson, 2006). As
an expression of gratitude, acts of kindness have been show to increase happiness over a 10-week
period simply by engaging in kind acts such as holding the door for strangers or doing a roommate’s
dishes (Tkach, 2005). Lyubomirsky, et al. (2005) found that acts of kindness over time, as opposed to
doing them all in one day, improved happiness levels. Such finding suggests that happiness can be
boosted through sustained and intentional gratitude-oriented activities.
Several studies have found that writing exercises that emphasize positive affect have long-term
positive effects on the writers’ experiences of happiness and subjective well-being. Pennebaker and
Seagal (1999) demonstrated that writing which included higher levels of positive emotion words had
positive effects on participants. Pennebaker’s (1997) expressive writing paradigm was employed to
measure participants as they repetitively re-experienced their happiest day. Utilizing Pennebaker’s
paradigm, Lyubomirsky, Sousa and Dickerhoof (2006) found that writing and talking about one’s day
increases a person’s positive emotions four weeks after the study. Emmons and McCullough (2003)
asked participants to keep gratitude journals once a week, three times a week, or not at all. In their
journals, participants wrote down up to five things for which they were grateful in the past week. The
gratitude-outlook groups exhibited heightened well-being across several outcome measures with the
most robust finding being positive affect.
Expressive writing studies are plentiful and the once neglected domain of letter writing as a
vehicle for improving health has seen a recent surge of interest (King, 2001; Sheldon & Lyubomirsky,
LETTERS OF GRATITUDE 12
2006a; Seligman et al., 2005; Lyubomirsky, Dickerhoof, Boehm, & Sheldon, 2009). For example,
VandeCreek, Janus, Pennebaker and Binau (2002) asked participants to pray and write letters to God
and found that both prayer and the letters increased insight and positive emotion, more so than simple
written descriptions. A single letter to God had the most impact. The authors explained that the act of
praying or explaining to another (in this case in a letter to God) was more conducive to personal insight
and greater positive emotional formulations about life events. In other words, writing a letter to God
was found to improve participant’s positive feelings about life events.
Watkins, Woodward, Stone and Kolts (2003) examined mood changes as the result of various
gratitude inductions, one of which was a letter writing condition. Their findings revealed that writing a
gratitude based letter produced a positive affect increase compared to the other gratitude inductions
(Watkins et al., 2003).
Lyubomirsky et al. (2009) used gratitude letters (not mailed to recipients) to measure the power
of reflection on past memories as a factor for improving general well-being. Participants were asked to
recall experiences during the past few years for which they were grateful for something. Based on those
memories participants wrote essays once a week for 15 minutes. Intentional and positive activities such
as writing essays (as well as visualizing one’s dreams coming true) were found to bolster perceived
positive change. The authors stated that increased well-being was most likely due to a higher motivation
to become happier. Furthermore, they suggested that increased well-being may be most beneficial
when the expression of gratitude has time to manifest, perhaps allowing people to improve their
relationships. They called for future research in this area.
The current study extends previous research by examining the effects of repeatedly engaging in
the volitional act of putting pen-to-paper or fingers-to-keys to express gratitude on subsequent
happiness. It is expected that participants in the letter writing condition will experience increased levels
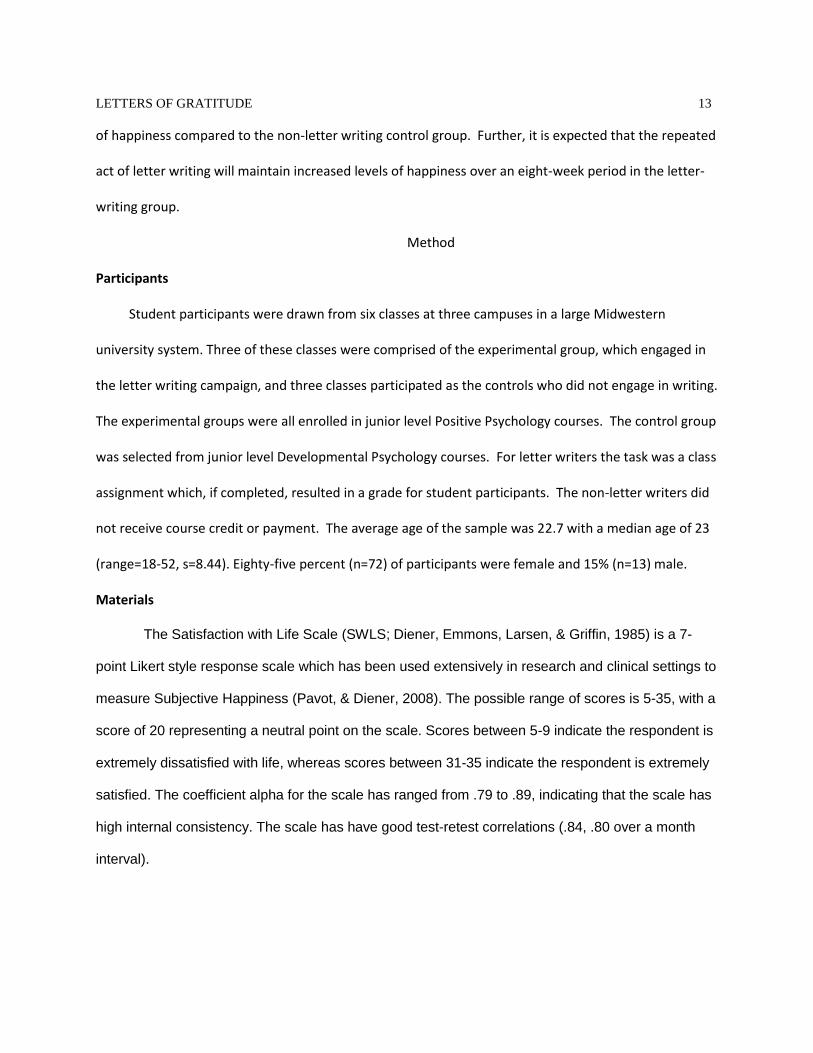
LETTERS OF GRATITUDE 13
of happiness compared to the non-letter writing control group. Further, it is expected that the repeated
act of letter writing will maintain increased levels of happiness over an eight-week period in the letter-
writing group.
Method
Participants
Student participants were drawn from six classes at three campuses in a large Midwestern
university system. Three of these classes were comprised of the experimental group, which engaged in
the letter writing campaign, and three classes participated as the controls who did not engage in writing.
The experimental groups were all enrolled in junior level Positive Psychology courses. The control group
was selected from junior level Developmental Psychology courses. For letter writers the task was a class
assignment which, if completed, resulted in a grade for student participants. The non-letter writers did
not receive course credit or payment. The average age of the sample was 22.7 with a median age of 23
(range=18-52, s=8.44). Eighty-five percent (n=72) of participants were female and 15% (n=13) male.
Materials
The Satisfaction with Life Scale (SWLS; Diener, Emmons, Larsen, & Griffin, 1985) is a 7-
point Likert style response scale which has been used extensively in research and clinical settings to
measure Subjective Happiness (Pavot, & Diener, 2008). The possible range of scores is 5-35, with a
score of 20 representing a neutral point on the scale. Scores between 5-9 indicate the respondent is
extremely dissatisfied with life, whereas scores between 31-35 indicate the respondent is extremely
satisfied. The coefficient alpha for the scale has ranged from .79 to .89, indicating that the scale has
high internal consistency. The scale has have good test-retest correlations (.84, .80 over a month
interval).
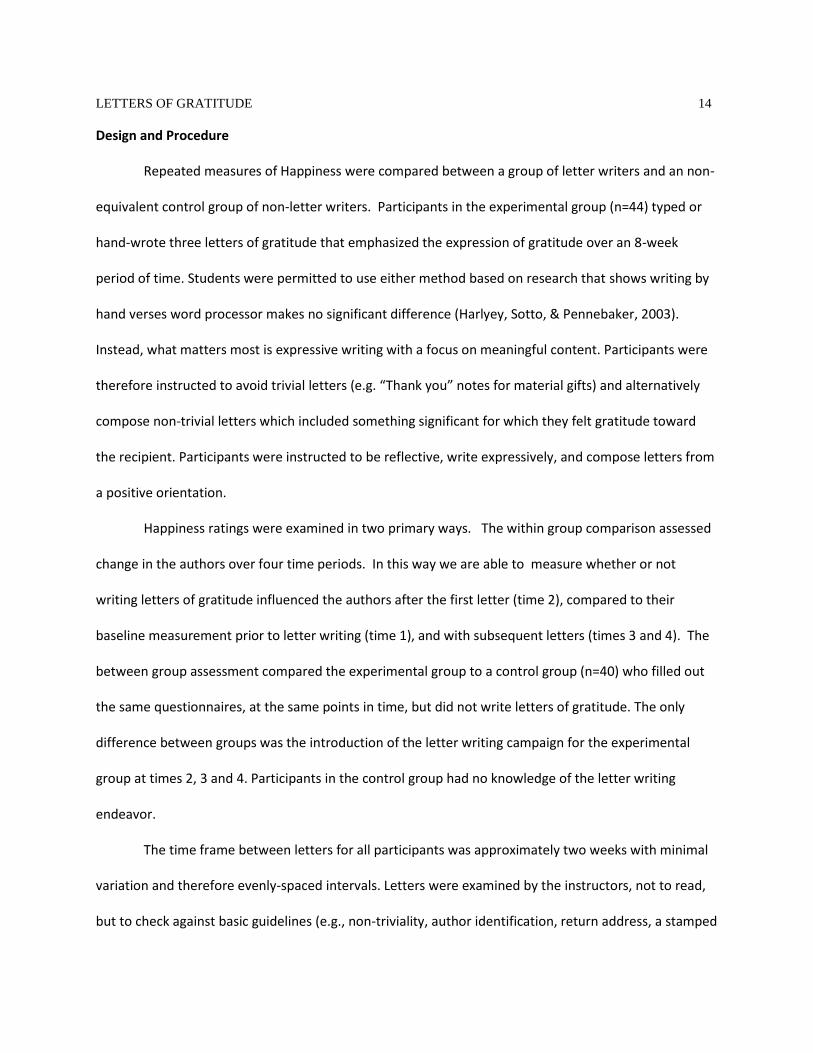
LETTERS OF GRATITUDE 14
Design and Procedure
Repeated measures of Happiness were compared between a group of letter writers and an non-
equivalent control group of non-letter writers. Participants in the experimental group (n=44) typed or
hand-wrote three letters of gratitude that emphasized the expression of gratitude over an 8-week
period of time. Students were permitted to use either method based on research that shows writing by
hand verses word processor makes no significant difference (Harlyey, Sotto, & Pennebaker, 2003).
Instead, what matters most is expressive writing with a focus on meaningful content. Participants were
therefore instructed to avoid trivial letters (e.g. “Thank you” notes for material gifts) and alternatively
compose non-trivial letters which included something significant for which they felt gratitude toward
the recipient. Participants were instructed to be reflective, write expressively, and compose letters from
a positive orientation.
Happiness ratings were examined in two primary ways. The within group comparison assessed
change in the authors over four time periods. In this way we are able to measure whether or not
writing letters of gratitude influenced the authors after the first letter (time 2), compared to their
baseline measurement prior to letter writing (time 1), and with subsequent letters (times 3 and 4). The
between group assessment compared the experimental group to a control group (n=40) who filled out
the same questionnaires, at the same points in time, but did not write letters of gratitude. The only
difference between groups was the introduction of the letter writing campaign for the experimental
group at times 2, 3 and 4. Participants in the control group had no knowledge of the letter writing
endeavor.
The time frame between letters for all participants was approximately two weeks with minimal
variation and therefore evenly-spaced intervals. Letters were examined by the instructors, not to read,
but to check against basic guidelines (e.g., non-triviality, author identification, return address, a stamped
LETTERS OF GRATITUDE 15
envelope, etc.). The primary investigator was responsible for mailing the letters. Participants were
aware that letters would be mailed to the intended recipients, therefore increasing the psychological
realism of the exercise. The questionnaires took approximately five minutes to complete and included
a demographic form (filled out once at time 1) and the SHS (Lyubomirsky & Lepper, 1999) and were
administered to both the letter-writing and the non-letter writing control groups at approximately two
week periods.