wrfkhplf dudfwhulvdwlrq wudfwv - … · fdfxow\ ri slhqfh, eqjlqhhulqj & thfkqrorj\ dhsduwphqw...
TRANSCRIPT

Faculty of Science, Engineering & Technology Department of Chemistry & Biotechnology
Investigation of antimicrobial activity and phytochemical characterisation of plant extracts
Submitted in total fulfillment of the requirements for the degree of
Doctor of Philosophy in Chemistry
By
Savithri Galappathie
Department of Chemistry and Biotechnology
Faculty of Science, Engineering and Technology
Swinburne University of Technology
October 2018

ii

iii
Abstract
Traditional medicine based on plant extracts and herbal remedies has been increasingly
accepted in Western countries with the modernisation of traditional medicine being a hot area
of research in recent years. During 1980-2014, there were 1562 new pharmaceutical drugs
developed to treat diseases with about 49% being derived from medicinal plants. There are
around 500,000 plant species worldwide but only one percent of these have been used as
therapeutic agent.
The Sarawak Biodiversity Centre (SBC), Kuching, Malaysia, has provided chemical plant
extracts from their collection of Southeast Asian plants that were screened for their antibacterial
and antifungal properties. The results of this study so far have demonstrated that many of the
Sarawak traditional medicinal plants have effects on microorganisms causative agents for
diarrhoea, stomachache, fever, headaches, cough and inflammation. Out of fifty Asian plant
extract that were screened, six were found to exhibit broad spectrum activity against several
strains of bacteria and fungi and there was significant effect against both Gram-positive and
Gram-negative bacteria. The use of these plant species by indigenous groups in Malaysia for
the treatment of these illnesses can therefore be substantiated by our findings. In addition to
this research, a study was undertaken to discover the basis of the healing abilities reported for
an Australian bush medicine.
One native Australian and one Bornean plant were the subject of further characterisation using
an approach developed for bioguided fractionation. Solid Phase Extraction tubes were used to
divide the complex mixture of the plant extract into smaller fractions that were then tested for
bioactivity. This process was then repeated for the active fractions and instrumental analysis of
these secondary fractions was used for identification.

iv
Eremophila longifolia leaf extract produced using the conventional immersion technique
exhibited better antimicrobial activity compared to Accelerated Solvent Extraction, acetonitrile
was found to be the most suitable extraction solvent and optimal activity was found with
extracts produced using the conventional immersion technique at 21°C and 5 days
There were two novel natural compounds isolated using bioguided fractionation from the
leaves of the Australian plant, Eremophila longifolia, and they were chemically identified as
neryl ferulate and neryl p-coumarate. Although the bioactivity was weak, their discovery has
further advance knowledge of an important indigenous medicine.
Asian plant Baccaurea lanceolata fruit extracts showed the most antimicrobial activity against
Gram-positive and Gram-negative bacterial strains, the active compound was isolated, and it
was chemically identified as tartaric acid.
The overall goal of this project was to identify the compounds responsible for observed
bioactivity.

v
This thesis dedicated to my late father, Mr. Ranjith Perera
Gunaratne, his sister Mrs. Mangala Fernando and my primary
school science teacher Mrs. Jayantha Fernando, especially
because of you, I love science.

vi
Acknowledgements
Firstly, I would like to express my sincere gratitude to all my supervisors Dr. Peter Mahon,
Professor Enzo Palombo and Dr François Malherbe for the continuous support towards my
research project. Special thanks to Peter, who gave me the necessary advice for all
chromatographic analysis, separation studies and coached me to think accordingly. His words
were “Savi, do the experiments systematically and it has to be consistent”. Tremendous thanks
to Professor Danny Meyer for her expert advice for statistical pathways and analysis. The
Sarawak Biodiversity Center is the primary provider of the Bornean plant extracts for this study
and my humble appreciation to the staff who were involved in the collection of the plant from
the different geological locations in the forest. To the University of Queensland, I am
immensely grateful to Dr. Mark Butler and his colleagues for providing necessary
instrumentation analysis to finalise this research. Also, a big thank you to senior LC-MS
application specialist Mr. Alex Chen, at Thermo Fisher Sciences Australia, for providing
unrestricted assistance of analysis for all my samples. I thank fellow colleagues, Mr. Ngan
Nguyen and Yeannette Lizama, always with a smile on their face, Dr. Rebecca Phillips and Dr.
Shanthi Joseph providing microbial advice and the cultures. Also, big thank you to Dr. Avinash
Karpe, Dr. Rohan Shah, Dr. Snehal Jadhav and Dr. Yulia Alekseeva for their precious support
to survive in difficult situations.
Finally, I would love to thank my beloved rebellion gang, my mum Nikulas, husband Suppriya
and kids, Amanda and her partner Julian, Tanya, Ruwini and her family, my physics and
chemistry teacher/cousin Lalani Kadigamuwa for her support in secondary school and my
beloved friend Pjrena, for their unconditional love and support including the encouragement to
finish.
I love you guys with all of my heart

vii
Declaration
To the best of my knowledge, this PhD thesis does not contain any published materials
including tables, figures and appendices, in whole, or in part, for the award of any other
academic degree or diploma by another individual. Except where otherwise indicated, this
work is my own oeuvre.
Savithri Galappathie
2018

viii
List of publications
Journal publications
• Savithri Galappathie, Enzo A. Palombo, Tiong Chia Yeo, Diana Lim Siok Ley, Chu
Lee Tu, François M. Malherbe and Peter J. Mahon, Comparative antimicrobial activity
of Southeast Asian plants used in Bornean folkloric medicine.Journal of Herbal
Medicine, 2014, 4 (2), 96-105
• Savithri Galappathie, David J. Edwards, Alysha G. Elliott, Matthew A. Cooper, Enzo
A. Palombo, Mark S. Butler and Peter J. Mahon, Antibacterial Nerol Cinnamates from
the Australian Plant Eremophila longifolia. Journal of Natural Products, 2017, 80 (4),
1178–1181

ix
Table of Contents
Abstract ............................................................................................................................ iii
Acknowledgements ........................................................................................................... vi
Declaration....................................................................................................................... vii
List of publications.......................................................................................................... viii
Table of Contents .............................................................................................................. ix
List of Figures ................................................................................................................. xiv
List of Tables .................................................................................................................. xvi
List of Abbreviations and Acronyms .............................................................................. xvii
Chapter 1 ........................................................................................................................... 1
1.1 Aims of the thesis ..................................................................................................... 2
1.2 Outcomes of the work undertaken in the throughout the study ................................. 3
1.3 Thesis Overview ....................................................................................................... 5
Chapter 2 ........................................................................................................................... 7
2.1 Plant medicines with antimicrobial activity .............................................................. 8
2.1.1 Ethnomedicinal significance of plants.................................................................8
2.1.2 Plants used for antibacterial medicines ...............................................................9
2.1.3 Plants used for antifungal medicines ................................................................. 11
2.1.4 Medicinal plants for the treatment of neurological and psychiatric disorders ..... 11
2.1.5 Plants for malaria therapy ................................................................................. 12
2.1.6 Plant medicine and acupuncture interrelated treatments .................................... 13
2.1.7 Plant medicine for cancer therapy ..................................................................... 13
2.2 Australian native plant collected from Byrock in New South Wales, Australia ........ 20
2.2.1 Description, distribution, ethnomedicinal and phytochemical identities of ........ 20
2.3 Southeast Asian plant collection from Sarawak, Province of Malaysia .................... 26
2.3.1 Description, distribution, ethnomedicinal and phytochemical identities of
Baccaurea lanceolata (Miq.) Müll.Arg ..................................................................... 26
2.3.2 Description, distribution, ethnomedicinal and phytochemical identities of
Fibraurea tinctoria Lour ........................................................................................... 29

x
2.3.3 Description, distribution, ethnomedicinal and phytochemical identities of
Goniothalamus tapisoides Mat Salleh ....................................................................... 32
2.3.4 Description, distribution, ethnomedicinal and phytochemical identities of
Goniothalamus velutinus Airy Shaw ......................................................................... 34
2.3.5 Description, distribution, ethnomedicinal and phytochemical identities of
Polyalthia hookeriana King ...................................................................................... 36
2.3.6 Description, distribution, ethnomedicinal and phytochemical identities of
Pyrenaria serrata Bl. var masocarpa (Korth) H. Keng .............................................. 37
2.4 Isolation and characterisation of bioactive compounds from plant materials. ........... 38
2.4.1 Extraction methods ........................................................................................... 39
2.4.2 Clean up and isolation methods ........................................................................ 42
2.4.3 Separation methods .......................................................................................... 44
2.4.4 Identification by spectroscopy methods ............................................................ 46
2.5 Conclusions ............................................................................................................ 48
Chapter 3 ......................................................................................................................... 50
3.1 Introduction ............................................................................................................ 51
3.2 Plants materials used in this study ........................................................................... 51
3.3 Methods used in this study ...................................................................................... 52
3.3.1 Preparation of Australian crude plant extract .................................................... 52
3.3.2 Preparation of the Southeast Asian plant extracts .............................................. 52
3.3.3 Bacterial strains and media ............................................................................... 53
3.3.4 Bioassays ......................................................................................................... 55
3.3.5 Separation techniques ....................................................................................... 56
3.3.6 Analysis techniques - Separation and identification .......................................... 60
3.4 Method development .............................................................................................. 64
3.4.1 Fractionation based on Solid Phase Extraction cartridges.................................. 64
3.4.2 Development of fractionation methods ............................................................. 65
3.4.3 Results and discussion ...................................................................................... 67

xi
3.5 Conclusions ............................................................................................................ 75
Chapter 4 ......................................................................................................................... 76
4.1 Introduction ............................................................................................................ 77
4.2 Plant collection ....................................................................................................... 77
4.2.1 Sample preparation ........................................................................................... 77
4.3 Extraction of leaves ................................................................................................ 77
4.3.1 Different extraction techniques ......................................................................... 77
4.4 Extraction efficiency analysis ................................................................................. 80
4.4.1 Assessment of antimicrobial activity ................................................................ 80
4.4.2 HPLC analysis.................................................................................................. 82
4.4.3 GC-MS analysis ............................................................................................... 82
4.5 Results and Discussion ........................................................................................... 82
4.5.1 Solvent optimisation ......................................................................................... 82
4.5.2 Maximising extraction yield using different extraction techniques .................... 86
4.6 Conclusions .......................................................................................................... 103
Chapter 5 ....................................................................................................................... 104
5.1 Introduction .......................................................................................................... 105
5.2 Extraction, isolation and characterisation .............................................................. 105
5.2.1 Fractionation of the E.longifolia plant extract ................................................. 105
5.2.2 GC-MS analysis ............................................................................................. 106
5.2.3 NMR Analysis................................................................................................ 106
5.3 Antimicrobial and antifungal assays ...................................................................... 106
5.3.1 Assessment of biological inhibitory activity of separated fractions ................. 106
5.4 Results and discussion .......................................................................................... 109
5.4.1 Primary fractionation ...................................................................................... 109
5.4.2 GC-MS analysis ............................................................................................. 111
5.4.3 Further separation, identification and characterisations of microbially active
compounds .............................................................................................................. 114
5.4.4 Thermal degradation experiments ................................................................... 121
5.5 Conclusion ............................................................................................................ 123

xii
Chapter 6 ....................................................................................................................... 124
Screening of ethnomedicinal Southeast Asian plants for antimicrobial and antifugal activities
124
6.1 Introduction .......................................................................................................... 125
6.2 Material and methods ............................................................................................ 126
6.2.1 Preparation of extracts .................................................................................... 126
6.2.2 Bacterial and fungal isolates and media used .................................................. 126
6.2.3 Antibacterial and antifungal assays ................................................................. 126
6.3 Results and discussion .......................................................................................... 126
6.3.1 Disc diffusion assay........................................................................................ 126
6.3.2 MIC and MBC/MFC determination for the selected extracts. .......................... 133
6.4 Conclusions .......................................................................................................... 137
Chapter 7 ....................................................................................................................... 138
7.1 Introduction .......................................................................................................... 139
7.2 Experimental ........................................................................................................ 139
7.2.1 Preparation of crude extract ............................................................................ 139
7.2.2 Primary fractionation by Solid Phase Extraction ............................................. 140
7.2.3 Secondary fractionation by Solid Phase Extraction ......................................... 140
7.2.4 Antimicrobial susceptibility tests .................................................................... 140
7.2.5 Chromatographic analysis .............................................................................. 141
7.3 Statistical Analysis................................................................................................ 142
7.4 Results and discussion .......................................................................................... 142
7.4.1 Primary fractionation ...................................................................................... 142
7.4.2 Secondary fractionation .................................................................................. 144
7.4.3 Compound identification and verification ....................................................... 146
7.5 The presence of tartaric acid in other plants. ......................................................... 152
7.6 Conclusions .......................................................................................................... 153
Chapter 8 ....................................................................................................................... 154
8.1 Summary of conclusions and further directions ..................................................... 155
8.2 Potential for future work ....................................................................................... 157
References ..................................................................................................................... 160

xiii
Appendix ....................................................................................................................... 173
xiv
List of Figures
Figure 1: Chemical structure of Quinine .............................................................................. 13 Figure 2: Catharanthus roseus G Don ................................................................................. 15 Figure 3: Chemical structure of Vinblastine (VBL) ............................................................. 16 Figure 4: Pacific Yew (Taxus brevifolia) bark ..................................................................... 17 Figure 5: Chemical structure of Paclitaxel (Taxol)............................................................... 17 Figure 6: Chemical structure of Camptothecin ..................................................................... 18 Figure 7: Camptotheca acuminate ....................................................................................... 18 Figure 8: Chemical structure of Combretastatin A ............................................................... 19 Figure 9: E. longifolia - Weeping emu bush ........................................................................ 21 Figure 10: Branches with leaves and flowers of E. longifolia ............................................... 21 Figure 11: Distribution of E. longifolia in Australia ............................................................. 22 Figure 12: Chemical structure of compounds isolated from E. longifolia [102]....................... 25 Figure 13: B. lanceolata ...................................................................................................... 27 Figure 14: F. tinctoria leaves and fruit ................................................................................ 30 Figure 15: F. tinctoria vine ................................................................................................. 30 Figure 16: G. tapisoides K. Mat-Salleh, from Lambir Hills National Park ........................... 32 Figure 17: Chemical structures of the compounds identified from G. tapisoides [119]............ 34 Figure 18: G. velutinus Airy Shaw ...................................................................................... 35 Figure 19: P. hookeriana branch ......................................................................................... 36 Figure 20: P. serrata branch with fruits ............................................................................... 38 Figure 21: Soxhlet extraction [141] ........................................................................................ 41 Figure 22: Supercritical fluid extraction (SFE) apparatus [142] .............................................. 42 Figure 23: Solid Phase Extraction method ........................................................................... 43 Figure 24: Standard compounds used to characterise the micro-scale fractionation .............. 60 Figure 25: Analytical HPLC chromatogram of the standard mixture of compounds. Peaks: 1. Uracil, 2. Phenol, 3. Acetophenone, 4. Anisole, 5. Toluene, 6. Biphenyl and 7. Pyrene ....... 67 Figure 26: HPLC chromatogram of SPE eluted fractions from the standard test mixture...... 68 Figure 27: Components isolated in each fraction for the two series of eluting solvents using SPE ..................................................................................................................................... 69 Figure 28: SPE results for the standard test mixture ............................................................. 70 Figure 29: Secondary fractionation of the standard test mixture with 40% acetonitrile/Milli-Q water ................................................................................................................................... 72 Figure 30: The analytical HPLC chromatogram of crude plant extract from E. longifolia .... 73 Figure 31: Analytical HPLC chromatogram of SPE eluted E. longifolia fractions ................ 74 Figure 32: Flow chart of extractions and microbial assessment ............................................ 78 Figure 33: HPLC chromatograms with CH3CN for E. longifolia leaves extraction at (A to C) different temperatures for ASE and (D) the conventional extraction method ........................ 88 Figure 34: HPLC chromatograms with EtOH for E. longifolia leaves extraction at (A to C) different temperatures for ASE and (D) the conventional extraction method ........................ 89 Figure 35: GC-MS chromatograms with CH3CN for E. longifolia leaves extraction at (A to C) different temperatures for ASE and (D) the conventional extraction method ................... 90 Figure 36: GC-MS chromatograms with EtOH for E. longifolia leaves extraction at (A to C) different temperatures for ASE and (D) the conventional extraction method ........................ 91

xv
Figure 37: Examples for antibacterial activity using DDA for different organisms (S. enterica and S. aureus) and a range of extracts. SA refers to the CH3CN extracts and AA are the EtOH extracts................................................................................................................................ 92 Figure 38: HPLC chromatograms from the conventional extraction of E. longifolia leaves using CH3CN with various times represented in A to F ....................................................... 99 Figure 39: GC-MS chromatograms from the conventional extraction of E. longifolia leaves using CH3CN with various times represented in A to F ..................................................... 100 Figure 40: Bioactivity against B. cereus from the Series 1 fractions in DDA ..................... 110 Figure 41: Bioactivity against B. cereus from the Series 2 fractions in DDA ..................... 110 Figure 42: GC-MS chromatogram of an active fraction of E. longifolia against B. cereus .. 112 Figure 43: GC-MS chromatogram of non-active fraction of E. longifolia against B. cereus. In this figure, red star indicates 2-methoxy-4-vinyl phenol .................................................... 112 Figure 44: Chemical structure of 2-methoxy-4-vinyl phenol .............................................. 112 Figure 45: GC-MS chromatogram of 2-methoxy-4-vinyl phenol ....................................... 113 Figure 46: Disc diffusion assay of 2-methoxy-4-vinylphenol against B. cereus .................. 113 Figure 47: Structures of (1) neryl ferulate and (2) neryl p-cinnamate. ................................ 117 Figure 48: Proposed autoxidation mechanism of neryl ferulate (1) .................................... 118 Figure 49: HPLC chromatograms of the thermal degradation experiment for an active fraction from E. longifolia .............................................................................................................. 122 Figure 50: Chemical structure of (1) neryl ferulate and with the thermal degradation product 2-methoxy-4 vinyl phenol circled in green ........................................................................ 122 Figure 51: (A) Disc diffusion assay for C. albicans clinical isolate (SC5314) (B) Disk diffusion assay for C. albicans laboratory isolate (DAY286) ............................................. 133 Figure 52: Primary SPE fractionation and inhibitory activity against B. cereus .................. 142 Figure 53: Disc diffusion assay results showing antimicrobial activity of the Milli-Q water fraction with various bacterial cultures .............................................................................. 143 Figure 54: Antimicrobial activity of secondary fractions (Fractions 1 to 7) of B. lanceolata against S. aureus. Fraction 8 is the positive control (Tetracycline) and Fraction 9 is the negative control (Milli-Q water) in disc diffusion assay..................................................... 144 Figure 55: Relative activities of secondary fractions (Fraction 1-7) of B. lanceolata against S. aureus. The white bars represent relative MIC and those in grey represent MBC............... 145 Figure 56. CFU values against E. coli for active Fractions 1 to 5 with 6 being the negative control............................................................................................................................... 146 Figure 57: Direct GC-MS analysis of the Milli-Q water fractions (1 to 6) with dimethyl tartrate eluting at 15.6 minutes .......................................................................................... 147 Figure 58: Derivatised GC-MS analysis of the Milli-Q water fractions (1 to 6) .................. 148 Figure 59: Chemical structures of the compounds with Spearman’s rank correlation coefficients greater than 0.716. (1) Dimethyl 2, 3-bis[(trimethylsilyl)oxy]succinate, (2) Arabino-hexos-2-ulose, 3, 4, 5, 6-tetrakis-o-(trimethylsilyl)-, bis(dimethyl acetal) and (3) Bis(trimethylsilyl) 2,3-bis[(trimethylsilyl)oxy]succinate .................................................... 150

xvi
List of Tables
Table 1: The most frequently occurring types of infections caused by the test pathogens ..... 54 Table 2: Solvent mixtures of acetonitrile and Milli-Q water (% v/v) used for fractionation in both series ........................................................................................................................... 58 Table 3: Mass of standard compounds used in the test mixture ............................................ 66 Table 4: Minimum inhibitory, bactericidal and fungal concentrations for E. longifolia leaves extracted using different solvents and hot water decoction extraction against various organisms ............................................................................................................................ 84 Table 5: Yield extraction efficiency for different extraction methods................................... 87 Table 6: Antibacterial activity for different organism from various extracts obtained using DDA ................................................................................................................................... 93 Table 7: Minimum inhibitory, bactericidal, and fungicidal concentrations of E. longifolia leaf extracts using various extraction conditions ......................................................................... 95 Table 8: Minimum inhibitory and bactericidal concentrations of E. longifolia leaf extracts using various extraction conditions...................................................................................... 97 Table 9: Minimum inhibitory, bactericidal and fungicidal concentrations of E. longifolia leaf extracts using different times with conventional CH3CN extraction. .................................. 102 Table 10: DDA bioactivity against B. cereus of CH3CN/H2O from Series 1 and 2 fractions ......................................................................................................................................... 111 Table 11: MIC of the crude extract and active fractions against a panel of Gram-positive and Gram-negative bacteria. .................................................................................................... 116 Table 12: Chemical details for the structures in Figure 47 ................................................. 117 Table 13: NMR spectroscopic data (600 MHz, CDCl3) for (1) neryl ferulate and (2) neryl p-cinnamate .......................................................................................................................... 119 Table 14: Biological activity of (1) Neryl Ferulate and (2) Neryl p-Cinnamate against a panel of bacteria, fungi and cell lines .......................................................................................... 121 Table 15: Summary of DDA results for the Sarawak extracts ............................................ 128 Table 16: DDA antimicrobial screening of selected plant extracts ..................................... 132 Table 17: MIC and MBC/MFC values for selected plant extracts ...................................... 134 Table 18: Spearman’s rank correlation coefficients for chromatographic peak area versus MBC for each fraction....................................................................................................... 149 Table 19: Compounds identified in the most active fractions from the secondary fractionation stage using derivatised GC-MS analysis ............................................................................ 150

xvii
List of Abbreviations and Acronyms
ASE Accelerated solvent extractor
BHIA Brain heart infusion agar
CFU Colony forming units
CH3CN Acetonitrile
CMRNG Chromosomally-mediated resistant Neisseria gonorrheae
DDA Disc diffusion assay
DMSO Dimethyl sulfoxide
EtOH Ethanol
GC-MS Gas chromatography–mass spectrometry
HPLC High performance liquid chromatography
HRMS High-resolution mass spectrometry
IC50 50% inhibitory concentration
LC-MS Liquid chromatography–mass spectrometry
LLE Liquid liquid extraction
MBC Minimum bactericidal concentration
MDR Multi-drug resistant
MeOH Methanol
MFC Minimum fungal inhibitory concentration
MHA Mueller-Hinton agar
MIC Minimum inhibitory concentration
MRO Multi-resistant organisms
NA Nutrient agar
NB Nutrient broth
NMR Nuclear magnetic resonance spectroscopy
PDA Potato dextrose agar
PDB Potato dextrose broth
SBC Sarawak Biodiversity Centre

xviii
SPE Solid phase extraction
WHO World Health Organisation

1
Chapter 1
Introduction

2
1.1 Aims of the thesis
Bacterial infections are among the most dominant illnesses in the world. The alarming spread
of drug resistant bacteria and limited access to anti-infective drugs in some populations
emphasise the importance of discovering new antibacterial and antifungal compounds. The
richest sources of natural compounds to defend against such bacterial pathogens are plants and
herbal extracts that have had their side effects empirically tested all the way through their
history of human use as bush medicines.
One aim of this research was thus to identify the antimicrobial active plants from a series of
plant extracts provided by the Sarawak Biodiversity Centre, in Malaysia. These plants were
collected as part of an intensive ethnomedicinal knowledge documentation program of plants
used by the local indigenous peoples. Based on the documented evidence of medicinal benefits,
fifty plant extracts were provided for the further antibacterial and antifungal analysis. The
extracts were tested against four Gram-negative bacteria: Escherichia coli; Pseudomonas
aeruginosa; Salmonella enterica serovar Typhimurium and Moraxella catarrhalis, three
Gram-positive bacteria: Bacillus cereus; Staphylococcus aureus and Streptococcus pyogenes
and one fungus Candida albicans.
A further aim of this research was to identify the bioactive compounds from the active plants.
Among all the plants that were tested, Baccaurea lanceolata was selected for further analysis
of the bioactive compounds detected in the preliminary analysis conducted on the crude
extracts. The crude extract separation was performed using bioguided primary and secondary
fractionation based on the solid phase extraction (SPE) format. This method is useful to
separate the complex mixtures and concentrate them accordingly. The active compounds were
identified using Gas Chromatography–Mass Spectrometry (GC-MS) and Liquid

3
Chromatography–Mass Spectrometry (LC-MS) with the resulting data statistically analysed
based on correlation methods.
The presented research also included a study of the Australian native plant, Eremophila
longifolia F. Muell, as this plant is widely used in Aboriginal communities as a bush medicine.
The plant is commonly known as Emu bush, Berrigan emu bush, Weeping emu bush, Native
plum, Juniper tree and Dog wood. In this case, plant material was available and a detailed
extraction study was performed, which included optimising the extraction solvents and
procedure. Ethanol, hot water and acetonitrile were used as extraction solvents and the
optimization was based on bioguided inhibitory assays using bacterial cultures. Different
extraction methods and soaking times were also used as variables. After applying the optimised
extraction method, the extract was processed using primary and secondary fractionation. The
unknown bioactive compounds were identified using GC-MS, LC-MS and Nuclear Magnetic
Resonance (NMR) spectroscopic analysis.
1.2 Outcomes of the work undertaken throughout this study
• Identification of plants that can inhibit microbial activity associated with infective
disease. From the plants that were collected from Sarawak, Malaysia, six plant extracts
out of fifty were identified after thorough bacterial and fungal screening. Of the six
active extracts, one was chosen for further analysis.
• The Australian plant, Eremophila longifolia, and Baccaurea lanceolata from Malaysia
were subjected to further chemical analysis. Each plant extract has undergone extensive
bioguided SPE fractionation.
• The active compound discovery for B. lanceolata was completed based on the
Spearman statistical correlation approach. Initially, bioactive fractions were identified

4
and those fractions were then analysed using GC-MS and LC-MS to determine
composition of the mixtures. The entire collection of data was subjected to statistical
analysis to identify the compound that is responsible for the bioactivity.
• E. longifolia active compound isolation and chemical structure elucidation was
performed in collaboration with the Institute of Molecular Biology at the University of
Queensland. The chemical identification was completed using a range of instrumental
analysis techniques including LC-MS and NMR.

5
1.3 Thesis Overview
Chapter 1 introduces the primary aims of the study
Chapter 2 offers an inclusive literature review on traditional medicine and its healing abilities.
It describes how plant-based remedies can fulfill the demands of Western medicine and how
effective they might be for some known diseases. Subsequently, in this chapter, the plants,
Baccaurea lanceolata (Miq.) Müll. Arg., Fibraurea tinctoria Lour, Goniothalamus tapisoides
Mat Salleh, Goniothalamus velutinus Airy Shaw, Polyalthia hookeriana King and Pyrenaria
serrata Bl. var masocarpa (Korth) H. Keng used in this research are introduced and more
comprehensively detailed. An overview of bioactive compounds produced by the plants has
been provided.
Chapter 3 discusses the materials and methods used in this study. A fractionation method was
developed using Solid Phase Extraction for a standard mixture of compounds and separation
was completed according to the log P values for each compound. It was then adapted to actual
plant extracts and was demonstrated to be suitable for the predictive separation of complex
mixtures.
Chapter 4 introduces the Australian plant E. longifolia, the extraction of the bioactive
compounds and testing for their antibacterial and antifungal activities.
Chapter 5 discusses the separation, isolation and characterisation of bioactive compounds in E.
longifolia that are responsible for inhibiting the growth of bacteria.
Chapter 6 introduces the Southeast Asian plants and describes their antibacterial and antifungal
inhibitory assays. Out of fifty plant extracts tested, six plants were discovered that had
antibacterial ability.
Chapter 7 focuses on primary and secondary SPE fractionation applied to the Asian plant B.
lanceolata with subsequent mass spectrometry analysis followed by statistical analysis.

6
Chapter 8 concludes the thesis with a brief summary of research outcomes and suggests further
work.

7
Chapter 2
Literature review

8
2.1 Plant medicines with antimicrobial activity
2.1.1 Ethnomedicinal significance of plants
Plants have been used as the main source of medicinal remedies for more than 11,000 years
and 70% of the worldwide population still relies on some form of traditional herbal medicine
[1-2]. According to the World Health Organisation (WHO) statistics for developing countries,
more than 80% of people rely on traditional medicine as their main source of medicine for
infectious diseases [3]. More recently, during the World Wars of the 20th century most of the
world’s population depended on herbal medicine due to the disrupted distribution of
pharmaceutical drugs and lack of other medicines [4]. As an example, garlic (Allium sativum)
was used as an antiseptic to prevent numerous diseases [5].
Furthermore, plant-based (phytotherapeutic) medicinal treatments can help the body to heal
itself. Most plants are used as diuretics and diaphoretics, antibacterial agents, as blood and
bowel cleansers, and as a kidney stimulator [6]. Additionally, these plants contain a range of
secondary metabolites that can help to defend against many bacterial and fungal infections.
This also establishes the importance of plant-derived medicines for use in modern times as well
[7].
Herbs have been widely employed in traditional medicine, which includes Chinese and
Ayurvedic medicine [8], and some of these herbal medicines are used in different parts of the
world along with more recently developed pharmaceutical medicines. The practice of plant
medicine is widespread in developing countries especially in rural areas and is a great deal
more accessible and affordable than expensive modern pharmaceutical drugs. It has been
revealed that 80% of the population in African and Asian countries are still using herbal
medicine as their main medicinal source for common diseases such as indigestions related

9
diseases including diarrhea , eye infections and skin infections [9]. Even in the modern times,
herbal medications are more economical compared to pharmaceutical medicines and more
readily accepted on the basis that they are “natural”. Nevertheless, the effectiveness of herbal
plants can change depending upon the seasons or the month collected, part of the plant used,
geographical location, altitude and the type of the soil where they grow. Therefore, extensive
indigenous knowledge that has evolved over many generations is an important factor when
employing medical treatments based on plants.
2.1.2 Plants used for antibacterial medicines
Bacterial infections are among the most detrimental global health conditions. According to the
WHO, the major cause of death in the developing countries from infectious diseases is due to
bacterial infections. The proportion of deaths was counted as 50% and this figure is
comparatively high compared to other subjective death rates [10]. These deaths are related to
1415 species of microbial agents, including numerous viruses, bacteria, fungi, protozoa and
helminths [11]. The alarming spread of drug resistant bacteria and limited access to many drugs
to treat bacterial infections in some populations emphasise the importance to discover new
antimicrobial medicines [12]. The richest source of natural compounds to defend against
pathogens comes from plants and it is generally accepted that plant-derived drugs are less toxic,
safer and more environmentally friendly. Also, they are generally more cost effective than
synthetically manufactured drugs [13-14] .
After the discovery of penicillin by Fleming in the early 1930’s [15], antibiotics almost entirely
controlled the spread and destruction of bacterial infections globally with death rates from
bacterial related infectious diseases dropping significantly [16]. With the development of many
other new antibiotics and the subsequent increase in the production and usage of new

10
antibiotics, some bacteria have evolved to evade the antimicrobial action by adapting diverse
mechanisms against antibiotics [17]. It is estimated that pharmaceutical companies worldwide,
manufacture about 100,000 tons of antibiotics annually to cure the bacterial and fungal related
infections among the world’s population [18]. Particularly in developing nations, most of the
antibiotic agents are not regulated as prescription medication and they are readily available as
over-the-counter medicines. The ease of accessing antibiotics has become the core factor for
the rise of antibiotic resilient bacteria, which has been growing continuously in the past decades
and has become a global health issue in recent years [19].
Nevertheless, a cumulative consequence of multiple genetic mutations has given bacteria the
capacity to become resistant and even proliferate in the presence of antibiotics initially used
for the handling and curing of pathogenic diseases [20]. For example, Staphylococcus aureus
(‘golden staph’) and Chromosomally-Mediated Resistant Neisseria gonorrhoeae (CMRNG
causes gonorrhoea) are, at present, virtually resistant to benzylpenicillin (penicillin G) [21].
Previously, these bacterial infections were readily cured by using generic penicillin [22] Certain
bacterial species are no longer susceptible to antibiotics and are thus identified as multi-drug
resistant organisms (MROs). Most of these bacteria have developed resistance against more
frequently used antibiotics like trimethoprim [23], amoxicillin [24], methicillin [25], penicillin [26],
tetracycline [27], erythromycin and vancomycin [28]. Multi-drug resistant Staphylococcus aureus
(MDR-SA), vancomycin resistant Enterococcus (VRE) [29] and multi drug resistant
Mycobacterium tuberculosis (MDR-TB) [30] are the most important examples of MROs.
Subsequently, the MROs are also resistant to most commercially available disinfectants and
they can be particularly problematic in the development of hospital-acquired infections [31].
Furthermore, they can be a major cause of the secondary infections for hospitalised patients
with immune deficiency disorders [32].

11
The WHO is concerned that increasingly, multi resistant bacteria and related infections are
elevating rapidly due to insufficient availability of newly synthesised antibiotics. In order to
overcome the problem of antimicrobial drug resistance, attention has recently turned to natural
products as a potential source of new antimicrobial drugs [33].
2.1.3 Plants used for antifungal medicines
According to many recent studies, plant extracts can be applied to prevent skin diseases caused
by fungi [34]. During the period of 1995-2012, there were 31 plant species identified as effective
for skin disorders ranging from itching to skin cancer. Allium sativum (garlic) showed
significant activity against Malassezia furfur (25 strains) which are liable for causing several
types of skin infections, including seborrheic dermatitis, tinea versicolor and pityrosporum
folliculitis [35]. It is also active against two different types of Candida albicans [23] and Candida
sp.[17], which are mostly responsible for oral candidiasis, oropharyngeal candidiasis or thrush
and, when it affects the genital area of females it is known as vulvovaginal yeast infection [36-
37]. Ethanol, ethyl acetate and aqueous extracts of Neem leaves showed inhibitory activity
against different Aspergillus species that cause serious lung infections for
immunocompromised patients [38], C. albicans and Microsporum gypseum [39] can be
responsible for fungal keratitis [40]. The leaves of Cassia fistula Linn have been identified as a
potential antipathogenic agent for Aspergillus niger, Aspergillus clavatus and C. albicans [41].
2.1.4 Medicinal plants for the treatment of neurological and psychiatric disorders
A recent report has revealed some native Iranian plants exhibited an influence on neurological
and psychiatric disorders. According to the study, there are as many as 10 different plant
families involved with the Family Astreaceae plant species showing the greatest effectiveness
with the seed decoction being used as a tranquilizer [42].

12
Controversial arguments related to the medicinal use of marijuana continues all around the
world including Australia. A recent Colombian clinical review suggested that marijuana could
be useful to handle patients with chronic pain and other psychiatric problems. A further study
revealed it could be used as an alternative medication for patients with chronic and neuropathic
pain, and spasticity sufferers due to multiple sclerosis. In the United States, the US Food and
Drug Administration approved administering medical marijuana to cancer patients after
chemotherapy treatments. This decision was granted on the basis of high-quality evidence that
proved cannabis can be used as an alternative medicine to treat nausea and regurgitation [43].
Moreover, an extensive review indicated that medicinal marijuana can be beneficial especially
in psychological disorders like Alzheimer’s disease, epilepsy, seizures and post-traumatic
stress disorders (PTSD) [44].
2.1.5 Plants for malaria therapy
Malaria is one of the most detrimental diseases in developing countries and in recent years
there were reports of malaria epidemics in 106 countries. In 2010, as many as 265 million
humans suffered from this primeval disease with a significant number of deaths being recorded
[45]. Effective antimalarial drugs containing amino quinoline and quinine are the best available
in the market to treat this mosquito related infection and associated side effects that include
arm and leg cramps related to vascular spasms, internal haemorrhoids [46] and irregular varicose
veins [47]. Quinine (Figure 1) is a cinchona alkaloid obtained from the bark of Cinchona
calisaya originally from South America [48] including regions of Brazil, Peru, Bolivia and Costa
Rica [49]. In the 1600s, native Peruvian used the bark extract from the trees as herbal medicine
to cure fever and then in the 1930s, European governments planted cinchona plant species in
their tropical colonies to meet the medicinal requirements but because of the high demand,

13
more recently synthetic quinine has been used as an antimalarial drug. In 1944, a New York
Times headline stated that finding quinine was the greatest scientific accomplishment of the
century [50].
Figure 1: Chemical structure of Quinine
2.1.6 Plant medicine and acupuncture interrelated treatments
Acupuncture and ancient Chinese herbal formulation mixtures showed promising improved
results for patients affected with seasonal allergic rhinitis (AR) [51]. Additionally, in research
based on the Korean herbal medicine, moxibustion, and acupuncture, it was suggested that this
complex mixture of the treatments illustrated effectiveness on female infertility [52]. Obesity
[53], breast cancer [54] and insomnia-related depression [55] were also treated by acupuncture-
based herbal medicine. According to published research in 2015, it was revealed that this herbal
concept can be useful for female patients with bacterial vaginosis [56].
2.1.7 Plant medicine for cancer therapy
The Cancer Council of Australia stated that there are 130,470 new cancer patients diagnosed
in every year and estimate that will this figure could reach up to 150,000 in 2020 [57].
Furthermore, according to the American Cancer Society, cancer kills approximately 3.5 million
individuals annually [58]. Malignant neoplastic disease is the major health related problem in
the modern world and it can affect any part of the physical structure of the human body [59]
OH
ON
N
CH2
CH3

14
with the most common cancers being skin, prostate, breast, bowel and lung [60]. Cancer can be
caused by many different factors that include cigarette smoking, lifestyle factors like diet and
activity, and specific virus infections [61]. Some 15-20% of human cancers occur due to long
term untreated virus infections, which include human Papilloma virus (HR-HPV) that is
responsible for oropharyngeal cancers [62] and cervical carcinoma [63]. Herpes-simplex virus,
also known as Kaposi’s sarcoma, (HSV-2) is a cofactor that can be conjugated with HR-HPV
and increase the risk of cervical cancer for females [64].
Cancer patient often require chemotherapy depending on the aggressiveness of the cancer.
Common side effects of chemotherapy include headache, skin rashes, nausea or vomiting,
somnolence and abdominal pain. These side effects can result in high blood sugar and type 2
diabetes, as well. Some cancers adapt self-defense mechanisms to become resistant to
chemotherapy related drugs [65]. This is the most vulnerable situation facing the new era of
cancer treatments and therefore there is increasing demand for new cancer related drugs.
Consequently, many cancer sufferers seek different solutions for this fatal illness based on
alternative or complementary medicines and it has been reported that more than 60% of cancer
patients use vitamin and herbal-based therapies [66].
Natural products play a major role in the development of novel drugs that target anticancer and
antiinfectious agents. Herbal medicine or alternative medication can be very useful with
patients with cancer and there have been reports of significant improvement of cancer related
agonising pain and pain regularity [67]. Past literature has described some poisonous Chinese
herbal medicines that are also used as cancer remedies. Evidence suggested that the
combination of chemotherapeutic agents and these herbs can reduce the systemic toxicity
15
effects from conventional Western medicines and can help to maintain high immunity levels
based on the theory the author called "fighting fire with fire" [68].
Recently, several plant-based compounds have been successfully employed in the treatment of
malignant neoplastic disease. The fruit extract of a plant from Indonesia, Phaleria macrocarpa
(Scheff), showed antioxidant properties and after the phytochemical isolation and
identification, it was confirmed that the gallic acid was the active compound. It resulted in
significant inhibitory cell proliferation activity against cancer cell lines (esophageal cancer cell
TE-2) compared to non-cancerous (CHEK-1) cell lines [69].
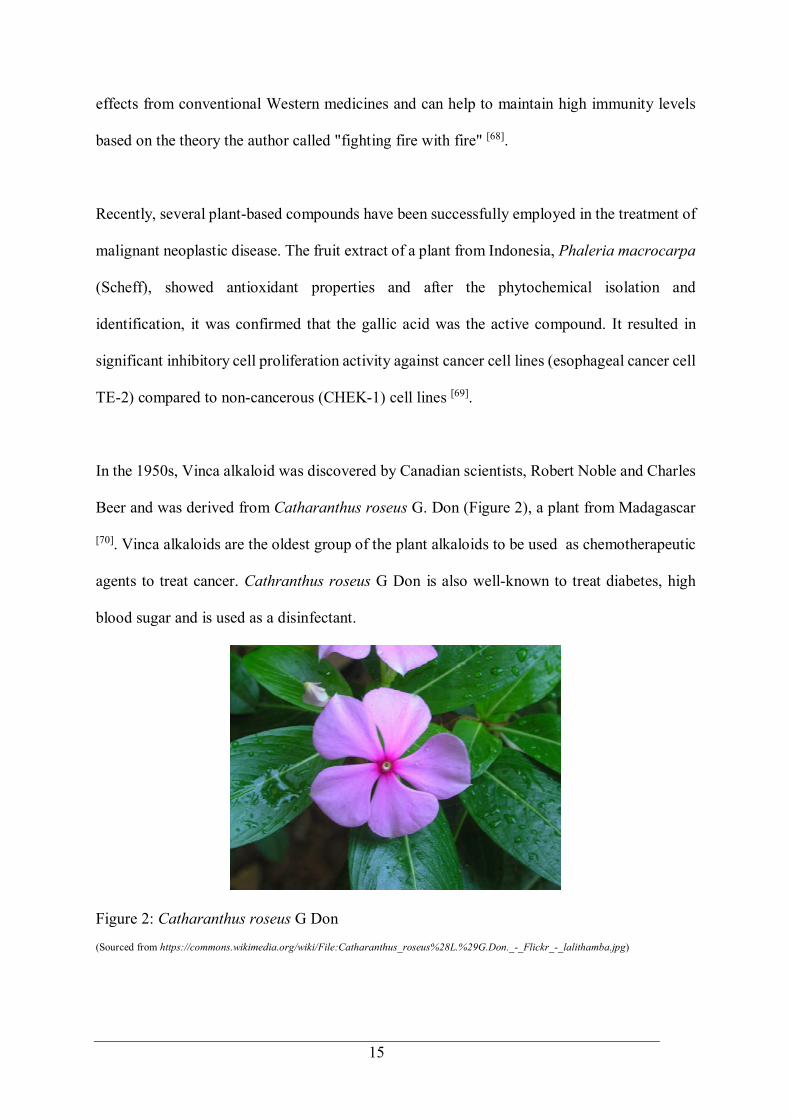
In the 1950s, Vinca alkaloid was discovered by Canadian scientists, Robert Noble and Charles
Beer and was derived from Catharanthus roseus G. Don (Figure 2), a plant from Madagascar
[70]. Vinca alkaloids are the oldest group of the plant alkaloids to be used as chemotherapeutic
agents to treat cancer. Cathranthus roseus G Don is also well-known to treat diabetes, high
blood sugar and is used as a disinfectant.
Figure 2: Catharanthus roseus G Don
(Sourced from https://commons.wikimedia.org/wiki/File:Catharanthus_roseus%28L.%29G.Don._-_Flickr_-_lalithamba.jpg)

16
There are four major Vinca alkaloids used as medicine: Vinblastine (VBL) (Figure 3),
vinorelbine (VRL), vincristine (VCR) and vindesine (VDS). All these alkaloids are approved
in the United States of America to treat patients with cancer related infections. Both VBL and
VCR are chemicals initially extracted from plants with VRL and VDS being synthetically
developed as vinca alkaloids molecules. Essentially, VBL and VCR are used for treating most
of cancers including Hodgkin lymphoma, non-Hodgkin’s lymphoma, breast, lung, brain, neck
and bladder cancers [71].
Figure 3: Chemical structure of Vinblastine (VBL)
The discovery of Paclitaxel (Taxol) from the bark of Taxus brevifolia Nutt (Taxaceae), Pacific
yew (Figure 4) is another example of using natural products for new drug discovery [72]. This
conifer tree is native to the Pacific North West of North America [73].

17
Figure 4: Pacific Yew (Taxus brevifolia) bark
(Sourced from: http://arcadianabe.blogspot.com.au/2011_12_01_archive.html)
Paclitaxel (Figure 5) is a lifesaving compound discovered in 1960’s by two American
scientists, Mansukh Wani and Monroe Wall. Taxol successfully treats cancer by inhibiting the
division of cancer cells and it is used to treat breast cancer, ovarian cancer, non-small lung
cancer, pancreatic cancer and AIDS related Kaposi’s sarcoma [74].
Figure 5: Chemical structure of Paclitaxel (Taxol)

18
Camptothecin (Figure 6) is a pentacyclic quinolone alkaloid derived from Camptotheca
acuminate (Figure 7) [75]. Topotecan is a chemotherapeutic agent that is semi-synthesised from
camptochecin that can be used to treat patients with ovarian, lung cancer and numerous other
cancers. This became the first oral topoisomerase I inhibitor and it is trading pharmaceutically
as Hycamtin [76-77] .
Figure 6: Chemical structure of Camptothecin
Figure 7: Camptotheca acuminate
(Sourced from: https://commons.wikimedia.org/wiki/File:Camptotheca_acuminata_- Chengdu_Botanical_Garden_-_Chengdu,_China_-_DSC03562.JPG)

19
Combretastatins (Figure 8) are natural phenols that are derived from South African native
plants, Combertum caffrum Kuntze (Combretaceae) [78]. This molecule is mainly deposited in
the bark of the tree and exhibits some effect on patients suffering from colon, lung and
leukaemia cancers. The non-polar and water-insoluble properties of this molecule have limited
its use as a drug and so Combretastatin A-4, which is a more polar molecule, was developed
[79]. This compound inhibits the development of blood cells within the tumor and mainly
disrupts the mitosis of the malignant neoplastic disease cells. Aside from all those positives,
this molecule is regarded as the most cytotoxic molecule derived from plants [66].
Figure 8: Chemical structure of Combretastatin A
Globally, there is a significant number of plant species that could be used for medicinal
purposes, however, phytochemical analysis has only been completed on relatively few plant
species [80]. In recent years, the exploration of plants has rapidly developed due to the use of
modern phytochemical techniques and it has been found that there are vast quantities of
chemicals that are associated with biosynthesis and metabolism pathways. Researchers have
developed techniques that are needed to separate, purify and perform phytochemical analysis
on the plant’s secondary metabolites but this has limitations due to the variety and structural
complexity of these compounds. A survey of the literature indicates that these secondary
metabolites are comprised of hundreds of unknown chemical structures. Furthermore, these
previous studies have found that there is a significant number of therapeutic drugs also derived

20
from plants [81] and some of the naturally occurring herbal products have similar active
ingredients as synthetically manufactured pharmaceutical drugs.
Often, the natural molecules have issues due to low water solubility and exhibit high
cytotoxcity effects on mammalian cells [66]. This requires pharmaceutical companies to
derivatise and modified these molecules to be compatible for human use without reducing their
bioactivity. Further research is required into the discovery of natural products to develop more
effective drugs to cure cancer related infections and microbial infectious diseases.
2.2 Australian native plant collected from Byrock in New South Wales, Australia
2.2.1 Description, distribution, ethnomedicinal and phytochemical identities of
Eremophila longifolia F. Muell
Eremophila is a significantly large genus and contains over 260 plant species from the family
Scrophulariaceae. This genus is commonly known in Australian indigenous communities as
Emu bush, Poverty bush and Fuchsia bush [81]. It is endemic to the Australian Continent [82] and
is scattered across all the states of Australia. It is primarily located in semi-arid, arid or desert
areas and it is absent from the wetter coastal belts along eastern Australia and southwestern
Western Australia [83]. Plants are usually found as small to medium shrubs although a few
species may be large bushes or small trees [84]. The name Eremophila is derived from Greek
and translates as “lonely places, desert” and “to love” [85].
2.2.1.1 Description of E. longifolia
E. longifolia is a desert solitude loving plant with long leaves and brightly coloured flowers
(Figures 9 and 10 ) [86]. Indigenous Australian people called it “berrigan” and is commonly

21
known as the weeping emu bush [87]. This plant is not considered as endangered based on its
conservation status [86].
Figure 9: E. longifolia - Weeping emu bush (Sourced from: http://upload.wikimedia.org/wikipedia/commons/3/33/E.longifolia_shrub.jpg)
Figure 10: Branches with leaves and flowers of E. longifolia
(Sourced from: http://upload.wikimedia.org/wikipedia/commons/3/3d/E.longifolia.jpg)
This plant is an evergreen with foliage all year round and is a rounded shrub or small tree that
grows to a height of about 4-8 m but is often much smaller [86]. It is not unusual to see this tree
grow in small clusters, as shown in Figure 9, as normally it surrounds the mother plant which

22
may have been grown from seeds or from root suckers [88]. The leaves of this plant are linear
shaped and up to 200 mm long and 4-7 mm wide. The leaf tip has a hooked or bent point and
is greyish green (dull green) in colour, it is mostly covered with fine hairs (this is an adaptation
to dry weather) [89]. Tree branches have droopy foliage [90] and the flowers arise in the leaf axils.
As displayed in Figure 10, the flowers are about 25-30 mm long with a tubular shape, have
short stalks of 4-11 mm in length and the colour can vary from pinkish to brick red with spots
on the inside [91].
2.2.1.2 Distribution of E. longifolia
E. longifolia is native to Australia and is predominantly distributed in semi-arid regions of all
the mainland states except for the wetter coastal areas in eastern and southwestern Australia
(Figure 11). This species rarely grows in the Northern Territory [90]. Even though it may grow
in dry climates, it has also been effectively cultivated in warm temperate areas. It also can be
seen in open, sunny areas with decent water drainage and can be tolerant of at least moderate
frost [92].
Figure 11: Distribution of E. longifolia in Australia
(Sourced from: http://www.florabank.org.au/lucid/key/species%20navigator/media/html/Eremophila_longifolia.htm)

23
2.2.1.3 Ethnomedicinal significance of E. longifolia
Australian indigenous communities have an extensive amount of understanding and knowledge
of the edible and medicinal properties of many different plant species, which are established in
the outback of Australia, and E. longifolia is considered as a prominent medicinal plant [93].
Traditional knowledge is playing a significant role in the sourcing, harvesting and preparation
of these plants for edible or medicinal purposes.
The knowledge of medicinal plants has been passed from generation to generation but this
pattern is being disrupted due to modernisation. A recent study revealed that only elders know
how to use these medicinal plants appropriately and this knowledge is still relied on for herbal
treatment tailored to the local habitat where they live [94]. The research revealed that most of
the bush medicines are derived from common plants that could be easily accessed, which is
convenient for a nomadic lifestyle as it reduces the size of any medicine kit that needs to be
carried.
The plant can be prepared as medicine in many different ways. Leafy branches can be smoked
over a fire with the steam that is produced being inhaled. As an aromatherapy, sprigs of
aromatic plant leaves are crushed and this can then be inhaled, inserted into the nasal septum
or put in the pillow that the patient would sleep on. In addition, an infusion can be prepared by
using pounded bark and leaves that are soaked in water for a few days; this was then taken
orally or used for bathing. Sometimes, an ointment would be prepared by using finely crushed
leaves, seeds, fruit pulp mixed with animal fat for external treatments as a paste to be rubbed
over the skin [95]. These preparations were frequently used as medicine to cure common colds,
fever, sores, wounds, headaches, scabies and common infections as listed in Table A1 of the
Appendix [96].

24
2.2.1.4 Phytochemistry of Eremophila
Past studies had shown very interesting results by identifying a diverse range of rare secondary
metabolites from this genus. One study screened 72 species of Eremophila duttonii species
against Gram positive and Gram negative bacteria where the results were quite encouraging
with an MIC value of 62 µg/mL for Streptococcus species. An extract of E. virens showed
activity against 68 clinical isolates of mMRSA at the MIC value of 31 μg/mL [97].
According to the other experimental results reported, some Eremophila species were
responsible for producing a diverse class of diterpenoids called surrulatane, which have
demonstrated antibacterial activity against pathogenic bacteria. In 1994, some researchers
identified that these surrulatane structures were related to the diterpenoid quinone antibiotic
biflorin isolated from the extract of E. duttonii [93].
Some recent bioguided isolation and identifications were reported for E. sturtii extracts that
possess antimicrobial and antiinflammatory properties and two novel structures were
elucidated. They belonged to a serrulantic acid group and were identified as 3, 8-
dihydroxyserrulatic acid and serrulatic acid, and the two known compounds are β-sitosterol
and Sesamin [96].
Table A2 in the Appendix indicates that most of the Eremophila species produce different
resins and the desert-adapted Eremophila species are known to especially generate diterpenes,
of which the most common skeletal structure is the bicarbocyclic serrulatane [98]. A number of
serrulatanes have been identified as antibacterial with activity against Gram-positive and
Gram-negative bacteria [82, 99-102].

25
Members of the Eremophila genus produce a limited number of flavonoids that have been
isolated and identified. In addition, recent studies describe a series of flavonoids, i.e., luteolin,
dinatin, tricin, 3,6-dimethoxyapigenin, jaceidin, and cirsimaritin, as well as a cembrene
diterpene, (3Z, 7E, 11Z)-15-hydroxycembra-3,7,11-trien-19-oic acid, that were identified for
the first time from E. lucida [103].
A previous study disclosed that a combination of eugenol methyl ether and safrole were found
in E. longifolia from the distillation of pounded leaves [104]. Additionally, the methanolic extract
from this plant isolated significant amounts of geniposidic acid and a small quantity of
mannintol and verbascoside (Figure 12).
O
OH
OH
OH
OH
O
OO
OH
H
H
OH
HO
HO
CH2OH
OH
OH
CH2OH
Geniposidic acid Mannintol
Verbascoside
Figure 12: Chemical structure of compounds isolated from E. longifolia [105]

26
Appendix Table 2B lists the volatile oils identified in E. longifolia in a past study completed
in 2009. For this study, the plant samples were collected in different geographical locations
and during different seasons throughout the year [94]. However, since this report, there has been
no further research of the medicinal aspects associated with E. longifolia and therefore there
are limited data on the biological and phytochemical properties.
In summary, Eremophila species are known to have a wide range of ethnomedical properties
and the main secondary metabolites are divided into different classes of compounds. The
phenolic compounds are mainly classified as flavonoids, lignins and phenylpropanoids, and
enriched with sesqui- and di-terpenes. These phenolic and terpenoids compounds are the
chemicals most responsible for the pharmacological properties of Eremophila extracts and they
are liable for observed cardiotonic, antiinflammatory, antimicrobial and cytotoxic activities [85].
2.3 Southeast Asian plant collection from Sarawak, Province of Malaysia
The fifty plant species that were initially analysed in this research were collected between 2005
and 2007 from various locations in Sarawak, Malaysia. They are categorised according to their
traditional role in healing practices and include treatments for sore throat, fever, conjunctivitis,
eye-related diseases, diarrhoea, dysentery, enteritis, vaginomycosis, furunculosis, burns and
much more.
2.3.1 Description, distribution, ethnomedicinal and phytochemical identities of
Baccaurea lanceolata (Miq.) Müll.Arg
2.3.1.1 Description of B. lanceolata
This plant species belongs to the genus of Baccaurea (flowering plants), the family of
Phyllanthaceae and is also placed in the family of Euphorbiaceae [106]. According to the

27
literature, diverse Malaysian tribal groups name this plant differently and these names are listed
in Table A3 of the Appendix.
Plants of this species can grow up to 21 m tall with bear’s thick skin and white fruits that grow
off the trunk. The pulp is translucent white with a sour flavour [107] (Figure 13).
Figure 13: B. lanceolata
(A) Branched tree with large leaves and fruits; (B) Magnified image of (A) [108]
2.3.1.2 Distribution of B. lanceolata
Baccaurea lanceolata is commonly found in the Philippines, Thailand, Malaysian Peninsula,
Sumatra, and Borneo (Sarawak, Brunei, Sabah, western, central, southern and eastern
Kalimantan) [108].
2.3.1.3 Ethnomedicinal significance of B. lanceolata
According to the ethnomedicinal knowledge of the seniors from numerous ethnic groups in
Borneo, Malaysia, this plant was commonly used against stomachache. It is prepared by
28
pounding leaves and fruits that were then mixed with water to be convert into a paste and
applied to the painful areas of the abdomen [106].
The majority of the ethnomedical therapies that used this plant were dependent on the ethnic
groups living in rural regions of Malaysia, for example:
• Kelabit: used to cure, alleviate stomachache; prepared using pounded leaves, which are
added to a minimal amount of water to dissolve and consumed as a decoction.
• Bidayuh: a cataplasm of the fruit applied as a cream on the inflamed parts of the body.
• Penan: to avoid drunkeness; pounded bark mixed with water and drank as decoction
before consuming any alcohol.
• Iban: to protect against charms; during Gawai Dayak (festival in Sarawak, Malaysia)
fruit is eaten before paying house visits [109].
According to the book published by Paul P. K. Chai, it has been mentioned that the Penan tribal
groups utilised squeezed sap (soft inner bark) from Baccaurea baccariana Pax ex Hoffm and
applied to the eye to cure eye diseases. Apart from the above-mentioned ethnic groups, some
other communities also used the inner bark juice of Baccaurea macrophylla Muell.-Arg for
sore eyes and related infections [110]. The fruit pericarp and reload can be edible as it is but, if
it is very sour, then it can be mixed with salt or sugar to overcome the sourness of the fruit.
Sometimes the fruit is mixed with chicken rice and consumed as a meal. Other research has
revealed that the Murut community in Sabah, Malaysia, also eats the aril of the fruit after it has
ripened and the mesocarp is eaten after being converted into a pickle [98, 106].
2.3.1.4 Phytochemistry of B. lanceolata
Studies have discovered that some specific volatile flavonoids were isolated from Baccaurea
motleyana (Muell. Arg.) Muell. Arg. (Rumba). After distillation of the dichloromethane extract

29
and analysis by GC-MS, they identified some sesquiterpene hydrocarbons and also high levels
of methyl 2-hydroxy-3-methylbutanoate, methyl 2-hydroxy-3-methylpentanoate and methyl 2-
hydroxy-4- pentanoate [111]. Additionally, three unknown and four known vanilloid derivative
compounds were isolated from the stem of Baccaurea ramiflora (same genus). These
compounds were confirmed by NMR, with the identified compounds being 4’-O-(6-O-
vanilloyl)- β-d-glucopyranosyl tachioside D, 6’-O-vanilloyl picraquassioside D and 6’-O-
vanilloylicariside B [112]. Another study revealed there are no significant toxicological effects
in rats when utilising 1200 mg/kg of Baccaurea angulate (Belimbing Dayak) plant extract as
a decoction [113].
In a qualitative phytochemical survey carried out in 1989, it was discovered that an extract
from the leaf of this plant species had constituents that contain alkaloids [114]. However, since
this report, there has been no further research of the medicinal activities associated with B.
lanceolata and, therefore, there are limited data on other biological and phytochemical
properties.
2.3.2 Description, distribution, ethnomedicinal and phytochemical identities of Fibraurea
tinctoria Lour
2.3.2.1 Description of F. tinctoria
This species belongs to the genus Fibraurea and the family Menispermaceae [115]. According
to the literature, diverse Malaysian tribal groups have different names for this plant as listed
in Table A4 (Appendix) and no common/English name is available.
F. tinctoria is a large, woody, climbing vine, that grows up to 40 m high with a stem diameter
of up to 5 cm[116] and yellow coloured wood [117] (Figures 14 and 15).

30
Figure 14: F. tinctoria leaves and fruit
Figure 15: F. tinctoria vine (Sourced from: https://www.flickr.com/photos/adaduitokla/6129211373/sizes/m/in/pool-680530@N20/)
2.3.2.2 Distribution of F. tinctoria
This species is widespread in northeastern India, the Nicobar Islands, Burma, Thailand,
Vietnam, eastern and southern China, Malaysia (Malaysian Peninsula, Sarawak and Sabah),
Brunei, Indonesia and the Philippines. Mostly, this plant species inhabits native forests and is
rarely cultivated in gardens or homes in Southeast Asia [118].

31
2.3.2.3 Ethnomedicinal significance of F. tinctoria
Ethnomedicinal properties attributed to this plant are diverse depending on the ethnic group
living in the region where the plant is found:
• Iban: boil slices of roots to make as a decoction to treat sexually transmitted diseases
like gonorrhoea and to avoid drunkenness or morning sickness during pregnancy; a
decoction of the stem is consumed as a remedy for various sicknesses and especially
for food poisoning and paralysis; a cataplasm of the stem or bark can be applied to
snake bites related infections [109].
• Penan: fresh juice from the stem is taken to cure poisonous bites from snakes,
centipedes and scorpions.
• Penan Totoh: decoctions from boiled roots are consumed as a tea to cure stomachaches.
• Kayan: roots are boiled until they become concentrated and taken as a tea to cure urine
infections and mitigate diarrhoea [109].
F. tinctoria stem and roots are very popular among these ethnic groups as a dye-producing
agent (yellow dye) [116].
2.3.2.4 Phytochemistry of F. tinctoria
Some alkaloids have been isolated from extracts of the root bark and stem of Fibraurea
chloroleuca Mier and are known as magnoflorine, pseudocolumbamine, dehydrocorydalmine
and palmatrubine. In addition, further alkaloids were documented as barbarians and
berberrubine [119]. Phytotherapy research produced some interesting results regarding the
inhibition of cytochrome P3A4 with secondary metabolites from F. tinctoria (CH3OH extract)
exhibiting an IC50 of 5.1 µg/mL [120]. It was also found that the non-polar portion of the CH3OH
extract had an inhibitory effect, with an IC50 value of 3.4 µg/mL.

32
Another study revealed F. tinctoria Lour as having an IC50 value ranging between from 0.4 to
8.6 μg/mL for selectivity towards Plasmodium falciparum in association to their cytotoxic
effects compared to the human cell lines [14]. Phytochemical studies on this plant resulted in the
isolation of several chemical constituents, including proto-berberine alkaloids and furanodi
terpenoids [116]. Further analysis revealed that berberrubine, fibleucin, fibraurin, 6-
hydroxyfibraurin, palmatrubine, pseudojatrorrhizine, carboxyfibleucin, chasmatine,
colombamine, jatrorrhizine, magnoflorine and palmatine were also present in this plant [121].
2.3.3 Description, distribution, ethnomedicinal and phytochemical identities of
Goniothalamus tapisoides Mat Salleh
2.3.3.1 Description of G. tapisoides
This species belongs to the genus Goniothalamus and the family Annonaceae and is commonly
known as Selada or Semukau [122]. G. tapisoides is a small tree of about 5 m in height [123]
(Figure 16).
Figure 16: G. tapisoides K. Mat-Salleh, from Lambir Hills National Park (Sourced from: https://www.flickr.com/photos/kmatsalleh/2558119374/)

33
2.3.3.2 Distribution of G. tapisoides
This plant species is predominately distributed throughout the island of Borneo, Northeast
India, Myanmar, Thailand, Vietnam, Sumatra, Malaysian Peninsular, Singapore, Java,
Northeast Celebes and the Philippines [124].
2.3.3.3 Ethnomedicinal significance of G. tapisoides
Various ethnic groups have pounded the leaf and bark, which was then rubbed into the infected
area of wounds due to snake and insect bites [125].
2.3.3.4 Phytochemistry of G. tapisoide
Previous phytochemical studies on this species resulted in the isolation of various essential oils.
However, the essential oil from the leaf and root of G. tapisoide is comprised almost entirely
of the monoterpenoid 1, 8-cineole [123]. In 2012, the researchers published data about 11 more
compounds isolated from the stem and bark of this species. They were classified as (1)
goniomicin A, (2) goniomicin B, (3) goniomicin C, (4) goniomicin D, (5) tapisoidin, (6)
goniothalamin, (7) 9-deoxygoniopypyrone, (8) pterodondiol, (9) liriodenine, (10) benzamide
and (11) cinnamic acid as shown in Figure 17. Goniothalamin has displayed some mild
cytotoxic effects against colon cancer cells (HT-29) and goniomicin B exhibited specific
antioxidant properties [122].

34
Figure 17: Chemical structures of the compounds identified from G. tapisoides [122]
2.3.4 Description, distribution, ethnomedicinal and phytochemical identities of
Goniothalamus velutinus Airy Shaw
2.3.4.1 Description of G. velutinus
This species belongs to the genus Goniothalamus and the family Annonaceae [124]. Commonly,
it is known as Lim panas (Iban), Kayo ujan panas (Kenyah) and Lakum [109]. G. velutinus is a
small tree and can reach up to 3 m in height with a stem that is 3 cm in diameter [81] (Figure
18).

35
Figure 18: G. velutinus Airy Shaw (Sourced from: Borneo Post, 2014) Photo from Sarawak Biodiversity Centre)
2.3.4.2 Distribution G. velutinus
G.velutinus is distributed throughout Southeast Asia and Malaysia [126].
2.3.4.3 Ethnomedicinal identities of G. velutinus
Various ethnic groups used the twigs as a mosquito repellent. The Iban ethnic group use a
decoction from boiled shoots that is consumed as a treatment to alleviate fever and the pounded
stem is applied to remedy snake bite related infections [81]. The Penan ethnic group use hanging
branches of the plant on each corner of the house as protection from spirits [109].
2.3.4.4 Phytochemistry of G. velutinus
Research conducted in late 1992 showed this species to be rich in phenanthrene lactams
(cytotoxic alkaloids) such as velutinam (10-amino-8-hydroxy-3, 4-dimethoxyphenanthrene-1-
carboxylic acid lactam) and aristolactam-BII [127]. A more recent study has shown that alkaloids
such as goniopedaline, aristololactam AII and goniothalactam are produced by G. velutinus

36
[128]. In 2010, further phytochemical characterisation was completed with another three
alkaloids being identified (pinocembrine, goniothalamin, and naringenin) [126]. It was also
discovered in this study that goniothalamin can have a significant inhibitory effect (98%)
against the measles virus (LC50=0.1 μg/mL).
2.3.5 Description, distribution, ethnomedicinal and phytochemical identities of Polyalthia
hookeriana King
2.3.5.1 Description of P. hookeriana
This species belongs to the genus Polyalthia and the family Annonaceae [124] and it is a small
tree that grows between 15 to 25 m high with hanging branches, dark green leaves and
yellowish red colour flowers [129] (Figure 19).
Figure 19: P. hookeriana branch (Sourced from: http://plantsofasia.com/index/polyalthia_hookeriana/0-894)
2.3.5.2 Distribution of P. hookeriana
P. hookeriana is native to Malaysia and Singapore, it is found mainly in the lowland and sub
montane forests [130].

37
2.3.5.3 Ethnomedicinal significance of P. hookeriana
Leaf and stem of this plant are used to cure sore eye-related infections [109].
2.3.5.4 Phytochemistry of P. hookeriana
There is no known scientifically chemical characterisation or identification available on this
plant.
2.3.6 Description, distribution, ethnomedicinal and phytochemical identities of Pyrenaria
serrata Bl. var masocarpa (Korth) H. Keng
2.3.6.1 Description of P. serrata.
The genus Pyrenaria belongs to the family Theaceae and the plant is commonly known as
Kayuh Lilui [124]. Species within the genus are distinguished as shrubs or small trees (Figure
20).
2.3.6.2 Distribution of P. serrata.
The plant commonly grows in most areas of India, Asia, America, a few places in Africa [112]
and is native to Java and Sumatra islands.
2.3.6.3 Ethnomedicinal significance of P. serrata.
Raw fruits are consumed as a remedy for coughing.
2.3.6.4 Phytochemical identities of P. serrata.
There is no known chemical analysis data available for this plant.

38
Figure 20: P. serrata branch with fruits
2.4 Isolation and characterisation of bioactive compounds from plant materials.
Plants have been the most fertile source for the discovery of novel compounds with potential
application in drug discovery and development. Application of plant-based natural products in
medicine has been practiced for many millennia. Natural products have been used against a
multitude of pathogens and it is, yet still true that almost half of the novel therapeutic drugs
approved by the US Food and Drug Administration since 1994 were plant-based natural
products [131].
Despite all the benefits of natural plant-based extracts, large pharmaceutical companies have
decreased their screening processes and it is mainly because of inadequate provision of plant
materials [132]. The isolation and characterisation of plant based natural products have been the
most challenging tasks in drug innovation.
Physiological and biochemical research often requires the production of extracts from plant
tissues that are purified and then chemically separated before further analysis. However, for
this purpose, the amount of starting material can be restricted and, therefore, purification and
separation needs to be undertaken carefully. According to research published in 1966, more

39
than 50 years ago, amino acids extracted from plant leaves were obtained in two separate steps.
The plant extract purification was performed using liquid-liquid extraction and the separation
was performed with thin-layer high-voltage electrophoresis. The amino acid identification was
then confirmed by ninhydrin or autoradiography [133]. However, these days there are many
novel and advanced techniques used which include extraction, separation, identification and
characterisation [134] and these techniques will be discuss in later chapters.
2.4.1 Extraction methods
Extraction is the first step for novel drug discovery with the mining of essential compounds
from a complex sample depending upon the solvent used for the extraction. There are a number
of extractions methods where the choice depends on the form of the sample and the nature of
the targeted natural products.
2.4.1.1 Conventional liquid immersion extraction method
This is a form of solid-liquid extraction and this process is the most commonly used technique.
The solvent selection is based on the compound of interest where it is usual to match the
polarity of the solvent with the polarity of the target molecules. In this method, a homogenised
solid sample is immersed into the selected solvent for a given time at room temperature [135].
The main disadvantage of this extraction method is that it is extremely time consuming
compared to other methods which will be discussed later.
2.4.1.2 Accelerated Solvent extraction (ASE)
An automated form of solid-liquid extraction is the Accelerated Solvent Extraction technique
and is useful for extracting semi volatile organic compounds [136]. The temperature and pressure
are the two parameters that can be adjusted with the temperature range usually 50°C to 200°C
40
and the pressure ramped between 10 MPa to 15 MPa. Once again the choice of solvent dictates
the compounds that are extracted but the range of polarities and efficiencies are much greater
than the conventional immersion method. The ASE extraction method is very fast and
extraction process can be completed within 15 to 20 minutes [137]. The disadvantage of this
process is the potential degradation of thermolabile compounds at higher temperatures.
However, the high efficiency of this extraction method can also extract unwanted compounds
as well, which can impact on separation and further isolation.
2.4.1.3 Liquid-liquid extraction (LLE)
Most commonly, this technique is used to extract polyphenols and non-complex phenolic
compounds from aqueous plant samples, such as juices or decoctions. This process is based on
the relative solubilities of a solute in two different immiscible solvents, most commonly water
(polar) and an organic solvent (non polar). Dichloromethane, diethyl ether, chloroform and
ethyl acetate are the main organic solvents utilised in this operation. Researchers have widely
used this technique because of its simplicity and its efficiency [138-139]. The main disadvantages
of this method are due to it being labor intensive and time consuming. It also needs relatively
large sample volumes and large amounts of ultra-pure, often toxic, organic solvents. Extraction
efficiency can be influenced due to the formation of emulsions between the layers, particularly
if there is a large amount of fine plant material present [140-141] .
2.4.1.4 Soxhlet extraction
This technique is a continuous form of solid-liquid extraction with acetonitrile and water
commonly used as solvents where the reflux process time is about 12 to 48 hours. The apparatus
is shown in Figure 21. The disadvantages for this method is the processing time and large

41
solvent consumption [142]. Also, this extraction technique requires a significant amount sample
of up to 30 g [143].
Figure 21: Soxhlet extraction [144]
2.4.1.5 Supercritical fluid extraction (SFE)
SFE (Figure 22) has been discussed as the most effective and efficient technique to extract the
desirable compound from plants. The extraction process separates one compound from another
in a combination of supercritical fluids and it provides a relatively clean extract. Carbon dioxide
is commonly utilised as a supercritical fluid. The critical set temperature of the extraction is
normally 31°C and required pressure is 74 bar. The normal processing time for the experiment
is 10 to 60 minutes [145]. This process can be employed especially for thermolabile compound
extraction.

42
Figure 22: Supercritical fluid extraction (SFE) apparatus [145]
2.4.1.6 Microwave assisted extraction (MAE)
The microwave assisted extraction technique is super-fast and is easy to use. The range of the
microwave frequencies is between 0.3 to 300 GHz and the adjustable temperature range
between 50°C to 200°C, which can be adjusted to the method requirement [146]. This technique
is especially useful for polar compound extraction as microwave radiation is best absorbed by
polar molecules to create heat, which is then transferred throughout the sample matrix [147].
2.4.2 Clean up and isolation methods
2.4.2.1 Solid phase extraction (SFE)
Solid phase extraction (Figure 23) is an extensively used sample preparation method that has
developed in recent decades. According to literature, it has been reported that most scientists
used the SPE technique as the preliminary purifying step when processing complex sample
mixtures and it is a useful technique for prompt and selective sample preparation [148]. It assists
to purify the analytes from the sample solution by sorption on to a solid sorbent and enables
the isolation of selected analytes from the non-adsorbed matrix. An advantage is if a smaller

43
volume is used to elute the analytes compared to the sample volume as an increase in
concentration can be achieved, this is also known as preconcentration. This technique is mainly
focused on three aspects of the sample preparation that includes preconcentration, sample clean
up and matrix exchange. SPE is the most common extraction method used in many research
areas such as environmental, clinical, food and industrial chemistry [149].
Figure 23: Solid Phase Extraction method
(Sourced from: http://www.waters.com/waters/en_AU/Solid-Phase-Extraction-SPE-Guide/nav.htm?cid=134721476&locale=en_AU)
The extraction process is predominantly dependent on the retention index of each target solute
in the sample mixture and the characteristics of the solid particles that are used as the stationary
phase of the cartridge. Retention of the solutes in the stationary phase depends on partitioning
between the mobile phase and the stationary phase [150]. Selection of the type of SPE extraction
cartridge mainly depends on the physical and chemical properties of the analyte, with the main
criteria based on the functional groups present in the analytes and the interactions with the
chosen sorbent [150].
The extraction efficiency is strongly influenced by the flow rate of the eluent, the sample
loading capacity of the separation cartridge and reproducibility of the separation of the solutes

44
of the sample mixture [151]. Traditional SPE sorbents are available as large particles of silica,
polymeric and resin materials packed in syringes or cartridges. The wide range of sorbents
provides various applications for various classes of drugs, including ionic and highly polar
compounds which are difficult to extract by traditional LLE methods [152].
It is considered as digital chromatography as the short format ensures that solutes are either
adsorbed or eluted in a solvent that matches the polarity and the migration through the
stationary phase is minimal [153]. It has replaced liquid-liquid extraction as the most common
extraction method in many research disciplines such as environmental, clinical, food and
industrial chemical analysis [154]. The SPE technique avoids the emulsion problems often
encountered in LLE methods and achieves significant simultaneous preconcentration and
purification [155].
2.4.3 Separation methods
2.4.3.1 Thin layer chromatography (TLC)
Thin layer chromatography is one of the oldest methods utilised beginning in the early 1960s.
Silica is used as a stationary phase combined with 2-(diphenylboryl-oxy)ethylamine and poly
ethylene glycol or AlCl3. Ultraviolet light is used for detection and the selected wavelength
range is between 350 - 365nm or 250 - 260nm [147, 156]. In biochemistry, including nucleic acid
analysis, the TLC separation technique is used extensively. The method involves spotting test
compounds onto a TLC plate where the plate is developed with a suitable solvent or mixed
solvent and visualization of the migrated spots possible due to their color, the quenching of
fluorescence or the use of chemical developing reagents.. Retention factors (Rf values) are
calculated from migration distances and individual standards are used for comparisons with the
unknowns [157].

45
2.4.3.2 Gas chromatography (GC)
GC is a very commonly used analysis technique in analytical chemistry for volatile analyte
separation in complex mixtures. The separation occurs according to chemical and physical
properties of the analytes and their interaction with the stationary phase immobilized on the
inside of a long tube or column. Each analyte elutes out of the column at different times and
this is called the retention time. The retention time is unique for specific analytes under a
specific set of conditions and can be used to identify the analytes when compared with a
standard. Inert gases such as hydrogen, helium and nitrogen are used as the carrier gas with the
choice depending on the type of detector that is employed.
2.4.3.3 High Performance Liquid Chromatography (HPLC)
HPLC is used as a separation and identification technique for high boiling point, non volatile
compounds. The technique is well established and is highly reliable for the separation of
complex mixtures. It is acceptable for pharmaceutical quality control and is widely used as an
analytical tool. The separating column must have sufficiently high sample capacity in addition
to high efficiency and this has led to the development of a wide range of columns sizes that
suit different applications. Furthermore, the column packing or stationary phase has a number
of surface chemistries that can be selected for a particular set of analytes. The nature of the
stationary phase influences the selection of solvents or mobile phase that are used as the
partitioning of the analyte is dependent on this combination. As the majority of analytes are
relatively non polar organic molecules then the most appropriate mode is reversed-phase
chromatography (also named as RPC, reverse-phase chromatography or hydrophobic
chromatography) where the stationary phase is more non polar than the mobile phase.
Therefore, the main column in use consists of high purity silica with a bonded phase of

46
monomeric C18 offers, which offers classical reversed-phase selectivity. The hydrophobic
stationary phase can retain most organic analytes as a result of hydrophobic interactions [158].
It is also compatible with water as a mobile phase in combination with less polar solvents such
as CH3CN and MeOH. The composition of the mixed mobile phase can be adjusted at highly
controlled rates to improve chromatographic separation performance.
2.4.4 Identification by spectroscopy methods
2.4.4.1 Mass Spectroscopy
2.4.4.1.1 Gas chromatography–mass spectrometry (GC-MS)
GC-MS is a hyphenated analytical technique that combines with GC with mass spectrometry
to separate and characterise unknown analytes in complex mixtures that includes drug detection
in blood samples, explosive/fire investigations and environmental sample analysis. The main
disadvantage of GC-MS is that thermal degradation of analytes can occur due to the high
temperatures that are required to transform liquid samples into a gaseous state in the injection
port. It is also difficult to analyse polar compounds due to their high boiling points but this can
be overcome with chemical derivatisation of the polar functional groups. The main advantage
of GC-MS is the availability of mass spectral reference libraries due to the instrument
independence of the molecular fragmentation during the ionisation process.
2.4.4.1.2 Liquid chromatography–mass spectrometry (LC-MS)
LC-MS is also a hyphenated combination of physical analyte separation with mass
spectroscopy capabilities and is an ideal merger of separation and detection. Unlike GC-MS,
the ionisation process for LC-MS is softer and molecular ions are more favored due to less
fragmentation. Therefore, the LC-MS combination provides molecular mass and structural
information, when multi stage MS-MS is employed, with accurate quantitative analysis of the
analyte. Recent improvements have resulted in highly accurate mass detection with molecular

47
masses able to be determined to ppm levels using high resolution instruments. This technique
can be used to analyse organic, inorganic and biochemical compounds found in environmental
and biological samples. It therefore finds use in cosmetic, agrochemical, pharmaceutical, food
processing and biotechnology industries to analyse samples.
2.4.4.2 Nuclear magnetic resonance spectroscopy (NMR)
NMR is a prominent spectroscopic technique used in research to obtain physical, chemical,
electronic and structural information for a molecule due to chemical shifts as a result of
interactions with a large external magnetic field.
2.4.4.2.1 Proton nuclear magnetic resonance (proton NMR, hydrogen-1 NMR, or 1H
NMR)
The 1H NMR spectra records chemical shifts and coupling constants including quantitative
relationship information about inter molecular and intra molecular resonances of the protons
within a molecule [159].
2.4.4.2.2 Carbon-13 nuclear magnetic resonance (13C)
The 13C technique is an application of NMR that responds to the carbon-13 isotope, which has
a natural abundance of approximately 1%. The sensitivity is much less than proton NMR but
this can be overcome by averaging multiple scans, which results in longer experiment times.
From 13C, the number of carbons in a molecule can be identified.

48
2.4.4.2.3 Homonuclear correlation spectroscopy (COSY)
COSY is the most the popular form of two dimensional NMR spectroscopy and detects the
coupling of spins between the H atoms in a molecule. It displays with both axes consisting of
proton NMR spectra with the cross peak intensity indicating the extent of coupling.
2.4.4.2.4 Heteronuclear single-quantum correlation spectroscopy (HSQC)
The HSQC technique identifies single bond correlation between protons and carbon. The X
axis normally represents the protons and Y-axis corresponds to the carbon atoms.
2.4.4.2.5 Heteronuclear multiple-bond correlation spectroscopy (HMBC)
HMBC also characterises the bonding correlations between carbon and proton. It can show
correlations over two, three and, in a conjugated molecule, four bonds within a molecule.
Correlation over one-bond is automatically suppressed by this method but is detected using
HSQC.
2.5 Conclusions
This study focuses on the antimicrobial activity of bioactive compounds of selected plant or
herbal extracts that are effective as medicines and have usually originated in indigenous
communities with their side effects being continuously monitored over many centuries based
on experiential knowledge. Unfortunately, this important indigenous knowledge is slowly
being lost due to habitat changes (civilization), industrialisation (e.g. Palm oil plantations in
Malaysia) and the deforestation of their native lands [160]. Specifically, the experiments in this
research are aimed at identifying the source of the antimicrobial and antifungal activities of
these selected extracts based on the knowledge of their usage by the indigenous people of
Australia and the Malaysian State of Sarawak in Borneo. In selected cases, these plants will be

49
further tested to obtain chemical identification for the compounds that are responsible for
inhibition of the observed bioactivity.
50
Chapter 3
Materials, methods and method development

51
3.1 Introduction
This chapter primarily describes the techniques applied to obtain crude plant extracts from one
Australian species E. longifolia F. Muell and fifty Southeast Asian species provided by the
SBC. It then presents information about six of the most noteworthy extracts interacting with
pathogens of Gram negative (four species) and Gram positive (three species) bacterial groups,
together with the fungal pathogen C. albicans. These were selected for assessing antibacterial
and antifungal inhibitory activities of the plant extracts. It continues by explaining general
aspects of the techniques used to perform the relevant assessments of the antibacterial and
antifungal activities. This includes Disc Diffusion Assay (DDA), along with Minimum
Bacterial Inhibitory Concentration (MIC), Minimum Fungal Inhibitory Concentration (MFC),
Minimum Bactericidal Concentration (MBC) and Minimum Fungicidal Concentration (MFC)
assays.
The chapter concludes with a brief description of extraction (Solid Phase Extraction, SPE),
separation (High Performance Liquid Chromatography, HPLC), and identification (Liquid
Chromatography–Mass Spectrometry, LC-MS; Gas Chromatography–Mass Spectrometry,
GC-MS; and Nuclear Magnetic Resonance spectroscopy, NMR) techniques that were used to
isolate, identify and characterise the bioactive plant compounds responsible for the inhibition
of the tested pathogens.
3.2 Plants materials used in this study
The plants collected for this study were from two geographically distant locations with different
climates. E. longifolia F. Muell was collected from near Burke in NSW, Australia, and
botanically authenticated by Dr. Robert J. Chinnock (State Herbarium, Adelaide, South
Australia with voucher specimen number AD99732199); Canopus BioPharma Inc. (Byrock,

52
New South Wales, Australia) supplied the plant material. For a brief discussion of this plant,
see Section 2.2.1.
In addition, the Sarawak Biodiversity Centre (SBC) in Sarawak, Malaysia, collected fifty
ethnomedicinally important plant species; the information about these plants was recorded for
the Traditional Knowledge Documentation program carried out by the SBC in Sarawak
Malaysia. For further information on all plants presented here, see Section 2.3
3.3 Methods used in this study
3.3.1 Preparation of Australian crude plant extract
E. longifolia leaves were separated and dried for 7 days at 60 °C in an incubator to reduce the
moisture content and then the leaves were converted into a very fine powder using a
commercial grinder. A mass of 10.25 g of powdered leaves was placed in 50 mL of CH3CN at
25 °C for 5 days with occasional stirring. The extract was then filtered through a 0.45 µm nylon
filter (Grace Part number N14745) and placed in the Speed Vac (RVC-2-18, CHRIST) at 40
°C until all the solvent had evaporated, which was typically a few hours. The dried plant extract
was kept in a -20 °C freezer until required for further experimental analysis.
3.3.2 Preparation of the Southeast Asian plant extracts
A selection of 50 plant extracts were obtained from the SBC of which some have been
described in Section 2.3. The plants extract were prepared by the SBC using a method where
the plant material (i.e. leaves, fruits and/or stems) were dried for 3 days at 45 °C in an incubator
to minimise the moisture content and then were converted into a very fine powder using a
commercial grinder. Then 6 g of each powder sample was soaked in 60 mL of a
dichloromethane-methanol mixture (1:1, v/v) overnight in an orbital shaker. The extracts were

53
then filtered through a 0.45 μm nylon filter with the filtrate placed in a rotary evaporator at 40
°C until all the solvent had evaporated. The concentrated plant extracts were then re-suspended
in dimethyl sulphoxide (DMSO, Merck) at a concentration of 400 μg/mL prior to the evaluation
of in vitro antimicrobial and antifungal activities (see Section 3.3.4) and the remaining extracts
were stored in a -20 °C freezer until required for further analysis.
3.3.3 Bacterial strains and media
Four Gram negative bacteria (Escherichia coli, Pseudomonas aeruginosa, Salmonella enterica
serovar Typhimurium and Moraxella catarrhalis), three Gram positive bacteria (Bacillus
cereus, Staphylococcus aureus and Streptococcus pyogenes) and one fungus (Candida
albicans) were used to test the plant extracts. Cultures were collected from the microbiology
laboratory at Swinburne University of Technology (Melbourne, Australia) and used for the
screening of extracts from the fifty plant species from Sarawak, Malaysia, From this, six plant
species showed significant activity against above mentioned bacteria and fungi. All
microorganisms were selected with respect to their abilities to cause various types of infections
in the susceptible hosts (Table 1) [161-164].
All bacteria were grown on brain heart infusion (BHI) agar (Oxoid) slants. Overnight cultures
were prepared by inoculating a loopful of the agar slant cultures into 2 mL of nutrient broth
(NA) (Oxoid). All bacterial cultures were incubated at 37 °C overnight under aerobic
conditions, with the exception of M. catarrhalis, which was incubated at 30 °C for 48 hrs. The
fungus was cultured in potato dextrose broth (PDB) medium (Difco) and incubated at 30 °C
for 48 hrs.
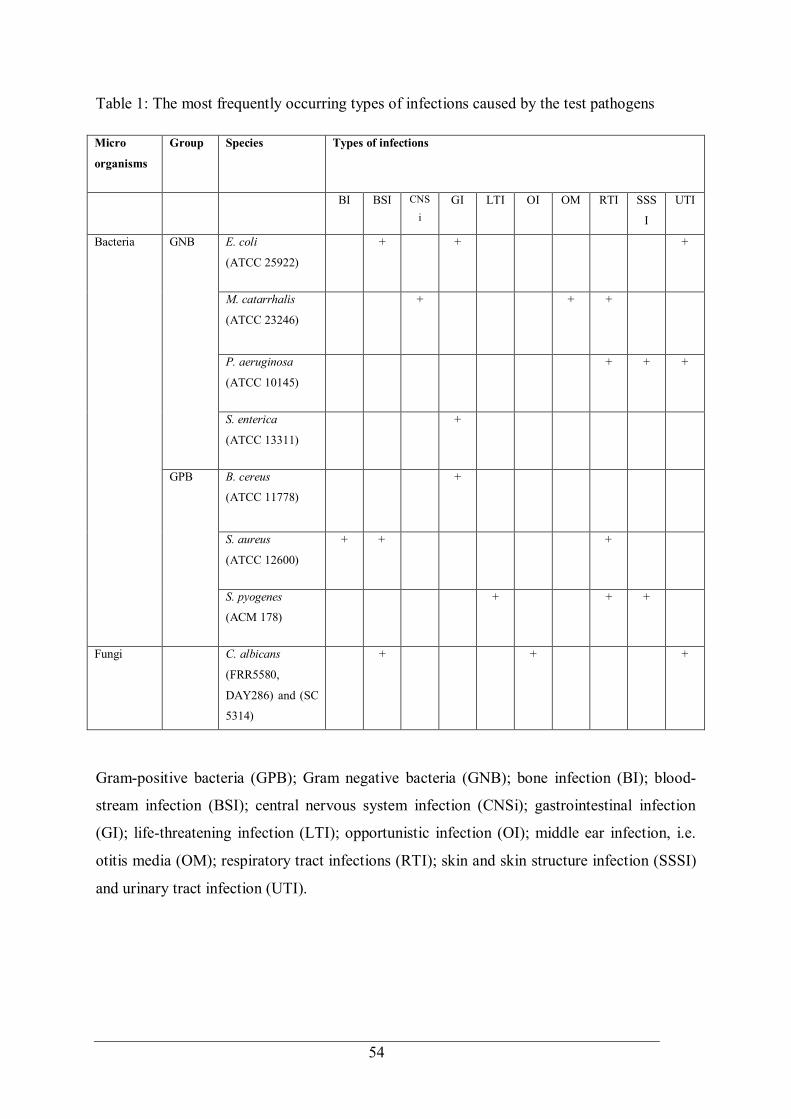
54
Table 1: The most frequently occurring types of infections caused by the test pathogens
Micro
organisms
Group Species Types of infections
BI BSI CNS
i GI LTI OI OM RTI SSS
I
UTI
Bacteria GNB E. coli
(ATCC 25922)
+ + +
M. catarrhalis
(ATCC 23246)
+ + +
P. aeruginosa
(ATCC 10145)
+ + +
S. enterica
(ATCC 13311)
+
GPB B. cereus
(ATCC 11778)
+
S. aureus
(ATCC 12600)
+ + +
S. pyogenes
(ACM 178)
+ + +
Fungi C. albicans
(FRR5580,
DAY286) and (SC
5314)
+ + +
Gram-positive bacteria (GPB); Gram negative bacteria (GNB); bone infection (BI); blood-
stream infection (BSI); central nervous system infection (CNSi); gastrointestinal infection
(GI); life-threatening infection (LTI); opportunistic infection (OI); middle ear infection, i.e.
otitis media (OM); respiratory tract infections (RTI); skin and skin structure infection (SSSI)
and urinary tract infection (UTI).

55
3.3.4 Bioassays
3.3.4.1 Disc diffusion assay
The disc diffusion assay involved inoculating a bacterial or fungal broth suspension (adjusted
to match a 0.5 McFarland turbidity standard) onto the surface of Mueller-Hinton agar (MHA)
(Oxoid) plates using sterile cotton-tipped swabs. The plates were dried for 2-3 min and then
pre-sterilised discs (6 mm in diameter) were placed on the agar surface. Subsequently, 5 μL of
the selected plant extracts (400 μg/mL) were added individually onto discs that were pre-wetted
with 5 μL of DMSO. Generally, the seeded plates were incubated at 37 °C for 24 hrs. The
exceptions being M. catarrhalis where nutrient agar (Oxoid) and C. albicans where potato
dextrose agar (PDA) (Difco) plates were used; these were incubated at 30 °C for 48 hrs. At the
end of the incubation period, the diameters of the zones of inhibition were measured.
All assays were performed in triplicate and the mean zones of inhibition were recorded.
Commercially available tetracycline (30 μg) antibiotic discs were used as the antimicrobial
positive control and freshly prepared standard amphotericin B (1.4 μg) was utilised as the
antifungal positive control. DMSO wetted discs were used as the negative control for all of
these susceptibility testing assays. Pure acetonitrile and methanol that were used as extracting
solvents showed no activity when included as solvent blanks.
3.3.4.2 Determination of minimum inhibitory concentration (MIC)
This method was performed by using the Mueller Hinton broth dilution method with doubling
serial dilution (50, 25, 12.5, 6.25 and 3.13 μg/mL using 100 μg/mL as the starting
concentrations) of plant extracts arrayed in triplicates into adjacent wells of 96-well microtitre
plates to which freshly prepared bacterial and fungal inocula were added [165]. The plates were
placed in a POLARSTAR Omega plate reader (Lab Tech) with the incubation temperature set

56
at 27 °C. The analysis was programmed for 200 cycles where absorbance readings (wavelength
600 nm) were measured in 53 time increments with linear shaking for 5 min before each reading
for all the bacteria except M. catarrhalis where the number of cycles was 150 and C. albicans
with 600 cycles. After the incubation period, the breakthrough concentration was established
[166]. Pure acetonitrile and methanol that were used as extracting solvents showed no activity
when included as solvent blanks.
3.3.4.3 Determination of minimum bactericidal and fungicidal concentrations
(MBC/MFC)
The minimum bactericidal and fungicidal concentration is a plant extract that resulted in the
killing of more than 99.9% of the microorganisms being tested [167]. The minimum bactericidal
concentration (MBC) and minimum fungicidal concentration (MFC) of the plant extracts were
determined by taking a loopful of the culture media from samples used in the MIC assays and
streak inoculating MHA (to determine MBC) and PDA (to determine MFC). All plates were
incubated at 37 °C for 24 hrs (bacteria) or 30 °C for 48 hrs (fungi). All the MBC/MFC and
MIC assays were performed in triplicate. DMSO was used as a negative control, with
tetracycline and amphotericin B used as positive controls for the antimicrobial and antifungal
susceptibility assays, respectively. Pure acetonitrile and methanol that were used as extracting
solvents showed no activity when included as solvent blanks.
3.3.5 Separation techniques
3.3.5.1 Solid Phase Extraction (SPE)
SPE has developed due to the need to simplify sample preparation by removing potentially
troublesome interferents and produce a less complex sample for analysis. It is a small format

57
chromatography and, in this thesis, it was used to fractionate plant extracts by eluting with a
mixed solvent that has the polarity altered by using different proportions of two solvents.

58
3.3.5.1.1 Primary fractionation
Commercially available SPE Giga cartridges (SPE column Phenomenex-Strata C18-e, 2 g/12
mL) were used as a preliminary separation column. The SPE separation was developed by
using two different series (Table 2) of eluents to generate fractions. Prior to separation, the SPE
cartridges were preconditioned with 20 mL of 100% acetonitrile (CH3CN) followed by 20 mL
of Milli-Q water. Fractionation was conducted using a series of different solvent mixtures listed
in Table 2 and the volume of solvent mixture used for each fractionation was 20 mL.
Table 2: Solvent mixtures of acetonitrile and Milli-Q water (% v/v) used for fractionation in
both series
Series 1 %CH3CN
Series 2 %CH3CN
Fraction 1
Fraction 2
Fraction 3
Fraction 4
Fraction 5
Fraction 6
Fraction 7
Fraction 8
0
10
25
40
55
70
85
100
0
18
33
48
63
78
100
-
The total flow rate was 1 mL/min. Collection tubes were positioned beneath the SPE cartridge
to collect the eluent that passed through the cartridge. Identification was performed using
HPLC by comparing the retention time for each component [168].
A standard mixture was used to correlate the solvent composition of the eluting solvent for
each fraction with the standard compound’s log P values. It would be expected that relatively

59
polar compounds would be eluted in the earlier fractions and be isolated from the non-polar
compounds. The extent of the isolation during the fractionation procedure would be revealed
by the proportions of each compound in each fraction, which was measured by HPLC.
3.3.5.1.2 Secondary fractionation
Based on the results from the primary fractionation for the plant extracts, it was observed that
further fractionation would be necessary and this was developed with the following strategy.
For a particular fraction identified from the primary fractionation, instead of eluting with a 20
mL aliquot of the appropriate solvent, the elution solvent was added and collected in 1 mL
increments. These fractions were also examined using HPLC.
3.3.5.2 Log P values
The polarity of a molecule can be described by the partition coefficient between water and
octanol [169]. The log P value of a compound is a measure of the polarity that influences many
biological processes, separation techniques, as well as drug absorption and distribution in the
human body [170]. The log P value can be measured but the development of various algorithms
that evaluate a molecular structure enables the log P to be estimated [171]. For all the compounds
in the standard test mixture, the log P values were calculated by using ACD (Advance
Chemistry Development) software (Figure 24). It follows that the greater the value for log P,
the more non-polar or hydrophobic the molecule.

60
Figure 24: Standard compounds used to characterise the micro-scale fractionation
3.3.6 Analysis techniques - Separation and identification
3.3.6.1 Gas Chromatography-Mass Spectrometry analysis (GC-MS)
The GC-MS analyses were carried out on a Shimadzu GC Chromatograph GC 2010 Plus fitted
with Zebron-ZB semi volatile GC capillary column (Phenomenex Australia Pty Ltd) with fused
silica (low polarity cross bond silarylene phase, 30 m x 0.25 mm, i.d. 0.50 µm) interfaced with
a Shimadzu mass selective detector QP2010 (Shimadzu, Japan) operated by GC-MS Solution
(version 2.61) software. The column oven temperature program used in this analysis was as
follows: initially 70 °C for 2 min, followed by an increase of temperature to 300 °C (at a heating
rate of 7.5 °C min-1) that was then held for 4.50 min. The injector temperature was set at 230
°C with a split ratio of 75:1 and ultra-high purity helium was used as the carrier gas. The
interface and ion source temperatures were maintained at 220 °C and 200 °C, respectively. The
mass scan range was 50-600 amu. For non-derivatised samples, the solvent delay time was 2.5
min and the solvent delay time was 7.5 min to eliminate detector saturation from the solvents

61
in the derivatisation process. A sample volume of 1 µL was injected into the system and
identification of the components was based on a comparison of the mass spectra with the Wiley
Edition 8.0 Mass Spectral Database (Shimadzu, Japan). The identification of each compound
was based on a combination of retention time and spectral matching (minimum of 80% in this
case) using the Mass Spectral Database.
3.3.6.1.1 Derivatisation for the polar metabolites
Derivatisation in gas chromatographic analysis was necessary due to the high polarity of some
of the compounds in the fractions and a trimethylsilyl reagent was used as the derivatisation
agent to form trimethylsilyl adducts. Briefly, dried samples (30 ± 0.2 mg) of various fractions
were solubilized in 100 µL of N, O-Bis (trimethylsilyl) trifluoroacetamide (BSTFA) containing
1% of trimethylchlorosilane (TMCS) followed by the addition of 200 µL pyridine (Sigma
Aldrich) and homogenised. The samples were then placed in a Microwave reactor (CEM
Discover) and 300 W power was applied for 1.50 min for the derivatisation reaction to occur.
The samples were subjected to centrifugation and the supernatant was collected. Supernatant
(in pyridine) was used for further GC-MS analysis.
3.3.6.2 Analytical High Performance Liquid Chromatography
Analyses were carried out using a Shimadzu HPLC consisting of a Prominence Modular High
Performance Liquid Chromatograph coupled to an UV−Vis Photo-Diode Array detector (SPD-
M20A). The analytical data were evaluated using the Lab Solution software data processing
system (Shimadzu Corporation, Kyoto, Japan). The separation was achieved on a reversed
phase chromatography column (Adsorbosphere XL C18, 5 μm, 150 mm x 2.1 mm) with an
oven temperature of 35 °C. The binary mobile phase consisted of (Reservoir A) 90:10 Milli-Q
water with 1% glacial acetic acid and CH3CN that was combined with a solvent that was

62
(Reservoir B) 10:90 of the same components. The following gradient run was employed: 0-15
min, 0%-100% B; 15-20 min, 100% B and 20-35 min, 0% B; an equilibration time of 15 min
was part of the program. The flow rate was 1.0 mL/min and the injection volume was 10 μL
with the monitoring wavelength being 254 nm.
3.3.6.3 Liquid Chromatography-Mass Spectroscopy (LC-MS)
3.3.6.3.1 Analysis of E. longifolia extract
Initial collection of the bioactive compounds was achieved using a Gilson PLC 2020 personal
purification system. The purity was analysed by using a Shimadzu Liquid chromatography–
mass spectrometer (LC-MS) 2020 with a UV-vis detector (λ=200-400 nm). A Zorbax Eclipse
XDB phenyl column (3.0 mm × 100 mm, 3.5 μm HPLC column was employed with flow rate
of 1 mL/min and oven temperature of 40 °C. The eluents were 0.05% formic acid in water and
0.05% formic acid in CH3CN. Further analysis was performed to obtain accurate masses using
High-resolution mass spectrometry (HRMS) that was performed on a Bruker Micro TOF mass
spectrometer using (-)ESI calibrated to sodium formate. This was undertaken at the Institute of
Molecular Biosciences at the University of Queensland.
3.3.6.3.2 For Southeast Asian plants
3.3.6.3.2.1. Primary analysis
Analyses were carried out using a Shimadzu instrument consisting of a Prominence Modular
Ultra High Performance Liquid Chromatograph (UPLC) coupled with an UV−Vis Photo-Diode
Array detector (SPD-M20A). UPLC was used for analysis because of the limited volumes of
the samples and the analytical data were evaluated using the Lab Solution software data
processing system (Shimadzu Corporation, Kyoto, Japan). The separation was achieved on a
reversed phase chromatography column (Vision HT C18, 1.5 μm, 50 mm x 2 mm) with an

63
oven temperature of 35 °C. The binary mobile phase consisted of (Reservoir A) Milli-Q water
with CH3CN as the second solvent (Reservoir B). The following gradient run was employed:
0-15 min, 0%-100% B and an equilibration time of 10 min was used before the next injection.
The flow rate was 0.2 mL/min and the injection volume was 2 μL with the monitoring
wavelength being 254 nm. For further MS/MS analysis was performed using Varian MS-500
mass spectrometer (Varian Inc., Palo Alto, CA, USA) system equipped with an ion trap mass
analyser having a mass range from 20 to 2000 amu was connected to the UPLC. Electrospray
ionisation (ESI) was operated in negative and positive modes with the ion spray voltage set at
-5000 V and 5000 V, respectively.
3.3.6.3.2.2. Secondary Analysis
Secondary analysis was performed by using a Thermofisher Ultra High Performance Liquid
Chromatography system (UPLC) coupled with benchtop Q-Exactive HF Hybrid Quadrupole
Orbitrap Mass Spectrometer (Thermofisher Scientific USA). Analytical data were evaluated
using the Compound Discoverer software data processing system. The separation was achieved
on a reversed phase chromatography column (Thermo Hypersil Gold C18, 1.9 μm, 50 mm x
2.1 mm) with an oven temperature of 40 °C. The binary mobile phase consisted of (Reservoir
A) Milli-Q water with 0.1% formic acid and 100% CH3CN with 0.1% formic acid as the second
solvent (Reservoir B). The following gradient run was employed: 0-10 min., 2%-95% B, 10-
12 min 95% B solvent and equilibration with 2% B time during 12-15 min. The flow rate was
0.2 mL/min. and the injection volume was 2 μL with the monitoring wavelength being 254 nm.
QE HF MS/MS parameters were Scan mode: Full MS/top 3 DDMS2, polarity: Positive and
Negative switching, MS resolution Full mas 60,000 and DDMS2 12,000, Scan mass range m/z
120-1200, Collision energy Stepped 17, 35 and 52, Dynamic exclusion 10 sec and Apex trigger

64
2-5 sec. QE HF Ion source parameters consist of Sheath gas 45, Aux gas 10, Sweep gas 0,
Spray voltage positive 3500 V and negative 3000 V, Capillary temperature 320 °C and
Vaporizer temperature 350 °C.
3.3.6.4 Nuclear Magnetic Resonance (NMR)
A Bruker Avance-600M Hz NMR spectrometer was used to analyse the structure of the
microbial active compounds from the plant E. longifolia. It was equipped with a Triple
Resonance Probe (TXI cryoprobe) using standard pulse sequences with the resonances
referenced with respect to Tetramethylsilane (TMS) (δH 0.00 and δC ppm). Samples were
analysed by 1H (600 MHz) and 13C (150 MHz) with CDCl3 used as the solvent.
3.3.6.5 Statistical Analysis
All testing was completed in triplicate and the data are presented as mean ± standard deviation
(mean ± SD). Statistical analysis was performed using an online statistical package
MetaboAnalyst 3.0 (TMIC, Edmonton, Canada). Various correlation statistical analysis
methods were used for evaluation of the data. Alternatively, the IBM SPSS Statistical package
V25 was used for some of the earlier statistical analyses (Statistical Package for the Social
Sciences in the USA).
3.4 Method development
3.4.1 Fractionation based on Solid Phase Extraction cartridges
SPE has been extensively used in sample preparation where routine use of this technique is as
a preliminary purifying technique for complex sample mixtures prior to any analysis [148]. An
advantage is that not only does this technique purify the target analyte from the sample mixture
but also results in a more concentrated target due to volume differences between the original

65
sample and the eluting solvent. In the process of method development for the complex mixtures
of compounds in the plant extracts, the SPE extraction technique became the main focus. This
was after considering several separation techniques and it was selected as the most flexible,
fast and cost-effective technique [172] to use as a primary and secondary fractionation platform.
3.4.2 Development of fractionation methods
3.4.2.1 Primary Solid Phase Extraction
The SPE method for the isolation/separation, purification and concentration of the plant
extracts sample before further HPLC analyses was initially characterised using a set of test
standards. The standards used were: Uracil (Sigma U0750-25 g), Phenol (Merck 6010188.05),
Acetophenone (BDH-27030), Anisole (SigmaA4405-1 L), Toluene (Merck 10284), Biphenyl
(Sigma/Aldrich B34656-25g) and Pyrene (Aldrich 18,551.5). All the standard compounds and
their log P values are presented in Figure 24.
Uracil and phenol were dissolved in 100 mL of Milli-Q water and the remainder of the
compounds were dissolved in HPLC gradient grade CH3CN. The standard mixture was
prepared by using 1 mL volumes of each standard listed in Table 3 and was diluted to 20 mL
with Milli-Q water. The mass of each standard was adjusted so that the HPLC peak heights at
an absorbance of 254 nm were approximately constant with the total mass being 100 mg.

66
Table 3: Mass of standard compounds used in the test mixture
Compound Concentration (mg/mL)
Uracil 0.01
Phenol 0.38
Acetophenone 0.02
Anisole 0.20
Toluene 0.40
Biphenyl 0.01
Pyrene 0.02
Disposable syringe cartridge columns were used as the stationary phase and the standard test
mixture was extracted using different proportions of CH3CN and Milli-Q water used as the
mobile phase to generate fractions. Elution occurred upon the addition of an appropriate
organic solvent to disrupt the interactions between the sorbent and the solutes.
3.4.2.2 HPLC analysis
The standard test mixture and the collected fractions after SPE separation were analysed using
HPLC as described in Section 3.3.6.2. The intention of using this standard mixture was to
correlate the solvent composition of the eluting solvent for each fraction with the standard
compound’s log P values. It would be expected that relatively polar compounds would be
eluted in the early fractions and to be isolated from the non-polar compounds. The extent of
the isolation during the fractionation procedure would be revealed by the proportions of each
compound in each fraction as measured by HPLC. The characterization of this fractionation
procedure using standards would enable reasonable estimates of the log P values of the
compounds in the plant extract based on the comparison of HPLC retention times [173].

67
3.4.3 Results and discussion
3.4.3.1 Primary Solid Phase Extraction of the standard test mixture
The fractions were analysed using analytical HPLC by comparison of the retention time for
each individual compounds with the standard mixture before fractionation (Figure 25). All of
the standards were eluted between 0.4 to 12 minutes, which corresponds to the time when the
gradient was active. The most polar compound, uracil (log P=-0.77), was eluted at 0.410 min
and the least polar compound, pyrene (log P=4.88), eluted at 11.366 min.
Figure 25: Analytical HPLC chromatogram of the standard mixture of compounds. Peaks: 1. Uracil, 2. Phenol, 3. Acetophenone, 4. Anisole, 5. Toluene, 6. Biphenyl and 7. Pyrene
Figures 26-27 demonstrate how effectively the SPE fractionation technique was able to
fractionate the complex standard test mixture with the fractionation performed using two
alternate series of CH3CN and Milli-Q water concentration combinations as listed in Table 3.
Uracil eluted in the first fraction as it is normally not retained on the reversed phase column or
the SPE cartridge and is often used as an unretained void volume marker for C18 and C8
columns [174]. The low log P value could be easily correlated to the very polar compounds in
the plant extracts and the retention of phenol demonstrates the practical lower limit of polarity
where the reversed phase separation mechanism is applicable.

68
Phen
ol
Ace
toph
enon
e
Ani
sole
Tolu
ene B
iphe
nyl
Pyre
ne
Figure 26: HPLC chromatogram of SPE eluted fractions from the standard test mixture
Ura
cil

69
(a)
(b)
Figure 27: Components isolated in each fraction for the two series of eluting solvents using
SPE
The relative area of each standard for a series is displayed in Figure 27 with the composition
of the solvent changed by 15% CH3CN for each fraction. The second series is offset by 7.5%
CH3CN from the first series in order to determine the range of solvent compositions that are
able to elute each solute. In both series, the Milli-Q water fraction contained 26% of the phenol
0102030405060708090
100
Sampleloaded
0% 10% 25% 40% 55% 70% 85% 100%
%A
rea
CH3CN Concentration
Series 1 - Standard test mixture fractions Vs %CH3CN
Uracil
Phenol
Acetophenone
Anisole
Toluene
Biphenyl
Pyrene
0102030405060708090
100
Sampleloaded
0% 18% 33% 48% 63% 78% 100%
% A
rea
CH3CN Concentration
Series 2 - Standard test mixture fractions Vs %CH3CN
Uracil
Phenol
Acetophenone
Anisole
Toluene
Biphenyl
Pyrene

70
with the remaining phenol not initially adsorbing and passing through in the sample solvent
during loading. In most cases, a fraction contained only one or two solutes indicating that the
15% step in solvent composition had sufficient separation resolution for the range of test
solutes that were chosen. This is not surprising as the chromatogram in Figure 26 shows that
the test solute retention times are relatively evenly distributed.
When the two series are combined (Figure 28), it can be seen that acetophenone (log P=1.66
± 0.22) elutes over a range of CH3CN compositions between 10% and 33%, with 40% of the
acetophenone eluting in the 25% CH3CN fraction. For anisole (log P=2. 13 ± 0.20), 50% was
extracted in the 40% CH3CN fraction and was distributed in the fractions between 33% and
48% CH3CN. Toluene (log P=2.70 ± 0.17) extracted in fractions between 40% and 63%
CH3CN with most eluting in the 48% CH3CN fraction. Both biphenyl (log P=3.98 ± 0.23) and
pyrene (log P= 5.17 ± 0.17) were extracted in the non-polar solvent range between 63% and
85% CH3CN fractions. The biphenyl is evenly distributed in the 63% and 70% CH3CN
fractions with 50% of pyrene extracted in the 78% CH3CN fraction.
Figure 28: SPE results for the standard test mixture
0
50
100
Loaded 0% 10% 18% 25% 33% 40% 48% 55% 63% 70% 78% 85% 100%
%Ar
ea
% CH3CN
Combined Standard test mixture fractions Vs %CH3CN
Uracil Phenol Acetophenone Anisol Toluene Biphenyl Pyrene

71
This study has demonstrated that a crude primary stage fractionation will be able to produce
fractions that contain a relatively narrow polarity range for the solutes in each fraction.
However, as will become apparent in Section 3.4.2.2, primary fractionation of plant extracts
will still contain a large number of solutes.
3.4.3.2 Secondary fractionation SPE of the standard test mixture
To further examine the need to produce fractions that contained fewer compounds, the same
standard test mixture of compounds was loaded (20 mL) onto a conditioned SPE cartridge.
Similar to the primary fractionation, elution was carried out using 20 mL volumes of Milli-Q
water containing 10% CH3CN and 25% CH3CN. However, the elution with 40% CH3CN was
performed in 1 mL aliquots for 20 times with each 1 mL aliquot collected in a microcentrifuge
tube. To observe how this influenced the extraction process, the primary fractionation was
continued as in elution Series 1 with 20 mL volumes of 55%, 70%, 85% and 100% CH3CN
added and collected, respectively. To examine the profile, all the fractions were transferred into
HPLC glass vials and analysis was completed using analytical HPLC.
Figure 29 shows that reasonably similar results were obtained as for the first four fractions
from Series 1 of the the primary fractionation in Figure 27. When the sample was loaded onto
the conditioned SPE column, 92% of uracil remained in the solvent and the majority of the
phenol has eluted in the 10% CH3CN fraction. Only some acetophenone has started to elute in
the 25% CH3CN fraction whereas in Figure 28, most of it eluted in this fraction.

72
Figure 29: Secondary fractionation of the standard test mixture with 40% acetonitrile/Milli-Q water
The minor variability was due to the manual control of the eluting solvent flow rate. Secondary
fractionation was performed for the 40% CH3CN eluting solvent where it was eluted in twenty 1
mL aliquots (Figure 29). It can be seen that the remaining acetophenone was eluted in fractions
up to 40%-5 CH3CN. It is interesting to observe that the anisole is distributed between fractions
40%-2 CH3CN and 40%-20 CH3CN having only been present in the 40% CH3CN fraction in the
primary Series 1. The fractionation of toluene spreads over a narrower region between the 40%-
7 CH3CN and 40%-14 CH3CN fractions. As in the earlier Series 1, a considerable amount of
biphenyl eluted in 70% CH3CN fraction and pyrene was also quite similar.
3.4.4.3 Eremophila longifolia plant extract separation
The primary fractionation strategy was used for the whole plant extract for E. longifolia and the
HPLC chromatogram is displayed in Figure 30 with the primary fractionation results displayed
in the HPLC chromatograms in Figure 31. Due to the similarity in the stationary phases for the
SPE cartridges and the HPLC column, the fractions contain groups of solutes of similar polarity.
This enables some predictive interpretation of each fraction depending on whether the bioassay
0102030405060708090
100
Load
ed 0% 10%
25%
40-1
40-2
40-3
40-4
40-5
40-6
40-7
40-8
40-9
40-1
040
-11
40-1
240
-13
40-1
440
-15
40-1
640
-17
40-1
840
-19
40-2
055
%70
%85
%10
0%
%A
rea
% CH3CN
Uracil
Phenol
Acetophenone
Anisole
Toluene
Biphenyl
Pyrene

73
of a fraction results in a positive result. As an example, based on the standard test mixture, if a
solute has a retention time between 0 and 2.5 min, then it is most likely they will be a polar
compound with a log P value less than 1.5, similar to phenol. Likewise, if the retention time is
in the 2.5-5 min time range, corresponding to the 18% to 40% CH3CN fractions, then the log P
values would be similar to acetophenone. The 48%-55% CH3CN fractions have retention times
from 5 to 7.5 min time and log P values of approximately 2.1. The group of solutes with retention
times between 7.5-10 min from fractions 48% to 63% CH3CN will have log P values around 2.7.
Solutes with retention times around 12 min from fractions 55%-70% CH3CN will log P values
between 4 and 5.2 based on comparison to biphenyl and pyrene.
Figure 30: The analytical HPLC chromatogram of crude plant extract from E. longifolia
E. longifolia plant extract

74
Figure 31: Analytical HPLC chromatogram of SPE eluted E. longifolia fractions

75
3.5 Conclusions
Plant extracts are a complex mixture containing molecules with a wide range of polarities from
very polar, and possibly ionisable, to relatively non-polar with some selectivity introduced by
the extracting solvent. Generally, bioactivity-guided fractionation to isolate the most active
agent has primarily been attempted using large scale column chromatography techniques with
the goal of isolating quantities on the tens of milligram scale but modern analytical techniques
can easily cope with much less. The SPE based technique has been thoroughly characterised
using known organic compounds with a range of polarities that include uracil, phenol,
acetophenone, anisole, toluene, biphenyl and pyrene. For the selection of these compounds, the
overall polarity of each molecule was estimated on the basis of log P values with polar
compounds having a log P < 2; moderate polarity compounds between 2 and 4 and non-polar
compounds having a log P > 4. It was found that this correlated well with the ability to separate
the mixture of compounds using a binary combination of solvents that span the polarity range.
The overall observation from the secondary fractionation is that it is possible to have fractions
with fewer components but the disadvantage is that the amount of each component is greatly
decreased and this is common with most separation strategies. However, the fractionation
provides similar amounts that are distributed over a wider range of fractions. If this amount is
sufficient to maintain bioactivity, then statistical correlations between the measured amounts
and bioactivity could be a useful way of identifying the bioactive compounds, as will be
explored with E. longifolia and B. lanceolata plant extracts.

76
Chapter 4
Antimicrobial activity of Eremophila longifolia F. Muell

77
4.1 Introduction
The aims of this chapter are to evaluate the antimicrobial properties of the E. longifolia plant
leaves extract and to determine the appropriate extraction method suitable to maximize the
antimicrobial activity. Eremophila longifolia (Scrophulariaceae) is an Australian native plant
that has been used traditionally by Aboriginal elders in order to treat various infective diseases.
An infusion prepared by brewing the leaves of Eremophila can be taken as a treatment for
headaches, to reduce fever and can act as an analgesic [84]. In addition, inhalation of the smoke
from leaves placed on a fire was thought to cure microbial and fungal infections [95].
4.2 Plant collection
Details regarding the plant material are described in Section 3.2.
4.2.1 Sample preparation
Collected plant samples were stored at -20 °C in a freezer until required. The leaves were
inspected for signs of degradation and stems were separated prior to extraction. The selected
leaves were stored in an incubator for 7 days at a temperature of 60 °C in order to remove
excess water. A commercial grinder was used to grind the dried leaves into a fine powder and
the leaf powder was stored at -20 °C in a freezer prior to extraction.
4.3 Extraction of leaves
4.3.1 Different extraction techniques
Numerous extraction methods have been used for obtaining leaf extracts. In the literature, the
most popular extraction techniques are Soxhlet extraction, conventional (traditional)
immersion extraction and accelerated solvent extraction (ASE). The conventional immersion

78
and ASE methods were investigated in this study to determine the optimal extraction conditions
based on antibacterial assays as summarised in Figure 32.
Figure 32: Flow chart of extractions and microbial assessment
4.3.1.1 Conventional extraction method
This extraction method is basically an immersion of the sample in the desired solvent with
occasional gentle agitation over a period of days. This technique has been widely used in recent
decades, as no specialised extraction equipment is required. Approximately 10 g of finely
ground leaves was submerged in separate 250 mL bottles containing either 50 mL CH3CN
(Merck Gradient grade) or 50 mL EtOH (Merck Analytical grade) [175], which were then stored
at ambient temperature (approximately 21 °C) for 5 days with occasional stirring.
4.3.1.2 Conventional extraction method-at different time scales
A consideration of the conventional extraction approach is the uncertainty on how much time
is required to extract the targeted compounds from the plants and this needs to be explored.
Separate amounts of approximately 30 g of finely ground Eremophila leaves were immersed
into separate bottles containing either 150 mL of CH3CN or 150 mL of EtOH, where each was
Solvent extraction
Accelerated Solvent Extraction orConventional extraction
Microbial assesment
Disc Diffusion assay
MIC
MBC

79
stored at room temperature for 7 days for extraction with continuous shaking (170 rpm).
Periodically, 10 mL aliquots of the crude plant extract were removed from each sample at
consecutive intervals of 24, 48, 72, 96, 120, and 168 hours.
The crude extraction aliquot was filtered through a 0.45 µm nylon syringe filter and centrifuged
at 1058 RCF (Relative Centrifugal Force) (Hettich EBA 20) with the supernatant collected.
The supernatant was transferred into a weighed 50 mL Falcon tube and placed in a Speed Vac
(RVC-2-8) solvent evaporator at 40 °C for approximately 8 hours where the solvent was
completely evaporated. The residues were accurately weighed and resuspended in a known
volume of DMSO before the antimicrobial activity was assessed. Another sample series was
prepared for HPLC and GC-MS analysis using EtOH as the solvent with the initial
concentration adjusted to 100 mg/mL for the both analyses. These extracts were stored at -20
°C until required for analysis.
4.3.1.3 Hot water extraction (100 °C boiling water)
This method is particularly relevant to the way that the Australian indigenous people used the
leaves to form a decoction that was consumed to cure headaches and colds, and applied to sores
to treat infections. About 10 g of the ground plant sample was placed in a beaker with 50 mL
of water and boiled at 100 °C for 10 min. The extract was left to cool to room temperature and
then filtered through a 0.45 µm nylon filter. The water was evaporated using a rotary evaporator
and the residue was stored at -20 °C until required. The residues were accurately weighed and
resuspended in a known volume of DMSO before antimicrobial evaluation.

80
4.3.1.4 Accelerated Solvent Extraction using different temperatures
A pressurised Dionex ASE 100 ACE was used that uses nitrogen gas with elevated pressures
(>1000 psi) coupled with temperature regulation (40-200 °C) in order to pass the desired
solvent through the sample. The ASE system has programmable options that include settings
for preferred temperature, extraction time and number of static cycles (number of times the
solvent passes through the sample while heating). These options generally enabled the
extraction procedure to be kept to less than one hour as opposed to the conventional method
extraction time, which was five days. About 10 g of the ground leaf sample was placed in a 34
mL ASE sample cell. The static time was constant (10 min) for all the extractions and the
variable temperatures used in the separate extractions were 40, 80 and 120 °C for both CH3CN
and EtOH solvents.
4.4 Extraction efficiency analysis
4.4.1 Assessment of antimicrobial activity
4.4.1.1 Bacterial strains and media
Eleven bacterial isolates and one fungal strain were used in this study. The bacterial and fungal
strains were collected from the Microbiology Laboratory at Swinburne University of
Technology. Apart from the bacteria described in Section 3.3.3, two clinical isolates and two
more laboratory bacterial strains were utilised. E. coli (O157:H7) and Vancomycin-Resistant
Enterococci (VRE) were employed as clinical isolates and the facultative anaerobic Gram-
positive Streptococcus mutans and aerobic Streptococcus sobrinus were tested.
The bacteria were subcultured on Brain Heart Infusion agar slants as described in Section 3.3.4.
Fresh cultures of E. coli and VRE were prepared by inoculating approximately 2 mL of Brain
Heart Infusion Broth with a loopful of microorganism from the slant cultures. Bacterial broth

81
cultures were incubated at 37 °C overnight under aerobic conditions as previously described
for the other bacteria isolates used in inhibitory assays. S sobrinus was incubated at 37 °C for
48 hours in aerobic conditions and S. sobrinus was grown at 37 °C for 48 hours in anaerobic
conditions using the candle jar technique [176].
There are a number of approaches that are commonly employed for the evaluation of
antibacterial activity of plant extracts. Disc diffusion assay (DDA) and plate-hole diffusion
assay (PHDA) are the most effective techniques employed in microbial assessments [177]. In
this study, DDA was used to assess the antimicrobial activity with commercially available 6
mm diameter sterile discs used as controls. The test culture for the DDA was prepared by
adjusting the concentration with sterile water to a 0.5 McFarland standard and was transferred
to the agar in a Petri dish using a cotton swab. A volume of 20 µL of the extracts from the
different extraction methods, where the concentration was 100 mg/mL in DMSO, was added
to the sterile disc and the discs were then placed on the agar plate. The agar plates were then
incubated at a specific temperature depending on the organism, as already described, and the
zones of inhibition for bacterial growth were measured in terms of a circular diameter in mm
[178]. A commercial tetracycline (30 µg) antibiotic disc was used as the positive control and 20
µL of DMSO was applied to a sterile disc as the blank in these experiments. All the assays
were performed in triplicate.
The microplate reader technique is a rapid alternative method for testing biological activity and
the instrument is designed to measure the optical density of samples at a desired wavelength in
a microtitre plate. This method is particularly useful in determining MIC and MBC values for
test compounds [178-179] and is suitable as a biological assessment technique for assessing crude
plant extracts [180]. General aspects in the determination of MIC and MBC values for bacteria

82
using this technique are described in Sections 3.3.4.2 and 3.3.4.3. However, additional specific
details for these experiments are that the initial concentration of the plant extract was 100
mg/mL and 100 µL of the plant extract was added to the first well. The doubling serial dilutions
started from the 100 mg/mL well and continued to 0.0488 mL with 10 µL of fresh bacterial
cultures (grown overnight and adjusted to a 0.5 McFarland standard) added into each well.
Tetracycline (1 mg/mL initial concentration) was applied as a positive control and DMSO was
the blank. The 96 well microtitre plates were incubated according to the desired temperatures
of the test bacteria and fungi. The activity of each well was estimated based on the measurement
of the absorbance at a wavelength of 600 nm [181]. All the assays were performed in triplicate
and the median of the MIC and MBC values were taken into the consideration.
4.4.2 HPLC analysis
The HPLC method that was used in these experiments is described in Section 3.3.6.2.
4.4.3 GC-MS analysis
General aspects related to GC-MS are contained in Section 3.3.6.1. However, the temperature
program used for these experiments was as follows: Initially 50 °C for 2 min, followed by an
increase of temperature to 280 °C (at a heating rate of 20 °C min-1) that was then held for 28
min.
4.5 Results and Discussion
4.5.1 Solvent optimisation
The choice of the solvent in an extraction can influence the compounds that are extracted as
dissolution of the compounds will depend on their relative solubility in the extraction solvent.
The solvents CH3CN and EtOH were examined as the primary solvents because they are the

83
most compatible with reversed phase liquid chromatography, which was the main analytical
tool utilised. Previous literature shows that the crude E. longifolia extracts were obtained with
EtOH and MeOH [85]. EtOH is a common polar protic solvent that is used for extraction with a
dielectric constant of 24.55 and a dipole moment of 1.69 D [182]. The polarity is due to the
alcohol group (-OH) present in the molecule, which contains the highly electronegative oxygen
atom that is able to bond with other molecules. The molecule also has an ethyl group (-C2H5),
that has relatively non-polar characteristics as well [183]. Thus, EtOH can extract both polar and
non-polar compounds from plant leaves [184].
Acetonitrile is a widely used solvent in HPLC but it has not been employed as a solvent in the
extraction of Eremophila species. CH3CN is an intermediate polar aprotic solvent with a higher
dielectric constant than EtOH of 38.8 and also has a larger dipole moment of 3.92 D. In this
sense, it can be expected that is should extract a wider range of polar and nonpolar compounds
[185].
Extraction efficiencies of each solvent using the conventional immersion approach and hot
water extraction are presented in Table 4. The data indicate that the bioactivity assays of the
crude extract obtained with CH3CN displayed significantly lower MIC and MBC values
compared to EtOH and the hot water extracts.

84
Table 4: Minimum inhibitory, bactericidal and fungal concentrations for E. longifolia leaves extracted using different solvents and hot water
decoction extraction against various organisms
Extraction Type
Concentration (µg/mL )c
E. coli P. aeruginosa S. enterica M. catarrhalis S. pyogenes B .cereus S. aureus C. albicans S. mutans S. sobrinus
EtOH Extracta
MIC 1563 391 1563 781 1563 391 391 3125 781 781 MBC/MFC 1563 391 3125 781 1563 391 391 3125 1563 1563
CH3CN Extractb
MIC 781 195 781 391 781 195 98 391 391 781 MBC/MFC 781 195 3125 391 781 195 98 391 1563 1563
Hot water Extract
MIC 1563 781 3125 781 3125 ≥6250 ≥6250 6250 1563 ≥6250 MBC/MFC 1563 781 3125 781 3125 ≥6250 ≥6250 6250 3125 ≥6250
MBC, minimum bactericidal concentration; MFC, minimum fungicidal concentration; MIC, minimum inhibitory concentration.
a, b E. longifolia leaf extraction using the conventional method.
Tetracycline (1 mg/mL initial concentration) and DMSO were applied as controls.
c Average of triplicate results.

85
The MIC and MBC values against E. coli for the CH3CN plant extract were both 781 µg/mL
whereas the EtOH and hot water extracts produced slightly higher results with MIC and MBC
values of 1563 µg/mL. For P. aeruginosa, the CH3CN plant extract once again had the lowest
MIC and MBC concentration of 195 µg/mL followed by EtOH with 391 µg/mL and hot water
with 781 µg/mL. The CH3CN plant extract displayed the lowest MIC against S. enterica
compared to other solvent extracts with the MBC values being the same for the all extraction
solvents at 3125 µg/mL. Ethanol and hot water extracts showed similar MBC and MIC
concentrations of 781 µg/mL against M. catarrhalis and the CH3CN extract had MBC and MIC
concentrations of 781 µg/mL.
Considering the Gram-negative bacteria, all of the extracts showed the lowest MBC and MIC
against P. aeruginosa and M. catarrhalis. For the Gram-positive bacteria, the CH3CN extract
had MIC and MBC that are remarkably low for S. aureus, with a value of 98 µg/mL, whereas
the hot water extract has values greater than 6250 µg/mL. The other bacteria, S.pyogenes and
B. cereus, along with the fungi C. albicans showed a similar pattern to the S. aureus isolate
against the extracts.
The cariogenic species S. mutans and S. sobrinus [186] are closely associated with formation of
dental caries within the teeth, especially in pre-school children [187]. Some research illustrated
that both of these bacteria isolates are considered to be the major etiologic agents for tooth
decay [188], which is related to their acid tolerance capacity [189]. Table 4 shows that the hot
water extract had a comparatively insignificant effect against either of S. mutans and S.
sobrinus. However, the EtOH and CH3CN extracts displayed similar MBC and MIC values
against both bacteria.

86
In summary, when comparing three different extraction methods, the CH3CN extract showed
the lowest MBC and MIC values and the hot water extract has displayed the highest values
against the broad range of selected pathogenic Gram-positive, Gram-negative and yeast
isolates. Thus, further extractions were limited to the solvents CH3CN and EtOH.
4.5.2 Maximising extraction yield using different extraction techniques
4.5.2.1 Conventional extraction method versus ASE with different extraction
temperatures
ASE is the most rapid technique for extracting compounds from plant materials and the whole
extraction can be done in 30 minutes when using elevated temperature and pressure [190]. The
results in Table 5 illustrate that the EtOH extraction solvent produces the highest percentage
yields under all conditions compared to extractions with CH3CN. For the conventional
extraction method, both EtOH and CH3CN extraction percentage yields were comparatively
lower than the ASE producing 7.63% and 2.14%, respectively. The ASE extraction yield
generally increases with temperature except for conditions using CH3CN at a temperature of
80 °C but it appears that the yields for 40 °C and 80 °C are quite similar and only significantly
increases at 120 °C.

87
Table 5: Yield extraction efficiency for different extraction methods
Extraction Method Extraction Efficiency (%)
EtOH CH3CN
Conventional extraction 7.63 2.14
ASE 40 °C 12.50 6.53
ASE 80 °C 13.22 5.18
ASE 120 °C 20.23 9.14
Figure 33 contains HPLC chromatograms of the crude plant extract from E. longifolia using
CH3CN as the solvent for different temperatures from ASE and the conventional method.
Comparison of the three chromatograms A, B and C with D indicates a higher intensity for the
ASE extractions relative to the conventional method with slightly below 1x10⁶ AU for the
largest peak compared to only 4x10⁵ AU for the same peak. The profiles for A to C are quite
similar but there are noticeable differences compared to chromatogram D where some peaks
are much smaller, such as around 8 minutes, and some peaks at around 16 minutes are much
larger. Furthermore, it was noticeable that the ASE extracts were much greener compared to
the conventional extract reflecting the greater yields for the ASE method. All of the extracts
were prepared at the same concentration for analysis using HPLC.
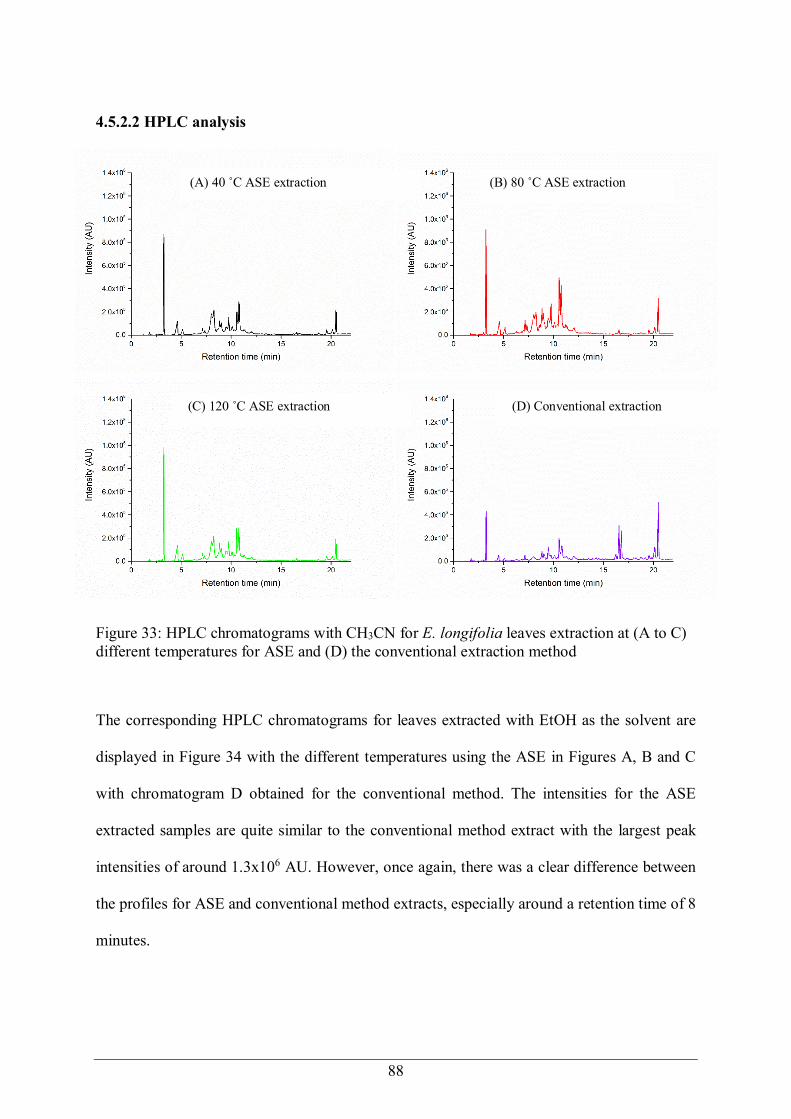
88
4.5.2.2 HPLC analysis
Acetonitrile extractions
Figure 33: HPLC chromatograms with CH3CN for E. longifolia leaves extraction at (A to C) different temperatures for ASE and (D) the conventional extraction method
The corresponding HPLC chromatograms for leaves extracted with EtOH as the solvent are
displayed in Figure 34 with the different temperatures using the ASE in Figures A, B and C
with chromatogram D obtained for the conventional method. The intensities for the ASE
extracted samples are quite similar to the conventional method extract with the largest peak
intensities of around 1.3x10⁶ AU. However, once again, there was a clear difference between
the profiles for ASE and conventional method extracts, especially around a retention time of 8
minutes.
(D) Conventional extraction
(C) 120 ˚C ASE extraction
(A) 40 ˚C ASE extraction
(B) 80 ˚C ASE extraction

89
Figure 34: HPLC chromatograms with EtOH for E. longifolia leaves extraction at (A to C) different temperatures for ASE and (D) the conventional extraction method
4.5.2.2 GC-MS analysis
The corresponding GC-MS chromatogram from extractions using CH3CN as the solvent are
displayed in Figure 35. Chromatograms A, B, and C show the ASE extractions at different
temperatures and the conventional extraction is presented in chromatogram D. Compared to
the HPLC chromatograms for the same sample in Figure 33, there are substantially more peaks
due to the greater resolution available in gas chromatography [191].
(C) 120 ˚C ASE extraction
(A) 40 ˚C ASE extraction
(B) 80 ˚C ASE extraction
(D) Conventional extraction

90
Figure 35: GC-MS chromatograms with CH3CN for E. longifolia leaves extraction at (A to C) different temperatures for ASE and (D) the conventional extraction method
Comparison of the profiles for the ASE extracts shows that there are noticeable differences,
particularly for the highest temperature. However, these differences are relative minor when
they are compared with the chromatogram obtained for the conventional method.
(A) 40 ˚C ASE extraction
(B) 80 ˚C ASE extraction
(C) 120 ˚C ASE extraction
(D) Conventional extraction

91
Figure 36: GC-MS chromatograms with EtOH for E. longifolia leaves extraction at (A to C) different temperatures for ASE and (D) the conventional extraction method
GC-MS chromatograms for extractions using EtOH as the solvent are contained in Figure 36
with chromatograms A, B and C obtained from ASE extractions and chromatogram D resulting
from the conventional method. A similar behavior pattern was observed in EtOH as was seen
with CH3CN.
4.5.2.3 Bioguided identification assays
4.5.2.3.1 Disc Diffusion Assays
The bioactivity of the various extracts was initially tested using two Gram-positive and one
Gram-negative bacteria with the DDA method. Average zones of inhibition from triplicate
(D) Conventional extraction
(A) 40 ˚C ASE extraction
(B) 80 ˚C ASE extraction
(C) 120 ˚C ASE extraction

92
measurements are presented in Figure 37 and reported in Table 6. Tetracycline was used as the
positive control with dried ethanol and acetonitrile discs used as negative controls.
Figure 37: Examples for antibacterial activity using DDA for different organisms (S. enterica and S. aureus) and a range of extracts. SA refers to the CH3CN extracts and AA are the EtOH extracts

93
Table 6: Antibacterial activity for different organism from various extracts obtained using
DDA Extraction Method B. cereus S. enterica S. aureus
Zone of inhibition in mm
EtOH - - -
Conventional extraction 12 12 15
ASE 40 °C 9 - 15
ASE 80 °C 9 - 13
ASE 120 °C 9 - 14
CH3CN - - -
Conventional extraction 16 20 19
ASE 40 °C 12 10 25
ASE 80 °C 10 9 18
ASE 120 °C 8 12 15
Tetracycline (30µg) 28 25 35
Extract concentration is 100 mg/mL and 20 µL of extract was added to each disc. Pure solvents were used as negative controls.
The conventional method for both CH3CN and EtOH extracts produced larger zones of
inhibition against the bacteria tested compared to the ASE extracts, with the exception of the
CH3CN ASE 40 °C extract against S. aureus. It is also apparent that an increased temperature
for the ASE method actually decreased the bioactivity for these extracts. The highest
temperature resulted in the highest yield of extract but clearly the extra mass that is extracted
is not bioactive and indicates that the external part of the plant contains the most antimicrobially
active compounds. This is not surprising as most microbial exposure will occur on the external
surfaces and this is where the defensive chemicals need to be located.

94
For the two solvents used for the conventional method, it is the CH3CN solvent that generally
showed higher zones of inhibition compared to EtOH. However, it is noted that the single
largest zone of inhibition is observed against S. aureus for the ASE method at 40 °C but because
it is less effective against the other two organisms compared to the conventional CH3CN
extraction, it has not been considered further. Therefore, based on these results, CH3CN is the
best solvent using the conventional method for extractions of E. longifolia leaves.
4.5.2.3.2 Assessment of MIC and MBC/MFC
To confirm the observations from the DDA experiments described in the previous section, a
more elaborate and detailed study was undertaken with an increase in the range of organisms
tested with values for MIC and MBC/MFC measured. Following the format of the results from
the previous DDA, the measured MIC and MBC/MFC results are listed in Table 7.
The extract obtained from the convention extraction method using CH3CN displayed the lowest
MBC and MIC values against Gram-negative E. coli, P. aeruginosa, and M. catarrhalis.
Similar results were obtained for the Gram-positive bacteria, namely B. cereus, S. aureus, S.
mutans, S. sobrinus and S. pyogenes with MIC values ranging from 98 µg/mL to 781 µg/mL
and MBC values ranging from 98 µg/mL to 1563 µg/mL. Likewise, the yeast C. albicans
behaved in a similar manner with both MIC and MFC values being 391 µg/mL. Overall, the
lowest MBC and MIC values were 98 µg/mL against S. aureus.

95
Table 7: Minimum inhibitory, bactericidal, and fungicidal concentrations of E. longifolia leaf extracts using various extraction conditions
Solvent Extraction Type Concentration (µg/mL )
E.coli P.aeruginosa S. enterica M. catarrhalis S. pyogenes B. cereus S. aureus C.albicans S. mutans S. sobrinus
EtOH Conventional MIC 1563 391 781 781 1563 391 391 3125 1563 781
MBC/MFC 1563 391 1563 781 1563 391 391 3125 3125 781
ASE 40 °C
MIC 1563 391 781 781 3125 781 391 3125 781 781
MBC/MFC 1563 391 1563 781 3125 781 391 3125 1563 781
ASE 80 °C
MIC 1563 185 781 781 3125 391 781 3125 1563 781
MBC/MFC 1563 185 1563 781 3125 391 781 3125 3125 781
ASE 120 °C
MIC 1563 391 781 195 3125 391 391 3125 391 781
MBC/MFC 1563 391 1563 195 3125 391 391 3125 781 781
CH3CN Conventional MIC 781 195 781 391 781 195 98 391 391 391
MBC/MFC 781 195 1563 391 781 195 98 391 1563 391
ASE 40 °C
MIC 1563 391 781 195 1563 391 195 1563 391 781
MBC/MFC 1563 391 781 195 1563 391 195 1563 1563 781
ASE 80 °C
MIC 1563 391 781 195 3125 781 391 781 391 781
MBC/MFC 1563 391 1563 195 3125 781 391 781 1563 781
ASE 120 °C
MIC 781 391 781 391 3125 781 1563 3125 781 1563
MBC/MFC 781 391 1563 391 3125 781 1563 3125 1563 781
MBC, minimum bactericidal concentration; MFC, minimum fungicidal concentration; MIC, minimum inhibitory concentration.
Tetracycline (1 mg/mL initial concentration) and DMSO were applied as controls.
Averages of triplicate results.
96
The ASE extracts were less active and the DDA result observed for the ASE extract at 40 °C
against S. aureus has not been repeated. Once again, the EtOH extracts were less active than
CH3CN extracts.
4.5.2.3.3 Assessment of MIC and MBC/MFC against clinical isolates
To further establish the preferred extraction solvent and method, these extracts were tested
against clinical isolates and the results are included in Table 8. The isolate E. coli O157:H7 is
not a common bacterium used in teaching laboratories as it can be responsible for cases of
severe gastroenteritis and has caused Haemolytic uraemic syndrome in America and Europe,
with children suffering from acute renal failure [192]. Another clinical isolate, Vancomycin-
Resistant Enterococcus (VRE) is a Gram-positive bacterium that is resistant to vancomycin
and can cause infection in the urinary tract, heart conditions like endocarditis, secondary
infections in wounds and blood poisoning [193].
The results for all extraction conditions against E. coli O157H7 displayed similar MIC and
MBC values of 781 µg/mL and 1563 µg/mL, respectively. The variation in the values
previously observed for E. coli using the various extraction methods that are listed in Table 7
has not been repeated in Table 8 for this clinical isolate but, clearly, the E. longifolia extracts
have bioactivity.
The VRE susceptibility was higher in all the EtOH extracts with MIC and MBC values ranging
between 781 µg/mL and 3125 µg/mL, with the majority being 1563 µg/mL. However, the
extract from the conventional method using CH3CN has the lowest MIC and MBC values at
781 µg/mL. It is interesting to note that the ASE extraction at 120 °C showed the highest MIC
and MBC values of 1563 µg/mL and 6250 µg/mL, respectively.

97
Table 8: Minimum inhibitory and bactericidal concentrations of E. longifolia leaf extracts
using various extraction conditions
Solvent Extraction Type Concentration (µg/mL )C against
E. coli O157:H7
VRE M259849
EtOH Conventional MIC 781 781
MBC 1563 1563
ASE 40 °C
MIC 781 1563
MBC 1563 3125
ASE 80 °C
MIC 781 1563
MBC 1563 1563
ASE 120 °C.
MIC 781 1563
MBC 1563 1563
CH3CN Conventional MIC 781 781
MBC 1563 781
ASE 40°C
MIC 781 781 MBC 1563 1563
ASE 80°C
MIC 781 781
MBC 1563 1563
ASE 120°C
MIC 781 1563
MBC 1563 6250
MBC, minimum bactericidal concentration; MIC, minimum inhibitory concentration.
Tetracycline (1 mg/mL initial concentration) and DMSO were applied as controls.
Averages of triplicate results
In summary, all of these studies consistently demonstrated that extractions based on the
conventional method produced an extract that showed more inhibitory activity against the
tested microorganisms compared to ASE methods. However, the CH3CN traditional method
extract displayed the lowest MIC and MBC values in all of the antimicrobial testing. The
conclusion was to use CH3CN as the solvent for the conventional extraction method in further
experiments.

98
4.5.2.4 Time dependence for the conventional method
Conventional extraction of E. longifolia using CH3CN as the solvent for 120 hours was found
to be the most effective conditions to obtain maximum bioactivity. However, a further study to
identify the optimum extraction time was undertaken with times of 24, 48, 72, 96, 120 and 168
hours. The extracts were analysed using HPLC, GC-MS and bioactivity assays.
4.5.2.4.1 Chromatographic analysis
The HPLC results are included in Figure 38 with the chromatograms for 24, 48, 72 and 96
hours of extractions being quite similar but with slightly smaller peaks compared to 120 and
168 hours. Figure 39 contains the GC-MS chromatograms with extracts for 120 and 168 hours
showing the most peaks.

99
Figure 38: HPLC chromatograms from the conventional extraction of E. longifolia leaves using CH3CN with various times represented in A to F
(B) 48 Hours (A) 24 Hours
(C) 72 Hours (D) 96 Hours
(E) 120 Hours (F) 168 Hours

100
Figure 39: GC-MS chromatograms from the conventional extraction of E. longifolia leaves using CH3CN with various times represented in A to F
(A) 24 Hours (B) 48 Hours
(C) 72 Hours (D) 96 Hours
(E) 120 Hours (F) 168 Hours

101
4.5.2.4.2 Bioactivity assays
The extracts were tested for their MIC and MBC/MFC against a range of pathogens and the
results are presented in Table 9. It appears that the extraction time has had no effect on activity
against M. catarrhalis and the fungus C. albicans with both MIC and MBC values being
consistent for all of the extraction times. The extracts showed decreased activity as the
extraction time increased against E. coli, S. enterica, B. cereus and S. aureus, but mostly for
their MIC values. A similar pattern of activity was observed against P. aeruginosa, S. pyogenes
and S. mutans, except that activity was restored after extended extraction times, with the
optimum time being 95-120 hours. As these tests are based on an equal initial concentration of
the total extract, this suggest that extended extraction times result in inactive material being
extracted and subsequent dilution of the active compounds. It is interesting to note that the
maximum activity against S. sobrinus was achieved with the shortest extraction time of 24
hours and then decreases with a plateau as the extraction time increases.

102
Table 9: Minimum inhibitory, bactericidal and fungicidal concentrations of E. longifolia leaf extracts using different times with conventional CH3CN extraction.
CH3CN Extraction
Concentration (µg/mL)
E. coli P. aeruginosa S. enterica M.catarrhalis S. pyogenes B. cereus S. aureus C. albicans S. mutans S. sobrinus
24 hours MIC 3125 781 781 391 1563 3125 391 781 1563 195 MBC/MFC 6250 1563 1563 781 3125 ≥6250 3125 1563 6250 195
48 hours MIC 3125 781 781 391 781 3125 391 781 6250 781 MBC/MFC ≥6250 1563 1563 781 1563 ≥6250 3125 1563 6250 781
72 hours MIC 1563 391 781 391 781 3125 391 781 6250 391 MBC/MFC 6250 1563 1563 781 1563 ≥6250 3125 1563 6250 391
96 hours MIC 3125 391 781 391 781 3125 391 781 6250 391 MBC/MFC 3125 1563 1563 781 1563 6250 3125 1563 6250 391
120 hours MIC 781 391 391 391 3125 781 195 781 6250 391 MBC/MFC 1563 781 1563 781 3125 6250 3125 3125 6250 391
168 hours MIC 781 391 391 391 3125 781 195 781 6250 391 MBC/MFC 1563 1563 1563 781 3125 6250 3125 3125 ≥6250 391
MBC, minimum bactericidal concentration; MFC, minimum fungicidal concentration; MIC, minimum inhibitory concentration.
Tetracycline (1 mg/mL initial concentration) and DMSO were applied as controls.
Averages of triplicate results.

103
4.6 Conclusions
In this chapter, the extraction conditions for E. longifolia leaves were optimised based on
antimicrobial assays. The effects of solvent, time, temperature and automation were
investigated and the conventional CH3CN immersion method at room temperature for 120
hours (5 days) was found to produce the best bioactivity results. Although the ASE was very
efficient based on the extraction yields, subsequent testing showed that much of these extracts
were inactive. Furthermore, the inactive compounds increased the complexity of the sample
and would likely make the identification of the active components more challenging.

104
Chapter 5
Phytochemical identification of Eremophila longifolia
F. Muell

105
5.1 Introduction
It was demonstrated in Chapter 4 that extracts of E. longifolia have antimicrobial activity
against a broad range of microorganisms. The extraction conditions for obtaining the
maximum bioactivity were optimised and, in this chapter, the separation, isolation and
characterisation of the bioactive compounds will be described. Experiments based on
bioguided fractionation followed by instrumental analysis have identified a number of
bioactive compounds.
Preliminary fractionation of the crude plant extract was completed using a solid phase
extraction method with these extracts analysed using GC-MS. Further bioguided fractionation
was accomplished by using an automated HPLC fraction collector. Identification was
determined from information obtained from NMR and LC-HRMS.
5.2 Extraction, isolation and characterisation
5.2.1 Fractionation of the E.longifolia plant extract
Crude plant extracts are very complex mixtures that contain hundreds of different secondary
metabolites and the nature of these different metabolites varies considerably for any given
extract. It follows that it is very challenging to isolate the active antimicrobial compounds
without any primary bioguided fractionation. Preliminary fractionation was performed in order
to separate the complex mixture of compounds in plant extracts as described in Section 3.3.1.
For the primary fractionation, 100 mg of crude plant extract was loaded onto a solid phase
cartridge. The antimicrobial activity of the fractions was measured to identify the fraction
where the compounds responsible for the inhibitory activity had been isolated.

106
5.2.2 GC-MS analysis
General aspects related to GC-MS are contained in Section 3.3.6.1. However, the temperature
program used for these experiments was as follows: linear temperature ramp from 50 °C to 250
°C over 12 min and then hold at 250 °C for a further 18 min. All fractions were evaporated to
dryness and reconstituted in 900 µL ethanol with 1 µL injected into the GC-MS. The mass scan
range was set to 50–600 amu and the solvent delay time was 5 min to avoid detector saturation
5.2.3 NMR Analysis
NMR analysis was performed using a Bruker Avance-600 MHz spectrometer equipped with a
TXI cryoprobe using standard pulse sequences with the resonances referenced to TMS (δH 0.00
and δC 0.0 ppm). NMR spectra for 1H (600 MHz) and 13C (150 MHz) were obtained in CDCl3.
5.3 Antimicrobial and antifungal assays
5.3.1 Assessment of biological inhibitory activity of separated fractions
5.3.1.1. Disc diffusion assay
The solvent for the separated fractions was removed and the extract was resuspended in 100
µL of DMSO and 20 µL was deposited onto blank discs placed on freshly prepared B. cereus
spread over Nutrient Agar plates as described in Section 3.3.4.1. Zones of inhibition were
recorded for each fraction.
5.3.1.2 MIC antimicrobial assays
Bacteria were obtained from American Type Culture Collection (ATCC; Manassas, VA, US)
or Network on Antimicrobial Resistance in S. aureus (NARSA). The pathogenic
microorganism isolates used for the bioguided fractionation are:

107
• Gram-positive bacteria, B. cereus (ATCC 11778), S. aureus (MRSA ATCC 43300,
GISA NRS17, GISA MRSA NRS1, VRS10 GRSA), Streptococcus pneumoniae (MDR
ATCC700677), Enterococcus faecalis (vanA clinical isolate) and Enterococcus faecium
(MDR vanA 15559)
• Gram-negative bacteria, E. coli (FDA control ATCC 25922) and Acinetobacter
baumannii (ATCC 19606)
The tested bacteria strains were cultured in Mueller-Hinton broth (MHB) (Bacto Laboratories,
cat. no. 211443) at 37 °C overnight with shaking (200 RPM). A sample of each culture was
then diluted 40-fold in fresh MHB and incubated with shaking (200 RPM) at 37 °C for 2-3
hours. A dose response MIC assay was performed using a standard microdilution assay
according to the Clinical and Laboratory Standard Institutes (CLSI) guidelines. The
compounds were serially diluted two-fold across the wells of 96-well plates (Corning; cat. no.
3370, polystyrene plates), with concentrations ranging from, 0.06–128 μg/mL, plated in
duplicate. The resultant mid-log phase cultures were diluted to the final concentration of 1 ×
106 CFU/mL, then 50 µL was added to each well of the compound-containing plates, giving a
final compound concentration range of 0.03–64 µg/mL and a final cell density of 5 × 10⁵
CFU/mL. Plates were covered and incubated at 37 °C for 24 hours. MIC values were
determined visually, being defined as the lowest concentration showing no visible growth.
Vancomycin. HCl (Sigma 861987), daptomycin (Molekula 64342447), colistin sulfate (Sigma
C4661) and polymyxin B sulfate (Sigma P4932) were used as control inhibitors. All work was
conducted in a biosafety cabinet class II.

108
5.3.1.3 Antifungal assays
Fungal strains C. albicans (ATCC 90028) and an encapsulated yeast Cryptococcus neoformans
(H99 ATCC 208821) were obtained from American Type Culture Collection (ATCC;
Manassas, VA, US). An 8-point dose response MIC assay was performed using a standard
microdilution assay. The compounds were serially diluted two-fold across the wells of 384-
well plates (Corning; cat. no. 3680, polystyrene plates), with concentrations ranging from, 1–
128 μg/mL, plating 25 μL in duplicate. Fungi were cultured for 3 days on Yeast Extract-
Peptone Dextrose (YPD) agar at 30 °C. A yeast suspension of 1 × 10⁶ to 5 × 10⁶ cells/mL (as
determined by OD530) was prepared from five colonies. These stock suspensions were diluted
with Yeast Nitrogen Base (YNB) broth to a final concentration of 2.5 × 10³ CFU/mL. Then, 25
μL of the fungal suspension was added to each well of the 384-well compound-containing
plates, giving final concentrations in the range of 0.5–64 µg/mL for the tested samples. Plates
were covered and incubated at 35 °C for 24 hours without shaking. To aid visualization of C.
neoformans growth, 0.001% resazurin (Sigma R7017) was added to each well and incubated
for a further 2 hours at 35 °C. MIC values were then determined visually for both strains, being
defined as the lowest concentration showing no visible growth. Fluconazole (Sigma; F8929)
was used as a control inhibitor. All work was conducted in a biosafety cabinet class II.
5.3.1.4 Cytotoxicity assays
HEK293 human embryonic kidney cells (ATCC® CRL-1573) and HepG2 hepatocellular
carcinoma cells (ATCC® HB-8065) were seeded as 6000 and 5000 cells/well, respectively, in
clear bottom 384-well plates (Corning® 3712) in a volume of 20 µL in DMEM medium
(GIBCO-Invitrogen, cat. no. 11330032), in which 10% FBS was added. Cells were incubated
for 24 hours at the temperature of 37 °C in 5% CO2 to allow the cells to attach to the plates.
Active compounds were dissolved in DMSO at 10 mg/mL and a dilution series of 1:3 fold steps

109
in cell culture medium was created with a final compound concentration range of 50–0.39
µg/mL in a 40 µL final assay volume. The final DMSO concentration was 1%. The cells were
incubated with the compounds for 24 hours at 37 °C and 5% CO2. After incubation, 10 µM
resazurin in PBS (Sigma R7017) was added to each well and the plates were incubated for a
further 3 hours at 37 °C, 5% CO2. The fluorescence intensity was read using a TECAN Infinite
M100 Pro Plate reader with excitation/emission at 560/590 nm. The data from four replicates
were analyzed using GraphPad Prism software (version 6) and the results were calculated using
the following equation:
%Viability = 100 (FITEST – FINEGATIVE) / (FI1%DMSO –FINEGATIVE) (1)
Tamoxifen (Sigma T5648) was the positive control and had an IC50 of 23 µg/mL.
5.4 Results and discussion
5.4.1 Primary fractionation
As described in Section 3.3.5.1.1, two different SPE fractionation series using different ratios
of CH3CN and H2O were carried out and the results of the DDA for antimicrobial activity
against B. cereus for Series 1 are shown in Figure 40 with Figure 41 showing Series 2. Table
10 contains a summary of the measured zones of inhibition. The highest activity was found in
the 25% CH3CN/H2O fraction from Series 1 with a 14 mm zone of inhibition. This is similar
to Series 2 where the 18% CH3CN/H2O fraction has a zone of 11 mm. When considering both
series together, the activity covers the range of 18% to 55% CH3CN/H2O and when compared
to the standard test mixture that was used in Section 3.4.1, these results indicate that most of
the active compounds are probably in the moderately non-polar range with log P values
between 1.9 and 2.5.

110
Figure 40: Bioactivity against B. cereus from the Series 1 fractions in DDA.
Figure 41: Bioactivity against B. cereus from the Series 2 fractions in DDA.

111
Table 10: DDA bioactivity against B. cereus of CH3CN/H2O from Series 1 and 2 fractions.
Series 1 CH3CN/H2O ratio
Zone of inhibition (mm)
Series 2 CH3CN/H2O ratio
Zone of inhibition (mm)
Eluted - Milli-Q water - Eluted - 10% - Milli-Q water - 25% 14 18% 11 40% 11 33% 9 55% 10 48% 9 70% - 63% - 85% - 78% - 100% - 100% -
5.4.2 GC-MS analysis
GC-MS has two main advantages compared to conventional HPLC, with GC having higher
chromatographic resolution compared to LC and the GC-MS having a searchable mass spectral
database whereas the HPLC has a diode array detector that provides only rudimentary UV-
Visible spectra. For these reasons, GC-MS analysis was completed on all of the fractions and
the chromatograms were compared for the active and non-active fractions in order to identify
the bioactive compounds in the plant extract. A comparison of the GC-MS chromatograms for
an active fraction in Figure 42 with an inactive fraction in Figure 43 showed that the biggest
change in intensity occurred for a peak with a retention time of 8.98 min and a mass spectral
database search identified 2-methoxy-4-vinyl phenol as a potential compound of interest. The
Wiley GC-MS library database match was identified with a very high probability of 95% and
the chemical structure is presented in Figure 44.

112
Figure 42: GC-MS chromatogram of an active fraction of E. longifolia against B. cereus
Figure 43: GC-MS chromatogram of non-active fraction of E. longifolia against B. cereus. In this figure the red star indicates 2-methoxy-4-vinyl phenol
Figure 44: Chemical structure of 2-methoxy-4-vinyl phenol
This is a commercially available chemical and to confirm the database identification, the pure
compound was analysed under the same conditions as shown in Figures 45 and the retention
time was also 8.98 minutes.

113
Figure 45: GC-MS chromatogram of 2-methoxy-4-vinyl phenol
The GC-MS analysis confirmed that the 2-methoxy-4-vinyl phenol retention time and spectra
were identical for the pure standard and the active fraction. The microbial inhibitory activity
of 2-methoxy-4-vinyl phenol was tested against B. cereus in a DDA (Figure 46). A 20 μL
aliquot of a 200 mg/mL solution of 2-methoxy-4-vinyl phenol in EtOH was tested along with
a range of further diluted solutions.
Figure 46: Disc diffusion assay of 2-methoxy-4-vinylphenol against B. cereus
The assays show that 2-methoxy-4-vinylphenol at a concentration of 200 mg/mL is able to
inhibit the growth of B. cereus producing a 15 mm of zone of inhibition This is compared to a
commercially available tetracycline disc (inhibiting the growth and killing of viable bacteria
cells) [194] used as the positive control (30 µg) with a 33 mm zone of inhibition and EtOH
2-methoxy-4-vinylphenol
200 mg/mL in EtOH
2-methoxy-4-vinylphenol
100 mg/mL in EtOH

114
(negative control) which showed no activity. It is apparent that the amount of bioactivity
observed for the pure 2-methoxy-4-vinyl phenol is substantially less than expected compared
to DDA for the extract fractions and it was concluded that other unknown compounds that are
not included in the GC-MS database might be present. It was also feasible that the active
compound has decomposed and fragmented due to the temperature of the GC-MS injector and
this will be further explored later in this chapter.
5.4.3 Further separation, identification and characterisations of microbially active
compounds
In collaboration with Dr Mark Butler and his associates in the Institute of Molecular
Biosciences at the University of Queensland, a more sophisticated approach was undertaken
utilising this research group’s expertise in natural products isolation and identification.
5.4.3.1 Automated HPLC based fractionation
Separated leaves were dried in an incubator for 7 days at 60 °C and ground into a fine powder
(51.1 g). The fine powder was extracted at constant temperature of 21 °C for 5 days with 250
mL CH3CN with occasional stirring. The solvent was removed by rotary evaporation to give
approximately 1.195 g of crude extract. A portion of the extract (500 mg) was dissolved in 20
mL of (1:1) CH3CN and Milli-Q H2O with separation obtained using a Shimadzu HPLC
consisting of a Prominence Modular High Performance Liquid Chromatograph coupled to an
UV−Vis Photo-Diode Array detector (SPD-M20A). An Agilent Phenyl XDB HPLC column
(100 × 20 mm, 5 µm) served as the stationary phase and a mobile phase of 40% CH3CN at a
flow rate 0.2 mL/min produced 14 mg of an active fraction. This fraction was further separated
on a Phenominex C8 HPLC column (250 × 9.4 mm, 5 µm) and the collected sample fraction

115
was freeze dried and stored in a -20 °C refrigerator until required for further experimental
analysis.
5.4.3.2 Purification and characterisation
Fraction purification was achieved using a Gilson® benchtop PLC 2020 Personal Purification
System with an interchangeable pump head. The flow rate was 1 mL/min and the mobile phase
was 0.05% formic acid in water (A) and 0.05% formic acid in CH3CN (B).
Compound purity was analyzed using a Shimadzu LCMS 2020 LC/MS with a SPD-M20A UV-
vis detector (λ= 200-400 nm), using a Zorbax Eclipse XDB phenyl column (3.0 × 100 mm, 3.5
μm, flow rate 1 mL/min, 40 °C). The mobile phase was prepared using 0.05% formic acid in
water (A) and 0.05% formic acid in CH3CN (B). High-resolution mass spectrometry (HRMS)
was performed on a Bruker Micro TOF mass spectrometer using (-)-ESI mode calibrated to
sodium formate.
As described in Section 5.3.1.2, further antimicrobial assays were performed against different
strains of Gram positive and Gram negative bacterium including different strains of S. aureus
(ATCC 43300), S. aureus (NRS 17 GISA), S. aureus (NRS 1 GISA MRSA), S. aureus (VRS
10 GRSA), S. pneumonia (ATCC 700677), E. faecalis (Clinical isolate vanA) and E. faecium
(ATCC 51559). The results for the crude extract and isolated fractions are displayed in Table
11. Whereas the controls have relatively broad spectrum activity, the fractions show excellent
and specific activity against vancomycin-resistant organisms, which is quite promising.

116
Table 11: MIC of the crude extract and active fractions against a panel of Gram-positive and Gram-negative bacteria.
8 point dose response - 0.015 to 32 μg/mL,
n=2 GP_020 GP_030 GP_035 GP_065 GP_023 GP_011 GP_025 S. aureus S. aureus S. aureus S. aureus S. pneumoniae E. faecalis E. faecium
Polystyrene Plates 96w (Corning 3370) ATCC
43300 NRS 17 NRS 1 VRS 10 ATCC 700677 clinical isolate ATCC 51559
MRSA GISA GISA/MRSA GRSA MDR VanA MDR/VanA
MCC ID Sample Name MIC (µg/mL)
MCC_0000095:02 Vancomycin 1 8 8 2 2 >32 >32
MCC_0000561:03 Daptomycin 1, 2 8 16 4 2 8 16 Crude extract >32 >32 >32 >32 >32 >32 >32
Active fraction DE7359_32_108 >32 >32 32 32 32 8, 16 8
Active fraction DE7359_32_109 >32 >32 >32 >32 >32 8 8
Abbreviations: MDR - Multi-drug resistant S. aureus, MRSA - Methicillin Resistant S. aureus, GISA - Glycopeptide intermediate S. aureus, GRSA –
Glycopeptide resistant S. aureus ,VRE VanA - Vancomycin-resistant Enterococcus carrying VanA gene. Vancomycin and Daptomycin were used as positive controls

117
Figure 47 shows two compounds that have been isolated and they are identified as (1) neryl
ferulate and (2) neryl p-coumarate, which are closely related and new antimicrobial
compounds.
Figure 47 : Structures of (1) neryl ferulate and (2) neryl p-cinnamate.
Table 12: Chemical details for the structures in Figure 47
(1) Neryl ferulate (2) Neryl p-cinnamate
Chemical formula C20H26O4 C19H24O3
Exact Mass 330.1831 300.1725
Molecular Mass 330.4240 300.3980
The purification of (1) and (2) was hampered by their close HPLC retention times and the
gradual in situ peroxide formation and subsequent reduction to the alcohols as described in
Figure 48. Singlet oxygen ene-type peroxidation of isoprene units in natural products was
proposed by Kadota and co-workers in 2000 [195] and this reaction has been used widely in
synthetic chemistry [196-197] . Although there is a debate about whether autoxidation occurs in
the organism or upon isolation, there is evidence to show that terpenes such as α-santalene [198],
linalool [199] and geraniol [200], which is the E isomer of the nerol subunit found in 1 and 2 can
undergo autoxidation. We found that no autoxidation occurred when the fractions and pure
compounds were stored under argon at -20 °C.

118
O
O
HO
H3CO
O
O
HO
H3CO
O
O
HO
H3CO
OOH
OOH
1
O
O
HO
H3CO
O
O
HO
H3CO
OH
OH
O2, light
Figure 48: Proposed autoxidation mechanism of neryl ferulate (1)
The molecular formula of (1) was determined to be C20H26O4 by HRMS and examination of
the 1H, 13C, COSY, HSQC and HMBC NMR spectra indicated the presence of methoxy and
hydroxy-substituted cinnamic acid with a linear C10 monoterpene, assignments are listed in
Table 13 with spectra contained in Appendix B,C and D. The C10 monoterpene unit was
determined to be nerol on the basis of the NMR data (C-9′ δC 23.6; δC 24.0 in nerol compared
to δC 17.1 in geraniol [201]), which was attached to the carboxy group of the cinnamic acid with
HMBC correlations from H2-1′ (δH 4.69, dd. J = 0.9, 7.2 Hz) to C-1 (δC 167.3). HMBC
correlations from OCH3-6 (δH 3.92, s) and H-8 (δH 6.91, d, J = 8.2 Hz) to C-6 (δC 146.7)
indicated that the cinnamic acid unit was ferulic acid. Therefore, the structure of (1) was

119
determined to be neryl ferulate, which has only been reported previously as a synthetic product
[202].
The molecular formula of (2) was determined to be C19H24O3, which was OCH3 less than (1).
Analysis of the NMR data shows that (2) still had the nerol monoterpene unit but had a p-
coumaric acid in place of ferulic acid. Therefore, the structure of (2) was determined to be neryl
p-cinnamate, which has not been previously reported.
Table 13: NMR spectroscopic data (600 MHz, CDCl3) for (1) neryl ferulate and (2) neryl p-
cinnamate
(1) Neryl ferulate
(2) neryl p-cinnamate Position δC, type δH, mult. (J in Hz)
δC, type δH, mult. (J in Hz)
1 167.3, C
167.3, C 2 115.6, CH 6.30, d (15.9)
115.8, CH 6.31, d (15.9)
3 144.7, CH 7.61, d (15.9)
144.2, CH 7.63, d (15.9) 4 127.1, C
127.5, C
5 109.2, CH 7.03, d (1.9)
129.9, CH 7.42, br d (8.5) 6 146.7, CH
115.8, CH 6.83, br d (8.5)
CH3O-6 55.9, CH3 3.92, s - - 7 147.7, C
157.4, C 6.83, br d (8.5)
8 114.7, CH 6.91 d (8.2) 115.8, CH 6.91 d (8.2) 9 123.1, CH 7.06, dd (1.9, 8.2) 129.9, CH 7.42, br d (8.5) OH-7
5.84, s
5.17, br s
1′ 61.1, CH 4.69, dd (0.9, 7.2) 61.1, CH 4.69, dd (0.9, 7.2) 2′ 119.3, CH 5.44, br t (7.2) 119.3, CH 5.43, br t (7.3) 3′ 142.8, C
142.7, C
4′ 32.2, CH2 2.16, m
32.2, CH2 2.16, m 5′ 26.7, CH2 2.10, dt (7.0, 7.0)
26.7, CH2 2.10, dt (7.0, 7.0)
6′ 123.6, CH 5.12, tqq (7.0, 1.4, 1.4) 123.6, CH 5.11, tqq (7.0, 1.5, 1.5) 7′ 132.2, C 132.2, C 8′ 17.7, CH3 1.61, br s 17.7, CH3 1.61, br s 9′ 23.6, CH3 1.79, br s 23.6, CH3 1.79, br s 10′ 25.7, CH3 1.69, br s 25.7, CH3 1.69, br s

120
The isolated compounds (1) neryl ferulate and (2) neryl p-cinnamate were profiled against a
panel of Gram-positive and Gram-negative bacteria, fungi and the human kidney-derived cell
lines HEK293 and HepG2 with the results presented in Table 14. Both (1) and (2) had no
activity against Gram-negative bacteria and only (1) displayed marginal antifungal activity
against Cryptococcus neoformans. (1) Neryl ferulate showed activity against a small panel of
antibiotic-resistant Gram-positive bacteria in the range of 8 to 32 µg/mL but showed some
cytotoxicity against the HEK293 and HepG2 human kidney cell lines at around 90 µg/mL. (2)
Neryl p-cinnamate was only active against E. faecium and showed a similar cytotoxicity
profile.
The only antibacterial activity of related compounds was the recent report of very weak
antibacterial activity of geranyl cinnamate against S. aureus and E. coli (MIC 5000 µg/mL)
[203]. Other biological activities of related compounds include the inhibition of lipid absorption
and accumulation by geranyl caffeate [204] and inhibition of LPS-induced production of nitric
oxide in murine macrophages by E and Z-geranyl ferulate [205], as well as geranyl caffeate and
farnesyl caffeate [206]. Farnesyl caffeate and farnesyl p-coumarate were reported to show
cytotoxicity (GI50 1.1–2.5 and 4.5–6.4 µg/mL respectively), [207] while farnesyl caffeate showed
in vitro antitrypanosomal activity (IC50 0.23 µg/mL) and cytotoxicity (IC50 13.3 µg/mL) against
the MRC5 cell line [208].

121
Table 14: Biological activity of (1) Neryl Ferulate and (2) Neryl p-Cinnamate against a panel
of bacteria, fungi and cell lines Bacterial and fungal strains, and cell lines Compounds
(1) (2) Controls Gram negative bacteria MIC (µg/mL) E. coli ATCC 25922 > 64 > 64 0.3 (COL), 0.3 (PMXB) A. baumannii ATCC 19606 > 64 > 64 0.5/1 (COL), 0.3 (PMXB) Gram positive bacteria MIC (µg/mL) S. aureus ATCC 43300 (MRSA) 16 > 64 1 (VAN), 4 (DAP) S. aureus NARSA NRS 17 (GISA) 16 > 64 >32 (VAN), 16/32 (DAP) S. aureus NARSA VRS 1 (VRSA) 16/32 > 64 >32 (VAN), 8 (DAP) S. pneumoniae ATCC 700677 (MDR) 8/16 64 2 (VAN), 8 (DAP) E. faecium ATCC 51559 (VRE VanA) 8 8 >32 (VAN), 32 (DAP Fungi MIC (µg/mL) C. albicans ATCC 90028 > 64 > 64 0.5/0.3 (FLU) C. neoformans H99 ATCC 208821 64/32 >64/32 8 (FLU) Cell lines CC50 (µg/mL) HEK293 ATCC CRL-1573 90 90 23 (TAM) HepG2 ATCC HB-8065 90 47 23 (TAM) Abbreviations: MDR - Multi-drug resistant, MRSA - Methicillin Resistant S. aureus, GISA - Glycopeptide intermediate S. aureus, VRSA - Vancomycin Resistant Intermediate S. aureus. VRE VanA - Vancomycin-resistant Enterococcus carrying VanA gene. HEK293 - human embryonic kidney cells, HepG2 - hepatocellular carcinoma cells. Controls: Colistin (COL), polymyxin B (PMXB), vancomycin (VAN), daptomycin (DAP) and tamoxifen (TAM).
5.4.4 Thermal degradation experiments
As discussed in Section 5.4.2, it was suspected that the extract underwent thermal degradation
when exposed to the high temperature of the GC-MS injector with 2-methoxy-4 vinyl phenol
identified as a bioactive compound. In order to investigate this further, a thermal degradation
experiment was performed and the results have proven to be very interesting. HPLC analysis
was used to compare the chromatograms for an active fraction before the heat treatment with
the same fraction after the heat treatment where the sample was exposed to a temperature of
230 °C for 30 minutes in a vacuum oven. A further chromatogram of the pure 2-methoxy-4
vinyl phenol was obtained with the concentration being 1 mg/mL. The resulting HPLC
chromatograms are displayed in Figure 49 with a dashed line that shows a peak with the same
retention time as 2-methoxy-4 vinyl phenol forms after the heat treatment of the extract

122
indicating that it is the product of thermal degradation. It is also quite noticeable the sizes of
other peaks in the extract are dramatically decreased due to the heat treatment.
Figure 49: HPLC chromatograms of the thermal degradation experiment for an active fraction
from E. longifolia
Examination of the molecular structures for the identified compounds (1) neryl ferulate and (2)
neryl p-cinnamate shows that both compounds contain the 2-methoxy-4 vinyl phenol fragment
as shown in (Figure 50) for (1) neryl ferulate.
Figure 50: Chemical structure of (1) neryl ferulate and with the thermal degradation product 2-methoxy-4 vinyl phenol circled in green
Before the heat treatment
2-methoxy-4 vinyl phenol
After the heat treatment
2-methoxy-4 vinyl phenol
123
5.5 Conclusion
In conclusion, two novel natural compounds, neryl ferulate and neryl p-coumarate, have been
identified using bioguided isolation from the leaves of the indigenous Australian medicinal
plant E. longifolia. Neryl ferulate displayed moderate activity against various Gram-positive
bacteria, while neryl p-coumarate was only active against E. faecium. As both compounds
displayed weak cytotoxicity effects upon mammalian cells and had issues with autoxidation,
they were not pursued further as antibacterial lead compounds. However, their discovery has
further advanced our knowledge of an important indigenous medicine. Furthermore, both of
these compounds easily degraded thermally to form 2-methoxy-4 vinyl phenol at higher
temperatures and this product might be responsible for the effectiveness of the smoke
inhalation treatment when the plant is used as an indigenous medicine.

124
Chapter 6
Screening of ethnomedicinal Southeast Asian plants for antimicrobial and antifungal activities

125
6.1 Introduction
Historically, Eastern Malaysian indigenous tribes have used traditional herbal remedies or
medicinal plants for centuries to cure infectious diseases [106]. These days, they inhabit the
Malaysian province of Sarawak, which is situated on the island of Borneo. Borneo is the third
biggest island in the world, well known as its rugged, dense rainforest and home to some of the
most endangered animals and trees [209]. Most of the forested areas are protected by the Malay
government [210] and are World Heritage listed by the United Nations Educational, Scientific
and Cultural Organization (UNESCO) [211].The plant extracts and herbal remedies are quite
distinctive with frequent use by several indigenous tribes in Sarawak [212]. The Sarawak
Biodiversity Centre in Sarawak has undertaken intensive work with tribal leaders to document
the ethnomedicinal knowledge about the plants that are still in use.
In collaboration with the Sarawak Biodiversity Centre, this research was performed to evaluate
the ethnomedicinal importance of extracts obtained from plants that are native to the province
of Sarawak in Malaysia. As most of the plants are used to treat infective illnesses, it is important
to establish that they possess antibacterial properties against Gram-positive and Gram-negative
pathogenic bacteria, as well as their potential antifungal properties. Initially, fifty crude plant
extracts were examined using antimicrobial assays and six plants were identified as the most
appropriate plant species for further analysis, namely Baccaurea lanceolata (Miq.) Müll. Arg.,
Fibraurea tinctoria Lour, Goniothalamus tapisoides Mat Salleh, Goniothalamus velutinus
Airy Shaw, Polyalthia hookeriana King and Pyrenaria serrata Bl. var masocarpa (Korth) H.
Keng.

126
6.2 Material and methods
All plants tested have been fully documented for their traditional medicinal use to treat
symptoms of infectious diseases by the SBC. Preliminary screening of fifty crude plant extracts
identified six extracts with potential antimicrobial activities. These were the main focus of this
chapter.
6.2.1 Preparation of extracts
The crude extracts were prepared according to Section 3.3.2.
6.2.2 Bacterial and fungal isolates and media used
Bacterial and fungal isolates that were used in this study have been discussed in Section 3.3.4
In addition, two additional strains of C. albicans, clinical isolate (SC5314) and laboratory
isolate (DAY286), were also employed.
6.2.3 Antibacterial and antifungal assays
All the microbial assays were performed according to the protocols described in Section 3.3.4
and include:
• Disc diffusion assay (DDA)
• Determination of minimum inhibitory concentration (MIC)
• Determination of bacterial and fungicidal concentration (MBC/MFC)
6.3 Results and discussion
6.3.1 Disc diffusion assay
Antimicrobial activity was evaluated using the disc diffusion method with the median diameter
of the zone of inhibition measured [164]. The disc used in this assay was 5 mm in diameter and
the negative control was DMSO. Although all of these plants have been documented due to

127
their use as natural medicines, according to the preliminary results from the disc diffusion
assays presented in Table 15, it was found that only six of the plants were identified as having
potentially antibacterial activity. Information obtained from the SBC identified them as B.
lanceolata, F .tinctoria, G. tapisoides, G. velutinus, P. hookeriana and P. serrata.

128
Table 15: Summary of DDA results for the Sarawak extracts
No Special Barcode Voucher specimen Scientific name (Family) Antimicrobial activity E. coli S. aureus C. albicans
1 A000461020301 - - - 2 A000461010301 SABC 0242 Fibraurea tinctoria (Menispermaceae) + + +
3 A000492010301 - - - 4 A000602010301 SABC 0422 Polyalthia hookeriana (Annonaceae)
+ + +
5 A000602020301 SABC 0422 Polyalthia hookeriana (Annonaceae)
+ + + 6 A000617040103 - - - 7 A000760020301 - - - 8 A000803010103 SABC0782 Mussaenda elmeri (Rubiaceae) - - - 9 A001001010103 - - - 10 A001042030103 SABC 1106 Pyrenarea serrata (Theaceae) + + + 11 A001066020103 - - - 12 A001347040103 SABC 1979 Baccaurea lanceolata (Euphorbiaceae) + + + 13 A001349040103 SABC1753 Trigonopleaura malayana (Euphorbiaceae) - - - 14 A001373010103 SABC1768 Santiria apiculata (Burseraceae) - - - 15 A001989010103 - - - 16 A002427010103 - - - 17 A002576020103 - - - 18 A002644010103 - - - 19 A002657010103 - - - 20 A002677020103 - - - 21 A002748020103 - - -

129
Summary of DDA results for the Sarawak extracts. (cont.)
No Special Barcode Voucher specimen Scientific name (Family) Antimicrobial activity E. coli S. aureus C. albicans
22 A002749040103 - - - 23 A002753030103 SABC 3373 Baccaurea lanceolata (Euphorbiaceae) + + + 24 A002791020103 SABC 1989 Goniothalamus tapisoides (Annonaceae) + + + 25 A002791030103 - - - 26 A002793020103 SABC 1992 Goniothalamus velutinus (Annonaceae)
+ + + 27 A002805020103 - - - 28 A002805010103 - - - 29 A002805030103 SABC1984 Anisophyllea disticha (Anisophylleaceae) - - - 30 A002814030103 SABC1996 Trigonopleaura malayana (Euphorbiaceae) - - - 31 A002822020103 SABC1988 Trivalvaria macrophylla (Euphorbiaceae) - - - 32 A002822040103 - - - 33 A002828010103 - - - 34 A002837050103 - - - 35 A002890010103 - - - 36 A002895030103 - - - 37 A002895020103 SABC3970 Baccaurea angulata (Euphorbiaceae) - - - 38 A002970030103 SABC3809 Tetracera marcrophylla (Dilleniaceae) - - - 39 A002970010103 - - - 40 A002981010103 - - - 41 A003161010103 SABC1528 Calophyllum lanigerum (Clusiaceae) - - - 42 A003161040103 SABC1528 Calophyllum lanigerum (Clusiaceae) - - - 43 A003546020103 SABC4492 Albizia corniculata (Fabaceae) - - -

130
Summary of DDA results for the Sarawak extracts. (cont.)
No Special Barcode Voucher specimen Scientific name (Family) Antimicrobial activity E. coli S. aureus C. albicans
44 A003561020103 - - - 45 A003699010103 - - - 46 A003703010103 - - - 47 A003807010103 - - - 48 A003857010103 - - - 49 A003857030103 - - - 50 A003865010103 - - -
+ Indicates plant species active against bacterial or fungal isolate.
- Indicates plant species not active against bacterial or fungal isolate.
Empty spaces in Voucher specimen number column and scientific name column indicate confidential information belonging to the SBC

131
These selected plant species were subjected to a more extensive panel of microorganisms and
the observations of the DDA are listed in Table 16. G. velutinus and G. tapisoides exhibited
some inhibitory effects against both Gram-negative and Gram-positive bacteria that include E.
coli, S.enterica serovar Typhimurium, M. catarrhalis, B. cereus and S. aureus. Most of the
plant extracts showed antimicrobial activity against the B. cereus strain. The extract from F.
tinctoria displayed antimicrobial activity against only two Gram-positive bacteria, B. cereus
and S. aureus. The two plant extracts from B. lanceolata (a and b) showed wide activity against
all the bacterial strains tested with the extract.
Since the extracts obtained from P. serrata species displayed antifungal activity against the C.
albicans isolate, further testing was performed using other laboratory and clinical strains of C.
albicans. Figure 51 (A and B) show the disc diffusion assays against the C. albicans clinical
isolate (SC5314) and laboratory isolate (DAY286), with different concentrations of
Amphotericin B used as the positive control as reducing number of viable cell count [213] and
DMSO used as a negative control. The effectiveness of the P. serrata extract against the C.
albicans isolates was indicated by zones of inhibition of 12 mm and 12.5 mm for the clinical
and laboratory strains, respectively. The zone of inhibition of the plant extract was actually
larger than that of the positive control.

132
Table 16: DDA antimicrobial screening of selected plant extracts
Plant Name Zone of inhibition (mm)
E. coli P. aeruginosa S. enterica M. catarrhalis S. pyogenes B. cereus S. aureus C. albicans F. tinctoria 0.0 0.0 0.0 0.0 0.0 10.0 10.0 0.0
P. hookeriana 7.0 0.0 0.0 9.0 0.0 11.3 8.0 0.0
P. serrata 0.0 0.0 0.0 7.0 0.0 10.0 0.0 12.5
B. lanceolataa 7.0 8.3 7.3 12.0 7.6 12.0 8.0 0.0
B. lanceolatab 7.0 8.3 7.0 10.6 7.0 9.6 7.0 0.0
G. tapisoides 7.0 0.0 8.0 8.0 0.0 10.6 8.0 0.0
G. velutinus 10.0 0.0 9.3 8.0 0.0 11.3 9.0 0.0
Tetracyclinec 24.0 15.3 21.6 40.6 19.6 30.6 30 0.0
Amphotericin Bc 0.0 0.0 0.0 0.0 0.0 0.0 0.0 18.0
The discs used in this study were impregnated with 400 µg of the plant extracts. a,b Two separate samples of B. lanceolata were collected from the same location during different months. c Tetracycline (30 µg) and Amphotericin B (1.38 µg) were used as positive controls for antibacterial and antifungal susceptibility tests, respectively.

133
(A) (B)
Figure 51: (A) Disc diffusion assay for C. albicans clinical isolate (SC5314) (B) Disk diffusion assay for C. albicans laboratory isolate (DAY286)
Disc 1: Impregnated with Amphotericin B (10µg)
Disc 2: Impregnated with Amphotericin B (1µg)
Disc 3: Impregnated with DMSO
Disc 4: Impregnated with 100µg/mL P. serrata extract
6.3.2 MIC and MBC/MFC determination for the selected extracts.
MIC and MBC/MFC analysis was performed using the Mueller Hinton broth dilution method with
doubling serial dilution (50, 25, 12.5, 6.25 and 3.13 μg/mL). The initial concentration of the plant
extracts used was 100 μg/mL. Absorbance readings and subculturing methods were conducted as
described in Section 3.3.4.2 to determine MICs and Section 3.3.4.3 for the determination of
MBCs/MFCs. The results summary in Table 17 displays the MIC and MBC/MFC values for the plant
extracts against a range of microorganisms.
1
2 4
32
3
2
1
4

134
Table 17: MIC and MBC/MFC values for selected plant extracts
Plant Name Concentration (µg/mL)
E. coli P. aeruginosa S. enterica M. catarrhalis S. pyogenes B. cereus S. aureus C. albicans F. tinctoria
n/a n/a n/a n/a n/a 25 50 n/a
MBC n/a n/a n/a n/a n/a ≥100.00 100 n/a P. hookeriana MIC 25 n/a n/a 25 n/a 12.5 25 n/a
MBC 50 n/a n/a 50 n/a 50 50 n/a P. serrata MIC n/a n/a n/a 25 n/a 12.5 n/a 25
MBC/MFC n/a n/a n/a 100 n/a ≥100.00 n/a 50 B. lanceolataa MIC 25 12.5 25 25 25 12.5 50 n/a
MBC 100 50 100 50 100 ≥100.00 100 n/a B. lanceolatab MIC 25 12.5 25 25 25 12.5 50 n/a
MBC 100 50 100 50 100 ≥100.00 100 n/a G. tapisoides MIC 25 n/a 25 12.5 n/a 12.5 25 n/a
MBC 50 n/a 100 50 n/a 100 100 n/a G. velutinus MIC 25 n/a 25 12.5 n/a 12.5 25 n/a
MBC 50 n/a 100 100 n/a ≥100.00 50 n/a
MBC, minimum bactericidal concentration; MFC, minimum fungicidal concentration; MIC, minimum inhibitory concentration; n/a, no activity. a,b Two separate samples of B. lanceolata were collected from the same location during different months.

135
The plant extracts from P. hookeriana B. lanceolataa, B. lanceolatab, G. tapisoides and G.
velutinus produced MIC values of 25 μg/mL and MBC values between 50 to 100 μg/mL against
E. coli. Only the two B. lanceolata extracts showed activity against P. aeruginosa with MIC
and MBC values of 12.5 μg/mL and 50 μg/mL, respectively. The Goniothalamus and
Baccaurea extracts were active against S.enterica serovar Typhimurium with respective MIC
and MBC values of 25 μg/mL and 100 μg/mL. All of the plant extracts, except F. tinctoria,
showed antibacterial activity against M. catarrhalis with MIC values in the range 12.5 μg/mL
to 25 μg/mL and MBC values between 50 μg/mL and 100 μg/mL with the Goniothalamus
extract exhibiting the strongest activity. The B. lanceolata extract was the most effective
inhibitory agent for S. pyogenes with MIC and MBC levels of 25 μg/mL and 100 μg/mL,
respectively.
Most of the plant extracts, except F. tinctoria, had the same MIC values against B. cereus and
the MBC values were more than 100 μg/mL except for G. tapisoides with a resulting MIC of
100 μg/mL. Except for the P. serrata extract, all the other plants showed acceptable inhibitory
activity against S. aureus. The strongest candidates were G. velutinus and P. hookeriana with
the MIC and MBC values of 25 μg/mL and 50 μg/mL, respectively. Overall, the two extracts
from B. lanceolata exhibited the lowest MIC and MBC values thereby showing the greatest
activity towards all the bacteria used in this study.
Only the P. seratta extract exhibited any antifungal activity against C. albicans with MIC and
MFC values of 25 μg/mL and 50 μg/mL, respectively. A major problem associated with this
pathogen is the formation of biofilms on the surface of medical devices inside the human body
(cardiac valves, catheters, etc.) [214], which promotes systemic fungal infection (candidiasis)
that usually occurs in immune-compromised patients [215]. Subject to further research and

136
analysis, it may be found that a drug developed from P. serrata can be used as an anticandidal
agent.
In summary, out of the 50 plant extracts that were screened, only six exhibited broad spectrum
activity against several strains of bacteria and fungi. Similar to literature observations, plant
extracts generally show more inhibitory activity against Gram-positive than Gram-negative
bacteria against selected plant extracts [216]. However, in most cases there was a significant
effect against both Gram-positive and Gram-negative bacteria.
All of the selected plant extracts showed considerable inhibitory activity against pathogenic
organisms and could be active against infections when used as medicines. For example,
stomachaches, diarrhoea and enteritis most probably result from bacterial infections caused by
E. coli, Salmonella, B. cereus and S .aureus due to contaminated food and water [217]. This
correlates well with the use of medicines derived from extracts of B. lanceolata. In general,
headaches and fever are often a consequence of bacterial infections and treatment using an
extract of G. velutinus shows strong broad spectrum activity that supports its use. Also, any
snake or insect bite-related infections can be triggered by the above mentioned pathogens [218]
with most skin infections being caused by S. aureus, the results confirm the effectiveness of
using extracts from F. tinctoria. Vaginomycosis is often due to infection from C. albicans, but
there has been no recorded traditional knowledge that describes the use of P. serrata for this
purpose. However, the results show that any treatment based on F. tinctoria will only be
effective if the infection is due to S. aureus.

137
6.4 Conclusions
The use of these plant species by the indigenous peoples of Borneo in the treatment of various
microbial illnesses can be supported by the reported findings. The results confirm that extracts
from these plants have inhibitory effects on pathogenic microorganisms responsible for some
common diseases such as diarrhoea, stomachache, fever, headaches, coughs and inflammation.
Based on this evidence, it is reasonable to suggest that some traditional medicinal plants could
be more widely utilised as novel therapeutic agents for the treatment of microbial diseases,
including those caused by antibiotic-resistant microorganisms. The results also reveal the need
for urgency in collecting and documenting plant specimens, as the traditional knowledge of
plants used for medicinal purposes is slowly vanishing.
Plant extracts derived from F. tinctoria, P. hookeriana, P. serrata, B. lanceolata, G. tapisoides
and G. velutinus demonstrated antimicrobial properties. P. serrata showed significant
antifungal activity against C. albicans with minimum inhibitory and minimum fungicidal
concentrations of 25 μg/mL and 50 μg/mL respectively. The outcomes of this study have
highlighted the importance of using the traditional knowledge to develop highly potent herbal
remedies for protection against human and animal pathogens. Of all the extracts, B. lanceolata
consistently showed the greatest antimicrobial activity and further effort to identify the specific
chemicals in the extract that provide the bioactivity is described in Chapter 7.

138
Chapter 7
Application of analytical and statistical approaches
for isolation and identification of bioactive
compounds from Baccaurea lanceolata

139
7.1 Introduction
The screening undertaken in Chapter 6 suggests that the B. lanceolata crude plant extract has
the highest activity against a wide panel of microorganisms and the active compounds will be
targeted in this Chapter. Isolation was attempted using the Solid Phase Extraction approach
with the primary separation completed with two different series of CH3CN/H2O ratios and
bioassays identified the most active of these fractions. In this case, the Milli-Q water fraction
was identified as the most active fraction against S. aureus and then secondary fractionation
was performed on this fraction. The identification and characterisation was completed using
GC-MS and LC-MS, in conjunction with a statistical correlation analysis.
The interpretation of quantitative dose-response data for a plant extract is complicated because
the active compound(s) have both unknown concentration(s) and mode(s) of action. However,
assuming that a greater concentration will result in a stronger response, a straightforward
ranking test based on Spearman correlation [219] between the relative chemical concentrations
in the fractions and the measured bioactive response for each fraction should enable the most
bioactive compound(s) to be identified. Spearman’s correlation coefficient (ρ) is the most
appropriate instrument to distinguish the source of bioactivity as the data employed in this
analysis have a non-linear and monotonic relationship.
7.2 Experimental
7.2.1 Preparation of crude extract
The B. lanceolata plant was collected in 2007 by the Sarawak Biodiversity Centre as a part of
its Traditional Knowledge Documentation Program. The initial botanical identification of the
collected plant was performed by the Sarawak Biodiversity Centre and the voucher specimen
(SABC3373) was deposited in the Centre’s herbarium. The fruit from the plant was initially

140
dried in an oven, then ground into a powder and the resulting material was extracted using 1:1
(v/v) dichloromethane and methanol as described in Section 3.3.2.
7.2.2 Primary fractionation by Solid Phase Extraction
The details are as described in Section 3.3.5 with 110.4 mg of the crude plant extract loaded
onto the SPE cartridge. The solvent was removed in a RVC 2-18 Rotor Evaporator at 40 °C
(Martin Christ Rotational Vacuum Concentrator) and the residue was reconstituted in 200 µL
of Milli-Q water for antimicrobial susceptibility testing.
7.2.3 Secondary fractionation by Solid Phase Extraction
Based on the bioactivity results from the primary fractionation, it was found that the Milli-Q
water fraction was the most active. Further plant extract (116.4 mg) was loaded onto a
conditioned SPE cartridge and elution was performed using Milli-Q water in 1 mL aliquots
repeated 20 times. Each 1 mL aliquot was collected in a micro-centrifuge tube and subjected
to freeze drying for 24 hrs. The freeze-dried fractions were then resuspended in 200 µL of
Milli-Q water and subjected to antimicrobial testing.
7.2.4 Antimicrobial susceptibility tests
7.2.4.1 DDA antimicrobial assays
Overnight nutrient broth cultures of Gram-positive bacteria B. cereus (ATCC 11778), S. aureus
(ATCC 12600), S. pyogenes (ACM 178) and the Gram-negative bacteria E.coli (ATCC 25922),
P. aeruginosa (ATCC 10145), S. enterica serovar Typhimurium (ATCC 13311) were used for
antimicrobial assays after both the primary and secondary fractionations. The details for this
testing are described in Section 3.3.4.1 with 10 µL of sample applied to the discs.

141
7.2.4.2 Determination of the relative MIC for the active fractions against S.aureus
The MIC of the fractions was determined by the broth micro-dilution method as described in
Section 3.3.4.3. Two-fold serial dilution of the fractions was performed in a 96-well plate using
Mueller Hinton Broth (MHB). A 10 µL aliquot of S. aureus that had been previously adjusted
to match a 0.5 McFarland standard was added to each well and the plates were incubated at 37
°C for 24 hrs. Tetracycline was used as a positive control and Milli-Q water as the negative
control.
7.2.4.3 Determination of colony-forming units (CFU) using E. coli
To assess the antibacterial effect of secondary fractions on Gram-negative bacteria, E. coli
cultures were adjusted to match a 0.5 McFarland standard (∼1 × 10⁸ CFU/mL). A volume of
90 µL of E. coli culture was seeded on MHB agar plates with 10 µL of two-fold serially diluted
aqueous fractions of the extract. Seeded MHB agar plates without extracts cultured under the
same conditions were used as controls. All the seeded plates were incubated at 37 °C for 24 hrs
and the number of colonies was then counted.
7.2.5 Chromatographic analysis
7.2.5.1 GC-MS analysis of the fractions
The GC-MS analyses were completed on a Shimadzu GC Chromatograph GC 2010 with the
methodology described in Section 3.3.6.1.
7.2.5.2 Derivatisation the active fractions
Bioactive secondary fractions were derivatised according to the method described in Section
3.3.6.1.1.

142
7.2.5.3 UPLC-Q-Exactive Orbitrap Mass Spectromertry
LC-MS analysis was conducted in collaboration with Thermofisher Scientific Australia at their
Demonstration Laboratory in Scoresby, Melbourne, Australia. The details are described in
Section 3.3.6.3.
7.3 Statistical Analysis
All the experiments were performed in triplicate except where otherwise stated. The data are
presented as mean ± standard deviation (mean ± SD). Statistical analysis was performed using
an online statistical package, MetaboAnalyst 3.0 (TMIC, Edmonton, Canada). Spearman
correlation analysis was used with data from GC-MS analysis and LC-MS analysis in both
positive and negative modes. A P-value of < 0.05 was considered statistically significant.
7.4 Results and discussion
7.4.1 Primary fractionation
A stepwise separation of the extract using SPE with increasingly non-polar fractions enabled
the optimal solvent mixture to be selected on the basis of bioguided fractionation. Figure 52
shows the results from DDA testing against B. cereus.
Figure 52: Primary SPE fractionation and inhibitory activity against B. cereus

143
The Milli-Q water fraction was found to be the only fraction that exhibited antimicrobial
activity against the array of bacteria tested and indicates that the most bioactive components of
the plant extract are relatively polar. Consideration of all the DDA results showed that the
Milli-Q water fraction was active against both Gram-negative and Gram-positive bacteria.
Amongst the Gram-negative bacteria, the antimicrobial activity decreased in the order: E. coli
> P. aeruginosa > S. enterica and amongst the Gram-positive bacteria, B.cereus was more
susceptible than S. pyogenes and S. aureus. The DDA results are presented in Figure 53 and,
based on these results, secondary fractionation was carried out on the Mill-Q water fraction.
Figure 53: Disc diffusion assay results showing antimicrobial activity of the Milli-Q water fraction with various bacterial cultures
0
5
10
15
20
E. c
oli
P. a
erug
inos
a
S. e
nter
ica
S. p
yrog
enes
B. c
ereu
s
S. a
ureu
s
Zone
of i
nhib
ition
(m
m)

144
7.4.2 Secondary fractionation
7.4.2.1 Relative MIC and MBC values
Secondary fractionation was performed using only Milli-Q water as the eluting solvent. Twenty
fractions were collected and DDA was performed for each fraction against S. aureus. Figure
54 illustrates the inhibitory microbial activities for the first seven fractions against S. aureus as
the remaining thirteen fractions were found to be inactive under the conditions used in the
DDA. The results indicated that the second fraction exhibited the highest activity against S.
aureus. The antimicrobial activity decreased in the order: Fraction 2 > Fraction 3 > Fraction 4
> Fraction 1 ≈ Fraction 5 where Fractions 6 and 7 did not show any activity.
Figure 54: Antimicrobial activity of secondary fractions (Fractions 1 to 7) of B. lanceolata against S. aureus. Fraction 8 is the positive control (Tetracycline) and Fraction 9 is the negative control (Milli-Q water) in disc diffusion assay
Figure 55 shows the relative MIC and MBC of the active fractions when tested against S.
aureus. The results showed that, similar to the DDA, the relative MIC and MBC were found to
be the highest for Fraction 2. However, the relative MIC decreased in the following order:
Fraction 2 > Fraction 1≈ Fraction 6 > Fraction 3 ≈ Fraction 5 > Fraction 4 and Fraction 7 did
not show any activity with the trend for the MBC being slightly different: Fraction 2 > Fraction
0
5
10
15
20
1 2 3 4 5 6 7 8 9
Zone
of i
nhib
ition
(m
m)
Fractions

145
3 ≈ Fraction 5 > Fraction 1 ≈ Fraction 4 > Fraction 6 with Fraction 7 not showing any inhibitory
activity.
Figure 55: Relative activities of secondary fractions (Fraction 1-7) of B. lanceolata against S. aureus. The white bars represent relative MIC and those in grey represent MBC
7.4.2.2 Comparing antibacterial activity of the fractions based on the colony-forming
units (CFU) method.
In order to obtain more robust quantitative data for antimicrobial testing, fractions were tested
against E. coli using an agar plate-based assay that allowed CFU values to be obtained. The
results are presented in Figure 56 and in this case, Fraction 2 showed the lowest CFU values
compared to the other fractions and the activity declined in the following order: Fraction 2 >
Fraction 1 > Fraction 3 > Fraction 4 > Fraction 5.
02468
1012141618
1 2 3 4 5 6 7
Rela
tive
aciti
vity
Fractions

146
Figure 56. CFU values against E. coli for active Fractions 1 to 5 with 6 being the negative
control
7.4.3 Compound identification and verification
7.4.3.1 GC-MS analysis
Direct GC-MS analysis of the secondary fractions was generally uninformative due the polar
nature of the eluted compounds but dimethyl tartrate was observed eluting as the peak at 15.6
minutes in Figure 57. BSTFA derivatisation of the six fractions followed by analysis with GC-
MS increased the number of observed peaks with the chromatograms shown in Figure 58. The
variation in MBC for each secondary fraction was mapped against the variation in peak area
for each peak in the chromatograms from the GC-MS. The reproducibility of the retention time
and the similarity of the mass spectra enabled the retention time to be used as the identifier for
each peak.
0
5
10
15
20
25
30
35
40
45
50
1 2 3 4 5 6
log
CFU
(CFU
/mL)
Fractions

147
Figure 57: Direct GC-MS analysis of the Milli-Q water fractions (1 to 6) with dimethyl tartrate eluting at 15.6 minutes

148
Figure 58: Derivatised GC-MS analysis of the Milli-Q water fractions (1 to 6)

149
A listing of the Spearman’s rank correlation coefficients is given in Table 18 where the
compounds are identified by their retention time. The critical value for the Spearman’s rank
correlation coefficient for seven fractions is 0.714 for a one-sided test of significance (α = 5%)
and absolute correlations greater than 0.786 for a two-sided test of significance (α = 5%) [220].
Of the twenty-seven compounds detected, only three compounds showed a significant
correlation between the MBC and peak area.
Table 18: Spearman’s rank correlation coefficients for chromatographic peak area versus
MBC for each fraction
GC-MS Retention time (min)
Spearman’s rank- correlation coefficient
10.58 0.619 12.36 0.629 12.75 0.711 13.84* 0.820 14.54* 0.842 14.83 0.619 15.61 0.619 15.80* 0.756 16.15 0.619 16.23 0.644 16.43 0.569 16.67 -0.374 16.88 0.186 16.96 0.710 17.04 0.584 17.16 0.619 17.42 0.615 17.64 0.642 18.47 0.619 18.94 0.486 19.61 0.576 19.70 0.619 19.80 0.619 20.79 0.464 20.86 0.664 22.07 0.619 23.54 0.435
*Spearman’s rank correlation coefficient greater than 0.714 (α = 5%).

150
Based on the critical test value, three compounds were identified and are listed in Table 19
along with their GC-MS library match probability; their chemical structures are given in Figure
59.
Table 19 : Compounds identified in the most active fractions from the secondary fractionation
stage using derivatised GC-MS analysis
Retention time
(min) Compound name Probability %
13.84 Dimethyl 2,3-bis[(trimethylsilyl)oxy]succinate 96
14.54 Arabino-hexos-2-ulose,3,4,5,6-tetrakis-o-
(trimethylsilyl)-, bis(dimethyl acetal) 80
15.80 Bis(trimethylsilyl)2,3-
bis[(trimethylsilyl)oxy]succinate 92
(1) (2) (3)
Figure 59: Chemical structures of the compounds with Spearman’s rank correlation coefficients
greater than 0.716. (1) Dimethyl 2, 3-bis[(trimethylsilyl)oxy]succinate, (2) Arabino-hexos-2-
ulose, 3, 4, 5, 6-tetrakis-o-(trimethylsilyl)-, bis(dimethyl acetal) and (3) Bis(trimethylsilyl) 2,3-
bis[(trimethylsilyl)oxy]succinate
It is noticeable that first structure is the trimethylsilyl derivative of dimethyl tartrate and the
third structure is derivatized tartaric acid. It was subsequently found that the arabino-hexos-2-

151
ulose, 3, 4, 5, 6-tetrakis-O-(trimethylsilyl)-, bis (dimethyl acetal) is a by-product from the
derivatisation process when commercially available authentic standards of dimethyl tartrate
and tartaric acid were analysed using the same conditions. The availability of pure substances
enabled confirmation of the derivatised identities from GC-MS based on retention times and
mass spectral library data.
The MIC and MBC values of pure dimethyl tartrate and tartaric acid were obtained against S.
aureus. Dimethyl tartrate showed MIC and MBC values of 15 mg/mL and 7.5 mg/mL,
respectively. Tartaric acid had MIC and MBC values of 940 µg/mL and 470 µg/mL,
respectively. Tartaric acid is an alpha hydroxyl, short chain carboxylic acid and is a chiral
compound. It acts as a pH lowering agent during the fermentation step in the wine making
process that reduces the levels of spoilage bacteria and also acts as a preservative during wine
storage in barrels [221]. The bacterial species Lactobacillus sp. and Pedioccus sp. are the main
causes for the wine spoilage, which reduces the quality of the wine and decreases its value [222].
According to published research, it has been found that there are some inhibitory effects on
Salmonella typhimurium by a few carboxylic acids that included tartaric acid [223]. Salmonella
typhimurium is responsible as the main food borne pathogen [224] that contaminates meat
products including poultry and beef [224-225]. Blended mixtures of tartaric, lactic, malic and citric
acids are used as a dietary acidifier in poultry and piggery diets. The gastrointestinal tract
contains acid tolerant bacteria that includes pathogenic E. coli, Salmonella typhimurium and
Campylobacter but the growth of these bacteria can be reduced significantly by adjusting the
digesta pH (pKa 3 to 5) in the gut, which can positively influence the growth of chicken and
piglets [223].

152
7.4.3.2 LC-MS analysis
As tartaric acid is not detectable in direct GC-MS analysis, high resolution LC-MS analysis
was performed to confirm the identities of tartaric acid and the dimethyl tartrate. It was found
that both were present in the active fractions but the amount of tartaric acid was considerably
higher compared to the dimethyl tartrate in the plant extract. Quantitative analysis of the B.
lanceolata fruit plant extract shows 0.8% of dimethyl tartrate and 7% of tartaric acid in the
crude extract. These results indicate that the tartaric acid exhibits considerably higher activity
against S. aureus compared to dimethyl tartrate and is the main contributor to the bioactivity.
Unfortunately, the extract was obtained using a general extraction procedure developed at the
Sarawak Biodiversity Centre with methanol used as one of the solvents. It is suspected that the
dimethyl tartrate is the result of an esterification reaction between methanol and tartaric acid.
However, at this stage it was not possible to obtain the fruit for direct analysis to detect dimethyl
tartrate and examine whether changing the extraction solvent composition influences the
distribution of compounds that are extracted but this should be further investigated.
7.5 The presence of tartaric acid in other plants.
L-Tartaric acid is a plant based derived metabolite that can be found in plants due to a naturally
occurring biosynthetic pathway that converts glucose to tartaric acid [226]. Tartaric acid is
produced in grapes during the ripening process where the acid content increases around 50 days
after flowering [227]. It is also found in most fruits including oranges [228], bananas and tamarinds.
A study from Thailand found that rural plant leaves such as from Cowa, Moringa, Neem tree, Noni,
Tamarind, Soap pod, Indian gooseberry, Ceylon Spinach and Gac have considerable levels of
tartaric acid. However, the Neem leaves showed the highest concentration of tartaric acid
compared to others [229]. It has been measured in the leaves and berries of Vitis labrusca cv,

153
Delawa grapes and leaves of Parthenocissus quinquefolia L. (Virginia creeper) [230]. Tartaric
acid can be used as a food additive to create a sour taste [231] and as an antioxidant [141].
7.6 Conclusions
Overall, the B. lanceolata fruit extract contains bioactive compounds that can suppress the
growth of various bacterial strains and the observed medicinal properties that are apparent for
many infectious diseases can be mostly attributed to the presence of tartaric acid in this extract.

154
Chapter 8
Summary and conclusions

155
8.1 Summary of conclusions and further directions
This research has validated the importance of plant based natural medicines from indigenous
Australian communities and the Malay ethnic groups from Sarawak. The accumulated
knowledge from past centuries regarding plants from their surrounding environments that have
been used to treat everyday ailments has been confirmed in many cases. To some extent, the
research supports the continued collection of knowledge about plant medicines from tribal
elders as it is important to secure their awareness of ethnomedicinal significant plants and to
protect them for future generations.
Method development
Solid Phase Extraction was used to extract compounds in complex mixtures based on a method
that was characterised using a standard mixture of known compounds with known log P values.
Elution with various ratios of water and acetonitrile where the polarity of the mixed solvent
was systematically altered enabled complex sample mixtures to be fractionated into narrow
bands of similar polarity. A multi-stage SPE method was developed and the distribution of the
bioactivity over a series of fractions was correlated with the composition of each fraction to
identify the source of bioactivity in plant extracts.
E. longifolia extraction and characterisation
As plant material was used for this study, a part of this study was to optimise the yield of
potentially bioactive compounds using extraction methods that included Accelerated Solvent
Extraction (ASE) and the conventional immersion process. The variables that were studied
included the type of solvent, temperature and the time of extraction. Extraction efficiency was
evaluated based on the effectiveness of each plant extract against selected microorganisms

156
including bacteria (both Gram-positive and Gram-negative) and fungi. The key findings from
this study are as follows:
• Extracts produced using the conventional immersion method exhibited better
antimicrobial activities compared to ASE.
• Acetonitrile was found to be the most suitable extraction solvent.
• Optimal activity was found with extracts produced using the conventional immersion
technique at 21 °C and 5 days.
Two novel compounds were identified, namely neryl ferulate and neryl p-cinnamate, using
nuclear magnetic resonance (NMR) and liquid chromatography with high resolution mass
spectrometry (LC-MS). These novel compounds were tested for antimicrobial activity against
selected microbes with neryl ferulate showing borderline inhibitory activity against antibiotic-
resistant Gram-positive bacteria including S. aureus ATCC 3300 (MRSA), S. aureus NARSA
NRS 17 (GISA), S. aureus NARSA VRS 1 (VRSA), S. pneumoniae ATCC 700677 (MDR), E.
faecium ATCC 51559 (VRE VanA) and C. neoformans H99 ATCC 208821. Neryl p-cinnamate
was only active against E. faecium. The extracted compounds were also tested against the
human kidney-derived cell lines HEK293 and HepG2 to determine any cytotoxicity effects.
Cytotoxic effects were observed against the HEK293 and HepG2 human kidney cell lines at
concentrations of 90 µg/mL and above.
Southeast Asian plant screening
Fifty plant extracts from the Sarawak Biodiversity Centre were screened based on information
obtained from their Traditional Knowledge Documentation program. After initial screening for
microbial inhibitory activity, only six plants were selected for the further antipathogenic
analysis: Baccaurea lanceolata (Miq.) Müll.Arg, Fibraurea tinctoria Lour, Goniothalamus
tapisoides Mat Salleh, Goniothalamus velutinus Airy Shaw, Polyalthia hookeriana King,

157
Pyrenaria serrata Bl. var masocarpa (Korth) H. Ken. Baccaurea lanceolata produced the best
results and was targeted for further phytochemical analysis.
Southeast Asian plant characterisation
The two B. lanceolata extracts, derived from plants collected at different times of the year from
the same location showed comparable activity indicating that this plant species produces
similar antimicrobial chemicals, regardless of the time of collection. The B. lanceolata fruit
extract contains bioactive compounds that can inhibit the growth of numerous bacterial strains
and this can be attributed to the presence of dimethyl tartrate and tartaric acid.
8.2 Potential for future work
Automated fraction collection
All the fractionation work was performed using manual flow control and was a highly labor
intensive process. An inconsistent flow rate affects the reproducibility during the fractionation
process and impedes increasing the amount of substance that can be collected from repeat
experiments. Going forward, it is recommended to use an automated fraction collector that
allows for more consistent flow rate control, is less labor intensive and will reduce experimental
time. Repeated experiments will increase the sensitivity of the bioactivity testing as this was a
major disadvantage with the current methodology.
Cell culture and animal studies
Of all fifty plants tested, B. lanceolata showed microbial activity against a wide range of
bacteria with P. serrata exhibiting activity against C. albicans and these two plants might have
future potential to be used as antimicrobial and antifungal agents. Therefore, it is important to
assess the safety of extracts by undertaking bioactivity assays against specific cell lines. Subject

158
to the in vitro findings, in vivo animal studies would be recommended to confirm safety and
efficacy.
Hyperglycemia related testing
Following the world-wide trend, it has been found that Australians are increasingly diagnosed
with Type 2 diabetes. Hyperglycemia related testing of the Australian endemic tree E.
longifolia and the Southeast Asian plants could provide useful treatments. Previous studies in
our laboratory have shown that traditional plants have anti-hyperglycemic activity.
Understanding these effects for E. longifolia would be beneficial.
Providing feedback to Sarawak Biodiversity Centre
The general extraction procedure used by the Sarawak Biodiversity Centre is a mixed solvent
that provides for a wide range of chemical polarities to be collected. However, the use of
methanol as one of the extraction solvents for the extraction of B. lanceolata fruit could be
altering the chemical constituents due to the esterification of carboxylic acids. According to
the chromatographic analysis, tartaric acid and dimethyl tartrate were identified as the active
constituents of B. lanceolata. However, as reported in Chapter 7, it was suspected that dimethyl
tartrate is the result of an esterification reaction between methanol and tartaric acid. Therefore,
the suggestion is to extract the B. lanceolata fruit using water as the solvent to remove the
possibility of compositional changes.
Reflective Overview
The analytical approach that was implemented due to the advancement in instrumental
techniques and the small sample amounts has been demonstrated to be a feasible strategy. The
use of the Accelerated Solvent Extraction system shows that it is too efficient when extracting

159
antibacterial substances from plant material. In hindsight this should have been foreseen
because if the antibacterial substances are part of a protective defense response for the plant
then these substances need to be closer to the external part of the plant.
The SPE fractionation approach was useful but requires further automation to be reproducible
and the chromatographic separations were effective but the value of these instrumental
separations is greatly enhanced if highly specific detection, such as high resolution mass
spectrometry, is available. Unfortunately access to LC-NMR was not possible and, in our case,
a more traditional approach was required to obtain structural information about the active
compounds but it is apparent that the high throughput screening of natural products is mostly
limited by the bioassay component of the process.

160
References
[1] I. Hamdan, F. Afifi, Studies on the in vitro and in vivo hypoglycemic activities of some medicinal plants used in treatment of diabetes in Jordanian traditional medicine, J. Ethnopharmacol. 2004, 93, 117-121.
[2] S. Chatterjee, A. Banerjee, I. Chandra, Hemidesmus indicus: A Rich Source of Herbal Medicine, Journal of Medicinal & Aromatic Plants 2014, 3, 1-3.
[3] A. A. Abdullahi, Trends and challenges of traditional medicine in Africa, African Journal of Traditional, Complementary and Alternative Medicines 2011, 8.
[4] M. S. Micozzi, Culture, anthropology, and the return of" complementary medicine", Med. Anthropol. Q. 2002, 16, 398-403.
[5] V. Londhe, Role of garlic (allium sativum) in various diseases an overview, Journal of pharmaceutical research & opinion 2014, 1, 129-134.
[6] M. Alzweiri, A. Al Sarhan, K. Mansi, M. Hudaib, T. Aburjai, Ethnopharmacological survey of medicinal herbs in Jordan, the Northern Badia region, J. Ethnopharmacol. 2011, 137, 27-35.
[7] T. Bartram, Bartram's Encyclopedia of Herbal Medicine, Hachette UK, 2013. [8] E. Roeder, H. Wiedenfeld, Plants containing pyrrolizidine alkaloids used in the
Traditional Indian Medicine including Ayurveda, International Journal of Pharmaceutical Sciences 2013, 68, 83-92.
[9] G. Bodeker, K. Who, C. Ong, C. Grundy, G. Burford, K. Shein, Word Health Organisation Kobe Centre, Japan, 2005, pp. 1-347.
[10] A. L. Rice, L. Sacco, A. Hyder, R. E. Black, Malnutrition as an underlying cause of childhood deaths associated with infectious diseases in developing countries, Bulletin of the World Health Organization 2000, 78, 1207-1221.
[11] L. H. Taylor, S. M. Latham, E. Mark, Risk factors for human disease emergence, Journal of Philosophical Transactions of the Royal Society of London Biological Sciences 2001, 356, 983-989.
[12] L. Silver, K. Bostian, Discovery and development of new antibiotics: the problem of antibiotic resistance, Journal of Antimicrobial agents and chemotherapy 1993, 37, 377-383.
[13] J. L. Ríos, M. C. Recio, Medicinal plants and antimicrobial activity, J. Ethnopharmacol. 2005, 100, 80-84.
[14] J. Nguyen Pouplin, H. Tran, T. Phan , C. Dolecek, J. Farrar, T. Tran, P. Caron, B. Bodo, P. Grellier, Antimalarial and cytotoxic activities of ethnopharmacologically selected medicinal plants from South Vietnam, J. Ethnopharmacol. 2007, 109, 417-427.
[15] R. Lee, The eureka! moment: 100 key scientific discoveries of the 20th century, Routledge, 2016.
[16] A. Tomasz, Multiple antibiotic resistant pathogenic bacteria. , N. Engl. J. Med. 1994, 330, 1247-1251.
[17] M. Shnit Orland, A. Kushmaro, Coral mucus associated bacteria: a possible first line of defense, Journal of FEMS Microbiology Ecology 2009, 67, 371-380.
[18] H. Nikaido, Multidrug resistance in Bacteria, Journal of Annual Review of Biochemistry 2009, 78, 119-146.
[19] X. Z. Li, H. Nikaido, Efflux-mediated drug resistance in bacteria, Drugs 2009, 69, 1555-1623.
[20] J. Martinez, F. Baquero, Mutation frequencies and antibiotic resistance, Antimicrob. Agents Chemother. 2000, 44, 1771-1777.

161
[21] C. Marshall, T. Kossmann, S. Wesselingh, D. Spelman, Methicillin ‐ Resistant Staphylococcus aureus and beyond: what's new in the world of the ‘golden staph’?, ANZ J. Surg. 2004, 74, 465-469.
[22] J. C. Baumgartner, T. Xia, Antibiotic susceptibility of bacteria associated with endodontic abscesses, J. Endod. 2003, 29, 44-47.
[23] P. Schneider, S. Hawser, K. Islam, Iclaprim, a novel diaminopyrimidine with potent activity on trimethoprim sensitive and resistant bacteria, Journal of Bioorganic & Medicinal Chemistry Letters 2003, 13, 4217-4221.
[24] V. Schaar, T. Nordstrom, M. Morgelin, K. Riesbeck, Vol. 55, National Center for Biotechnology Information, 2011, pp. 3845-3853.
[25] L. M. Weigel, D. B. Clewell, S. R. Gill, N. C. Clark, L. K. McDougal, S. E. Flannagan, J. F. Kolonay, J. Shetty, G. E. Killgore, F. C. Tenover, Genetic analysis of a high-level Vancomycin-Resistant isolate of Staphylococcus aureus, Journal of Science Magazine 2003, 302, 1569-1571.
[26] D. J. H. Kilgus, D.J.Strang, A, Results of periprosthetic hip and knee infections caused by resistant bacteria, Journal of Clinical Orthopaedics and Related Research 2002, 404, 116-124.
[27] M. C. Roberts, Tetracycline resistance determinants: mechanisms of action, regulation of expression, genetic mobility, and distribution, Journal of FEMS Microbiology Ecology 1996, 19, 1-24.
[28] H. Seppälä, T. Klaukka, J. Vuopio-Varkila, A. Muotiala, H. Helenius, K. Lager, P. Huovinen, The effect of changes in the consumption of macrolide antibiotics on erythromycin resistance in Group A Streptococci in Finland, N. Engl. J. Med. 1997, 337, 441-446.
[29] B. H. Heintz, J. Halilovic, C. L. Christensen, Vancomycin-Resistant Enterococcal urinary tract infections, Journal of Pharmacotherapy 2010, 30, 1136-1149.
[30] A. Mottalib, M. Hossain, I. Khalil, S. Islam, A. Hossain, Drug susceptibility pattern of Mycobacterium tuberculosis isolates against conventional anti-tuberculosis drugs in Dhaka, Bangladesh, Saudi Medical Journal 2011, 32, 484-488.
[31] E. Skyman, Doctoral thesis, University of Gothenburg. Sahlgrenska Academy. 2014. [32] T. Poovelikunnel, G. Gethin, H. Humphreys, Mupirocin resistance: clinical
implications and potential alternatives for the eradication of MRSA, J. Antimicrob. Chemother. 2015, 70, 2681-2692.
[33] F. J. Angulo, P. Collignon, J. H. Powers, T. M. Chiller, A. Aidara-Kane, F. M. Aarestrup, World Health Organization ranking of antimicrobials according to their importance in human medicine: a critical step for developing risk management strategies for the use of antimicrobials in food production animals, Journal of Clinical Infectious Diseases 2009, 49, 132-141.
[34] N. Tabassum, M. Hamdani, Plants used to treat skin diseases, Pharmacognosy reviews 2014, 8, 52.
[35] K. Harada, M. Saito, T. Sugita, R. Tsuboi, Malassezia species and their associated skin diseases, J. Dermatol. 2015, 42, 250-257.
[36] J. Sardi, L. Scorzoni, T. Bernardi, A. Fusco-Almeida, M. M. Giannini, Candida species: current epidemiology, pathogenicity, biofilm formation, natural antifungal products and new therapeutic options, J. Med. Microbiol. 2013, 62, 10-24.
[37] N. Tabassum, M. Hamdani, Plants used to treat skin diseases, Journal of Pharmacognosy Reviews 2014, 8, 52-60.
[38] N. Smith, D. Denning, Underlying conditions in chronic pulmonary aspergillosis including simple aspergilloma, Eur. Respir. J. 2011, 37, 865-872.

162
[39] D. Mahmoud, N. Hassanein, K. Youssef, A. Zeid, Antifungal activity of different neem leaf extracts and the nimonol against some important human pathogens, Braz. J. Microbiol. 2011, 42, 1007-1016.
[40] Y. P. Ran, X. X. Wang, Y. L. Dai, X. M. Peng, G. P. Zhou, Facial tinea corporis in an infant due to Microsporum gypseum: a case report, Chinese Journal of Mycology 2006, 1, 1-8.
[41] N. R. Bhalodia, V. Shukla, Antibacterial and antifungal activities from leaf extracts of Cassia fistula : An ethnomedicinal plant, Journal of Advanced Pharmaceutical Technology & Research 2011, 2, 104-109.
[42] K. Saki, M. Bahmani, M. Rafieian Kopaei, H. Hassanzadazar, K. Dehghan, F. Bahmani, J. Asadzadeh, The most common native medicinal plants used for psychiatric and neurological disorders in Urmia city, northwest of Iran, Asian Pacific Journal of Tropical Disease 2014, 4, 895-901.
[43] K. P. Hill, Medical marijuana for treatment of chronic pain and other medical and psychiatric problems: a clinical review, The Journal of the American Medical Association 2015, 313, 2474-2483.
[44] K. A. Belendiuk, L. L. Baldini, M. O. Bonn Miller, Narrative review of the safety and efficacy of marijuana for the treatment of commonly state-approved medical and psychiatric disorders, Journal of Addiction Science & Clinical Practice 2015, 10, 1-10.
[45] S. A. Karamati, H. Hassanzadazar, M. Bahmani, M. Rafieian Kopaei, Herbal and chemical drugs effective on malaria, Asian Pacific Journal of Tropical Disease 2014, 4, 599-601.
[46] V. Lohsiriwat, Hemorrhoids: from basic pathophysiology to clinical management, World J. Gastroenterol. 2012, 18, 2009-2017.
[47] E. C. Evans, Hemodialysis-Related Cramps and Nocturnal Leg Cramps-What Is Best Practice ?, J. Nephrol. Nurs. 2013, 40, 549-553.
[48] A. S. Botsaris, Plants used traditionally to treat malaria in Brazil: the archives of Flora Medicinal, Journal of Ethnobiology and Ethnomedicine 2007, 3, 1-8.
[49] A.-M. Carroll, D. J. Kavanagh, F. P. McGovern, J. W. Reilly, J. J. Walsh, Nature’s Chiral Catalyst and Anti-Malarial Agent: Isolation and Structure Elucidation of Cinchonine and Quinine from Cinchona calisaya, J. Chem. Educ. 2012, 89, 1578-1581.
[50] J. Achan, A. O. Talisuna, A. Erhart, A. Yeka, J. K. Tibenderana, F. N. Baliraine, P. J. Rosenthal, U. D'Alessandro, Quinine, an old anti-malarial drug in a modern world: role in the treatment of malaria, Malar. J. 2011, 10, 1-12.
[51] B. Brinkhaus, J. Hummelsberger, R. Kohnen, J. Seufert, C. H. Hempen, H. Leonhardy, R. Nögel, S. Joos, E. Hahn, D. Schuppan, Acupuncture and chinese herbal medicine in the treatment of patients with seasonal allergic rhinitis: a randomized controlled clinical trial, J. Allergy Clin. Immunol. 2004, 59, 953-960.
[52] J. C. Jeong, M. S. Choi, S. H. Yoon, D. I. Kim, D. I. Kim, S. H. Jang, J. Y. Leem, S. K. Ku, B. Y. Seo, M. H. Jeon, Analysis of the result of Korean medicine treatment for female subfertility using herbal medicine, Acupuncture and moxibustion treatment, Journal of Korean Medicine 2015, 36, 1-7.
[53] Y. Sui, H. Zhao, V. Wong, N. Brown, X. Li, A. Kwan, H. Hui, E. Ziea, J. Chan, A systematic review on use of Chinese medicine and acupuncture for treatment of obesity, Journal of Obesity Reviews 2012, 13, 409-430.
[54] G. S. Liao, M. K. Apaya, L. F. Shyur, Herbal medicine and acupuncture for breast cancer palliative care and adjuvant therapy, Journal of Evidence Based Complementary and Alternative Medicine 2013, 2013, 1-17.
[55] M. Lafferty, S. Phillips, Acupuncture as a beneficial treatment for insomnia and depression, J. Altern. Complement. Med. 2014, 146, 1-18.

163
[56] S. Su, Observation of the clinical effect of acupuncture and Chinese medicine treatment of bacterial vaginosis, International Journal of Clinical Acupuncture 2015, 24, 172-174.
[57] M. P. Coleman, D. Forman, H. Bryant, J. Butler, B. Rachet, C. Maringe, U. Nur, E. Tracey, M. Coory, J. Hatcher, C. E. McGahan, D. Turner, L. Marrett, M. L. Gjerstorff, T. B. Johannesen, J. Adolfsson, M. Lambe, G. Lawrence, D. Meechan, E. J. Morris, R. Middleton, J. Steward, M. A. Richards, Cancer survival in Australia, Canada, Denmark, Norway, Sweden, and the UK, 1995–2007 (The International Cancer Benchmarking Partnership): an analysis of population-based cancer registry data, The Lancet 2011, 377, 127-138.
[58] F. R. Siakholak, M. Ghoncheh, R. Pakzad, H. S. Gandomani, F. Ghorat, H. Salehiniya, Epidemiology, incidence and mortality of oral cavity and lips cancer and their relationship with the human development index in the world, Journal of Biomedical Research and Therapy 2016, 3, 872-888.
[59] M. P. Heron, in National Vital Statistics Reports (NVSR), Vol. 64, National Vital Statistics Reports, 2015, pp. 1-93.
[60] A. Coates, in Cancer Council Australia for Health Professionals Working in Cancer Control. Journal of the Clinical Oncological Society of Australia, Vol. 37, Australia, 2013, pp. 1-136.
[61] J. F. Perz, G. L. Armstrong, L. A. Farrington, Y. J. Hutin, B. P. Bell, The contributions of Hepatitis B virus and Hepatitis C virus infections to cirrhosis and primary liver cancer worldwide, J. Hepatol. 2006, 45, 529-538.
[62] H. Mirghani, F. Amen, F. Moreau, J. Guigay, M. Ferchiou, A. E. Melkane, D. M. Hartl, J. L. St Guily, Human papilloma virus testing in oropharyngeal squamous cell carcinoma: what the clinician should know, Journal of Oral Oncology 2014, 50, 1-9.
[63] M. A. Nobbenhuis, J. M. Walboomers, T. J. Helmerhorst, L. Rozendaal, A. J. Remmink, E. K. Risse, H. C. van der Linden, F. J. Voorhorst, P. Kenemans, C. J. Meijer, Relation of Human papilloma virus status to cervical lesions and consequences for cervical-cancer screening: a prospective study, The Lancet 1999, 354, 20-25.
[64] J. S. Smith, R. Herrero, C. Bosetti, N. Munoz, F. X. Bosch, J. Eluf-Neto, X. Castellsague, C. J. Meijer, A. J. Van den Brule, S. Franceschi, Herpes simplex virus 2 as a Human papilloma virus cofactor in the etiology of invasive cervical cancer, The National Cancer Institute 2002, 94, 1604-1613.
[65] V. Tsouris, M. K. Joo, S. H. Kim, I. C. Kwon, Y. Y. Won, Nano carriers that enable co-delivery of chemotherapy and RNAi agents for treatment of drug-resistant cancers, Journal of Biotechnology Advances 2014, 32, 1037-1050.
[66] U. Shah, R. Shah, S. Acharya, N. Acharya, Novel anticancer agents from plant sources, Chinese Journal of Natural Medicines 2013, 11, 16-23.
[67] J. W. Lee, W. B. Lee, W. Kim, B. I. Min, H. Lee, S. H. Cho, Traditional herbal medicine for cancer pain: A systematic review and meta-analysis, Journal of Complementary Therapies in Medicine 2015, 23, 265-274.
[68] S. Wang, X. Wu, M. Tan, J. Gong, W. Tan, B. Bian, M. Chen, Y. Wang, Fighting fire with fire: poisonous Chinese herbal medicine for cancer therapy, J. Ethnopharmacol. 2012, 140, 33-45.
[69] A. Faried, D. Kurnia, L. Faried, N. Usman, T. Miyazaki, H. Kato, H. Kuwano, Anticancer effects of gallic acid isolated from Indonesian herbal medicine, Phaleria macrocarpa (Scheff.) Boerl, on human cancer cell lines, Int. J. Oncol. 2007, 30, 605-614.
[70] M. Moudi, R. Go, C. Y. S. Yien, M. Nazre, Vinca alkaloids, International journal of Preventive Medicine 2013, 4, 1231-1235.

164
[71] L. Chiu, I. Hsin, T. Yang, W. Sung, J. Chi, J. Chang, J. Ko, G. Sheu, The ERK–ZEB1 pathway mediates epithelial–mesenchymal transition in pemetrexed resistant lung cancer cells with suppression by vinca alkaloids, Journal of Oncogene 2016, 36, 242-253.
[72] S. Howat, B. Park, I. S. Oh, Y. W. Jin, E. K. Lee, G. J. Loake, Paclitaxel: biosynthesis, production and future prospects, Journal of New Biotechnology 2014, 31, 242-245.
[73] R. Victor, On the use of biotechnology for biodiversity conservation in arid countries with special reference to Oman, International Journal of Environmental Studies 2013, 70, 900-908.
[74] G. M. Cragg, Paclitaxel (Taxol®): a success story with valuable lessons for natural product drug discovery and development, Journal of Medicinal Research Reviews 1998, 18, 315-331.
[75] S. Kusari, S. Zühlke, M. Spiteller, An endophytic fungus from Camptotheca acuminata that produces camptothecin and analogues, J. Nat. Prod. 2009, 72, 2-7.
[76] G. M. Cragg, D. J. Newman, Plants as a source of anti-cancer agents, J. Ethnopharmacol. 2005, 100, 72-79.
[77] P. M. Woster, Foreword: American Chemical Society Division of Medicinal Chemistry. Celebrating 100 Years of Excellence, J. Med. Chem. 2009, 52, 7333-7338.
[78] A. Cirla, J. Mann, Combretastatins: from natural products to drug discovery, Journal of Natural Product Reports 2003, 20, 558-564.
[79] H. X. Li, X. R. Liu, W. P. Zhang, C. Zhang, H. B. Sun, A review of current status of combretastatin A-4 phosphate (CA4P), Chinese Journal of New Drugs and Clinical Remedies 2010, 11, 1-5.
[80] P. Bradley, British herbal compendium: A handbook of scientific information of widely used plant drugs, Vol. 2, British Herbal Medicine Association, 2006.
[81] U. Quattrocchi, CRC world dictionary of medicinal and poisonous plants: common names, scientific names, eponyms, synonyms, and etymology, Vol. 5, CRC Press, New York, 2012.
[82] E. C. Barnes, A. R. Carroll, R. A. Davis, Mitchellenes A–E, Cyclic sesquiterpenes from the Australian plant Eremophila mitchellii, J. Nat. Prod. 2011, 74, 1888-1893.
[83] A. W. Claridge, J. M. Trappe, D. J. Paull, in Desert Truffles, Springer, 2014, pp. 203-214.
[84] G. S. Richmond, E. L. Ghisalberti, The Australian desert shrub Eremophila (myoporaceae): Medicinal, cultural, horticultural and phytochemical uses, Econ Bot 1994, 48, 35-59.
[85] A. N. Singab, F. S. Youssef, M. L. Ashour, M. Wink, The genus Eremophila (Scrophulariaceae): An ethnobotanical, biological and phytochemical review, J. Pharm. Pharmacol. 2013, 65, 1239-1279.
[86] ANPSA. Australian Native Plants Society 2014, from http://asgap.org.au [87] B. D. Cooke, Planning Landscape-scale Rabbit Control, 2013. [88] R. J. Chinnock. (1992). PlantNET New South Wales flora online. 2018, from
http://pngplants.org/web2printer/web2printer4.php?img=0&lnk=3&style=/style.css [89] E. M. Curtis, A. Leigh, S. Rayburg, Relationships among leaf traits of Australian arid
zone plants: alternative modes of thermal protection, Australian Journal of Botany 2012, 60, 471-483.
[90] G. Richmond, E. Ghisalberti, Seed dormancy and germination mechanisms in Eremophila (Myoporaceae), Australian Journal of Botany 1994, 42, 705-715.
[91] B. Barlow, Cytogeography of the genus Eremophila, Australian Journal of Botany 1971, 19, 295-310.
[92] C. Williams, Vol. 4, Rosenberg Publishing, 2013.

165
[93] N. J. Sadgrove, S. Mijajlovic, D. J. Tucker, K. Watson, G. L. Jones, Characterization and bioactivity of essential oils from novel chemotypes of Eremophila longifolia (F. Muell) (Myoporaceae): a highly valued traditional Australian medicine, Flavour and Fragrance Journal 2011, 26, 341-350.
[94] J. Smith, D. Tucker, D. Alter, K. Watson, G. Jones, Intraspecific variation in essential oil composition of Eremophila longifolia F. Muell. (Myoporaceae): Evidence for three chemotypes, Journal of Phytochemistry 2010, 71, 1521-1527.
[95] N. J. Sadgrove, G. L. Jones, A possible role of partially pyrolysed essential oils in Australian Aboriginal traditional ceremonial and medicinal smoking applications of Eremophila longifolia (R. Br.) F. Muell (Scrophulariaceae), J. Ethnopharmacol. 2013, 147, 638-644.
[96] Q. Liu, D. Harrington, J. L. Kohen, S. Vemulpad, J. F. Jamie, Bactericidal and cyclooxygenase inhibitory diterpenes from Eremophila sturtii, Journal of Phytochemistry 2006, 67, 1256-1261.
[97] C. P. Ndi, S. J. Semple, H. J. Griesser, S. M. Pyke, M. D. Barton, Antimicrobial compounds from Eremophila serrulata, Journal of Phytochemistry 2007, 68, 2684-2690.
[98] I. J. Biva, C. P. Ndi, H. J. Griesser, S. J. Semple, Antibacterial constituents of Eremophila alternifolia: An Australian aboriginal traditional medicinal plant, J. Ethnopharmacol. 2016, 182, 1-9.
[99] E. C. Barnes, A. M. Kavanagh, S. Ramu, M. A. Blaskovich, M. A. Cooper, R. A. Davis, Antibacterial serrulatane diterpenes from the Australian native plant Eremophila microtheca, Journal of Phytochemistry 2013, 93, 162-169.
[100] A. Abell, E. Horn, G. Jones, M. Snow, R. Massywestropp, R. Riccio, The structure of a stable serrulatane diterpenoid acetal from Eremophila rotundifolia, Australian Journal of Chemistry 1985, 38, 1837-1845.
[101] K. Croft, E. Ghisalberti, P. Jefferies, G. Proudfoot, The chemistry of Eremophila spp. XVI. New serrulatanes from Eremophila sp., Australian Journal of Chemistry 1981, 34, 1951-1957.
[102] Y. M. Syah, E. L. Ghisalberti, Serrulatane diterpenes from a new Eremophila species, Journal of Phytochemistry 1997, 45, 1479-1482.
[103] Y. Tahtah, S. G. Wubshet, K. T. Kongstad, A. M. Heskes, I. Pateraki, B. L. Møller, A. K. Jäger, D. Staerk, High resolution PTP1B inhibition profiling combined with high performance liquid chromatography high resolution mass spectrometry solid phase extraction nuclear magnetic resonance spectroscopy: Proof of concept and antidiabetic constituents in crude extract of Eremophila lucida, Journal of Fitoterapia 2016, 110, 52-58.
[104] E. Della, P. Jefferies, The chemistry of Eremophila species. The essential oil of Eremophila longifolia F. Muell, Australian Journal of Chemistry 1961, 14, 663-664.
[105] M. Pennacchio, Y. M. Syah, E. L. Ghisalberti, E. Alexander, Cardioactive compounds from Eremophila species, J. Ethnopharmacol. 1996, 53, 21-27.
[106] J. Kulip, An ethnobotanical survey of medicinal and other useful plants of Muruts in Sabah, Malaysia, Telopea 2003, 10, 81-98.
[107] T. Lim, Edible medicinal and non-medicinal Plants, Springer, 2012. [108] R. Nagarajan, M. Jonathan, P. D. Roy, L. Wai Hwa, M. Prasanna, S. Sarkar, M.
Navarrete López, Metal concentrations in sediments from tourist beaches of Miri City, Sarawak, Malaysia (Borneo Island), The International Journal for Marine Environmental Scientists, Engineers, Administrators, Politicians and Lawyers 2013, 73, 369-373.
[109] P. P. K. Chai, Medicinal plants of Sarawak, Lee Miing Press, 2006.

166
[110] U. Quattrocchi, CRC World Dictionary of Medicinal and Poisonous Plants: Common Names, Scientific Names, Eponyms, Synonyms, and Etymology, Vol. 5, CRC Press, UK, 2015.
[111] K. C. Wong, S. W. Wong, S. S. Siew, D. Y. Tie, Volatile constituents of the fruits of Lansium domesticum correa (Duku and Langsat) and Baccaurea motleyana (Muell. Arg.) Muell. Arg. (Rambai), Flavour and Fragrance Journal 1994, 9, 319-324.
[112] X. W. Yang, H. P. He, Y. L. Ma, F. Wang, Y. Q. Zuo, H. Lin, S. L. Li, L. Li, X. J. Hao, Three new vanilloid derivatives from the stems of Baccaurea ramiflora, Planta Med. 2010, 76, 88-90.
[113] D. Ibrahim, N. Hazali, N. Jauhari, M. N. Yahya, I. A. Ahmed, M. A. Mikail, M. Ibrahim, Sub-chronic toxicological evaluation of the Baccaurea angulata (Belimbing Dayak) fruit juice in rats, International Journal of Applied Research in Natural Products 2013, 6, 23-32.
[114] D. Arbain, J. R. Cannon, K. Kartawinata, R. Djamal, A. Bustari, A. Dharma, H. Rivai, D. Basir, M. Sjafar, R. Nawfa, Survey of some West Sumatran plants for alkaloids, Econ Bot 1989, 43, 73-78.
[115] A. Latiff, I. M. Turner, K. Mat Sellehi, Taxonomic realignment of Malaysian vascular plants in Burkill’s monumental dictionary, The Malayan Nature Journal 2014, 65, 171-229.
[116] C. R. Su, Y. F. Chen, M. J. Liou, H. Y. Tsai, W. S. Chang, T. S. Wu, Anti-inflammatory activities of furanoditerpenoids and other constituents from Fibraurea tinctoria, Bioorg. Med. Chem. 2008, 16, 9603-9609.
[117] P. Rojsanga, W. Gritsanapan, W. Leelamanit, S. Sukrong, Molecular authentication of Thai medicinal plant Khamin khruea by PCR-RFLP analysis, Planta Med. 2008, 74, 1327-1333.
[118] N. Eswani, K. A. Kudus, M. Nazre, A. A. Noor, M. Ali, Medicinal plant diversity and vegetation analysis of logged over hill forest of Tekai Tembeling Forest Reserve, Jerantut, Pahang, Journal of Agricultural Science 2010, 2, 189-210.
[119] J. Siwon, R. Verpoorte, A. B. Svendsen, Studies on Indonesian medicinal plants VI further alkaloids from Fibraurea chloroleuca, Planta Med. 1981, 41, 65-68.
[120] C. R. Su, Y. F. Ueng, N. X. Dung, M. Vijaya Bhaskar Reddy, T. S. Wu, Cytochrome P3A4 inhibitors and other constituents of Fibraurea tinctoria, J. Nat. Prod. 2007, 70, 1930-1933.
[121] R. M. Ali, ASEAN Herbal and Medicinal Plants, ASEAN Secretariat, 2010. [122] R. P. T. Kim, V. Bihud, K. Bin Mohamad, K. H. Leong, J. Bin Mohamad, F. Bin
Ahmad, H. Hazni, N. Kasim, S. N. A. Halim, K. Awang, Cytotoxic and antioxidant compounds from the stem bark of Goniothalamus tapisoides Mat Salleh, Molecules 2012, 18, 128-139.
[123] F. Ahmad, B. A. Moharm, I. Jantan, A Comparative study of the constituents of the essential oils of Goniothalamus tapis Miq. and G. tapisoides Mat Salleh from Borneo, Journal of Essential Oil Research 2010, 22, 499-502.
[124] R. B. Gardens, M. B. G. Kew. (2012). The Plant List 1.1, from http://www.theplantlist.org/
[125] K. Mat-Salleh, A. Latiff, Tumbuhan Ubatan Malaysia, Pusat Pengurusan Penyelidikan, UKM, 2002.
[126] F. B. Ahmad, N. K. N. M. Sallehuddin, Z. Assim, Chemical constituents and antiviral study of Goniothalamus velutinus, Journal of Fundamental Sciences 2010, 6, 72-75.
[127] S. Omar, C. L. Chee, F. Ahmad, J. X. Ni, H. Jaber, J. Huang, T. Nakatsu, Phenanthrene lactams from Goniothalamus velutinus, Journal of Phytochemistry 1992, 31, 4395-4397.

167
[128] B. Fassihuddin, Phytochemical and biological studies on Goniothalamus spp. in Borneo, Iranian Journal of Pharmaceutical Research 2004, 3, 13-14.
[129] H. Keng, R.-S. L. Keng, The concise flora of Singapore: gymnosperms and dicotyledons, Vol. 1, NUS Press, 1990.
[130] I. Turner, New species of Polyalthia (Annonaceae) from Borneo and their relationship to Polyalthia cauliflora, Nordic Journal of Botany 2010, 28, 267-279.
[131] G. M. Cragg, D. J. Newman, K. M. Snader, Natural products in drug discovery and development, J. Nat. Prod. 1997, 60, 52-60.
[132] A. L. Harvey, Natural products in drug discovery, Drug Discov. Today 2008, 13, 894-901.
[133] R. L. Bieleski, N. A. Turner, Separation and estimation of amino acids in crude plant extracts by thin layer electrophoresis and chromatography, Journal of Analytical Biochemistry 1966, 17, 278-293.
[134] A. Gupta, M. Naraniwal, V. Kothari, Modern extraction methods for preparation of bioactive plant extracts, International Journal of Applied and Natural Sciences 2012, 1, 8-26.
[135] A. Nostro, M. Germano, V. D’angelo, A. Marino, M. Cannatelli, Extraction methods and bioautography for evaluation of medicinal plant antimicrobial activity, Lett. Appl. Microbiol. 2000, 30, 379-384.
[136] F. E. Ahmed, Analyses of pesticides and their metabolites in foods and drinks, Trend in Analytical Chemistry 2001, 20, 649-661.
[137] D. E. Breithaupt, Simultaneous HPLC determination of carotenoids used as food coloring additives: applicability of accelerated solvent extraction, Journal of Food Chemistry 2004, 86, 449-456.
[138] F. F. Cantwell, M. Losier, in Comprehensive Analytical Chemistry, Vol. 37, Elsevier, 2002, pp. 297-340.
[139] J. N. Eloff, A sensitive and quick microplate method to determine the minimal inhibitory concentration of plant extracts for bacteria, Journal of Planta Medica 1998, 64, 711-713.
[140] L. Berrueta, B. Gallo, F. Vicente, A review of solid phase extraction: basic principles and new developments, Journal of Chromatographia 1995, 40, 474-483.
[141] J. Dai, R. J. Mumper, Plant phenolics: Extraction, analysis and their antioxidant and anticancer properties, Journal of Molecules 2010, 15, 7313-7352.
[142] S. Babić, M. Petrović, M. Kaštelan-Macan, Ultrasonic solvent extraction of pesticides from soil, J. Chromatogr. A 1998, 823, 3-9.
[143] V. F. Péres, J. Saffi, M. I. S. Melecchi, F. C. Abad, R. de Assis Jacques, M. M. Martinez, E. C. Oliveira, E. B. Caramão, Comparison of soxhlet, ultrasound assisted and pressurized liquid extraction of terpenes, fatty acids and Vitamin E from Piper gaudichaudianum Kunth, J. Chromatogr. A 2006, 1105, 115-118.
[144] L. Wang, C. L. Weller, Recent advances in extraction of nutraceuticals from plants, Trends in Food Science & Technology 2006, 17, 300-312.
[145] G. Sapkale, S. Patil, U. Surwase, P. Bhatbhage, Supercritical fluid extraction, International Journal of Chemical Sciences 2010, 8, 729-743.
[146] C. S. Eskilsson, E. Björklund, Analytical-scale microwave assisted extraction, J. Chromatogr. A 2000, 902, 227-250.
[147] C. D. Stalikas, Extraction, separation, and detection methods for phenolic acids and flavonoids, J. Sep. Sci. 2007, 30, 3268-3295.
[148] M. J. Wells, J. L. Michael, Reversed-phase solid-phase extraction for aqueous environmental sample preparation in herbicide residue analysis, J. Chromatogr. Sci. 1987, 25, 345-350.

168
[149] C. F. Poole, New trends in solid-phase extraction, Trends in Analytical Chemistry 2003, 22, 362-373.
[150] D. M. Pavlović, S. Babić, A. J. Horvat, M. Kaštelan Macan, Sample preparation in analysis of pharmaceuticals, Trends in Analytical Chemistry 2007, 26, 1062-1075.
[151] K. M. Li, L. P. Rivory, S. J. Clarke, Solid Phase Extraction (SPE) techniques for sample preparation in clinical and pharmaceutical analysis: a brief overview, Current Pharmaceutical Analysis 2006, 2, 95-102.
[152] J. Płotka Wasylka, N. Szczepańska, M. de la Guardia, J. Namieśnik, Modern trends in solid phase extraction: new sorbent media, Trends in Analytical Chemistry 2016, 77, 23-43.
[153] S. I. Mussatto, L. F. Ballesteros, S. Martins, J. A. Teixeira, Extraction of antioxidant phenolic compounds from spent coffee grounds, Journal of Separation and Purification Technology 2011, 83, 173-179.
[154] Y. Wen, L. Chen, J. Li, D. Liu, L. Chen, Recent advances in solid-phase sorbents for sample preparation prior to chromatographic analysis, Trends in Analytical Chemistry 2014, 59, 26-41.
[155] F. Pena-Pereira, I. Lavilla, C. Bendicho, Miniaturized preconcentration methods based on liquid–liquid extraction and their application in inorganic ultratrace analysis and speciation: A review, Spectrochimica Acta Part B: Atomic Spectroscopy 2009, 64, 1-15.
[156] M. Santiago, S. Strobel, in Methods Enzymol., Vol. 533, Elsevier, 2013, pp. 303-324. [157] J. Sherma, in A Century of Separation Science, CRC Press, 2001, pp. 65-86. [158] I. Molnar, C. Horváth, Reverse-phase chromatography of polar biological substances:
separation of catechol compounds by high-performance liquid chromatography, Journal of Clinical Chemistry 1976, 22, 1497-1502.
[159] S. K. Bharti, R. Roy, Quantitative 1H NMR spectroscopy, Trends in Analytical Chemistry 2012, 35, 5-26.
[160] L. P. Koh, D. S. Wilcove, Is oil palm agriculture really destroying tropical biodiversity ?, Conservation Letters 2008, 1, 60-64.
[161] H. Girish, S. Satish, Antibacterial activity of important medicinal plants on human pathogenic bacteria-a comparative analysis, Journal of World Applied Sciences 2008, 5, 267-271.
[162] A. G. Hise, J. Tomalka, S. Ganesan, K. Patel, B. A. Hall, G. D. Brown, K. A. Fitzgerald, An essential role for the NLRP3 inflammasome in host defense against the human fungal pathogen Candida albicans, Journal of Cell Host & Microbe 2009, 5, 487-497.
[163] P. A. Hunter, S. Dawson, G. L. French, H. Goossens, P. M. Hawkey, E. J. Kuijper, D. Nathwani, D. J. Taylor, C. J. Teale, R. E. Warren, Antimicrobial-resistant pathogens in animals and man: prescribing, practices and policies, J. Antimicrob. Chemother. 2010, 65, 3-17.
[164] J. H. Jorgensen, J. D. Turnidge, Susceptibility Test Methods: Dilution and Disk Diffusion Methods*, 11 ed., American Society of Microbiology, 2015.
[165] C. Kamaraj, A. A. Rahuman, C. Siva, M. Iyappan, A. V. Kirthi, Evaluation of antibacterial activity of selected medicinal plant extracts from south India against human pathogens, Asian Pacific Journal of Tropical Disease 2012, 2, 296-301.
[166] B. A. Bannister, N. T. Begg, S. H. Gillespie, in Infectious Disease, Blackwell Science Pty Ltd, 2000, pp. 35-51.
[167] R. Gherardi, R. Becerril, C. Nerin, O. Bosetti, Development of a multilayer antimicrobial packaging material for tomato puree using an innovative technology, Journal of LWT-Food Science and Technology 2016, 72, 361-367.

169
[168] G. Caprioli, L. Navarini, M. Cortese, M. Ricciutelli, E. Torregiani, S. Vittori, G. Sagratini, Quantification of isoflavones in coffee by using solid phase extraction (SPE) and high performance liquid chromatography tandem mass spectrometry (HPLC‐MS/MS), J. Mass Spectrom. 2016, 51, 698-703.
[169] N. M. Garrido, I. G. Economou, A. J. Queimada, M. Jorge, E. A. Macedo, Prediction of the n‐hexane/water and 1-octanol/water partition coefficients for environmentally relevant compounds using molecular simulation, AIChE Journal 2012, 58, 1929-1938.
[170] K. Ansari, C. Lal, Synthesis, physicochemical properties and antimicrobial activity of some new benzimidazole derivatives, European Journal of Medicinal Chemistry 2009, 44, 4028-4033.
[171] K. Valko, C. Du, C. Bevan, D. P. Reynolds, M. H. Abraham, Rapid method for the estimation of octanol/water partition coefficient (log Poct) from gradient RP-HPLC retention and a hydrogen bond acidity term (Sigma alpha2H), Curr. Med. Chem. 2001, 8, 1137-1146.
[172] M. Anastassiades, S. J. Lehotay, D. Štajnbaher, F. J. Schenck, Fast and easy multiresidue method employing acetonitrile extraction/partitioning and “dispersive solid-phase extraction” for the determination of pesticide residues in produce, J. AOAC Int. 2003, 86, 412-431.
[173] D. J. Creek, A. Jankevics, R. Breitling, D. G. Watson, M. P. Barrett, K. E. Burgess, Toward global metabolomics analysis with hydrophilic interaction liquid chromatography mass spectrometry: improved metabolite identification by retention time prediction, Journal of Analytical chemistry 2011, 83, 8703-8710.
[174] B. A. Olsen, Hydrophilic interaction chromatography using amino and silica columns for the determination of polar pharmaceuticals and impurities, J. Chromatogr. A 2001, 913, 113-122.
[175] E. J. Hayhoe, E. A. Palombo, Extracts of Eremophila longifolia inhibit the cariogenic activities of Streptococcus mutans and Streptococcus sobrinus, Journal of medicinal plant research 2011, 5, 2476-2482.
[176] M. E. Saravia, P. Nelson-Filho, R. A. B. Silva, A. De Rossi, G. Faria, L. A. B. Silva, C.-G. Emilson, Recovery of Streptococuus mutans on MSB, SB-20 and SB-20M agar media, Arch. Oral Biol. 2013, 58, 311-316.
[177] C. Kenny, A. Furey, B. Lucey, A post-antibiotic era looms: can plant natural product research fill the void ?, Br. J. Biomed. Sci. 2015, 72, 191-200.
[178] K. Hegstad, C. G. Giske, B. Haldorsen, E. Matuschek, K. Schønning, T. M. Leegaard, G. Kahlmeter, A. Sundsfjord, Performance of the EUCAST disk diffusion method, the CLSI agar screen method, and the Vitek 2 automated antimicrobial susceptibility testing system for detection of clinical isolates of Enterococci with low and medium level VanB type vancomycin resistance: a multicenter study, J. Clin. Microbiol. 2014, 52, 1582-1589.
[179] D. E. Yang, X. Y. Lin, Y. L. Wang, Z. G. Yang, Q. Wei, Structure-functional relationship of chitosans against bacteria, Gaodeng Xuexiao Huaxue Xuebao/Chemical Journal of Chinese Universities 2006, 27, 1277-1281.
[180] U. Mabona, A. Viljoen, E. Shikanga, A. Marston, S. Van Vuuren, Antimicrobial activity of southern African medicinal plants with dermatological relevance: From an ethnopharmacological screening approach, to combination studies and the isolation of a bioactive compound, J. Ethnopharmacol. 2013, 148, 45-55.
[181] P. Velmurugan, K. Anbalagan, M. Manosathyadevan, K.-J. Lee, M. Cho, S. M. Lee, J. H. Park, S. G. Oh, K. S. Bang, B. T. Oh, Green synthesis of silver and gold nanoparticles using Zingiber officinale root extract and antibacterial activity of silver

170
nanoparticles against food pathogens, Journal of Bioprocess and Biosystems Engineering 2014, 37, 1935-1943.
[182] M. Mohsen-Nia, H. Amiri, B. Jazi, Dielectric constants of water, methanol, ethanol, butanol and acetone: Measurement and computational study, Journal of Solution Chemistry 2010, 39, 701-708.
[183] X. Yuan, J. Wang, G. Zeng, H. Huang, X. Pei, H. Li, Z. Liu, M. Cong, Comparative studies of thermochemical liquefaction characteristics of microalgae using different organic solvents, Energy 2011, 36, 6406-6412.
[184] J. S. Kirkwood, C. Maier, J. F. Stevens, Simultaneous, untargeted metabolic profiling of polar and nonpolar metabolites by LC‐Q‐TOF Mass Spectrometry, Curr. Protoc. Toxicol. 2013, 4, 1-4.
[185] J. Coetzee, G. Padmanabhan, Properties of bases in acetonitrile as solvent. IV. Proton acceptor power and homoconjugation of mono-and diamines, J. Am. Chem. Soc. 1965, 87, 5005-5010.
[186] G. Conrads, H. J. de Soet, L. Song, K. Henne, H. Sztajer, I. Wagner Döbler, A. P. Zeng, Comparing the cariogenic species Streptococcus sobrinus and S. mutans on whole genome level, Journal of Oral Microbiology 2014.
[187] M. Okada, Y. Soda, F. Hayashi, T. Doi, J. Suzuki, K. Miura, K. Kozai, PCR detection of Streptococcus mutans and S. sobrinus in dental plaque samples from Japanese pre-school children, J. Med. Microbiol. 2002, 51, 443-447.
[188] S. D’erole, M. Tieri, D. Martinelli, D. Tripodi, The effect of swimming on oral health status: competitive versus non-competitive athletes, Journal of Applied Oral Science 2016, 24, 107-113.
[189] M. M. Nascimento, J. A. Lemos, J. Abranches, R. B. Gonçalves, R. A. Burne, Adaptive acid tolerance response of Streptococcus sobrinus, J. Bacteriol. 2004, 186, 6383-6390.
[190] J. Gan, S. Papiernik, W. Koskinen, S. Yates, Evaluation of Accelerated Solvent Extraction (ASE) for analysis of pesticide residues in soil, Journal of Environmental Science & Technology 1999, 33, 3249-3253.
[191] W. Jennings, Qualitative analysis of flavor and fragrance volatiles by glass capillary gas chromatography, Elsevier, 2012.
[192] H. Pennington, Escherichia coli O157, The Lancet 2010, 376, 1428-1435. [193] R. E. Rosenberg Goldstein, S. A. Micallef, S. G. Gibbs, A. George, E. Claye, A.
Sapkota, S. W. Joseph, A. R. Sapkota, Detection of Vancomycin Resistant Enterococci (VRE) at four U.S. wastewater treatment plants that provide effluent for reuse, Sci. Total Environ. 2014, 466, 404-411.
[194] M. L. Nelson, S. B. Levy, The history of the tetracyclines, Ann. N. Y. Acad. Sci. 2011, 1241, 17-32.
[195] A. H. Banskota, Y. Tezuka, K. Q. Tran, K. Tanaka, I. Saiki, S. Kadota, Thirteen novel cycloartane-type tri terpenes from Combretum quadrangulare, J. Nat. Prod. 2000, 63, 57-64.
[196] H. H. Wasserman, J. L. Ives, Singlet oxygen in organic synthesis, Tetrahedron 1981, 37, 1825-1852.
[197] M. Zamadar, A. Greer, in Handbook of Synthetic Photochemistry, Wiley-VCH Verlag GmbH & Co. KGaA, 2010, pp. 353-386.
[198] K. S. Ngo, G. D. Brown, Autoxidation of a santalene, Journal of Chemical Research 2000, 2000, 68-70.
[199] M. Sköld, A. Börje, E. Harambasic, A. T. Karlberg, Contact allergens formed on air exposure of linalool. Identification and quantification of primary and secondary oxidation products and the effect on skin sensitization, Chem. Res. Toxicol. 2004, 17, 1697-1705.

171
[200] L. Hagvall, C. Bäcktorp, S. Svensson, G. Nyman, A. Börje, A. T. Karlberg, Fragrance compound geraniol forms contact allergens on air exposure. Identification and quantification of oxidation products and effect on skin sensitization, Chem. Res. Toxicol. 2007, 20, 807-814.
[201] J. W. de Haan, L. J. M. Van de Ven, Configurations and conformations in acyclic, unsaturated hydrocarbons. A 13C NMR study, Organic Magnetic Resonance 1973, 5, 147-153.
[202] K. Akhtar, S. B. Khan, L. Khan, Synthesis and characterization of new derivatives of cinnamic acid, Organic Chemistry: An Indian Journal 2009, 5, 142–147.
[203] M. Zanetti, T. K. Carniel, A. Valério, J. V. d. Oliveira, D. d. Oliveira, P. H. H. d. Araújo, H. G. Riella, M. A. Fiori, Synthesis of geranyl cinnamate by lipase catalyzed reaction and its evaluation as an antimicrobial agent, J. Chem. Technol. Biotechnol. 2017, 92, 115-121.
[204] M. Imai, T. Kumaoka, M. Hosaka, Y. Sato, C. Li, M. Sudoh, Y. Tamada, H. Yokoe, S. Saito, M. Tsubuki, N. Takahashi, Inhibitory effects of hydroxylated cinnamoyl esters on lipid absorption and accumulation, Bioorg. Med. Chem. 2015, 23, 3788-3795.
[205] S. S. Hong, J. S. Oh, Phenylpropanoid ester from Zingiber officinale and their inhibitory effects on the production of nitric oxide, Arch. Pharm. Res. 2012, 35, 315–320.
[206] K. Uwai, Y. Osanai, T. Imaizumi, S.-i. Kanno, M. Takeshita, M. Ishikawa, Inhibitory effect of the alkyl side chain of caffeic acid analogues on lipopolysaccharide-induced nitric oxide production in RAW264.7 macrophages, Bioorg. Med. Chem. 2008, 16, 7795-7803.
[207] A. A. Hussein, D. A. Olmedo, Y. Vasquez, P. D. Coley, P. N. Solis, M. P. Gupta, New cytotoxic cinnamic acid derivatives from leaves of Bonamia trichantha, Revista Latinoamericana de Quimica 2005, 33, 90-95.
[208] K. Otoguro, M. Iwatsuki, A. Ishiyama, M. Namatame, A. Nishihara Tsukashima, H. Kiyohara, T. Hashimoto, Y. Asakawa, S. Ōmura, H. Yamada, In vitro antitrypanosomal activity of some phenolic compounds from propolis and lactones from Fijian Kawa (Piper methysticum), Journal of Natural Medicines 2012, 66, 558-561.
[209] D. L. Gaveau, D. Sheil, M. A. Salim, S. Arjasakusuma, M. Ancrenaz, P. Pacheco, E. Meijaard, Rapid conversions and avoided deforestation: examining four decades of industrial plantation expansion in Borneo, Journal of Scientific Reports 2016, 6, 1-14.
[210] D. L. Gaveau, M. Kshatriya, D. Sheil, S. Sloan, E. Molidena, A. Wijaya, S. Wich, M. Ancrenaz, M. Hansen, M. Broich, Reconciling forest conservation and logging in Indonesian Borneo, Journal of PlOS One 2013, 8, 1-11.
[211] H. Goh, Influence of park governance on tourism development In Kinabalu Park, Malaysia Borneo, Journal of WIT Transactions on Ecology and the Environment 2015, 193, 929-939.
[212] B. Fasihuddin, L. B. Din, Medicinal plants used by various ethnic groups in Sarawak, Malaysian Journal of Science 2017, 18, 7-11.
[213] P. Uppuluri, A. Srinivasan, A. Ramasubramanian, J. L. Lopez-Ribot, Effect of fluconazole, amphotericin B and caspofungin against Candida albicans biofilms under conditions of flow and on biofilm dispersion, Antimicrob. Agents Chemother. 2011, AAC. 01701-01710.
[214] G. Ramage, K. V. Walle, B. L. Wickes, J. L. Lopez-Ribot, Characteristics of biofilm formation by Candida albicans, Revista iberoamericana de micología 2001, 18, 163-170.
[215] D. M. MacCallum, in Pathogenic Yeasts (Eds.: R. Ashbee, E. M. Bignell), Springer Berlin Heidelberg, 2010, pp. 41-67.

172
[216] P. Lambert, Cellular impermeability and uptake of biocides and antibiotics in Gram‐positive bacteria and mycobacteria, J. Appl. Microbiol. 2002, 92.
[217] K. Molbak, J. E. Oslen, H. C. Wegener, in Foodborne Infections, 3rd ed. (Eds.: H. P. Riemann, D. O. Cliver), Acadamic Press, London, 2006.
[218] A. Garg, S. Sujatha, J. Garg, N. S. Acharya, S. C. Parija, Wound infections secondary to snakebite, The Journal of Infection in Developing Countries 2009, 3, 221-223.
[219] J. Hauke, T. Kossowski, Comparison of values of Pearson's and Spearman's correlation coefficients on the same sets of data, Quaestiones geographicae 2011, 30, 87-93.
[220] J. H. Zar, Biostatistical Analysis, Prentice-Hall, 1984. [221] W. Pan, D. Jussier, N. Terrade, R. Y. Yada, R. M. De Orduna, Kinetics of sugars,
organic acids and acetaldehyde during simultaneous yeast-bacterial fermentations of white wine at different pH values, Food research international 2011, 44, 660-666.
[222] E. Bartowsky, Bacterial spoilage of wine and approaches to minimize it, Lett. Appl. Microbiol. 2009, 48, 149-156.
[223] E. Mani-López, H. S. García, A. López-Malo, Organic acids as antimicrobials to control Salmonella in meat and poultry products, Food Research International 2012, 45, 713-721.
[224] K. Over, N. Hettiarachchy, M. Johnson, B. Davis, Effect of organic acids and plant extracts on Escherichia coli O157: H7, Listeria monocytogenes, and Salmonella Typhimurium in broth culture model and chicken meat systems, J. Food Sci. 2009, 74, 515-521.
[225] J. C. Buzby, P. D. Frenzen, B. Rasco, Product liability and microbial foodborne illness, US Department of Agriculture, Economic Research Service, 2001.
[226] S. DeBolt, D. R. Cook, C. M. Ford, L-Tartaric acid synthesis from vitamin C in higher plants, Journal of Proceedings of the National Academy of Sciences 2006, 103, 5608-5613.
[227] K. Saito, Z. Kasai, Accumulation of tartaric acid in the ripening process of grapes, Plant Cell Physiol. 1968, 9, 529-537.
[228] H. Cen, Y. Bao, Y. He, D.-W. Sun, Visible and near infrared spectroscopy for rapid detection of citric and tartaric acids in orange juice, Journal of Food Engineering 2007, 82, 253-260.
[229] P. Muangthai, P. Nookaew, Monitoring on some organic acids in fresh and processed rural plant leaves in Thailand, Asian Journal of Natural & Applied Sciences 2015, 4, 82-89.
[230] K. Saito, F. A. Loewus, Formation of tartaric acid in vitaceous plants: Relative contributions of L-ascorbic acid inclusive and non inclusive Pathways, Plant Cell Physiol. 1989, 30, 905-910.
[231] S. Yamaguchi, K. Ninomiya, Umami and Food Palatability, The Journal of Nutrition 2000, 130, 921-926.
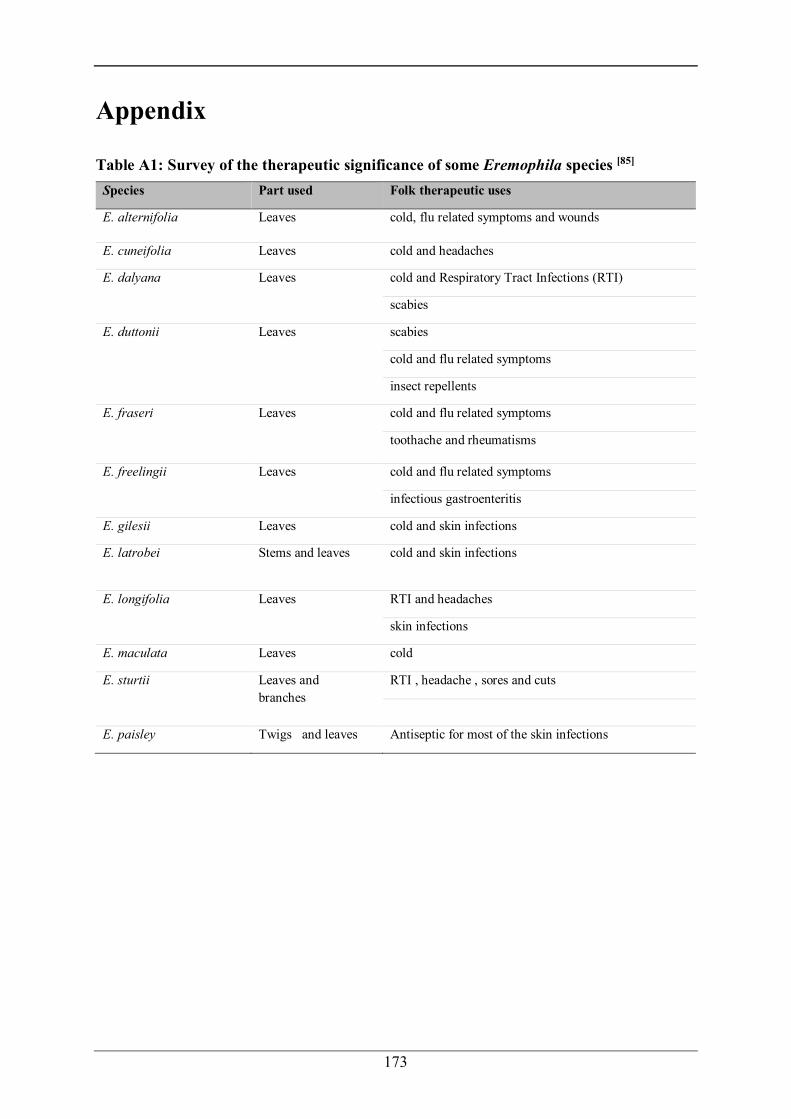
173
Appendix
Table A1: Survey of the therapeutic significance of some Eremophila species [85] Species Part used Folk therapeutic uses E. alternifolia Leaves cold, flu related symptoms and wounds E. cuneifolia Leaves cold and headaches E. dalyana Leaves cold and Respiratory Tract Infections (RTI)
scabies
E. duttonii Leaves scabies
cold and flu related symptoms
insect repellents
E. fraseri Leaves cold and flu related symptoms
toothache and rheumatisms
E. freelingii Leaves cold and flu related symptoms
infectious gastroenteritis
E. gilesii Leaves cold and skin infections
E. latrobei Stems and leaves cold and skin infections
E. longifolia Leaves RTI and headaches
skin infections
E. maculata Leaves cold
E. sturtii Leaves and branches
RTI , headache , sores and cuts
E. paisley Twigs and leaves Antiseptic for most of the skin infections

174
Table A2: Volatile oil composition of E. longifolia specimens collected from various locations in western NSW, Australia [94]
NSW Bioregion
MD MD MD MD MD BHC MDD CP
Voucher ID JES019 SM003 SM004 SM005 SM012 SM017 SM018 SM019 Month of collection
Aug Dec Dec Dec Dec Dec Dec Dec
Yield (% w/w) 3.1 5.7 4.9 5.6 5.1 1.9 0.5 0.4
Compounds RRI Quantity (%) Identification
Bornylene 902 – – – – – – – 1.3 α-Pinene 935 – – – – – – – 0.4 α-Fenchene 950 – – – – – – – 0.5 Camphene 952 – – – – – – – 2.5 Sabinene 974 – – – – – – – 5 β-pinene 979 – – – – – – – 0.2 β-Myrcene 990 – – – – – – – 1.3 4-Carene 998 0.1 0.4 0.4 0.4 0.4 – – – α-Phellandrene 1006 – – – – – – – 0.2 α-Terrpinene 1017 – 0.3 0.3 0.3 0.4 0.1 – 0.4 p-Cymene 1026 0.1 0.1 0.1 0.1 0.1 0.1 0.1 0.7 Limonene 1030 0.2 0.8 0.7 0.7 0.8 2.1 0.9 9.9 β-Phellandrene 1032 – – – – – – – 0.8 β-Ocimene (Z) 1048 – – – – – – – 0.5 γ-Terpinene 1058 – – – – – – – 0.6 Terpinolene 1084 – – – – – 0.3 – 4.7 Fenchone 1087 – – – – – – – 0.4 Linalool 1088 0.3 0.6 0.1 0.4 0.3 1 – – Fenchol 1117 – – – – – – – 19.7

175
Table A2: Volatile oil composition of E. longifolia specimens collected from various locations in western NSW, Australia. (cont.)
NSW Bioregion MD MD MD MD MD BHC MDD CP
Voucher ID JES019 SM003 SM004 SM005 SM012 SM017 SM018 SM019 Month of collection
Aug Dec Dec Dec Dec Dec Dec Dec
Yield (% w/w) 3.1 5.7 4.9 5.6 5.1 1.9 0.5 0.4
Compounds RRI Quantity (%) Identification
Menth-2-en-1-ol 1125 0.1 0.1 0.1 0.2 0.1 0.1 0.1 0.3 Limonene oxide 1132 – – – – – – – 0.4 Isomenthone 1168 75.2 67.5 61.1 74.5 86.7 0.3 10.1 1.2 Borneol 1175 – – – – – – – 31.7 4-Terpineol 1187 – 0.1 0.2 0.2 0.2 – – 4.4 α-Terpineol 1196 8.3 8.8 11 11 8.8 11.7 4.1 1.3 Exo-Fenchyl acetate 1218 – – – – – – – 0.1
(S)-Carvone 1247 – – – – – – 0.1 – Piperitone 1259 1.6 3.8 2.8 1.7 0.5 0.4 0.1 – Bornyl acetate 1284 – – – – – – – 7.2 Unidentified – 5.4 0.3 0.4 1 0.7 2.9 2.2 2.8 Total identified – 94.6 99.7 99.6 99 99.3 97.1 97.8 97.2
Abbreviations: RRI: Kovats retention indices, relative to C9–C24 alkanes on non-polar column (ZB-5 ms); (%): Relative percentage obtained from peak area; MD: Mootwingee Downs bioregion; BHC: Broken Hill Complex bioregion; MDD: Murray–Darling Depression bioregion; CP: Cobar peneplain bioregion; Identification: MS: Mass spectra; RI: Retention

176
Table A3: Diverse names for Baccaurea lanceolata (Miq.) Müll.Arg
Sarawak anthology Synonyms Vernacular names (According to the Tribe)
Common/English name
Pisau (Bidayuh) Limpa’ong (Iban) Bua’pau (Kelabit) Lepesu (Penan)
Adenocrepis lancealatus (Miq.) Müll. Arg Baccaurea pyrrhodasya (Miq.) Müll. Arg Baccaurea glabriflora Pax & K. Hoffm Hedycarpus lancealatus Miq. (basionym) Pierardia pyrrhodasya Miq.
Limpasu (Banjarese: Bundu Tuhan) Ampusu (Bidayuh) Asam pauh, Empaong, Lampaong Lampawong, Lampong (Iban) Buah Lepasu Lipasu, Nipassu (Dusun) Kalampesu, Lempahong (Kalimantan) Buah Lipauh (Kelabit) Kelepesoh (Kenyah) Tampoy (Malay) Buah Lepesuh (Punan)
Lampaong
Table A4: Diverse names for F.tinctoria Lour[109, 115]
Synonyms Vernacular names
Fibraurea chloroleua Akar kunyit, randau merkunyit (Iban) Lang pempuan (Kedayan) Akar penawar (Penan) Akbah binak (Kayn) Laka lete (Penan Totoh)

177
Figure B: Supporting Information antibacterial neryl ferulate from the Australian Plant Eremophila longifolia Figure B1: 1H NMR spectrum of neryl ferulate (1) (CDCl3, 600 MHz)

178
Figure B2: Expansion of 1H NMR spectrum of neryl ferulate (1) (CDCl3)

179
Figure B3: 13C NMR spectrum of neryl ferulate (1) (CDCl3, 150 MHz)

180
Figure B4: Expansion of 13C NMR spectrum of neryl ferulate (1) (CDCl3, 150 MHz)

181
Figure B5: COSY NMR spectrum of neryl ferulate (1) (CDCl3)

182
Figure B6: HSQC NMR spectrum of neryl ferulate (1) (CDCl3)
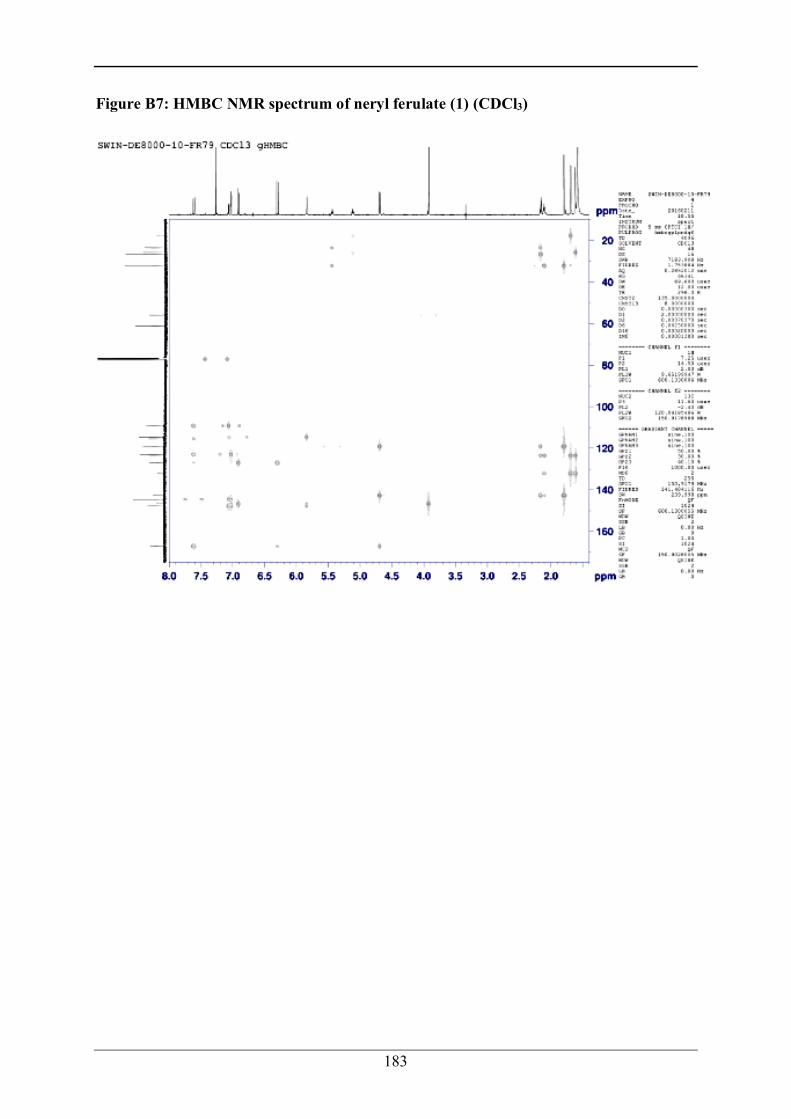
183
Figure B7: HMBC NMR spectrum of neryl ferulate (1) (CDCl3)

184
Table C: Supporting Information antibacterial neryl p-coumarate from the Australian Plant Eremophila longifolia Figure C1: 1H NMR spectrum of neryl p-coumarate (2) (CDCl3, 600 MHz)

185
Figure C2: Expansion of 1H NMR spectrum of neryl p-coumarate (2) (CDCl3)

186
Figure C3: 13C NMR spectrum of neryl p-coumarate (2) (CDCl3)

187
Figure C4: Expansion of 13C NMR spectrum of neryl p-coumarate (2) (CDCl3)

188
Figure C5: COSY NMR spectrum of neryl p-coumarate (2) (CDCl3)

189
Figure C6: HSQC NMR spectrum of neryl p-coumarate (2) (CDCl3)

190
Figure C7: HMBC NMR spectrum of neryl p-coumarate (2) (CDCl3)

191
Figure D: Supporting NMR spectrums of neryl ferulate autooxidation
Figure D1: Structure of neryl ferulate (1) autooxidation products and peak assignments in the HSQC spectrum

192
Figure D2: 1H NMR spectrum of neryl ferulate (1) autooxidation products (CD3OD, 600 MHz)

193
Figure D3: JMOD NMR spectrun of neryl ferulate (1) autooxidation products (CD3OD, 125 MHZ)

194
Figure D4: COSY NMR spectrum of neryl ferulate (1) autoxidation products (CD3OD)

195
Figure D5: HMBC NMR spectrum of neryl ferulate (1) autoxidation products (CD3OD)