wpic platinum quarterly q1 2018 - … · prepared by sfa (oxford) for world platinum investment...
TRANSCRIPT

© World Platinum Investment Council Ltd 2018 Page 1 of 20
PLATINUM QUARTERLYQ1 201814th May 2018
ContentsForeword P1 Summary Table P3 First Quarter 2018 Review P4 2018 Forecast P7
Expanded Tables P12 Glossary of Terms P16 Copyright and Disclaimer P18
FOREWORD
One of the primary aims of the World Platinum Investment Council (WPIC) is to make the platinum market easier for investors to understand and navigate. The complexities of this market are many and varied.
Many experts and institutional investors who understand and work in this market are currently visiting London. I look forward to meeting many of them during what I’m sure will be a very busy and thought-provoking London Platinum Week.
However, if the WPIC is to succeed in its mission to expand the size of the investment market for platinum, then we have also to successfully reach and support retail investors.
We have made great strides in retail during the last few years, entering into partnerships with BullionVault, Valcambi, the UK’s Royal Mint, Tanaka and Mitsubishi in Japan, GraniteShares in the US, among others; but we can do more.
China, particularly the Chinese retail market, is a priority target for our global team. We are increasing awareness of platinum as an investment asset in China, and we have advanced plans to launch a number of new investment products including, for example, platinum accumulation plans, which have previously proved to be a springboard for growth in Japan.
I recently posted a couple of articles looking at the development of platinum investment in both Western and Asian markets.
As part of our wider retail engagement and promotion of platinum as the best precious metal and as an investment asset, last month we announced our new partnership with the Athletics World Cup, which takes place in London in July. The winner of this prestigious team event, which will involve the eight highest ranked teams over selected track and field events (US, UK, Germany, South Africa, France, China, Poland and Jamaica) will scoop the Platinum Trophy which we are providing to this inaugural event.
Celebrating the finest athletics team in the world and linking them with the world’s best precious metal, fires the starting gun on a campaign to heighten public awareness of platinum as an investment worthy of consideration. This is already proving particularly helpful to our efforts in China.
Somewhat ironically, the historically low price of platinum, and its continued discount to gold, is supporting our efforts to gain interest from value investors in China. However, this clearly doesn’t help our wider efforts elsewhere in the world.
The platinum price is weak. PGM producers are struggling to remain profitable against the backdrop of low US dollar prices and a stronger South African rand.
Platinum’s robust fundamentals, which are scrutinised in today’s Platinum Quarterly, appear unable to shake-off the negative sentiment driving the short-term price.
Platinum demand in 2018 will be up, despite falling diesel sales. But this is only the headline, which masks the complex underlying activity in the sector.
While diesel car sales are down in the European Union, heavy duty diesel sales are strong in the rest of the world. US heavy-duty truck orders have responded to rising freight demand in a confident economy. US sales of Daimler Trucks, for instance, are up 21%. In China, increased sales were bolstered by higher platinum loadings to meet tightening emissions legislation. Environmentally driven fleet renewal in India is now also underway.
Against this backdrop, it’s interesting to observe how automakers are communicating their respective strategies to the wider market. There has been a significant increase in the number of announcements by automakers on the need for diesel cars to meet CO2 targets. It seems many have evaluated the risk of high CO2 fines when compared to the cost of addressing diesel emissions. We believe many have already decided that low NOx solutions are preferable to accepting fines and are now producing very clean diesels.
© World Platinum Investment Council Ltd 2018 Page 2 of 20
PLATINUM QUARTERLY Q1 2018
For those without a diesel solution, deafening silence tells its own story.
This month’s Platinum Quarterly shows that the expected rebound in industrial demand in 2018 is supported by strong demand growth in the first quarter, up 4% year-on-year and 6% quarter-on-quarter.
The turnaround in Chinese jewellery demand continues with same-store sales at the world’s largest listed jewellery retailer, Chow Tai Fook, up 7% in the first quarter, building on a 5% increase at the end of 2017.
On the supply side, the data we publish today requires a greater amount of explanation than we would normally consider in this foreword.
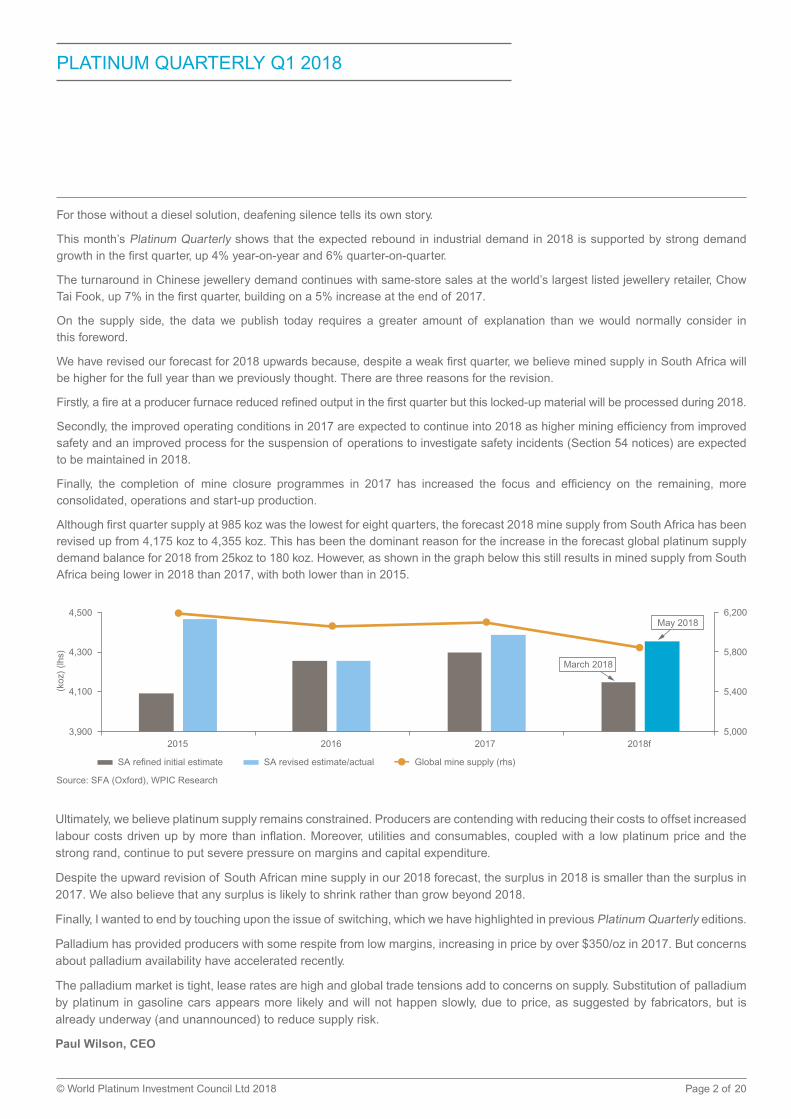
We have revised our forecast for 2018 upwards because, despite a weak first quarter, we believe mined supply in South Africa will be higher for the full year than we previously thought. There are three reasons for the revision.
Firstly, a fire at a producer furnace reduced refined output in the first quarter but this locked-up material will be processed during 2018.
Secondly, the improved operating conditions in 2017 are expected to continue into 2018 as higher mining efficiency from improved safety and an improved process for the suspension of operations to investigate safety incidents (Section 54 notices) are expected to be maintained in 2018.
Finally, the completion of mine closure programmes in 2017 has increased the focus and efficiency on the remaining, more consolidated, operations and start-up production.
Although first quarter supply at 985 koz was the lowest for eight quarters, the forecast 2018 mine supply from South Africa has been revised up from 4,175 koz to 4,355 koz. This has been the dominant reason for the increase in the forecast global platinum supply demand balance for 2018 from 25koz to 180 koz. However, as shown in the graph below this still results in mined supply from South Africa being lower in 2018 than 2017, with both lower than in 2015.
5,000
5,400
5,800
6,200
3,900
4,100
4,300
4,500
(koz
) (lh
s)
2015 2016 2017 2018f
March 2018
May 2018
SA refined initial estimate SA revised estimate/actual Global mine supply (rhs)
XXX
Source: SFA (Oxford), WPIC Research
Ultimately, we believe platinum supply remains constrained. Producers are contending with reducing their costs to offset increased labour costs driven up by more than inflation. Moreover, utilities and consumables, coupled with a low platinum price and the strong rand, continue to put severe pressure on margins and capital expenditure.
Despite the upward revision of South African mine supply in our 2018 forecast, the surplus in 2018 is smaller than the surplus in 2017. We also believe that any surplus is likely to shrink rather than grow beyond 2018.
Finally, I wanted to end by touching upon the issue of switching, which we have highlighted in previous Platinum Quarterly editions.
Palladium has provided producers with some respite from low margins, increasing in price by over $350/oz in 2017. But concerns about palladium availability have accelerated recently.
The palladium market is tight, lease rates are high and global trade tensions add to concerns on supply. Substitution of palladium by platinum in gasoline cars appears more likely and will not happen slowly, due to price, as suggested by fabricators, but is already underway (and unannounced) to reduce supply risk.
Paul Wilson, CEO
Page 3 of 20Prepared by SFA (Oxford) for World Platinum Investment Council
PLATINUM QUARTERLY Q1 2018
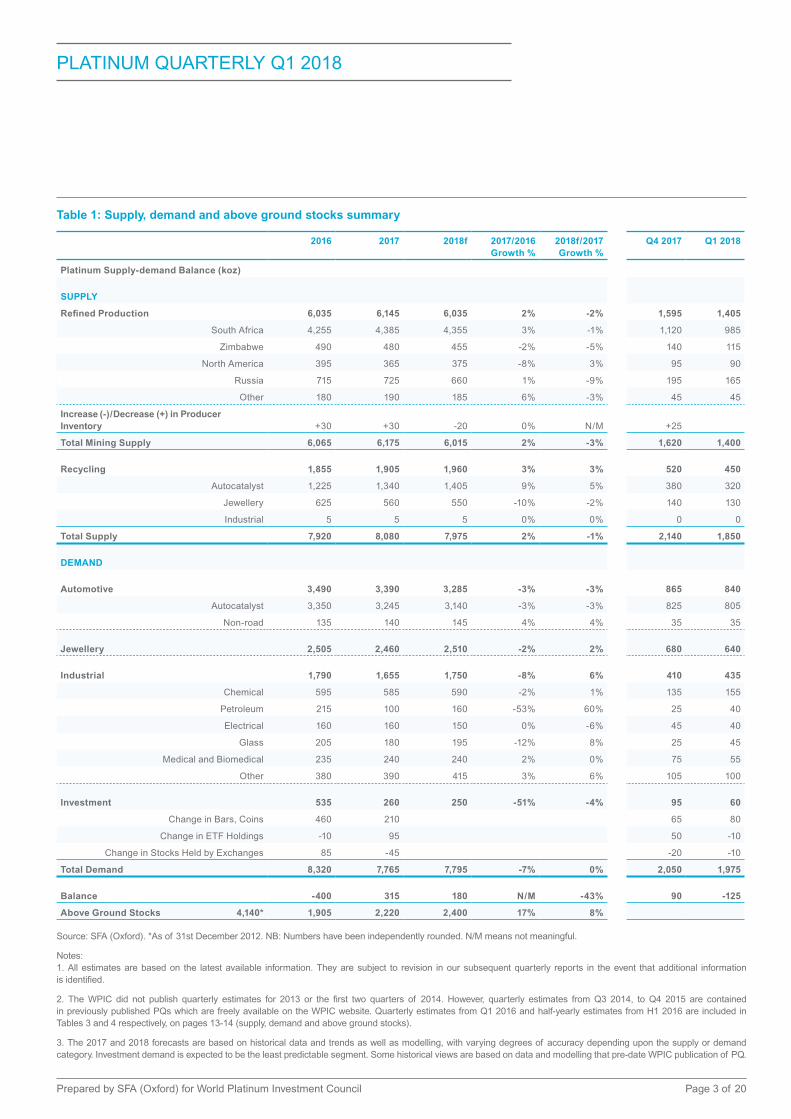
Table 1: Supply, demand and above ground stocks summary
2016 2017 2018f 2017/2016 Growth %
2018f/2017 Growth %
Q4 2017 Q1 2018
Platinum Supply-demand Balance (koz)
SUPPLY
Refined Production 6,035 6,145 6,035 2% -2% 1,595 1,405
South Africa 4,255 4,385 4,355 3% -1% 1,120 985
Zimbabwe 490 480 455 -2% -5% 140 115
North America 395 365 375 -8% 3% 95 90
Russia 715 725 660 1% -9% 195 165
Other 180 190 185 6% -3% 45 45
Increase (-)/Decrease (+) in Producer Inventory +30 +30 -20 0% N/M +25
Total Mining Supply 6,065 6,175 6,015 2% -3% 1,620 1,400
Recycling 1,855 1,905 1,960 3% 3% 520 450
Autocatalyst 1,225 1,340 1,405 9% 5% 380 320
Jewellery 625 560 550 -10% -2% 140 130
Industrial 5 5 5 0% 0% 0 0
Total Supply 7,920 8,080 7,975 2% -1% 2,140 1,850
DEMAND
Automotive 3,490 3,390 3,285 -3% -3% 865 840
Autocatalyst 3,350 3,245 3,140 -3% -3% 825 805
Non-road 135 140 145 4% 4% 35 35
Jewellery 2,505 2,460 2,510 -2% 2% 680 640
Industrial 1,790 1,655 1,750 -8% 6% 410 435
Chemical 595 585 590 -2% 1% 135 155
Petroleum 215 100 160 -53% 60% 25 40
Electrical 160 160 150 0% -6% 45 40
Glass 205 180 195 -12% 8% 25 45
Medical and Biomedical 235 240 240 2% 0% 75 55
Other 380 390 415 3% 6% 105 100
Investment 535 260 250 -51% -4% 95 60
Change in Bars, Coins 460 210 65 80
Change in ETF Holdings -10 95 50 -10
Change in Stocks Held by Exchanges 85 -45 -20 -10
Total Demand 8,320 7,765 7,795 -7% 0% 2,050 1,975
Balance -400 315 180 N/M -43% 90 -125
Above Ground Stocks 4,140* 1,905 2,220 2,400 17% 8%
Source: SFA (Oxford). *As of 31st December 2012. NB: Numbers have been independently rounded. N/M means not meaningful.
Notes: 1. All estimates are based on the latest available information. They are subject to revision in our subsequent quarterly reports in the event that additional information is identified.
2. The WPIC did not publish quarterly estimates for 2013 or the first two quarters of 2014. However, quarterly estimates from Q3 2014, to Q4 2015 are contained in previously published PQs which are freely available on the WPIC website. Quarterly estimates from Q1 2016 and half-yearly estimates from H1 2016 are included in Tables 3 and 4 respectively, on pages 13-14 (supply, demand and above ground stocks).
3. The 2017 and 2018 forecasts are based on historical data and trends as well as modelling, with varying degrees of accuracy depending upon the supply or demand category. Investment demand is expected to be the least predictable segment. Some historical views are based on data and modelling that pre-date WPIC publication of PQ.

Page 4 of 20Prepared by SFA (Oxford) for World Platinum Investment Council
PLATINUM QUARTERLY Q1 2018
2018 FIRST QUARTER PLATINUM MARKET REVIEW
Global demand was 1,975 koz in the first quarter of the year, down marginally (-10 koz) year-on-year as gains in jewellery (+30 koz) and industrial (+15 koz) demand were outweighed by declines in automotive (-35 koz) and investment demand (-20 koz). Total supply rose 4% (+75 koz) year-on-year to 1,850 koz as both primary and secondary supply increased. The first quarter typically sees weak output from South Africa, but an improvement in output from Russia resulted in global refined production falling 10 koz and, unlike Q1’17, there was not a significant build in producer inventory, so overall total mining supply increased by 3% to 1,400 koz. The resulting market balance was a deficit of 125 koz (Chart 1).
Supply
Refined production fell by 0.7% (-10 koz) year-on-year to 1,405 koz in the first quarter of 2018. A fire at a South African producer’s furnace in February this year resulted in a build-up of concentrate (around 75-80 koz), reducing refined production in the quarter, but this was partly offset by ongoing operational improvements across the mines on South Africa’s Western-limb – including the extraction of higher-grade ore, higher concentrator recoveries and improved stoping efficiencies. South African supply decreased by 3% year-on-year (-35 koz) to 985 koz overall.
Total Supply Balance
-125
1,850
1,975
Total Demand
Chart 1: Supply-demand balance, koz, Q1 2018
Source: SFA (Oxford)
1,41
5
-60
420
1,77
5
1,40
5
0
450
1,85
0
Chart 2: Platinum supply, koz
Refined production
Q1 2017 Q2 2017 Q3 2017 Q4 2017 Q1 2018
Producer inventory Recycling Total
Source: SFA (Oxford)
Page 5 of 20Prepared by SFA (Oxford) for World Platinum Investment Council
PLATINUM QUARTERLY Q1 2018
Supply from Russia increased by 18% year-on-year (+25 koz) to 165 koz in Q1’18 owing to the reconfiguration of downstream processing facilities that had negatively impacted on production volumes in the prior year period. Output from North America fell by 5% year-on-year (-5 koz) to 90 koz following the closure of a mine in Sudbury last year which had reached the end of its life.
Production from all other regions remained stable. There was a minor increase in producer inventory (2 koz), to give total mining supply of 1,400 koz for the quarter – up 3% (+45 koz) on Q1’17 when there was a larger (60 koz) rise in producer stocks.
Secondary supply reached 450 koz in Q1’18, an increase of 7% year-on-year, but a decline of 13% from a very strong fourth quarter. Autocatalyst recycling in the quarter saw a return to more typical levels, falling to 320 koz, following elevated catalyst collection volumes in the US and Europe in Q4’17, but grew 7% year-on-year from 300 koz. Jewellery recycling also rose compared to the same period last year, gaining 8% to 130 koz, as stronger retail performance in China led to more jewellery being traded in to purchase new items.
Demand
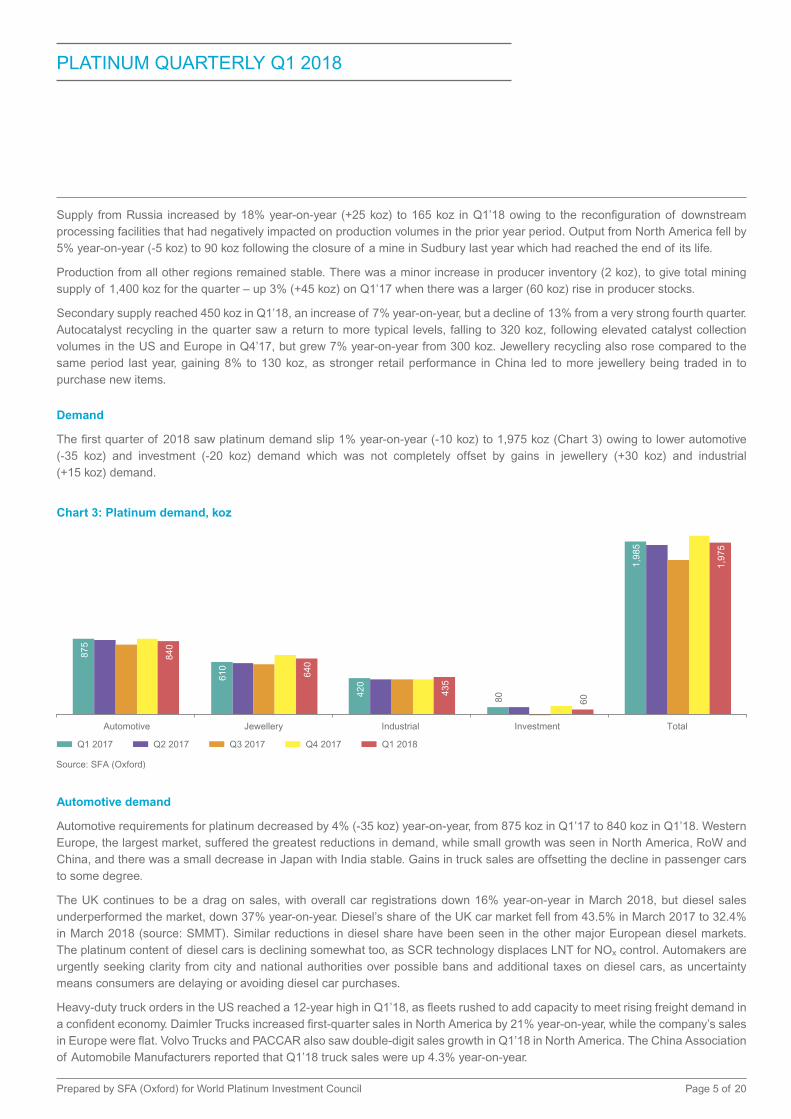
The first quarter of 2018 saw platinum demand slip 1% year-on-year (-10 koz) to 1,975 koz (Chart 3) owing to lower automotive (-35 koz) and investment (-20 koz) demand which was not completely offset by gains in jewellery (+30 koz) and industrial (+15 koz) demand.
Automotive demand
Automotive requirements for platinum decreased by 4% (-35 koz) year-on-year, from 875 koz in Q1’17 to 840 koz in Q1’18. Western Europe, the largest market, suffered the greatest reductions in demand, while small growth was seen in North America, RoW and China, and there was a small decrease in Japan with India stable. Gains in truck sales are offsetting the decline in passenger cars to some degree.
The UK continues to be a drag on sales, with overall car registrations down 16% year-on-year in March 2018, but diesel sales underperformed the market, down 37% year-on-year. Diesel’s share of the UK car market fell from 43.5% in March 2017 to 32.4% in March 2018 (source: SMMT). Similar reductions in diesel share have been seen in the other major European diesel markets. The platinum content of diesel cars is declining somewhat too, as SCR technology displaces LNT for NOx control. Automakers are urgently seeking clarity from city and national authorities over possible bans and additional taxes on diesel cars, as uncertainty means consumers are delaying or avoiding diesel car purchases.
Heavy-duty truck orders in the US reached a 12-year high in Q1’18, as fleets rushed to add capacity to meet rising freight demand in a confident economy. Daimler Trucks increased first-quarter sales in North America by 21% year-on-year, while the company’s sales in Europe were flat. Volvo Trucks and PACCAR also saw double-digit sales growth in Q1’18 in North America. The China Association of Automobile Manufacturers reported that Q1’18 truck sales were up 4.3% year-on-year.
875
610
420
80
1,98
5
840
640
435
60
1,97
5
Chart 3: Platinum demand, koz
Automotive
Q1 2017 Q2 2017 Q3 2017 Q4 2017 Q1 2018
Jewellery Industrial Investment Total
Source: SFA (Oxford)

Page 6 of 20Prepared by SFA (Oxford) for World Platinum Investment Council
PLATINUM QUARTERLY Q1 2018
Jewellery demand
First-quarter global jewellery demand is estimated at 640 koz, a rise of 3% year-on-year, with all regions seeing demand at a similar or slightly higher level than in the first quarter of last year. All the major platinum jewellery markets (China, Japan, North America and Western Europe) have maintained high levels of consumer confidence over the first three months of 2018, despite some wobbles in the stock markets.
Retail sales growth for all jewellery continued in a strong manner in Asia, as mainland China saw a 7.9% increase in Q1’18 compared to the same period in 2017, while sales in Hong Kong and Macau were up by 3.8% year-on-year in January and then accelerated in February (up 31% year-on-year), although platinum has not benefitted as much from this tailwind as gold. Platinum trade on the Shanghai Gold Exchange has risen by 2% year-on-year in Q1’18, returning to growth after a 39% decline in Q1’17. The Indian jewellery market has mostly readjusted following the introduction of the Goods and Services Tax last year as jewellers are no longer reporting significant problems or difficulties, and the slight increase in tax does not appear to have had a significant negative impact.
Industrial demand
Industrial demand for platinum increased by 4% year-on-year (+15 koz) to 435 koz in the first quarter of 2018, following growth in chemical catalysis, petroleum refining and other end-uses. New propane dehydrogenation (PDH) capacity in China lifted platinum purchases by the chemical industry in Q1’18, while greater production of fuel cells in Japan for the transport sector raised other industrial end-use requirements. Expansion of oil refining capacity also elevated net petroleum platinum demand in the RoW last quarter, outweighing a decline in this application in China, where capacity growth slowed.
Investment demand
In the first quarter of 2018 total investment demand was 60 koz (Chart 4), as robust bar and coin sales were offset by small declines in ETF holdings (-10 koz) and stocks held by exchanges (-10 koz).
Bar and coin demand was 80 koz in Q1’18. Coin sales were aided by the US Mint making both bullion and proof platinum American Eagle coins available during the first quarter. As in 2017, the Mint limited the mintage of bullion coins to 20,000 and they sold out, but doubled the mintage of proof coins to 20,000 with just under half being purchased in the first quarter. Platinum bar purchases in Japan were muted at the start of the year, but as the platinum price dropped in March investor purchases picked up.
While ETF holdings fell 10 koz, this masks divergent fortunes in different regions. US and Swiss ETFs saw net sales of 39 koz and 13 koz respectively, whereas investors in the UK and South Africa added 18 koz and 25 koz to their holdings, respectively.
Chart 4: Platinum investment
100
koz
50
-50Q1 2017 Q2 2017 Q3 2017 Q4 2017 Q1 2018
Source: SFA (Oxford)
Bars and coins ETFs Exchange stocks
0
Page 7 of 20Prepared by SFA (Oxford) for World Platinum Investment Council
PLATINUM QUARTERLY Q1 2018
2018 FORECAST
Global platinum supply is forecast to dip 1% (-105 koz) year-on-year to 7,975 koz this year as total mining supply falls 3% (-160 koz) to 6,015 koz, while recycling expands by 3% (+55 koz) to 1,960 koz. Most regions are expected to have lower refined production in 2018 with declines in South Africa (-30 koz), Zimbabwe (-25 koz), Russia (-65 koz) and Other regions (-5 koz) outweighing a projected gain of 10 koz in North America. Autocatalyst recycling continues to trend higher, although growth is expected to slow to 5% from 9% in 2017, reaching 1,405 koz, and this outweighs a 2% dip in jewellery recycling (-10 koz) to 550 koz.
Global platinum demand is projected to be marginally higher in 2018 than last year at 7,795 koz, as gains in industrial (+95 koz) and jewellery (+50 koz) demand offset declines in automotive (-105 koz) and investment (-10 koz) demand. Industrial demand is anticipated to recover by 6% year-on-year to 1,750 koz, as refinery closures which held back net petroleum demand in 2017 are not repeated and chemical, glass and other end-uses also see gains. Jewellery demand is forecast to increase 2% to 2,510 koz this year as continued growth is expected in North America, Europe and India, and Chinese demand is projected to stabilise. Automotive demand continues to slip, falling 3% to 3,285 koz, as growth in commercial vehicles is insufficient to offset lower demand from passenger cars.
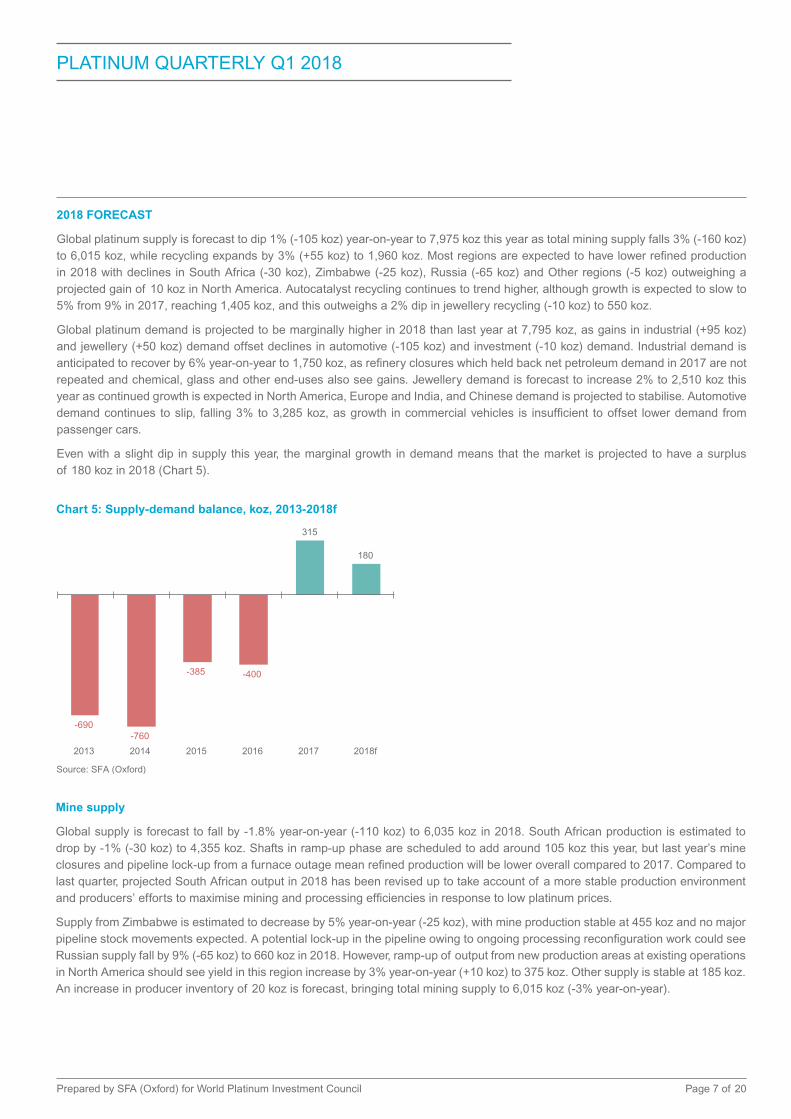
Even with a slight dip in supply this year, the marginal growth in demand means that the market is projected to have a surplus of 180 koz in 2018 (Chart 5).
Mine supply
Global supply is forecast to fall by -1.8% year-on-year (-110 koz) to 6,035 koz in 2018. South African production is estimated to drop by -1% (-30 koz) to 4,355 koz. Shafts in ramp-up phase are scheduled to add around 105 koz this year, but last year’s mine closures and pipeline lock-up from a furnace outage mean refined production will be lower overall compared to 2017. Compared to last quarter, projected South African output in 2018 has been revised up to take account of a more stable production environment and producers’ efforts to maximise mining and processing efficiencies in response to low platinum prices.
Supply from Zimbabwe is estimated to decrease by 5% year-on-year (-25 koz), with mine production stable at 455 koz and no major pipeline stock movements expected. A potential lock-up in the pipeline owing to ongoing processing reconfiguration work could see Russian supply fall by 9% (-65 koz) to 660 koz in 2018. However, ramp-up of output from new production areas at existing operations in North America should see yield in this region increase by 3% year-on-year (+10 koz) to 375 koz. Other supply is stable at 185 koz. An increase in producer inventory of 20 koz is forecast, bringing total mining supply to 6,015 koz (-3% year-on-year).
-690 -760
-385 -400
315
180
2013 2014 2015 2016 2017 2018f
Chart 5: Supply-demand balance, koz, 2013-2018f
Source: SFA (Oxford)

Page 8 of 20Prepared by SFA (Oxford) for World Platinum Investment Council
PLATINUM QUARTERLY Q1 2018
Recycling
Total platinum recycling from all sources is expected to supply 1,960 koz of metal to the market in 2018, a 3% increase over 2017 recycling.
Autocatalyst recycling is forecast to gain 5% year-on-year to 1,405 koz. Robust scrap steel and palladium prices should promote additional recycling of end-of-life vehicles and collection of autocatalysts, which has a positive knock-on effect for platinum recycling. The two main regions for recycling, North America and Western Europe, are both expected to continue the trend of increasing secondary platinum supply that was witnessed in 2017, although at a lower rate.
Secondary supply from jewellery is estimated to decline marginally by 2% in 2018 to 550 koz, as Japanese recycling is set to retrace the growth it saw last year. Platinum jewellery recycling from China is likely to stay flat year-on-year, in line with the trends that it is seeing in jewellery demand.
Automotive demand
Continued weakness in light-duty diesel sales is expected to drag automotive platinum demand down by 3% (-105 koz), from 3,390 koz in 2017 to 3,285 koz in 2018.
Western Europe, though still around 40% of the market and more than twice the size of any other regional market, is predicted to see the greatest reduction in demand for the year, while North America, India and RoW are likely to see modest growth and Japan and China are set to see small reductions.
Public uncertainty over the risk and timing of possible diesel bans in some cities continues to dent sales of diesel cars in Europe. Diesel car sales in the US, by contrast, are expected to be strong, and while vehicle numbers are much smaller than the European market, the impact on platinum demand from autocatalysts is higher as US diesel cars tend to be much larger than their European counterparts.
Automakers are increasingly recognising that with a declining diesel share in their light vehicle portfolios, they may struggle to meet the 95 g/km by 2020 CO2 targets and face hefty fines. The European Environment Agency recently released data for 2017, showing that average CO2 emissions from new cars increased by 0.4% year-on-year to 118.5 g/km. The European Automobile Manufacturers’ Association showed that diesel’s share of car sales fell from 49.9% to 44.8% in 2017. While parallel increases in vehicle mass may complicate the analysis, many in the industry are connecting rising CO2 emissions with falling diesel share.
8,080 7,975
-30 -25
+10
-65 -5 -50
+55
8,500
8,000
7,500
7,000
6,5002017 South
AfricaZimbabwe North
AmericaRussia Other Change in
producerinventory
Recycling 2018f
koz
Chart 6: Changes in total supply, 2018f vs. 2017
Source: SFA (Oxford)

Page 9 of 20Prepared by SFA (Oxford) for World Platinum Investment Council
PLATINUM QUARTERLY Q1 2018
Heavy-duty truck demand in most regions is estimated to be positive for platinum demand, both as vehicle numbers rise and as the platinum content of each vehicle grows, particularly with the greater use of DOCs on Chinese trucks required to comply with emissions legislation. In India, considerable fleet renewal is already being seen, and is likely to continue over the next two years, as environmentally conscious corporate clients in some sectors increasingly expect their goods to be transported in vehicles no more than five years old and there is far greater focus on hourly efficiency of haulage operations.
In the US, heavy-duty truck sales are expected to outpace the medium-duty segment in 2018. Increasing activity in the oil industry, construction and consumer products is contributing to the need for additional freight capacity in the US, while growing activity in mining and agriculture in some parts of Asia is driving demand for further commercial vehicles in these markets.
Jewellery demand
The 2018 forecast for annual platinum jewellery demand is 2,510 koz, a 2% (+50 koz) increase on 2017, as growth is expected in all regions except Japan. Chinese demand is predicted to climb slightly over the course of 2018 as improvements in consumer sentiment feed into jewellery retail sales, although most of the sales growth is being seen coming from sales of gold jewellery and consequently the expectations of growth in platinum demand in the region are still small. Expansion in third and fourth tier cities and campaigns aimed at boosting the engagement of millennials in the jewellery market should offset potential declines in the bridal sector. Reasonable economic growth forecasts in the US and Europe are supporting the expansion in these markets, strengthened by the currently high platinum price discount to gold. The Indian market saw good growth in sales during the Akshaya Tritiya festival, viewed as an auspicious day for jewellery purchases. Indian demand is expected to continue its strong performance from the first few months of the year as larger retailers with multiple stores gain market share from the independent sector. Jewellery demand from Japan is anticipated to be little changed this year, as the low rate of economic growth is not likely to be sufficient to bolster the market.
Industrial demand
A rebound in net petroleum requirements (+60 koz) is expected to help increase industrial platinum demand by 6% (+95 koz) to 1,750 koz this year, as usage in petroleum refining recovers in Japan and rises in the RoW. Growth in glass fabrication (+15 koz), chemical catalysis (+5 koz) and other end-uses (+25 koz) is also anticipated to lift platinum requirements in 2018, far exceeding a drop in electrical demand (-10 koz), whilst medical usage remains flat.
7,765 7,795
-105
+50 +5 +60
-10
+15 +0 +25
-10
8,500
8,000
7,500
7,000
6,5002017 Automotive Jewellery Chemical Petroleum Electrical Glass Medical and
BiomedicalOther Investment 2018f
koz
Chart 7: Changes in demand by category, 2018f vs. 2017
Source: SFA (Oxford)
Industrial demand

Page 10 of 20Prepared by SFA (Oxford) for World Platinum Investment Council
PLATINUM QUARTERLY Q1 2018
Chemical
Chemical requirements are forecast to climb by 1% year-on-year to 590 koz in 2018, predominantly supported by growth in China, which should outweigh a decline in the RoW. Rising production of platinum-cured silicone products and greater expansion of PDH capacity are set to lift China’s platinum usage this year. However, despite higher silicone production, slower expansion of both paraxylene and nitric acid capacity is expected to lower platinum demand throughout the RoW in 2018, partially offsetting growth in China.
Petroleum
Net petroleum demand is predicted to recover by 60 koz to 160 koz this year, boosted by a rebound in Japan plus growth in the RoW. Japan’s platinum requirements are expected to recover back to net positive levels in 2018, as fewer refining capacity cuts are anticipated in the country compared to last year. Expansion of petroleum refining capacity in several emerging economies is set to increase new metal demand across the RoW, although the rate of capacity growth is estimated to ease in China and North America, lowering requirements in these regions and hindering overall demand growth this year.
Electrical
Declining hard disk drive (HDD) demand is set to reduce platinum usage in electrical applications by 6% to 150 koz in 2018, with global HDD shipments forecast to fall by 10% year-on-year to 364 million units. The PC market is predicted to account for the majority (80%) of the decrease in HDD deliveries this year, shrinking by 17%, owing to weak PC sales and further substitution to solid-state drives (SSDs). Lower HDD demand is likely to reduce platinum requirements, primarily in China where usage in other electrical components is also anticipated to ease, following a strong 2017.
Glass
Platinum requirements for glass fabrication are projected to rise by 8% to 195 koz this year, despite a decline in China, where government restrictions combating domestic overcapacity may inhibit capacity growth. However, demand is forecast to increase in all other regions, particularly Western Europe, where the upcoming expansion of glass fibre facilities is likely to boost platinum purchases this year. In Japan, a lack of closures in 2017/18 should lift domestic demand with ongoing production requirements exceeding recycle supply from closures, while new plants and expansions in Latin America and Asia are also expected to raise requirements in the RoW.
2018fDemand7,795 koz
Chart 8: Demand end-use shares, 2018f vs. 2017
Jewellery32%
Source: SFA (Oxford)
Automotive42%
Medical andBiomedical 3%
Glass 3%
Electrical 2%
Petroleum 2%
Chemical 8%
Other5%
Investment3%
Industrial23%
2017Demand7,765 koz
Jewellery32%
Automotive44%
Medical andBiomedical 3%
Glass 2%
Electrical 2%Petroleum 1%
Chemical 8%
Other5%
Investment3%
Industrial21%

Page 11 of 20Prepared by SFA (Oxford) for World Platinum Investment Council
PLATINUM QUARTERLY Q1 2018
Other
Rising demand for fuel cells is forecast to boost platinum consumption in other industrial end-uses by 6% to 415 koz in 2018, while requirements for automotive sensors, mainly in China and the RoW, are also anticipated to increase as vehicle production expands in these regions. Growing fuel cell adoption in various transport and stationary applications is set to raise platinum consumption in key markets, including Japan and the US, as fuel cells are increasingly used in trains, buses and non-road vehicles such as forklift trucks.
Investment demand
This year platinum investment is forecast to be 250 koz, with ETFs predicted to have another positive year. As the local platinum price is projected to rise somewhat this year and the yen is forecast to weaken, Japanese investors’ bar purchases are estimated to be lower than last year, while global coin sales are anticipated to be similar to those in 2017.
ABOVE GROUND STOCKS
With the market forecast to have a surplus of 180 koz, above ground stocks are projected to end the year at 2,400 koz.
The WPIC definition of above ground stocks is: the year-end estimate of the cumulative platinum holdings not associated with exchange-traded funds, metal held by exchanges or working inventories of mining producers, refiners, fabricators or end-users.

Page 12 of 20Prepared by SFA (Oxford) for World Platinum Investment Council
PLATINUM QUARTERLY Q1 2018
Table 2: Supply, demand and above ground stocks summary – annual comparison
2013 2014 2015 2016 2017 2018f 2017/2016 Growth %
2018f/2017 Growth %
Platinum Supply-demand Balance (koz)
SUPPLY
Refined Production 6,070 4,880 6,150 6,035 6,145 6,035 2% -2%
South Africa 4,355 3,115 4,465 4,255 4,385 4,355 3% -1%
Zimbabwe 405 405 405 490 480 455 -2% -5%
North America 355 400 385 395 365 375 -8% 3%
Russia 740 740 715 715 725 660 1% -9%
Other 215 220 180 180 190 185 6% -3%
Increase (-)/Decrease (+) in Producer Inventory -215 +350 +45 +30 +30 -20 0% N/M
Total Mining Supply 5,855 5,230 6,195 6,065 6,175 6,015 2% -3%
Recycling 1,980 2,035 1,710 1,855 1,905 1,960 3% 3%
Autocatalyst 1,120 1,255 1,190 1,225 1,340 1,405 9% 5%
Jewellery 855 775 515 625 560 550 -10% -2%
Industrial 5 5 5 5 5 5 0% 0%
Total Supply 7,835 7,265 7,905 7,920 8,080 7,975 2% -1%
DEMAND
Automotive 3,170 3,310 3,395 3,490 3,390 3,285 -3% -3%
Autocatalyst 3,030 3,165 3,255 3,350 3,245 3,140 -3% -3%
Non-road 140 150 140 135 140 145 4% 4%
Jewellery 2,945 3,000 2,840 2,505 2,460 2,510 -2% 2%
Industrial 1,475 1,565 1,750 1,790 1,655 1,750 -8% 6%
Chemical 535 555 605 595 585 590 -2% 1%
Petroleum 50 65 205 215 100 160 -53% 60%
Electrical 185 190 165 160 160 150 0% -6%
Glass 145 175 200 205 180 195 -12% 8%
Medical and Biomedical 220 220 230 235 240 240 2% 0%
Other 340 360 345 380 390 415 3% 6%
Investment 935 150 305 535 260 250 -51% -4%
Change in Bars, Coins -5 50 525 460 210
Change in ETF Holdings 905 215 -240 -10 95
Change in Stocks Held by Exchanges 35 -115 20 85 -45
Total Demand 8,525 8,025 8,290 8,320 7,765 7,795 -7% 0%
Balance -690 -760 -385 -400 315 180 N/M -43%
Above Ground Stocks 4,140* 3,450 2,690 2,305 1,905 2,220 2,400 17% 8%
Source: SFA (Oxford). *As of 31st December 2012. NB: Numbers have been independently rounded. N/M means not meaningful.

Page 13 of 20Prepared by SFA (Oxford) for World Platinum Investment Council
PLATINUM QUARTERLY Q1 2018
Table 3: Supply and demand summary – quarterly comparison
Q2 2016 Q3 2016 Q4 2016 Q1 2017 Q2 2017 Q3 2017 Q4 2017 Q1 2018 Q1’18/Q1’17 Growth %
Q1’18/Q4’17 Growth %
Platinum Supply-demand Balance (koz)
SUPPLY
Refined Production 1,650 1,620 1,490 1,415 1,550 1,585 1,595 1,405 -1% -12%
South Africa 1,200 1,180 1,065 1,020 1,090 1,155 1,120 985 -3% -12%
Zimbabwe 120 120 120 115 125 100 140 115 0% -18%
North America 105 100 85 95 85 95 95 90 -5% -5%
Russia 180 175 170 140 205 185 195 165 18% -15%
Other 45 45 50 45 50 50 45 45 0% 0%
Increase (-)/Decrease (+) in Producer Inventory +60 -105 -75 -60 +75 -10 +25 N/M N/M
Total Mining Supply 1,710 1,515 1,415 1,355 1,625 1,575 1,620 1,400 3% -14%
Recycling 480 510 470 420 480 480 520 450 7% -13%
Autocatalyst 340 315 290 300 330 330 380 320 7% -16%
Jewellery 140 195 180 120 150 150 140 130 8% -7%
Industrial 0 0 0 0 0 0 0 0 N/M N/M
Total Supply 2,190 2,025 1,885 1,775 2,105 2,055 2,140 1,850 4% -14%
DEMAND
Automotive 910 800 885 875 855 800 865 840 -4% -3%
Autocatalyst 875 770 850 835 815 765 825 805 -4% -2%
Non-road 35 30 35 35 35 35 35 35 0% 0%
Jewellery 600 630 700 610 590 580 680 640 5% -6%
Industrial 480 465 410 420 410 410 410 435 4% 6%
Chemical 140 170 130 150 135 160 135 155 3% 15%
Petroleum 60 55 55 35 15 25 25 40 14% 60%
Electrical 40 40 40 40 40 40 45 40 0% -11%
Glass 80 60 5 45 55 50 25 45 0% 80%
Medical and Biomedical 70 45 75 55 70 45 75 55 0% -27%
Other 90 95 105 95 95 90 105 100 5% -5%
Investment 95 50 225 80 90 -10 95 60 -25% -37%
Change in Bars, Coins 115 80 115 30 70 45 65 80 167% 23%
Change in ETF Holdings -15 -85 115 60 20 -40 50 -10 N/M N/M
Change in Stocks Held by Exchanges -5 55 -5 -10 0 -15 -20 -10 0% -50%
Total Demand 2,085 1,945 2,220 1,985 1,945 1,780 2,050 1,975 -1% -4%
Balance 105 80 -335 -210 160 275 90 -125
Source: SFA (Oxford). NB: Numbers have been independently rounded. N/M means not meaningful.

Page 14 of 20Prepared by SFA (Oxford) for World Platinum Investment Council
PLATINUM QUARTERLY Q1 2018
Table 4: Supply and demand summary – half-yearly comparison
H1 2016 H2 2016 H1 2017 H2 2017 H2’17/H2’16 Growth %
H2’17/H1’17 Growth %
Platinum Supply-demand Balance (koz)
SUPPLY
Refined Production 2,925 3,110 2,965 3,180 2% 7%
South Africa 2,010 2,245 2,110 2,275 1% 8%
Zimbabwe 250 240 240 240 0% 0%
North America 205 185 180 190 3% 6%
Russia 370 345 345 380 10% 10%
Other 90 95 95 95 0% 0%
Increase (-)/Decrease (+) in Producer Inventory +210 -180 +15 +15 N/M 0%
Total Mining Supply 3,135 2,930 2,980 3,195 9% 7%
Recycling 875 980 900 1,000 2% 11%
Autocatalyst 620 605 630 710 17% 13%
Jewellery 255 375 270 290 -23% 7%
Industrial 0 0 0 0 N/M N/M
Total Supply 4,010 3,910 3,880 4,195 7% 8%
DEMAND
Automotive 1,800 1,685 1,730 1,665 -1% -4%
Autocatalyst 1,730 1,620 1,650 1,590 -2% -4%
Non-road 70 65 70 70 8% 0%
Jewellery 1,180 1,330 1,200 1,260 -5% 5%
Industrial 925 875 830 820 -6% -1%
Chemical 290 300 285 295 -2% 4%
Petroleum 115 110 50 50 -55% 0%
Electrical 80 80 80 85 6% 6%
Glass 140 65 100 75 15% -25%
Medical and Biomedical 120 120 125 120 0% -4%
Other 180 200 190 195 -3% 3%
Investment 260 275 170 85 -69% -50%
Change in Bars, Coins 265 195 100 110 -44% 10%
Change in ETF Holdings -40 30 80 10 -67% -88%
Change in Stocks Held by Exchanges 35 50 -10 -35 N/M N/M
Total Demand 4,165 4,165 3,930 3,830 -8% -3%
Balance -155 -255 -50 365
Source: SFA (Oxford). NB: Numbers have been independently rounded. N/M means not meaningful.
Page 15 of 20Prepared by SFA (Oxford) for World Platinum Investment Council
PLATINUM QUARTERLY Q1 2018
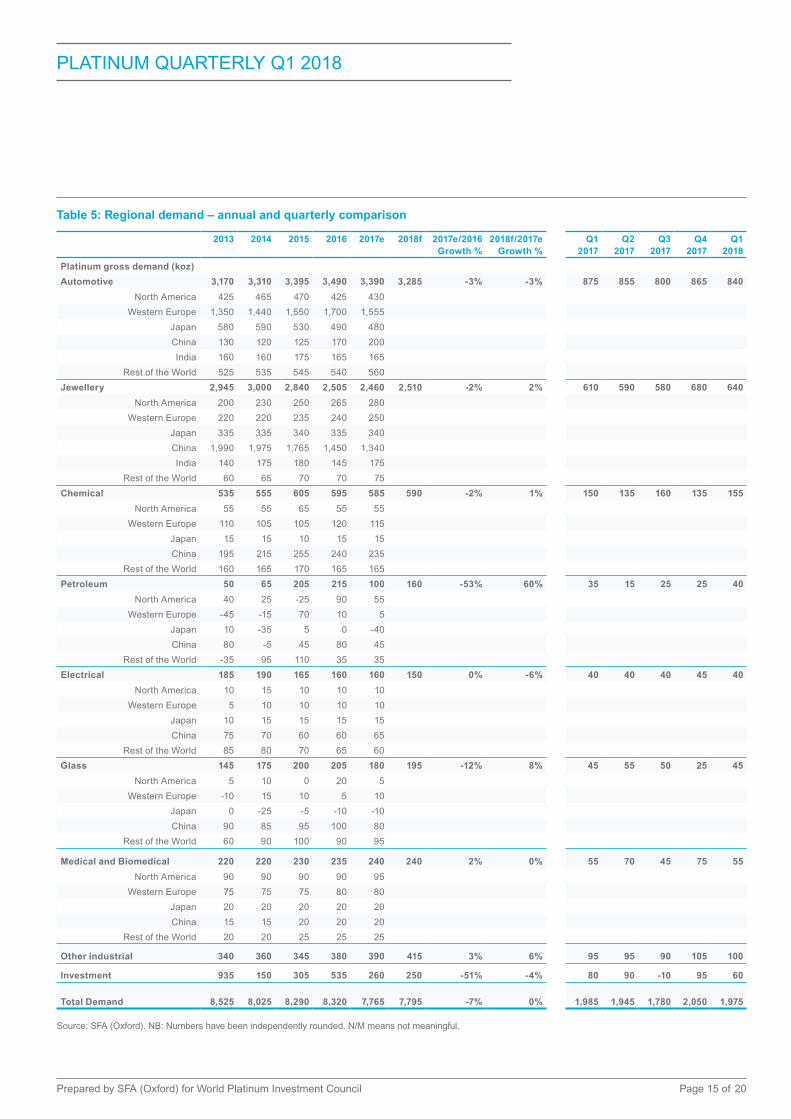
Table 5: Regional demand – annual and quarterly comparison
2013 2014 2015 2016 2017e 2018f 2017e/2016 Growth %
2018f/2017e Growth %
Q1 2017
Q2 2017
Q3 2017
Q4 2017
Q1 2018
Platinum gross demand (koz)
Automotive 3,170 3,310 3,395 3,490 3,390 3,285 -3% -3% 875 855 800 865 840
North America 425 465 470 425 430
Western Europe 1,350 1,440 1,550 1,700 1,555
Japan 580 590 530 490 480
China 130 120 125 170 200
India 160 160 175 165 165
Rest of the World 525 535 545 540 560
Jewellery 2,945 3,000 2,840 2,505 2,460 2,510 -2% 2% 610 590 580 680 640
North America 200 230 250 265 280
Western Europe 220 220 235 240 250
Japan 335 335 340 335 340
China 1,990 1,975 1,765 1,450 1,340
India 140 175 180 145 175
Rest of the World 60 65 70 70 75
Chemical 535 555 605 595 585 590 -2% 1% 150 135 160 135 155
North America 55 55 65 55 55
Western Europe 110 105 105 120 115
Japan 15 15 10 15 15
China 195 215 255 240 235
Rest of the World 160 165 170 165 165
Petroleum 50 65 205 215 100 160 -53% 60% 35 15 25 25 40
North America 40 25 -25 90 55
Western Europe -45 -15 70 10 5
Japan 10 -35 5 0 -40
China 80 -5 45 80 45
Rest of the World -35 95 110 35 35
Electrical 185 190 165 160 160 150 0% -6% 40 40 40 45 40
North America 10 15 10 10 10
Western Europe 5 10 10 10 10
Japan 10 15 15 15 15
China 75 70 60 60 65
Rest of the World 85 80 70 65 60
Glass 145 175 200 205 180 195 -12% 8% 45 55 50 25 45
North America 5 10 0 20 5
Western Europe -10 15 10 5 10
Japan 0 -25 -5 -10 -10
China 90 85 95 100 80
Rest of the World 60 90 100 90 95
Medical and Biomedical 220 220 230 235 240 240 2% 0% 55 70 45 75 55
North America 90 90 90 90 95
Western Europe 75 75 75 80 80
Japan 20 20 20 20 20
China 15 15 20 20 20
Rest of the World 20 20 25 25 25
Other industrial 340 360 345 380 390 415 3% 6% 95 95 90 105 100
Investment 935 150 305 535 260 250 -51% -4% 80 90 -10 95 60
Total Demand 8,525 8,025 8,290 8,320 7,765 7,795 -7% 0% 1,985 1,945 1,780 2,050 1,975
Source: SFA (Oxford). NB: Numbers have been independently rounded. N/M means not meaningful.
Page 16 of 20Prepared by SFA (Oxford) for World Platinum Investment Council
PLATINUM QUARTERLY Q1 2018
GLOSSARY OF TERMS
Above ground stocks
The year-end estimate of the cumulative platinum holdings not associated with: exchange-traded funds, metal held by exchanges or working inventories of: mining producers, refiners, fabricators or end-users. Typically, unpublished vaulted metal holdings from which a supply-demand shortfall can be readily supplied or to which a supply-demand surplus can readily flow.
BDH
Butane dehydrogenation; catalytic conversion of isobutane to isobutylene.
Bharat Stage III/IV standards (BS-III, BS-IV)
Bharat Stage III is equivalent to Euro 3 emissions legislation. Introduced in 2005 in 12 major cities across India and enforced nationwide from April 2010. Bharat Stage IV is equivalent to Euro 4 emissions legislation. Introduced in 2010 in 14 major cities across India and set to be enforced nationwide from April 2017.
Bharat Stage V/VI standards (BS-V, BS-VI)
Early in 2016 the Indian government announced the intention to ‘leapfrog’ Bharat Stage V and move directly to Bharat Stage VI, equivalent to Euro 6, in 2020.
Conformity factor (CF)
The EU is to allow automakers to exceed current Euro 6 NOx limits, giving time to adapt to new real-world driving emissions rules. From September 2017 for new models and from September 2019 for new vehicles, a CF of up to 2.1 (110%) will be allowed over the 80 mg/km NOx limit. This CF will be phased out at the latest in 2021, then from January 2020 (new models) and January 2021 (new vehicles) a lower CF of 1.5 will be allowed, reflecting statistical and technical uncertainty of the tests.
Diesel oxidation catalyst (DOC)
A DOC oxidises harmful carbon monoxide and unburnt hydrocarbons, produced by incomplete combustion of diesel fuel, to harmless carbon dioxide and water.
Diesel particulate filter (DPF) and catalysed diesel particulate filter (CDPF)
A DPF physically filters particulates (soot) from diesel exhaust. A CDPF adds a PGM catalyst coating to facilitate oxidation and removal of the soot. The terms are often used interchangeably.
Emissions legislation
Tailpipe regulations covering emissions of particulate matter, hydrocarbons and oxides of nitrogen.
ETF
Exchange-traded fund. A security that tracks an index, commodity or basket of assets. Platinum ETFs included in demand are backed by physical metal.
Euro V/VI emission standards
EU emission standards for heavy-duty vehicles. Euro V legislation was introduced in 2009 and Euro VI in 2013/2014; will be widely adopted later in other regions.
Euro 5/6 emission standards
EU emission standards for light-duty vehicles. Euro 5 legislation was introduced in 2009 and Euro 6 in 2014/2015; will be widely adopted later in other regions.
Form factor
The size of a hard disk drive (e.g. 2.5-inch or 3.5-inch) which varies depending on the device the drive is used in.
GTL
Gas-to-liquids is a refinery process that converts natural gas to liquid hydrocarbons such as gasoline or diesel fuel.
HDD
Hard disk drive.
HDV
Heavy-duty vehicle.
koz
Thousand ounces.
LCD
Liquid-crystal display used for video display.
LCV
Light commercial vehicle.
Lean NOx traps (LNT)
Rhodium-based, catalyses the chemical reduction of NOx in diesel engine exhaust to harmless nitrogen.
Metal-in-concentrate
PGMs contained in the concentrate produced after the crushing, milling and froth flotation processes in the concentrator. It is a measure of a mine’s output before the smelting and refining stages.

Page 17 of 20Prepared by SFA (Oxford) for World Platinum Investment Council
PLATINUM QUARTERLY Q1 2018
moz
Million ounces.
Net demand
A measure of the theoretical requirement for new metal, i.e. net of recycling.
Non-road engines
Non-road engines are diesel engines used, for example, in construction, agricultural and mining equipment, using engine and emissions technology similar to on-road heavy-duty diesel vehicles.
NOx storage catalyst (NSC)
Used in light duty diesel aftertreatment to convert harmful oxides of nitrogen to harmless nitrogen and carbon dioxide. The PGM content is mainly platinum, with some rhodium. NSCs may be used in conjunction with SCR technology to minimise NOx emissions.
OECD
Organisation for Economic Co-operation and Development, consisting of 34 developed countries.
oz
A unit of weight commonly used for precious metals. 1 troy ounce = 1.1 ounces.
Paraxylene
A chemical produced from petroleum naphtha extracted from crude oil using a platinum catalyst. This is used in the production of terephthalic acid which is used to manufacture polyester.
PDH
Propane dehydrogenation, where propane is converted to propylene.
PGMs
Platinum-group metals.
Producer inventory
As used in the supply-demand balance, the change in producer inventory is the difference between reported refined production and metal sales.
RDE
Real Driving Emissions - the term used by the EU to define the testing protocol that will measure pollutants emitted from cars, including NOx, while driven on the road. It is in addition to laboratory tests. RDE testing will be implemented in
September 2017 for new types of cars and will apply to all registrations from September 2019.
Refined production
Processed platinum output from refineries.
Secondary supply
Recycling output.
Selective catalytic reduction (SCR)
PGM-free, converts harmful NOx in diesel exhaust to harmless nitrogen, via a tank of urea solution. Used in heavy-duty diesel vehicles, increasingly competes with LNT in light-duty diesel vehicles. Contained within an aftertreatment system which normally requires a platinum-containing oxidation catalyst ahead of the SCR unit.
SGE
Shanghai Gold Exchange.
SSD
Solid-state drive.
Stage 4 regulations
European emission standards implemented in 2014 for non-road diesel engines.
Three-way catalyst
Used in gasoline cars to remove hydrocarbons, carbon monoxide and NOx. Largely palladium-based now, some rhodium.
Tier 4 stage
Emissions standards phased in between 2008 and 2015 in the US for non-road vehicles.
WLTP
Worldwide Harmonized Light Vehicles Test Procedure is a laboratory test to measure pollutant emissions and fuel consumption. WLTP replaces the New European Drive Cycle (NEDC).
WPIC
The World Platinum Investment Council.
Ounce conversion
1 million ounces = 31.1 tonnes.

Page 18 of 20Prepared by SFA (Oxford) for World Platinum Investment Council
PLATINUM QUARTERLY Q1 2018
IMPORTANT NOTICE AND DISCLAIMER: This publication is general and solely for educational purposes. The publisher, The World Platinum Investment Council, has been formed by the world’s leading platinum producers to develop the market for platinum investment demand. Its mission is to stimulate investor demand for physical platinum through both actionable insights and targeted development, providing investors with the information to support informed decisions regarding platinum and working with financial institutions and market participants to develop products and channels that investors need. No part of this report may be reproduced or distributed in any manner without attribution to the authors. The research and commentary attributed to SFA in the publication is © SFA Copyright reserved. All copyright and other intellectual property rights in the data and commentary contained in this report remain the property of SFA, one of our third party content providers, and no person other than SFA shall be entitled to register any intellectual property rights in the information, or data herein. The analysis, data and other information attributed to SFA reflect SFA’s judgment as of the date of the document and are subject to change without notice. No part of the data or commentary shall be used for the specific purpose of accessing capital markets (fundraising) without the written permission of SFA.
This publication is not, and should not be construed to be, an offer to sell or a solicitation of an offer to buy any security. With this publication, neither the publisher nor SFA intend to transmit any order for, arrange for, advise on, act as agent in relation to, or otherwise facilitate any transaction involving securities or commodities regardless of whether such are otherwise referenced in it. This publication is not intended to provide tax, legal, or investment advice and nothing in it should be construed as a recommendation to buy, sell, or hold any investment or security or to engage in any investment strategy or transaction. Neither the publisher nor SFA is, or purports to be, a broker-dealer, a registered investment advisor, or otherwise registered under the laws of the United States or the United Kingdom, including under the Financial Services and Markets Act 2000 or Senior Managers and Certifications Regime or by the Financial Conduct Authority.
This publication is not, and should not be construed to be, personalized investment advice directed to or appropriate for any particular investor. Any investment should be made only after consulting a professional investment advisor. You are solely responsible for determining whether any investment, investment strategy, security or related transaction is appropriate for you based on your investment objectives, financial circumstances and risk tolerance. You should consult your business, legal, tax or accounting advisors regarding your specific business, legal or tax situation or circumstances.
The information on which this publication is based is believed to be reliable. Nevertheless, neither the publisher nor SFA can guarantee the accuracy or completeness of the information. This publication contains forward-looking statements, including statements regarding expected continual growth of the industry. The publisher and SFA note that statements contained in the publication that look forward in time, which include everything other than historical information, involve risks and uncertainties that may affect actual results and neither the publisher nor SFA accepts any liability whatsoever for any loss or damage suffered by any person in reliance on the information in the publication.
The logos, services marks and trademarks of the World Platinum Investment Council are owned exclusively by it. All other trademarks used in this publication are the property of their respective trademark holders. The publisher is not affiliated, connected, or associated with, and is not sponsored, approved, or originated by, the trademark holders unless otherwise stated. No claim is made by the publisher to any rights in any third-party trademarks.
WPIC Research MiFID II Status
The World Platinum Investment Council (WPIC) has undertaken an internal and external review of its content and services for MiFID II. As a result WPIC highlights the following to the recipients of its research services, and their Compliance/Legal departments:
WPIC research content falls clearly within the Minor Non-Monetary Benefit Category, and can continue to be consumed by all asset managers free of charge. WPIC research can be freely shared across investment organisations.
WPIC does not conduct any financial instrument execution business. WPIC does not have any market making, sales trading, trading or share dealing activity. (No possible inducement).
WPIC content is disseminated widely and made available to all interested parties through a range of different channels, therefore qualifying as a “Minor Non-Monetary Benefit” under MiFID II (ESMA/FCA/AMF). WPIC research is made freely available through the WPIC website. WPIC does not have any permissioning requirements on research aggregation platforms.
WPIC does not, and will not seek, any payment from consumers of our research services. WPIC makes it clear to institutional investors that it does not seek payment from them for our freely available content.
More detailed information is available on the WPIC website: http://www.platinuminvestment.com/investment-research/mifid-ii