wp2 establishing retail ds as a new medium...
TRANSCRIPT

Bringing Research to Retail SM
This document is not to be reproduced or published, in any form or by any means, without the express written permission of Platt Retail Institute. This material is p r o t e c t e d b y c o p y r i g h t pursuant to Title 17 of the U.S. Code.
Platt Retail Institute
Working Paper
See the entire PRI Resource Library at www.plattretailinstitute.org/library.
Copyright ⓒ Platt Retail Institute LLC, 2005, 2012, 2014. All rights reserved.
Establishing Retail Digital Signage as a New Medium and Measuring Its Effectiveness
CONTENTSIntroductionDiscussion
A. OverviewB. Antecedent Considerations: i. Fragmentation of Mass Media ii. Impact Upon Consumer Buying BehaviorC. Retail Digital Signage as a New Marketing Medium
i. Elimination of the Time-Lag between Consumer Message Exposure and the Place of Purchase
ii. Direct Correlation between Message and Sales Impact iii. Enhancing the In-Store Marketing Environment D. Retail Digital Signage Testing MethodologiesE. Testing Model Applied to a Convenience Store Chain and Results Achieved from the Digital Signage DeploymentF. Testing Model Applied to a Grocery Store Chain and Results Achieved
from the Digital Signage DeploymentConclusions
The authors appreciate the comments received from Professor Barton Weitz, University of Florida, and Professor Edward J. Fox, Southern Methodist University.
www.plattretailinstitute.org
By Steven Keith Platt, Director and Research Fellow, Platt Retail Institute, Francis J. Mulhern, Associate Dean, Department of Integrated Marketing Communications, Northwestern University, and Guy Vaughan, Director, Retail Marketing Services and Director, POPAI UK/Ireland and Head of Research.
About PRI
Platt Retail Institute (PRI) is an international consulting and research firm that focuses on the use of technology to i m p a c t t h e c u s t o m e r exper ience. In an omni-channel environment, PRI works with its clients to develop marketing strategies t h a t b u i l d b r a n d s b y integrating various customer-facing technologies.

About PRI PRI’s mission is to initiate and secure the funding of studies on specific retail business issues. PRI functions as a conduit, bringing together retail executives with leading researchers. The genesis of the Retail Institute is the recognition of the wealth of knowledge being produced at the University level, on the one hand, and the need for more advanced yet practical business research and insight at the retail level, on the other. It is, therefore, the Retail Institute’s main objective to serve as a knowledge bridge between the University and retail industry and its related vendors. It will achieve this objective through the commercialization of the resources of its Research Fellows and University relationships.
2
PRI OfficesU.S. Office: P.O. Box 158Hinsdale, IL 60522 U.S.A.Phone: 312.265.6106 [email protected] German Office: Rather Kirchplatz 1140472 DusseldorfGermanyPhone: [49] 211 [email protected]
Spanish Office:Ctra de Mig, 75 08907 L'Hospitalet de Llobregat Barcelona, Spain Phone: [34] 981847755 [email protected]

Sponsors
The Platt Retail Institute thanks the following firms, whose generous financial support enables our Institute to undertake its research and educational activities.
By fus ing bet ter th ink ing wi th smar ter s t ra tegy, DMX Music (www.dmxmusic.com) brings some of the world’s largest brands to life every day by integrating visual imaging, music and message marketing with audio/video systems and unparalleled customer care. DMX Music gets consumers to think about a company’s brand and inspires them to take action at the site level. The company’s solutions are engineered to deliver powerful, on-target entertainment services that extend a brand’s impact. Everything from in-store music, digital signage and systems design to custom compilation CDs and promotions, DMX Music is a single solution for managed account service. It’s all part of one integrated media strategy designed to connect retailers with customers and maximize their marketing efforts.
ActiveLight, Inc. (www.activelight.com) is a national distributor of digital screens and projectors, including large-format plasma and LCD displays, professional projection equipment, and complete interactive signage solutions. The company represents all major manufacturers and supports more than 3,000 commercial and residential resellers and systems integrators. The company is an authorized distributor for more than 50 display products from manufacturers such as Sony, Panasonic, Pioneer, InFocus, Barco, Samsung, NEC Technologies, Sharp and others. ActiveLight leads the industry by offering value-added support solutions such as dedicated service and order status toll-free numbers, free extended-term warehousing, nationwide access to a network of affiliate warehouses, installation and repair services, and expedited product swap.
Convergent Media Systems (www.convergent.com), founded in Atlanta in 1980, is the leading provider of high-impact video and media-rich communications for digital signage, e-learning and corporate communications enterprise applications. Convergent provides services for over 70 digital media networks and more than 400,000 viewing locations, including design and development of custom content and courseware, digital asset and learning
3

management, broadcast-quality studio and production services, network engineering, and installation and ongoing operations. Clients include AT&T Wireless, Advance Auto Parts, Bank of America, Borders Books, Channel One, Eli Lilly, Unisys, Volkswagen of America and other industry leaders.
GFX Dynamics (www.gfxdynamics.com) integrates dynamic digital and static signage into the retail environment with innovative solutions designed specifically to increase sales of merchandise and services. Proprietary, patented hardware and software solutions, combined with the products and services of strategic partners, enable dynamic content to be triggered in response to customer activity and sales results to be displayed in real time for effective ROI analysis. Among the unique products offered by GFX Dynamics are DupliView™ double-sided, portrait-format displays and SmartTable™ technology triggering targeted dynamic content as shoppers handle RFID tagged merchandise. GFX Dynamics is part of GFX International, a leading full-service provider of retail graphics. The resulting years of graphics and merchandising experience give GFX Dynamics a solid understanding of a retailer's expectations and the skills required to tailor solutions to their needs.
Combining R&D and engineering expertise, manufacturing power and unrivaled service, NEC Display Solutions (www.necdisplay.com) innovates, produces and delivers high-quality, competitively priced visual display products that help its customers see their digital world more clearly. Its award-winning lines of CRT and LCD monitors and information displays utilize advanced technologies that add comfort and convenience to the visual experience for a wide range of users. The company also brings together experts in the industry and offers a single point of contact to provide total display solutions for a variety of markets. A host of solution provider and customer-focused programs extend its price and service benefits.
POPAI (www.popai.com) is the only nonprofit, global trade association of the marketing at-retail industry. POPAI's groundbreaking research has made marketing-at-retail a measured medium, on a par with print and broadcast. The
4

association serves its members global needs by providing them a voice in their industry through a voluntary board, committees, task forces and leadership councils. In addition, POPAI sets the industry-wide standards for ethical business practices and expanded opportunities for the preservation of rights as a communication medium. Our members represent all facets of the industry: producers of displays, retailers, brand marketers, ad agencies, those who research the industry, and more.
Scala, Inc. ( www.scala.com) pioneered the industry of digital signage in 1987, and is today headquartered near Philadelphia, Pennsylvania, with operations in California, the UK, Germany, The Netherlands, Norway and Japan. As flat panel and networking technologies catch up with Scala's vision, Scala finds itself with over a 15-year head start, helping it to win some of the largest digital signage engagements and most respectable partners in the industry. Companies that are standardizing their digital signage equipment on the Scala InfoChannel® 3 platform include Tesco, Best Buy, T-Mobile, ShopRite, ASDA (Wal*Mart UK), Virgin MegaStore, Bloomberg, Kiwi, Azizia-Panda Supermarket, McKee Foods, Burger King, Muvico, Warner Brothers Movie World, RaboBank, Nedbank, Santiago Airport, and Dubai Airport. A network of over 250 Value Added Resellers across the globe offer Scala InfoChannel® solutions, and constitute our sales and support force that extends to every continent but Antarctica.
JCPENNEY CENTER FOR RETAIL EXCELLENCE
The JCPenney Center for Retail Excellence at Southern Methodist University Cox School of Business (www.cox.smu.edu/corporate/centers/jcpenney) was funded by a generous endowment from the JCPenney Company. The mission of the Center is to:
• Conduct cutting-edge research of interest to retailers addressing retail marketing and management issues and consumer shopping behavior.
• Enhance the education of the school’s students by offering retail courses and partnering with the retail community.
• Stimulate interest in retail careers among the school’s students and to help prepare them for those careers.
• Develop executive education programs for executives and managers in retail-related businesses.
5

The David F. Miller Center for Retailing Education and Research at the University of Florida (www.cba.ufl.edu/CRER/index.asp), founded in 1986, has over 30 retail firms supporting the activities of the Center. The Center’s objectives are to: 1) to stimulate student interest in pursuing careers in retailing, 2) to prepare students for entry level management positions, 3) to provide continuing education opportunities for individuals currently in retailing, 4) to improve communications between retailers and academics, and 5) to undertake research on retailing issues, opportunities, and problems. The objectives are directed toward finding ways to increase retailing productivity and uncover effective strategies for dealing with heightened competition and rapidly changing conditions in retail markets.
6

IntroductionRetail Digital Signage (RDS) is being embraced as a new marketing medium by a growing body of constituents. RDS is visual content displayed in a retail environment, delivered digitally through a centrally managed and controlled network. Messages delivered via a retail digital signage system may be individually addressed to several or thousands of locations real-time, and can be day-parted to adjust to various environmental factors. RDS has potential as a new medium due to its location in-store, as a result of message flexibility, and because of the ability to quantify its impact upon consumer shopping behavior. Yet many questions remain unanswered regarding the viability of retail digital signage systems.
The research objective of this Working Paper is to investigate the extent to which retail digital signage as an advertising medium can affect consumer shopping behavior in a measurable way. This is accomplished through observed experience and empirical research. This research is significant for several reasons. First, consumer purchase decisions are, to a significant extent, made in-store. As a consequence, RDS can impact sales at the store-level. Second, because measurement of the results from marketing spending have generally failed to keep pace with technology, RDS offers the ability to timely match marketing spending to its sales impact at the store-level.
In this Working Paper, we;
1. Address the fragmentation of mass media to ascertain whether marketing decision makers should be receptive to a new in-store advertising medium. We conclude that RDS has distinct functionality that warrants its inclusion as part of the marketing mix.
2. Explore the extent to which RDS influences consumer shopping behavior in a retail environment. By analyzing the stages of the buying process, and supported by the sales research presented, we conclude that RDS has the potential to substantially affect consumer shopping behavior.
3. Define RDS and advance its benefits as a new retail in-store marketing medium.
4. Detail relevant testing methods to be applied when measuring the impact of RDS.
5. Demonstrate the application of these testing methodologies by detailing the results achieved from a convenience store and a grocery store digital signage system deployment.
7

Discussion
A. Overview
Retail digital signage systems have implications for both the retailer and the consumer package goods company (CPG). In certain instances, the considerations will be similar for both. On one hand, RDS represents a new advertising medium available to retailers and the CPG industry. RDS’s impact upon the consumer shopping experience, the retailer’s brand in-store, shopper loyalty, etc., on the other hand, represents issues that are mainly confronted by retailers. In this Working Paper, we address issues faced by both groups as advertisers, as well as those considerations mainly of importance to retailers, as gatekeepers of the store. As it is the retailer who ultimately adopts or forgoes installation of RDS in its stores, an understanding of the three business models being adopted by retailers is instructive.
Three different business models of RDS are currently being embraced. Each has advantages and disadvantages to a retailer. These include the following:
1. Advertising Network Model: The generation of ad revenue is a major motivating factor for this system deployment. An incremental lift in retail sales is, of course, important as well. In this case, the system’s cost, advertising sales and content creation are generally managed by a third-party on behalf of the retailer. Examples include Wal-Mart TV and Imperial Oil (Esso) service stations in Toronto. Ad revenue and air time are divided between the retailer and the third-party provider. Variants on this model, such as in the case of TescoTV and Asda Live, reflect the retailer bearing the RDS infrastructure cost, while working with third-party providers to sell advertising and produce content.
2. Captive Network Model: In this instance, the retail digital signage system is purchased and managed by a retailer without accepting third-party ads. Examples include Nike Town and Commerce Bank. A slight variant on this model, such as in the case of Advance TV, run by Advance Auto Parts, finds merchandise vendors assisting the retailer in the production of content, such as a segment on how to change a muffler, which is paid for by the CPG and may also contain brand promotional content. The generation of additional sales, control of the customer experience and of the messages delivered in-store are primary motivational factors for adopting this model of RDS deployment.
3. Outsource Network Model: Generation of advertising sales is not a primary motivator for retailers adopting this business model. This business model is characterized by portions of the system being controlled or managed by third-party vendors on behalf of a retailer.1 An example is CompUSA TV, where the retailer owns and installed the system, and ad sales and content are managed by third-parties on behalf of the retailer.
Despite having a number of options in terms of a workable business model, RDS is a new advertising medium with its fair share of issues. For example, marketing spend decisions have been plagued by a lack of adequate methods to gauge the impact of an RDS on consumer purchases. While the results from some promotional tools, such as coupons, may be more quantifiable than
8
______________________1 The outcomes associated with the outsource network model are not detailed here. The reasons for this are that the nature of the relationship between the retailer and the third-party provider are private and often unique, thus not subject to analysis. In addition, this is a business model that is still emerging, thus best practices have not yet been established.

those of various promotional vehicles, such as advertising in newspaper and on television, the fact remains that marketing metrics have, to a great extent, failed to keep pace with technological advances. This issue is significant because of the dollars involved. Consider that for 2005, U.S. advertising spending is projected at $280.6 billion, and worldwide spending is projected at $553.4 billion.2 In addition, as marketing channels continue to fragment, advertisers will seek new platforms to deliver their messages.
Marketing professionals are charged with allocating communication dollars among five broad platforms. These include advertising, sales promotion, public relations, personal selling and direct marketing. Each of these promotional tools has a unique set of characteristics. Yet in the final analysis, the justification for such expenditures rests on sales impact. However, in the majority of cases, the impact of such marketing investments is either unknown or, at best, determined at a later time.3 The inherent flaws in marketing measurement have been well documented in both the scholarly research4 and by the firms investing these marketing dollars.5
An advertising medium is defined as one of the various mass media that can be employed to carry advertising messages to potential audiences or target markets for products, services, organizations, or ideas. The audience for these messages tends to be mass market in scope, with limited capabilities to segment the market. As RDS is clearly capable of carrying messages, the issue is not one of it being classified as a new media per se, but rather whether it is an effective media for achieving targeted retail store-level communication objectives. This is a function of whether RDS can influence consumer buying behavior in a measurable way relative to other media.
In this Working Paper, we examine how Retail Digital Signage systems influence consumer shopping behavior and detail the measurement of their impact on sales. This information will assist marketing practitioners in determining whether to allocate promotional dollars to this new medium, and retailers in considering whether or not to implement a retail digital signage system. We present various methods of measurement, illustrate how they are applied, and detail the results achieved from several retail deployments.
B. Antecedent Considerations
i. Fragmentation of Mass Media
Mass media communication channels do not extend into the store. RDS offers advertisers the ability to extend their message into the place of purchase. In addition, as mass media continues to fragment, RDS is a compelling, measurable marketing extension, with the ability to reach a highly targeted audience.
9
__________________________________
2 Source: Universal McCann. Includes spending on TV, direct mail, newspaper, radio, Yellow Pages, magazine, internet, and other forms of media. 3 This issue, in an advertising context, is viewed as the communications effect, which is capable of measurement, versus the sales effect, which is difficult to measure. For example, focus groups and interviews will reveal insights into customer perceptions, but are not suitable for gathering large amounts of data relative to a message’s influence upon a sale.4 “Good planning and control of advertising depend on measures of advertising effectiveness. Yet the amount of fundamental research on advertising effectiveness is appallingly small.” Philip Kotler, Marketing Management, Millennium Edition, 2000, p. 594.5 Jim Stengel, Global Marketing Officer, Procter & Gamble Company, keynote address titled “The Future of Marketing,” February 2004, AAAA Media Conference and Trade Show.

Reduced audience levels are having an impact on the effectiveness of traditional mass communication channels.6 In fact, spending on new advertising delivery methods is outpacing growth in older forms of media.7 To illustrate this, consider that while overall growth in advertising spending is forecast at 6.4 percent in 2005, Internet advertising is expected to grow by 25 percent8 and cable TV is expected to grow by 9.5 percent, while network TV is forecast to grow by 2 percent.9 This fragmentation is causing marketers to seek to express their messages in a variety of new formats, such as mobile devices, video magazines and in-store.
Advertisers are also seeking improved accountability for their spending. In this regard, most forms of measurement associated with traditional media have failed to keep pace with technology. Fundamentally, conventional media selection is predicated upon the premise that exposure to a message by a target audience will result in brand awareness that will ultimately result in a transaction. For most forms of advertising, such as print and broadcast ads, directories, billboards, brochures and booklets, etc., this creates a time-lag between the exposure and accurately measuring sales impact. This practice of gauging advertising based upon exposure persists for various reasons. First, it affords the media buyer the opportunity to compare costs across various communication platforms. Thus, it is an established method to buy and sell advertising. Second, substantial methods of gauging financial impact of marketing communications have had only mixed success.
Retail stores are an underutilized marketing medium, with great potential to impact shopping behavior.10 While a variety of in-store media currently exist, they often lack the speed, flexibility, and measurability that are afforded by RDS-delivered communications. Therefore, RDS represents a new medium capable of reaching consumers at the place of purchase. In addition, through integration into a retailer’s legacy systems, such as POS, merchandise and supply chain, RDS has the ability to immediately gauge the impact of a message and adapt the message to changing retail dynamics.
ii. Impact Upon Consumer Buying Behavior
The consumer buying process illustrates the potential points of impact of RDS. From this, insights into how RDS influences in-store shopping behavior is developed, which are then communicated via messages delivered at the store-level. Ultimately, messages are tailored to reach a desired level of impact.
10
________________________6 “We’ve gone from the era of mass production, mass merchandising, and mass marketing to the era of customized products and services. Media fragmentation is atomizing audiences.” Randall Rothenberg, Director of Intellectual Capital, Booz Allen Hamilton. 7 Satellite, cable and TiVo are examples of disruptive technologies impacting television. Digital radio, for example, is a disruptive technology impacting radio. New technologies, such as digital radio, are calling into question the traditional approach of forcing consumers to watch, listen and read an advertisement. “…the traditional advertising approach is inadequate for today’s intelligent products and informationally-empowered consumer,” “The Death of Advertising,” Journal of Advertising, Dec. 1994.8 Spending on internet advertising is forecast at $11.5 Billion in 2005 and $19.2 Billion in 2010. Source: Sanford C. Bernstein & Co. 9 Source: Universal McCann.10. “Another promising new media site is the store itself.” Philip Kotler, Marketing Management, Millennium Edition, 2000, p. 589. See generally, “Scoring Points: How Tesco is Winning Customer Loyalty,” Humby, Hunt, and Phillips, 2004.

Levy & Weitz11 detail the four stages of the buying process as follows:
1. Need Recognition: The buying process is triggered when a consumer recognizes an unsatisfied need. Need may be stimulated externally as well as in a store. In-store, need recognition occurs from exposure to a stimulus, such as a message, merchandise, etc. The recognized need can then lead to an increase in the likelihood of a purchase.
Implications for RDS: Dynamic messaging can stimulate functional and psychological needs at the store-level.
2. Information Search: To satisfy a need, consumers seek both product and service information, as well as information pertaining to how and where the product and/or service can be obtained. Outside the store, advertising is one source of such information. Merchandise selection, service offerings and pricing strategy, among other things, are geared to drive customers into the store to seek this information.12 Inside the store, visual merchandising and static signs, for example, supply shoppers with additional information.
Implications for RDS: Dynamic messaging can provide timely product/service and store information that can easily scale to provide specific types and amounts of information that may aid in satisfying consumer information requirements.
3. Evaluation of Alternatives: Consumers evaluate available information about a product/service and available retailer choices, ultimately selecting the one that best satisfies their needs. Intuitively, consumers evaluate and rank the product/service and retailer based upon various relative attributes (such as product features, price, store convenience, assortment, store environment, etc.), and how important these attributes are to the individual consumer.
Implications for RDS: RDS messaging can scale to impact both relevant product/service and store information, and can impact the relative importance placed on these individual attributes by a consumer due to its ability to rapidly change messages to appeal to various consumer segments. For example, RDS-delivered messages may impact consumer price and merchandise assortment perceptions due to its flexibility in altering promotional messages. Store attribute importance can be impacted by deep and varied content that addresses, for example, product education and demonstrations.
4. Choice of Alternatives: A consumer’s conclusions on product/service/retailer attributes and the weight ascribed thereto can result in a consumer purchase that fills their need.
Implications for RDS: RDS targeted messages can be useful in educating consumers about a store’s performance characteristics, can shift consumer shopping attribute preferences, and, provide flexibility to rapidly introduce new products/services that can impact consumer store preferences.
Each of the above-noted implications for RDS has been substantiated through testing.
11
_______________________11 Levy & Weitz, Retailing Management, Fourth Edition, Chapter 5. 12 “The retailer’s objective at this stage of the buying process is to limit the customer’s information search to its store.” Levy & Weitz, Retailing Management, Fourth Edition, p. 146.

In the first test discussed in this Working Paper, the following results were observed:
• RDS messages overall produced a weighted sales increase of 10 percent in both volume and sales of advertised brands.
• RDS price promotion messages of advertised brands produced a weighted average increase of 22 percent in volume and 24 percent in sales.
• 31 percent of store shoppers recalled seeing the screens.
In the second test reported in this Working Paper, the following results were observed:
• RDS brand and promotional messages resulted in sales increases of 10 percent to 11 percent in both volume and sales by consumer product goods companies during a six-month trial.
• RDS brand and promotional messages resulted in sales increases of 9 percent to 11 percent in both volume and sales by a retailer’s private label merchandise during a six-month trial.
• 59 percent of store shoppers recalled seeing the screens.
C. Retail Digital Signage as a New Marketing Medium
RDS is defined as “the visual content displayed in a retail environment, delivered digitally through a centrally managed and controlled network.”13 The key benefits of RDS are summarized as follows:
1. RDS messaging is dynamic, possessing the capability to display complex graphics and videos, resulting in attention-garnering messages.
2. RDS messages are capable of rapid deployment systemwide, storewide or in a single store aisle, and can leverage specific regional and store conditions, such as customer demographics, weather conditions, promotions, educational content, and can further be fractionalized into day-parts.
3. RDS can be centrally monitored, ensuring that systemwide, brand-compliant messages are deployed. This represents a major advantage over other forms of in-store communications, which are plagued with questions of store compliance.
4. RDS can enhance customer service and improve store personnel productivity. Digital signage assists customers in locating the merchandise they are looking for in the store, and can provide in-depth information and product demonstrations to aid in the purchase decision.
5. RDS can reduce store operating costs associated with graphics deployments and increase labor productivity relative to other types of signage. RDS eliminates the costs associated with printing, distributing and installing static signage. In addition, RDS may decrease store labor costs, while improving labor productivity. For example, the U.S. Postal Service is experimenting with RDS to direct customers with simple
12
__________________13 Platt, Sinha, Weitz, Hellberg, Iyer and Myers, Implications for Retail Adoption of Digital Signage Systems, Working Paper, October 2004.

service requirements to self-service options, and to educate customers while waiting in the lobby line about products and services to reduce time spent with a retail associate at the counter, thus improving its employee productivity.
6. RDS is capable of timely and accurate measurement of a message’s impact upon a consumer.
A practical illustration of these benefits, for example, is advanced by a financial institution, which identified the purpose of adopting a retail digital signage system as: “delivering compelling product messages to customers while creating a quick and far-reaching communication delivery source.” The following objectives were identified:
• Cross-sell the customers while they are visiting the branch.
• Decrease customer complaints regarding transaction wait times.
• Improve turnaround time between conception and delivery.
• Decrease printing costs of branch signage and rate fliers.
• Effectively communicate bank messages and information to branch employees.
• Provide turnkey marketing to branches.
As a new in-store marketing medium, RDS possesses various key benefits:
1. RDS eliminates the time-lag between consumer exposure to a message and the place of purchase.
2. RDS-enabled technology possesses the ability to directly correlate the message to its sales impact.
3. The dynamic nature of RDS enhances its ability to make timely changes of messages in response to changing consumer and environmental factors.
These benefits are detailed below.
i. Elimination of the Time-Lag between Consumer Message Exposure and the Place of Purchase
RDS placement in-store eliminates the time-lag between consumer exposure to a message and the ability to buy a product.14 As retail environments become more relevant elements in the marketing mix, RDS offers an advantageous method to influence consumer purchase behavior in the store.
Retail stores are being recognized as part of the marketing mix because they intersect the time and place where all elements of the sale – the consumer, the money, and the product – come together.”15 According to Quelch and Cannon-Bonventre,16 marketing expenditures at the place of purchase are becoming significant because: 1. they often prove more productive than advertising and promotion expenditures; 2. sales support in-store is declining, which fosters greater interest by retailers to deliver information at the place of purchase; and, 3. with changes in consumer shopping patterns and expectations, the place of purchase is becoming more important to consumer decision making. The
13
______________________14 While store graphics and POP possess this same attribute, mass media does not.15 Store Wars, the Battle for Mindspace and Shelfspace, Corstjens and Corstjens, 1995. 16 Quelch and Cannon-Bonventre, “Better Marketing at the Point of Purchase,” Harvard Business Review, Nov.-Dec., 1983, p. 163.
relevance of these conclusions concerning the importance of retail in-store marketing becomes more significant when consideration is given to the fact that many consumer purchases are unplanned.17 The high incidence of unplanned purchases reflects the importance of in-store communications. Given the benefits of RDS as an in-store medium, it has the potential to dramatically affect purchase behavior.
ii. Direct Correlation between Message and Sales Impact
RDS offers the ability to leverage technology to rapidly measure the impact of a message upon sales at the store-level. While retailers may also have an interest in measuring customer experience and customer loyalty, among other things, measurement of the correlation between the sales impact and RDS-displayed messages can be achieved by integration into a retailer’s legacy systems. Contrast this to traditional mass media, where ad pricing is based upon cost per thousand, with no assurance of who is looking at the ad, and the measures are relative to the media content, such as a magazine, not the ads per se. Simply, RDS affords the opportunity to measure whether someone buys something after viewing an in-store message. In addition, RDS offers the ability to rapidly adjust in-store messages to the level of sales impact the message may or may not be exerting upon consumers. That is, if a message is not achieving its intended sales objective, it can quickly be altered. As such, RDS exhibits several of the same qualities associated with Internet advertising. A message’s impact upon sales can continually be assessed by looking at POS data and, if desired, it can be changed quickly. Finally, RDS messages can rapidly adjust to other retailer specific factors, such as overstocks. Again, the effect the message is having at the store-level can be altered rapidly to achieve a desired result.
iii. Enhancing the In-Store Marketing Environment
Past research has found a relationship between exposure to in-store marketing activities and consumer purchase behavior.18 From an in-store marketing perspective, a retailer may distinguish itself in a variety of ways, including product assortment, price, and promotional strategy. RDS enhances a retailer’s ability to communicate about any or all of these elements to customers in the store, as well as to day-part messages to appeal to specific customer segments and to adapt to local environmental conditions, such as changing weather patterns or the local Town Hall meeting.
For the most part, information relative to store merchandise is limited to product packaging, visual merchandising and store personnel. RDS offers the opportunity to expand the amount and type of information provided to a customer due to its dynamic nature. In addition, in-store promotional activities such as store coupons, graphics, displays, etc. are static in nature. RDS, on the other hand, is dynamic in nature, thus adaptable to changing market conditions, environmental factors, etc. Further, RDS messaging can be enhanced and varied to stress merchandise selection that is more susceptible to impulse purchase.19
14
_____________________17 Park, Iyer and Smith, “The Effects of Situational Factors on In-Store Grocery Shopping Behavior,” Journal of Consumer Research, Spring 1989, p. 422-433.18 Dhar and Hoch, “Price Discrimination Using In-Store Merchandising,” Journal of Marketing, Volume 60, No. 1, 1996. 19 See “Impulse Buying Varies by Product,” Journal of Advertising Research, December 1978, where the researchers found, for example, that 55 percent of bakery products were impulse purchases, on the high end, and 39 percent of books and stationery were impulse purchases, on the low-end, of their findings of impulse purchases by merchandise line.
Inman, Ferraro and Winer determined that 59 percent of store purchases were unplanned, 30 percent were planned and that the remainder were either generally planned or brand switches. Expanding upon this, Inman’s developmental model details the consumer in-store purchase decision-making process by identifying consumer-specific factors (i.e., deal proneness, household size, trips per week, age, compulsiveness, gender, purchase involvement, income, etc.), and shopping-specific factors that impact both need recognition and in-store information seeking behavior. Shopping-specific factors, which can be affected by a retailer, were found to exert a greater average impact on in-store decision making than consumer-specific variables, which are not susceptible to retailer influence. The following factors, in the order noted, most impacted the shopping-trip specific factors: number of aisles shopped, trip type, shopping party size, use of a list, and display type. According to Inman, retailers should “encourage consumers to shop as many aisles as possible and provide exposure to as many product categories and in-store displays as possible.”20 Messages delivered by RDS should thus focus upon influencing shopping trip specific factors.
Accepting that a significant portion of consumer purchases are impulse buys determined in the store, RDS delivered messages offer a compelling medium to advertisers. Further, current research supports the proposition that RDS influences consumer shopping behavior in the store. In the grocery store test detailed in Section F, RDS messages were found to have a 10 percent to 11 percent impact on sales over and above any other promotional activity that may have been occurring in the store during the test period.
D. Retail Digital Signage Testing Methodologies
As mass markets continue to fragment and retail and consumer brands seek more targeted communication, the drive toward new, more precisely targeted and effective media becomes apparent. The ability to influence consumer behavior is the justification for an RDS system. In this section, various methods to measure the influence and to test the effectiveness of a retail digital signage system are explored.
The effectiveness of a digital signage system quantifies the extent to which the goals of the deployment are being met. The evaluation process is somewhat easier when the expected benefits are tangible. For example, in the case of an advertising network model, the system’s goals may be limited to generating advertising revenue and merchandise category lift. In this instance, the measurement of advertising revenue and sales impact is relatively straightforward. In the captive business model, the expected benefits from an implementation of a retail digital signage system may include direct benefits such as product trial, brand sales and the like, as well as indirect benefits associated with communicating about the brand and store image. As with all forms of media, communications that have a direct impact on purchase behavior are much more easily evaluated, while indirect effects are more elusive.
The process to assess the performance of a program can be divided into three parts. The first part consists of understanding a retailer’s business strategy and understanding how a digital signage system enhances that strategy. In the application context, retailers may adopt digital signage systems for a variety of reasons including generating revenue from the store medium, improving sales, enhancing the customer experience and/or improving customer loyalty. These objectives form the basis for establishing the metrics that will be utilized to assess the effectiveness of the digital signage system that are consistent with
15
___________________20 Inman, Ferraro, and Winer, In-Store Decision Making: The Role of Category-Level and Shopping Trip-Level Factors, Working Paper, 2005.

the communication objectives. In the event that attaining more intangible goals is desired, such as enhancing the customer experience, measures of customer impressions, store and product education, and/or brand perception should be established. If influencing customer loyalty is a desired goal of a retail digital signage system, measures that involve the store/brand promise, product perceptions, and customer lifetime value should be considered. Once the measures are established, the final step in the evaluation process consists of data collection and analysis to assess the impact of digital signage on the measures of interest. Data sets can be gathered from a variety of sources such as POS data, through discussion groups, visual scans, video observations, and shopper interviews. Other data gathering methods currently under investigation include customer loyalty card usage, touch screen hits (if an interactive format is adopted), store personnel interviews, etc. This process is illustrated in Table 1.
Table 1. RDS Measurement Methodologies.
Organizational Goals of RDS
Metrics Data Source
Generate media revenue
• Opportunity to be seen via store traffic (gross rating)
• Assess if messages are being seen (net rating)
• Video observations
• Visual scans, shopper interviews
Affect sales • Sales lift• Basket/ticket size• Customer
convenience
• Sales analysis• Sales analysis• Visual scans,
shopper interviews
Enhance Customer Experience
• Customer impress-ions of store attri-butes (such as service levels, checkout wait time perceptions.
• Store and product education
• Brand perception
• Discussion groups, shopper interviews
Impact Customer Loyalty
• Enhance store/brand promise
• Enhance p roduc t perceptions
• Customer l i fet ime value
• Discussion groups, visual scans, shopper interviews, shopper surveys, loyalty card use, model customer equity value
Testing methodologies will, to a great extent, be dependent upon the implementation stage of a project. That is, the measurement deployed will be influenced by the stage of a project’s development. During the early phases of a deployment, where issues such as screen physical placement, credibility of the application, content, play list, etc. are being refined, more robust testing may be required. Once baseline measurement standards are established, the required measurement may be less intense. Notwithstanding, measurement may be desirable to confirm that system goals are being met during various segments of a project, such as coincident with a new promotional program.
16

As detailed below, five data sources can be leveraged. Suggestions are advanced regarding the number of test stores, testing period, etc. that will ideally be involved in a test. The actual test parameters should, in practice, be determined on a case-by-case basis. Other methods are becoming available as well, but have not, as of yet, been subject to empirical testing.
1. Sales Analysis: Sales analysis provides the link between the message and its impact upon consumer shopping behavior. Ideally, 20 stores should be involved in testing during a trial phase – 10 enabled and 10 non-enabled. Analysis should begin four weeks prior to deployment to establish baseline statistics. The purpose in establishing these pre-deployment baseline numbers is to gauge product performance prior to screen deployment to filter the effects of seasonal fluctuations, product availability, and to otherwise generate inert sales figures for use in the controlled testing phase. The test should run 24 weeks during the trial phase. The output from this testing will assist a retailer in determining the impact of RDS-enabled stores when compared to non-enabled stores, aid in making product assortment decisions and merchandise shelf allocations, as well as assess promotional and cross-promotional impact, and lead to the understanding of shopping patterns, etc.
2. Discussion Groups: Discussion groups are utilized to determine shopper awareness of the digital signage system and the messages; message relevance to shopper needs and expectations and message recall; and shopper utilization of content, i.e., calls to action, etc. Generally, six to eight shoppers from RDS-enabled stores are interviewed three times during a six-month trial period to determine shopper perception of a digital signage installation. The output from these discussions will assist the retailer in determining if customers are aware of the screens, if the screen placement is accurate, and if messages displayed are significant and relevant.
3. Visual Scans: Visual scans will lead to a qualitative understanding of: store traffic patterns; conversion of screen observation to sales; length of exposure and number of messages viewed; and shopper field of vision. Ten to 100 shoppers should be equipped with visual cameras to determine shopper field of vision as they shop a store. This testing occurs three times during a six-month trial period. The output from this will assist a retailer in determining shopper field of vision and net ratings. That is, what is actually being viewed. 4. Video Observations: Video observations produce quantitative data relative to customer shopping behavior. Five to 10 video cameras are installed in one-to-three RDS-enabled stores, capturing data over a two to seven day period three times during a six-month trial period. The output from this will assist a retailer in determining shopping store pathways and specific counts relative to store and aisles shopped. Information produced will include the following:
• The number of shoppers entering the store by time of day/day of week.• Who is entering the store – gender/age/group size.• Number of shoppers who pass the screens in different locations.• Number of shoppers who glance at the screens.• Number of shoppers who stop and look at the screens.
The output from this will assist a retailer in calculating shopper opportunity to see and determining gross ratings. 5. Shopper Interviews: Shopper interviews will lead to an understanding of screen observation and recall, as well as message impact. One hundred to 300 shoppers are interviewed three times during a six-month trial period. The output from this will assist a retailer in understanding shopper perceived behavior, which can be compared with quantitative data to determine variances.
17

E. Testing Model Applied to a Convenience Store Chain and Results Achieved from The Digital Signage deployment
Background
From September to November 2003, a major UK convenience store retailer with over 2,780 stores (hereinafter referred to as CS), implemented and tested a retail digital signage system in six stores. The research objective was to establish the sales impact of RDS-delivered messages, and to gain insights into customer awareness and perceptions of the in-store screens.
CS’s stores average 1,400 square feet each. Stores were equipped with from three to seven screens per store. Each store had a 20-inch welcome screen and four 15-inch screens placed overhead throughout the store in the following four zones: the Welcome Zone (testing the soft drinks category); the Beer, Wines & Spirits Zone (testing the beer category); the General Grocery Zone (testing the cereal and biscuits categories); and, the Freezer Zone (testing frozen foods and butters and spreads). In addition, one 8.25-inch, shelf-mounted screen was placed at eye level. Merchandise categories were selected based upon the composition of the participating CPGs (five major brands participated in the test and assisted in funding the project). Only six stores were tested due to the availability of funding. In this retailer’s case, the number of screens, placement, size and content were determined on a trial and error basis.
Messages included CS store and private-label content, as well as third-party CPG brand advertising, which was contributed as part of the test. Third-party advertising included merchandise advertisements, merchandise advertising coupled with price promotions, and merchandise price promotions only. Promotional messages ran in three-week cycles to coincide with product promotions.
Messages delivered were short clips of 10 seconds each. Message length was determined based upon the short duration of time shoppers remain in the convenience store and the small size of the stores. A total of nine messages were displayed for 10 seconds each, resulting in a loop every 90 seconds (messages cycled 40 times per hour per zone). Different message loops were shown throughout the four store zones. Message scheduling was divided into four day-parts as follows: 10 a.m. to 2 p.m.; 2 p.m. to 6 p.m.; 6 p.m. to midnight, and midnight to 10 a.m. Messages were scheduled by day-part to reflect a logical sequence of merchandise sales, i.e., messages related to the sale of newspapers were displayed between 10 a.m. to 2 p.m.; advertising related to alcohol was displayed between 6 p.m. and midnight.
The following details the application of the testing methods and the results achieved during the CS RDS trial.
Sales Analysis
A total of 10 stores were involved in the test. Six test stores were RDS-enabled. Four control, non-enabled stores were also included in the test for purposes of establishing baseline comparisons. The control stores had the same price points and promotions running in-store as the test stores. The test and control stores were matched by size, sales volume and demographics. All 10 stores received a weekly audit visit to monitor the number of merchandise shelf facings, prices, promotions of all advertised brands and the categories they reside in, and to ensure that no unplanned in-store displays and/or graphics were present. The screens were also checked for function and for accuracy of the promotions displayed. POS data was collected by CS for the selected advertised SKUs and competitive SKUs within the product categories.
18
Analysis began four weeks prior to deployment to establish baseline statistics. The purpose in establishing these pre-deployment baseline numbers is to gauge product performance prior to screen deployment to filter the effects of seasonal fluctuations,21 product availability, and to otherwise generate inert sales figures for use in the controlled testing phase. The test objective is to match POS data to determine the sales impact of RDS in test versus control stores. Figure 1 illustrates how baseline measures are established at the control sites, and compares the results with those at test sites to illustrate the impact of RDS.
(The following is for illustrative purposes only, and is not related to the CS test per se.)
Assume that baseline sales at the control and test stores were 100 prior to testing. Assume further that during the test period, sales in the control stores rose to 133 (+33 percent), and sales in the test stores rose to 143 (+43 percent). Therefore, the impact of RDS at the test stores would be expressed as follows:
Figure 1. Sales Audit Use of Control Store Data Model Example.
Weighted (True) Performance: 143 units X 100 – 100 = +7.5 percent 133 units
The following is a summary of significant sales results achieved during the CS RDS trial.
• On average, RDS messages overall produced a weighted sales increase of 10 percent in both volume and sales of advertised brands.
• RDS price promotion messages of advertised brands produced a weighted average increase of 22 percent in volume and 24 percent in sales.
• Of the categories tested, brand messages had the strongest impact in the beer category (+20 percent in volume and +28 percent in sales), and the least influence in private-label beverages (+4 percent in volume and +4 percent in sales). See Table 2.
19
________________________21 Consideration of seasonal fluctuations is necessary to prevent data distortion. For example, assume that RDS testing occurred in the summer when cold drinks are most likely to be sold. Absent such baseline comparisons, a portion of any sales change might falsely be attributable to the RDS messaging, rather than due to the change in weather conditions. By establishing baseline comparisons and testing versus controlled stores, the impact of such variations would be eliminated.

Table 2. Chart of CPG and CS Private-Label Merchandise Brand Advertisings Only.
Merchandise Category
Unit Sales % Lift Sales Volume % Lift
Biscuits-all varieties (ads ran throughout nine week trial)
+8% (nine week overall results)
+8% (nine week overall results)
Cereal-all varieties (ads ran throughout nine week trial)
+10% (nine week overall results)
+10% (nine week overall results)
Frozen Foods-all varieties (ads ran during weeks seven-nine of trial)
+13% (weeks seven-nine results)
+14% (weeks seven-nine results)
Beer #1 (ads ran throughout nine week trial)
+20% (weeks four-six results)
+28% (weeks four-six results)
CS Private-label Lemonade (ads ran during weeks one-six of trial)
+4% (weeks one-six results)
+4% (weeks four-six results)
• Price promotion messages had a significant impact on the beer category (25 percent percent in volume and 22 percent in sales). The RDS promotional impact upon the private-label beverage category was substantially greater than that of the beer category. See Table 3.
Table 3. Chart of CPG Merchandise and CS Private-Label Advertising-Price Promotions Only.
Merchandise Category
Unit Sales % Lift Sales Volume % Lift
Beer #2 (three segments of price promotions running for three weeks each)
+22% (nine week overall results)
+25% (nine week overall results)
Beer #2 (price promotions in weeks one-three)
+23% (weeks one-three results)
+32% (weeks one-three results)
Beer #2 (price promotions in weeks four-six)
+19% (weeks four-six results)
+22% (weeks four-six results)
Beer #2 (price promotions in weeks seven-nine)
+25% (weeks seven-nine results)
+22% (weeks seven-nine results)
CS Private-label Lemonade (price promotions in weeks seven-nine)
+16% (weeks seven-nine results)
+16% (weeks seven-nine results)
20

• While the impact of RDS ads on sales in the beer category were substantial, the impact of coupling brand advertising with price promotions in the beer category were not dramatically different than advertisements that were brand only or promotional only. See Table 4.
Table 4. Chart of CPG Merchandise Brand Advertising Coupled with Price Promotions.
Merchandise Category
Unit Sales % Lift Sales Volume % Lift
Beer #1 (brand ads ran throughout nine week trial, coupled with price promotions in weeks one-three and seven-nine)
+23% (nine week overall results)
+28% (nine week overall results)
Beer #1 (brand ads ran throughout nine week trial, coupled with price promotions in weeks one-three)
+27% (weeks one-three results)
+29% (weeks one-three results)
Beer #1 (brand ads ran throughout nine week trial, coupled with price promotions in weeks seven-nine)
+21% (weeks seven-nine results)
+27% (weeks seven-nine results)
• The category impact upon the five categories tested (including RDS advertised and non-advertised brands) was the highest in unit volume in the cereal category (5.4 percent), and the highest in Pounds sales in the soft drink category (5.1 percent). The category impact upon the five categories tested (including RDS advertised and non-advertised brands) was the lowest in unit volume (1.3 percent) and sales volume (1.3 percent) in the butter and spreads category. See Table 5.
Table 5. Chart of Tested Category Results (total for category, including advertised and non-advertised brands).
Merchandise Category
Unit Sales % Lift Sales Volume % Lift
Soft Drinks +5.1% (nine week overall results)
+5.1% (nine week overall results)
Butter and Spreads +1.3% (nine week overall results)
+1.3% (nine week overall results)
Beer, Wine and Sprits +3.9% (nine week overall results)
+3.8% (nine week overall results)
Cereal +5.4% (nine week overall results)
+3.1% (nine week overall results)
Frozen Food +3.7% (nine week overall results)
+3.4% (nine week overall results)
Video Observations
Small fixed video cameras were installed in one RDS-enabled test store. Five cameras were located on the top of five RDS displays focused to determine if shoppers were looking at the screens. The cameras recorded for five days, including the weekend. The video was then analyzed to evaluate store counts to determine shopper opportunity to be seen. In this case, it was determined that, on average, 1,034 people entered the stores per day.
Shopper Interviews
21

Interviews were conducted with 268 shoppers as they left the store to understand their store usage, and assess their awareness of the screens and recall of the advertised messages. Information gathered relative to store visits aids in determining the message’s gross opportunity to be seen (i.e., 41 percent visit the stores daily, 39 percent visit the stores every few days, 12 percent visit weekly). Information gathered relative to awareness of screens aids in determining the message’s net rating, that is, how many people recall seeing the screens and specific advertising communicated thereon. Overall, 31 percent of store shoppers recall seeing the screens, with a recall rate of 64 percent among those age 16-21, versus a recall rate of 9 percent among those age 65+. Category recall for all food items was 18 percent, frozen food was 13 percent, cereals were 12 percent, soft drinks were 12 percent, and beer was 11 percent. Hot drinks had the lowest recall rate, 5 percent of those interviewed.
F. Testing Model Applied to a Grocery Store Chain and Results Achieved from the Digital Signage Deployment
Background
From August 2004 to January 2005, a major UK grocery store retailer with over 274 stores (hereinafter referred to as GS), implemented and tested a retail digital signage system in two stores. The system went live in September 2004, with the most intensive testing occurring in three separate phases. Data was compiled during test Phase One (September 2004), test Phase Two (November 2004) and test Phase Three (January 2005). The research objective was to evaluate the effectiveness and measure the performance of the RDS system on shopper behavior over an extended period of time. The testing methodology was, for the most part, consistent throughout the test period.22
GS’s stores average 55,000 square feet each. Two stores were RDS-enabled with differing screen configurations for measurement purposes.23 In the Y (or Action Alley) store, five double-sided 42-inch screens were placed overhead in the main or action alley; two 60-inch screens were placed over an escalator leading to the entrance to the mezzanine floor; and one 42-inch screen was placed in a private-label apparel department by the cash desk. In the W (or Individual Aisles) store, eleven double-sided 42-inch screens were placed overhead in the aisles of nine individual departments (Beer, Wine and Sprits, Skincare, Household, Canned & Savory, Cereals, Snacking, Soft Drinks, Confectionery, Men’s Toiletries), and two 42-inch screens were placed in a private-label apparel department. Merchandise categories were selected based upon the retailer’s assessment of the potential for third-party advertising sales. That is, GS selected the screen locations in the W store based upon which brands have the largest advertising budgets, and then sought out specific CPGs to participate in the testing.
Messages included general GS store and private-label brand and promotional merchandise content. In addition, messages included third-party CPG brand and promotions. Messages were specifically designed for the RDS test.
Messages delivered were short clips of 15 seconds each. Message and loop length were determined based upon the stores’ size and customer dwell times. In the Y store, a total of 14 messages were displayed for 15 seconds each,
22
_____________________22 A noteworthy change occurred between Phase One and Two. This was related to a better matching of merchandise to message location at the Action Alley store.23 Due to budgetary considerations, only two stores were selected for RDS installation and testing.

resulting in a loop every three minutes and thirty seconds (generally, dwell times were assumed to be longer in Action Alley than in Individual Aisles), with individual messages being repeated 17.14 times per hour (there were no individual store zones in the Y store tests).
In the W store, a total of six messages were displayed for 15 seconds each, resulting in a loop every one minute and thirty seconds, and individual messages being repeated 40 times per hour. Each of the 11 zones ran a different loop. Message varied slightly by day-part. In both test stores, the messages were changed every month, content was created and managed by a third-party provider, and messages were distributed to the store via broadband. POS data was gathered by GS for independent analysis.
The following details the application of the testing methods and the results achieved during the GS RDS trial.
Sales Analysis
A total of eight stores were involved in the testing. The Y and W test stores were RDS-enabled. Six control, non-enabled stores were also included in the test for purposes of establishing baseline comparisons. The control stores were matched to the two test stores in terms of square footage, store sales, store number of transactions and shopper demographics. Both the test and control stores ran the same promotions.
Analyses began six weeks prior to deployment to establish baseline data in the six control and two test stores, in a manner consistent to that detailed in the CS study in Section E. The test objective was to match POS data to determine the sales impact of RDS in the test versus control stores.
The following is a summary of the sales results achieved during the GS RDS trial. These definitions apply to the Figures provided:
1. Branded Products – Including Non-Sponsors (includes the results of test sponsor and non-sponsor ads, which are defined as those that did not contribute to the test cost): results achieved from third-party CPG brand advertising, combining the results of messages with and without price promotions.
2. Own Label: results achieved from GS brand private-label merchandise advertising, combining the results of messages with and without price promotions.
3. Featured Deals: results achieved from both third-party CPG and GS brand private-label merchandise advertising of price promotions.
4. Featured Branded: results achieved from third-party CPG advertising without price promotions.
5. Featured Own Label: results achieved from GS brand private-label merchandise advertising of price promotions.
6. Average/advertisement (Including Non-Sponsors): combines the results of items three, four and five.• The overall positive impact of RDS messages realized by CPGs,
combining both brand and promotional messages, averaged between 10 percent and 11 percent in both stores, in both units and pounds, over the six-month trial (see Figures 2, 3 and 4, Branded Products).
• The overall positive impact of RDS messages realized by GS brand private-label merchandise, combining both brand and promotional messages, averaged between 9 percent and 11 percent in both
23

stores, in both units and pounds, over the six-month trial (see Figures 2, 3, and 4, Own Label).
• The overall positive impact of RDS messages realized by combining CPG brand advertising and both CPG and GS private-label promotional messages, averaged between 10 percent and 11 percent in both stores, in both units and pounds, over the six-month trial (see Figures 2, 3, and 4, Average/Advertisement).
Figure 2.
Figure 3.
24
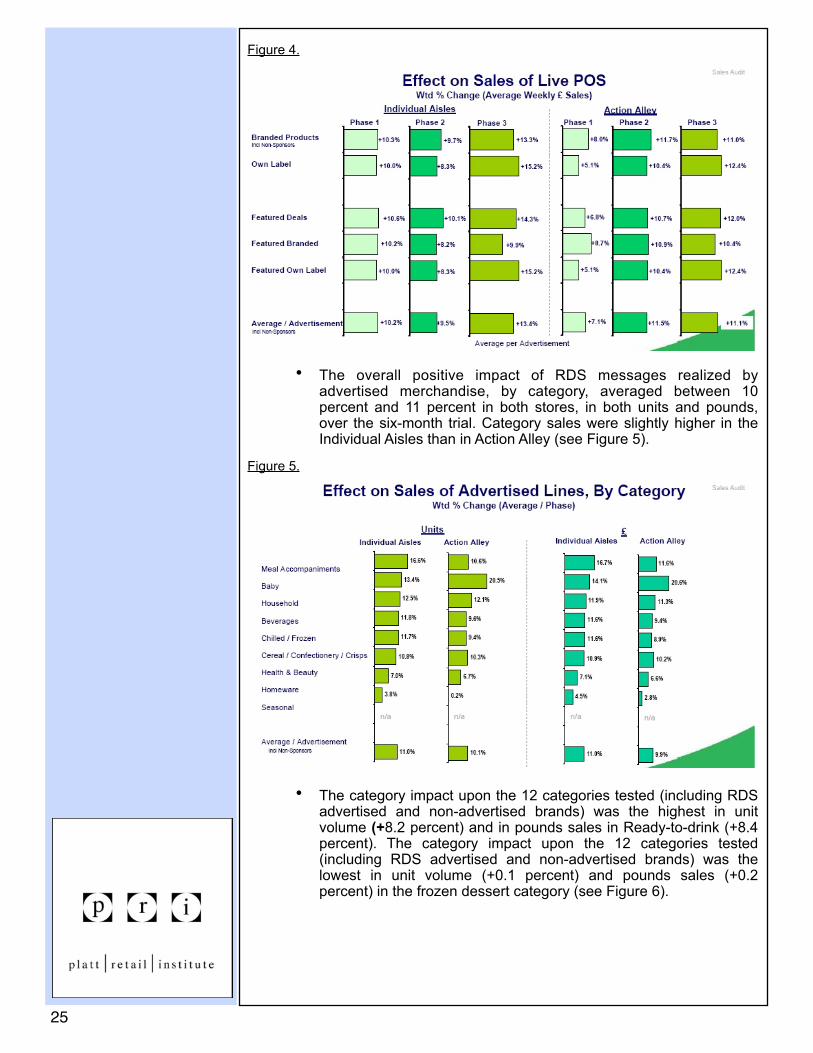
Figure 4.
• The overall positive impact of RDS messages realized by advertised merchandise, by category, averaged between 10 percent and 11 percent in both stores, in both units and pounds, over the six-month trial. Category sales were slightly higher in the Individual Aisles than in Action Alley (see Figure 5).
Figure 5.
• The category impact upon the 12 categories tested (including RDS advertised and non-advertised brands) was the highest in unit volume (+8.2 percent) and in pounds sales in Ready-to-drink (+8.4 percent). The category impact upon the 12 categories tested (including RDS advertised and non-advertised brands) was the lowest in unit volume (+0.1 percent) and pounds sales (+0.2 percent) in the frozen dessert category (see Figure 6).
25
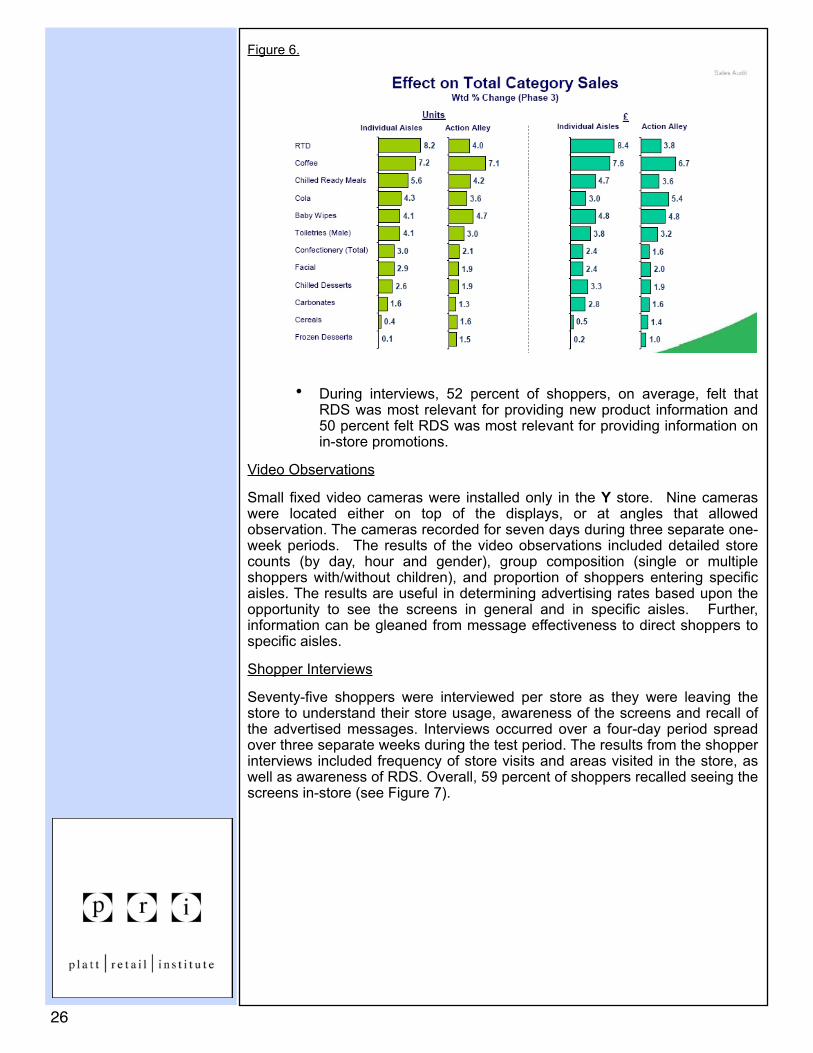
Figure 6.
• During interviews, 52 percent of shoppers, on average, felt that RDS was most relevant for providing new product information and 50 percent felt RDS was most relevant for providing information on in-store promotions.
Video Observations
Small fixed video cameras were installed only in the Y store. Nine cameras were located either on top of the displays, or at angles that allowed observation. The cameras recorded for seven days during three separate one-week periods. The results of the video observations included detailed store counts (by day, hour and gender), group composition (single or multiple shoppers with/without children), and proportion of shoppers entering specific aisles. The results are useful in determining advertising rates based upon the opportunity to see the screens in general and in specific aisles. Further, information can be gleaned from message effectiveness to direct shoppers to specific aisles.
Shopper Interviews
Seventy-five shoppers were interviewed per store as they were leaving the store to understand their store usage, awareness of the screens and recall of the advertised messages. Interviews occurred over a four-day period spread over three separate weeks during the test period. The results from the shopper interviews included frequency of store visits and areas visited in the store, as well as awareness of RDS. Overall, 59 percent of shoppers recalled seeing the screens in-store (see Figure 7).
26
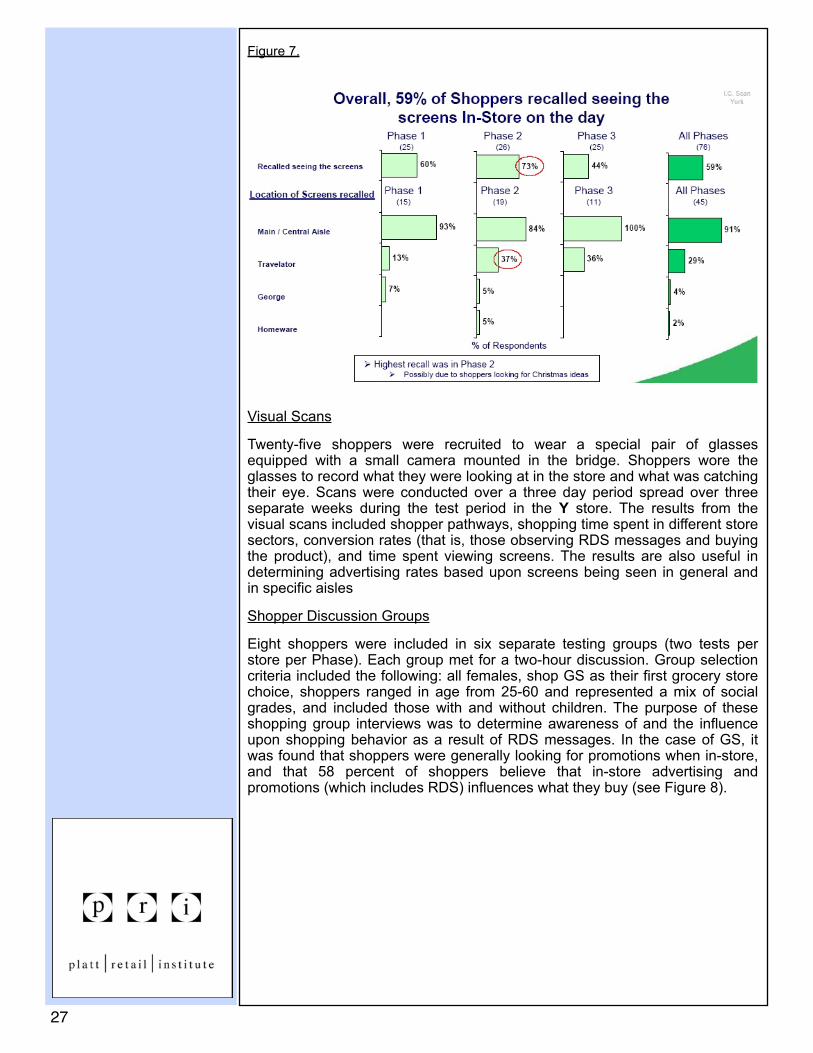
Figure 7.
Visual Scans
Twenty-five shoppers were recruited to wear a special pair of glasses equipped with a small camera mounted in the bridge. Shoppers wore the glasses to record what they were looking at in the store and what was catching their eye. Scans were conducted over a three day period spread over three separate weeks during the test period in the Y store. The results from the visual scans included shopper pathways, shopping time spent in different store sectors, conversion rates (that is, those observing RDS messages and buying the product), and time spent viewing screens. The results are also useful in determining advertising rates based upon screens being seen in general and in specific aisles
Shopper Discussion Groups
Eight shoppers were included in six separate testing groups (two tests per store per Phase). Each group met for a two-hour discussion. Group selection criteria included the following: all females, shop GS as their first grocery store choice, shoppers ranged in age from 25-60 and represented a mix of social grades, and included those with and without children. The purpose of these shopping group interviews was to determine awareness of and the influence upon shopping behavior as a result of RDS messages. In the case of GS, it was found that shoppers were generally looking for promotions when in-store, and that 58 percent of shoppers believe that in-store advertising and promotions (which includes RDS) influences what they buy (see Figure 8).
27

Figure 8.
28

ConclusionsMessages communicated via retail digital signage systems can have a meaningful impact upon consumer purchase behavior in retail stores. This Working Paper details the rationale for advertisers to adopt media channels capable of reaching consumers in-store; details the qualitative impact of RDS upon the consumer buying process and advances quantitative test results in support thereof; details the attributes of RDS as a new medium; presents RDS testing methodologies; and, finally, presents detailed insights into the testing methods and results achieved from two retail digital signage system deployments.
Future research should revolve around the following:
1. Establishing industry-wide accepted standards of measurement of effectiveness. This will occur through the development of mathematic modeling that can quickly analyze and interpret the data intersection between RDS messages and POS, supply chain, pricing optimization and other retail legacy systems.
2. Establishing industry-wide accepted ROI models. RDS deployments are expensive. While we have established in this Working Paper that RDS-delivered messages can have a meaningful impact on consumer shopping behavior, this impact must be substantial enough to justify an RDS investment.
3. Develop additional insights into the ramifications for CPG advertisers to justify a meaningful shift in advertising spend away from traditional media toward RDS.
4. Additional message testing to gain a deeper understanding regarding specific category impact resulting from RDS.•
29