wp1 key environmental challenges of the orange juice ... day... · wp1 – key environmental...
TRANSCRIPT

WP1 – Key environmental challenges of the
orange juice supply chain in Europe

INTRODUCTION
EU27 countries comprise the region that holds the largest
consumption of fruit juice in the world
2

INTRODUCTION
Orange is the most popular flavor (35% market share )
Carton dominates the packaging choice (60% of total volume
consumed), followed by PET (25%)
3

INTRODUCTION
4
Orange raw juice
from press
1. Orange juice NFC
(= direct juice)
Concentration process
to orange juice
concentrate (FCOJ)
Re-dilution to orange juice
2.Orange juice FC
(made from orange juice concentrate)
One common name = fruit juice but 2 categories(acc. to European Fruit Juice Dir.)

INTRODUCTION
FC (Frozen Concentrate) vs NFC (Not from Concentrate)
Ambient vs Chilled juices: Ambient products show a higher
consumption (about 5 times) than chilled juice
5

6
INTRODUCTION
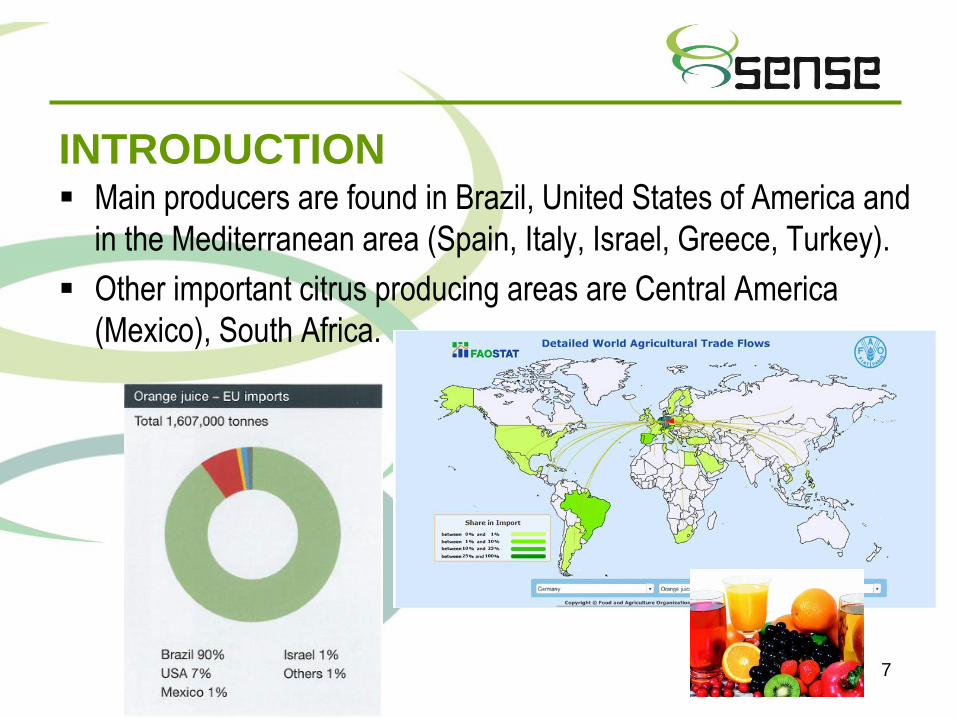
INTRODUCTION Main producers are found in Brazil, United States of America and
in the Mediterranean area (Spain, Italy, Israel, Greece, Turkey).
Other important citrus producing areas are Central America
(Mexico), South Africa.
7

Life cycle of the orange juice supply
chain
©AZTI-Tecnalia | Todos los derechos reservados
8
Store Storage Fertilisers Pesticides
Processing Packaging
Transport
Retailing
Fridge
End of life
Orange production
Processing Retailing Consumption End of life

Main impacts from life cycle stages
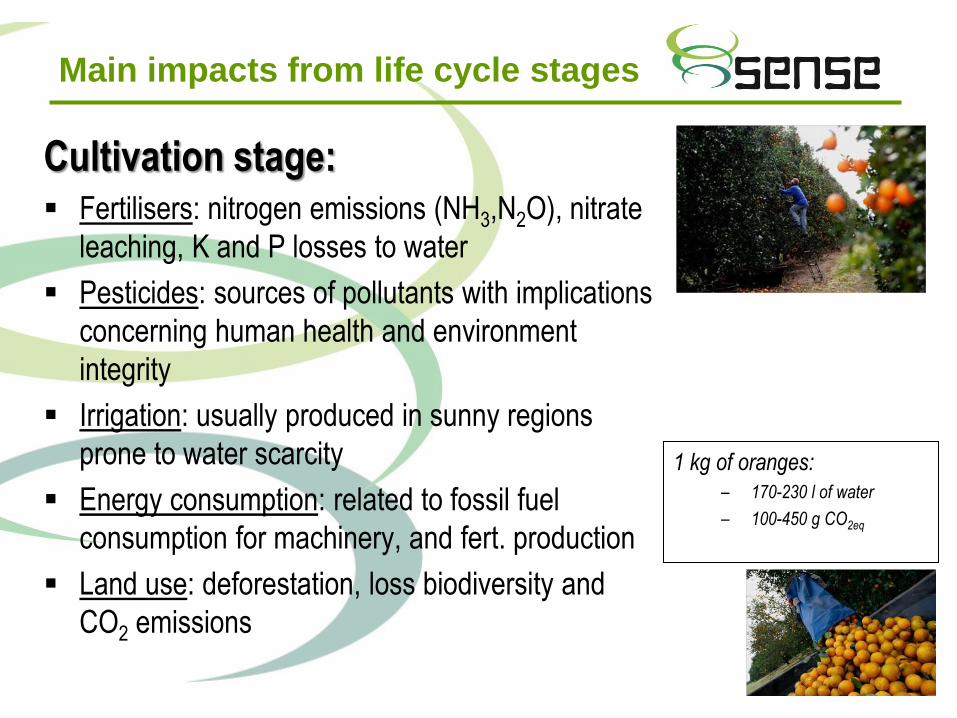
Main impacts from life cycle stages
Cultivation stage: Fertilisers: nitrogen emissions (NH3,N2O), nitrate
leaching, K and P losses to water
Pesticides: sources of pollutants with implications
concerning human health and environment
integrity
Irrigation: usually produced in sunny regions
prone to water scarcity
Energy consumption: related to fossil fuel
consumption for machinery, and fert. production
Land use: deforestation, loss biodiversity and
CO2 emissions
1 kg of oranges:
– 170-230 l of water
– 100-450 g CO2eq

Main impacts from life cycle stages
Transport to industry: Energy: related to fossil fuel consumption for
transport (CO2, NOx,…)
Juice processing: Energy consumption: electricity (machinery), fossil
fuel consumption (thermal processing).
Water & detergent use: water consumption/pollution
Wastewater and waste: by-products (animal feed,
natural fertilisers…)
Materials consumption: NFC is directly collected by refrigerator tankers ready to be
distributed.
FCOJ is packaged in LDPE bags and stored in tanks made of low-
carbon steel.
Co-products from orange processing
after juice concentration:
- Juice 65º Brix concentrate: 100kg
- Essence oils: 0.1 kg
- Aroma: 1.1 kg
- Evaporated water: 452 kg

Main impacts from life cycle stages
Bottling and packaging: Energy consumption: electricity (machinery),
Water and detergent use: water consumption
and pollution
Materials consumption:
Depends on packaging materials (Carton, Plastic,
Glass)
Reconstitution of 1kg of
orange juice :
- Electricity: 0.083kWh
- Natural gas: 0.0073m3

Main impacts from life cycle stages
Retailing: Energy for refrigeration: electricity
Refrigerant emissions: (HCFs)
Consumer: Energy for refrigeration: electricity
Fuel consumption: transport to/from store
Waste: Depend on packaging material and waste
management scenario:
Landfill
Incineration
Recycling

Impacts from LC stages: Overview
Global warming
Eutrophication
Acidification
Water scarcity
Toxicity
Land use
Resource depletion
Global warming
Eutrophication
Water scarcity
Ozone depletion
Resource depletion
Global warming
Acidification
Ozone depletion
Global warming
Acidification
Ozone depletion
Global warming
Acidification
Eutrophication
Toxicity
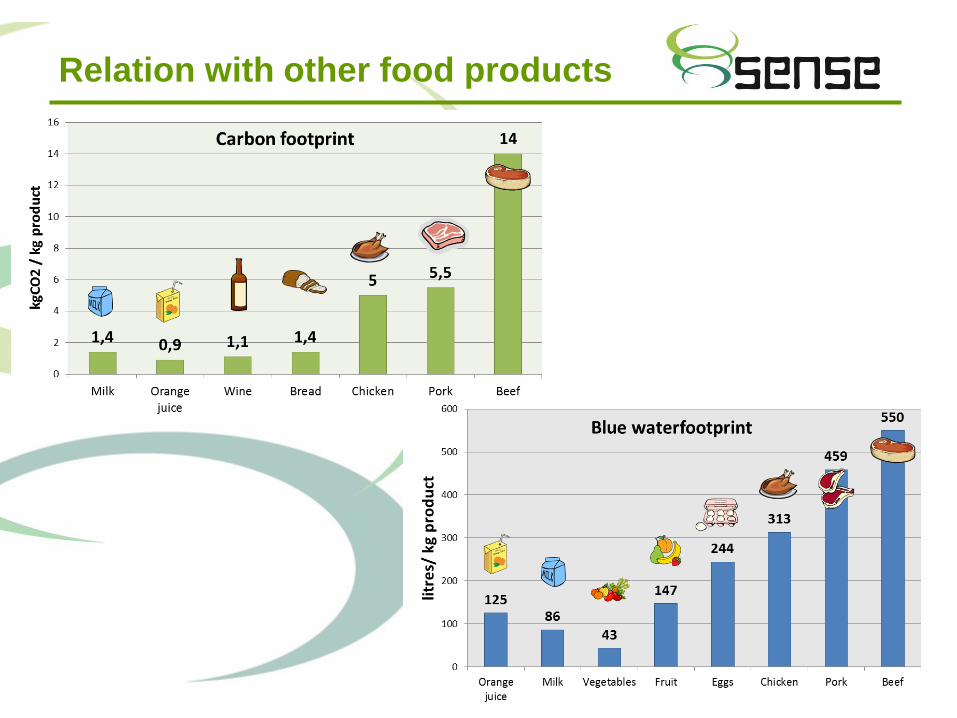
Relation with other food products

Regional differences
Key Impact Categories:
Main contribution to global warming originates from fuel consumption in the transport step, followed by the agriculture (use
of fertilizers, production of pesticides and herbicides) (Beccali et al, 2009). Same trend could be found for acidification
potential. Regarding eutrophication potential more than 80% of the total impact is due to the use and production of
fertilizers, pesticides and herbicides.
Transport and agricultural inputs are the most influential stages of the orange juice value chain.

Aspects to be considered
Origin of raw material (orange juice)
Packaging (Brick, glass, PET)
Trends in the consumption of JFC and NFC

Regional differences
Thank you for your attention