wp 3.2 deliverable 1: fisheries impact evaluation tool
TRANSCRIPT

BalticBOOST Appendix 1, WP 3.2 Deliverable 1 Final report 14 February 2017
Page 1 of 12
Theme 3: Physical loss and damage to seabed habitats
This is a deliverable from the BalticBOOST project that was coordinated by HELCOM and co-financed by the
European Union in 2015-2016 as part of the programme DG ENV/MSFD Action Plans/2016.
WP 3.2 Deliverable 1: Fisheries Impact Evaluation Tool (FIT) with
Application to Assess the Bottom Fishing Footprint in Western Baltic Sea
(ICES Subdivisions 22-24) Partner: 1Technical University of Denmark (DTU Aqua, DK)
Authors: Francois Bastardie1, Ole E. Eigaard1, J. Rasmus Nielsen1, Josephine Egekvist1, Niels
Hintzen2, Daniel van Denderen2,1, and Adriaan Rijnsdorp2. 2Wageningen University (WUR, NL)
Contents 1. Introduction ........................................................................................................................................... 2
2. Methods ................................................................................................................................................ 2
2.1 Methods – swept area intensity or swept area ratio .......................................................................... 2
2.2 Methods – trawling footprints ............................................................................................................ 3
2.3 Methods – Seabed integrity ................................................................................................................ 3
2.4 Methods – Origin of landings .............................................................................................................. 5
3. Results ................................................................................................................................................... 5
4. Discussion .............................................................................................................................................. 9
5. The ‘FisheriesImpactTool’ (FIT) Software ............................................................................................ 10
6. References ........................................................................................................................................... 11
BalticBOOST Appendix 1, WP 3.2 Deliverable 1 Final report 14 February 2017
Page 2 of 12
1. Introduction Fishing is one of the dominant anthropogenic activities affecting marine ecosystems (Halpern et al., 2008)
and there is global concern about adverse effects of particularly bottom trawls on seabed habitats and the
structure and functioning of benthic ecosystems (Dayton et al., 1995; Watling and Norse, 1998; Jennings
and Kaiser, 1998). We introduce here a workflow for relating the fishing pressure issued from the different
fishing activities to the response of some of the affected components (fish stocks, benthic habitats) in order
to address the needs for an evaluation tool of how fishing impacts the marine ecosystem. As a matter of
proof, the objective of the below analysis is to study the footprint of fishing with mobile bottom-contacting
gears in the Western Baltic Sea during 2010–2012 and compare it across habitat areas. Bottom fishing
distribution and intensity (calculated as swept area in a grid cell divided by surface area of a grid cell) is
analyzed at a resolution of 1×1 minute longitude and latitude for different EUNIS habitat types and main
gear groups, distinguishing between surface and subsurface footprints. Furthermore, an indicator of seabed
integrity is estimated at the same grid cell resolution. The characterized fishing pressure is further coupled
to information on fish and shellfish landings in order to make explicit the trade-off between impacts and
the revenue made out of the sales from the impacting fisheries. This coupling should support end-users and
practitioners further by incorporating the first steps of an economic dimension of the concerned fishing
practices. This tool can ultimately apply to any area as soon as the required area-specific data are available.
Subcomponents of the tool are also to be informed and downscaled to particular areas supported by
specific cases studies.
2. Methods
2.1 Methods – Wwept area intensity or swept area ratio Two parallel sources of data are set up depending on whether the raw or aggregated VMS data are used
(see diagram further below) while the workflow from aggregated VMS data is an approximation of the one
starting from the raw VMS data. Working on data issued by a data call from ICES, ICES WGSFD is generating
aggregated swept area ratio (SAR) on a c-square grid from the individual country aggregated VMS data. The
coverage obtained by the ICES data call is good given most of the European countries submitted data to
ICES (ICES WGSFD 2016). Alternatively, in the present application, raw VMS data were available and
extracted 2010-2012 VMS data from Denmark, Sweden and Germany, the three main active countries in
the western Baltic, were coupled to logbook data also based on methodology developed by Bastardie et al.
(2010) and Hintzen et al. (2012). Individual logbook observations for bottom trawling were assigned to
different functional gear groups (métiers) based on target species and gear type information (Eigaard et al.,
2016a). Relationships between gear dimensions and vessel size (e.g. trawl door spread and vessel power)
for each métier (Eigaard et al., 2016a) were used to assign the swept-width of gear to each logbook trip. In
addition to the total width of the gear used to estimate the surface impact, the subsurface impact was
estimated based on information on the dimensions of the gear components that penetrate into the seabed
(Eigaard et al., 2016a). The extended logbook data were combined with interpolated vessel tracks from
VMS data (Hintzen et al., 2010). In this way the total seabed area swept by a given vessel and fishing gear
over the three-year period could be estimated taking into account the gear footprint of the métiers. The
total area swept annually was estimated within grid cells of 1x1 minute longitude and latitude, which
corresponds to approx. 1.9 km2 at 56oN with cell size gradually increasing or decreasing the further south
or north it is located. The annual intensity was then calculated by dividing the total area trawled in each
grid cell with the size of the grid cell. The swept area ratio is calculated for surface and subsurface abrasion
separately.
BalticBOOST Appendix 1, WP 3.2 Deliverable 1 Final report 14 February 2017
Page 3 of 12
2.2 Methods – trawling footprints A western Baltic “Trawling Footprint” was estimated as an indicator of benthic fishing pressure in the area
(Eigaard et al. 2016b). This indicator shows the extent of fishing with mobile bottom-contacting gears, and
reflects the proportion of the total seabed area (management area or habitat type) that is trawled annually
during the period of analysis. Under the assumption of uniform distribution within grid cells the extent of
bottom trawled was calculated in two ways: (i) percentage of the grid cells of a management area or
habitat type (after standardization for differences in grid cell size) where any quantity of trawling has been
recorded irrespective of its intensity; (ii) area of the seabed trawled at least once a year. This first metric (i)
includes the untrawled parts of grid cells where trawling intensity was less than once a year. The second
metric (ii) was calculated as the sum of the surface area of the fully trawled grid cells (trawled >= 1 year−1)
plus the sum of the swept areas of partially trawled grid cells (trawled less than once a year). The first
footprint calculation (i) acknowledges that the data used (2010–2012) only covers a relatively short time-
step. If a longer time step would be considered the untrawled parts of the grid cells would be increasingly
likely to be trawled.
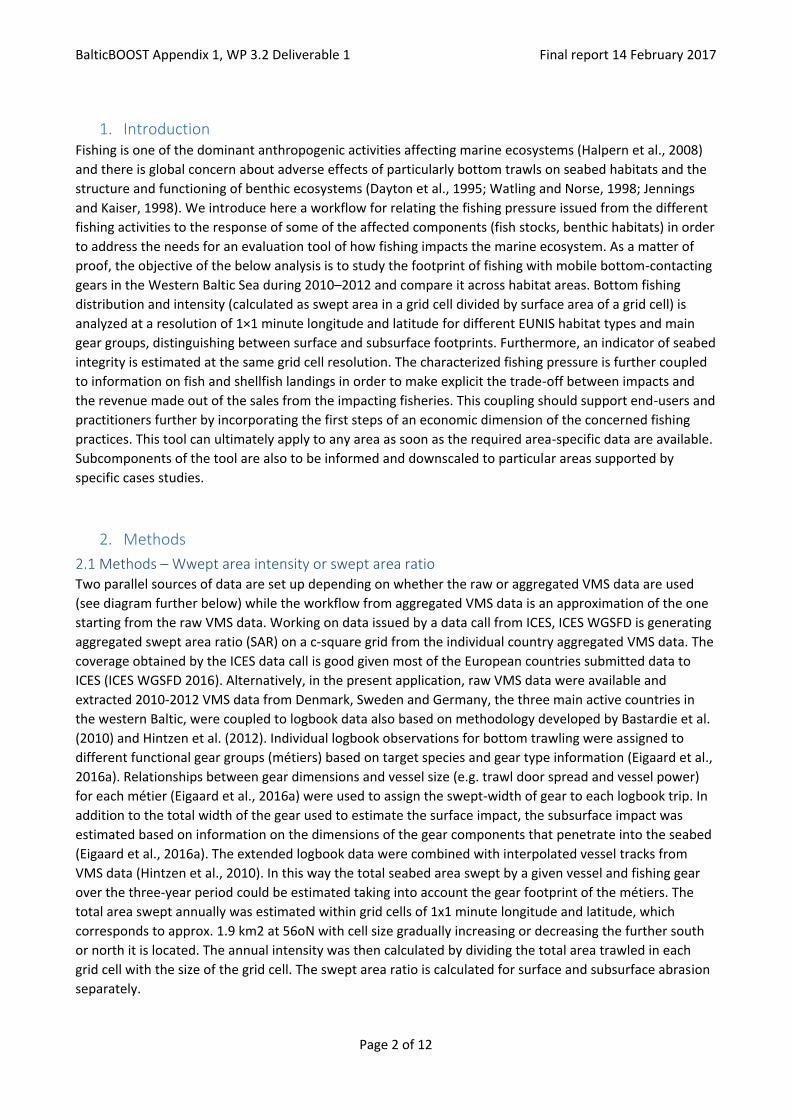
The Trawling Footprint was estimated by both methods described above as proportions of the different
EUNIS habitat type areas (Level 3) in the Western Baltic (Figure 1) where fishing with mobile bottom
contacting gear occurs. The footprints were estimated separately by gear type (Bottom otter trawl; Seine;
Dredge).
Figure 1. Distribution of EUNIS habitats (level 3) in the western Baltic Sea.
2.3 Methods – Seabed integrity The integrity of the seabed was estimated for the Western Baltic using the longevity approach developed in
BENTHIS WP2 (Eigaard et al. 2016b). The seabed integrity index (SBI) was estimated for grid cells of 1×1
min. longitude and latitude by combining the annual intensity estimates with the longevity composition of
the biomass from a reference (untrawled) area. The main principle of the approach is that if the reciprocal
of the trawling intensity, which reflects the average time interval between two successive trawling events,
is less than the life span of an organism, the integrity of the seabed habitat to provide a place to live for the

BalticBOOST Appendix 1, WP 3.2 Deliverable 1 Final report 14 February 2017
Page 4 of 12
organism may be compromised (Rijnsdorp et al., 2016). Because the reference longevity composition of the
different habitat types in the Western Baltic is not yet established, the assumption was made that the only
established reference longevity composition so far, from the North Sea (Eigaard et al. 2016b after Rijnsdorp
et al. 2014; Table xx; North Sea parameter estimates defined for EUNIS level 3 A5.1, A5.2, A5.3, and A5.4),
also applies for all the habitat types in the Baltic Sea. This is of course a substantial simplification and
consequently the index values and maps should be considered preliminary. Even so the SBI approach was
applied for the purpose of demonstrating methodology and output type:
SBI=(exp( α+β(ln〖1/t〗 ))⁄((1+exp( α+β(ln〖1/t〗 )))
With t is the trawling intensity and α and β are the coefficients of the logistic regression of the
cumulative biomass (specific to each habitat; e.g. Figure 2) against log of the life span of the taxa, with the
estimates given in Table 1.
Table 1: Alpha and beta parameter estimates obtained from Rijnsdorp et al (2016) to deduce the seabed
index (SBI) from habitat specific biomass longevity distributions (as described in Eigaard et al. 2016).
EUNIS Level3 α β
A5.1 4.77415 2.64516
A5.2 -7.6857 4.424618
A5.3 5.72813 4.151049
A5.4 4.11021 2.801233
Figure 2. The proportion of biomass of longevity classes (<1, 1–3, 3–10, and >10 years) of the infaunal
community (total) and two types of bioturbators (surface depositing, diffusive mixing) and two feeding
types (suspension feeding, deposit feeding) in three habitat types: (a) A5.1, Sublittoral coarse sediment;
(b) A5.2, Sublittoral sand; (c) A5.3, Sublittoral mud. From A. D. Rijnsdorp et al. ICES J. Mar. Sci.
2016;73:i127-i138.

BalticBOOST Appendix 1, WP 3.2 Deliverable 1 Final report 14 February 2017
Page 5 of 12
2.4 Methods – Origin of landings Within the tool, the spatial distribution of the retained catches (landings) declared in fishermen´s logbooks
was obtained following the methodology developed in Hintzen et al 2012, introducing VMStools (an R
package) for processing the VMS data and couple them to logbooks declaration in a most standard way.
VMStools is applied here and embedded in the present fisheries impact assessment tool to assign a piece of
the landings in kg per trip per ICES rectangle per fishing day evenly to the discrete positions (on the same
trip, rectangle and day) detected as fishing events by the analysis of the individual VMS tracks.
Alternatively, at a coarser scale, the international landings collected at the ICES rectangle level by EU STECF
can dispatch over the VMS fishing positions, with some limiting assumptions.
3. Results Fishing with mobile bottom-contacting gears is widely distributed with high intensities over the Western
Baltic and Kattegat (Figure 3, left). The entire eastern half of Kattegat has a high fishing pressure level with
annual intensities between 1 and 10, but also substantial areas of the Arkona Basin, north and south of
Bornholm and the most south-western part of the Baltic (Kiel and Mecklenburg Bay) has annual intensities
above 1. A few localized hotspots in these high-pressure areas have annual intensities above 10.
Disregarding the western Kattegat and the inner Danish waters most of the area shown has intensities
above 1. When estimating the subsurface intensity the same picture of pressure distribution emerges, but
with the intensities scaled substantially down (only the areas in Kattegat with intensities above 1 and
otherwise the high-pressure areas experience annual intensities from 0.1 to 1) (Figure 3, right).
Figure 3. Annual average fishing intensity (2010-2012) at the surface level (left; sediment abrasion < 2cm)
and subsurface level (right; abrasion ≥ 2 cm) for all bottom contacting gears from Denmark, Sweden and
Germany.
BalticBOOST Appendix 1, WP 3.2 Deliverable 1 Final report 14 February 2017
Page 6 of 12
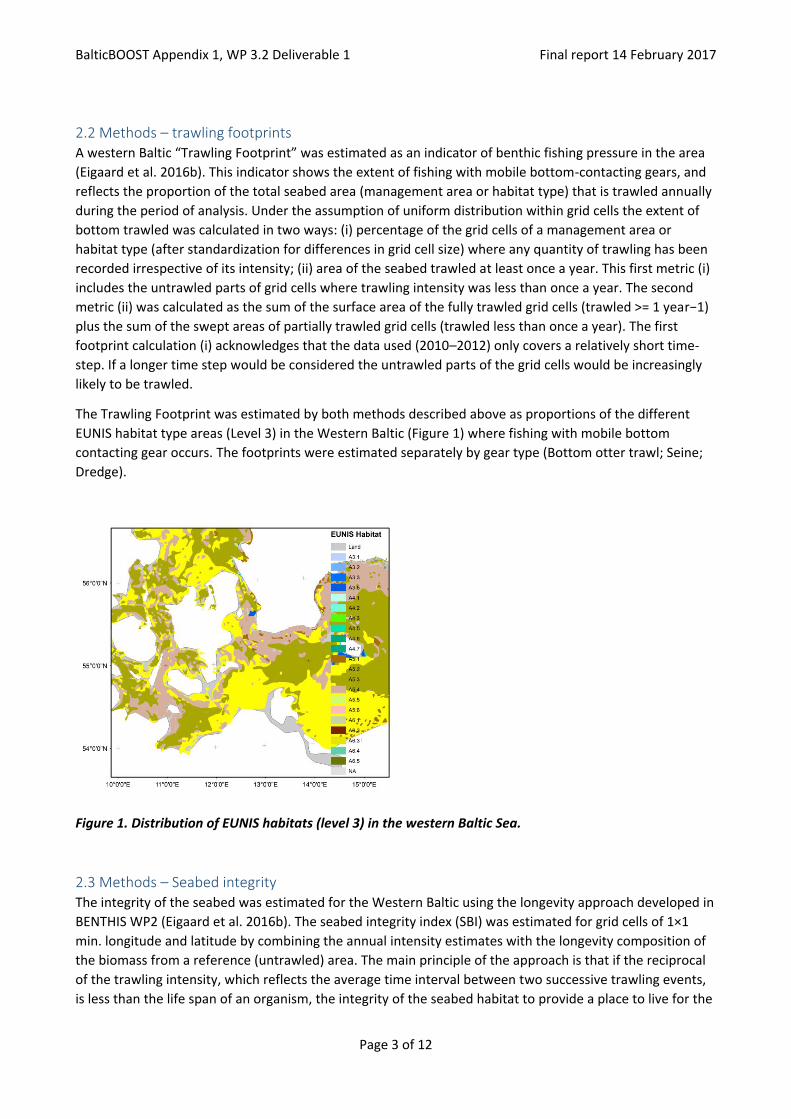
When separating the fishing pressure by gear type, it becomes clear that otter trawling is the main gear in
the area (Figure 4, left). Demersal seining takes place nearly exclusively in the Arkona Basin, the south-
eastern part of Mecklenburg Bight and a small part of western Kattegat (Figure 4, middle), whereas
dredging is restricted to Danish fjords, straits and coastal areas (Figure 4, right)
Figure 4. Annual average fishing intensity (2010-2012) with seabed impact at the surface level by main
gear groups. Left: Otter Trawl, middle: Demersal Seine, right: Dredge.
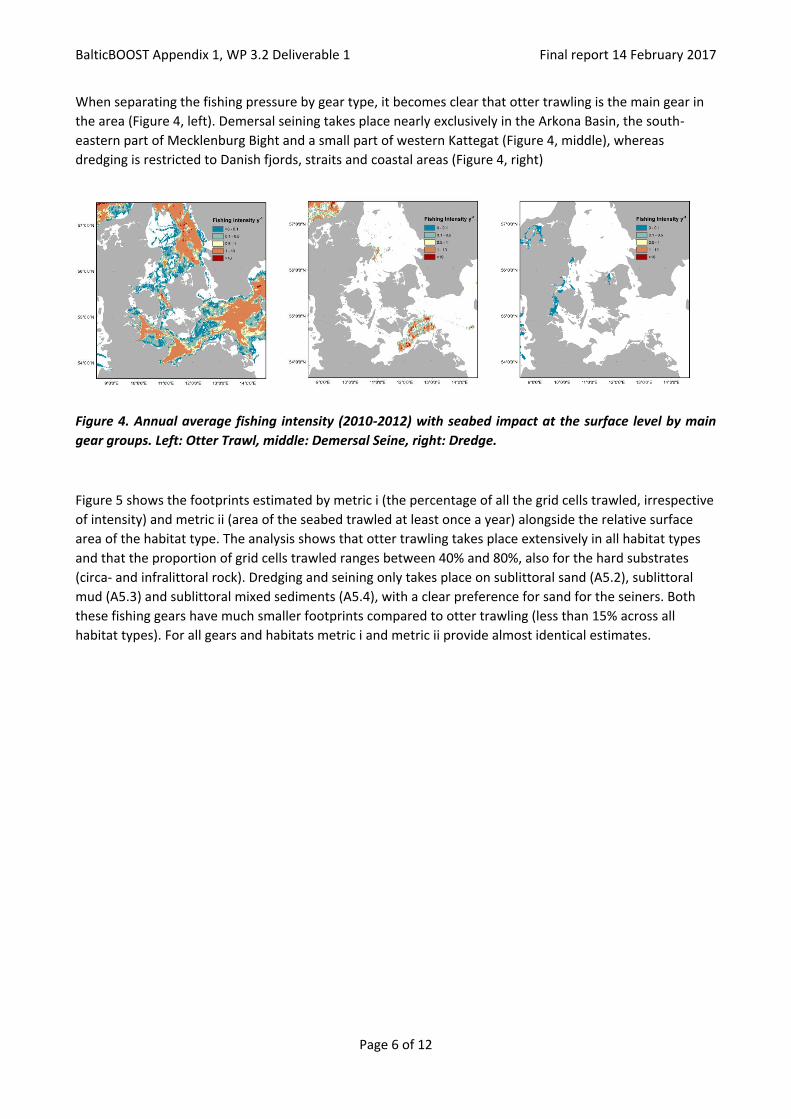
Figure 5 shows the footprints estimated by metric i (the percentage of all the grid cells trawled, irrespective
of intensity) and metric ii (area of the seabed trawled at least once a year) alongside the relative surface
area of the habitat type. The analysis shows that otter trawling takes place extensively in all habitat types
and that the proportion of grid cells trawled ranges between 40% and 80%, also for the hard substrates
(circa- and infralittoral rock). Dredging and seining only takes place on sublittoral sand (A5.2), sublittoral
mud (A5.3) and sublittoral mixed sediments (A5.4), with a clear preference for sand for the seiners. Both
these fishing gears have much smaller footprints compared to otter trawling (less than 15% across all
habitat types). For all gears and habitats metric i and metric ii provide almost identical estimates.
BalticBOOST Appendix 1, WP 3.2 Deliverable 1 Final report 14 February 2017
Page 7 of 12
Figure 5. Footprint per EUNIS habitat within SD 22-24 and per fishing activity (Dredge, Seine, Otter Trawl)
from Danish, Swedish and German fleets. The trawling footprint is estimated by metric i (the percentage
of all the grid cells trawled, irrespective of intensity, grey bars) and metric ii (area of the seabed trawled
at least once a year, white bars) and plotted alongside the relative surface area of each habitat type in
the studied area (black bars).
Seabed integrity estimated at the subsurface level revealed that most grid cells either have a low (<0.18) or
a high (>0.82) integrity (Figure 6). More intermediate values are only observed in smaller areas north of
Bornholm, in the Arkona Basin and in the Kiel and Mecklenburg Bays.

BalticBOOST Appendix 1, WP 3.2 Deliverable 1 Final report 14 February 2017
Page 8 of 12
Figure 6. Seabed integrity Index (SBI) values corresponding to the subsurface trawling intensities (after
Rijnsdorp et al, 2016, and Eigaard et al.2016, accepted) For the seabed integrity indicator, 0=all taxa
impacted and 1=no taxa impacted). The white areas show grid cells that were untrawled.
The importance of coupling the spatial occurrences of fishing to the logbook declaration was illustrated by
characterizing the cod spatial origin of the (retained) catches within the Baltic Sea made by a subset of the
Danish fishers (Figure 7, from Bastardie et al. 2016). Using recent development in the analysis of fisheries
data, in particular VMStools presented in Hintzen et al. (2012), we show that the fine spatial distribution of
the catches can be obtained by different type of gears. This is at a much lower geographical scale that it
was available so far (at best, the ICES rectangle) which creates useful new information on various fisheries
spatial impact–related aspects.
Figure 7. The Central Baltic Sea region with ICES area codings and bathymetry (in blue levels) are shown
together with the spatial origin of the 2012 cod landings in kg (red levels circles). Source: Bastardie et al.
2016.

BalticBOOST Appendix 1, WP 3.2 Deliverable 1 Final report 14 February 2017
Page 9 of 12
4. Discussion The maps of trawling intensity show a somewhat different picture for Kattegat and the Western Baltic area.
In Kattegat approximately half the area (western part) is untrawled or trawled at low intensities, whereas
practically all the eastern half is trawled at intensities above 10. This apparent either-or level of fishing
pressure most likely reflects that Nephrops trawling is the dominant fishery in Kattegat and that this
species is very abundant throughout the deeper soft-sediment parts (eastern half of Kattegat) but not
present at all in the shallower areas (western half).
In contrast, the western Baltic area has a more heterogeneous distribution pattern of fishing pressure with
intensive bottom trawling in localized areas, and medium to low-intensity trawling elsewhere. It is likely
that this heterogeneity in the western Baltic reflects certain morphological features, such as gradients in
bathymetry, changes in bottom type or the occurrence of untrawlable grounds. A second mechanism
generating trawling hotspots and heterogeneity is related to the patchiness in the distribution patterns of
the target fish and their prey (Rijnsdorp et al., 2011; Ellis et al., 2014). Cod is the dominating target species
in the Western Baltic and this species can be expected to be patchier in distribution than the Nephrops in
Kattegat.
The difference in the dominating target species of the two areas is also reflected in the subsurface trawling
intensity map, where it is clearly reflected that the gear-footprint of a Nephrops trawl in Kattegat has a
substantially higher proportion of subsurface impact than the gear-footprint of a cod trawl in the Western
Baltic (Eigaard et al., 2016a).
The analysis of footprints per habitat and gear type demonstrated that otter trawling takes place
extensively in all habitat types. The broad diversity of habitats trawled, ranging from muddy or sandy
sediments, via coarse and mixed sediments to rock and other hard substrata, is related to the wide range of
bottom trawls and technology that has evolved over time and allowed fishers to move into formerly
untrawlable habitats (Valdemarsen, 2001; Rijnsdorp et al., 2008; Eigaard et al., 2014). In contrast, demersal
seining in the area has a clear preference for sandy habitats, reflecting this gear type’s poorer ability to fish
on rougher bottom (Eigaard et al., 2016a).
For all gears and habitats metric (i) and metric (ii) provided almost identical footprint estimates, reflecting
that only a small part of the grid cells are fished at annual intensities less than 1. This means that the
Western Baltic bottom trawl fishery is very conservative in nature when it comes to choice of fishing
grounds and tends to fish the same grid cells across years (keeping in mind of course that the analysis only
covers the period from 2010-2012 and VMS obligation was extended from 2012 onwards to also cover
vessels larger than 12 meter).
In general the seabed integrity of grid cells was either high (>0.82) or low (<0.18). Areas with intermediate
seabed integrity were sparse (Figure 5). This dichotomy relates to the trawling intensity profile and the
longevity distribution of the benthic community. High seabed integrity will be restricted to grid cells with a
trawling intensity of less than 0.1 year−1, because taxa with a life span of >10 years comprise < 18% of the
biomass of the benthic community. It is only a narrow range of intensity (0.1–0 .5 year−1) for which SBI
takes middling/moderate values. Most cells have either high or low trawling intensity and so the SBI is
either high (>0.82) or low (<0.18), respectively.
It should, however, be highlighted that the seabed integrity estimated in this paper should be considered as
a first attempt. Due to a lack of benthic community information, the same longevity distribution
(extrapolated from soft-sediment habitats in the North Sea) was applied to all habitat types in the western
Baltic and Kattegat. It is very likely that the longevity distribution of the benthic community will differ
across habitats. Hence, the extrapolated critical trawling intensity from the North Sea (0.1 year−1) will not
BalticBOOST Appendix 1, WP 3.2 Deliverable 1 Final report 14 February 2017
Page 10 of 12
be appropriate for e.g. biogenic habitats, which are characterized by taxa with much longer life spans (Clark
et al., 2016). On the other hand, in habitats exposed to high natural variations, taxa with relatively short life
spans may dominate more. Hence, the critical trawling intensity may be refined when information on the
longevity distribution of the benthic community becomes available for different habitat types in the Baltic.
Also the use of trawling intensities with subsurface impact for estimating seabed integrity (based on the
North Sea soft-sediment community) may alternate with the use of surface intensities (e.g. in habitats
dominated by emergent fauna) according to improved information of habitat types and community
composition.
5. The ‘FisheriesImpactTool’ (FIT) Software FisheriesImpactTool is the tool delivering this assessment and has been developed by the WP3.2
BalticBOOST project based on the experience acquired during EU-FP7 BENTHIS and ICES Working Group on
Spatial Fisheries Data (WGSFD 2015). FIT answers requests about the need for guidance on how pressure
maps of fishing intensity contribute to an assessment of the state of seabed habitats. FIT is first used for
mapping the fishing surface and subsurface pressure on both the habitats and the fish communities. The
‘BENTHIS longevity approach’ is further deployed by FIT to relate, in a mechanistic quantitative approach,
the pressure to meaningful biological response and ecological impact indicators as described during the
joint ICES WKFBI workshop (ICES, 2016)/BalticBOOST Workshop held in Copenhagen in late June 2016. In
this approach, the longevity is the habitat-specific key species attribute (biological trait) used as a proxy for
defining the sensitivity of the habitats and benthic communities under pressure. Information on longevity
produces the index of seabed impact (SBI) when crossed with the information on the fishing pressure
(Rijnsdorp et al. 2016).
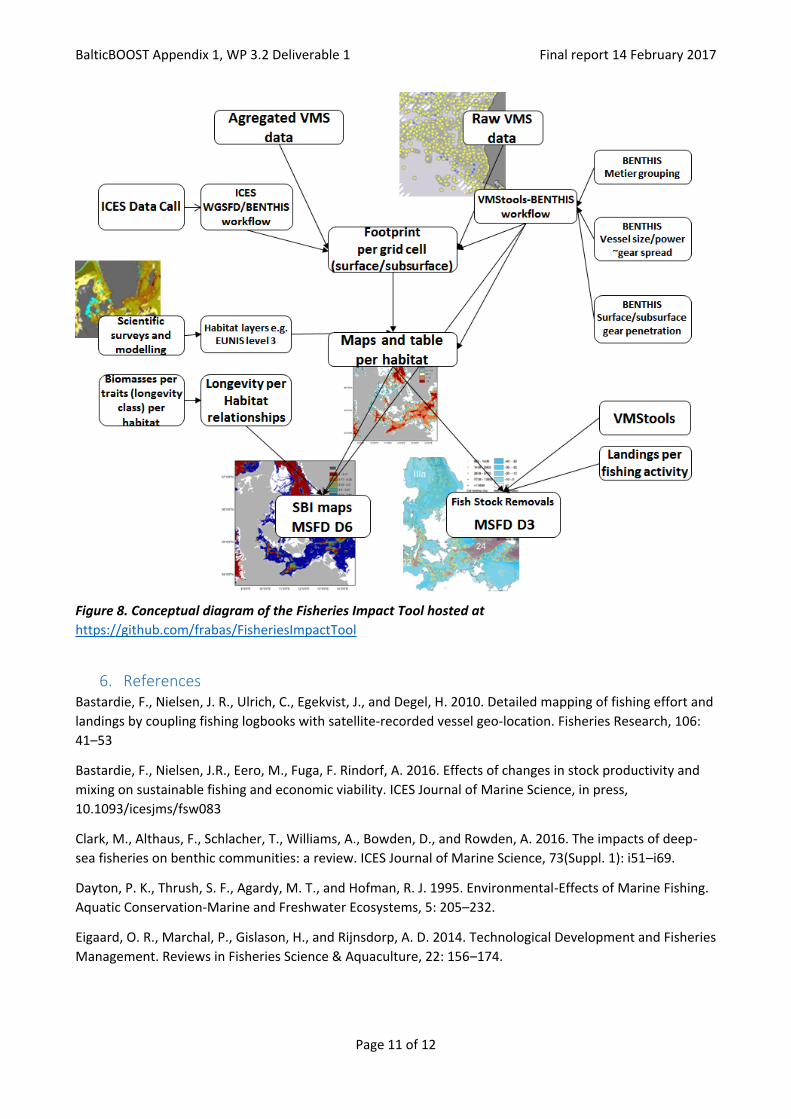
The tool workflow (see diagram, Figure 8) is designed to answer the question about how much pressure of
fishing with mobile bottom-contacting gears affects the benthic habitats and communities (MSFD
Descriptor 6) and the commercially-important fish and shellfish exploited in the area (in line with MSFD
Descriptor 3) by quantifying the spatial distribution of the fishing pressure and removals of fish from the
fisheries. The tool itself is a set of R routines hosted by a specific github repository online
(https://github.com/frabas/FisheriesImpactTool), and which further offers a way to track the versions of
the tool when amended (the github platform is an online service for versioning control system).
BalticBOOST Appendix 1, WP 3.2 Deliverable 1 Final report 14 February 2017
Page 11 of 12
Figure 8. Conceptual diagram of the Fisheries Impact Tool hosted at
https://github.com/frabas/FisheriesImpactTool
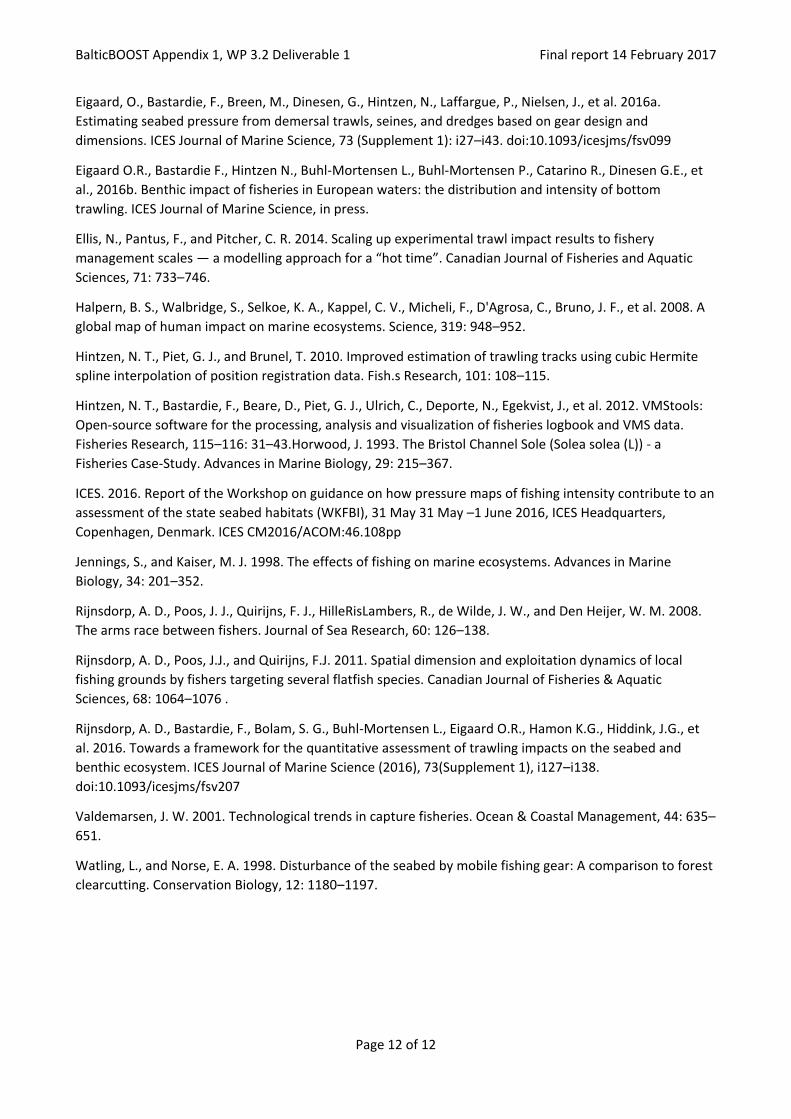
6. References Bastardie, F., Nielsen, J. R., Ulrich, C., Egekvist, J., and Degel, H. 2010. Detailed mapping of fishing effort and
landings by coupling fishing logbooks with satellite-recorded vessel geo-location. Fisheries Research, 106:
41–53
Bastardie, F., Nielsen, J.R., Eero, M., Fuga, F. Rindorf, A. 2016. Effects of changes in stock productivity and
mixing on sustainable fishing and economic viability. ICES Journal of Marine Science, in press,
10.1093/icesjms/fsw083
Clark, M., Althaus, F., Schlacher, T., Williams, A., Bowden, D., and Rowden, A. 2016. The impacts of deep-
sea fisheries on benthic communities: a review. ICES Journal of Marine Science, 73(Suppl. 1): i51–i69.
Dayton, P. K., Thrush, S. F., Agardy, M. T., and Hofman, R. J. 1995. Environmental-Effects of Marine Fishing.
Aquatic Conservation-Marine and Freshwater Ecosystems, 5: 205–232.
Eigaard, O. R., Marchal, P., Gislason, H., and Rijnsdorp, A. D. 2014. Technological Development and Fisheries
Management. Reviews in Fisheries Science & Aquaculture, 22: 156–174.
BalticBOOST Appendix 1, WP 3.2 Deliverable 1 Final report 14 February 2017
Page 12 of 12
Eigaard, O., Bastardie, F., Breen, M., Dinesen, G., Hintzen, N., Laffargue, P., Nielsen, J., et al. 2016a.
Estimating seabed pressure from demersal trawls, seines, and dredges based on gear design and
dimensions. ICES Journal of Marine Science, 73 (Supplement 1): i27–i43. doi:10.1093/icesjms/fsv099
Eigaard O.R., Bastardie F., Hintzen N., Buhl-Mortensen L., Buhl-Mortensen P., Catarino R., Dinesen G.E., et
al., 2016b. Benthic impact of fisheries in European waters: the distribution and intensity of bottom
trawling. ICES Journal of Marine Science, in press.
Ellis, N., Pantus, F., and Pitcher, C. R. 2014. Scaling up experimental trawl impact results to fishery
management scales — a modelling approach for a “hot time”. Canadian Journal of Fisheries and Aquatic
Sciences, 71: 733–746.
Halpern, B. S., Walbridge, S., Selkoe, K. A., Kappel, C. V., Micheli, F., D'Agrosa, C., Bruno, J. F., et al. 2008. A
global map of human impact on marine ecosystems. Science, 319: 948–952.
Hintzen, N. T., Piet, G. J., and Brunel, T. 2010. Improved estimation of trawling tracks using cubic Hermite
spline interpolation of position registration data. Fish.s Research, 101: 108–115.
Hintzen, N. T., Bastardie, F., Beare, D., Piet, G. J., Ulrich, C., Deporte, N., Egekvist, J., et al. 2012. VMStools:
Open-source software for the processing, analysis and visualization of fisheries logbook and VMS data.
Fisheries Research, 115–116: 31–43.Horwood, J. 1993. The Bristol Channel Sole (Solea solea (L)) - a
Fisheries Case-Study. Advances in Marine Biology, 29: 215–367.
ICES. 2016. Report of the Workshop on guidance on how pressure maps of fishing intensity contribute to an
assessment of the state seabed habitats (WKFBI), 31 May 31 May –1 June 2016, ICES Headquarters,
Copenhagen, Denmark. ICES CM2016/ACOM:46.108pp
Jennings, S., and Kaiser, M. J. 1998. The effects of fishing on marine ecosystems. Advances in Marine
Biology, 34: 201–352.
Rijnsdorp, A. D., Poos, J. J., Quirijns, F. J., HilleRisLambers, R., de Wilde, J. W., and Den Heijer, W. M. 2008.
The arms race between fishers. Journal of Sea Research, 60: 126–138.
Rijnsdorp, A. D., Poos, J.J., and Quirijns, F.J. 2011. Spatial dimension and exploitation dynamics of local
fishing grounds by fishers targeting several flatfish species. Canadian Journal of Fisheries & Aquatic
Sciences, 68: 1064–1076 .
Rijnsdorp, A. D., Bastardie, F., Bolam, S. G., Buhl-Mortensen L., Eigaard O.R., Hamon K.G., Hiddink, J.G., et
al. 2016. Towards a framework for the quantitative assessment of trawling impacts on the seabed and
benthic ecosystem. ICES Journal of Marine Science (2016), 73(Supplement 1), i127–i138.
doi:10.1093/icesjms/fsv207
Valdemarsen, J. W. 2001. Technological trends in capture fisheries. Ocean & Coastal Management, 44: 635–
651.
Watling, L., and Norse, E. A. 1998. Disturbance of the seabed by mobile fishing gear: A comparison to forest
clearcutting. Conservation Biology, 12: 1180–1197.