world journal of pharmaceutical research ananda et al
TRANSCRIPT

www.wjpr.net Vol 3, Issue 5, 2014.
1318
Ananda et al. World Journal of Pharmaceutical Research
FORMULATION DESIGN AND OPTIMIZATION OF MOUTH
DISSOLVING TABLETS OF TELMISARTAN USING SOLID
DISPERSION TECHNIQUE
*Ananda Chaudhary1, Mukesh Sangra
2, Sandeep Kumar
3
Department of Pharmaceutics Research Div., ASBASJSM College of Pharmacy, BELA
(Ropar), Punjab 140111 India
ABSTRACT
The purpose of this research was to formulate mouth dissolving tablet
of Telmisartan for rapid action, beneficial for patients having
difficulties in swallowing and in conditions where access to water is
difficult. Telmisartan is an antihypertensive drug used for the treatment
of hypertension. The crucial aspect in the formulation of mouth-
dissolving tablets is to mask the bitter taste and to minimize the
disintegration time while maintaining a good mechanical strength of
the tablet. Solid dispersion was prepared to increase the solubility and
dissolution rate of Telmisartan with Poloxamer188 (PXM188) by using
fusion method. Drug polymer interactions were investigated using
differential scanning calorimetry (DSC), x-ray diffraction (XRD) and
Fourier transform infrared spectroscopy (FTIR). For the preparation of Telmisartan mouth
dissolving tablets, its 1:3 solid dispersions with PXM188 was used with various synthetic
superdisintegrants (Croscarmellose sodium, SSG). In an attempt to construct a statistical
model for the prediction of wetting time, disintegration time and percentage friability, a 32
full factorial design was used to optimize the influence of the amounts of superdisintegrants.
The results indicate that the optimized tablet formulation provides a DT 45 sec, WT 65 sec,
cumulative percentage drug release 96.23% and acceptable friability (0.82%). Stability
studies of optimized formulation revealed that formulation is stable.
KEY WORDS: Telmisartan, PXM188, solid dispersion, Fusion method, Mouth dissolving
tablets, factorial design.
World Journal of Pharmaceutical Research SJIF Impact Factor 5.045
Volume 3, Issue 5, 1318-1333. Research Article ISSN 2277 – 7105
Article Received on
24 May 2014,
Revised on 19 June 2014,
Accepted on 14 July 2014
*Correspondence for
Author
Ananda Chaudhary
Department of Pharmaceutics
Research Div., ASBASJSM
College of Pharmacy, BELA
(Ropar), Punjab 140111 India.

www.wjpr.net Vol 3, Issue 5, 2014.
1319
Ananda et al. World Journal of Pharmaceutical Research
INTRODUCTION
Techniques that have commonly been used to improve dissolution and bioavailability of
poorly water-soluble drugs, in general, include micronization, the use of surfactant, and the
formation of solid dispersions.3 Chiou and Riegelman outlined 6 types of drug-carrier
interactions in solid-state dispersions: simple eutectic mixtures, solid solutions, glass
solutions and glass suspensions, amorphous precipitates, and compound or complex
formation. Other factors such as increased wettability, solubilization of the drug by the carrier
at the diffusion layer, and the reduction or absence of aggregation and agglomeration may
also contribute to increased dissolution. Telmisartan is a nonpeptide angiotensin receptor II
(Type- ATI) antagonist that causes inhibition of the action of angiotensin II on vascular
smooth muscle, which leads to a reduction in arterial blood pressure4. Telmisartan is 2-(4-
{[4-methyl-6-(1-methyl-1H-1, 3-benzodiazol-2-yl)-2-propyl-1H-1, 3-benzodiazol 1yl]
methyl} phenyl) benzoic acid. Studies show that Telmisartan is a partial agonist of PPAR-γ,
which is an established target for diabetic persons. This suggests that Telmisartan can
improve carbohydrate and lipid metabolism, as well as control insulin resistance without
causing the side effects that are associated with full PPAR-γ activators. Telmisartan has a
long duration of action, and has the longest half-life of any ARB (24 hours). The usually
effective dose of Telmisartan is 20, 40, 80 mg once daily. In cases where the target blood
pressure is not achieved, Telmisartan dose can be increased to a maximum of 80 mg once
daily5. The bioavailability of Telmisartan is poor about 45%, which due to extensive first pass
hepatic metabolism; the bioavailability can be increase by mouth dissolving formulation. So,
in order to enhance oral bioavailability, solubility enhancement can be achieved via solid
dispersion formation by using hydrophilic polymers. Among the carriers used in the
formation of solid dispersions, poloxamer188 (PXM188) is the most commonly used6. The
aim of the present study was to evaluate the physicochemical properties of solid dispersions
of Telmisartan in PXM188. In order to characterize the prepared dispersions, differential
scanning calorimetry (DSC), X-ray diffraction (XRD), and Fourier transform infrared
spectroscopy (FTIR) as well as dissolution and solubility studies were performed. Moreover,
a trial for the incorporation of the prepared solid dispersion in a mouth dissolving tablets was
made. A 32 full factorial design was used to study the effect of formulation variables on the
performance of these tablets7, 8
.

www.wjpr.net Vol 3, Issue 5, 2014.
1320
Ananda et al. World Journal of Pharmaceutical Research
MATERIALS AND METHODS
Telmisartan was gift from Kwality Pharmaceutical Pvt. Ltd, PXM188, croscarmellose
sodium and sodium starch glycolate were a gift from Signet Chemicals Pvt. Ltd., Mumbai.
Potassium Dihydrogen Orthophosphate, diSodium Hydrogen phosphate and microcrystalline
cellulose were supplied from Loba Chem Pvt. Ltd., Mumbai. Magnesium stearate was
supplied from Central Drug House Pvt. Ltd., Mumbai. Other reagents and organic solvents
used were of analytical grade. Buffer and its dilutions were prepared with double-distilled
water.
Preparation of Solid Dispersions
Solid dispersions of Telmsartan in PXM188 containing 5 different weight ratios (1:1, 1:3,
1:5, 1:7 and 1:9) were prepared by the fusion method. Telmisartan and poloxamer188 were
weighed according to different weighed ratios. Poloxamer188 was melted at 60ᴼ C.
Telmisartan was added to the molten polymer mixed well and cooled to room temperature to
obtain a solid mass. The solidified masses was crushed and passed through 40 mesh sieve.
The resulting solid dispersion was stored in desicator until further analysis9.
Phase Solubility Study
Solubility studies were performed according to the method described by Higuchi and
Connors10
. Excess amount drug and solid dispersion (equivalent to 20 mg drug) was added to
100 ml volumetric flask containing 25 ml distilled water. The system was agitated on a rotary
shaker for 24 h at 100 rpm maintained at room temperature and filtered. The filtrate was
suitably diluted and analyzed on a Spectrophotometer at 297 nm.
Dissolution Studies
Dissolution experiments were performed in triplicate in phosphate buffer pH 6.8 at 37ᴼ C
using dissolution apparatus II (paddle method) at a rotation speed of 75 rpm. Powdered
samples of each preparation equivalent to 20 mg of Telmisartan were added to the dissolution
medium. At appropriate time intervals, 5 ml of the mixture was withdrawn. The initial
volume was maintained by adding 5 ml of fresh dissolution medium. The removed samples
were assayed for Telmisartan content at 297 nm. The dissolution profiles were examined as
follows: the percentage of the drug dissolved after 30 min (PD30), and the dissolution
efficiency (DE %) parameter after 30 min. The dissolution efficiency can be defined as the
area under the dissolution curve up to a certain time. It is measured using the trapezoidal

www.wjpr.net Vol 3, Issue 5, 2014.
1321
Ananda et al. World Journal of Pharmaceutical Research
method and is expressed as a percentage of the area of the rectangle divided by the area of
100% dissolution in the same time.
Drug Content
Solid dispersions equivalent to 20 mg of Telmisartan were weighed accurately and dissolved
in suitable quantity of phosphate buffer (pH 6.8). The drug content was analyzed at 297 nm
by UV spectrophotometer (Shimadzu 1700). Each sample was analyzed in triplicate.
Fourier Transform Infrared Spectroscopy (FTIR)
FTIR spectra of pure drug, Poloxamer188 and solid dispersion were recorded on samples
prepared in KBr (2 mg sample in 200 mg KBr). The scanning range was 400 to 4000 cm−1
using FTIR Spectrophotometer.
Differential Scanning Calorimetry (DSC)
The DSC thermograms were recorded on a DSC (model 50, Shimadzu). Samples of 2 mg
weight were heated in hermetically sealed aluminum pans over a temperature range of 30˚C
to 300˚C at a constant rate of 10˚C/min under nitrogen purge (40 ml/min).
X-ray Diffraction (XRD)
XRD patterns were obtained using a CuKα monochromated radiation. Diffractograms were
run at a scanning speed of 8˚/min over a 2θ range of 0˚ to 80˚.
Preparation of Mouth Dissolving Tablets
Different Telmisartan mouth dissolving tablets were prepared according to the proportions
given in Table 1. The raw materials were passed through a screen (40 mesh) prior to mixing.
Powdered 1:3 solid dispersion, containing amount equivalent to 20 mg Telmisartan, was
mixed with the other excipients and compressed on a single-punch tablet machine equipped
with convex-faced 8-mm punches. The tablet weight was adjusted to 200 mg.
Experimental Design of Telmisartan Mouth Dissolving Tablets
A 32 full factorial design was used in order to investigate the joint influence of 2 formulation
variables. In this design, 3 factors are evaluated, each at 2 levels, and experimental trials are
performed at all 9 possible combinations8, 9
. The amounts of croscarmellose sodium (X1) and
SSG (X2) were selected as dependent variables. The wetting time, disintegration time and
percentage friability were selected as dependent variables. In addition, contour plots and
response surface plots were used to graphically represent the effect of the dependent

www.wjpr.net Vol 3, Issue 5, 2014.
1322
Ananda et al. World Journal of Pharmaceutical Research
variables. Statistical model incorporating interactive and polynomial terms is used to evaluate
the response11
. Y = b0 + b1X1 + b2X2 + b12X1X2 + b11 (X1)2 +b22 (X2)
2
(1) Where, Y is the dependent variable, b0 is the arithmetic mean response of the nine runs,
and b1 is the estimated coefficient for the factor X1. The main effects (X1 and X2) represent
the average result of changing one factor at a time from its low to high value. The interaction
terms (X1X2) show how the response changes when two factors are simultaneously changed.
The polynomial terms [(X1)2 and (X2)
2] are included to investigate nonlinearity. The
composition of the factorial design batches MDT1 to MDT9 is shown in Table 2.
Table1: Percentages of different ingredients used in preparation of Telmisartan mouth
dissolving tablets
Ingredients F1 F2 F3 F4 F5 F6
Solid dispersion (1:3) 80 80 80 80 80 80
Croscarmellose sodium 5 10 15 - - -
SSG - - - 5 10 15
Avicel pH 101 105 100 95 105 100 95
Aspartame 5 5 5 5 5 5
Talc 3 3 3 3 3 3
Mg. Stearate 2 2 2 2 2 2
Table 2: Composition of factorial design batches
Batch code
Variable levels in coded form D.T. W.T. Friability
X1 X2 Y1 (Sec) Y2 (Sec) Y3 (%)
MDT1 -1 -1 68 100 0.55
MDT2 0 -1 52 76 0.65
MDT3 +1 -1 41 52 0.96
MDT4 -1 0 60 65 0.60
MDT5 0 0 48 56 0.98
MDT6 +1 0 37 49 0.91
MDT7 -1 +1 35 44 0.82
MDT8 0 +1 24 36 0.92
MDT9 +1 +1 19 28 0.98
Coded Value
Actual Values
X1 X2
-1 2.5 2.5
0 5 5
+1 7.5 7.5
Where X1 indicates croscarmellose sodium and X2 indicates SSG

www.wjpr.net Vol 3, Issue 5, 2014.
1323
Ananda et al. World Journal of Pharmaceutical Research
Evaluation of the Prepared Tablets
The tablet geometry was determined by a means of a micrometer (Mityato, Japan), while the
tablet breaking strength (hardness) and the tablet friability were determined using Pfizer
hardness tester and Roche fribilator, respectively. The disintegration and wetting times were
measured according to the method described. Briefly, the disintegration time was measured
using a modified disintegration method. For this purpose, a cylindrical vessel was used in
which 10-meshscreen was placed in such way that only 2 ml of disintegrating or dissolution
medium would be placed below the sieve. To determine disintegration time, 6 ml of
phosphate buffer (pH 6.8), was placed inside the vessel in such way that 2 ml of the media
was below the sieve and 4 ml above the sieve. Tablet was placed on the sieve and the whole
assembly was then placed on a shaker. The time at which all the particles pass through the
sieve was taken as a disintegration time of the tablet. On the other hand, the wetting time was
measured as follows: A piece of tissue paper (12 cm x 10.75 cm) folded twice was placed in a
small petri dish (ID = 65 cm) containing 10 ml of phosphate buffer (pH 6.8). A tablet was put
on the paper, and the time for the complete wetting was measured. Three trials for each batch
were performed and the standard deviation was also determined.
RESULTS AND DISCUSSION
Solubility Measurement
Solubility data of pure drug and solid dispersion in phosphate buffer (pH 6.8) at 37±2ᴼ C
were shown in table 3 respectively and graph is represented in fig. 1.
Dissolution Studies
The dissolution profile of pure drug and solid dispersions were carried out in phosphate
buffer (pH 6.8). Dissolution release values are shown in table 4. From the data, it is event that
the onset of dissolution of pure drug was very low. The dissolution release from pure drug
was only 28.16% in 30 min. Therefore, this release suggested a strong need to enhance the
dissolution of pure drug. The presence of poloxamer188 increases the dissolution of pure
drug from the solid dispersion, which increases the dissolution rate as shown in fig 2. This is
clear from the dissolution studies that the solid dispersion (1:3) of Telmisartan:
Poloxamer188 gives fastest dissolution of drug as compared to other formulations. The
release profile showed 2 different phases of drug release. An initial rapid phase followed by a
slower one. These results could be attributed to the general phenomenon of particle size
reduction during the dissolution process medium by Poloxamer188. Solid dispersion
technique has improved the dissolution rate of Telmisartan to greater extent. The presence of

www.wjpr.net Vol 3, Issue 5, 2014.
1324
Ananda et al. World Journal of Pharmaceutical Research
PXM188 increases the dissolution rate of Telmisartan up to a drug to polymer ratio of 1: 3.
The DE30 value (i.e. dissolution efficiency value for 30 min) for SD2 (1: 3) was 70.52%,
whereas DE30 value for SD5 (1:9) was 65.09%. This might be due to the formation of viscous
boundary layer around the drug particles, leading to a decrease in the dissolution rate, as seen
in table 4.
Table 3: Solubility data of pure drug and solid dispersions in phosphate buffer (pH 6.8)
at 37±2 ᴼC
Formulation number Solubility(µg/ml)
Pure 27.86±0.001
SD1 147.54±0.006
SD2 286.60±0.006
SD3 172.65±0.008
SD4 184.23±0.003
SD5 195.34±0.002
Fig. 1: Solubility plot of pure drug and solid dispersion at 37± 2ᴼC
Fig. 2: Percent release of pure drug and from solid dispersion

www.wjpr.net Vol 3, Issue 5, 2014.
1325
Ananda et al. World Journal of Pharmaceutical Research
Table 4: Dissolution Parameters of pure drug and different Solid Dispersions
Time (min) Pure drug SD1 SD2 SD3 SD4 SD5
PD30 24.82±0.29 42.75±0.19 96.23±0.39 91.24±0.19 90.22±0.19 88.55±0.19
DE% 21.70 32.32 70.52 68.50 66.24 56.09
Fourier Transform Infrared Spectroscopy
The FTIR studies were performed to check the possible interaction of the drug with the
polymer. IR spectra of pure Telmisartan, Poloxamer and their formulations are shown in fig.
3 shows the FTIR of Telmisartan, poloxamer188, physical mixtue and their SD prepared by
fusion method. The spectrum of pure Telmisartan depict the characteristic peaks at 3058.74
cm-1
(aromatic C-H stretch), 2958.92 cm-1
(aliphatic C-H stretch), 1696.72 cm-1
(COOH
acid), 1599.53 cm-1
(aromatic C=C bend and stretch), 1461.11 cm-1
(C-H bend), 1383cm-1
(OH bending and C=O stretching of COOH acid), 742.30 cm-1
756.85 cm-1
(ring vibration
due to 1,2 disubstituted benzene), respectively.
The presence or absence s of characteristic peaks associated with specific structural group of
the drug molecules was noted. The chemical interaction has been reflected by changes in the
characteristic peaks of TEL, depending on the degree of interaction. The FT-IR spectra
showed shift in peaks and also absence of peaks of Poloxamer188 and TEL indicating
chemical interaction between poloxamer188 and TEL during fusion. The FTIR spectra
showed the absence of the characteristic peak of TEL at 3058 cm-1
(aromatic C-H stretch)
and shifting of 2958.92 cm-1
(aliphatic C-H stretch), 1461.11 cm-1
(C-H bend), 1383.43 cm-1
(OH bending and C=O stretching of – COOH acid). . There were no extra peaks observed in
the IR spectrum of solid dispersion. This established that the drug Telmisartan and
poloxamer188 used in the study showed no interaction and indicated that they were
compatible with each other.
DSC analysis
The DSC runs for Telmisartan, Poloxamer188 and solid dispersion (prepaerd by fusion
method) are shown in fig. 4. The DSC curve of pure TEL and PXM188 exhibited single
endothermic peaks at 268.46ᴼC (TEL) and 59.35ᴼC (PXM188) which corresponded to their
intrensic melting points. The characteristic peaks of PXM188 were invariably identified in
the DSC curves of SD, suggesting that the PXM188 was present in the same physical state
after making the SD powder by the fusion method. No charateristic melting peak of TEL was
identified in the DSC curves obtained from these PXM188 based SD formulation. This might

www.wjpr.net Vol 3, Issue 5, 2014.
1326
Ananda et al. World Journal of Pharmaceutical Research
be due to the higher polymer concentration and uniform distribution of drug in the crust of
polymer, resulting in complete miscibility of molten drug in polymer. Absence of peak for
the drug indicates that the drug is distributed homogenously in an amorphous state within in
the solid dispersions without any interaction.
XRD Analysis
XRD pattern of pure Telmisartan, poloxamer188 and solid dispersion are shown in fig. 5. The
XRD pattern of Poloxamer188 had two characteristic peaks of high intensity at 19.0ᴼ and
23.0ᴼ. In the X-ray diffractrogram of Telmisartan, sharp peaks at diffraction angle (2θ) were
6.0ᴼ, 14.0ᴼ, 18.0ᴼ, 23.0ᴼ, 25.0ᴼ indicate the presence of highly crystalline in nature and the
main peak at 6.0ᴼ was particularly more distinctive. It is known that the lack of a distinctive
peak of a drug in SD systems demonstrates that a high concentration of the drug is dissolved
in the solid state.
Fig. 3: FTIR spectra of( a) Telmisartan(b) PXM188 (c) 1:3 physical mixture of
Telmisartan/PXM188 (d) 1:3 solid dispersion of Telmisartan/PXM188.

www.wjpr.net Vol 3, Issue 5, 2014.
1327
Ananda et al. World Journal of Pharmaceutical Research
Fig. 4: (a) DSC of Telmisartan (b) PXM188 (c) 1:3 solid dispersion of Telmisartan /
PXM188
Position [°2Theta] (Copper (Cu))
10 20 30 40
Counts
0
5000
10000
TX-A
Position [°2Theta] (Copper (Cu))
10 20 30 40
Counts
0
2000
4000
6000 PMX-A
Fig. 5: XRD pattern of (a) Telmisartan (b) PXM188(c) 1:3 solid dispersion of
Telmisartan/ PXM188
Position [°2Theta] (Copper (Cu))
10 20 30 40
Counts
0
2000
4000
6000
8000 PX-A
www.wjpr.net Vol 3, Issue 5, 2014.
1328
Ananda et al. World Journal of Pharmaceutical Research
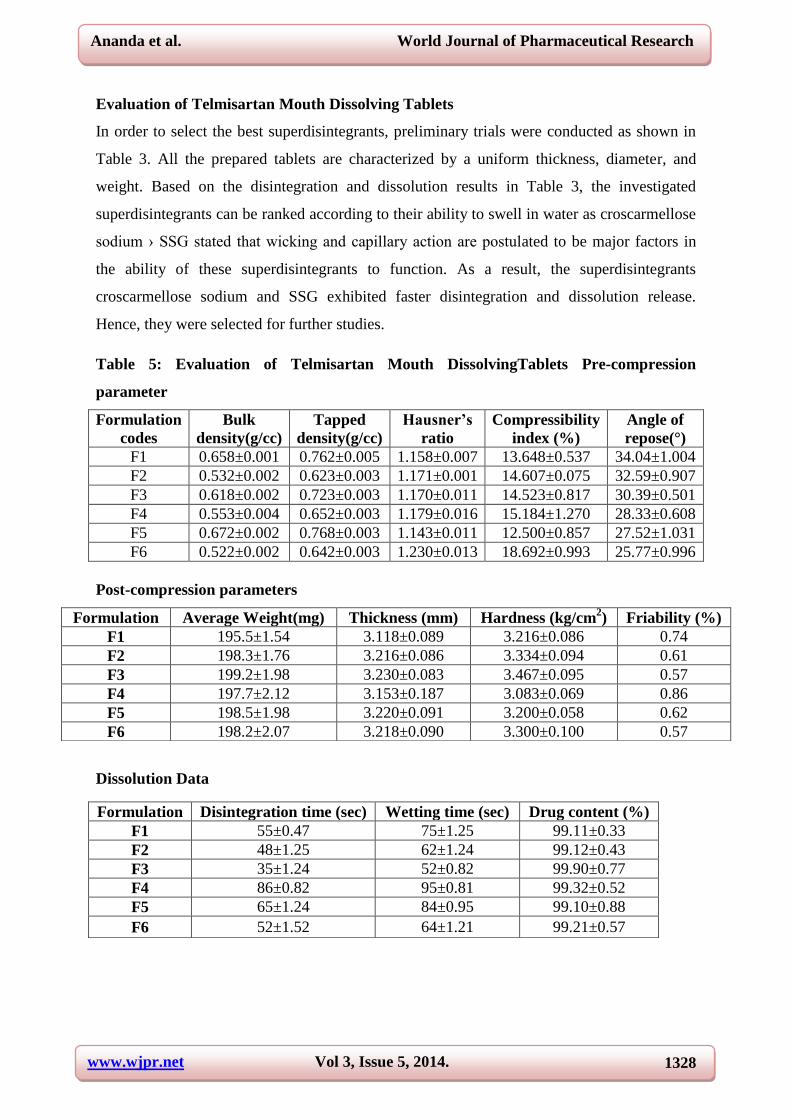
Evaluation of Telmisartan Mouth Dissolving Tablets
In order to select the best superdisintegrants, preliminary trials were conducted as shown in
Table 3. All the prepared tablets are characterized by a uniform thickness, diameter, and
weight. Based on the disintegration and dissolution results in Table 3, the investigated
superdisintegrants can be ranked according to their ability to swell in water as croscarmellose
sodium › SSG stated that wicking and capillary action are postulated to be major factors in
the ability of these superdisintegrants to function. As a result, the superdisintegrants
croscarmellose sodium and SSG exhibited faster disintegration and dissolution release.
Hence, they were selected for further studies.
Table 5: Evaluation of Telmisartan Mouth DissolvingTablets Pre-compression
parameter
Formulation
codes
Bulk
density(g/cc)
Tapped
density(g/cc)
Hausner’s
ratio
Compressibility
index (%)
Angle of
repose(°)
F1 0.658±0.001 0.762±0.005 1.158±0.007 13.648±0.537 34.04±1.004
F2 0.532±0.002 0.623±0.003 1.171±0.001 14.607±0.075 32.59±0.907
F3 0.618±0.002 0.723±0.003 1.170±0.011 14.523±0.817 30.39±0.501
F4 0.553±0.004 0.652±0.003 1.179±0.016 15.184±1.270 28.33±0.608
F5 0.672±0.002 0.768±0.003 1.143±0.011 12.500±0.857 27.52±1.031
F6 0.522±0.002 0.642±0.003 1.230±0.013 18.692±0.993 25.77±0.996
Post-compression parameters
Dissolution Data
Formulation Average Weight(mg) Thickness (mm) Hardness (kg/cm2) Friability (%)
F1 195.5±1.54 3.118±0.089 3.216±0.086 0.74
F2 198.3±1.76 3.216±0.086 3.334±0.094 0.61
F3 199.2±1.98 3.230±0.083 3.467±0.095 0.57
F4 197.7±2.12 3.153±0.187 3.083±0.069 0.86
F5 198.5±1.98 3.220±0.091 3.200±0.058 0.62
F6 198.2±2.07 3.218±0.090 3.300±0.100 0.57
Formulation Disintegration time (sec) Wetting time (sec) Drug content (%)
F1 55±0.47 75±1.25 99.11±0.33
F2 48±1.25 62±1.24 99.12±0.43
F3 35±1.24 52±0.82 99.90±0.77
F4 86±0.82 95±0.81 99.32±0.52
F5 65±1.24 84±0.95 99.10±0.88
F6 52±1.52 64±1.21 99.21±0.57

www.wjpr.net Vol 3, Issue 5, 2014.
1329
Ananda et al. World Journal of Pharmaceutical Research
Result of Factorial Design
Preliminary experiments for preparation of solid dispersion indicated that factors X1
(croscarmellose sodium), X2 (SSG) are effective variables on the disintegration time, wetting
time and percentage friability so were used for further systemic studies.
The statistical evaluation of dependent variables was performed by using design expert
version 8.0.7.1.Software. The regression analysis results (p value) of the variables on
disintegration time, wetting time and percentage friability of tablets are shown in table 6. The
ANOVA result of tablets is shown in table 7. According to p value, full model or reduced
model can be selected10
, so in the present study, full model having both significant and non
significant p values was used in obtaining dependent variables because the fitness of full
model to the system is better than reduced model. The significance level of coefficient was
found to be P > 0.05, hence they were omitted from the full models. On the other hand, the
coefficient of significant at P < 0.05, hence they were retained in the reduced models11
. The
outcomes for response parameter, i.e., DT, WT and % friability, were subjected to regression
analysis and statistical models were found to be significant. The high values of correlation
coefficient for DT, WT and % friability indicate a good fit. The coefficients for the equation
representing the quantitative effect of the dependent variables on DT, WT and % friability of
tablets are shown in table 6. The equations for each polymer can be generated by putting
values of coefficients in Eq. 1 in terms of coded factors. Coefficients with one factor indicate
the effect of that particular factor, while the coefficients with more than one factor and those
with second-order terms represent the interaction between those factors and the quadratic
nature of the phenomena, respectively. Positive sign of the term indicates positive (additive)
effect, while negative sign indicates negative (antagonistic) effect of the factor on the
response. The quadratic terms of X1 and X2 also had effect on DT, WT and % friability.
Fig. 6 and 7 show the counter plots and response surface plots for DT, WT and % friability,
respectively. The disintegration time, wetting time and % friability for the 9 patches (MDT1
Time (min) F1 F2 F3 F4 F5 F6
0 0±0 0±0 0±0 0±0 0±0 0±0
5 30.32±0.19 44.11±0.49 48.32±0.39 28.69±0.50 33.41±0.98 40.27±0.78
10 41.97±0.39 51.34±0.59 52.67±0.69 35.92±0.49 42.33±0.70 57.53±0.58
15 57.60±0.49 65.94±0.68 68.39±0.59 51.63±0.68 59.59±0.78 65.79±0.49
20 69.03±0.49 78.03±0.29 78.99±0.49 64.02±0.78 75.67±0.49 78.47±0.37
25 75.59±0.58 88.72±0.34 90.42±0.78 76.63±0.83 80.02±0.59 85.03±0.57
30 83.85±0.37 92.33±0.79 94.03±0.53 80.46±0.47 88.22±0.48 91.38±0.35

www.wjpr.net Vol 3, Issue 5, 2014.
1330
Ananda et al. World Journal of Pharmaceutical Research
to MDT9) showed a wide variation from 19-68 sec, 28-100 sec and 0.55-0.98% respectively
(Table 2). The data clearly indicate that the disintegration time, wetting time and % friability
values strongly depend on the selected dependent variables. The polynomial equations can be
used to draw conclusions after considering the magnitude of coefficient and the mathematical
sign it carries (positive or negative). It was observed that DT, WT and % friability were
dependent on the factors. There was linear decrease in the disintegration time, wetting time
and % friability with increase in concentration of both superdisintegrants (croscarmellose,
SSG).
Table 6: Summary of results of regression analysis
Response Coefficients estimates
b0 b1 b2 b12 b11 b22
D.T. 47.00 -11.00 -13.83 2.75 2.00 -8.50
p value 0.0001 0.0001 0.0123 0.0684 0.0013
W.T. 56.44 -13.33 -20.00 8.00 0.33 -0.67
p value 0.0088 0.0027 0.0580 0.9353 0.8713
%Friability 0.91 0.12 0.093 -0.062 -0.066 -0.097
p value 0.0390 0.0716 0.2316 0.9173 0.2004
Table 7: The result of analysis of variance
Response df Sum of Square Mean of Square F R2
DT Model 5 2056.92 411.38 400.26 0.9985
Residual 3 3.08 1.03
WT Model 5 3723.78 744.76 26.04 0.9775
Residual 3 85.78 28.59
% friability Model 5 0.17 0.035 4.96 0.8920
Residual 3 0.021 0.069
Fig.6: Counter plot for disintegration time, wetting time and % friability

www.wjpr.net Vol 3, Issue 5, 2014.
1331
Ananda et al. World Journal of Pharmaceutical Research
Fig.7: Response surface plot for disintegration time, wetting time and % friability
The desirability of the optimized batch was found to be 0.903 which was very close to the 1,
that means the targeted value of disintegration time, wetting time and % friability which we
selected for the optimized batch were closely achieved.
Fig.8: Desirability plots of telmisartan mouth dissolving tablets
The optimized formula suggested by the factorial design was croscarmellose sodium of
6.25% (12.5 mg) and SSG of 2.5% (5 mg). Hence, this formula was prepared and
characterized further.
Table 8: Optimized formulation of mouth dissolving tablets of Telmisartan
Ingredients Quantity per tablet (mg)
Solid dispersion(1:3) 80.00
CCS 12.5
SSG 5.00
Avicel PH101 92.5
Aspartame 5.00
Talc 3.00
Magnesium Stearate 2.00

www.wjpr.net Vol 3, Issue 5, 2014.
1332
Ananda et al. World Journal of Pharmaceutical Research
Table 9: Evaluation parameter of optimized batch
Parameters Optimized Formulation
Avg. weight (mg) 198.3±0.99
Thickness (mm) 3.20±0.38
Hardness (kg/sq.cm) 3.33±0.094
Drug content (%) 99.74±0.68
% CDR at 30 min 96.23±0.30
DT (Sec) 45±0.34, WT (Sec) 65±0.86, Friability (%) 0.81±0.35
CONCLUSION
The results of 32 full factorial design revealed that the amount of croscarmellose sodium and
sodium starch glycolate significantly affect the dependent variables such as disintegration
time, wetting time and percentage friability. Thus it is concluded that by adopting the
systematic formulation approaches, an optimum point can be reached in the shortest time
with minimum effort.
ACKNOWLEDGEMENT
This research was supported by Department of Pharmacy, ASBASJSM College of Pharmacy,
Bela by providing the facilities and requirement of research. I wish to thank that help during
this research work Asst. Prof. Dr. Shailesh Sharma.
REFERENCES
1. Prashant B Pawar, vinash G Mansuk1, Kuldip H Ramteke, Y P Sharma, Sagar N Patil.
Mouth Dissolving Tablets. Int. J. of Herbal Drug Res, 2011; 1: 22-29.
2. Divate S, Kavitha K, Sockan GN. Fast Disintegrating Tablets. An Emerging Trend; Int. J.
Pharm. Sci. Rev. & Res, 2011; 18-22.
3. Sucheta Bhise, Dyandevi Mathure, Mithun V.K. Patil and Rajendra D. Patankar.
Solubility Enhancement of Antihypertensive Agent by Solid Dispersion Technique. Int. J
of Pharm & Life Sci, 2011: 2: 970-975.
4. Vishal Dhiman, Gaurav Jain, Vaibhav Jagtap, R.V.Sheorey. Formulation and In-vitro
Evaluation of Fast Dissolving Tablets of Telmisartan. Int. J. of Pharm. & Life Sci, 2012:
3: 2159-2164.
5. Maulesh Vyas, Arpita jaiswal , Nisha Upadhyay, Dr. Atanu Kumar Behera. Formulation
and Development of Solubility Improvised Complex of Telmisartan using Various
Techniques. Int. J of Universal Pharma and Bio Sci, 2014: 3.

www.wjpr.net Vol 3, Issue 5, 2014.
1333
Ananda et al. World Journal of Pharmaceutical Research
6. Kaushal Patel, Ashwini Rajendra. Design and Evaluation of Mouth Dissolving Tablets of
Antihypertensive Drug Telmisartan. Int. J of Pharm Tech Res, 2012: 4; 715-724.
7. Schwartz BJ, Connor RE. Optimization Technique in Pharmaceutical Formulations and
Processing, Drugs and Pharmaceutical Sciences. Marcel Dekker, Inc, New York, 1996:
727-754.
8. Bolten S. Optimization Techniqes in Pharmaceutical Statistics Practical and Clinical
Applications. Marcel Dekker Inc, New York. 1997: 80; 308-337.
9. A. Ramu, s. Vidyadhara, n. Devanna, ch. Anusha and j. Keerthi. Formulation and
Evaluation of Rosuvastatin Fast Dissolving Tablets. Asian Journal of Chemistry, 2013:
25; 5340-534.
10. Mowafaq M. GAreeb, Alaa A. Abdulrasool, Ahmed A. Hussein and Mohammed I.
Noordin. Kneading Technique for Preparation of Binary Solid Dispersion of Meloxicam
with Poloxamer188. AAPS Pharm Sci Tech, 2009: 10; 1206-1215.
11. Omaima A. Sammour, Mohammed A. Hammad, Nagia A. Megrab and Ahmed S. Zidan.
Formulation and Optimization of Mouth Disolving Tablets Containing Rofecoxib Solid
Dispersion. AAPS Pharm Sci Tech, 2006: 7 (2); E1-E9.
12. Narmada GY, Mohini K, Prakash Rao B, Gowrinath DXP, Kumar KS. Formulation,
Evaluation and Optimization of Fast Dissolving Tablets Containing Amlodipine Besylate
by Sublimation Method. ARS Pharma, 2009: 50; 129-144.