world fertility report 2013 fertility at the extremesworld fertility report 2013: fertility at the...
TRANSCRIPT
So
ci
al
A
ff
ai
rs
E c o n o m i c &
United Nations
World Fertility Report2013
Fertility at the Extremes
E c o n o m i c &
World Fertility Report 2013: Fertility at the Extremes
United Nations
S o
c i a
l A f f a
i r s

This page is intentionally left blank
ST/ESA/SER.A/331
Department of Economic and Social Affairs Population Division
World Fertility Report 2013: Fertility at the Extremes
United Nations New York, 2014
DESA The Department of Economic and Social Affairs of the United Nations Secretariat is a vital interface between global policies in the economic, social and environmental spheres and national action. The Department works in three main interlinked areas: (i) it compiles, generates and analyses a wide range of economic, social and environmental data and information on which States Members of the United Nations draw to review common problems and take stock of policy options; (ii) it facilitates the negotiations of Member States in many intergovernmental bodies on joint courses of action to address ongoing or emerging global challenges; and (iii) it advises interested Governments on the ways and means of translating policy frameworks developed in United Nations conferences and summits into programmes at the country level and, through technical assistance, helps build national capacities.
Note The designations employed in this report and the material presented in it do not imply the expression of any opinion whatsoever on the part of the Secretariat of the United Nations concerning the legal status of any country, territory, city or area or of its authorities, or concerning the delimitation of its frontiers or boundaries. This publication has been issued without formal editing.
Suggested citation: United Nations, Department of Economic and Social Affairs, Population Division (2014). World Fertility Report 2013: Fertility at the Extremes (United Nations publication). ST/ESA/SER.A/331 UNITED NATIONS PUBLICATION Copyright © United Nations 2014 All rights reserved
iii
PREFACE
The Population Division of the Department of Economic and Social Affairs of the United Nations
Secretariat is responsible for providing the international community with up-to-date and impartial information on population and development. The Population Division provides guidance on population and development issues to the United Nations General Assembly, the Economic and Social Council and the Commission on Population and Development, and undertakes regular studies on population estimates and projections, fertility, mortality, migration, reproductive health, population policies and population and development interrelationships.
As part of its work on fertility, the Population Division monitors levels and trends in age and parity
patterns of fertility and its proximate determinants, such as marriage and contraceptive use, collects and analyses information on the relationship between fertility and development, and provides substantive support to intergovernmental discussions at the United Nations on the topics of fertility, family planning and development.
World Fertility Report 2013: Fertility at the Extremes is the fifth in a series and focuses on trends in
fertility over the past 20 years and key factors underlying these trends for countries at the extremes of fertility: 66 countries with more than 3.2 children per woman in 2005-2010 and 70 countries with 2.0 children per woman or less in 2005-2010. The data presented are from World Population Prospects: The 2012 Revision, the official United Nations publication of population estimates and projections. Country data are taken from the same report, other United Nations sources or national sources, as appropriate.
This report was prepared by Ms. Petra Nahmias with substantive inputs from Mr. Stephen Kisambira
and Ms. Ann Biddlecom. Ms. Donna Culpepper and Ms. Natalia Devyatkin provided editorial support. Ms. Francesca Perucci reviewed and provided helpful comments on the draft report.
The World Fertility Report series as well as other population information may be accessed on the
Population Division’s website at www.unpopulation.org. For further information concerning this publication, please contact the office of the Director, Population Division, Department of Economic and Social Affairs, United Nations, New York, 10017, USA, telephone (212) 963-3209, fax (212) 963-2147, email: [email protected]

v
CONTENTS P
PREFACE ........................................................................................................................................................ iii EXPLANATORY NOTES .................................................................................................................................... vii KEY FINDINGS ................................................................................................................................................ viii INTRODUCTION .............................................................................................................................................. 1 Chapter I. LOW FERTILITY ............................................................................................................................. 3
A. The transition to below-replacement fertility ........................................................................... 5 B. Fertility decline at young and old ages ..................................................................................... 7 C. Completed fertility and childlessness ....................................................................................... 13 D. Childbearing and marriage ....................................................................................................... 15 E. Fertility projections ................................................................................................................... 20 F. Consequences of low fertility ................................................................................................... 21 G. Policy approaches to low fertility ............................................................................................. 22 II. HIGH FERTILITY ............................................................................................................................. 27 A. Changes in total fertility and age-specific fertility rates ........................................................... 27 B. Fertility projections .................................................................................................................. 36 C. Changes in fertility timing, marriage and contraceptive use .................................................... 37 D. Fertility decline and socio-economic development .................................................................. 43 E. Consequences of high fertility .................................................................................................. 47 F. Policy approaches to high fertility ............................................................................................ 48 CONCLUSION .................................................................................................................................................. 52
REFERENCES .................................................................................................................................................. 53
ANNEXES ....................................................................................................................................................... 61
FIGURES
I.1. Levels of total fertility in low-fertility countries, 2005-2010 .................................................. 4 I.2. Trends in total fertility among current low-fertility countries, 1950-2010 ............................... 6 I.3. Adolescent birth rate in 1990-1995 and 2005-2010 and adolescent birth rate
as a percentage of total fertility in 2005-2010, low-fertility countries ...................................... 8 I.4. Mean age at first birth, around 1994 and latest point available, low-fertility countries ........... 9 I.5. Number of births per 1,000 women aged 40-44, 1990-1995 and 2005-2010, low-fertility countries 10 I.6. Proportion of total fertility attributable to births to women aged 40-44, 1990-1995 and
2005-2010, low-fertility countries ............................................................................................ 11 I.7. Age-specific fertility rates among low-fertility countries by region, 2005-2010...................... 12 I.8. Percentage of women aged 40-44 who are childless, around 1994 and latest point available,
low-fertility countries .............................................................................................................. 14 I.9. Percentage of women aged 40-44 who are childless or with three or more children, latest
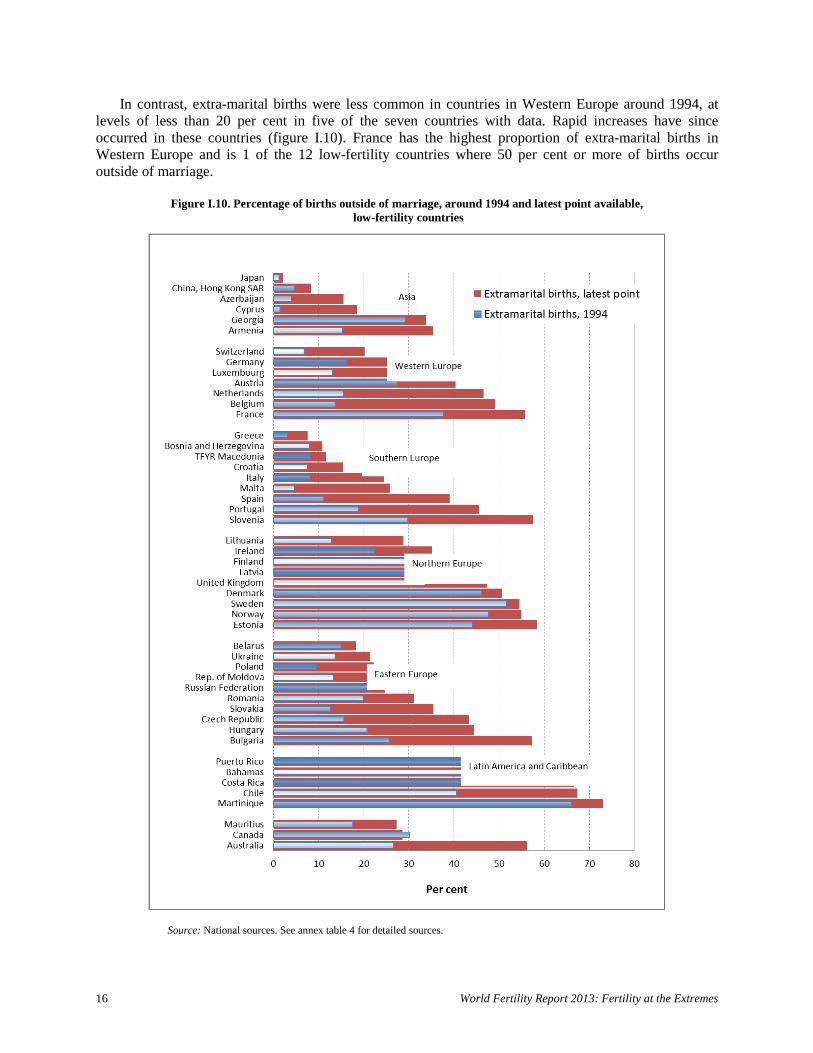
point available, low-fertility countries ..................................................................................... 15 I.10. Percentage of births outside of marriage, around 1994 and latest point available, low-fertility
countries ................................................................................................................................... 16 I.11. Female mean age at first marriage, around 1994 and latest point available, low-fertility countries 18 I.12. Percentage of women aged 40-44 who never married, around 1994 and latest point available, low-fertility countries ............................................................................................................... 19
vi
I.13. Total fertility for countries by major area, estimates for 2005-2010 and projections for 2030-2035, low-fertility countries ............................................................................................ 20
I.14. Old-age dependency ratio, 1995 to 2035, low-fertility countries ............................................. 22 I.15. Percentage of low-fertility countries with government policies on fertility levels by type of
policy, 1996 and 2013 ............................................................................................................. 23 II.1. Levels of total fertility in high-fertility countries, 2005-2010 .................................................. 28 II.2. Maximum fertility and onset of fertility decline among high-fertility countries ...................... 29 II.3. Fertility decline in high-fertility countries from 1994 to 2010 ................................................. 31 II.4. Adolescent birth rates in 1990-1995 and 2005-2010, high-fertility countries .......................... 32 II.5. Birth rate of women aged 40-44 in 1990-1995 and 2005-2010, high-fertility countries .......... 33 II.6. Percentage change in the birth rates of adolescents and women aged 40-44 between 1990-1995
and 2005-2010, high-fertility countries .................................................................................... 34 II.7. Percentage decline in total fertility attributed to change in birth rates among women aged
15-19 and 40-44, 1990-1995 to 2005-2010, high-fertility countries ........................................ 36 II.8. Total fertility for countries, 2005-2010 and projections for 2030-2035, high-fertility countries 37 II.9. Adolescent birth rate and mean age at first marriage and first birth, selected high-fertility
countries, 1990s to latest data available .................................................................................... 39 II.10. Contraceptive prevalence rate in 1994 and 2014, high-fertility countries ................................ 40 II.11. Change in total fertility between 1990-1995 and 2005-2010 and change in contraceptive
prevalence rate between 1994 and 2010, high-fertility countries ............................................. 41 II.12. Unmet need for limiting and for spacing, latest data available, high-fertility countries ........... 43 II.13. Proportion of urban population and years of school life expectancy for females among
high-fertility countries in the quartiles with longest and shortest durations between the timing of peak fertility and the onset of fertility transition, high-fertility countries ............................ 45
II.14. Infant mortality and contraceptive prevalence among high-fertility countries in the quartiles with longest and shortest durations between the timing of peak fertility and onset of the fertility transition, high-fertility countries ............................................................................................. 46
II.15. Percentage of high-fertility countries with government policies on fertility levels by type of policy, 1996 and 2013 ............................................................................................................. 49
ANNEX TABLES
1. Indicators and data sources ...................................................................................................... 61 2. Female mean age at first birth around 1994 and the most recent year, low-fertility countries
with data for both periods ......................................................................................................... 62 3. Completed fertility: Women aged 40-44 childless and with three or more children,
low-fertility countries with data for both periods ..................................................................... 63 4. Percentage of births outside marriage, around 1994 and the most recent year, low-fertility
countries with data for both periods ......................................................................................... 65 5. Maximum fertility between 1950 and 2010 and onset of fertility transition in high-fertility
countries ................................................................................................................................... 66 6. Decline in total fertility in high-fertility countries between 1994 and 2010 ............................. 67 7. Female mean age at first marriage and age at first birth around 1994 and the most recent
year, high-fertility countries with data for both periods ........................................................... 68
vii
EXPLANATORY NOTES The following symbols have been used in the tables throughout this report:
Two dots (..) indicate that data are not available or are not reported separately. A hyphen (-) indicates that the item is not applicable. A minus sign (-) before a figure indicates a decrease. A full stop (.) is used to indicate decimals. Use of a hyphen (-) between years, for example, 1995-2000, signifies the full period involved. Numbers and percentages in tables do not necessarily add to totals because of rounding.
References to countries, territories and areas: The designations employed and the material in this publication do not imply the expression of any opinion whatsoever on the part of the Secretariat of the United Nations concerning the legal status of any country, territory or area or its authorities, or concerning the delimitation of its frontiers or boundaries. The term “country” as used in this publication also refers, as appropriate, to territories or areas. Names and compositions of geographical areas follow those of “Standard country or area codes for statistical use” (ST/ESA/STAT/SER.M/49/Rev.3), available at http://unstats.un.org/unsd/methods/m49/m49.htm.
viii
KEY FINDINGS
• Fertility has declined significantly since the 1994 International Conference on Population and Development, yet 66 countries remain with high fertility levels (more than 3.2 children per woman). The number of low-fertility countries (with 2.0 children per woman or less) has increased from 51 countries at the time of the 1994 ICPD to 70 countries today.
• High-fertility countries are increasingly concentrated in sub-Saharan Africa (45 out of 66 high-fertility countries) while low-fertility countries are becoming more diverse geographically, including many more countries in Asia and Latin America and the Caribbean (31 out of the 70 low-fertility countries are from regions outside of Europe).
• There have been substantial declines in adolescent fertility in many high-fertility countries, but adolescent fertility remains very high in Middle Africa and Western Africa. Angola, Chad, Mali and Niger stand out with adolescent birth rates of above 180 births per 1,000 women aged 15-19 years in 2005-2010. Adolescent fertility also continues to account for a high proportion of births in many low-fertility countries in Latin America and the Caribbean; in five low-fertility countries, all in Latin America and the Caribbean, 15 per cent or more of all births were to adolescent mothers.
• Fertility is projected to decrease in high-fertility countries. Some of these countries, especially in Asia, are projected to experience a sharp decline. The fertility decline in other countries is projected to be more gradual with Mali and Niger standing out as remaining with particularly high fertility. Among high-fertility countries, 16 are projected to reach total fertility of 2.6 or below by 2030-2035. All 17 countries with projected fertility of 3.8 or more are in Eastern, Middle and Western Africa.
• Most low-fertility countries are projected to increase their fertility or for it to remain relatively stable to 2030-2035 (52 out of 70 countries). The greatest increase is projected to be in the lowest fertility countries: 18 countries, all with a total fertility of less than 1.5 in 2005-2010, are projected to increase total fertility by 0.3 children per woman or more by 2030-2035.
• The female mean age at first birth has increased in both low-fertility and high-fertility countries. However, the age at first birth remains young in many high-fertility countries, especially in sub-Saharan Africa where nine of the countries with available data report a mean age at first birth of below 19 years. In many low-fertility countries, the postponement of first birth to older ages is becoming more common, with four countries (Greece, Italy, Luxembourg and Switzerland) reporting a mean age at first birth of 30 years or older whereas no countries had reached this level around 1994.
• In low-fertility countries, there has been an increase in childlessness among women aged 40-44 years, especially in Eastern Asia and Europe, with five countries reaching a level of childlessness where more than one woman in five has no children by the age of 40-44 years, a level not seen in any country around 1994. There has also been an increase in childbearing outside of marriage in low-fertility countries and areas with more than half of children currently born outside of marriage in Martinique, Norway, Puerto Rico and Sweden.
• In high-fertility countries, there has been a dramatic increase in the contraceptive prevalence rate, especially in Eastern Africa where it more than doubled in 13 out of 16 high-fertility countries, in
ix
some cases increasing more than tenfold. Despite this increase, high levels of unmet need for family planning remain, with more than one married woman in four having an unmet need in half of the high-fertility countries. Most unmet need for family planning in the high-fertility countries of Africa is for delaying or spacing births whereas in the high-fertility countries of Asia and Latin America and the Caribbean most unmet need for family planning is for stopping childbearing (i.e., women wish to have no more children).
• High-fertility countries will be faced with a growing and youthful population, even with further fertility declines in the future. There are opportunities to benefit from changes in the age structure brought about by continued declines in fertility if increased investments in human capital, job growth and other supportive policies are put in place.
• Most low-fertility countries will experience population ageing although the extent will depend on how long a country has experienced low fertility and how low fertility has declined. The changing age structure will present a challenge especially for the increasing number of low-fertility middle-income countries.
United Nations Department of Economic and Social Affairs ǀ Population Division 1
INTRODUCTION
Fertility patterns in the world have changed dramatically over the last two decades since the International Conference on Population and Development (ICPD) in 1994, producing a world with very diverse childbearing patterns. Further complicating this picture are questions regarding the future path that fertility change will take in countries experiencing high levels or low levels of childbearing and the effective policy approaches to address population and development implications of these diverse childbearing patterns.
The World Fertility Report 2013: Fertility at the Extremes, the fifth in a series, adopts a particular
focus on countries where fertility levels are high (more than 3.2 children per woman) and countries where fertility levels are low (2.0 children per woman or less). In 1990-1995, around the time of the ICPD, 105 countries had high fertility as opposed to just 66 countries in 2005-2010 (the period of the most recent fertility estimates). Several countries, such as Iran, the United Arab Emirates and Viet Nam, experienced rapid fertility declines over this time period, moving from high fertility to low fertility over the span of a single generation. High-fertility countries are increasingly concentrated in sub-Saharan Africa while low-fertility countries have moved from being predominantly European to include countries from Asia and Latin America and the Caribbean.
What have been the pathways countries have taken that resulted in levels of fertility at the extremes of
today? How have key correlates of fertility changed over time and how similar are the patterns in these correlates for countries at high or low fertility levels? What are the social and economic consequences and policy approaches for countries with fertility at the extremes? This report addresses these questions drawing on a long time series of fertility estimates and updated data from countries on selected correlates of fertility change. Available policy options are also discussed.
For the purposes of this report, 66 countries are categorized as high fertility (i.e., countries or areas
with total fertility of more than 3.2 children per woman in 2005-2010) and 70 countries are categorized as low fertility (i.e., countries or areas with total fertility of 2.0 children per woman or less in 2005-2010).1 Estimates and projections of total fertility and age-specific fertility rates were taken from the 2012 Revision of World Population Prospects (United Nations, 2013a) to enable comparability over time and to include the maximum number of countries or areas in the analyses. Countries or areas2 with at least 90,000 inhabitants in 2012 were included and are grouped geographically into six major areas (Africa, Asia, Europe, Latin America and the Caribbean, Northern America and Oceania) and 21 regions.
Data on other indicators of fertility and correlates of fertility change were taken from varied sources
(see annex table 1). Model-based estimates of family planning indicators were drawn from a recent United Nations publication (United Nations, 2014a). Modelled data were not available for all indicators and thus estimates were drawn from a range of data sources, such as national censuses, national household surveys and vital registration. In these cases, the reference year is not the same but a short range of years was used for estimates around 1994 and for the latest point available. Information on national policies was obtained from the latest global assessment of population policies, based in part on official Government responses to the United Nations Inquiry among Governments on Population and Development.
1 In previous editions of the World Fertility Report, analysis was also conducted by development group where countries were categorized as part of developed regions or developing regions. These development group categories were based on the fertility levels of countries around the 1960s (United Nations, 1966) and were not used in the present report because their meaning is increasingly ambiguous. Many countries classified as part of developing regions now have very low fertility (e.g., China) as well as high per capita income (e.g., the Republic of Korea and Singapore). 2 The term “country” as used in this publication refers, as appropriate, to countries, territories or areas.

United Nations Department of Economic and Social Affairs ǀ Population Division 3
I. LOW FERTILITY
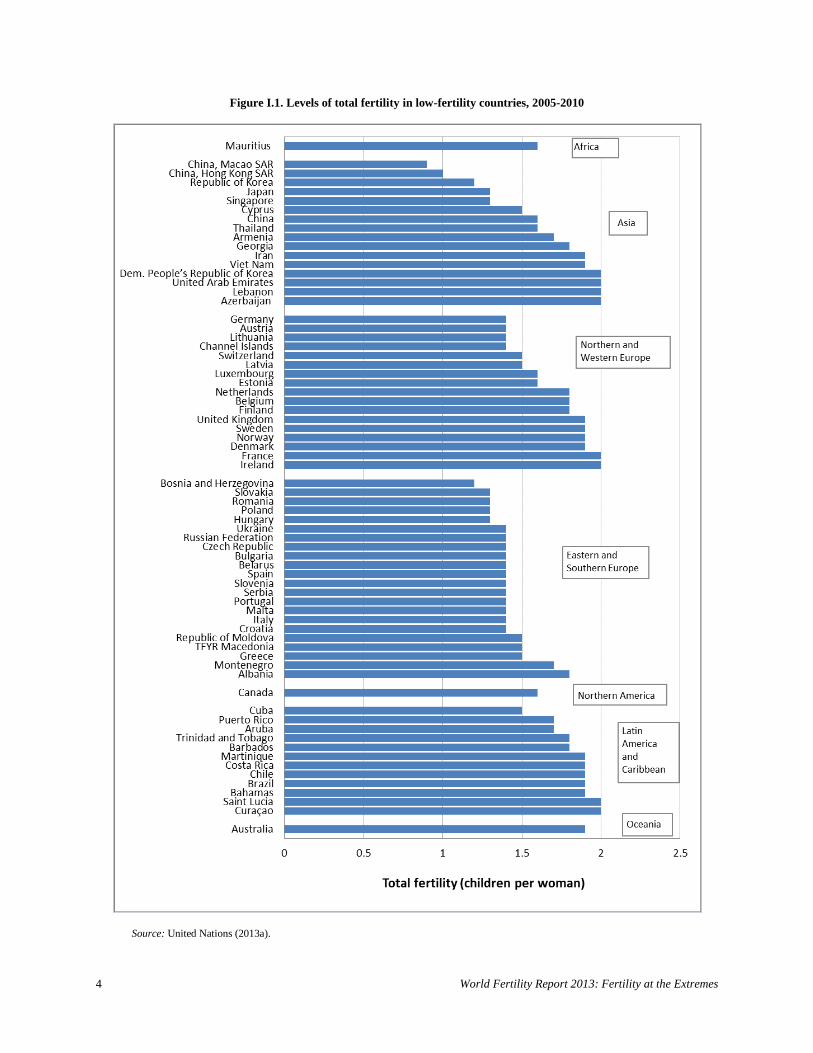
Low fertility (defined in this report as total fertility of 2.0 children per woman or less) is fast becoming the norm for many countries in the world and is no longer a predominantly European phenomenon. Countries in parts of Asia and Latin America and the Caribbean are experiencing fertility levels that are below the replacement level of 2.1 children per woman. Eastern Asia has become a region of especially low fertility, with total fertility of 1.4 children per woman or less in Hong Kong Special Administrative Region (SAR) of China, Japan, Macao SAR of China, and the Republic of Korea. While 39 of the 70 low-fertility countries in 2005-2010 are in Europe, 16 are in Asia and 12 are in Latin America and the Caribbean (figure I.1). Australia, Canada and Mauritius are the only low-fertility countries in Oceania, Northern America and Africa, respectively.
The transition to low fertility is occurring at faster rates and at lower levels of development than was
traditionally seen in Europe and North America during their fertility transitions, meaning that fertility rates are converging at a faster pace than the convergence of many other socio-economic characteristics (Kohler and others, 2002). There is concern in many countries that, without migration, a rapid fertility transition poses serious challenges, including an expanding older population and a shrinking workforce to pay for social services and pensions and to drive economic growth. As more countries experience sustained low fertility, it is important to understand how countries differ in their trajectories toward low fertility and correlates of fertility change in order to inform effective policies that address the consequences of below-replacement fertility.
At the time of the 1994 ICPD, 51 of today’s 70 low-fertility countries had fertility levels at 2.0
children per woman or less. This figure includes most low-fertility countries in Europe (figure I.2), which had already reached replacement-level fertility prior to the 1990s (Albania and the former Yugoslav Republic (TFYR) of Macedonia are exceptions to this pattern). In Eastern Asia, most low-fertility countries also reached below-replacement fertility before 1994, except in the Democratic People’s Republic of Korea. Persistently low levels of fertility increasingly characterize countries in Eastern Asia, and the region has replaced Europe as the “global hotspot” of low fertility (Sobotka, 2013). Central Asia, Western Asia and Latin America and the Caribbean are emerging as new areas of low fertility. The majority of low-fertility countries in these regions did not have below-replacement fertility at the time of the 1994 ICPD.
4 World Fertility Report 2013: Fertility at the Extremes
Figure I.1. Levels of total fertility in low-fertility countries, 2005-2010
Source: United Nations (2013a).
United Nations Department of Economic and Social Affairs ǀ Population Division 5
A. THE TRANSITION TO BELOW-REPLACEMENT FERTILITY
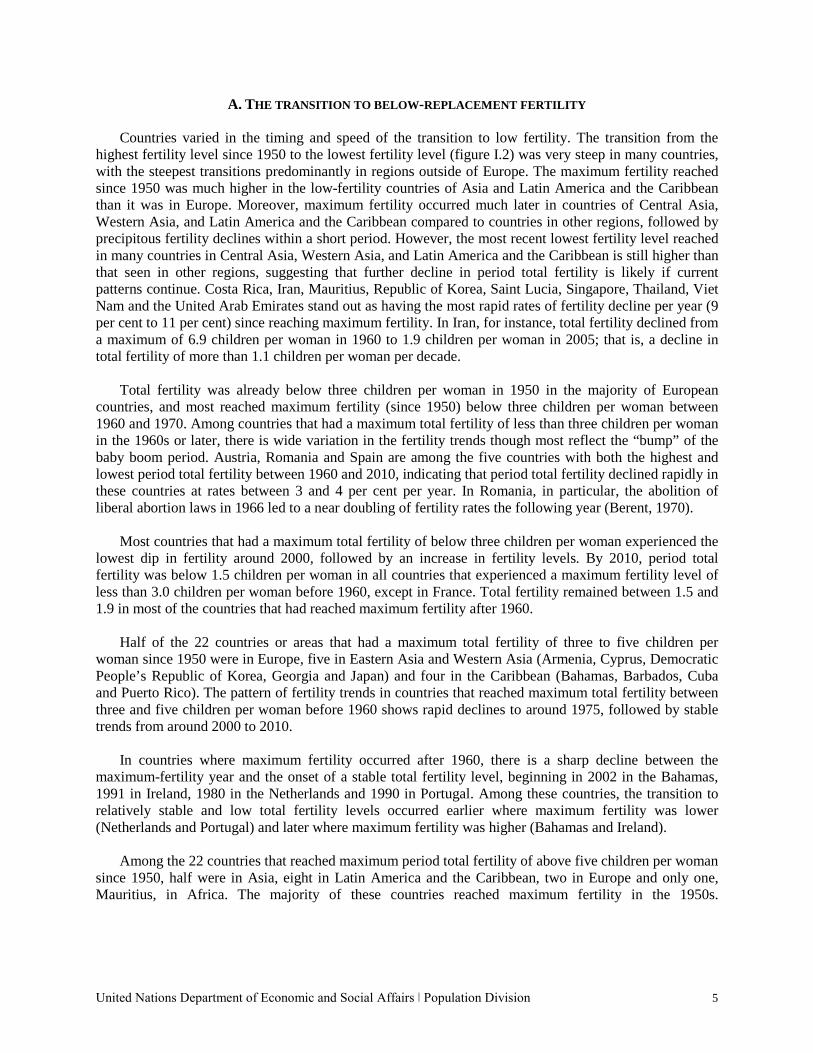
Countries varied in the timing and speed of the transition to low fertility. The transition from the highest fertility level since 1950 to the lowest fertility level (figure I.2) was very steep in many countries, with the steepest transitions predominantly in regions outside of Europe. The maximum fertility reached since 1950 was much higher in the low-fertility countries of Asia and Latin America and the Caribbean than it was in Europe. Moreover, maximum fertility occurred much later in countries of Central Asia, Western Asia, and Latin America and the Caribbean compared to countries in other regions, followed by precipitous fertility declines within a short period. However, the most recent lowest fertility level reached in many countries in Central Asia, Western Asia, and Latin America and the Caribbean is still higher than that seen in other regions, suggesting that further decline in period total fertility is likely if current patterns continue. Costa Rica, Iran, Mauritius, Republic of Korea, Saint Lucia, Singapore, Thailand, Viet Nam and the United Arab Emirates stand out as having the most rapid rates of fertility decline per year (9 per cent to 11 per cent) since reaching maximum fertility. In Iran, for instance, total fertility declined from a maximum of 6.9 children per woman in 1960 to 1.9 children per woman in 2005; that is, a decline in total fertility of more than 1.1 children per woman per decade.
Total fertility was already below three children per woman in 1950 in the majority of European
countries, and most reached maximum fertility (since 1950) below three children per woman between 1960 and 1970. Among countries that had a maximum total fertility of less than three children per woman in the 1960s or later, there is wide variation in the fertility trends though most reflect the “bump” of the baby boom period. Austria, Romania and Spain are among the five countries with both the highest and lowest period total fertility between 1960 and 2010, indicating that period total fertility declined rapidly in these countries at rates between 3 and 4 per cent per year. In Romania, in particular, the abolition of liberal abortion laws in 1966 led to a near doubling of fertility rates the following year (Berent, 1970).
Most countries that had a maximum total fertility of below three children per woman experienced the
lowest dip in fertility around 2000, followed by an increase in fertility levels. By 2010, period total fertility was below 1.5 children per woman in all countries that experienced a maximum fertility level of less than 3.0 children per woman before 1960, except in France. Total fertility remained between 1.5 and 1.9 in most of the countries that had reached maximum fertility after 1960.
Half of the 22 countries or areas that had a maximum total fertility of three to five children per
woman since 1950 were in Europe, five in Eastern Asia and Western Asia (Armenia, Cyprus, Democratic People’s Republic of Korea, Georgia and Japan) and four in the Caribbean (Bahamas, Barbados, Cuba and Puerto Rico). The pattern of fertility trends in countries that reached maximum total fertility between three and five children per woman before 1960 shows rapid declines to around 1975, followed by stable trends from around 2000 to 2010.
In countries where maximum fertility occurred after 1960, there is a sharp decline between the
maximum-fertility year and the onset of a stable total fertility level, beginning in 2002 in the Bahamas, 1991 in Ireland, 1980 in the Netherlands and 1990 in Portugal. Among these countries, the transition to relatively stable and low total fertility levels occurred earlier where maximum fertility was lower (Netherlands and Portugal) and later where maximum fertility was higher (Bahamas and Ireland).
Among the 22 countries that reached maximum period total fertility of above five children per woman
since 1950, half were in Asia, eight in Latin America and the Caribbean, two in Europe and only one, Mauritius, in Africa. The majority of these countries reached maximum fertility in the 1950s.
6 World Fertility Report 2013: Fertility at the Extremes
Figure I.2. Trends in total fertility among current low-fertility countries, 1950-2010
Source: United Nations (2013a). NOTES: B&H refers to Bosnia and Herzegovina, CI refers to Channel Islands, Czech Rep. refers to Czech Republic, DPRK refers to Democratic People’s Republic of Korea, RoK refers to Republic of Korea, T&T refers to Trinidad and Tobago, UAE refers to United Arab Emirates, and UK refers to United Kingdom.
United Nations Department of Economic and Social Affairs ǀ Population Division 7
B. FERTILITY DECLINE AT YOUNG AND OLD AGES
1. Adolescent fertility
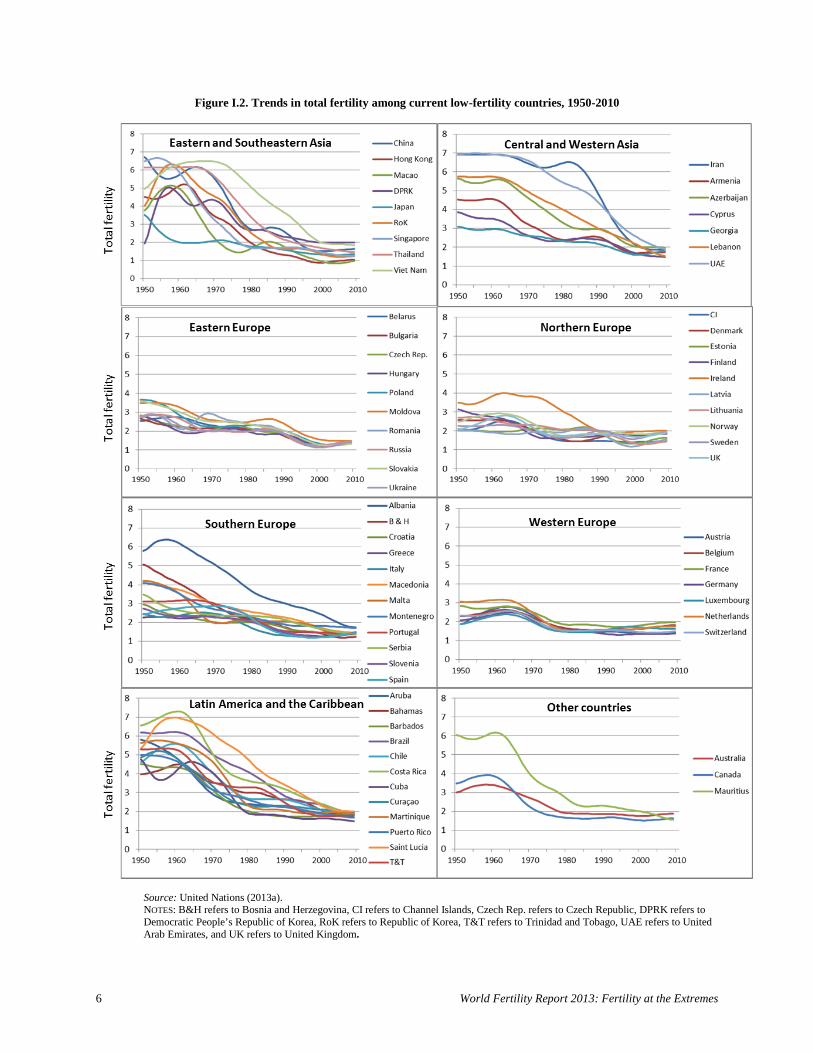
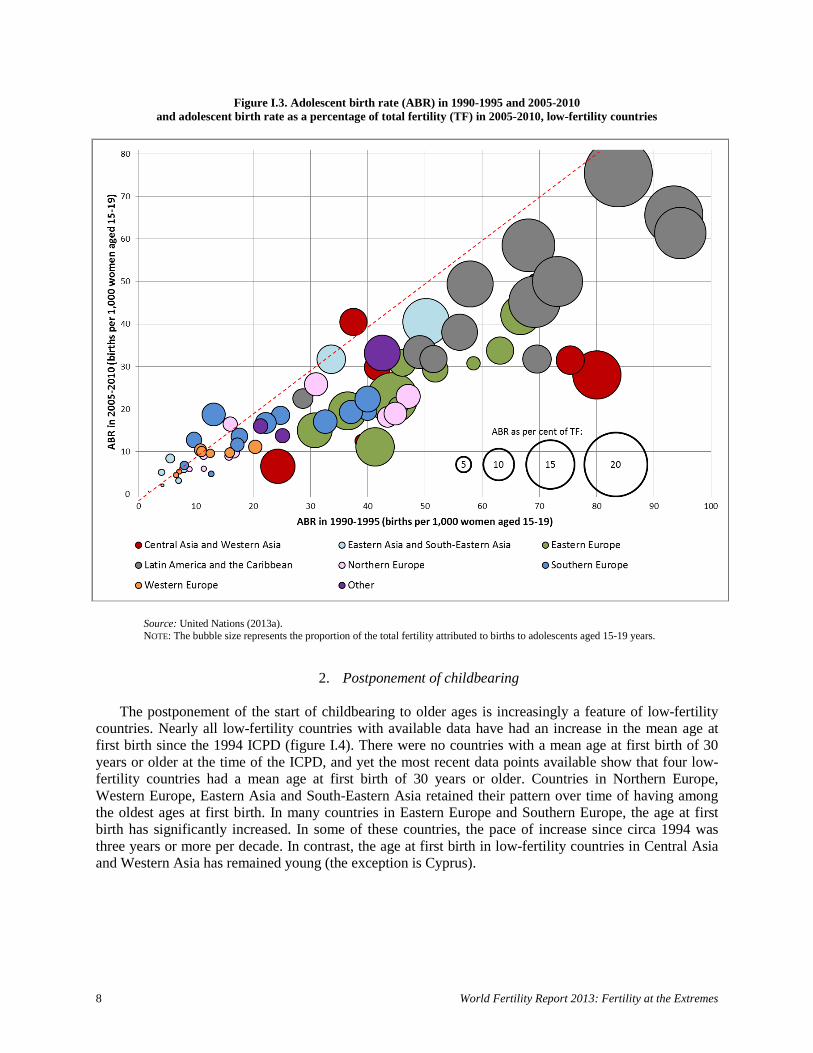
Though all countries in this study have below-replacement fertility, many still have a relatively high proportion of births to adolescent mothers. Low-fertility countries in Latin America and the Caribbean have relatively high adolescent birth rates (ABR) in 2005-2010 (figure I.3), ranging from 22 births per 1,000 women aged 15-19 in Martinique to 76 births per 1,000 women aged 15-19 in Brazil. The decline in adolescent fertility in low-fertility countries in Latin America and the Caribbean since 1990-1995 has been more modest than in low-fertility countries in other regions that also had high adolescent fertility in 1990-1995, such as Eastern Europe and Central and Western Asia. Moreover, adolescent fertility in Latin America and the Caribbean is defined by very high differentials by socio-economic and education group (Cavenaghi, 2013). In 8 of 12 countries in Latin America and the Caribbean, the ABR declined by less than one third between 1990-1995 and 2005-2010, and between one third and a half in the remainder of the countries (an exception is the Bahamas, where the ABR declined by more than half). In Brazil, for example, the ABR declined from 84 births per 1,000 women aged 15-19 in 1990-1995 to 76 in 2005-2010 (a decline of less than 10 per cent). Armenia had a similar adolescent birth rate to Brazil in 1990-1995 of 80 births per 1,000 women aged 15-19, but by 2005-2010 this had declined by about 65 per cent to 28 births per 1,000 women aged 15-19.
Central and Western Asia and Eastern Europe have relatively high adolescent birth rates. Eastern
Europe has higher adolescent birth rates than other sub-regions of Europe, although there have been sharp declines in many countries since 1990-1995. In Northern Europe, the countries from the former Soviet Union (Estonia, Latvia and Lithuania) and Ireland and United Kingdom have relatively high adolescent birth rates, although Estonia, Latvia and Lithuania have experienced declines of more than half since 1990-1995.
Eastern and South-Eastern Asia stand out as regions with very low adolescent fertility, both in 1990-
1995 and 2005-2010 with the notable exceptions of Thailand and Viet Nam where the ABR in 2005-2010 was 41 and 32, respectively. Western Europe also stands out as a region with particularly low adolescent birth rates (less than 11 births per 1,000 women aged 15-19). Other countries in Northern Europe all had very low adolescent birth rates of 9 births or below per 1,000 women aged 15-19.
The bubble sizes in figure I.3 represent the proportion of the total fertility attributed to births to
adolescents aged 15-19 years, which is high in low-fertility countries in Latin America and the Caribbean compared to other regions. In 2005-2010, 10 of 18 low-fertility countries where the proportion of period total fertility attributable to adolescent fertility is 10 per cent or more are in Latin America and the Caribbean. In four of these countries (Brazil, Chile, Costa Rica and Saint Lucia), the ABR increased between 1990-1995 and 2005-2010. Thailand, in South-Eastern Asia and Azerbaijan, in Western Asia, are the other low-fertility countries where the ABR constitutes 10 per cent or more of total fertility and where the ABR increased. Given that reducing childbearing among adolescents is a concern of many Governments, reductions in adolescent childbearing will likely be associated with further reductions in overall fertility levels.
8 World Fertility Report 2013: Fertility at the Extremes
Figure I.3. Adolescent birth rate (ABR) in 1990-1995 and 2005-2010 and adolescent birth rate as a percentage of total fertility (TF) in 2005-2010, low-fertility countries
Source: United Nations (2013a). NOTE: The bubble size represents the proportion of the total fertility attributed to births to adolescents aged 15-19 years.
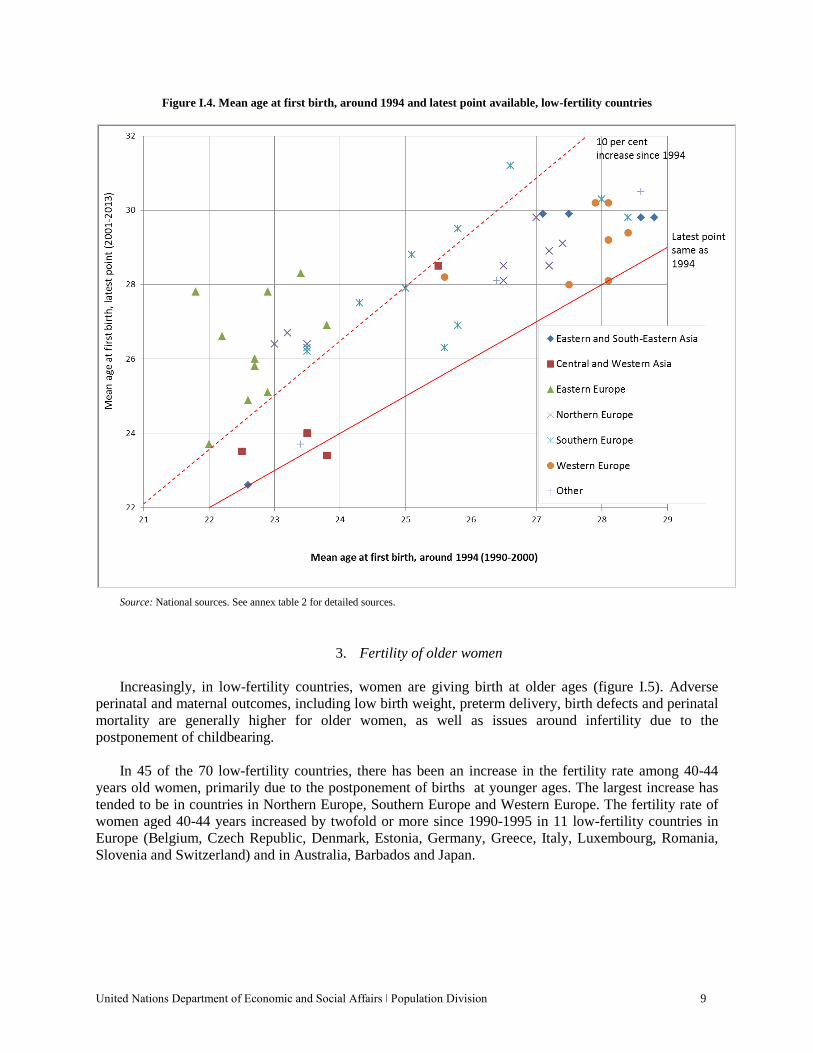
2. Postponement of childbearing The postponement of the start of childbearing to older ages is increasingly a feature of low-fertility
countries. Nearly all low-fertility countries with available data have had an increase in the mean age at first birth since the 1994 ICPD (figure I.4). There were no countries with a mean age at first birth of 30 years or older at the time of the ICPD, and yet the most recent data points available show that four low-fertility countries had a mean age at first birth of 30 years or older. Countries in Northern Europe, Western Europe, Eastern Asia and South-Eastern Asia retained their pattern over time of having among the oldest ages at first birth. In many countries in Eastern Europe and Southern Europe, the age at first birth has significantly increased. In some of these countries, the pace of increase since circa 1994 was three years or more per decade. In contrast, the age at first birth in low-fertility countries in Central Asia and Western Asia has remained young (the exception is Cyprus).
United Nations Department of Economic and Social Affairs ǀ Population Division 9
Figure I.4. Mean age at first birth, around 1994 and latest point available, low-fertility countries
Source: National sources. See annex table 2 for detailed sources.
3. Fertility of older women
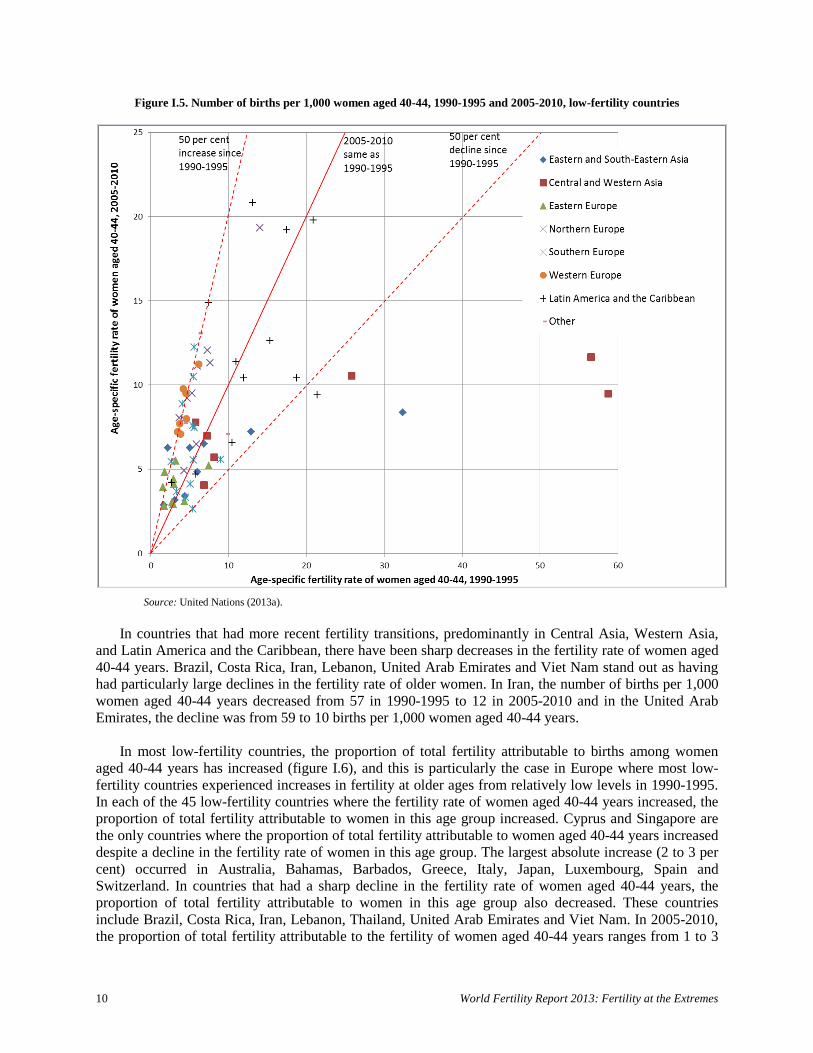
Increasingly, in low-fertility countries, women are giving birth at older ages (figure I.5). Adverse perinatal and maternal outcomes, including low birth weight, preterm delivery, birth defects and perinatal mortality are generally higher for older women, as well as issues around infertility due to the postponement of childbearing.
In 45 of the 70 low-fertility countries, there has been an increase in the fertility rate among 40-44
years old women, primarily due to the postponement of births at younger ages. The largest increase has tended to be in countries in Northern Europe, Southern Europe and Western Europe. The fertility rate of women aged 40-44 years increased by twofold or more since 1990-1995 in 11 low-fertility countries in Europe (Belgium, Czech Republic, Denmark, Estonia, Germany, Greece, Italy, Luxembourg, Romania, Slovenia and Switzerland) and in Australia, Barbados and Japan.
10 World Fertility Report 2013: Fertility at the Extremes
Figure I.5. Number of births per 1,000 women aged 40-44, 1990-1995 and 2005-2010, low-fertility countries
Source: United Nations (2013a).
In countries that had more recent fertility transitions, predominantly in Central Asia, Western Asia,
and Latin America and the Caribbean, there have been sharp decreases in the fertility rate of women aged 40-44 years. Brazil, Costa Rica, Iran, Lebanon, United Arab Emirates and Viet Nam stand out as having had particularly large declines in the fertility rate of older women. In Iran, the number of births per 1,000 women aged 40-44 years decreased from 57 in 1990-1995 to 12 in 2005-2010 and in the United Arab Emirates, the decline was from 59 to 10 births per 1,000 women aged 40-44 years.
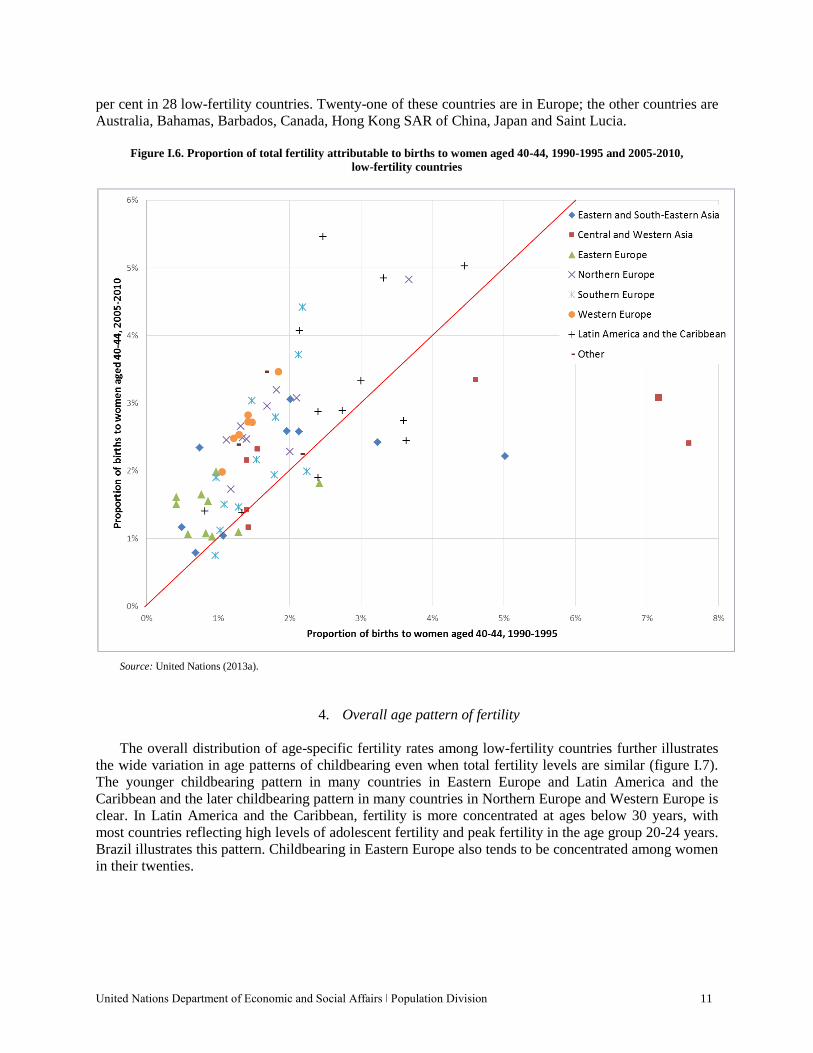
In most low-fertility countries, the proportion of total fertility attributable to births among women
aged 40-44 years has increased (figure I.6), and this is particularly the case in Europe where most low-fertility countries experienced increases in fertility at older ages from relatively low levels in 1990-1995. In each of the 45 low-fertility countries where the fertility rate of women aged 40-44 years increased, the proportion of total fertility attributable to women in this age group increased. Cyprus and Singapore are the only countries where the proportion of total fertility attributable to women aged 40-44 years increased despite a decline in the fertility rate of women in this age group. The largest absolute increase (2 to 3 per cent) occurred in Australia, Bahamas, Barbados, Greece, Italy, Japan, Luxembourg, Spain and Switzerland. In countries that had a sharp decline in the fertility rate of women aged 40-44 years, the proportion of total fertility attributable to women in this age group also decreased. These countries include Brazil, Costa Rica, Iran, Lebanon, Thailand, United Arab Emirates and Viet Nam. In 2005-2010, the proportion of total fertility attributable to the fertility of women aged 40-44 years ranges from 1 to 3
United Nations Department of Economic and Social Affairs ǀ Population Division 11
per cent in 28 low-fertility countries. Twenty-one of these countries are in Europe; the other countries are Australia, Bahamas, Barbados, Canada, Hong Kong SAR of China, Japan and Saint Lucia.
Figure I.6. Proportion of total fertility attributable to births to women aged 40-44, 1990-1995 and 2005-2010,
low-fertility countries
Source: United Nations (2013a).
4. Overall age pattern of fertility
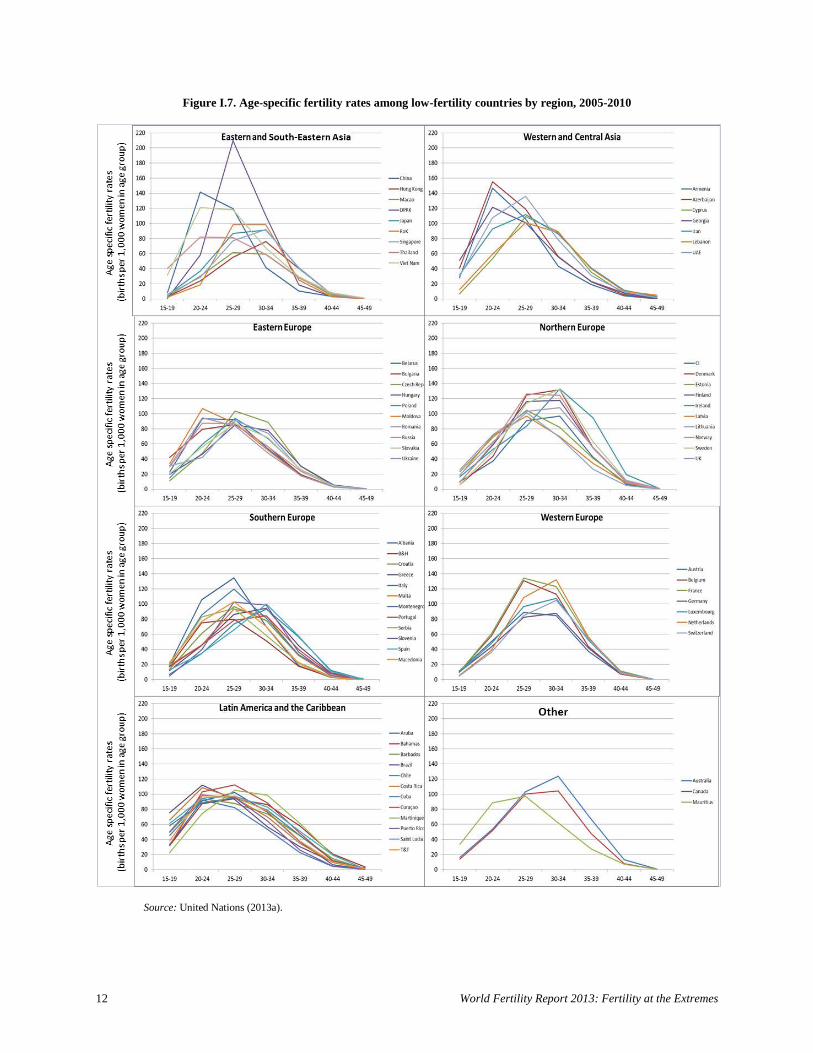
The overall distribution of age-specific fertility rates among low-fertility countries further illustrates the wide variation in age patterns of childbearing even when total fertility levels are similar (figure I.7). The younger childbearing pattern in many countries in Eastern Europe and Latin America and the Caribbean and the later childbearing pattern in many countries in Northern Europe and Western Europe is clear. In Latin America and the Caribbean, fertility is more concentrated at ages below 30 years, with most countries reflecting high levels of adolescent fertility and peak fertility in the age group 20-24 years. Brazil illustrates this pattern. Childbearing in Eastern Europe also tends to be concentrated among women in their twenties.
12 World Fertility Report 2013: Fertility at the Extremes
Figure I.7. Age-specific fertility rates among low-fertility countries by region, 2005-2010
Source: United Nations (2013a).
United Nations Department of Economic and Social Affairs ǀ Population Division 13
All countries in Northern Europe, Southern Europe and Western Europe have peak childbearing in the 25-29 or 30-34 years age groups. Albania and Montenegro stand out as having childbearing concentrated in younger age groups and Ireland has relatively high levels of childbearing at older ages. Most countries in Central Asia and Western Asia tend to have a relatively early peak in fertility, and all countries have peak fertility between the ages of 20 and 29 years. In Eastern Asia and South-Eastern Asia there is wide variation among countries in the age pattern of childbearing. Some countries, such as China and Viet Nam, show a peak level of fertility in the 20-24 years age group, while Hong Kong SAR of China, Japan and Singapore all have a later peak in fertility in the 30-34 years age group.
C. COMPLETED FERTILITY AND CHILDLESSNESS
While the age-specific period fertility rates provide a picture of fertility at a particular point in time,
completed fertility is a function of historical fertility rates experienced by women as they passed through their childbearing years. Often the period fertility rates can decline to levels that are much lower than completed fertility by cohort because the period rates are sensitive to the timing of childbearing and a shift to childbearing at older ages (a “tempo” effect). In other words, if women decide to postpone childbearing to older ages, the years in which the postponement occurs will record fewer births and a lower period measure of total fertility.
The distribution of the number of children born to women who have completed or are approaching
the end of their childbearing years also provides information on the different routes by which countries have reached low fertility. Completed family size, measured here by the number of children ever born to women aged 40-44 years, reflects past fertility behaviour and, as such, may differ from period total fertility, especially where fertility decline has been rapid.
In some countries, a relatively high proportion of women remain childless but the women who do
have children tend to have large families. In other countries, childlessness is less common but women who have children tend to have smaller families of one or two children. For the purposes of this report, childlessness is defined as women who have not had a live birth, regardless of whether women are intentionally childless or not.
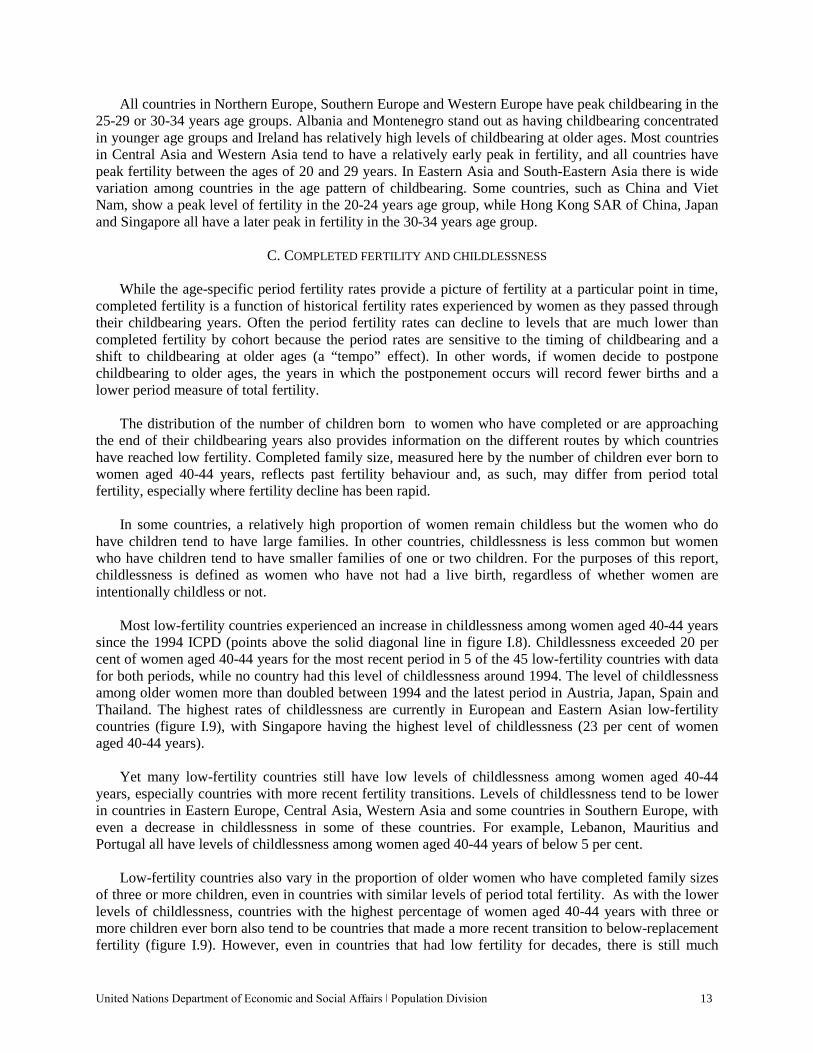
Most low-fertility countries experienced an increase in childlessness among women aged 40-44 years
since the 1994 ICPD (points above the solid diagonal line in figure I.8). Childlessness exceeded 20 per cent of women aged 40-44 years for the most recent period in 5 of the 45 low-fertility countries with data for both periods, while no country had this level of childlessness around 1994. The level of childlessness among older women more than doubled between 1994 and the latest period in Austria, Japan, Spain and Thailand. The highest rates of childlessness are currently in European and Eastern Asian low-fertility countries (figure I.9), with Singapore having the highest level of childlessness (23 per cent of women aged 40-44 years).
Yet many low-fertility countries still have low levels of childlessness among women aged 40-44
years, especially countries with more recent fertility transitions. Levels of childlessness tend to be lower in countries in Eastern Europe, Central Asia, Western Asia and some countries in Southern Europe, with even a decrease in childlessness in some of these countries. For example, Lebanon, Mauritius and Portugal all have levels of childlessness among women aged 40-44 years of below 5 per cent.
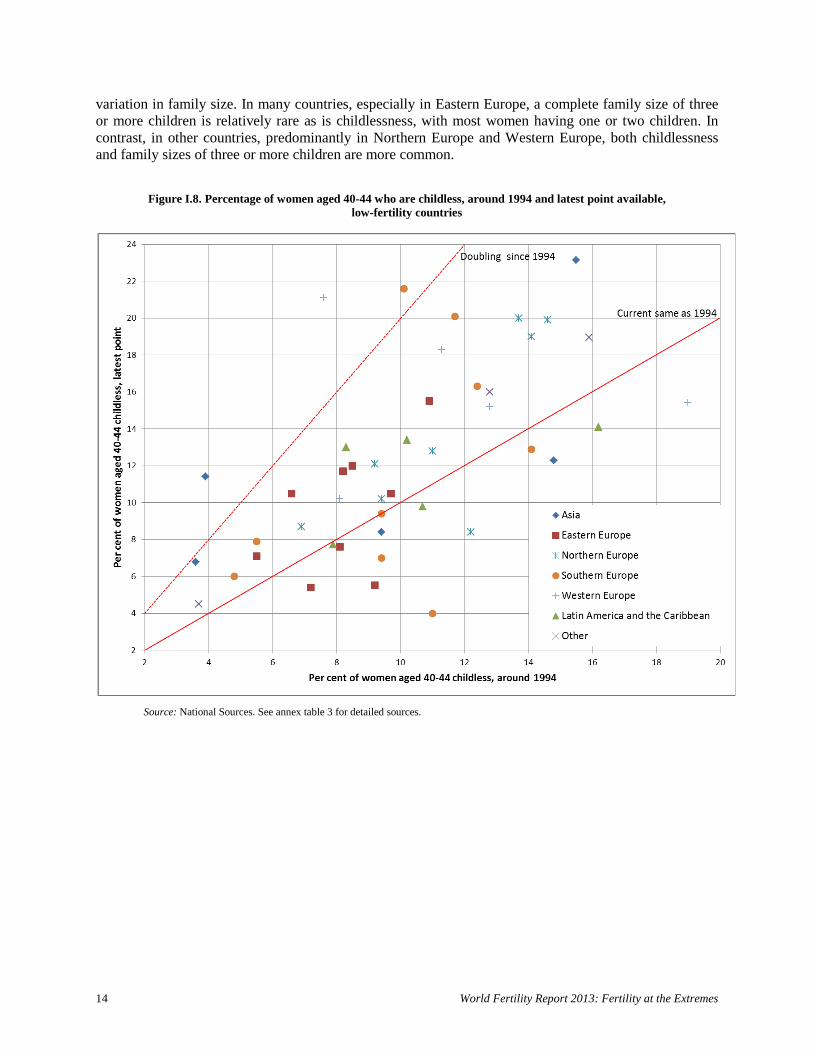
Low-fertility countries also vary in the proportion of older women who have completed family sizes
of three or more children, even in countries with similar levels of period total fertility. As with the lower levels of childlessness, countries with the highest percentage of women aged 40-44 years with three or more children ever born also tend to be countries that made a more recent transition to below-replacement fertility (figure I.9). However, even in countries that had low fertility for decades, there is still much
14 World Fertility Report 2013: Fertility at the Extremes
variation in family size. In many countries, especially in Eastern Europe, a complete family size of three or more children is relatively rare as is childlessness, with most women having one or two children. In contrast, in other countries, predominantly in Northern Europe and Western Europe, both childlessness and family sizes of three or more children are more common.
Figure I.8. Percentage of women aged 40-44 who are childless, around 1994 and latest point available, low-fertility countries
Source: National Sources. See annex table 3 for detailed sources.
United Nations Department of Economic and Social Affairs ǀ Population Division 15
Figure I.9. Percentage of women aged 40-44 who are childless or with three or more children, latest point available, low-fertility countries
Source: National Sources. See annex table 3 for detailed sources.
D. CHILDBEARING AND MARRIAGE
Marriage patterns, including the timing of marriage and the proportion of women and men who have
ever been married, have an influence on fertility levels and the timing of births. The analysis of childbearing and marriage is complex because the nature of unions in which childbearing occurs goes beyond formal marriage to include consensual unions and other types of unions. Moreover, comparable data on union status across countries and over time are limited. Despite these analytical challenges, several recent trends in childbearing and union formation characterize low-fertility countries.
1. Childbearing outside of marriage
One of the most profound changes in fertility is the rise in childbearing outside of marriage. There is
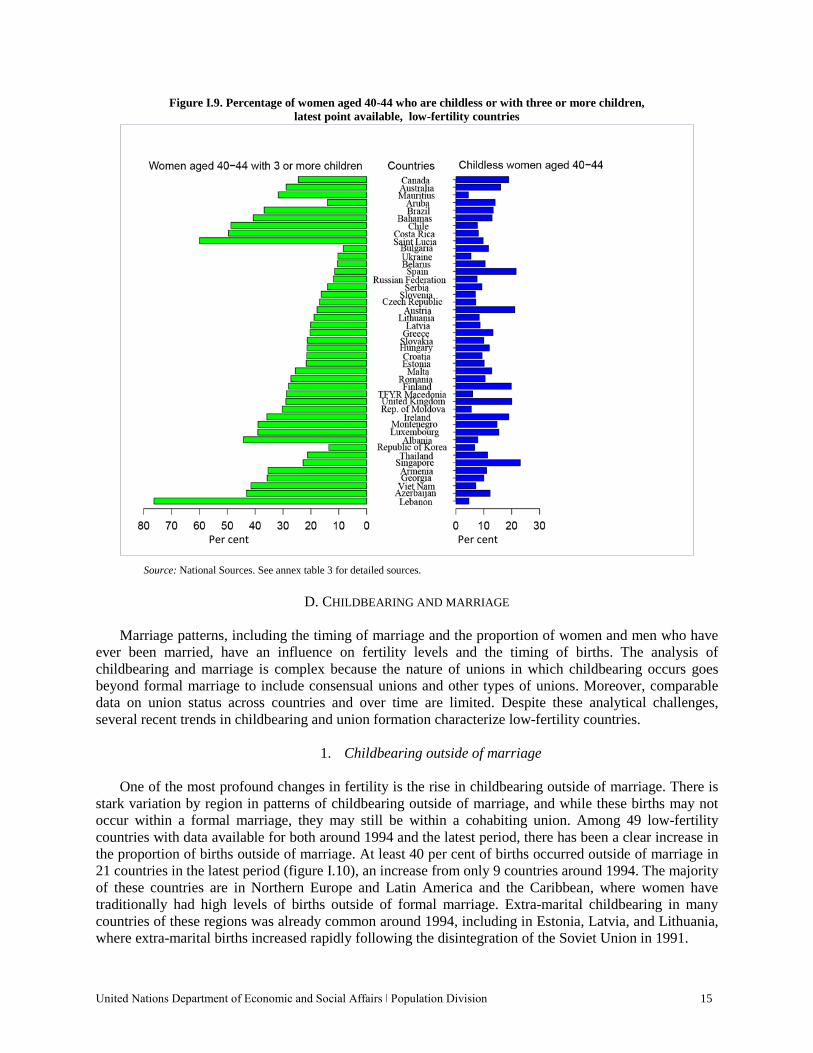
stark variation by region in patterns of childbearing outside of marriage, and while these births may not occur within a formal marriage, they may still be within a cohabiting union. Among 49 low-fertility countries with data available for both around 1994 and the latest period, there has been a clear increase in the proportion of births outside of marriage. At least 40 per cent of births occurred outside of marriage in 21 countries in the latest period (figure I.10), an increase from only 9 countries around 1994. The majority of these countries are in Northern Europe and Latin America and the Caribbean, where women have traditionally had high levels of births outside of formal marriage. Extra-marital childbearing in many countries of these regions was already common around 1994, including in Estonia, Latvia, and Lithuania, where extra-marital births increased rapidly following the disintegration of the Soviet Union in 1991.
Per cent Per cent
16 World Fertility Report 2013: Fertility at the Extremes
In contrast, extra-marital births were less common in countries in Western Europe around 1994, at levels of less than 20 per cent in five of the seven countries with data. Rapid increases have since occurred in these countries (figure I.10). France has the highest proportion of extra-marital births in Western Europe and is 1 of the 12 low-fertility countries where 50 per cent or more of births occur outside of marriage.
Figure I.10. Percentage of births outside of marriage, around 1994 and latest point available,
low-fertility countries
Source: National sources. See annex table 4 for detailed sources.
United Nations Department of Economic and Social Affairs ǀ Population Division 17
The level of childbearing outside of marriage among most countries in Eastern Europe and Southern Europe is lower compared to Northern Europe and Western Europe. However, substantial increases have occurred since 1994 in the majority of countries of these regions. Childbearing outside of marriage is relatively uncommon among the low-fertility countries in Asia, though the percentage of extra-marital births has more than doubled in all low-fertility countries in this region, except Georgia and Japan.
2. Increase in mean age at marriage
A higher average age at which men and women marry is associated with the postponement of
childbearing and the proportion of men and women who ultimately remain unmarried, although, as has been shown already, the link between childbearing and marriage is increasingly weakening.
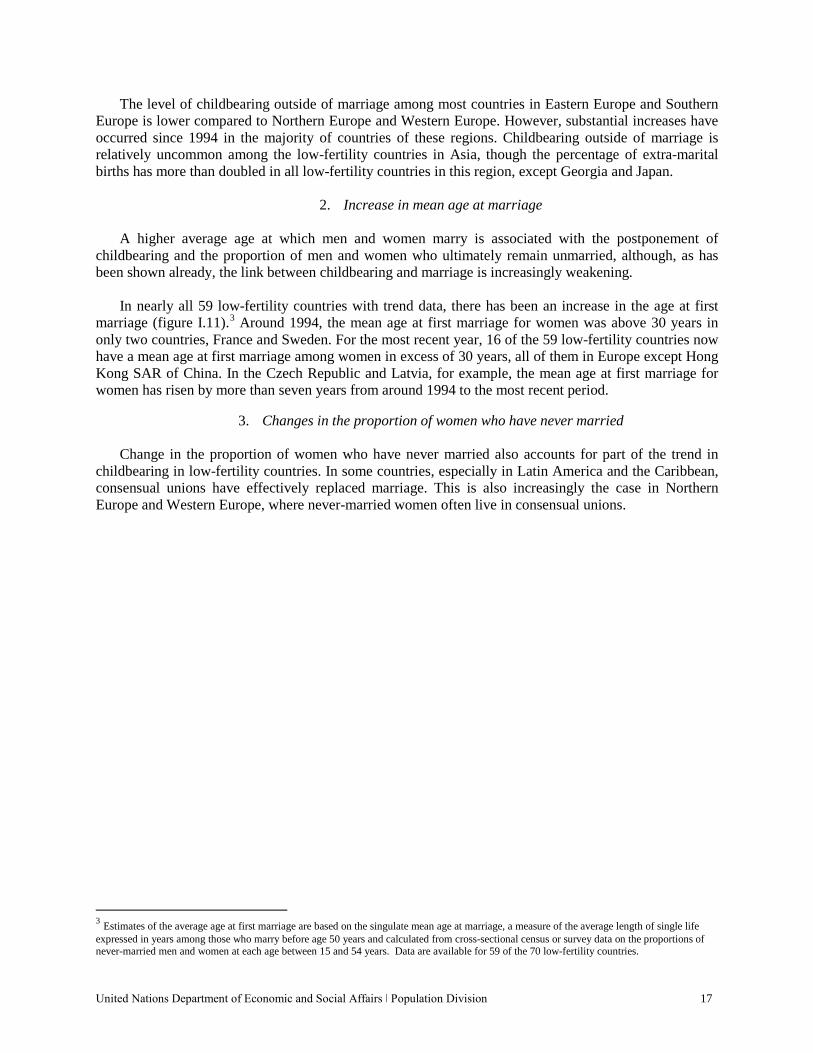
In nearly all 59 low-fertility countries with trend data, there has been an increase in the age at first
marriage (figure I.11).3 Around 1994, the mean age at first marriage for women was above 30 years in only two countries, France and Sweden. For the most recent year, 16 of the 59 low-fertility countries now have a mean age at first marriage among women in excess of 30 years, all of them in Europe except Hong Kong SAR of China. In the Czech Republic and Latvia, for example, the mean age at first marriage for women has risen by more than seven years from around 1994 to the most recent period.
3. Changes in the proportion of women who have never married
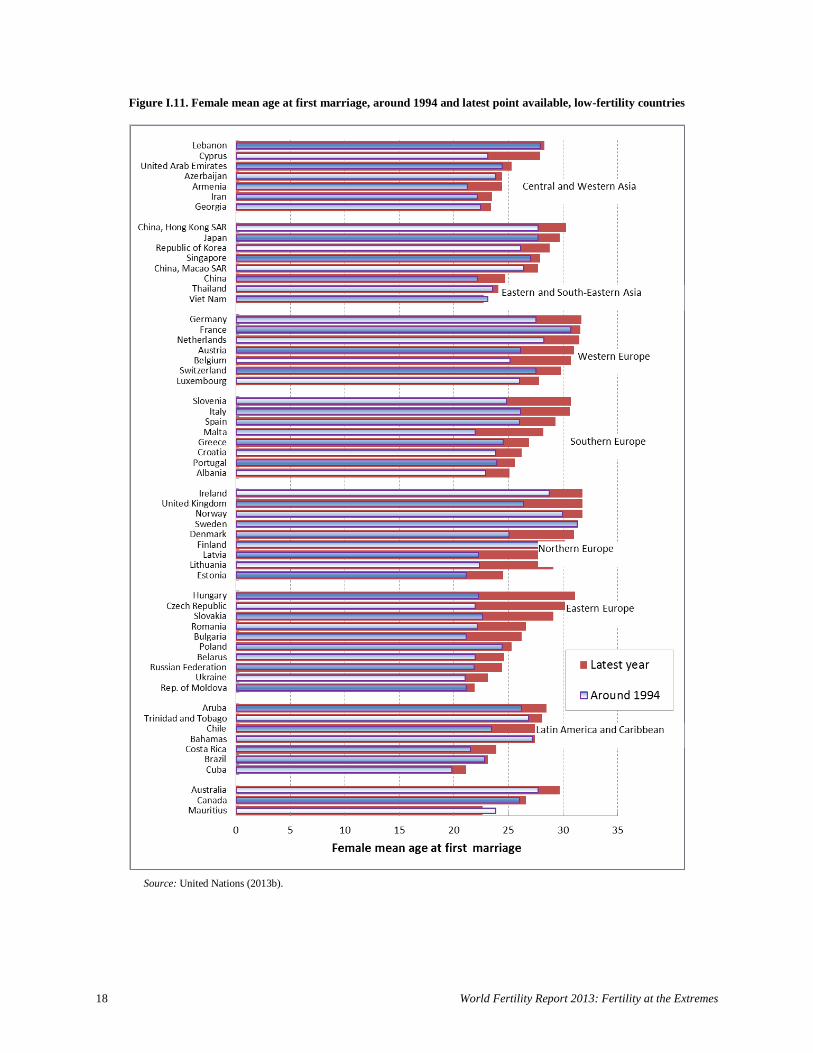
Change in the proportion of women who have never married also accounts for part of the trend in
childbearing in low-fertility countries. In some countries, especially in Latin America and the Caribbean, consensual unions have effectively replaced marriage. This is also increasingly the case in Northern Europe and Western Europe, where never-married women often live in consensual unions.
3 Estimates of the average age at first marriage are based on the singulate mean age at marriage, a measure of the average length of single life expressed in years among those who marry before age 50 years and calculated from cross-sectional census or survey data on the proportions of never-married men and women at each age between 15 and 54 years. Data are available for 59 of the 70 low-fertility countries.
18 World Fertility Report 2013: Fertility at the Extremes
Figure I.11. Female mean age at first marriage, around 1994 and latest point available, low-fertility countries
Source: United Nations (2013b).
United Nations Department of Economic and Social Affairs ǀ Population Division 19
Figure I.12. Percentage of women aged 40-44 who never married, around 1994 and latest point available, low-fertility countries
Source: United Nations 2013b. NOTES: The figures only include countries where consensual unions were reported as a separate category for marital status in data collection for both periods. The exceptions are Albania and Poland where data showed that consensual unions are below 4 per cent or in countries in Asia where consensual unions are assumed to be rare.

20 World Fertility Report 2013: Fertility at the Extremes
The proportion of women aged 40-44 years who have never married increased since around 1994 in most low-fertility countries, although there is a wide range in levels (figure I.12). The increase has been particularly large in countries in Eastern Asia. Where childbearing outside of marriage is uncommon, as in most parts of Asia, this trend means that the postponement or rejection of marriage is an important determinant of fertility levels. The proportion of never-married women aged 40-44 years has reached levels of more than 20 per cent in countries such as the Bahamas, Chile and Lebanon.
E. FERTILITY PROJECTIONS
Much debate exists regarding future fertility levels in low-fertility countries (Lutz and others, 2014;
United Nations, 2013a). The projections described here assume a slight increase in fertility over time for countries that have already reached around or below replacement-level fertility and where the pace of fertility decline has decreased to zero. This pattern of a slight increase in fertility following declines to low levels is one that has been experienced in at least 25 low-fertility countries or areas, 16 of which are in Northern Europe or Western Europe (United Nations, 2014b). The projection model also allows for country-specific variability in the pace of fertility recovery and the long-term fertility level reached based on each country’s historical experience (United Nations, 2014b).
Most low-fertility countries, especially countries with very low fertility (below 1.6 children per
woman in 2005-2010), are projected to experience slight increases in total fertility to 2030-2035 under the medium fertility variant, although fertility rates will still be well below replacement level (figure I.13).
Figure I.13. Total fertility (TF) for countries by major area, estimates for 2005-2010 and projections for 2030-2035, low-fertility countries
Source: United Nations (2013a).

United Nations Department of Economic and Social Affairs ǀ Population Division 21
Altogether, the number of low-fertility countries or areas with total fertility below 1.6 children per woman is projected to decrease from 34 countries in 2005-2010 to 10 countries in 2030-2035. Many low-fertility countries outside of Europe, predominantly those with more recent fertility transitions and higher total fertility, are projected to have a continued fertility decline to 2030-2035.
F. CONSEQUENCES OF LOW FERTILITY
At the time of the 1994 ICPD, low fertility was mainly a characteristic of high-income countries,
especially in Europe. Since that time, low fertility has also become a feature of middle-income countries, which have more limited resources to address many of the consequences of low fertility compared to high-income countries. Moreover, many of these middle-income countries have experienced far more rapid transitions to low fertility levels than was historically the case and thus these countries have had less time to adapt to the resulting macro-level changes.
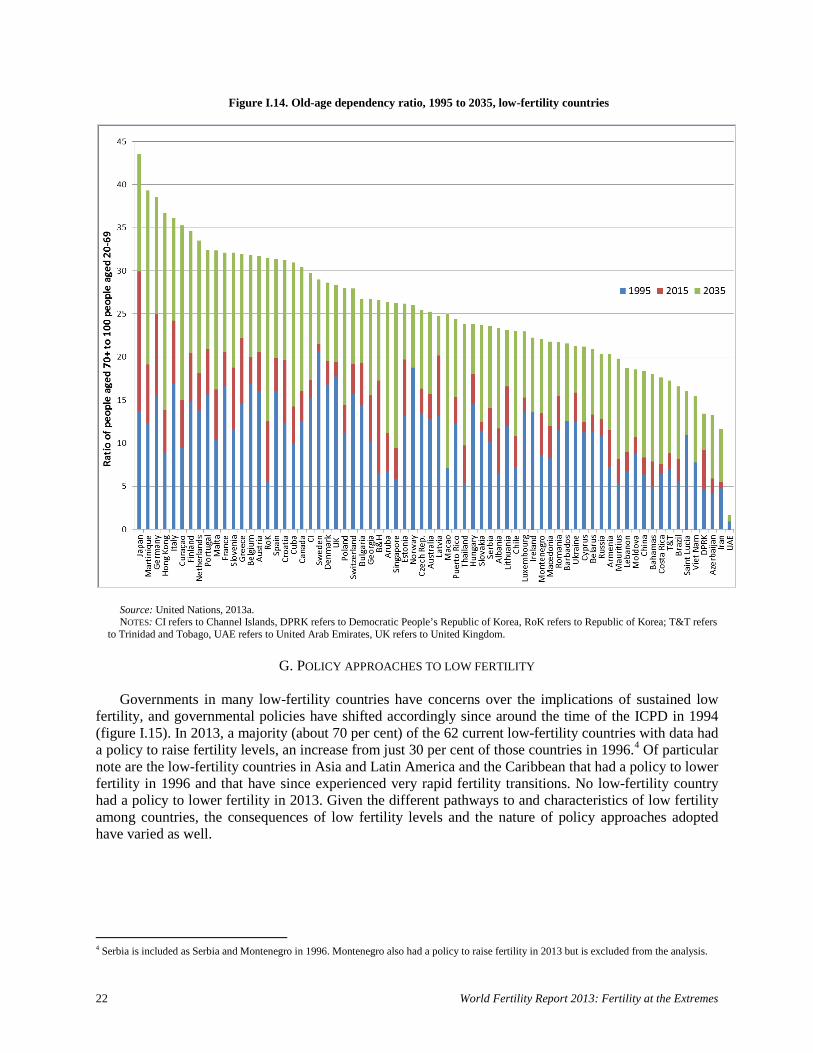
The most obvious long-term consequence of sustained low fertility is population ageing. In countries
where the fertility transition has been rapid and recent, the population is often still relatively youthful due to large cohorts of people of working age, compared with countries with more established fertility transitions. Consequently, countries with more recent fertility transitions have had a smaller increase in the old-age dependency ratio (the ratio of the population aged 70 years or over to the population aged 20 to 69 years) between 1995 and 2015 compared with countries that have had low fertility levels for a long period (figure I.14).
The increase in the old-age dependency ratio between 2015 and 2035 is projected to be substantial for
all low-fertility countries, especially countries in regions apart from Europe, where the old-age dependency ratio is projected to double. This increase in the older population compared to the working-age population will present a serious challenge to these countries, especially since many of them are middle-income countries or countries where the care of older persons has traditionally been a family responsibility (Guo, 2012; Stephen, 2012).
Another consequence of low fertility is the increased reliance by countries on positive net in-
migration to meet labour market needs. Although international migration is not a long-term structural remedy for population ageing, it can help mitigate the short-term effects of an ageing population. Migration can increase the working-age population, and migrant women often tend to be of reproductive age and to have, at least initially, higher fertility rates (Wilson and others, 2013). High levels of migration to a country, while associated with lower levels of fertility, is not perfectly correlated with fertility levels. In other words, in-migration may be low where fertility is also low (such as Ukraine) or, conversely, there may be high levels of in-migration where fertility is relatively high (such as France). Furthermore, migration as a mitigation strategy for low fertility may not be appropriate for all low-fertility countries, especially given that low fertility is occurring at ever-lower levels of development and the political sensitivities around migration in some countries. For example, countries in Eastern and South-Eastern Europe, which have struggling economies, have both low levels of fertility and net out-migration, leading to even more significant population decline (Sobotka, 2013; Wilson and others, 2013). Many low-fertility countries in Asia have far lower migration levels than European countries (Abbassi and Gubhaju, 2014).
In the absence of migration, population size will begin to decrease if fertility levels remain stable at a
below-replacement level. In 1990-1995, there were 12 countries with a negative rate of natural increase (i.e., deaths outnumbered births), all of which were in Europe (the exception was Rwanda due to the genocide in 1994). By 2010-2015, 17 countries are projected to have a negative rate of natural increase, all of which are in Europe, except Japan. By 2030-2035, 40 countries are projected to have a negative rate of natural increase, including 9 countries in regions other than Europe.
22 World Fertility Report 2013: Fertility at the Extremes
Figure I.14. Old-age dependency ratio, 1995 to 2035, low-fertility countries
Source: United Nations, 2013a. NOTES: CI refers to Channel Islands, DPRK refers to Democratic People’s Republic of Korea, RoK refers to Republic of Korea; T&T refers
to Trinidad and Tobago, UAE refers to United Arab Emirates, UK refers to United Kingdom.
G. POLICY APPROACHES TO LOW FERTILITY
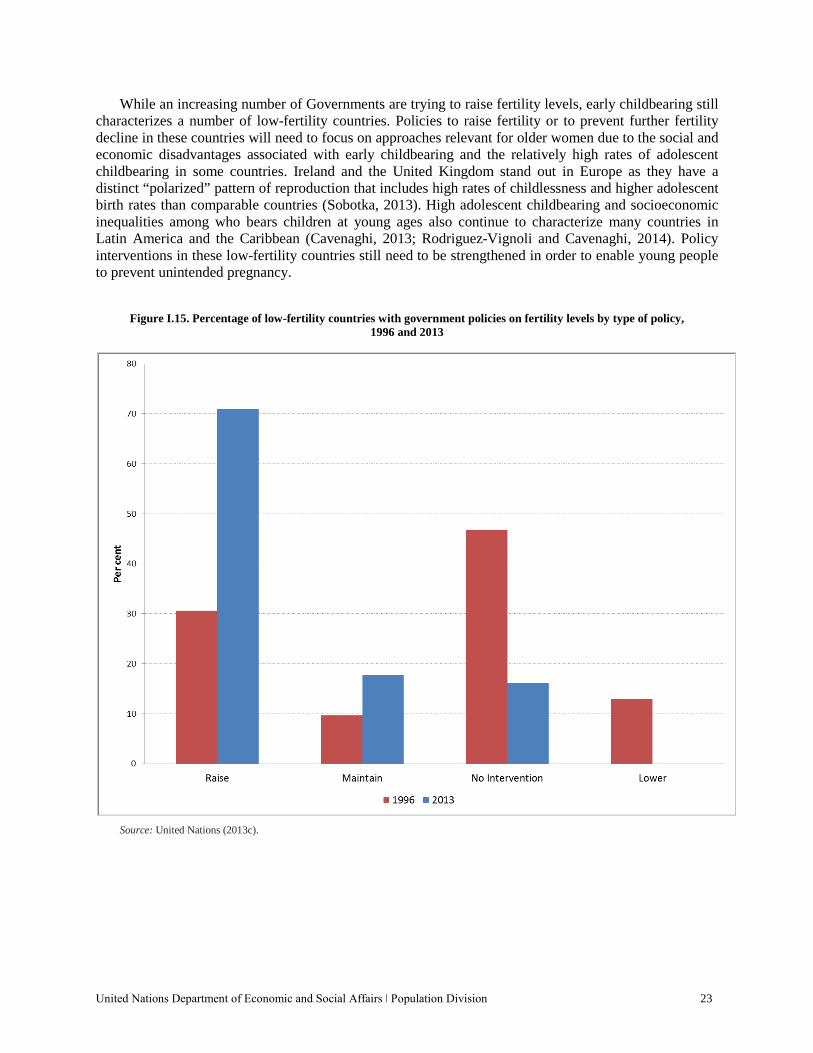
Governments in many low-fertility countries have concerns over the implications of sustained low
fertility, and governmental policies have shifted accordingly since around the time of the ICPD in 1994 (figure I.15). In 2013, a majority (about 70 per cent) of the 62 current low-fertility countries with data had a policy to raise fertility levels, an increase from just 30 per cent of those countries in 1996.4 Of particular note are the low-fertility countries in Asia and Latin America and the Caribbean that had a policy to lower fertility in 1996 and that have since experienced very rapid fertility transitions. No low-fertility country had a policy to lower fertility in 2013. Given the different pathways to and characteristics of low fertility among countries, the consequences of low fertility levels and the nature of policy approaches adopted have varied as well.
4 Serbia is included as Serbia and Montenegro in 1996. Montenegro also had a policy to raise fertility in 2013 but is excluded from the analysis.
United Nations Department of Economic and Social Affairs ǀ Population Division 23
While an increasing number of Governments are trying to raise fertility levels, early childbearing still characterizes a number of low-fertility countries. Policies to raise fertility or to prevent further fertility decline in these countries will need to focus on approaches relevant for older women due to the social and economic disadvantages associated with early childbearing and the relatively high rates of adolescent childbearing in some countries. Ireland and the United Kingdom stand out in Europe as they have a distinct “polarized” pattern of reproduction that includes high rates of childlessness and higher adolescent birth rates than comparable countries (Sobotka, 2013). High adolescent childbearing and socioeconomic inequalities among who bears children at young ages also continue to characterize many countries in Latin America and the Caribbean (Cavenaghi, 2013; Rodriguez-Vignoli and Cavenaghi, 2014). Policy interventions in these low-fertility countries still need to be strengthened in order to enable young people to prevent unintended pregnancy.
Figure I.15. Percentage of low-fertility countries with government policies on fertility levels by type of policy, 1996 and 2013
Source: United Nations (2013c).
24 World Fertility Report 2013: Fertility at the Extremes
1. Pro-natalist policies
The success of policies to influence fertility in low-fertility countries has not been impressive for the
most part. Studies have shown a small but significant effect of national policies on fertility (Billingsley and Ferrarini, 2014). However, there is room for improvement in measuring the effects of policies and understanding the mechanisms involved (Gauthier, 2007; Gauthier, 2008), and long-term changes in fertility preferences could still emerge (Kohler and others, 2006; Stephen, 2012; Balbo and others, 2013). The wider context of social, cultural and economic factors in low-fertility countries seems to matter more for influencing fertility levels than specific policy interventions per se (Hoorens and others, 2011).
Interestingly, despite major shifts in family values and behaviours in Europe, the two-child family
ideal has remained dominant, including among the most educated groups (Sobotka, 2013), and ideal family size is still close to replacement-level even in countries that experienced early declines in fertility to very low levels (Sobotka and Beaujouan, 2014). Furthermore, despite the very low fertility levels reached in Eastern and Southern Europe, childlessness has not been considered desirable, with most people expressing a desire for at least one child (Kohler and others, 2002). Thus, an effective policy will facilitate the conditions that best enable people to reach their desired family size (Sobotka, 2013).
Biological constraints to fecundity are an increasingly important factor as childbearing is postponed
to older ages. Given that ideal family size has remained relatively stable, the postponement of childbearing means that desired family size may not be achieved, leading to a divergence of desired fertility and achieved fertility (Hoorens and others, 2011) or what has been termed “an unmet need for children” (Balbo and others, 2013). As a consequence, the demand for and use of assisted reproductive technology has grown. Reports of the European Society of Human Reproduction and Embryology covering 31 countries in Europe showed that medically assisted reproduction treatments (ART), including assisted reproductive technology cycles and intrauterine insemination cycles, have continued to increase year by year, reaching more than half a million of cycles in 2010 (Kupka and others, 2014). An analysis of 14 European countries with ART data over the period 1997 to 2009 showed that the proportion of births attributed to assisted reproduction has also grown over time, with the highest level observed in Demark (nearly 5 per cent of births in 2007) (Kocourkova and others, 2014).
2. Financial incentives
The evidence for the effect of financial incentives on increasing fertility is mixed and often temporary
and transient (Hoorens and others, 2011). Financial incentives take different forms, including payments upon the birth of a baby, child allowances and tax breaks. In most countries, the payments are not sufficient to cover the direct and indirect costs of raising children and often have the most effect on either the lowest income families or larger families where the marginal cost of each child is lower (Thévenon and Gauthier, 2011; Thévenon, 2011). A study of 16 Western European countries found no significant effect of direct child allowances on either the timing of births or completed fertility (Kalwij, 2010). Generous child allowances in the United Kingdom were found to encourage young motherhood with little effect on overall fertility (Balbo and others, 2013). Where the financial incentives are particularly generous, such as in France or Quebec, Canada, there is evidence that there is a fertility benefit for higher income families as well (Thévenon, 2011). It appears that policies, which reduce the opportunity cost of having children seem to have a greater influence on fertility than direct financial incentives (Hoorens and others, 2011; Kalwij, 2010), although this influence varies by region and by country.
United Nations Department of Economic and Social Affairs ǀ Population Division 25
3. Marriage Involuntary non-marriage has been implicated as a cause of childlessness mainly in low-fertility
countries of Eastern Asia and South-Eastern Asia than in other regions (Jones, 2007), although a weakening of the desire to have children could, in turn, be responsible for decreased marriage rates (Jones, 2012). Low-fertility countries in Asia are generally characterised by low levels of adolescent childbearing, increasing levels of never-married women and childlessness, low levels of extra-marital childbearing and postponement of childbearing to later ages. The increase in never-married women in Asia particularly characterizes more-educated women (Jones, 2010). Policies to increase fertility need to consider whether postponement or rejection of marriage is a barrier to childbearing (Abbasi-Shavazi and Gubhaju, 2014; Jones, 2012; Stephen, 2012). Any policy to increase fertility in most low-fertility countries in Asia will also need to address barriers to marriage that may exist. Singapore is the only country that has explicitly focused on policies to increase marriage through housing policy and government matchmaking services with some limited success (Jones, 2012).
4. Work-life balance The compatibility between childbearing and labour force participation, especially for women, is a key
factor influencing fertility. Countries have taken different approaches to address this issue with varying success. Childcare subsidies seem to vary in impact depending on the broader social and economic context, the structure of childcare systems and the varying needs of parents (Gauthier and Philipov, 2008). For example, in countries with a culture of long working hours, the impact of subsidies for institutional childcare could be limited (Boling, 2008). In the Republic of Korea, where people work the longest hours of any Organization for Economic Cooperation and Development (OECD) country, there is also very limited public provision of childcare; nearly half of all employed women quit their jobs when they have children as parenthood and employment are particularly incompatible (Stephen, 2012). In the low-fertility countries in Eastern Asia, women face a stark choice between motherhood and a career due to a patriarchal environment and slow policy responses (Abbassi and Gubhaju, 2014; Frejka and others, 2010).
Japan and Singapore have focused on policies promoting marriage and childbearing through direct
subsidies for childbearing and more family-friendly policies like subsidized childcare and paid maternity leave. The Republic of Korea also supported subsidized childcare and parental leave but not direct support for childbearing (Abbassi and Gubhaju, 2014). However, in none of these countries have the policies had much success in influencing fertility as fertility has continued to decline to very low levels with low-fertility Eastern Asian countries often presenting women with a stark choice between motherhood and a career due to a patriarchal environment and slow policy responses (Abbassi and Gubhaju 2014; Frejka and others 2010). In contrast, in other OECD countries, the provision of childcare services for children under the age of three was found to be a more effective policy lever for increasing fertility than other factors such as leave entitlements and benefits granted around childbirth (Luci-Greulich and Thévenon, 2013). For the provision of childcare to work effectively to influence fertility, the provision of childcare services must be available at the appropriate times and continuously over the childhood period. In that respect, countries in Eastern Europe and Southern Europe as well as Japan and the Republic of Korea lag behind other OECD countries (Thévenon, 2011). Childcare policies in Singapore appear to partially account for why fertility is higher there as compared with other similar Eastern Asian countries (Jones, 2012).
Strong support for work-life balance seems to support higher fertility (Kalwij, 2010) with different
policy models leading to higher fertility in Nordic and Anglo-Saxon countries (Andersson, 2008; Thévenon, 2011). In Nordic countries, the work-life balance is achieved through significant State interventions. Anglo-Saxon countries tend to see part-time work of parents (mainly mothers) with young
26 World Fertility Report 2013: Fertility at the Extremes
children as a private choice but taxes are still structured in order to provide support for this option (Thévenon, 2011). In contrast, in Southern European countries, the strong family orientation seems to drive fertility downwards with little public policy attention to being able to combine parenthood with work or education (Hoorens and others, 2011).
There is mixed evidence on the effect of parental leave on fertility and this varies greatly across
countries depending on the nature of the leave (Hoorens and others, 2011; Thévenon, 2011). In Nordic countries, there is evidence that where fathers take parental leave, there are more second- and third-order births (Duvander and others, 2010). Research in Sweden has shown that parental-leave allowance reduces the postponement of births (Balbo and others, 2013).
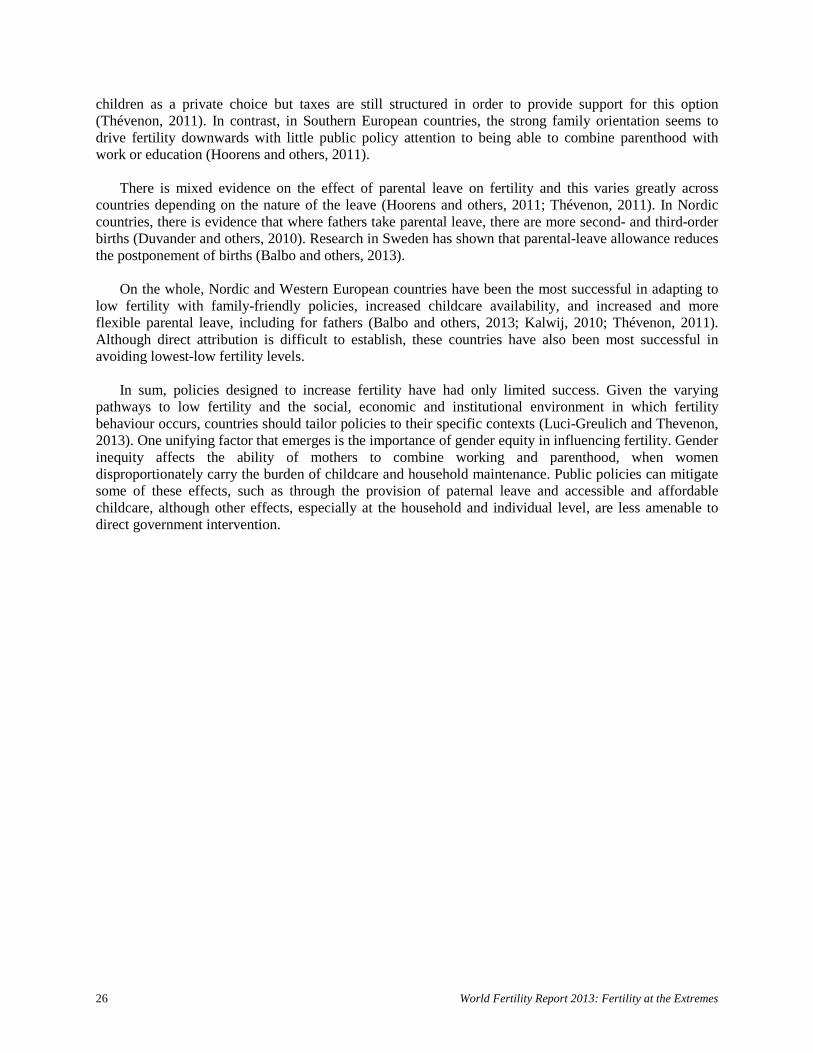
On the whole, Nordic and Western European countries have been the most successful in adapting to
low fertility with family-friendly policies, increased childcare availability, and increased and more flexible parental leave, including for fathers (Balbo and others, 2013; Kalwij, 2010; Thévenon, 2011). Although direct attribution is difficult to establish, these countries have also been most successful in avoiding lowest-low fertility levels.
In sum, policies designed to increase fertility have had only limited success. Given the varying
pathways to low fertility and the social, economic and institutional environment in which fertility behaviour occurs, countries should tailor policies to their specific contexts (Luci-Greulich and Thevenon, 2013). One unifying factor that emerges is the importance of gender equity in influencing fertility. Gender inequity affects the ability of mothers to combine working and parenthood, when women disproportionately carry the burden of childcare and household maintenance. Public policies can mitigate some of these effects, such as through the provision of paternal leave and accessible and affordable childcare, although other effects, especially at the household and individual level, are less amenable to direct government intervention.
United Nations Department of Economic and Social Affairs ǀ Population Division 27
II. HIGH FERTILITY
Since the International Conference on Population and Development (ICPD) in 1994, fertility has continued to fall in many countries and regions in the world. However, fertility still remains considerably above replacement level in a significant number of countries, predominantly in sub-Saharan Africa. Trends in high-fertility countries are important to understand as these countries are increasingly responsible for the largest portion of global population growth. Furthermore, most high-fertility countries are also low-income countries, where a growing and youthful population challenges the public provision of basic services such as for education and health.
In this report, high fertility is defined as a period total fertility level greater than 3.2 children per
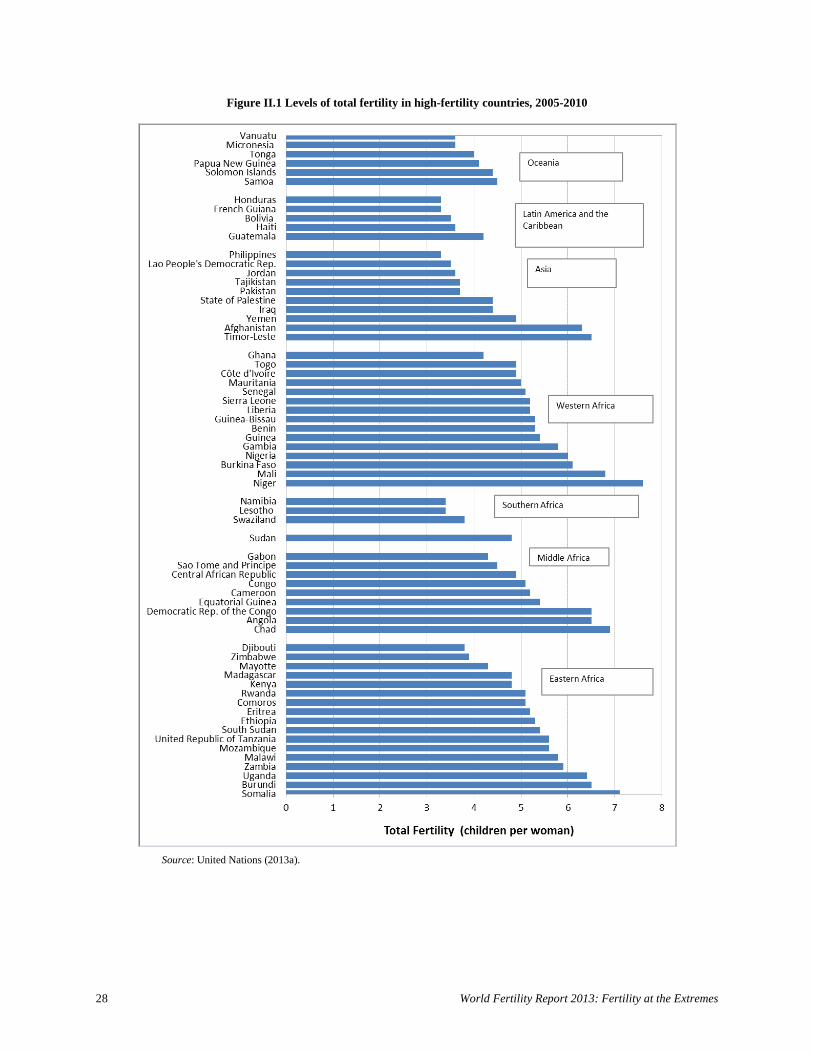
woman in 2005-2010. Among the 66 high-fertility countries, fertility is highest in Eastern Africa, Middle Africa and Western Africa where total fertility is above five children per woman in the majority of high-fertility countries (figure II.1). Fertility, while still high, is much lower in countries of Asia, Latin America and the Caribbean, Southern Africa and Oceania, where many countries included in this report as high-fertility countries, have a total fertility below four children per woman.
A. CHANGES IN TOTAL FERTILITY AND AGE-SPECIFIC FERTILITY RATES
1. Maximum fertility and onset of fertility decline
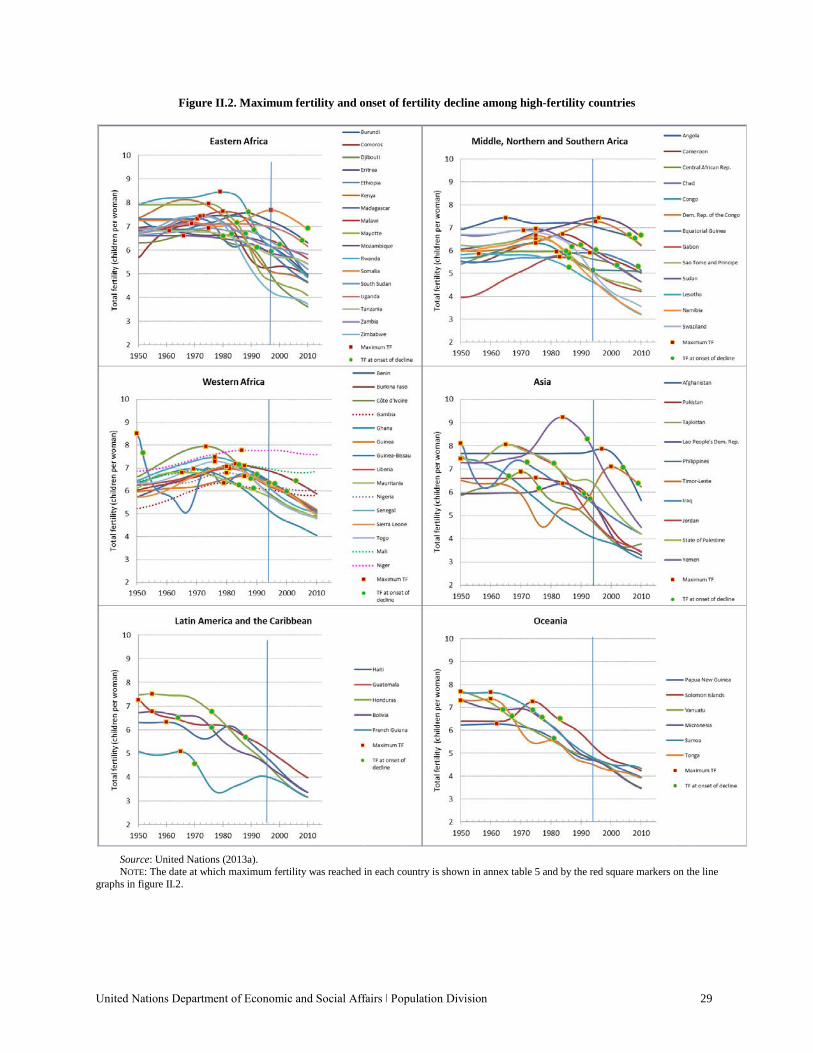
High-fertility countries vary in the timing and speed of fertility decline. The transition from maximum fertility experienced since 1950 to the lowest fertility level (figure II.2) was very steep in many countries, with the steepest transitions predominantly in regions outside of Europe.5 In the majority of high-fertility countries, the maximum fertility reached (the red square markers on the line graphs in figure II.2) was seven or more children per woman. Only among countries in Middle Africa, Northern Africa, Southern Africa and Latin America and the Caribbean was maximum fertility below seven children per woman. There were wide variations in maximum fertility in Eastern Africa, Middle Africa and Asia compared to other regions. Most high-fertility countries in Africa reached maximum fertility much later, after 1975, compared to countries in other regions. All the high-fertility countries in Latin America and the Caribbean experienced maximum fertility by the mid-1960s, as did most high-fertility countries in Oceania (figure II.2).
Fertility decline had already begun in most high-fertility countries by the time of the 1994 ICPD (the
date of the onset of fertility decline is shown by the green round marker for each country in figure II.2; the vertical line marks 1994). All high-fertility countries in Latin America and the Caribbean and Oceania and 80 per cent of high-fertility countries in Asia had begun the fertility transition by 1994, whereas only one in three countries in Middle Africa and about half of countries in Eastern and Western Africa had done so. Among the 23 high-fertility countries not in transition at the time of the 1994 ICPD, most have since entered a fertility transition; by 2010, only three countries have not yet done so and all are in Western Africa (Gambia, Mali and Niger).
5 Maximum fertility is defined in this report as the highest level of period total fertility reached since 1950. The onset of fertility decline is defined as the first year in which there is 10 per cent decline in fertility from maximum fertility and where fertility levels do not return to maximum fertility levels (Coale, 1986).
28 World Fertility Report 2013: Fertility at the Extremes
Figure II.1 Levels of total fertility in high-fertility countries, 2005-2010
Source: United Nations (2013a).
United Nations Department of Economic and Social Affairs ǀ Population Division 29
Figure II.2. Maximum fertility and onset of fertility decline among high-fertility countries
Source: United Nations (2013a). NOTE: The date at which maximum fertility was reached in each country is shown in annex table 5 and by the red square markers on the line graphs in figure II.2.
30 World Fertility Report 2013: Fertility at the Extremes
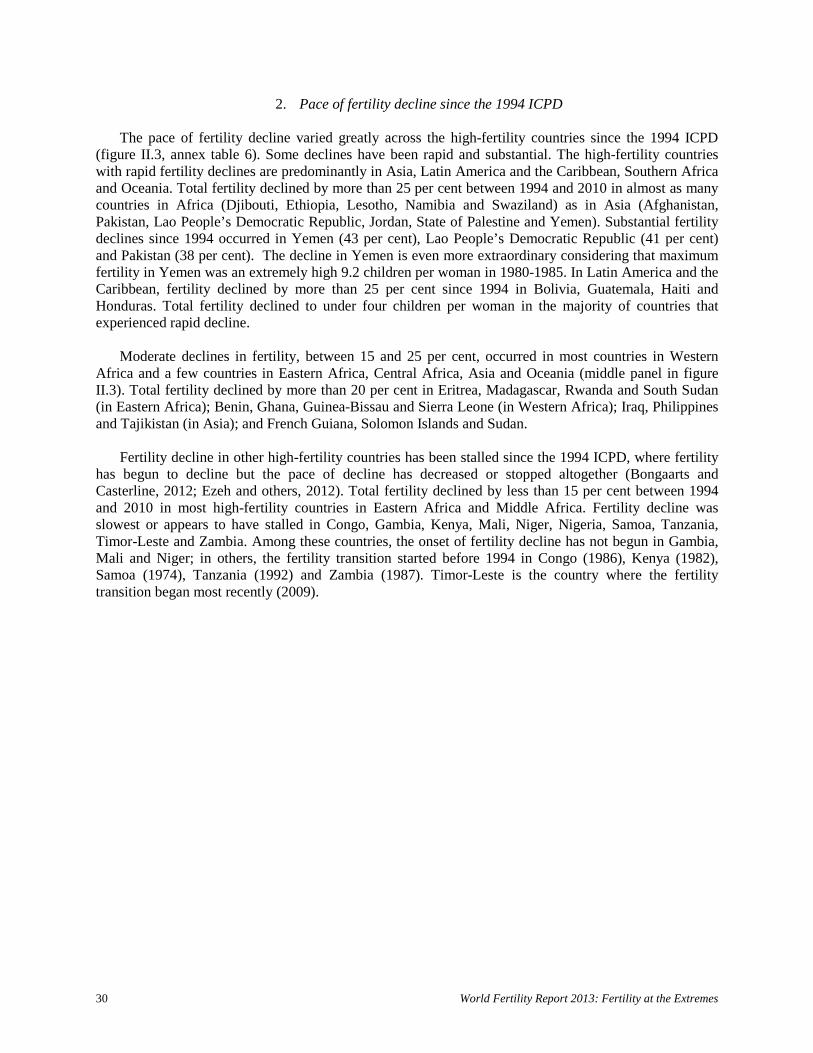
2. Pace of fertility decline since the 1994 ICPD The pace of fertility decline varied greatly across the high-fertility countries since the 1994 ICPD
(figure II.3, annex table 6). Some declines have been rapid and substantial. The high-fertility countries with rapid fertility declines are predominantly in Asia, Latin America and the Caribbean, Southern Africa and Oceania. Total fertility declined by more than 25 per cent between 1994 and 2010 in almost as many countries in Africa (Djibouti, Ethiopia, Lesotho, Namibia and Swaziland) as in Asia (Afghanistan, Pakistan, Lao People’s Democratic Republic, Jordan, State of Palestine and Yemen). Substantial fertility declines since 1994 occurred in Yemen (43 per cent), Lao People’s Democratic Republic (41 per cent) and Pakistan (38 per cent). The decline in Yemen is even more extraordinary considering that maximum fertility in Yemen was an extremely high 9.2 children per woman in 1980-1985. In Latin America and the Caribbean, fertility declined by more than 25 per cent since 1994 in Bolivia, Guatemala, Haiti and Honduras. Total fertility declined to under four children per woman in the majority of countries that experienced rapid decline.
Moderate declines in fertility, between 15 and 25 per cent, occurred in most countries in Western
Africa and a few countries in Eastern Africa, Central Africa, Asia and Oceania (middle panel in figure II.3). Total fertility declined by more than 20 per cent in Eritrea, Madagascar, Rwanda and South Sudan (in Eastern Africa); Benin, Ghana, Guinea-Bissau and Sierra Leone (in Western Africa); Iraq, Philippines and Tajikistan (in Asia); and French Guiana, Solomon Islands and Sudan.
Fertility decline in other high-fertility countries has been stalled since the 1994 ICPD, where fertility
has begun to decline but the pace of decline has decreased or stopped altogether (Bongaarts and Casterline, 2012; Ezeh and others, 2012). Total fertility declined by less than 15 per cent between 1994 and 2010 in most high-fertility countries in Eastern Africa and Middle Africa. Fertility decline was slowest or appears to have stalled in Congo, Gambia, Kenya, Mali, Niger, Nigeria, Samoa, Tanzania, Timor-Leste and Zambia. Among these countries, the onset of fertility decline has not begun in Gambia, Mali and Niger; in others, the fertility transition started before 1994 in Congo (1986), Kenya (1982), Samoa (1974), Tanzania (1992) and Zambia (1987). Timor-Leste is the country where the fertility transition began most recently (2009).
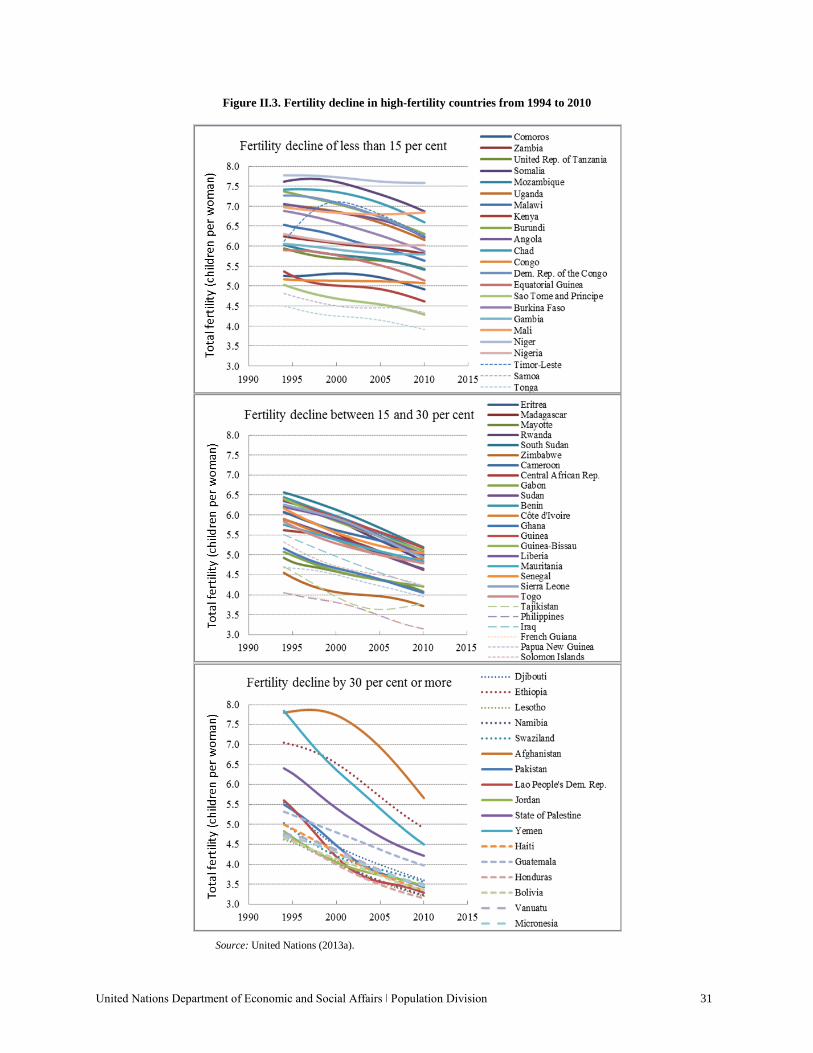
United Nations Department of Economic and Social Affairs ǀ Population Division 31
Figure II.3. Fertility decline in high-fertility countries from 1994 to 2010
Source: United Nations (2013a).
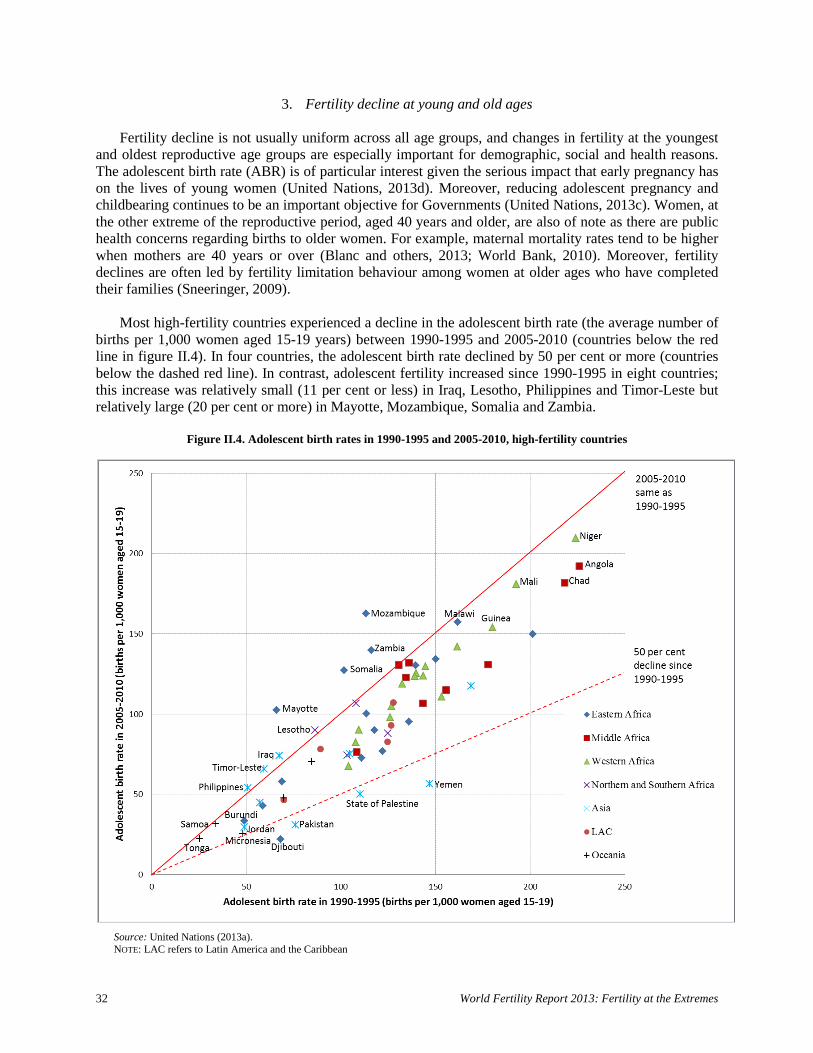
32 World Fertility Report 2013: Fertility at the Extremes
3. Fertility decline at young and old ages Fertility decline is not usually uniform across all age groups, and changes in fertility at the youngest
and oldest reproductive age groups are especially important for demographic, social and health reasons. The adolescent birth rate (ABR) is of particular interest given the serious impact that early pregnancy has on the lives of young women (United Nations, 2013d). Moreover, reducing adolescent pregnancy and childbearing continues to be an important objective for Governments (United Nations, 2013c). Women, at the other extreme of the reproductive period, aged 40 years and older, are also of note as there are public health concerns regarding births to older women. For example, maternal mortality rates tend to be higher when mothers are 40 years or over (Blanc and others, 2013; World Bank, 2010). Moreover, fertility declines are often led by fertility limitation behaviour among women at older ages who have completed their families (Sneeringer, 2009).
Most high-fertility countries experienced a decline in the adolescent birth rate (the average number of
births per 1,000 women aged 15-19 years) between 1990-1995 and 2005-2010 (countries below the red line in figure II.4). In four countries, the adolescent birth rate declined by 50 per cent or more (countries below the dashed red line). In contrast, adolescent fertility increased since 1990-1995 in eight countries; this increase was relatively small (11 per cent or less) in Iraq, Lesotho, Philippines and Timor-Leste but relatively large (20 per cent or more) in Mayotte, Mozambique, Somalia and Zambia.
Figure II.4. Adolescent birth rates in 1990-1995 and 2005-2010, high-fertility countries
Source: United Nations (2013a). NOTE: LAC refers to Latin America and the Caribbean
United Nations Department of Economic and Social Affairs ǀ Population Division 33
Countries with persistently high adolescent birth rates are concentrated mainly in Middle Africa and Western Africa. Angola, Chad, Mali and Niger had the highest adolescent birth rates in 2005-2010 (more than 180 births per 1,000 women aged 15-19) despite declines since 1990-1995. Even within the same region, adolescent birth rates vary widely among high-fertility countries. In Eastern Africa, for example, Burundi, Djibouti and Rwanda have adolescent birth rates below 50 births per 1,000 women aged 15-19 while Malawi, Mozambique and Uganda have high rates of 150 births or more per 1,000 women aged 15-19 years.
The fertility of older women, measured as the age-specific fertility rate of women aged 40-44 years
has dramatically declined, in many high-fertility countries since the 1994 ICPD (figure II.5). In Lao People’s Democratic Republic, Namibia and Pakistan, fertility among older women declined by 50 per cent or more since 1990-1995 (countries below the red dashed line in figure II.5). By 2005-2010, only four high-fertility countries (Gambia, Papua New Guinea, Tajikistan and Timor-Leste) had birth rates among older women higher than levels in 1990-1995. Nonetheless, fertility among older women remains high in many countries in Eastern Africa and Western Africa, including Burundi, Mali, Niger, Rwanda and Somalia where more than 100 births per 1,000 women aged 40-44 years occurred in 2005-2010.
Figure II.5. Birth rate of women aged 40-44 years in 1990-1995 and 2005-2010, high-fertility countries
Source: United Nations (2013a).
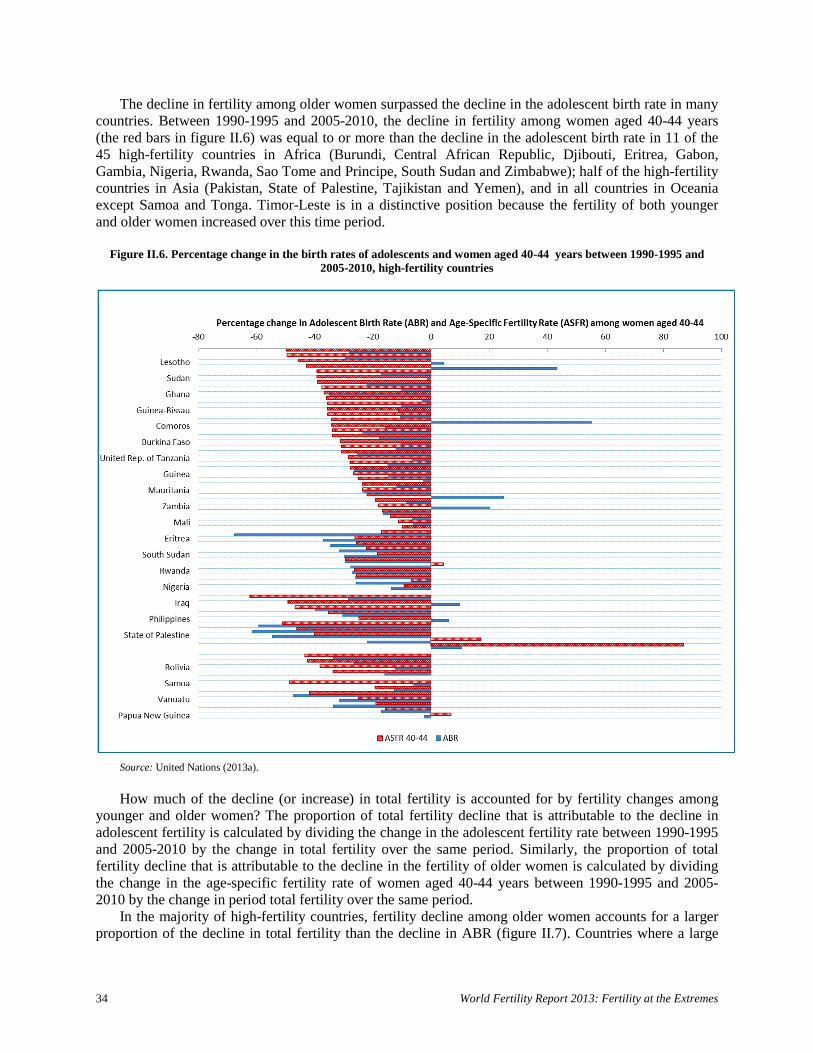
34 World Fertility Report 2013: Fertility at the Extremes
The decline in fertility among older women surpassed the decline in the adolescent birth rate in many countries. Between 1990-1995 and 2005-2010, the decline in fertility among women aged 40-44 years (the red bars in figure II.6) was equal to or more than the decline in the adolescent birth rate in 11 of the 45 high-fertility countries in Africa (Burundi, Central African Republic, Djibouti, Eritrea, Gabon, Gambia, Nigeria, Rwanda, Sao Tome and Principe, South Sudan and Zimbabwe); half of the high-fertility countries in Asia (Pakistan, State of Palestine, Tajikistan and Yemen), and in all countries in Oceania except Samoa and Tonga. Timor-Leste is in a distinctive position because the fertility of both younger and older women increased over this time period.
Figure II.6. Percentage change in the birth rates of adolescents and women aged 40-44 years between 1990-1995 and
2005-2010, high-fertility countries
Source: United Nations (2013a).
How much of the decline (or increase) in total fertility is accounted for by fertility changes among
younger and older women? The proportion of total fertility decline that is attributable to the decline in adolescent fertility is calculated by dividing the change in the adolescent fertility rate between 1990-1995 and 2005-2010 by the change in total fertility over the same period. Similarly, the proportion of total fertility decline that is attributable to the decline in the fertility of older women is calculated by dividing the change in the age-specific fertility rate of women aged 40-44 years between 1990-1995 and 2005-2010 by the change in period total fertility over the same period.
In the majority of high-fertility countries, fertility decline among older women accounts for a larger proportion of the decline in total fertility than the decline in ABR (figure II.7). Countries where a large
United Nations Department of Economic and Social Affairs ǀ Population Division 35
proportion of total fertility decline is attributed to the decline in ABR are also countries where the decline in total fertility was small between 1990-1995 and 2005-2010. This is the case in countries such as Angola, Chad, Mali, Niger, Nigeria and Uganda, where a relatively small decline in the adolescent birth rate accounted for between 25 and 40 per cent of the overall decline in total fertility. In Gambia, the decline in adolescent fertility accounted for a 72 per cent decline in total fertility despite the relative stall in fertility change between 1994 and 2010 (figure II.3). In a number of countries, the contribution of adolescent fertility was negative. In other words, total fertility declined due to declining fertility at older ages and despite an increase in the adolescent birth rate.
In high-fertility countries where the decline in total fertility has been small, a large proportion of the
fertility decline is attributed to declines in fertility among both younger and older women. Fertility change among younger women aged 15-19 years and older women aged 40-44 years accounts for 88 per cent of the decline in total fertility in Comoros, 67 per cent in Gambia and 86 per cent in Niger between 1990-1995 and 2005-2010. In Angola, Chad, Mali, Nigeria, Uganda and Tanzania, 40-60 per cent of the decline in total fertility is attributed to fertility declines in these two age groups.
In most high-fertility countries, the decline in fertility among older women contributed to at least 10
per cent of the overall decline in total fertility since 1990-1995 (figure II.7). Among 33 high-fertility countries, fertility decline among older women contributed to 20 per cent or more of the fertility decline during this period and in 5 of these countries, over 50 per cent of the decline. Where the decline in the fertility of older women contributed disproportionately to the overall decline in total fertility, the age-specific fertility rates of younger women often increased over this period. Fertility in these countries could have declined further had there been concurrent declines in adolescent fertility.
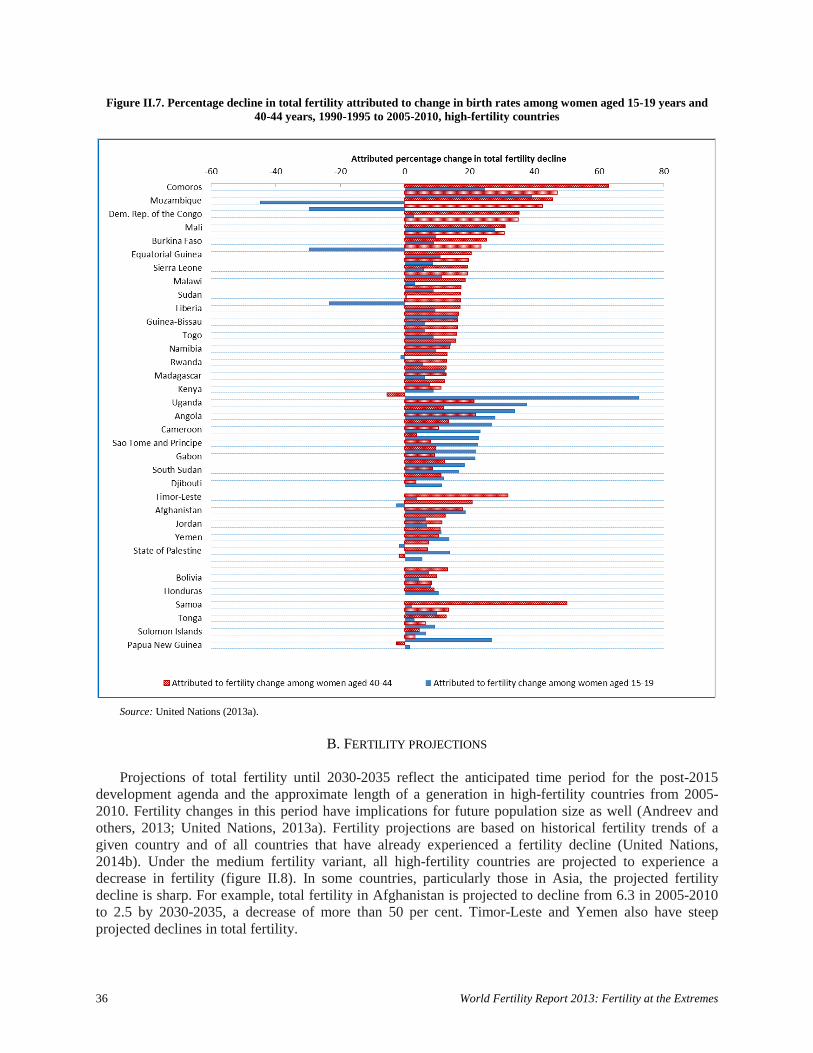
36 World Fertility Report 2013: Fertility at the Extremes
Figure II.7. Percentage decline in total fertility attributed to change in birth rates among women aged 15-19 years and 40-44 years, 1990-1995 to 2005-2010, high-fertility countries
Source: United Nations (2013a).
B. FERTILITY PROJECTIONS
Projections of total fertility until 2030-2035 reflect the anticipated time period for the post-2015
development agenda and the approximate length of a generation in high-fertility countries from 2005-2010. Fertility changes in this period have implications for future population size as well (Andreev and others, 2013; United Nations, 2013a). Fertility projections are based on historical fertility trends of a given country and of all countries that have already experienced a fertility decline (United Nations, 2014b). Under the medium fertility variant, all high-fertility countries are projected to experience a decrease in fertility (figure II.8). In some countries, particularly those in Asia, the projected fertility decline is sharp. For example, total fertility in Afghanistan is projected to decline from 6.3 in 2005-2010 to 2.5 by 2030-2035, a decrease of more than 50 per cent. Timor-Leste and Yemen also have steep projected declines in total fertility.

United Nations Department of Economic and Social Affairs ǀ Population Division 37
Yet some of the highest fertility countries, particularly in Western African (Gambia, Mali, Niger and Nigeria), are projected to experience a decline of less than 25 per cent in total fertility by 2030-2035. The only countries with projected total fertility above four children per woman by 2030-2035 are in Eastern Africa, Middle Africa and Western Africa. Niger and Mali are projected to be global outliers with significantly higher fertility rates (more than 5.5 children per woman) than any other country. No high-fertility country is projected to reach below-replacement level fertility by 2030-2035.
Figure II.8. Total fertility for countries, 2005-2010 and projections for 2030-2035, high-fertility countries
Source: United Nations (2013a) from medium fertility variant. NOTES: CAR refers to Central African Republic, GB refers to Guinea-Bissau, SL refers to Sierra Leone, PNG refers to Papua New Guinea, ST&P refers to Sao Tome and Principe, SI refers to Solomon Islands.
C. CHANGES IN FERTILITY TIMING, MARRIAGE AND CONTRACEPTIVE USE
Many factors have contributed to the decline in fertility in high-fertility countries. These factors can be divided into broad cultural, economic and social factors, such as education or economic growth, that affect fertility through changes in proximate determinants such as marriage and sexual unions, breastfeeding, sterility, abortion and contraceptive use. A thorough consideration of all these factors is beyond the scope of this report. Instead, the focus is on changes in key correlates of fertility decline for which adequate data are currently available: age at first marriage, age at first birth, contraceptive use and unmet need for family planning (limiting and spacing).
38 World Fertility Report 2013: Fertility at the Extremes
1. Age at first marriage and first birth
In the majority of high-fertility countries, women are increasingly postponing first marriage to older ages. Age at first marriage represents for many women, the first exposure to the risk of pregnancy and childbearing. As a result, a younger age of marriage is associated with higher fertility rates as well as broader social, economic and health problems resulting from child and early marriage. Mean age at first birth marks the entry into motherhood and has risen in most countries, although the mean age at first birth still remains relatively young in countries in sub-Saharan Africa, especially Western Africa. In addition to the demographic, social and health issues surrounding adolescent childbearing (United Nations 2013d), a younger woman is exposed to a longer childbearing period if her first birth occurs early and she is likely to bear more children than if her first birth occurs later.
The female mean age at first marriage is generally increasing in high-fertility countries (first panel of
figure II.9 and annex table 7).6 Of the 29 high-fertility countries with available data, 27 had an increase in the female mean age at first marriage although overall regional trends are unclear. Still, the mean age at first marriage was less than 20 years in 18 countries according to the most recent data available (around 2009), down from 21 countries in the 1990s. Many countries in Middle Africa and Western Africa still had particularly young ages at first marriage fort the latest data point available. Six countries had a mean age at first marriage of less than 18 years for the latest point available, compared with 11 countries in the 1990s. The countries with the largest absolute increase in the mean age at first marriage are Eritrea, Gabon and Ghana, where the mean age at first marriage increased by 1.4 years per decade. In only one country, Madagascar, the female mean age at first marriage decreased over this time period.
There has also been an increase in the mean age at first birth in many high-fertility countries since the time of the ICPD (second panel of figure II.9 and annex table 7). Although countries in Middle Africa and Western Africa tend to have lower mean ages at first birth, many countries in this region have had substantial increases over time in the mean age at first birth. The increases in Eastern Africa and Southern Africa and in Latin America and the Caribbean have been more modest with Eritrea and Madagascar even experiencing a decrease in the mean age at first birth. Rwanda stands out as having a particularly high mean age at first birth for the region (22.9 years in 2010). The four high-fertility countries in Asia with data continue to have much older mean ages at first birth (22 years or older). Nonetheless, of the 29 high-fertility countries with data, the mean age at first birth was below 20 years for 19 countries in the 1990s and in 14 countries for the most recent year (since 2001).
The relationship between fertility change and the female mean age at first marriage and mean age at first birth shows that the adolescent birth rate has decreased as the mean age at first marriage and the mean age at first birth have increased in most countries with available data (figure II.9). Two exceptions are Mozambique and Zambia (the red arrows pointing upward), where the adolescent birth rate increased despite increases in the mean age at first marriage and mean age at first birth. While there is a general association between older ages at first marriage and first birth and lower levels of adolescent childbearing, the association is weak between older ages at marriage and trends in total fertility (Garenne, 2014).
6 For 28 out of the 29 countries included in this analysis, the mean age at first marriage is based on national household surveys (mainly Demographic and Health Surveys) using the median age at first marriage for women aged 25-29 years. Because the data are drawn from surveys, a range of dates is used with the closest point to 1994 (from 1990-2000) and the latest point available (from 2001-2013).
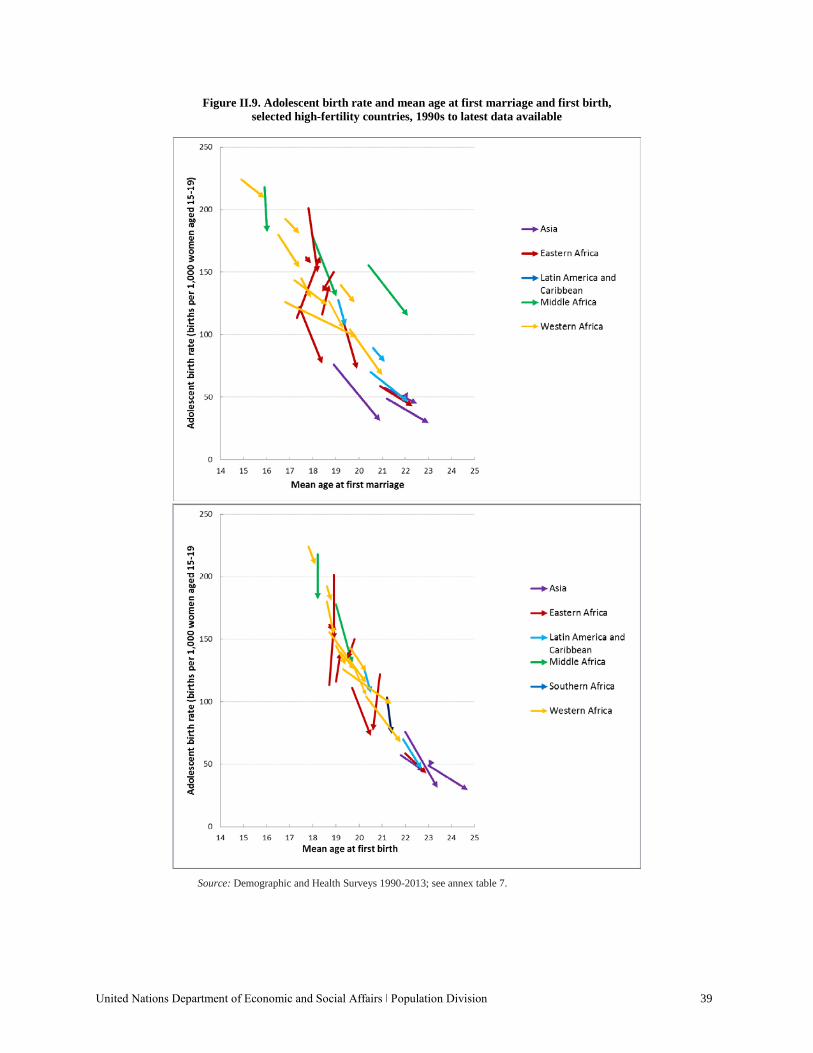
United Nations Department of Economic and Social Affairs ǀ Population Division 39
Figure II.9. Adolescent birth rate and mean age at first marriage and first birth, selected high-fertility countries, 1990s to latest data available
Source: Demographic and Health Surveys 1990-2013; see annex table 7.
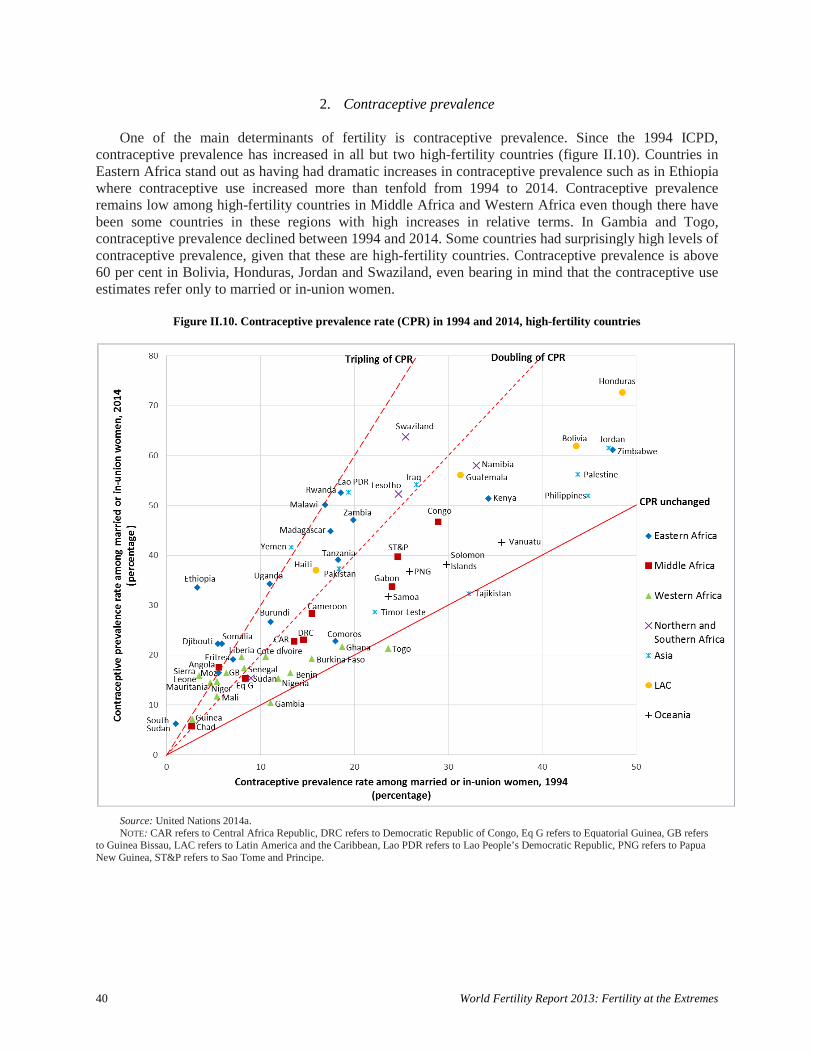
40 World Fertility Report 2013: Fertility at the Extremes
2. Contraceptive prevalence
One of the main determinants of fertility is contraceptive prevalence. Since the 1994 ICPD, contraceptive prevalence has increased in all but two high-fertility countries (figure II.10). Countries in Eastern Africa stand out as having had dramatic increases in contraceptive prevalence such as in Ethiopia where contraceptive use increased more than tenfold from 1994 to 2014. Contraceptive prevalence remains low among high-fertility countries in Middle Africa and Western Africa even though there have been some countries in these regions with high increases in relative terms. In Gambia and Togo, contraceptive prevalence declined between 1994 and 2014. Some countries had surprisingly high levels of contraceptive prevalence, given that these are high-fertility countries. Contraceptive prevalence is above 60 per cent in Bolivia, Honduras, Jordan and Swaziland, even bearing in mind that the contraceptive use estimates refer only to married or in-union women.
Figure II.10. Contraceptive prevalence rate (CPR) in 1994 and 2014, high-fertility countries
Source: United Nations 2014a. NOTE: CAR refers to Central Africa Republic, DRC refers to Democratic Republic of Congo, Eq G refers to Equatorial Guinea, GB refers
to Guinea Bissau, LAC refers to Latin America and the Caribbean, Lao PDR refers to Lao People’s Democratic Republic, PNG refers to Papua New Guinea, ST&P refers to Sao Tome and Principe.
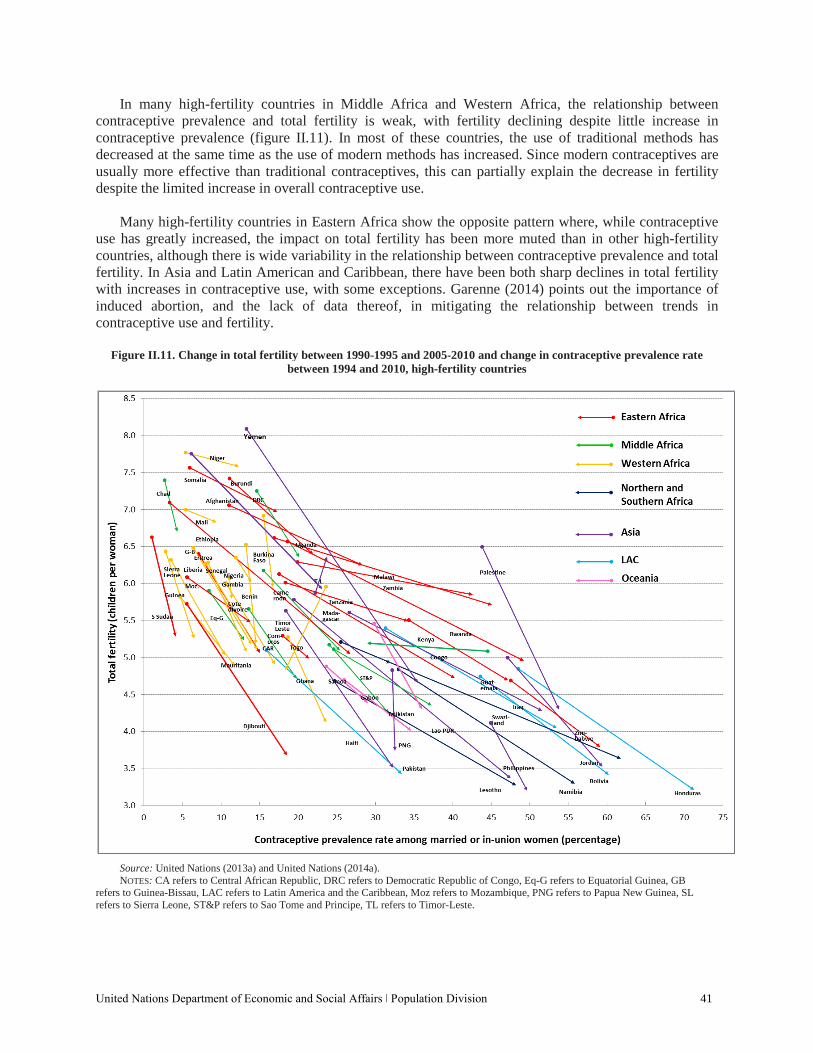
United Nations Department of Economic and Social Affairs ǀ Population Division 41
In many high-fertility countries in Middle Africa and Western Africa, the relationship between contraceptive prevalence and total fertility is weak, with fertility declining despite little increase in contraceptive prevalence (figure II.11). In most of these countries, the use of traditional methods has decreased at the same time as the use of modern methods has increased. Since modern contraceptives are usually more effective than traditional contraceptives, this can partially explain the decrease in fertility despite the limited increase in overall contraceptive use.
Many high-fertility countries in Eastern Africa show the opposite pattern where, while contraceptive
use has greatly increased, the impact on total fertility has been more muted than in other high-fertility countries, although there is wide variability in the relationship between contraceptive prevalence and total fertility. In Asia and Latin American and Caribbean, there have been both sharp declines in total fertility with increases in contraceptive use, with some exceptions. Garenne (2014) points out the importance of induced abortion, and the lack of data thereof, in mitigating the relationship between trends in contraceptive use and fertility.
Figure II.11. Change in total fertility between 1990-1995 and 2005-2010 and change in contraceptive prevalence rate
between 1994 and 2010, high-fertility countries
Source: United Nations (2013a) and United Nations (2014a). NOTES: CA refers to Central African Republic, DRC refers to Democratic Republic of Congo, Eq-G refers to Equatorial Guinea, GB
refers to Guinea-Bissau, LAC refers to Latin America and the Caribbean, Moz refers to Mozambique, PNG refers to Papua New Guinea, SL refers to Sierra Leone, ST&P refers to Sao Tome and Principe, TL refers to Timor-Leste.
42 World Fertility Report 2013: Fertility at the Extremes
The relationship between the change in contraceptive prevalence and change in total fertility is stronger among high-fertility countries in Asia than those in other regions. High-fertility countries in Eastern Africa, Northern Africa and Southern Africa are more similar to countries in Asia, whereas Middle African and Western African countries are more similar to Latin American and Caribbean countries where the change in total fertility is less closely associated with contraceptive use.
Contraceptive use includes many traditional methods that are generally less effective in preventing
pregnancy than modern contraceptive methods. The uptake of modern methods of contraception tends to account for contemporary fertility declines more so than the use of traditional methods. An increase in contraceptive use overall without a parallel increase in the use of modern methods is unlikely to have an impact on fertility. Most high-fertility countries in Eastern Africa have seen notable gains in modern contraceptive prevalence together with declines in total fertility, although the fertility declines have been less steep than those observed in high-fertility countries in Asia and Latin America and the Caribbean.
3. Unmet need for family planning
In the majority of high-fertility countries, the increase in contraceptive prevalence has not kept pace
with increasing demand. The percentage of women with an unmet need for family planning (i.e., women who wish to postpone their next pregnancy or stop having children altogether but, for whatever reason, are not using contraception) indicates the degree to which high-fertility countries have not addressed demand for contraceptives. Among high-fertility countries, unmet need for family planning ranges from 11 per cent of married women of reproductive age to 37 per cent (latest data point available). High-fertility countries in Asia and Latin America and the Caribbean tend to have lower levels of unmet need than countries in Eastern Africa, Middle Africa and Western Africa. However, there are some high-fertility countries in Western Africa, such as Niger and Nigeria, that also have relatively low levels of unmet need due to high desired fertility.
Unmet need can be for either limiting childbearing (when a woman wishes to have no more children)
or for delaying or spacing births (when a woman wishes to have a child two or more years later). It is important to make this distinction because different types of contraception are relevant for the different types of unmet need. Among high-fertility countries with low levels of contraceptive prevalence, the vast majority of unmet need is for spacing. Most high-fertility countries with the highest percentage of unmet need for spacing are in sub-Saharan Africa, except Haiti and Timor Leste (figure II.12). Unmet need for limiting among high-fertility countries in Middle Africa and Western Africa is lower than among high-fertility countries in Asia and Latin America and the Caribbean. Although meeting unmet need for family planning is important for social and health reasons, the fertility impact of meeting unmet need for spacing is considered to be less than meeting unmet need for limiting, which partially explains a weak relationship between fertility decline and meeting demand for contraception in sub-Saharan Africa (Casterline and El-Zeini, 2014).
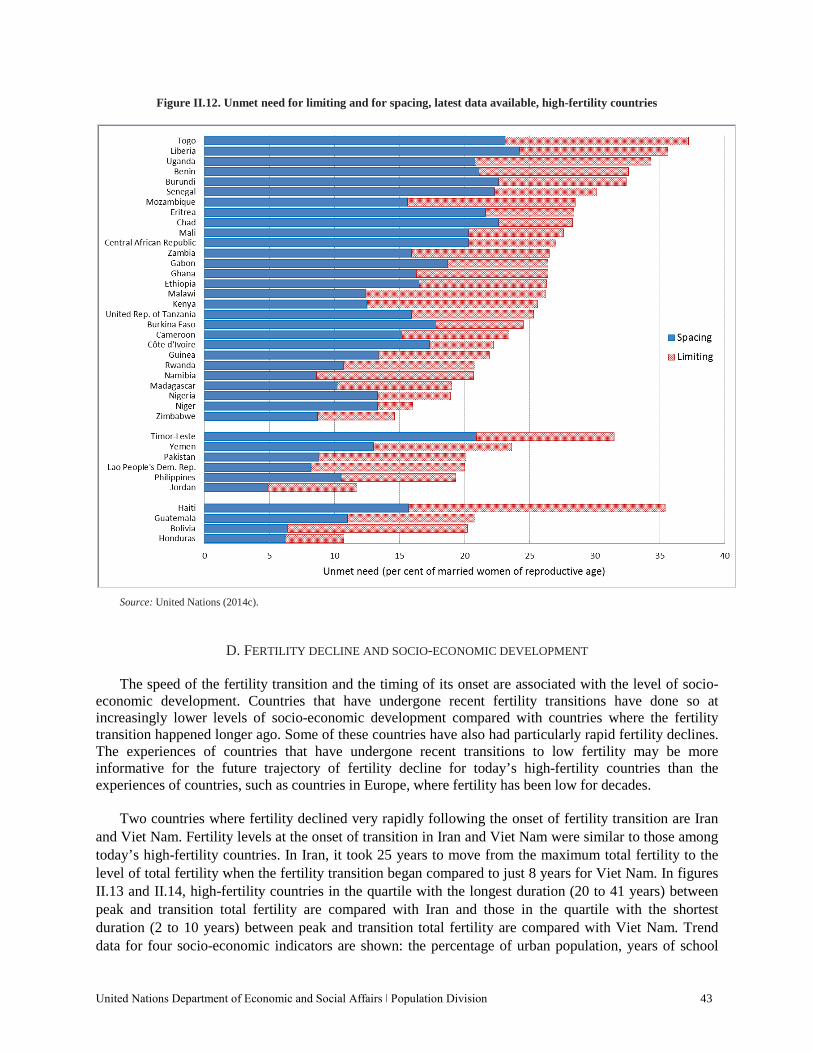
United Nations Department of Economic and Social Affairs ǀ Population Division 43
Figure II.12. Unmet need for limiting and for spacing, latest data available, high-fertility countries
Source: United Nations (2014c).
D. FERTILITY DECLINE AND SOCIO-ECONOMIC DEVELOPMENT
The speed of the fertility transition and the timing of its onset are associated with the level of socio-economic development. Countries that have undergone recent fertility transitions have done so at increasingly lower levels of socio-economic development compared with countries where the fertility transition happened longer ago. Some of these countries have also had particularly rapid fertility declines. The experiences of countries that have undergone recent transitions to low fertility may be more informative for the future trajectory of fertility decline for today’s high-fertility countries than the experiences of countries, such as countries in Europe, where fertility has been low for decades.
Two countries where fertility declined very rapidly following the onset of fertility transition are Iran
and Viet Nam. Fertility levels at the onset of transition in Iran and Viet Nam were similar to those among today’s high-fertility countries. In Iran, it took 25 years to move from the maximum total fertility to the level of total fertility when the fertility transition began compared to just 8 years for Viet Nam. In figures II.13 and II.14, high-fertility countries in the quartile with the longest duration (20 to 41 years) between peak and transition total fertility are compared with Iran and those in the quartile with the shortest duration (2 to 10 years) between peak and transition total fertility are compared with Viet Nam. Trend data for four socio-economic indicators are shown: the percentage of urban population, years of school
44 World Fertility Report 2013: Fertility at the Extremes
life expectancy for females from primary to secondary, infant mortality rate and contraceptive prevalence. No country has attained middle-income status without urban population growth and few have reached income levels of $10,000 per capita before reaching about 60 per cent urbanization (Annez and Buckley, 2009). Urban population growth creates structural shifts that are necessary in attaining middle-income status, higher school completion rates, improved water and sanitation facilities and higher levels of contraceptive use. Research also shows that child survival and family planning programmes play important complementary roles in fertility decline (Cohen and Montgomery, 1997).
For most high-fertility countries, the fertility transition started when socio-economic indicators were
at lower levels that appear insufficient to spur rapid fertility decline (as was the case for Iran and Viet Nam). Among high-fertility countries with the longest durations between peak and transition total fertility (similar to Iran’s pattern), the level of urbanization tended to be lower and with somewhat slower growth over time than what occurred in Iran and the number of years of schooling from primary to secondary for girls was shorter (figure II.13). Among high-fertility countries with the shortest durations between peak and transition total fertility (similar to Viet Nam’s pattern), countries tended to begin their fertility transitions at lower levels of female education but there was no clear pattern with respect to urbanization levels.
For both groups of high-fertility countries, the fertility transition began when there were higher levels
of infant mortality and lower contraceptive prevalence levels compared with the low-fertility countries of Iran and Viet Nam at the time of their fertility transitions (figure II.14). For example, contraceptive prevalence at the onset of the fertility transition was 47 per cent in Iran and 29 per cent in Viet Nam, and levels rose steeply since that time point to over 75 per cent by 2010. In contrast, contraceptive prevalence was much lower at the time the fertility transition began for almost all of today’s high-fertility countries and the pace of increase has been much slower.
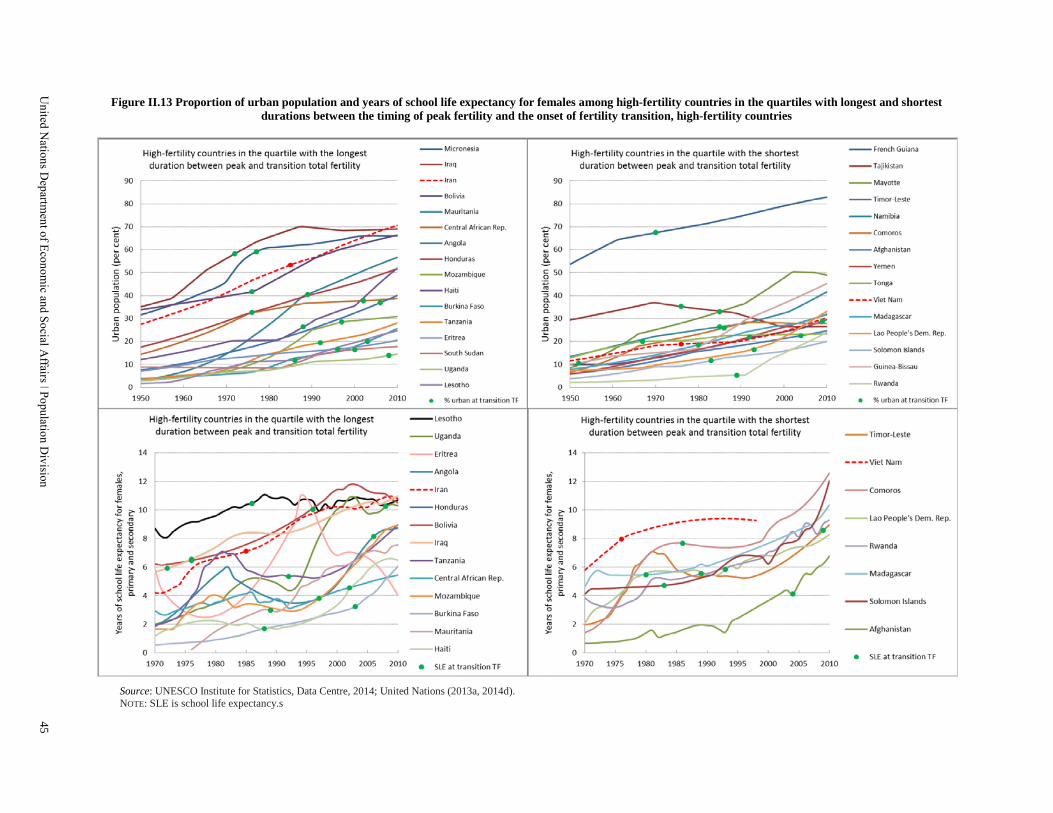
Figure II.13 Proportion of urban population and years of school life expectancy for females among high-fertility countries in the quartiles with longest and shortest durations between the timing of peak fertility and the onset of fertility transition, high-fertility countries
Source: UNESCO Institute for Statistics, Data Centre, 2014; United Nations (2013a, 2014d). NOTE: SLE is school life expectancy.s
United N
ations Departm
ent of Economic and Social A
ffairs ǀ Population Division
45
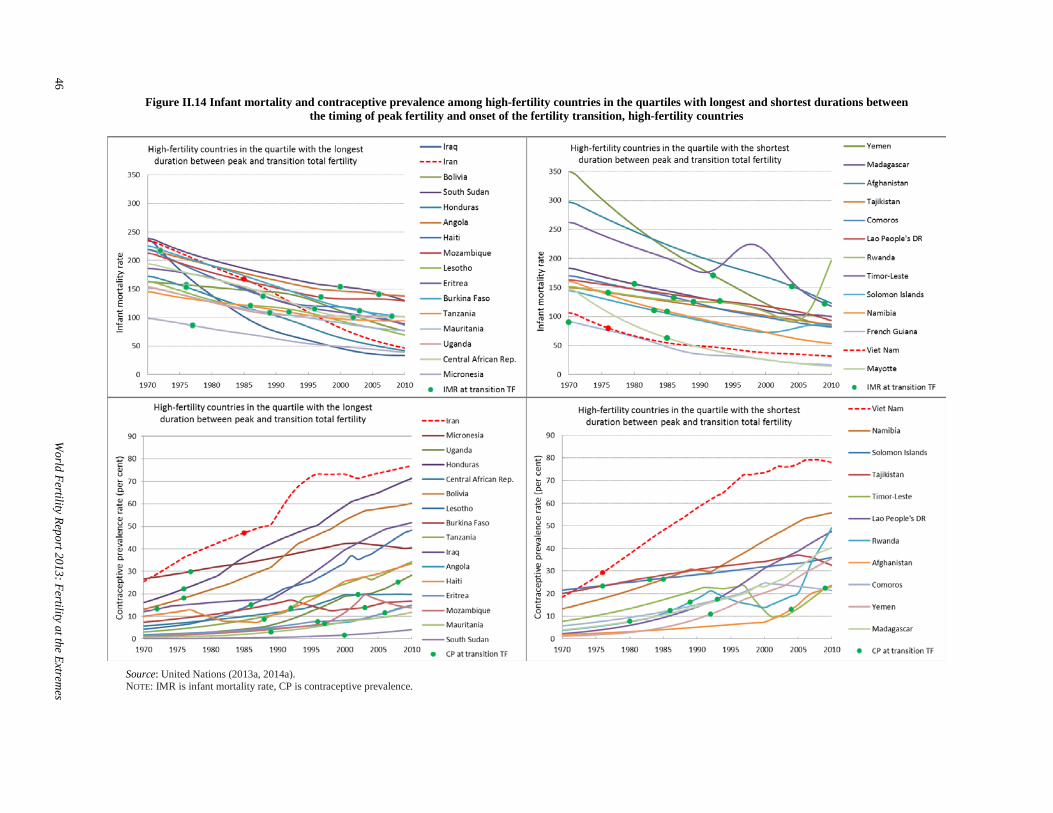
Figure II.14 Infant mortality and contraceptive prevalence among high-fertility countries in the quartiles with longest and shortest durations between the timing of peak fertility and onset of the fertility transition, high-fertility countries
Source: United Nations (2013a, 2014a). NOTE: IMR is infant mortality rate, CP is contraceptive prevalence.
46
World Fertility Report 2013: Fertility at the Extrem
es
United Nations Department of Economic and Social Affairs ǀ Population Division 47
E. CONSEQUENCES OF HIGH FERTILITY
Sustained high fertility has profound implications for population growth, the age structure, the provision of public services, maternal and child health, and the environment and natural resources. At the time of the 1994 ICPD, high fertility was common in the majority of countries in developing regions. Now, high fertility levels are predominantly in sub-Saharan Africa with only a small number of high-fertility countries outside of this region. Although there are fewer high-fertility countries today, and many have undergone significant declines in fertility, these countries will continue to contribute an increasing proportion to global population growth (Andreev and others, 2013) and the attendant development implications of a fast-growing population at the national level.
Fertility rates are the most significant driver of population age structures. Where fertility rates are
high and sustained, populations will grow and have a more youthful structure. A rapid decline in fertility, where fertility rates have been high in the past, can eventually lead to a bulge in the working-age population and smaller populations of older adults and children. With such a bulge in the working-age population, it is possible to unleash enormous economic gains (May 2012:49)—the so-called “demographic dividend”—yet the gains from the demographic dividend are not an automatic result from age-structure changes. These changes can yield economic benefits if countries make investments in human capital, especially schooling, job growth and good governance, encouraging financial investment and savings (Bloom and others, 2003; Bloom and Canning, 2008; Eloundou-Enyegue, 2013).
The consequences of high fertility for education are complex. The rapid population growth that
accompanies high fertility levels makes provision of public services like schooling more challenging as these services need to keep pace with the growing population. Where fertility declines rapidly, children have higher education levels, there is greater asset accumulation and greater use of preventive health services (Bongaarts and others, 2012). Evidence from Bangladesh shows that in areas experiencing lower fertility, children complete more schooling (Joshi and Schultz, 2012). The number of siblings also negatively correlates with schooling outcomes in developing countries (National Research Council and Institute of Medicine, 2005). The inverse relationship between education and fertility could also exacerbate inequalities since fertility usually decreases first among more educated mothers (Elondou-Enyegue and Williams, 2006).
Reductions in high fertility are also associated with positive trends in maternal mortality. In
particular, fertility reductions generally translate into fewer risky pregnancies such as those of very young or very old mothers, those at high parity and of women with closely-spaced pregnancies (Campbell and Graham, 2006; Ahmed and others, 2012; Bongaarts and others, 2012; Cleland and others, 2012). Family planning is a key component for achieving fertility declines and reductions in maternal mortality, and it has the additional benefit of reducing the number of unintended pregnancies and therefore maternal mortality and morbidity due to unsafe abortion (Ahmed and others, 2012; Cleland and others, 2012).
48 World Fertility Report 2013: Fertility at the Extremes
The health benefits of fertility decline extend to children as well. Decreasing fertility is often associated with increasing birth intervals, especially in sub-Saharan Arica. Shorter birth intervals are known to be associated with decreased child survival: the shorter the birth interval, the greater the risk of mortality (Rutstein, 2008; Rutstein and Winter, 2014). Data show associations between birth interval length below 33 months and adverse perinatal outcomes, probably related to maternal nutritional depletion (Rutstein, 2008). For early childhood mortality, there is no threshold in the effect of interval length with the longer the interval, the smaller the risk of dying (Rutstein, 2008). The mechanisms are complicated but thought to include competition for resources and cross-infection from older siblings (Bongaarts and others, 2012). Rapid subsequent births also raise mortality for older siblings (Hobcraft and others, 1985). Since preferred birth intervals exceed three years in many sub-Saharan African countries, meeting the relatively high proportion of unmet need for family planning for spacing in these countries could improve child survival even without a change in desired family size (Bongaarts and others, 2012).
Children from high-order births (order four and higher) are known to be at greater risk of dying
during childhood (Rutstein and Winter, 2014), therefore reducing unintended higher-order births through decreasing fertility will lead to decreased child mortality. In addition, similar to maternal mortality, maternal age also has an impact on child survival, with a significantly higher risk of dying throughout childhood to children born to mothers less than 18 years. For children born to older mothers over 35 years, the excess risk only exists for neonatal mortality and is balanced by a reduced risk of dying for children aged one to four years (Rutstein and Winter, 2014).
Lastly, high fertility and the high rate of population growth that it fosters can have a negative impact
on the environment and natural resources (United Nations, 2011; World Bank, 2010). While there are questions over the direct relationship between demographic change and the environment, population growth has been implicated in deforestation and desertification, two outcomes that are of particular importance for poor agrarian countries, especially in sub-Saharan Africa (World Bank, 2010). Sahelian countries (Burkina Faso, Chad, Gambia, Guinea-Bissau, Mali, Mauritania, Niger and Senegal) are particularly vulnerable to the consequences of climate change and are also countries that face high population growth rates (Bongaarts and others, 2012). For example, Niger already has severe food shortages and high levels of malnutrition among children that are predicted to be exacerbated by high population growth and the expected impacts of climate change and environmental degradation, leading to greater risk of humanitarian crises in the coming decades (May, 2012, p. 163; Potts and others, 2011).
F. POLICY APPROACHES TO HIGH FERTILITY
High fertility and associated population growth present major challenges to Governments. In response to such challenges, a variety of public policies have either been considered or implemented to reduce fertility levels. High-fertility countries varied in their policy approaches towards fertility around the time of the 1994 ICPD, but many countries have since moved to adopt policies to lower fertility (figure II.15).This general change among high-fertility countries towards policies to reduce fertility is part of a longer trend reaching back to the 1970s. As of 2013, Equatorial Guinea was the only high-fertility country that remained with a policy to raise fertility.
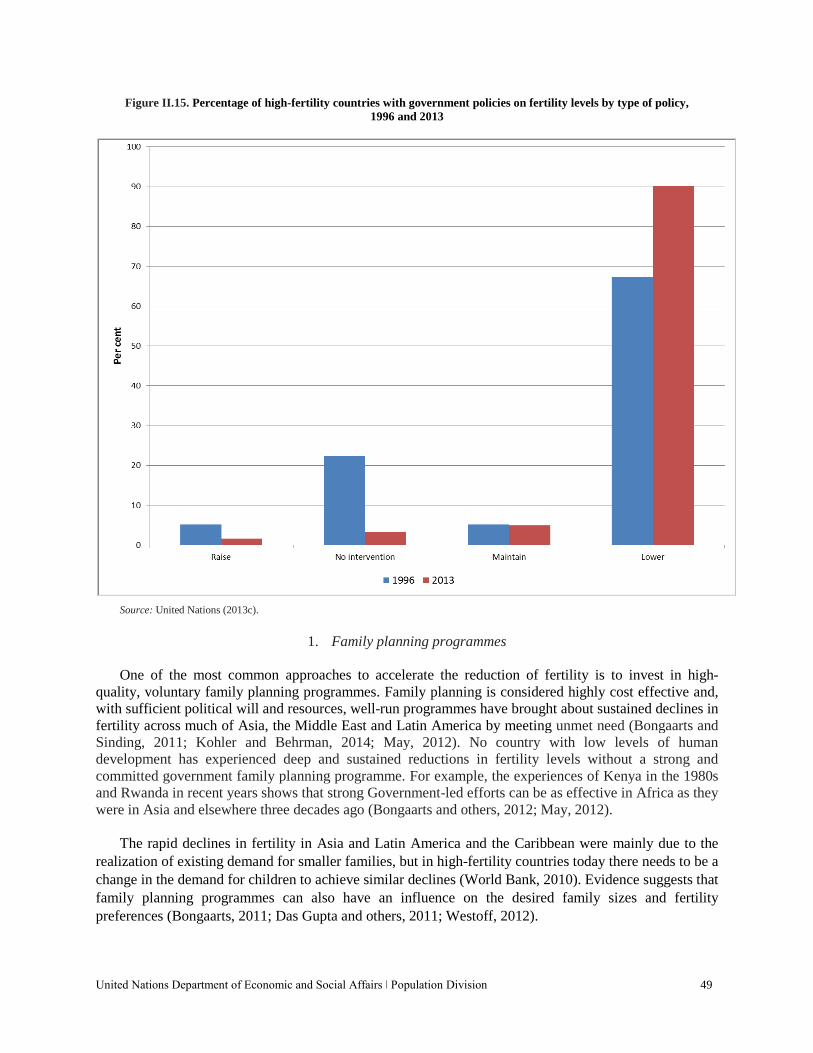
United Nations Department of Economic and Social Affairs ǀ Population Division 49
Figure II.15. Percentage of high-fertility countries with government policies on fertility levels by type of policy, 1996 and 2013
Source: United Nations (2013c).
1. Family planning programmes
One of the most common approaches to accelerate the reduction of fertility is to invest in high-quality, voluntary family planning programmes. Family planning is considered highly cost effective and, with sufficient political will and resources, well-run programmes have brought about sustained declines in fertility across much of Asia, the Middle East and Latin America by meeting unmet need (Bongaarts and Sinding, 2011; Kohler and Behrman, 2014; May, 2012). No country with low levels of human development has experienced deep and sustained reductions in fertility levels without a strong and committed government family planning programme. For example, the experiences of Kenya in the 1980s and Rwanda in recent years shows that strong Government-led efforts can be as effective in Africa as they were in Asia and elsewhere three decades ago (Bongaarts and others, 2012; May, 2012).
The rapid declines in fertility in Asia and Latin America and the Caribbean were mainly due to the
realization of existing demand for smaller families, but in high-fertility countries today there needs to be a change in the demand for children to achieve similar declines (World Bank, 2010). Evidence suggests that family planning programmes can also have an influence on the desired family sizes and fertility preferences (Bongaarts, 2011; Das Gupta and others, 2011; Westoff, 2012).
50 World Fertility Report 2013: Fertility at the Extremes
Family planning programmes can also address barriers to use that go beyond basic supply challenges. For example, Uganda has much higher fertility and lower contraceptive use than in the neighbouring countries of Kenya, Rwanda and Zimbabwe, and yet two out of five young women aged 15-24 years have an unmet need for family planning. However, multiple obstacles, including strong misconceptions and fears about using methods, prevent young women from using contraception despite their desire to prevent pregnancy (Nalwadda and others, 2010). Improving dissemination of information about contraception, especially through media, and with a particular focus on vulnerable groups of people such as the young, unmarried, poor and rural (Darroch, 2013; Das Gupta and others, 2011) should be priorities of family planning programmes. Given the inequities in reproductive decision-making power to women’s disadvantage in many high-fertility countries, it may be more effective to integrate family planning programmes with other strategies that promote gender-equitable norms (Izugbara and Ezeh, 2010; Nalwadda and others, 2010).
2. Education and other approaches that influence fertility decline
Improving access to female education is imperative to a sustained fertility transition in high-fertility
countries (Ezeh and others, 2009; Lutz, 2014), both as a factor on its own and also due to its association with later marriage, the demand for and ability to obtain and use contraceptives, and declines in infant and child mortality (Lutz, 2014; Shapiro and Gebreselassie, 2008).
Improving socioeconomic conditions are also associated with continued fertility decline (May, 2012,
p. 131). For example, in Kenya, low and deteriorating living standards are thought to be partly responsible for the stall in fertility decline, despite high levels of female literacy and schooling (Bongaarts, 2006) and changes in socioeconomic conditions in Ghana have been more decisive for fertility decline than changes in family planning services (Agyei-Mensah, 2006). Similarly, socioeconomic interventions are also needed as the rural poor are often resentful of family planning programmes that they may not identify as a high priority (Agei-Mensah, 2006).
In countries where large proportions of girls still marry before the age of 18 years, policies and
programmes promoting a later age at marriage can be effective in reducing early childbearing (National Research Council and Institute of Medicine, 2005). In the Berhane Hewan Programme in Ethiopia, for example, economic incentives were provided to families who did not marry off their daughters during the project period and support was provided for girls who were already married (Erulkar and Muthengi, 2009). Adolescent girls in the experimental area were nearly three times more likely to be in school, were 90 per cent less likely to be married and were nearly three times more likely to have used any family planning method compared to girls in the control area (Erulkar and Muthengi, 2009).
Declining infant and child mortality are also argued to be a pre-requisite for fertility decline and future fertility changes are dependent on the future of changes in infant and child mortality (Shapiro and Gebreselassie, 2008). While improvements in child survival are essential, increases in child survival in most high-fertility African countries have already exceeded the level at which steep fertility declines began in many countries of other regions (Bongaarts and others, 2012).
United Nations Department of Economic and Social Affairs ǀ Population Division 51
3. The distinctiveness of sub-Saharan Africa
The pace of future fertility decline for high-fertility countries today, most of which are in sub-Saharan Africa, may be distinctly different than in other regions (Bongaarts 2013; Bongaarts and Casterline, 2012). For example, meeting unmet need for family planning has less of an impact on fertility in this region (Casterline and El-Zeini, 2014), with women often postponing births in order to space rather than limit family size (Moultrie and others, 2012; Romaniuk, 2011). The onset of the fertility transition also took place at generally lower levels of development than was the case for countries that have more recently made the transition from high fertility to low fertility. This variance from historical patterns is important not only for planning and implementing policies that may reduce fertility, but also because it may have far-reaching development implications.
52 World Fertility Report 2013: Fertility at the Extremes
CONCLUSION Fertility levels have undergone remarkable changes throughout the world since the 1994 International
Conference on Population and Development. This report focused on fertility and its correlates at the extremes: countries with very low fertility and those with very high fertility. High fertility is increasingly a characteristic of the least developed countries, especially in sub-Saharan Africa. Low fertility, previously a characteristic of countries in Europe, has become far more widespread in other regions, with some countries experiencing very rapid fertility transitions at lower levels of human development than was the case historically.
Considerable diversity exists at the extremes in terms of the pathways that resulted in low or high
fertility and the factors underlying fertility change, even among countries with similar fertility levels. This raises questions about the future course that fertility will take. The fertility transition in countries in sub-Saharan Africa has been exceptional in that it has been slower, later, and at a lower level of development than countries in Asia and Latin America and the Caribbean (Bongaarts, 2013). As a result, it has been suggested that the pace of fertility decline in sub-Saharan Africa has been projected to be too rapid (United Nations, 2013e), especially outside of Southern Africa. Others argue that gains in women’s education in these countries will help usher in faster fertility declines than initially projected (Lutz and others, 2014). Similarly, many questions remain regarding the fertility projections for low-fertility countries. There is no evidence that the recent increase in period fertility levels in some European countries will be emulated by countries in other regions with very low fertility, such as Eastern Asia.
The age pattern of childbearing is important for fertility trends since changes in the age of
childbearing can have a significant impact on both period and completed fertility as well as implications for maternal and infant health. There have been significant declines in adolescent childbearing in high-fertility countries, although the rates remain high in Middle Africa and Western Africa. In the majority of high-fertility countries, the decline in fertility among older women contributed a large proportion of the overall decline in total fertility since the ICPD rather than the decline in adolescent fertility. At the other extreme, childbearing among older women is becoming more prevalent in low-fertility countries. In Latin America and the Caribbean, childbearing at young ages remains relatively high despite the decline in total fertility to low levels.
Government policies to influence fertility, whether to raise or lower it, have changed significantly
since the ICPD in 1994. There is now far more concern about fertility levels, with more low-fertility countries expressing concern about and adopting policies to raise fertility and high-fertility countries doing the same to lower fertility. For some countries, the change in policy came about due to a realisation of the impact of continued fertility levels at either the high or low extremes. In other countries, in particular the low-fertility countries that had very rapid fertility transitions, policies changed to accommodate a new demographic reality. While demography is not destiny, the implications of fertility levels at the extremes will continue to reflect and shape the well-being of individuals, families, countries and, ultimately, the world.
United Nations Department of Economic and Social Affairs ǀ Population Division 53
REFERENCES
Abbasi-Shavazi, Mohammad Jalal, and Bhakta Gubhaju (2014). Different pathways to low fertility in Asia: Consequences and Policy Implications. Expert Paper No. 2014/1. New York: United Nations. Available from http://www.un.org/en/development/desa/population/publications/pdf/expert/2014-1_Abbasi-Shavazi&GubhajuExpert-Paper.pdf.
Agyei-Mensah, Samuel (2006). Fertility transition in Ghana: Looking back and looking forward. Population, Space
and Place, No. 12, pp. 461-477. Ahmed, Saifuddin, Qingfeng Li, Li Liu and Amy O. Tsui (2012). Maternal deaths averted by contraceptive use: An
analysis of 172 countries. The Lancet, vol. 380, No. 9837, pp. 111-125. Andersson, Gunnar (2008). A review of policies and practices related to the ‘Highest-Low’ fertility of Sweden.
Vienna Yearbook of Population Research, pp. 89-102. Andreev, Kirill, Vladimíra Kantorová and John Bongaarts (2013). Demographic components of future population
growth. Technical Paper No. 2013/3. New York: United Nations. Available from http://www.un.org/en/ development/desa/population/publications/pdf/technical/TP2013-3.pdf.
Annez, Patricia Clarke and Robert M. Buckley (2009). Urbanization and growth: Setting the context. In
Urbanization and Growth: Commission on Growth and Development, Spence M, Annez P C, and Buckley R M, eds. Washington, DC. The International Bank for Reconstruction and Development . The World Bank, pp.1–46.
Balbo, Nicoletta, Francesco Billari, and Melinda Mills (2013). Fertility in advanced societies: A review of research.
European Journal of Population, vol. 29, pp. 1-38. Berent, Jerzy (1970). Causes of fertility decline in Eastern Europe and the Soviet Union: Part I. The influence of
demographic factors. Population Studies, vol. 24, No. 1, pp. 35–58. Billingsley, Sunnee and Tommy Ferrarini (2014). Family policy and fertility intentions in 21 European countries.
Journal of Marriage and Family, vol. 76, pp. 428-445. Blanc, Ann, William Winfrey and John Ross (2013). New findings for maternal mortality age patterns: Aggregated
results for 38 countries. PLoS ONE, vol. 8, No. 4, e59864. Available from http://www.ploscollections.org/article/info%3Adoi%2F10.1371%2Fjournal.pone.0059864.
Bloom, David E. and David Canning (2008) Global demographic change: Dimensions and economic significance.
Population and Development Review, vol. 34(S), pp.17-51. Bloom, David E., David Canning, and Jaypee Sevilla (2003). The Demographic Dividend: A New Perspective on the
Economic Consequences of Population Change. RAND Corporation, Monograph Reports MR-1274-WFHF/DLPF/RF/UNPF.
Boling, P. (2008). Demography, culture and policy: Understanding Japan's low fertility. Population and
Development Review, vol. 34, No. 2, pp. 307-326. Bongaarts, John (2006). The causes of stalling fertility transitions. Studies in Family Planning, vol. 37, No. 1, pp. 1-
16. ——— (2011). Can family planning programs reduce high desired family size in sub-Saharan Africa? International
Perspectives on Sexual and Reproductive Health, vol. 37, No. 4, pp. 209-216. ——— (2013). How exceptional is the pattern of fertility decline in sub-Saharan Africa? Expert Paper No. 2013/4.
New York: United Nations. Available from http://www.un.org/en/development /desa/population/publications/pdf/expert/2013-4_Bongaarts_Expert-Paper.pdf.
54 World Fertility Report 2013: Fertility at the Extremes
Bongaarts, John, and John Casterline (2012). Fertility transition: Is sub-Saharan Africa different? Population and
Development Review, vol. 38 (Supplement s1), pp. 153-168. Bongaarts, John, John Cleland, John Townsend, Jane Bertrand, and Monica Das Gupta (2012). Family Planning
Programs for the 21st Century Rationale and Design. New York, NY: Population Council. Bongaarts, John, and Steven Sinding (2011). Population policy in transition in the developing world. Science , vol.
333, pp. 574-576. Campbell, Oona, and Wendy Graham (2006). Strategies for reducing maternal mortality: Getting on with what
works. The Lancet , vol. 368, pp. 1284-1299. Casterline, John and El-Zeini, Laila (2014). Unmet need and fertility decline: A comparative perspective on
prospects in sub-Saharan Africa. Studies in Family Planning, vol. 45, No. 2, pp. 227-245. Cavenaghi, Suzana. 2013. Fertility decline and public policies to address population rights: Perspective from Latin
America. Expert Paper No. 2013/5. New York: United Nations. Available from http://www.un.org/en/development/desa/population/publications/pdf/expert/2013-5_Cavenaghi_ Expert-Paper.pdf.
Cleland, John, Agustin Conde-Agudelo, Herbert Peterson, John Ross and Amy Tsui (2012). Contraception and
health. The Lancet, vol. 380, No. 9837, pp. 149-156. Coale, Ansley (1986). The decline of fertility in Europe since the eighteenth century as a chapter in demographic
history. In The Decline of Fertility in Europe , Coale A and Watkins S, eds. Princeton: Princeton University Press, pp.1-30.
Cohen, Barney and Mark R. Montgomery (1997). Introduction. In From Death to Birth: Mortality Decline and
Reproductive Change, Cohen B and Montgomery M R, eds. Washington, DC, Committee on Population, National Research Council, pp.1–38.
Darroch, Jacqueline E. (2013). Trends in contraceptive use. Contraception, vol. 87, pp. 259-263. Das Gupta, Monica, John Bongaarts, and John Cleland (2011). Population, poverty, and sustainable development: A
review of the evidence. The World Bank Development Research Group, Policy Research Working Paper 5719. Duvander, Ann-Zofie, Trude Lappegård, and Gunnar Andersson (2010). Family policy and fertility: Fathers’ and
mothers’ use of parental leave and continued childbearing in Norway and Sweden. Journal of European Social Policy, vol. 20, No. 1, pp. 19-31.
Eloundou-Enyegue, Parfait (2013). Harnessing a demographic dividend: Challenges and opportunities in high and
intermediate fertility countries. Expert Paper No. 2013/7. New York: United Nations. Available from http://www.un.org/en/development/desa/population/publications/pdf/expert/2013-7_Eloundou-EnyegueExpert-Paper.pdf.
Eloundou-Enyegue, Parfait and Linda Williams (2006). Family size and schooling in sub-Saharan African settings:
A reexamination. Demography, vol. 43, No. 1, pp. 25-52. Erulkar, Annabel and Eunice Muthengi (2009). Evaluation of Berhane Hewan: A Pilot Program to Promote
Education & Delay Marriage in Rural Ethiopia. New York: The Population Council. Ezeh, Alex, John Bongaarts, and Blessing Mberu. (2012). Global population trends and policy options. The Lancet,
vol. 380, No. 9837, pp. 142-148.
United Nations Department of Economic and Social Affairs ǀ Population Division 55
Ezeh, Alex, Blessing Mberu, and Jacques Emina (2009). Stall in fertility decline in Eastern African countries: Regional analysis of patterns, determinants and implications. Philosophical Transactions of the Royal Society B: Biological Sciences, vol. 364, pp. 2991-3007.
Frejka, T., G. W. Jones, and J.P. Sardon. (2010) East Asian childbearing patterns and policy developments.
Population and Development Review, vol. 36, pp. 579–606. Garenne, Michel (2014) Trends in marriage and contraception in sub-Saharan Africa: A longitudinal perspective on
factors of fertility decline. DHS Analytical Studies No. 42. ICF International Rockville, Maryland. Gauthier. A. H. (2007). The impact of family policies on fertility in industrialized countries: A review of the
literature. Population Research and Policy Review, vol. 26, No. 3, pp. 323-346. ——— (2008). Some theoretical and methodological comments on the impact of policies on fertility. Vienna
Yearbook of Population Research, pp. 25-28. Gauthier, A. H., and D. Philipov (2008). Can policies enhance fertility in Europe? Vienna Yearbook of Population
Research, pp. 1-16. Guo, Zhigang (2012). The low fertility rate is the major demographic risk in China. China Economic Journal, vol. 5,
pp. 2-3. Hobcraft, J.N., J.W. McDonald, and S.O. Rutstein (1985). Demographic determinants of infant and early child
mortality: A comparative analysis. Demography, vol. 39, No. 3, pp. 363-385. Hoorens, Stijn, Jack Clift, Laura Staetsky, Barbara Janta, Stephanie Diepeveen, Molly Morgan Jones, and Jonathan
Grant (2011). Low Fertility in Europe. Is There Still Reason to Worry? Rand Europe. Cambridge, UK. Izugbara, C. O. and Ezeh, A. C. (2010), Women and high fertility in Islamic Northern Nigeria. Studies in Family
Planning, vol. 4, pp. 193–204. Jones, Gavin (2007). Delayed marriage and very low fertility in Pacific Asia. Population and Development Review,
vol. 33, No. 3, pp. 453-478. ——— (2010). Changing marriage patterns in Asia. Asia Research Institute Working Paper Series No. 131
Available from http://www.ari.nus.edu.sg/docs/wps/wps10_131.pdf. ——— (2012). Population policy in a prosperous city-state: Dilemmas for Singapore. Population and Development
Review, vol. 38, pp. 311–336. Joshi, Shareen, and T. Paul Schultz (2012). Family planning and women’s and children’s health: Long-term
consequences of an outreach program in Matlab, Bangladesh. Demography, vol. 50, pp. 149-180. Kalwij, Adriaan. 2010. The impact of family policy expenditure on fertility in Western Europe. Demography, vol.
47, No. 2, pp. 503-519. Kocourkova, Jirina, Boris Burcin and Tomas Kucera (2014). Demographic relevancy of increased use of assisted
reproduction in European countries. Reproductive Health, vol. 11, No. 37. Available from http://www.reproductive-health-journal.com/content/11/1/37.
Kohler, Hans-Peter and Jere R. Behrman (2014). Benefits and costs of the population and demography targets for
the post-2015 development agenda. Copenhagen Consensus Assessment Paper. Available from http://www.copenhagenconsensus.com/post-2015-consensus/populationanddemography.
Kohler, Hans-Peter, Francesco C. Billari and José Antonio Ortega (2002). The emergence of lowest-low fertility in
Europe during the 1990s. Population and Development Review, vol. 28, No. 4, pp. 641–680.
56 World Fertility Report 2013: Fertility at the Extremes
——— (2006). Low fertility in Europe: Causes, implications and policy options. In The Baby Bust. Who will do the
Work? Who Will Pay the Taxes? Fred R. Harris, ed. Lanham, MD Rowman and Littlefield Publishers, pp. 48-109.
Kupka, M.S. and others (2014). Assisted reproductive technology in Europe, 2010: results generated from European
registers by European Society of Human Reproduction and Embryology (ESHRE). Human Reproduction, vol. 29, No. 10, pp. 2099–2113.
Luci-Greulich, Angela and Olivier Thévenon (2013). The impact of family policies on fertility trends in developed
countries. European Journal of Population, vol. 29, No. 4, pp. 387-416. Lutz, Wolfgang (2014). A population policy rationale for the twenty-first century. Population and Development
Review, vol. 40, No. 3, pp. 527-544. Lutz, Wolfgang, William P. Butz and Samir KC, eds. (2014). World Population & Human Capital in the 21st
Century. Oxford: Oxford University Press. May, John (2012). World Population Policies: Their Origin, Evolution, and Impact. Springer Press, New York,
USA. Moultrie, Tom, Takudzwa Sayi, and Ian Timaeus. (2012). Birth intervals, postponement, and fertility decline in
Africa: A new type of transition? Population Studies, vol. 66, No. 3, pp. 241-258. Nalwadda, Gorrette, Florence Mirembe, Josaphat Byamugisha, and Elisabeth Faxelid (2010). Persistent high fertility
in Uganda: Young people recount obstacles and enabling factors to use of contraceptives. BMC Public Health, vol. 10, No. 530, pp. 1-13.
National Research Council and Institute of Medicine (2005). Growing Up Global: The Changing Transitions to Adulthood in Developing Countries. Washington, D.C., The National Academies Press.
Potts, Malcolm, Virginia Gidi, Martha Campbell and Sarah Zureick (2011). Niger: Too little, too late. International
Perspectives on Sexual and Reproductive Health, vol. 37, No. 2, pp. 95-101. Rodríguez-Vignoli, Jorge and Suzana Cavenaghi (2014). Adolescent and youth fertility and social inequality in
Latin America and the Caribbean: what role has education played? Genus, vol. 70, No. 1, pp. 1-25. Romaniuk, Anatole (2011). Persistence of high fertility in Tropical Africa: The case of the Democratic Republic of
the Congo. Population and Development Review, vol. 37, No. 1, pp. 1-28. Rutstein, Shea (2008). Further evidence of the effects of preceding birth intervals on neonatal, infant and under-five-
years mortality and nutritional status in developing countries: Evidence from the demographic and health. Calverton, MD: ORC Macro, DHS Working Paper 41. Available from http://www.dhsprogram.com/pubs/pdf/WP41/WP41.pdf
Rutstein, Shea and Rebecca Winter (2014). The effects of fertility behavior on child survival and child nutritional
status: Evidence from the Demographic and Health Surveys, 2006 to 2012. DHS Analytical Studies, No. 37. ICF International Rockville, Maryland. Available from http://www.dhsprogram.com/pubs/pdf/AS37/AS37.pdf
Shapiro, David and Tesfayi Gebreselassie. (2008) Fertility transition in sub-Saharan Africa: Falling and stalling.
African Population Studies, vol. 23, No. 1, pp. 3-23. Sneeringer, Stacey (2009). Fertility transition in sub-Saharan Africa: Comparative analysis of cohort trends in 30
countries. DHS Comparative Reports No. 23. Calverton, MD. Available from http://dhsprogram.com/pubs/pdf/CR23/CR23.pdf.
United Nations Department of Economic and Social Affairs ǀ Population Division 57
Sobotka, Tomas. 2013. Pathways to low fertility: European perspectives. Expert Paper No. 2013/8. New York: United Nations. Available from http://www.un.org/en/development/desa/population
/publications/pdf/expert/2013-8_Sobotka_Expert-Paper.pdf. Sobotka, Tomas and Eva Beaujouan. 2014. Two is best? The persistence of a two-child family ideal in Europe.
Population and Development Review, vol. 40, No. 3, pp. 391-419. Stephen, Elizabeth Hervey (2012). Bracing for low fertility and a large elderly population in South Korea. Korea
Economic Institute Academic Paper Series. Available from http://www.keia.org/sites/ default/files/publications/aps_doc_elizabeth_stephens.pdf.
Thévenon, Olivier (2011). Family policies in OECD countries: A comparative analysis. Population and
Development Review, vol. 37, pp. 57–87. Thévenon, Olivier and Anne H. Gauthier (2011). Family Policies in Developed Countries: A ‘Fertility-Booster’ with
Side-Effects. Community, Work & Family vol. 14, No. 2, pp. 197-216. United Nations (1966). World population prospects, as assessed in 1963. Population Studies No. 41. New York,
United Nations. United Nations, Department of Economic and Social Affairs, Population Division (2011). Seven Billion and
Growing: The Role of Population Policy in Achieving Sustainability. Technical Paper No. 2011/3. New York, United Nations. Available from http://www.un.org/en/development/desa/ population/publications/pdf/technical/TP2011-3_SevenBillionandGrowing.pdf.
——— (2013a). World Population Prospects: The 2012 Revision. New York, United Nations. Available from
http://esa.un.org/unpd/wpp/index.htm. ——— (2013b). World Marriage Data 2012. New York, United Nations. Available from
http://www.un.org/en/development/desa/population/publications/dataset/marriage/wmd2012.shtml ——— (2013c). World Population Policies 2013. New York, United Nations. Available from
http://www.un.org/en/development/desa/population/publications/pdf/policy/WPP2013/wpp2013.pdf . ——— (2013d). Adolescent Fertility since the International Conference on Population and Development (ICPD) in
Cairo. New York: United Nations. Available from http://www.un.org/en/development/desa/population/publications/pdf/fertility/Report_Adolescent-Fertility-since-ICPD.pdf.
——— (2013e). United Nations Expert Group Meeting on Fertility, Changing Population Trends and Development:
Challenges and Opportunities for the Future. New York, United Nations. Available from http://www.un.org/en/development/desa/population/events/expert-group/21/index.shtml.
——— (2014a). Model-based Estimates and Projections of Family Planning Indicators 2014. Available from:
http://www.un.org/en/development/desa/population/theme/family-planning/cp_ model.shtml
——— (2014b). World Population Prospects The 2012 Revision. Methodology of the United Nations Population
Estimates and Projections. New York, United Nations. Available from http://esa.un.org/unpd/wpp/Documentation/pdf/WPP2012_Methodology.pdf
——— (2014c). World Contraceptive Use 2014 (POP/DB/CP/Rev2014). Available from
http://www.un.org/en/development/desa/population/publications/dataset/contraception/wcu2014.shtml ——— (2014). World Urbanization Prospects: The 2014 Revision, CD-ROM Edition. New York, United Nations.
58 World Fertility Report 2013: Fertility at the Extremes
UNESCO Institute for Statistics, Data Centre (2014). Available from http://data.uis.unesco.org /Index.aspx?DataSetCode=EDULIT_DS&popupcustomise=true&lang=en (accessed 13 October 2014).
Westoff, Charles. (2012). The recent fertility transition in Rwanda. Population and Development Review, vol. 38
(Supplement), pp. 169-178. Wilson, Chris, Tomáš Sobotka, Lee Williamson and Paul Boyle (2013). Migration and intergenerational
replacement in Europe. Population and Development Review, vol. 39, No. 1, pp. 131-157. World Bank. (2010). Determinants and consequences of high fertility: A synopsis of the evidence. Washington, DC:
World Bank. Available from http://siteresources.worldbank.org/INTPRH/ Resources/376374-1278599377733/Determinant62810PRINT.pdf.

Annexes

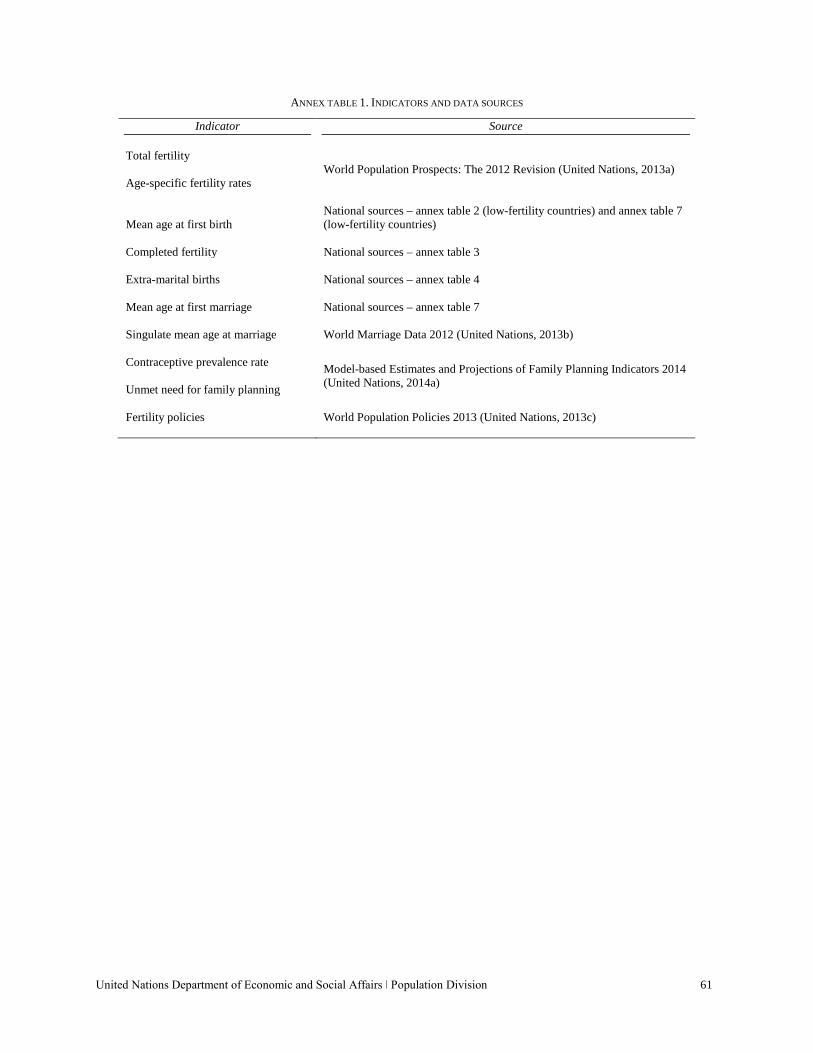
United Nations Department of Economic and Social Affairs ǀ Population Division 61
ANNEX TABLE 1. INDICATORS AND DATA SOURCES
Indicator Source Total fertility
World Population Prospects: The 2012 Revision (United Nations, 2013a) Age-specific fertility rates
Mean age at first birth
National sources – annex table 2 (low-fertility countries) and annex table 7 (low-fertility countries)
Completed fertility National sources – annex table 3 Extra-marital births
National sources – annex table 4
Mean age at first marriage
National sources – annex table 7
Singulate mean age at marriage
World Marriage Data 2012 (United Nations, 2013b)
Contraceptive prevalence rate
Model-based Estimates and Projections of Family Planning Indicators 2014 (United Nations, 2014a)
Unmet need for family planning
Fertility policies
World Population Policies 2013 (United Nations, 2013c)
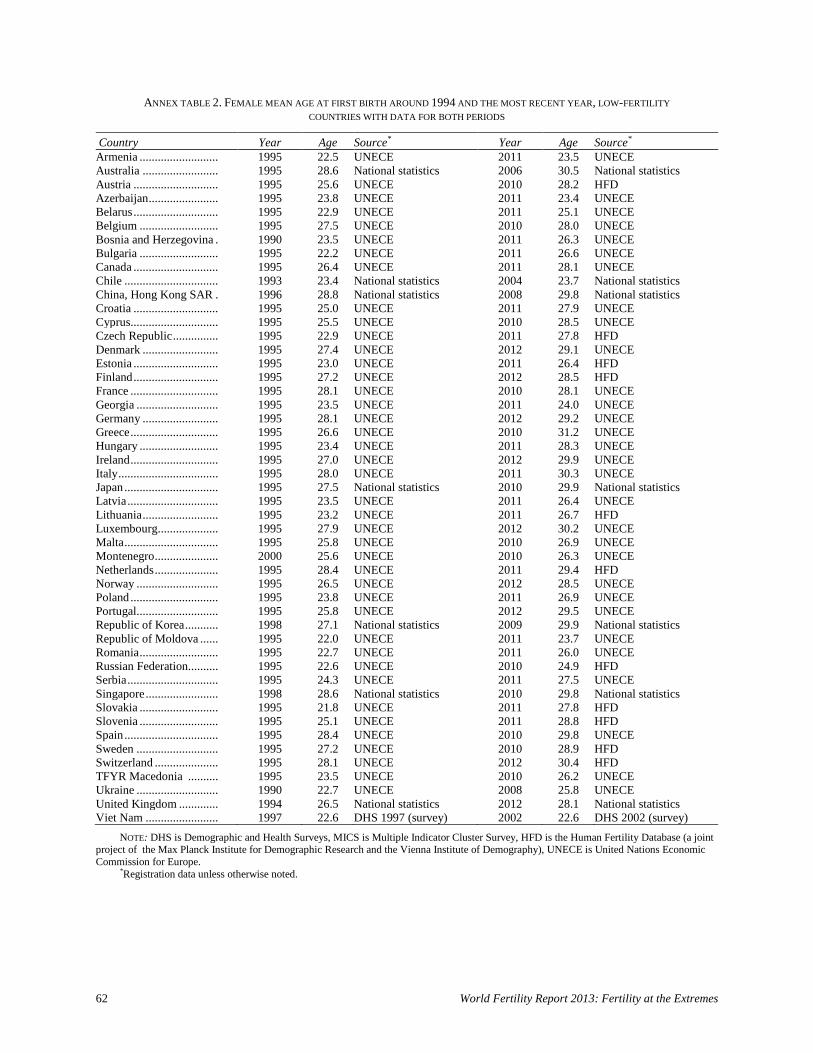
62 World Fertility Report 2013: Fertility at the Extremes
ANNEX TABLE 2. FEMALE MEAN AGE AT FIRST BIRTH AROUND 1994 AND THE MOST RECENT YEAR, LOW-FERTILITY COUNTRIES WITH DATA FOR BOTH PERIODS
Country Year Age Source* Year Age Source* Armenia .......................... 1995 22.5 UNECE 2011 23.5 UNECE Australia ......................... 1995 28.6 National statistics 2006 30.5 National statistics Austria ............................ 1995 25.6 UNECE 2010 28.2 HFD Azerbaijan ....................... 1995 23.8 UNECE 2011 23.4 UNECE Belarus ............................ 1995 22.9 UNECE 2011 25.1 UNECE Belgium .......................... 1995 27.5 UNECE 2010 28.0 UNECE Bosnia and Herzegovina . 1990 23.5 UNECE 2011 26.3 UNECE Bulgaria .......................... 1995 22.2 UNECE 2011 26.6 UNECE Canada ............................ 1995 26.4 UNECE 2011 28.1 UNECE Chile ............................... 1993 23.4 National statistics 2004 23.7 National statistics China, Hong Kong SAR . 1996 28.8 National statistics 2008 29.8 National statistics Croatia ............................ 1995 25.0 UNECE 2011 27.9 UNECE Cyprus............................. 1995 25.5 UNECE 2010 28.5 UNECE Czech Republic ............... 1995 22.9 UNECE 2011 27.8 HFD Denmark ......................... 1995 27.4 UNECE 2012 29.1 UNECE Estonia ............................ 1995 23.0 UNECE 2011 26.4 HFD Finland ............................ 1995 27.2 UNECE 2012 28.5 HFD France ............................. 1995 28.1 UNECE 2010 28.1 UNECE Georgia ........................... 1995 23.5 UNECE 2011 24.0 UNECE Germany ......................... 1995 28.1 UNECE 2012 29.2 UNECE Greece ............................. 1995 26.6 UNECE 2010 31.2 UNECE Hungary .......................... 1995 23.4 UNECE 2011 28.3 UNECE Ireland ............................. 1995 27.0 UNECE 2012 29.9 UNECE Italy ................................. 1995 28.0 UNECE 2011 30.3 UNECE Japan ............................... 1995 27.5 National statistics 2010 29.9 National statistics Latvia .............................. 1995 23.5 UNECE 2011 26.4 UNECE Lithuania ......................... 1995 23.2 UNECE 2011 26.7 HFD Luxembourg .................... 1995 27.9 UNECE 2012 30.2 UNECE Malta ............................... 1995 25.8 UNECE 2010 26.9 UNECE Montenegro ..................... 2000 25.6 UNECE 2010 26.3 UNECE Netherlands ..................... 1995 28.4 UNECE 2011 29.4 HFD Norway ........................... 1995 26.5 UNECE 2012 28.5 UNECE Poland ............................. 1995 23.8 UNECE 2011 26.9 UNECE Portugal ........................... 1995 25.8 UNECE 2012 29.5 UNECE Republic of Korea ........... 1998 27.1 National statistics 2009 29.9 National statistics Republic of Moldova ...... 1995 22.0 UNECE 2011 23.7 UNECE Romania .......................... 1995 22.7 UNECE 2011 26.0 UNECE Russian Federation .......... 1995 22.6 UNECE 2010 24.9 HFD Serbia .............................. 1995 24.3 UNECE 2011 27.5 UNECE Singapore ........................ 1998 28.6 National statistics 2010 29.8 National statistics Slovakia .......................... 1995 21.8 UNECE 2011 27.8 HFD Slovenia .......................... 1995 25.1 UNECE 2011 28.8 HFD Spain ............................... 1995 28.4 UNECE 2010 29.8 UNECE Sweden ........................... 1995 27.2 UNECE 2010 28.9 HFD Switzerland ..................... 1995 28.1 UNECE 2012 30.4 HFD TFYR Macedonia .......... 1995 23.5 UNECE 2010 26.2 UNECE Ukraine ........................... 1990 22.7 UNECE 2008 25.8 UNECE United Kingdom ............. 1994 26.5 National statistics 2012 28.1 National statistics Viet Nam ........................ 1997 22.6 DHS 1997 (survey) 2002 22.6 DHS 2002 (survey)
NOTE: DHS is Demographic and Health Surveys, MICS is Multiple Indicator Cluster Survey, HFD is the Human Fertility Database (a joint project of the Max Planck Institute for Demographic Research and the Vienna Institute of Demography), UNECE is United Nations Economic Commission for Europe. *Registration data unless otherwise noted.
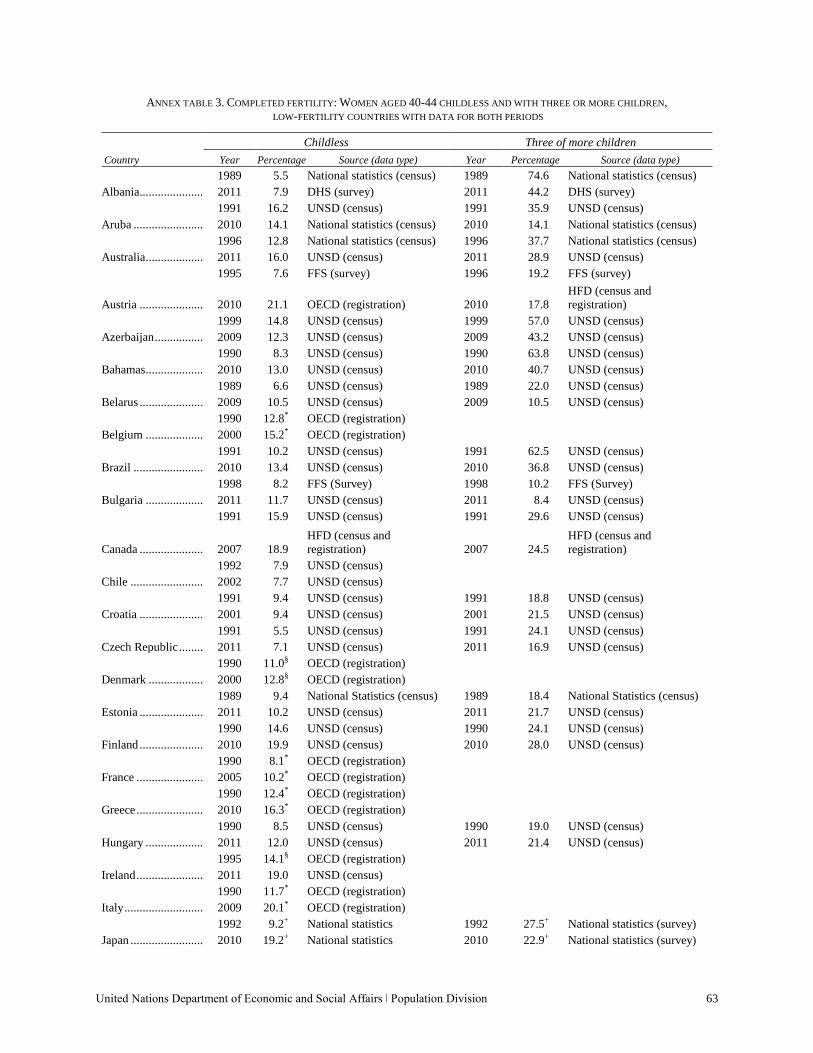
United Nations Department of Economic and Social Affairs ǀ Population Division 63
ANNEX TABLE 3. COMPLETED FERTILITY: WOMEN AGED 40-44 CHILDLESS AND WITH THREE OR MORE CHILDREN, LOW-FERTILITY COUNTRIES WITH DATA FOR BOTH PERIODS
Childless Three of more children Country Year Percentage Source (data type) Year Percentage Source (data type)
Albania ..................... 1989 5.5 National statistics (census) 1989 74.6 National statistics (census) 2011 7.9 DHS (survey) 2011 44.2 DHS (survey)
Aruba ....................... 1991 16.2 UNSD (census) 1991 35.9 UNSD (census) 2010 14.1 National statistics (census) 2010 14.1 National statistics (census)
Australia ................... 1996 12.8 National statistics (census) 1996 37.7 National statistics (census) 2011 16.0 UNSD (census) 2011 28.9 UNSD (census)
Austria .....................
1995 7.6 FFS (survey) 1996 19.2 FFS (survey)
2010 21.1 OECD (registration) 2010 17.8 HFD (census and registration)
Azerbaijan ................ 1999 14.8 UNSD (census) 1999 57.0 UNSD (census) 2009 12.3 UNSD (census) 2009 43.2 UNSD (census)
Bahamas ................... 1990 8.3 UNSD (census) 1990 63.8 UNSD (census) 2010 13.0 UNSD (census) 2010 40.7 UNSD (census)
Belarus ..................... 1989 6.6 UNSD (census) 1989 22.0 UNSD (census) 2009 10.5 UNSD (census) 2009 10.5 UNSD (census)
Belgium ................... 1990 12.8* OECD (registration) 2000 15.2* OECD (registration)
Brazil ....................... 1991 10.2 UNSD (census) 1991 62.5 UNSD (census) 2010 13.4 UNSD (census) 2010 36.8 UNSD (census)
Bulgaria ................... 1998 8.2 FFS (Survey) 1998 10.2 FFS (Survey) 2011 11.7 UNSD (census) 2011 8.4 UNSD (census)
Canada .....................
1991 15.9 UNSD (census) 1991 29.6 UNSD (census)
2007 18.9 HFD (census and registration) 2007 24.5
HFD (census and registration)
Chile ........................ 1992 7.9 UNSD (census) 2002 7.7 UNSD (census)
Croatia ..................... 1991 9.4 UNSD (census) 1991 18.8 UNSD (census) 2001 9.4 UNSD (census) 2001 21.5 UNSD (census)
Czech Republic ........ 1991 5.5 UNSD (census) 1991 24.1 UNSD (census) 2011 7.1 UNSD (census) 2011 16.9 UNSD (census)
Denmark .................. 1990 11.0§ OECD (registration) 2000 12.8§ OECD (registration)
Estonia ..................... 1989 9.4 National Statistics (census) 1989 18.4 National Statistics (census) 2011 10.2 UNSD (census) 2011 21.7 UNSD (census)
Finland ..................... 1990 14.6 UNSD (census) 1990 24.1 UNSD (census) 2010 19.9 UNSD (census) 2010 28.0 UNSD (census)
France ...................... 1990 8.1* OECD (registration) 2005 10.2* OECD (registration)
Greece ...................... 1990 12.4* OECD (registration) 2010 16.3* OECD (registration)
Hungary ................... 1990 8.5 UNSD (census) 1990 19.0 UNSD (census) 2011 12.0 UNSD (census) 2011 21.4 UNSD (census)
Ireland ...................... 1995 14.1§ OECD (registration) 2011 19.0 UNSD (census)
Italy .......................... 1990 11.7* OECD (registration) 2009 20.1* OECD (registration)
Japan ........................ 1992 9.2+ National statistics 1992 27.5+ National statistics (survey) 2010 19.2+ National statistics 2010 22.9+ National statistics (survey)
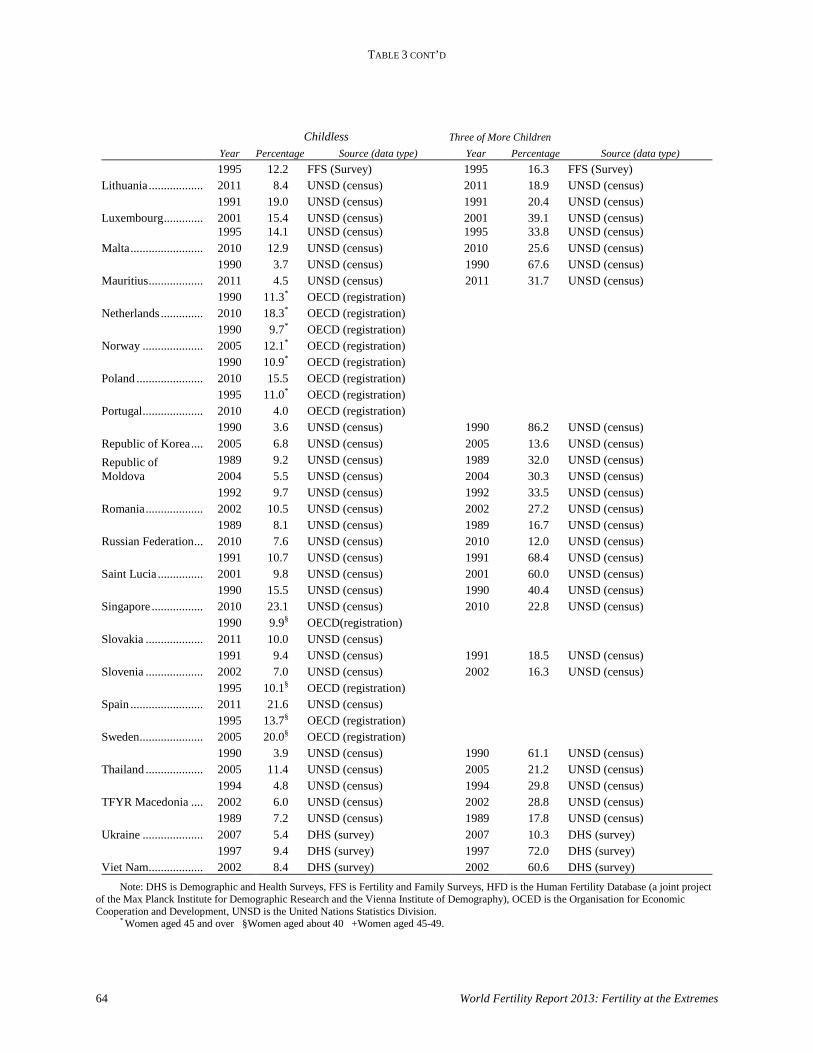
TABLE 3 CONT’D
64 World Fertility Report 2013: Fertility at the Extremes
Childless Three of More Children Year Percentage Source (data type) Year Percentage Source (data type)
Lithuania .................. 1995 12.2 FFS (Survey) 1995 16.3 FFS (Survey) 2011 8.4 UNSD (census) 2011 18.9 UNSD (census)
Luxembourg ............. 1991 19.0 UNSD (census) 1991 20.4 UNSD (census) 2001 15.4 UNSD (census) 2001 39.1 UNSD (census)
Malta ........................ 1995 14.1 UNSD (census) 1995 33.8 UNSD (census) 2010 12.9 UNSD (census) 2010 25.6 UNSD (census)
Mauritius .................. 1990 3.7 UNSD (census) 1990 67.6 UNSD (census) 2011 4.5 UNSD (census) 2011 31.7 UNSD (census)
Netherlands .............. 1990 11.3* OECD (registration) 2010 18.3* OECD (registration)
Norway .................... 1990 9.7* OECD (registration) 2005 12.1* OECD (registration)
Poland ...................... 1990 10.9* OECD (registration) 2010 15.5 OECD (registration)
Portugal .................... 1995 11.0* OECD (registration) 2010 4.0 OECD (registration)
Republic of Korea .... 1990 3.6 UNSD (census) 1990 86.2 UNSD (census) 2005 6.8 UNSD (census) 2005 13.6 UNSD (census)
Republic of Moldova
1989 9.2 UNSD (census) 1989 32.0 UNSD (census) 2004 5.5 UNSD (census) 2004 30.3 UNSD (census)
Romania ................... 1992 9.7 UNSD (census) 1992 33.5 UNSD (census) 2002 10.5 UNSD (census) 2002 27.2 UNSD (census)
Russian Federation ... 1989 8.1 UNSD (census) 1989 16.7 UNSD (census) 2010 7.6 UNSD (census) 2010 12.0 UNSD (census)
Saint Lucia ............... 1991 10.7 UNSD (census) 1991 68.4 UNSD (census) 2001 9.8 UNSD (census) 2001 60.0 UNSD (census)
Singapore ................. 1990 15.5 UNSD (census) 1990 40.4 UNSD (census) 2010 23.1 UNSD (census) 2010 22.8 UNSD (census)
Slovakia ................... 1990 9.9§ OECD(registration) 2011 10.0 UNSD (census)
Slovenia ................... 1991 9.4 UNSD (census) 1991 18.5 UNSD (census) 2002 7.0 UNSD (census) 2002 16.3 UNSD (census)
Spain ........................ 1995 10.1§ OECD (registration) 2011 21.6 UNSD (census)
Sweden ..................... 1995 13.7§ OECD (registration) 2005 20.0§ OECD (registration)
Thailand ................... 1990 3.9 UNSD (census) 1990 61.1 UNSD (census) 2005 11.4 UNSD (census) 2005 21.2 UNSD (census)
TFYR Macedonia .... 1994 4.8 UNSD (census) 1994 29.8 UNSD (census) 2002 6.0 UNSD (census) 2002 28.8 UNSD (census)
Ukraine .................... 1989 7.2 UNSD (census) 1989 17.8 UNSD (census) 2007 5.4 DHS (survey) 2007 10.3 DHS (survey)
Viet Nam .................. 1997 9.4 DHS (survey) 1997 72.0 DHS (survey) 2002 8.4 DHS (survey) 2002 60.6 DHS (survey)
Note: DHS is Demographic and Health Surveys, FFS is Fertility and Family Surveys, HFD is the Human Fertility Database (a joint project of the Max Planck Institute for Demographic Research and the Vienna Institute of Demography), OCED is the Organisation for Economic Cooperation and Development, UNSD is the United Nations Statistics Division. * Women aged 45 and over §Women aged about 40 +Women aged 45-49.
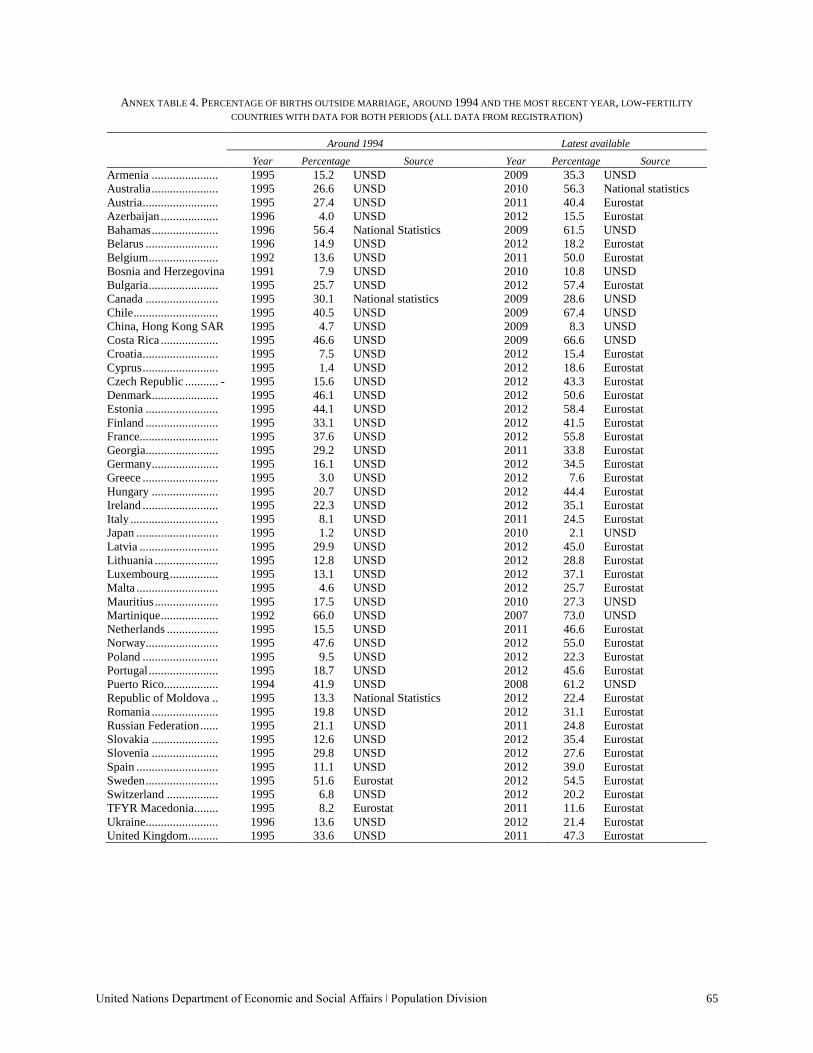
United Nations Department of Economic and Social Affairs ǀ Population Division 65
ANNEX TABLE 4. PERCENTAGE OF BIRTHS OUTSIDE MARRIAGE, AROUND 1994 AND THE MOST RECENT YEAR, LOW-FERTILITY
COUNTRIES WITH DATA FOR BOTH PERIODS (ALL DATA FROM REGISTRATION)
Around 1994 Latest available Year Percentage Source Year Percentage Source Armenia ...................... 1995 15.2 UNSD 2009 35.3 UNSD Australia ...................... 1995 26.6 UNSD 2010 56.3 National statistics Austria ......................... 1995 27.4 UNSD 2011 40.4 Eurostat Azerbaijan ................... 1996 4.0 UNSD 2012 15.5 Eurostat Bahamas ...................... 1996 56.4 National Statistics 2009 61.5 UNSD Belarus ........................ 1996 14.9 UNSD 2012 18.2 Eurostat Belgium ....................... 1992 13.6 UNSD 2011 50.0 Eurostat Bosnia and Herzegovina 1991 7.9 UNSD 2010 10.8 UNSD Bulgaria ....................... 1995 25.7 UNSD 2012 57.4 Eurostat Canada ........................ 1995 30.1 National statistics 2009 28.6 UNSD Chile ............................ 1995 40.5 UNSD 2009 67.4 UNSD China, Hong Kong SAR 1995 4.7 UNSD 2009 8.3 UNSD Costa Rica ................... 1995 46.6 UNSD 2009 66.6 UNSD Croatia ......................... 1995 7.5 UNSD 2012 15.4 Eurostat Cyprus ......................... 1995 1.4 UNSD 2012 18.6 Eurostat Czech Republic ........... - 1995 15.6 UNSD 2012 43.3 Eurostat Denmark ...................... 1995 46.1 UNSD 2012 50.6 Eurostat Estonia ........................ 1995 44.1 UNSD 2012 58.4 Eurostat Finland ........................ 1995 33.1 UNSD 2012 41.5 Eurostat France.......................... 1995 37.6 UNSD 2012 55.8 Eurostat Georgia........................ 1995 29.2 UNSD 2011 33.8 Eurostat Germany ...................... 1995 16.1 UNSD 2012 34.5 Eurostat Greece ......................... 1995 3.0 UNSD 2012 7.6 Eurostat Hungary ...................... 1995 20.7 UNSD 2012 44.4 Eurostat Ireland ......................... 1995 22.3 UNSD 2012 35.1 Eurostat Italy ............................. 1995 8.1 UNSD 2011 24.5 Eurostat Japan ........................... 1995 1.2 UNSD 2010 2.1 UNSD Latvia .......................... 1995 29.9 UNSD 2012 45.0 Eurostat Lithuania ..................... 1995 12.8 UNSD 2012 28.8 Eurostat Luxembourg ................ 1995 13.1 UNSD 2012 37.1 Eurostat Malta ........................... 1995 4.6 UNSD 2012 25.7 Eurostat Mauritius ..................... 1995 17.5 UNSD 2010 27.3 UNSD Martinique ................... 1992 66.0 UNSD 2007 73.0 UNSD Netherlands ................. 1995 15.5 UNSD 2011 46.6 Eurostat Norway........................ 1995 47.6 UNSD 2012 55.0 Eurostat Poland ......................... 1995 9.5 UNSD 2012 22.3 Eurostat Portugal ....................... 1995 18.7 UNSD 2012 45.6 Eurostat Puerto Rico.................. 1994 41.9 UNSD 2008 61.2 UNSD Republic of Moldova .. 1995 13.3 National Statistics 2012 22.4 Eurostat Romania ...................... 1995 19.8 UNSD 2012 31.1 Eurostat Russian Federation ...... 1995 21.1 UNSD 2011 24.8 Eurostat Slovakia ...................... 1995 12.6 UNSD 2012 35.4 Eurostat Slovenia ...................... 1995 29.8 UNSD 2012 27.6 Eurostat Spain ........................... 1995 11.1 UNSD 2012 39.0 Eurostat Sweden ........................ 1995 51.6 Eurostat 2012 54.5 Eurostat Switzerland ................. 1995 6.8 UNSD 2012 20.2 Eurostat TFYR Macedonia ........ 1995 8.2 Eurostat 2011 11.6 Eurostat Ukraine........................ 1996 13.6 UNSD 2012 21.4 Eurostat United Kingdom .......... 1995 33.6 UNSD 2011 47.3 Eurostat
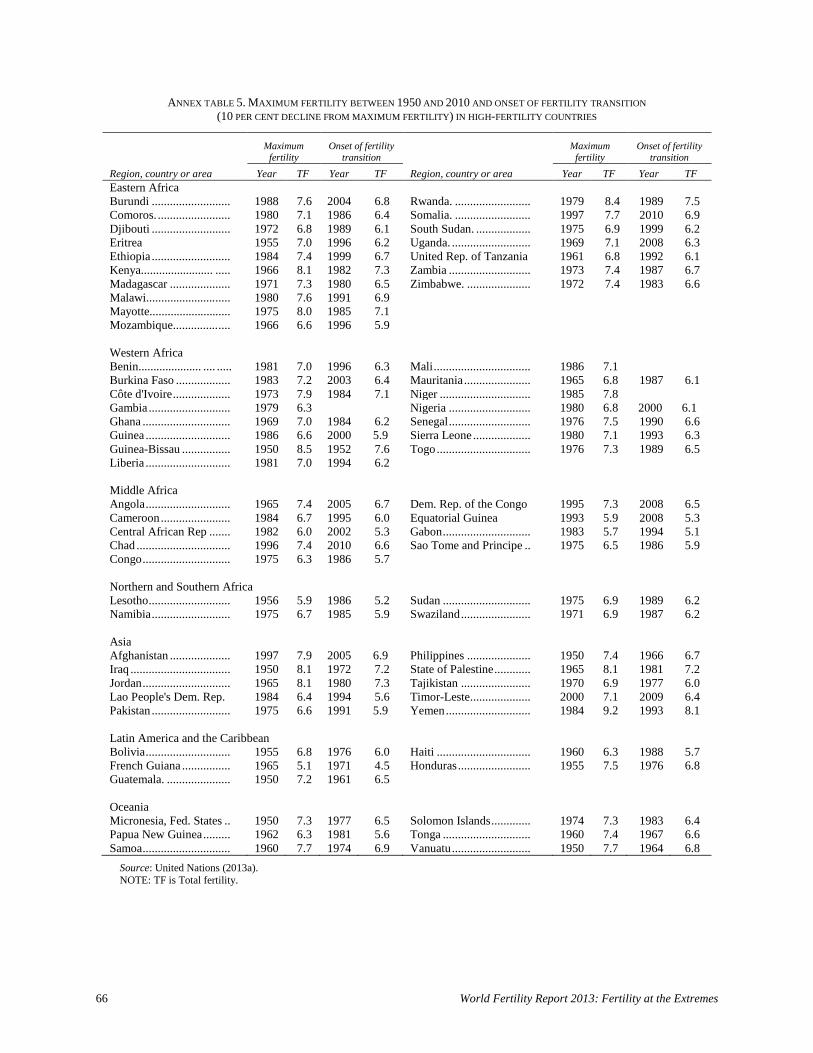
66 World Fertility Report 2013: Fertility at the Extremes
ANNEX TABLE 5. MAXIMUM FERTILITY BETWEEN 1950 AND 2010 AND ONSET OF FERTILITY TRANSITION (10 PER CENT DECLINE FROM MAXIMUM FERTILITY) IN HIGH-FERTILITY COUNTRIES
Source: United Nations (2013a). NOTE: TF is Total fertility.
Maximum
fertility Onset of fertility
transition Maximum
fertility Onset of fertility
transition Region, country or area Year TF Year TF Region, country or area Year TF Year TF Eastern Africa Burundi .......................... 1988 7.6 2004 6.8 Rwanda. ......................... 1979 8.4 1989 7.5 Comoros. ........................ 1980 7.1 1986 6.4 Somalia. ......................... 1997 7.7 2010 6.9 Djibouti .......................... 1972 6.8 1989 6.1 South Sudan. .................. 1975 6.9 1999 6.2 Eritrea 1955 7.0 1996 6.2 Uganda. .......................... 1969 7.1 2008 6.3 Ethiopia .......................... 1984 7.4 1999 6.7 United Rep. of Tanzania 1961 6.8 1992 6.1 Kenya........................ ..... 1966 8.1 1982 7.3 Zambia ........................... 1973 7.4 1987 6.7 Madagascar .................... 1971 7.3 1980 6.5 Zimbabwe. ..................... 1972 7.4 1983 6.6 Malawi....................... ..... 1980 7.6 1991 6.9 Mayotte........................... 1975 8.0 1985 7.1 Mozambique............... .... 1966 6.6 1996 5.9 Western Africa Benin..................... .... ..... 1981 7.0 1996 6.3 Mali ................................ 1986 7.1 Burkina Faso .................. 1983 7.2 2003 6.4 Mauritania ...................... 1965 6.8 1987 6.1 Côte d'Ivoire ................... 1973 7.9 1984 7.1 Niger .............................. 1985 7.8 Gambia ........................... 1979 6.3 Nigeria ........................... 1980 6.8 2000 6.1 Ghana ............................. 1969 7.0 1984 6.2 Senegal ........................... 1976 7.5 1990 6.6 Guinea ............................ 1986 6.6 2000 5.9 Sierra Leone ................... 1980 7.1 1993 6.3 Guinea-Bissau ................ 1950 8.5 1952 7.6 Togo ............................... 1976 7.3 1989 6.5 Liberia ............................ 1981 7.0 1994 6.2 Middle Africa Angola ............................ 1965 7.4 2005 6.7 Dem. Rep. of the Congo 1995 7.3 2008 6.5 Cameroon ....................... 1984 6.7 1995 6.0 Equatorial Guinea 1993 5.9 2008 5.3 Central African Rep ....... 1982 6.0 2002 5.3 Gabon ............................. 1983 5.7 1994 5.1 Chad ............................... 1996 7.4 2010 6.6 Sao Tome and Principe .. 1975 6.5 1986 5.9 Congo ............................. 1975 6.3 1986 5.7 Northern and Southern Africa Lesotho ........................... 1956 5.9 1986 5.2 Sudan ............................. 1975 6.9 1989 6.2 Namibia .......................... 1975 6.7 1985 5.9 Swaziland ....................... 1971 6.9 1987 6.2 Asia Afghanistan .................... 1997 7.9 2005 6.9 Philippines ..................... 1950 7.4 1966 6.7 Iraq ................................. 1950 8.1 1972 7.2 State of Palestine ............ 1965 8.1 1981 7.2 Jordan ............................. 1965 8.1 1980 7.3 Tajikistan ....................... 1970 6.9 1977 6.0 Lao People's Dem. Rep. 1984 6.4 1994 5.6 Timor-Leste.................... 2000 7.1 2009 6.4 Pakistan .......................... 1975 6.6 1991 5.9 Yemen ............................ 1984 9.2 1993 8.1 Latin America and the Caribbean Bolivia ............................ 1955 6.8 1976 6.0 Haiti ............................... 1960 6.3 1988 5.7 French Guiana ................ 1965 5.1 1971 4.5 Honduras ........................ 1955 7.5 1976 6.8 Guatemala. ..................... 1950 7.2 1961 6.5 Oceania Micronesia, Fed. States .. 1950 7.3 1977 6.5 Solomon Islands ............. 1974 7.3 1983 6.4 Papua New Guinea ......... 1962 6.3 1981 5.6 Tonga ............................. 1960 7.4 1967 6.6 Samoa ............................. 1960 7.7 1974 6.9 Vanuatu .......................... 1950 7.7 1964 6.8
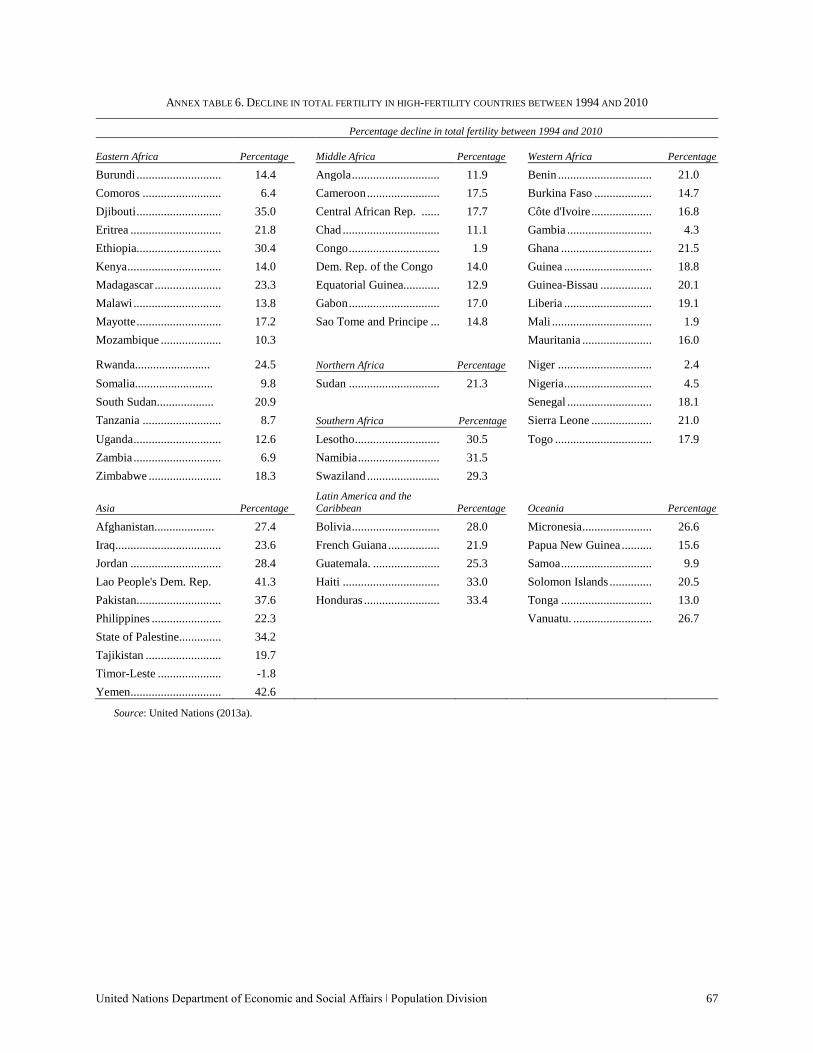
United Nations Department of Economic and Social Affairs ǀ Population Division 67
ANNEX TABLE 6. DECLINE IN TOTAL FERTILITY IN HIGH-FERTILITY COUNTRIES BETWEEN 1994 AND 2010
Percentage decline in total fertility between 1994 and 2010
Eastern Africa Percentage
Middle Africa Percentage
Western Africa Percentage
Burundi ............................ 14.4 Angola ............................. 11.9 Benin ............................... 21.0
Comoros .......................... 6.4 Cameroon ........................ 17.5 Burkina Faso ................... 14.7
Djibouti ............................ 35.0 Central African Rep. ...... 17.7 Côte d'Ivoire .................... 16.8
Eritrea .............................. 21.8 Chad ................................ 11.1 Gambia ............................ 4.3
Ethiopia ............................ 30.4 Congo .............................. 1.9 Ghana .............................. 21.5
Kenya ............................... 14.0 Dem. Rep. of the Congo 14.0 Guinea ............................. 18.8
Madagascar ...................... 23.3 Equatorial Guinea............ 12.9 Guinea-Bissau ................. 20.1
Malawi ............................. 13.8 Gabon .............................. 17.0 Liberia ............................. 19.1
Mayotte ............................ 17.2 Sao Tome and Principe ... 14.8 Mali ................................. 1.9
Mozambique .................... 10.3 Mauritania ....................... 16.0
Rwanda......................... 24.5 Northern Africa Percentage Niger ............................... 2.4
Somalia.......................... 9.8 Sudan .............................. 21.3 Nigeria ............................. 4.5
South Sudan................... 20.9 Senegal ............................ 18.1
Tanzania .......................... 8.7 Southern Africa Percentage Sierra Leone .................... 21.0
Uganda ............................. 12.6 Lesotho ............................ 30.5 Togo ................................ 17.9
Zambia ............................. 6.9 Namibia ........................... 31.5
Zimbabwe ........................ 18.3 Swaziland ........................ 29.3
Asia Percentage
Latin America and the Caribbean Percentage Oceania Percentage
Afghanistan.................... 27.4 Bolivia ............................. 28.0 Micronesia ....................... 26.6
Iraq ................................... 23.6 French Guiana ................. 21.9 Papua New Guinea .......... 15.6
Jordan .............................. 28.4 Guatemala. ...................... 25.3 Samoa .............................. 9.9
Lao People's Dem. Rep. 41.3 Haiti ................................ 33.0 Solomon Islands .............. 20.5
Pakistan ............................ 37.6 Honduras ......................... 33.4 Tonga .............................. 13.0
Philippines ....................... 22.3 Vanuatu. .......................... 26.7
State of Palestine.............. 34.2
Tajikistan ......................... 19.7
Timor-Leste ..................... -1.8
Yemen.............................. 42.6
Source: United Nations (2013a).
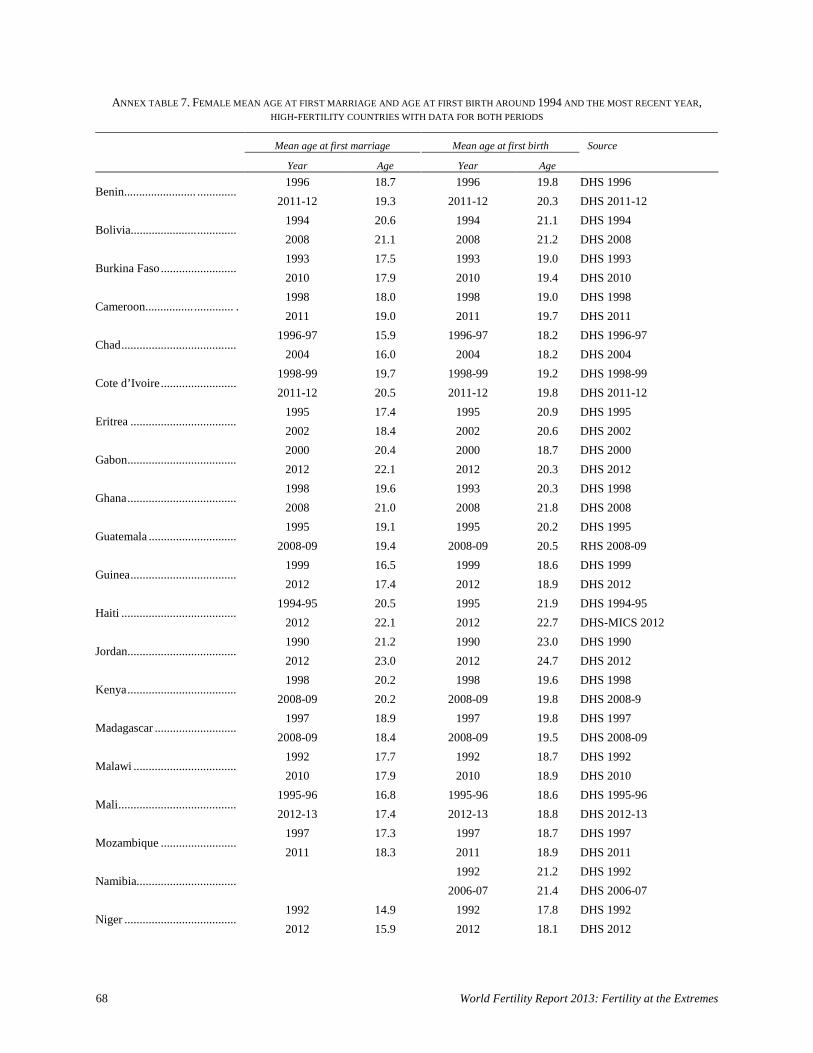
68 World Fertility Report 2013: Fertility at the Extremes
ANNEX TABLE 7. FEMALE MEAN AGE AT FIRST MARRIAGE AND AGE AT FIRST BIRTH AROUND 1994 AND THE MOST RECENT YEAR, HIGH-FERTILITY COUNTRIES WITH DATA FOR BOTH PERIODS
Mean age at first marriage Mean age at first birth Source
Year Age Year Age
Benin........................ ............. 1996 18.7 1996 19.8 DHS 1996
2011-12 19.3 2011-12 20.3 DHS 2011-12
Bolivia...................... ............. 1994 20.6 1994 21.1 DHS 1994
2008 21.1 2008 21.2 DHS 2008
Burkina Faso ......................... 1993 17.5 1993 19.0 DHS 1993
2010 17.9 2010 19.4 DHS 2010
Cameroon................ ............. . 1998 18.0 1998 19.0 DHS 1998
2011 19.0 2011 19.7 DHS 2011
Chad ...................................... 1996-97 15.9 1996-97 18.2 DHS 1996-97
2004 16.0 2004 18.2 DHS 2004
Cote d’Ivoire ......................... 1998-99 19.7 1998-99 19.2 DHS 1998-99
2011-12 20.5 2011-12 19.8 DHS 2011-12
Eritrea ................................... 1995 17.4 1995 20.9 DHS 1995
2002 18.4 2002 20.6 DHS 2002
Gabon .................................... 2000 20.4 2000 18.7 DHS 2000
2012 22.1 2012 20.3 DHS 2012
Ghana .................................... 1998 19.6 1993 20.3 DHS 1998
2008 21.0 2008 21.8 DHS 2008
Guatemala ............................. 1995 19.1 1995 20.2 DHS 1995
2008-09 19.4 2008-09 20.5 RHS 2008-09
Guinea ................................... 1999 16.5 1999 18.6 DHS 1999
2012 17.4 2012 18.9 DHS 2012
Haiti ...................................... 1994-95 20.5 1995 21.9 DHS 1994-95
2012 22.1 2012 22.7 DHS-MICS 2012
Jordan .................................... 1990 21.2 1990 23.0 DHS 1990
2012 23.0 2012 24.7 DHS 2012
Kenya .................................... 1998 20.2 1998 19.6 DHS 1998
2008-09 20.2 2008-09 19.8 DHS 2008-9
Madagascar ........................... 1997 18.9 1997 19.8 DHS 1997
2008-09 18.4 2008-09 19.5 DHS 2008-09
Malawi .................................. 1992 17.7 1992 18.7 DHS 1992
2010 17.9 2010 18.9 DHS 2010
Mali ....................................... 1995-96 16.8 1995-96 18.6 DHS 1995-96
2012-13 17.4 2012-13 18.8 DHS 2012-13
Mozambique ......................... 1997 17.3 1997 18.7 DHS 1997
2011 18.3 2011 18.9 DHS 2011
Namibia................................. 1992 21.2 DHS 1992
2006-07 21.4 DHS 2006-07
Niger ..................................... 1992 14.9 1992 17.8 DHS 1992
2012 15.9 2012 18.1 DHS 2012
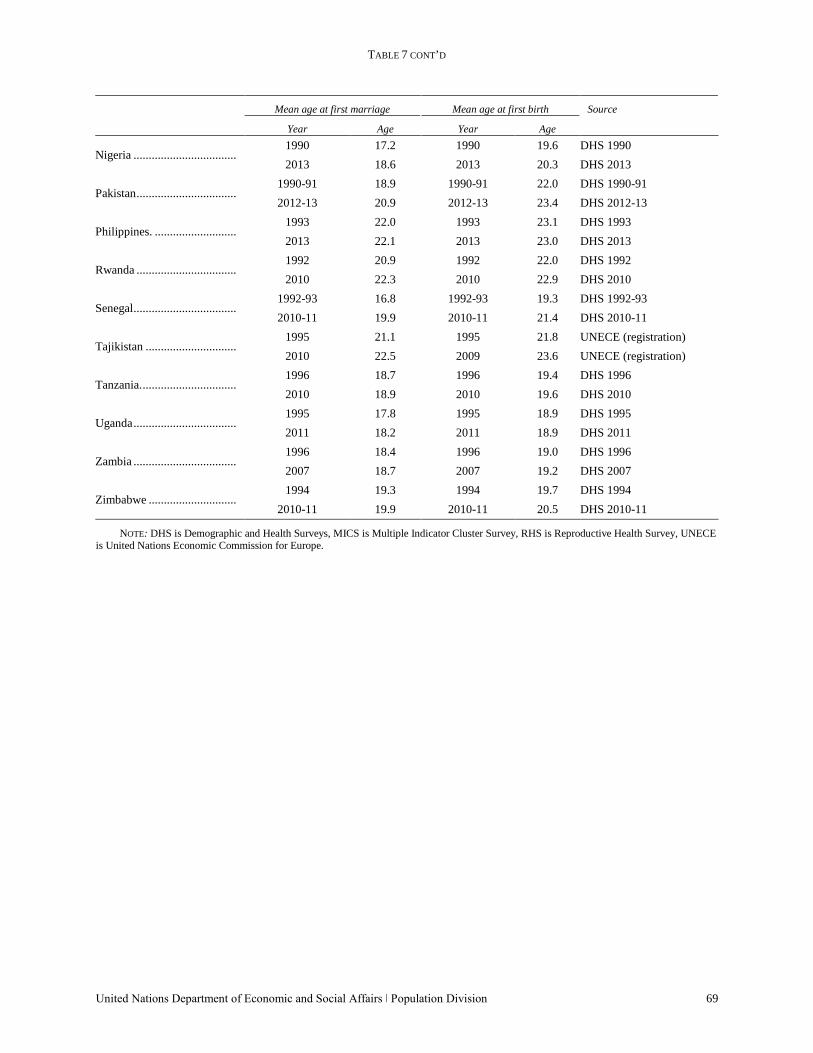
TABLE 7 CONT’D
United Nations Department of Economic and Social Affairs ǀ Population Division 69
Mean age at first marriage Mean age at first birth Source
Year Age Year Age
Nigeria .................................. 1990 17.2 1990 19.6 DHS 1990
2013 18.6 2013 20.3 DHS 2013
Pakistan ................................. 1990-91 18.9 1990-91 22.0 DHS 1990-91
2012-13 20.9 2012-13 23.4 DHS 2012-13
Philippines. ........................... 1993 22.0 1993 23.1 DHS 1993
2013 22.1 2013 23.0 DHS 2013
Rwanda ................................. 1992 20.9 1992 22.0 DHS 1992
2010 22.3 2010 22.9 DHS 2010
Senegal .................................. 1992-93 16.8 1992-93 19.3 DHS 1992-93
2010-11 19.9 2010-11 21.4 DHS 2010-11
Tajikistan .............................. 1995 21.1 1995 21.8 UNECE (registration)
2010 22.5 2009 23.6 UNECE (registration)
Tanzania. ............................... 1996 18.7 1996 19.4 DHS 1996
2010 18.9 2010 19.6 DHS 2010
Uganda .................................. 1995 17.8 1995 18.9 DHS 1995
2011 18.2 2011 18.9 DHS 2011
Zambia .................................. 1996 18.4 1996 19.0 DHS 1996
2007 18.7 2007 19.2 DHS 2007
Zimbabwe ............................. 1994 19.3 1994 19.7 DHS 1994
2010-11 19.9 2010-11 20.5 DHS 2010-11
NOTE: DHS is Demographic and Health Surveys, MICS is Multiple Indicator Cluster Survey, RHS is Reproductive Health Survey, UNECE is United Nations Economic Commission for Europe.