world energy council · pdf fileefficiency and competitiveness ... common misperceptions about...
TRANSCRIPT

Roadmap towards a Competitive European Energy Market
World Energy Council For sustainable energy.

Roadmap towards a Competitive European Energy Market
Copyright © 2010 World Energy Council
All rights reserved. All or part of this publication may be used or reproduced as long as the following citation is included on each copy or transmission: ‘Used by permission of the World Energy Council, London, www.worldenergy.org’
Published 2010 by:
World Energy Council Regency House 1-4 Warwick Street London W1B 5LT United Kingdom
ISBN: 0 946121 38 9
Disclaimer: This report reflects the views of WEC European Members and does not necessarily represent the view of all WEC members.
Roadmap towards a Competitive European Energy Market

Roadmap towards a Competitive European Energy Market World Energy Council 2010
Bulgaria Stefan Kanchovski, NEK EAD
Dimcho Kanev, NEK EAD
Czech Republic Pavel Solc, CEPS a.s.
France Michel Matheu, EdF
Florence Fouquet, GdF
Germany Henning Rentz, RWE
Stefan Ulreich, E.ON AG
Italy Alessandro Clerici, ABB SpA
Bruno Cova, CESI
Francescs Massara, TERNA
Massimo Ceccariglia, TERNA
The Netherlands Theo W. Fens, UCpartners
Poland Dr. Pawel Kuraszkiewicz
Romania Roxana Palade, OPCOM
Victor Ionescu, OPCOM Serbia Dejan Mandic, Energoprojekt Entel
Spain Helena Nosei, Union Fenosa
Sergio Auffray, Union Fenosa
José Antonio García Merino, Union Fenosa
Sweden Gunnar Lundberg, Vattenfall AB (Chair)
Switzerland Niklaus Zepf, AXPO WEC Slav Slavov, Regional Manager for Europe
Jean-Eudes Moncomble, Observateur
Study Group Members

Roadmap towards a Competitive European Energy Market World Energy Council 2010
Introduction 1 Electricity Market Description 2 Definition of Goals for the Power Market 10
Efficiency and Competitiveness 10 Supply Security 10 The Environment 11 Conclusions 12
Status in the European Power Markets 14 From National Markets to Regional Markets 14 Common Misperceptions about Competition 19 Prerequisites for Competition 22 Deficits in the Current European System 25
Regional and National Electricity Markets: An Overview 26 Introduction and an Overview of Europe’s Current Electricity Demand 26 Regional European Energy Markets 28 Conclusions 60
Renewable Energy 61 Introduction 61 Why Encourage the Increase of RES-E in the Generation Mix? 61 What Are the Available Mechanisms to Promote RES-E? 63 Which of these Mechanisms Are the Most Effective and Efficient? 65 What Are the Technical Issues Surrounding Integration of the RES-E Grid into Europe’s Generation Mix? 67 What Are the Current Status and the Future Goals for RES-E in Europe? 74 Conclusions 74
Obstacles 76 Political Obstacles 76 Technical Obstacles 76 Market Obstacles 77
Roadmap and Recommendations 78 Annex 1 82 Annex 2 85 Annex 3 87 References 89
Contents
Roadmap towards a Competitive European Energy Market World Energy Council 2010
1
With the financial crisis evolving into a severe, global economic recession, there have been growing doubts over whether energy markets can continue to operate efficiently under present conditions or whether the shift to non-market mechanisms would be a better choice. This question remains an ongoing source of debate in the recently liberalised electricity sector.
Textbook wisdom says that the market is the most efficient place to allocate financial means for investments. Therefore, during a period of a crisis, it should follow that we actually need more market mechanisms, not fewer, if we want to stimulate investments in an economically efficient way. Regulated electricity prices and nationalistic thinking will not help to solve Europe’s electricity challenges with regards to either the generation or the transportation of electricity.
For the electricity market, the central danger of the current recession is that countries will revert to national thinking and protectionism to the detriment of Europe as a whole. Increased protectionism will almost certainly stop further investments into the European grid infrastructure, and it will slow the exchanges between different national markets that Europe so desperately needs. Grid improvements are the core challenge for the European electricity sector, and the successful completion of these improvements is necessary if regional markets are going to take the next steps towards a truly common European market.
This report describes the current situation of European electricity markets. It clearly shows that the various European markets are still in different stages of development and in opening themselves up to fair market competition. The process of integration must be accelerated. Failure to speed
up this process will result in lost momentum and then inertia. One possible solution to this challenge would be to define a core-European region as a model region for competitive markets. To this end, policymakers and European market players should better co-ordinate their efforts to attract the necessary investments and to implement updated regulations and smart market solutions.
This report focuses primarily on the electricity market. Though the EU-directive for liberalisation of European electricity and gas markets (February 1996) and subsequent provisions have addressed electricity and gas under the same heading, the authors of this report maintain that these markets are actually quite different in nature and deserve to be studied independently. Carrying out another report focused specifically on the gas market would be desirable and would have a complementary value to this study.
Renewable energies are playing an increasing role in power generation, and they are a valuable contribution to Europe’s energy security and Europe’s sustainable energy development. The recent EU-Energy Climate Package has fixed ambitious targets to integrate renewable energy sources into Europe’s energy mix, and those targets are being encouraged by a number of policy incentives. However, many economic and operational problems still exist. Renewables are not yet competitive, and the existing large grids still need to adapt to and ease the access of smaller, decentralised RES-electricity producers without causing operational failures to the system. The study broadly considers all of these issues and recommends some market–based solutions to solve them.
Introduction

Roadmap towards a Competitive European Energy Market World Energy Council 2010
2
Prior to liberalisation, all EU countries had vertically-integrated utilities. In some countries there were also local distribution companies, all with a local monopoly over their service territory.
Electricity prices in Europe varied considerably depending on generation mix. Countries with large hydro capabilities had the lowest prices followed by countries that depended on nuclear facilities as their primary generating source. When low-cost gas fired generation became available, the pressure on high-cost coal plants increased. Pre-liberalisation, the consumer shouldered the risks: cost overruns and operational mistakes made by the supplier resulted in higher prices for the consumer.
Liberalisation of energy markets was first discussed in the 1980s. The debate was mainly driven by economists and was focused on the need to improve the overall efficiency in the systems. Because of the fundamentals of monopoly markets, large surplus capacities had emerged in all countries. Making matters worse, utility companies constantly over-invested in capacity. Even though economic models existed that would show how to optimize the systems from social and economic points of view, there was a general consensus among electricity producers that it was better “to be on the safe side” than to risk a shortage. Since all costs of these overestimations could be passed to the consumers, there was little motivation for the producers to do anything differently.
In England, the shift towards liberalisation started in earnest in 1990. There, the goal was both privatisation and liberalisation, but in other
countries, liberalisation was not necessarily coupled with privatisation. That was the case in Scandinavia where the focus was primarily on ensuring a sufficient number of market actors rather than on who was the owner of those companies. Several economists (for example Joskow, Dec 2008) argued that the important thing was “to create hard budget constraints and high-powered incentives for performance improvements and to make it more difficult for the state to use these enterprises to pursue costly political agendas.” The question of whether it mattered if the state acted as a professional owner or if the state never can nor will act commercially remained a topic of debate.
The European Union presented its first electricity market directive in 1996 (Directive 96/92/EC). Because the EU’s mandate does not allow it to prescribe the form of ownership, the EU’s goal was focused entirely on the liberalisation of the electricity sector, not privatisation. From the beginning, the basic element of the EU liberalisation was the freedom of customers to choose their electricity supplier based on the three pillars identified in the European Treaty: free movement of capital, goods, and people. This model implicitly directed Europe into a retail competition model of liberalisation. By comparison, in the United States, liberalisation started with electricity generators, resulting in wholesale competition. It was then left open to each individual state whether or not to introduce retail competition as well. Thus, we see two fundamentally different models: the European model focused on retail competition and, by extension, wholesale competition, and the US model focused strictly on
Electricity Market Description

Roadmap towards a Competitive European Energy Market World Energy Council 2010
3
wholesale competition. Economists differ dramatically in their assessments of these models. One school says that wholesale competition is the important step and that once it is properly in place, regulation of retail prices can very well remain because retail margins make up a very small percentage in that part of the value chain. Other economists maintain that customer choice and retail competition is necessary in order to guarantee competitive behaviour in wholesale markets.
One of the most important prerequisites for a liberalised market is the “unbundling” of the value chain. This is because direct access to the networks is necessary in order for generators to compete and for customers to choose suppliers. Because transmission and distribution are natural monopolies, they need to be regulated in order to ensure competition. Generation, sales, and trading are naturally more open to competition and thus do not need to be regulated more than the free market already dictates.
How far unbundling will go has been the big debate in Europe over the last 10 years. Because transmission plays such an essential role in system operation and system planning, many argue that it is important for distribution to be strictly separated between generation and sales on one side and transmission on the other. From a distribution perspective, it is sufficient to legally and functionally separate distribution from generation and sales.
In the United States, where privately listed companies own the majority of transmission
networks, unbundling of ownership has not been implemented. Instead, in several parts of the United States, Independent System Operators (ISOs) have been created. These ISOs are responsible for system planning and system operation. The owner of the transmission system gets a fair return on assets but has no influence on the operation. The ISOs are normally regional and examples include PJM (Pennsylvania-New Jersey-Maryland Interconnection), NE (New England), NYISO (New York Independent System Operator), and MISO (Midwest Independent System Operator). This has created larger regional markets with a larger number of actors, high liquidity on the market, and, consequently, improved competition.
There is another fundamental difference between the European model and the US model. In Europe the basic element in the market is the day-ahead market. In this situation, market price is set day-ahead at the point where supply meets demand. This price is normally a reference price for financial products like futures and forwards. Trade is done via both Power Exchanges and OTC (over-the-counter).
In the United States wholesale markets use Locational Marginal Pricing (LMP). The price is calculated in real time for every node in the transmission system. Nodes with surplus of generation will show a lower price than nodes with less generation, thus giving locational signals to consumers, generators, and transmitters. Financial trade is operated over NYMEX or other platforms using the LMP as reference prices. In combination with this energy-related market, there have been markets for capacity introduced.
Figure 1 The value chain of the electricity market from generation to the end-customer.

Roadmap towards a Competitive European Energy Market World Energy Council 2010
4
Since liberalisation began, the structure of the market has changed considerably. Some countries like the United Kingdom started by splitting up and privatising what had been entirely state-owned monopolies. Meanwhile, other countries have privatised the incumbent state-owned company.
In any case, before liberalisation, no pan-European electric companies existed. Today, however, there are a number of companies which are active in countries beyond their home country. In countries where there are many distribution companies, mergers have taken place, creating fewer but larger distribution companies.
The restructuring process continues and will continue indefinitely; the overall goal of a fully compatible European Electricity Market is far from being completed.
Liberalisation has gone much slower than anticipated in original proposals because of political resistance in many countries. Moreover, the EU has now been enlarged by 12 countries, none of which boast strong, competitive markets.
By the middle of 2009, there were three fairly well developed European markets. The UK market is the frontrunner, functioning well today but having difficulties merging with other markets because of
its unique market design fundamentals. The Nordic market is an advanced Regional Market with one regional Power Exchange and TSO cooperation above the European standard. The Central Western European Market (CWE), which includes France, Luxembourg, Belgium, the Netherlands, and Germany, is, by volume, the largest regional market in Europe. The CWE Market has shown progress, but there is still a lot of work to do if it is going to achieve the kinds of harmonisation present in the Nordic market.
Other markets in the south of Europe function fairly well on the wholesale level, but when it comes to the retail market (the market important for the customers), the systems begin to break down. For example, in Spain price regulation totally distorts the market and makes competition impossible. The same problem exists in Eastern Europe where the old state-dominated system has not yet been replaced by a competitive market.
In the Nordic market there is a trend towards more spot market-oriented contracts also among households’ customers. In Norway this has been in place many years, and it has been shown to improve customers’ response to prices. In combination with advanced metering, spot market contracts are able to increase demand response.
Figure 2 This report mainly focuses on the wholesale market. Other parts of the market (e.g. the retail market) that also shape competition are not considered because they still show large discrepancies between nations.

Roadmap towards a Competitive European Energy Market World Energy Council 2010
5
As noted earlier, the main objective of liberalisation is to improve the efficiency of the system and thus to create socio-economic benefits. Central to the discussion on efficiency is the pricing methodology. In old monopoly markets the price was regulated based on the average costs for the whole system. The newest generation units normally have above average costs. Thus, the regulated average price stimulated a higher use of electricity than there would have been if the marginal cost for the last unit had set the price. For a generator it was necessary to know that he could include the cost of the new generation unit in his total cost since this last unit could not be motivated by the price allowed by the policymakers.
In a competitive market, the market sets the price so that supply meets demand, normally called marginal cost pricing. This pricing model gives the customer information about the cost of an increase
or decrease in consumption. The model also gives information on what the customer is prepared to pay for additional supply. This demonstrates that it would be very difficult to talk about energy efficiency without first having market-based pricing. One of the reasons for Demand Side Management Programs or State Subsidies for Energy Efficiency in monopoly markets was to overcome the difference between the regulated price and the marginal cost of last produced kWh.
Liberalisation of many markets started when there was a substantial surplus of capacity. Following economic theory, when markets opened (or, in some instances, even before markets opened) prices immediately started to fall towards short- term marginal costs. When old capacity was phased out and demand increased, prices also started to increase, again in line with economic theory.
Figure 3 Wholesale Market Structure: The structure of the wholesale market: the market splits into a part with physical delivery and a part with financial settlement. Additionally, we have different marketplaces with exchanges and OTC-market. PX = power exchange; TSO = transmission service operator; OTC = over the counter

Roadmap towards a Competitive European Energy Market World Energy Council 2010
6
The period between 2005 and 2008 saw increasing fuel prices, which was reflected in higher electricity prices. When fuel prices went down again in the end of 2008 and when overall demand went down as a result of the financial crisis, electricity prices also went down.
Going forward, climate change will have an impact on electricity prices in liberalised markets. This is true regardless of the methods chosen to reduce CO2 emissions. For example, if an Emission Trading System sets a price for CO2, this price will essentially be a cost for a generation unit based on fossil fuels. If that generation unit sets the market price on electricity, the CO2 price will, by extension, have an impact on the electricity price. The same would happen with a tax on CO2. In a regulated electricity market, like the ones that exist in some parts of the United States, the situation would be different. In these situations, the regulator can accept the total CO2 cost, whether it comes from auctioning of CO2 allowances or from a tax for the generator, and include that cost in the regulated costs that the electricity price is based upon. The regulator cannot include so-called opportunity costs if there is free allocation of CO2 allowances. Therefore, a cap and trade system with free allowances would result in much lower electricity prices in those US states with regulated markets compared to those states with liberalised markets. This lower electricity price would give the wrong signal to customers to reduce CO2 emissions and/or to increase energy efficiency. The aim of liberalisation is not lower prices per se. It is efficient prices contributing to socio-economic efficiency. The distribution of producer or consumer surplus is
another issue. What can be learned from liberalisation processes around the world?
The first lesson is that liberalisation will not necessarily lower electricity prices as initially announced. If liberalisation is started when there is surplus of capacity, prices will fall. This has been demonstrated in many parts of Europe. However, when there is no surplus, market prices will have to adjust so that supply meets demand. Otherwise, someone will have to pay for this additional consumption and supply. In some countries, taxpayers indirectly shoulder this burden. Thus, the conclusion is that liberalisation will result in more efficient but not necessarily lower prices.
The second lesson is that liberalisation leads to efficient investments. In a market with regulated prices, investors speculate in including the investment cost in the regulated cost base so that prices will increase but not reach the full cost of the new capacity. Although the new generation capacity alone will not be profitable, the entire generation portfolio can be. This price below where supply meets demand will stimulate a higher use of electricity compared to the cost of new generation capacity.
In a liberalised market, the generators have to match new investments to the point in time where the price is equal to or higher than the cost of the generator to be built. This is, of course, a very challenging exercise, which will become even more difficult if the European Trading System (ETS) or another carbon market sets an accepted price for
Figure 4 The retail market has a different market structure.

Roadmap towards a Competitive European Energy Market World Energy Council 2010
7
CO2. If a European or global carbon market does become established, it should be obvious that electricity prices will be better set by a market model where supply and demand set the price than by a regulated system.
The third lesson is that when liberalisation is finished, the scope of political interventions in the electricity supply business diminishes. This alone probably contributes quite considerably to the overall efficiency of the electricity market. From a
politician’s point of view, it can be frustrating to not have authority beyond setting the rules of the market. On the other hand, it should be quite convenient for politicians to not be obligated to act when there are problems, as was the case in the old days.
Mostly because of the sensitive pricing issues described above, liberalisation is a vulnerable process. During the transition from monopolies to competitive markets, many countries have
Figure 5 European wholesale electricity prices between 1995 and 2006. Evolution of end-user prices for industrial users (24 GWh without VAT) and evolution of oil and coal prices (1995-2006) based on nominal prices in Euros. The difference in the price increases is notable: whereas heavy fuel oil almost tripled in nominal terms between 1995 and 2006, electricity increased by 25% in nominal terms, and in real terms it even decreased slightly. Source: Benefits from Liberalisation: Update to EURELECTRIC-KEMA report confirms price reductions for customers, July 2007.

Roadmap towards a Competitive European Energy Market World Energy Council 2010
8
implemented various forms of price regulation. In some cases, governments and regulators cite lack of competition or to the desire to simply avoid rapid price increases for customers. However, in the long run competition is likely to help reduce prices and improve quality.
The sentiment of the old expression “you cannot be half pregnant” could easily be applied to energy markets. Once a liberalised European Energy Market has been agreed upon, it is necessary to push that market to develop as quickly as possible and to allow it to be as close to perfect competition as possible. Any errors or missteps during the process could provoke political interventions, possibly halting the liberalisation process to the detriment of the society. This potential outcome is depicted in Figure 6.
Through three different directives, (96/92/EC, 2003/54/EC, and the 3rd energy package with the relevant directive 2009/72/EC for the electricity market), the liberalisation process in Europe has largely followed the first track identified in Figure 6. However, the Nordic market is currently the only organised market. The CWE market has made progress in the last two years but is in a vulnerable stage. Other markets are still in the process of liberalising on the national level or are just beginning to have price convergence on a regional level. Throughout these processes, we can observe several instances where national political opportunism has led to regulations that push electricity prices below market levels (indicated by track 2 in Figure 6), thus hindering development towards a truly competitive market.
The European Commission and the European regulators (ERGEG) have set up seven regional initiatives to better structure regional markets. These initiatives have had varying degrees of success. In some of these cases, national governments have not done enough to advance the development of regional markets. Whether it is because of national rules governing the handling of CO2 costs, moving congestions to the country borders instead of dealing with them where they physically are located, or introducing export fees, these examples of nationalism (Track 3) result in the short term protection of the national consumer and undermine the broader goal of having an Internal Electricity Market (IEM) in Europe.
It is unlikely that the system of having very different market rules governing different EU countries will be viable for much longer, but the question remains: are European directives to be followed or is it acceptable that countries continue sidestepping them? If repeated national interventions are taken to the extreme, the IEM will be dead on arrival, and countries will have no choice but to go back to national monopolies (Track 4).

Roadmap towards a Competitive European Energy Market World Energy Council 2010
9
In short, there are three potential outcomes that could result from the liberalisation of European electricity markets:
The continued integration of regional markets, ultimately resulting in a European-wide market
Certain regions - most likely the northern and north western regions—will develop their own functional markets. The other regions of Europe will develop more slowly, and there will be repeated infringement procedures from the European Commission against these countries
The liberalisation efforts in Europe will collapse. National monopolies or more regulated markets will be reintroduced
Figure 6 Possible types of developments: The market could evolve into a fully integrated European market; however, national interventions could also undermine this, thus leading back to regulated national markets. NOTE: This chart has been purposefully simplified in order to generalise the possible developments.

Roadmap towards a Competitive European Energy Market World Energy Council 2010
10
From a long-term perspective, three goals should drive the European electricity market.
1. The electricity market should be as competitive as possible. This is a reasonable aspiration as it supports the overall European target to make Europe a leader in global competitiveness (i.e. Lisbon target for the EU).
2. In order to meet the overall competitiveness target, electricity supply security should be improved, and Europe must reduce its dependency on non-European countries.
3. The electricity market must strive to be more environmentally friendly in support of the Kyoto Protocol targets.
These three objectives are, in principle, supported by a large majority of politicians in Europe (both EU and non-EU members alike). In addition to these targets, the electricity market must ensure the overall justice for all European inhabitants.
Efficiency and Competitiveness One of Europe’s top priorities is the establishment of a truly competitive electricity market in Europe. This will enable a substantially larger market compared to what could exist in individual countries, and thus, optimisation will occur over a bigger volume. The new European market will have more players, which will increase competition and reduce unit cost. A unified European market will also have the advantage of requiring less reserve
capacity than all single markets combined. This will further reduce cost. Fortunately, most European politicians accept these core principles of electricity liberalisation.
To ensure true competition, a pan-European market will require that electricity can be exchanged across-borders. The current market rules ensure that the electricity can be transported on the highest grid level at the same price independent of the distance. This principle best supports the development of a competitive electricity market.
Supply Security Europe’s energy dependency is high and is likely to continue increasing. Meanwhile, Europe’s own oil and gas reserves are steadily decreasing, and the continent’s overall energy demand continues to grow. Currently, 50% of all European energy supply comes from outside Europe. This will increase to nearly 70% by 2030. Politically, Europe is becoming more and more vulnerable to foreign energy suppliers, thus undermining its economic independence. Making matters worse, a significant amount of Europe’s money will be transferred annually to countries outside Europe, reducing Europe’s trade balance.
By reducing energy consumption and electricity demand, Europe can support its goals of reducing its energy dependency. Improving energy efficiency will play a fundamental role in this process, while also helping the European electricity market to become even more competitive. Possible steps to improve energy efficiency include laws (maximum
Definition of Goals for the Power Market

Roadmap towards a Competitive European Energy Market World Energy Council 2010
11
energy consumption by application) or a true market (white certificate).
In the short term, a legal approach is likely to bring the best efficiency results. In the long term, however, it is expected that the market approach will bring better results, as it will ensure higher levels of efficiency at lower costs. (See the arguments related to the CO2 market).
Diversification is another core component of supply security. Diversification can be achieved with regard to prime energy, locations, and production methods.
As noted in Chapter 2.1, security of supply requires that generators be in geographical proximity to consumers. The wider the distance between generators and consumers, the higher the reliance is. The development of the generation capacity depends on the free market, but the development of the high voltage grid depends on the transmission system operator (TSO) of each country. This creates a challenge because the generation market has a European perspective, but the TSOs will have a harder time getting together to develop a common European strategy and to give the generation market a clear and binding framework. If the TSOs are unable to cooperate
effectively, a Regional System Operator (RSO) may be the next alternative.
The Environment Compared to ten years ago, concerns over the environment are playing a much more central role in the debate over European energy markets. Over the last decade, a European carbon market has been successfully established. This market has had a significant impact on the electricity market. In addition to the carbon market, all EU countries have their own national targets for increasing their use of renewable energy resources.
For citizens and politicians alike, the common perception is that the EU’s carbon-reduction goals and its renewable energy targets are working hand-in-hand to reduce CO2 emissions, but it is worth challenging these assumptions. For a given period, the EU defines the maximum legal amount of CO2 emissions. The market then finds those production plants and processes which can reduce CO2 to targeted amounts with the least cost. The most expensive of emissions-reducing methods effectively defines the price of the CO2. Politicians play an indirect role in setting the price of carbon through legislating emissions caps and defining the total amount of permissible CO2 emissions. The
Figure 7 The EU-25’s dependency on imports from non-European suppliers. Source: EU Commission 2004

Roadmap towards a Competitive European Energy Market World Energy Council 2010
12
larger the carbon market is and the more CO2
emitters there are in this market, the better the
overall carbon market system works.
The financial incentives to promote renewable
energy can also help reduce carbon emissions.
However, the RES-E targets are national, and free
trade of RES-E across-borders is not allowed.
These national systems have an impact on the
global carbon market – depending strongly on the
carbon intensity of the existing generation mix and
the degree of penetration of renewables in a
country. Still, the market price of carbon alone
would not be sufficient to promote investments in
renewables since the difference between the costs
to produce renewable electricity and the market
price for electricity is larger than the market price
for carbon (RES costs – Market price for electricity
> CO2 -price).
Figure 8 shows that the abatement costs of various
technologies are very different. These costs now
have to be compared to the market price of carbon.
The chart shows that the cost of electricity
production from most renewable technologies is
often significantly higher than the costs for
conventional electricity generation. This is true
even when the price of carbon is included in the
cost of conventional electricity production.
The current carbon market in Europe is working.
Going forward, it will be necessary to ensure that
as many industries and carbon emitters as possible
participate in this carbon market and that the
number of exceptions is reduced to an absolute
minimum. This will help to minimise distortions. In
the long run, subsidy systems for renewables
should converge with the market price of carbon to
achieve the most environmental benefits at the
lowest possible costs.
Figure 8
Typical range of abatement costs for various technologies. The different technologies show a wide range of
abatement costs. Nuclear (EPR) and improved insulation of homes in particular are projects that would be
profitable even without a carbon price.
Source: Fahl 2006.

Roadmap towards a Competitive European Energy Market World Energy Council 2010
13
Conclusions The goal of the liberalised market is to achieve competitive price position. However, this economic goal is not necessarily shared by society as a whole, and society may have other, conflicting priorities. It often seems that consumers want it all: the lowest possible energy price, low price variation, security of energy supply, high environmental standards, energy infrastructures that do not alter or damage the landscape, and independence from foreign suppliers.
Today, we have with a European-wide carbon market and many variations of national laws and regulations. It will be difficult in the long run to combine a European electricity market and a global carbon market with national support systems for RES-E. Currently, we have a conflict of systems with regulated RES energy and un-regulated parts of the generation market. It is very demanding to optimise this, as Europe is in between national markets and a European market. In the words of Michael Porter, Europe is “stuck in the middle.” It suffers from the disadvantages of both extremes, and it cannot take the necessary steps to achieve the ideal system.
Overall, what Europe wants and what is feasible are not entirely compatible. The multidimensional optimisation process is very demanding. For this reason, we are confronted with patchwork markets that fall short of the optimal outcome. It is not only essential to achieve the best overall solution;
people must also understand and trust this solution.
Today, we are far away from our key objectives. It is up to politicians and the electricity sector at large to improve consumer confidence in the system.
Overall, what Europe wants and what is feasible are not entirely compatible. The multidimensional optimisation process is very demanding. For this reason, we are confronted with patchwork markets that fall short of the optimal outcome. It is not only essential to achieve the best overall solution; people must also understand and trust this solution. Today, we are far away from our key objectives. It is up to politicians and the electricity sector at large to improve consumer confidence in the system.

Roadmap towards a Competitive European Energy Market World Energy Council 2010
14
From National Markets to Regional Markets Increasingly, the liberalisation of the European electricity markets is being driven by an international perspective. In the past, electricity markets were primarily defined on a national scale, and it was often the case that a monopoly-holding incumbent controlled the entire national market. While some cross-border exchanges did take place (for example, during times of seasonal shortages or unexpected power plant outages), generation portfolios and transmission grids were really designed to meet the needs of their respective nations. With the introduction of a liberalised electricity market, cross-border exchanges of electricity increased. This was due to the fact that consumers were looking for the cheapest sources of electricity available.
Toy model as an introduction: Four countries form a regional market
In this example, we consider four countries; A, B, C and D; and their respective national electricity markets. In case of no connection between these countries, there will be no increase of competition at the time of liberalisation. However, the situation changes when the transmission system is modified towards cross-border exchange and when the regulatory framework is more or less identical. Both prerequisites are necessary to build new power plants at the lowest possible costs. In the final state, all new power stations have been built at the
cheapest sites, and the old power stations have been completely replaced.
This simple example explains some critical timescales and issues:
Time to improve the grids for international electricity transport
Time to build new generation capacity in order to increase competition
Accepting dependence on neighbour countries electricity generation is necessary
Achieving a truly competitive market takes time, typically at least the magnitude of order of an investment cycle in the generation, and in the transmission sector. Additionally, a substantial amount of new transmission capacity and new generation capacity is necessary to enter into a competitive market. This is a strong difference in comparison to other markets with short investment cycles.
The minimum time it will take to achieve competitiveness will be defined by the lead and construction time of the assets. Additional time may also be necessary to develop a harmonised framework for the affected countries. Several approaches are possible, for example, one regulator and one TSO per country or one regulator and one TSO per region. Certainly the one regulator and one TSO per region approach could speed up the liberalisation process tremendously. A country-by-country approach could also deliver the same results, provided there is effective
Status in the European Power Markets

Roadmap towards a Competitive European Energy Market World Energy Council 2010
15
cooperation between each nation’s regulator and TSO.
Generation Market
Table 1 shows the market shares of generation companies in various European countries. This table specifically ignores the question of international competition. Therefore, the values overestimate the market power of the companies in question and are only relevant in case of broadly hypothetical discussions. It is important to stress that when the cross-border exchange of electricity is taken into account, it may lead to a very different picture of market power.
One famous example in Europe is the Nordic market, composed of Finland, Sweden, Norway, and Denmark. The three largest generators in this region have a market share of about 40%. That is a clear contrast to the national shares of 75% in Denmark, 68% in Finland, and 78% in Sweden. This indicates that integrating national markets into regional ones is an effective way to reduce market share of the most dominant companies.
Table 1 The Key parameters of the national generation markets within the EU-27. The key parameters of the national generation markets still show the strong legacy of monopolies. That said, it is questionable to use national borders for the calculation of these parameters. The alternative is to use regional markets, which would reflect the integration of formerly national markets into an international market.
Source: EU Commission, COM (2009) 115 final, March 11, 2009, Report on Progress in Creating the Internal Gas and Electricity Market
Number of companies with more than 5% share of generation capacity (%)
Share of 3 biggest companies (%)
2006 2007 2006 2007 Austria 5 5 52.2 52 Belgium 2 2 93 99.9 Bulgaria 6 6 56.4 56.4 Cyprus 1 1 100 100 Czech Republic 1 1 73.54 76.85 Denmark 2 2 75 75 Estonia 1 1 99 99 Finland 4 4 67 68 France 1 1 93 93 Germany 5 4 68.52 85.4 Greece 1 1 99 Hungary 6 5 67 67 Ireland 4 72 Italy 5 5 66.3 61.2 Latvia 1 1 95 93 Lithuania 3 3 84 84 Luxembourg 3 3 74.8 80 Malta Norway 5 6 43.7 40 Poland 6 5 62.8 50.9 Portugal 3 2 75 72.5 Romania 5 5 65.1 63.7 Slovak Republic 1 1 84.8 85.2 Slovenia 3 3 89.8 92.7 Spain 4 5 60.3 76 Sweden 3 3 79 78 The Netherlands 4 6 62 61 United Kingdom 6 8 37.5 41

Roadmap towards a Competitive European Energy Market World Energy Council 2010
16
National markets should fulfil some basic criteria in order to be included in a regional market:
Liquid day-ahead and forward markets and open balancing and intra-day markets with trustworthy prices;
A sufficient number of market participants, energy suppliers, and large consumers;
Transparent access to market information;
Congestion management in the regional market based on market rules.
The TSOs play a crucial role in the emergence of regional markets (see following section).
Transmission
Often, discussions about electricity transmission centre on ownership issues. With this focus, topics such as developing a regional framework for TSOs and identifying the tasks of TSOs in the context of a regional electricity market often get neglected.
In order to allow cross-border trading on all markets, the TSO rules need to be better harmonised. Possible steps in this direction include defining gate closures, nomination procedures, and balancing rules. Furthermore, the congestion management of bottlenecks must be co-ordinated and market-based. If it can be done in an economically feasible way, the development of interconnection capacity will help reduce these bottlenecks and facilitate market integration.
The task of minimising bottlenecks is more difficult than it may originally seem. Most TSOs operate in a regulated environment, and the regulator defines the income of the TSOs. By and large, regulators have a very nationalistic point of view. Therefore, it is questionable, whether they will create the right incentives for increasing interconnectivity.
TSOs should also strive for cooperation with generators, as this will help grid development to occur simultaneously with the development of generation infrastructure. A special focus here is on renewable generation and the challenges posed by its wide fluctuations in generation.
The current state of transmission in the European market still reflects the old national infrastructure, where the main focus was to distribute electricity within one country. Only in rare cases was a cross-border exchange of electricity necessary. With the liberalisation of the electricity markets, however, the weak international connections are increasingly evident, and the necessity for further international development is even more pressing.

Roadmap towards a Competitive European Energy Market World Energy Council 2010
17
Table 2 Indicative values for Net Transfer Capacities (NTC) in Europe, Winter 2008-2009, working day, peak hours, non-binding values. Source: European Network of Transmission System Operators for Electricity (ENTSO-E)
From To MW Provided Comments From To MW Provided Comments
PT ES 1200 Both countries ES PT 1300 Both
countries
FR ES 1400 Both countries ES FR 500 Both
countries
FR IT 2650 Both countries IT FR 995 Both
countries
FR CH 3200 Both countries CH FR 2300 Both
countries
DE FR 2750 Both countries FR DE 2900 Both
countries
BE FR 2200 Both countries FR BE 3200 Both
countries
FR GB 2000 GB GB FR 2000 GB
CH IT 4240 Both countries IT CH 1810 Both
countries
AT IT 220 Both countries IT AT 85 Both
countries
IT SI 160 Both countries SI IT 430 Both
countries
DE CH 1500 Both countries CH DE 3200 Both
countries
DE LU 980 Both countries LU DE NRL Both
countries
NL BE 2400 Both countries NL BE 2400 Both
countries
NL DE 3000 Both countries DE NL 3850 Both
countries
DE AT 2000 Both countries AT DE 1800 Both
countries
DE CZ 800 Both countries CZ DE 2250 Both
countries
Depending on wind situation in Germany
PL DE 1100 DE DE PL 1200 DE
Depending on wind situation in Germany; Because of the meshed system in the region, PL only provides values in the Interdependent NTC Matrix
DK_E DE 550 Both countries DE DK_E 550 Both
countries
DK_W DE 1500 Both countries DE DK_W 950 Both
countries
Depending on wind situation in Germany
NL NO NRL Both countries NO NL 700 NL
NO DK_W 950 Both countries DK_W NO 950 Both
countries
NO SE 2200 Both countries SE NO 2300 Both
countries
SE FI 2050 Both countries FI SE 1650 Both
countries

Roadmap towards a Competitive European Energy Market World Energy Council 2010
18
Table 2 (cont.)
From To MW Provided Comments From To MW Provided Comments
FI RU 0 Both countries RU FI 1300 Both
countries
FI EE 350 Both countries EE FI 350 Both
countries
EE RU 1000 Both countries RU EE 1000 Both
countries
LV EE 750 Both countries EE LV 750 Both
countries
LV RU 600 Both countries RU LV 400 Both
countries
LV LT 1300 Both countries LT LV 1500 Both
countries
LT BY 2200 Both countries BY LT 1400 Both
countries
LT RU 680 Both countries RU LT 680 Both
countries
SE PL 600 Both countries SE PL SE 100 PL
PL CZ 1750 CZ CZ PL 800 CZ PL SK 500 SK SK PL 500 SK SK UA 400 SK UA SK 400 SK
CZ SK 1200 SK CZ provided 2000 MW
SK CZ 1000 Both countries
SK HU 1200 SK HU provided 1500 MW
HU SK 400 SK SK provided 600 MW
HU UA 300 HU UA HU 800 HU
RO HU 800 RO HU RO 600 Both countries
HU provided 900 MW
RO UA 400 RO UA RO 400 RO
HU RS 600 Both countries RS HU 600 Both
countries
RS HR 420 Both countries HR RS 430 Both
countries
AT HU 500 AT HU provided 700 MW
HU AT 350 AT HU provided 600 MW
RO RS 450 RS RO provided 650 MW
RS RO 500 Both countries
RO BG 750 Both countries BG RO 750 Both
countries
GR BG 300 GR BG provided 500 MW
BG GR 500 GR BG provided 600 MW
GR MK 300 Both countries MK GR 70 Both
countries
GR AL 300 Both countries AL GR 30 Both
countries
RS AL 250 Both countries AL RS 250 Both
countries
ME AL 200 Both countries AL ME 100 Both
countries
BA ME 400 Both countries ME BA 480 Both
countries
RS BA 350 Both countries BA RS 430 Both
countries
HR BA 630 Both countries BA HR 600 Both
countries

Roadmap towards a Competitive European Energy Market World Energy Council 2010
19
Customers
Table 3 shows the switch rates in the different sectors (large industry, medium-sized industry, small industry, and households). From this table it is clear that large industry greatly benefits from liberalised electricity markets. Smaller companies are usually less energy intensive and are therefore less affected by the electricity prices. The discrepancy between small and large countries can also be attributed to the fact that the small and medium-sized companies still have to educate themselves more about the opportunities of the market.
Households are less active when it comes to switching to a new supplier. When households do switch suppliers, it is often because these households want a special energy mix, for example, 100% renewables.
In general, personal preferences, and not price, are the driving factors behind household decisions to switch electricity suppliers. Experience also shows that there is often a lag between the time new suppliers become available and the time households actually make a switch. Households will switch suppliers for economic reasons, but this usually only happens when the new electricity bill is dramatically cheaper than the current one. This presents yet another challenge to European liberalisation. In some EU member states, a household’s total electricity bill will be determined primarily by grid tariffs and taxes. Therefore, if a company wants to gain a substantial economic advantage over its competitors, that advantage will be difficult to achieve on a purely economic basis.
Consequently, services of a utility play a major role or also other reasons, e.g. security of supply. For households, the relative share of taxes in the overall electricity price is higher than it is for industrial users, thus the competitive share of the customer prices is less important for household customers than it is for industry.
Regulators
As noted earlier, regulators have a strong national focus. If liberalisation is to be successful, regulators will need to work closely together to transition national regulatory frameworks to a common European one. The electricity sector is characterised by long-term investments. Therefore, creating a stable and predictable framework is a top priority.
The European Regulators Group for Electricity and Gas (ERGEG) was established in 2003 by the European Commission as an advisory group on internal market issues in Europe. It can be seen as a foundation for harmonised rules in Europe. As a result of the Third Energy Package, the Agency for the Cooperation of European Regulators (ACER) will become operational in January 2011.
Common Misperceptions about Competition Unfortunately, much of the public debate over European electricity liberalisation is based on misinformation and misconstrued facts. This section will dispel some of the most common myths.
Table 2 (cont.)
From To MW Provided Comments From To MW Provided Comments
RS BA 350 Both countries BA RS 430 Both
countries
HR BA 630 Both countries BA HR 600 Both
countries
HU HR 1000 Both countries HR HU 400 Both
countries
SI HR 900 Both countries HR SI 900 Both
countries
AT CZ CZ CZ AT provided 900 MW
CZ AT 700 AT CZ provided 1900 MW

Roadmap towards a Competitive European Energy Market World Energy Council 2010
20
Often, a strong correlation is drawn between an enterprise’s high operative earnings and low competition. However, this is not necessarily the case. An enterprise’s operative earnings depend on many factors including the development of innovation and the pace of investment. Moreover, even in markets with low competition, companies working in highly regulated and risk-free markets can endanger the existence of their company.
Another misconception is that markets with a limited number of players experience minimal competition. As the European mobile phone market indicates, this is not the case. This industry is a more or less structured as an oligopoly with only four or five dominant companies. Nonetheless, customers benefit from a high degree of competition. Similarly, a variety of small boutiques offering their services is not a guarantee of fair market prices, especially when the diversity leads to a difficult comparison of the prices, as might be the case with real estate agents.
Yet another market misconception is that a high switch rate is considered as proof of high competition. If this were the case, then the market for gasoline would be almost perfect, since there are few drivers who are loyal to just one brand. The beer market, by contrast, would be rather imperfect, since most people do prefer a certain brand. Similarly, retail banking shows an extremely low switch rate, again leading to the question of how to measure market integration and competition. Of course, none of these comparisons are serious or perfect analogies, but in a way, that is exactly the point. We must think carefully about how to define competition and how to measure it. The popular myths will not really help in finding the right answers.
Table 3 Switch rates in the different sectors in the electricity market. Usually, large, industrial companies show a much higher tendency to switch the supplier because their economic interest is much more pronounced. Source: Regulators data.

Roadmap towards a Competitive European Energy Market World Energy Council 2010
21
Figures 9 (top) and 10 (bottom) Figure 9: Evolution of prices and share of taxes (excl. VAT) for industrial users (24GWH, 1995-2006) Figure 10: Evolution of prices and share of taxes (incl. VAT) for households (3,500 kWH, 1995-2006) Source: EURELECTRIC 2007

Roadmap towards a Competitive European Energy Market World Energy Council 2010
22
Prerequisites for Competition Competition needs a reliable framework that stimulates market forces to do their work. For this, there are several necessary prerequisites.
Legal Prerequisites
To encourage competition in the electricity market, a few legal prerequisites should be in place. Following ERGEG, it is clear that the way to a single European market is via regional markets. Ideally, these regional markets should all have the same legislation to ensure a level playing field. As long as there are differences in national legislation and regulation, the regional market will be somewhat distorted. To get rid of these possible distortions, legislation and regulation has to be harmonised across Europe. Some characteristics of good regulation include:
Clarity The regulator must clearly establish long-term targets;
The responsibilities of regulatory authorities must be clearly defined in legislation;
Regulatory requirements must be easily understandable;
Stakeholders’ rights, obligations, and penalties must also be clearly established.
Neutrality The varying interests of different stakeholders must be balanced against each other. The temptation to focus on short-term targets rather than the long-term sustainable welfare of both industry and consumers must be avoided.
Transparency Legislation must guarantee an open and accessible regulatory process. All stakeholders should be informed of regulatory proposals and invited to make their own submissions. These submissions along with the final decision and the justification of that decision should be clearly communicated to all affected stakeholders;
All relevant documentation must be publicly available in both the country’s native language and English;
Regulatory objectives and procedures must be clear and enduring. They should provide certainty over the long-term;
Predictable and consistent regulatory requirements will ensure that the level of regulatory risk is low.
Efficiency Permitting returns that are adequate to give incentives for new investments, hence ensuring security of supply;
Incentives to reduce cost should be provided.

Roadmap towards a Competitive European Energy Market World Energy Council 2010
23
Independent of the investor, generation investments must receive the same treatment under legislation. A level playing field will result in a larger number of generation companies in a region, since it will make it easier for non-incumbents to enter the region. The concentration will effectively be reduced on both a national and regional level. Some existing legislation could favour incumbent companies, thus making it very difficult to reduce market concentration. The non-discriminatory third party access (TPA) is also fundamental for generation investments, which should be realisable without administrative hurdles.
To achieve a level playing field in a regional market, it is also necessary to have harmonised rules for the transmission system operators (TSOs). Like generation investments by non-incumbents, this will lead to a reduction of market concentration but with one striking difference: Whereas generation investments need roughly one investment cycle to become effective, the TSO-harmonisation will be effective immediately. Provided sufficient grid capabilities are available, taking together the incumbents of their former monopolistic region to one region will reduce the concentration in the region immediately provided sufficient grid capacities are available. If the grid capacities are not sufficient to transport the electricity in the region without bottlenecks, the TSO-harmonisation will help provide the right incentives for the needed grid investments.
Economic Prerequisites
Having enough independent players on the market is the main economic prerequisite of liberalised
markets. This can be easily achieved through integrating national markets into regional ones. The regional energy market will automatically have an increased number of independent players, thus increasing the competition and reducing concentration.
Educational Prerequisites
Liberalised markets mean more freedoms for the customer, such as the right to choose a provider. However, the customer can only appreciate this market offer if the customer is educated about the options. In other words, the customer has the obligation to learn since it is now his responsibility to decide which electricity supplier is the optimal choice.
The bigger a customer’s electricity bill, the more likely that customer is to spend time educating himself about the different options of the electricity markets.
They have an enormous economic pressure and their competitors can reach a substantial competitive advantage by better energy procurement. The best example of this is primary aluminium production. Because the aluminium market is international, European companies are participants in a global competition. Sometimes markets have very attractive prices for special customers thanks to low production costs or a customer’s political influence. Competition in the electricity market may result in a fair price for the region, but that does not necessarily mean matching the cheapest price available globally. Interestingly enough, the metal sector also creates

Roadmap towards a Competitive European Energy Market World Energy Council 2010
24
global link between electricity markets. This competitive pressure, however, will not work on the short-time scale of the spot market, but only with the mid- and long-term markets, where investment decisions take place. In the medium- and long-run, aluminium smelters will go to the regions with the most attractive electricity prices, and demand will drop in the original sites.
Naturally, customers who are less affected by their electricity bill will spend considerably less time to research the cheapest electricity supplier. This, however, is not necessarily a sign of missing competition. Rather, it is mainly due to complacency caused by limited exposure to electricity prices.
Political Prerequisites
In addition to the already mentioned prerequisites, a strong political will to accept competition and its results is necessary. Naively, many think that liberalisation will automatically drive down prices, but it is important to remember that liberalised markets aim to achieve fair prices – fair for both the producer and the consumer.
When a region has an ageing power plant portfolio, the market prices should reflect the needed development and show higher market price for electricity. In a perfect market, this will set incentives for investments in new power plants. Similarly, a recession or an energy efficiency measurement can lead to an over-supply of electricity within a certain region, resulting in disinvestments. In accordance with the desires of the general public, politicians might have a
preference for low market prices. Because of this, the political will for liberalisation tends to weaken when prices rise, and politicians often attempt to re-regulate in an effort to offset increasing prices.
Generally, liberalised markets also tend to shift responsibility from politicians to market participants. Politics should ideally define the framework in which the market participants will work. Since the energy markets are increasingly international, their framework can no longer be defined nationally. This means it is necessary to have a balanced distribution of responsibilities between political players. Following the principle of subsidiarity, responsibility should be assigned to the lowest possible level where the problems can be solved. International electricity trading and exchange is certainly beyond the scope of national politics. At the very least, a regional framework has to be established and defined.
Lastly, the idea of a liberalised market should be valid for all sorts of generation. Certain types of electricity generation are currently not under competition and actually benefit from financial subsidies such as feed-in tariffs. Promotion schemes might be a good idea to help introduce a new technology into a market, but all of these technologies must sooner or later prove that they are economical in their own right.

Roadmap towards a Competitive European Energy Market World Energy Council 2010
25
Introducing a promotion scheme only makes sense in combination with a roadmap for integrating the first subsidised technologies into the competitive market system.1
Deficits in the Current European System In the current European system, the main obstacle is a predominantly national view among regulators and grid operators that is difficult to bring in line with a European or even regional market. Because of this, needed investments in grid infrastructure are delayed or do not take place. Consequently, investments in power plants are also made with caution. If a harmonised framework existed, investments in the grid infrastructure in one area would be done following the same rules as the neighbouring area. As a result, bottlenecks would be reduced, and there would be more security for investments in generation assets. With substantial new investments, the power plant fleet in Europe could be dramatically improved. Competition would ensure that the older, inefficient, and high-cost plants would vanish.
Unfortunately, today’s politicians and regulators see the private household as the key to increasing competition. Private customers do stand to benefit from liberalisation, but they will benefit from this liberalisation much more if there is also a substantial increase of competition within the European generation sector.
1 Alternatively a roadmap how to re-regulate the market is needed, in case the European governments are convinced that electricity should be a regulated business.

Roadmap towards a Competitive European Energy Market World Energy Council 2010
26
Introduction and an Overview of Europe’s Current Electricity Demand The European Commission’s 2004 Strategy Paper2 devoted a significant amount of attention to the role of the regional markets and to cross-border market development. It recognised the importance of ongoing development in the countries where cross-border interconnections and commercial relations were already reasonably strong and could be further enhanced by settling certain practical issues.
In the Strategy Paper, the European Commission highlighted eight potential regional electricity markets:
Nordic Market – Denmark, Norway, Sweden, and Finland
Great Britain and Ireland
West Market – France, Germany, Austria, Switzerland, and Benelux
Iberian Market – Portugal and Spain
Italian Market
North East Market – Poland, Czech Republic, Slovakia, Hungary, and Slovenia
South East Market – the Balkan countries
2http://ec.europa.eu/energy/electricity/florence/doc/florence_10/strategy_paper/strategy_paper_march_2004.pdf
Baltic Market – Lithuania, Latvia, and Estonia.
The European Parliament adopted the Electricity Directive and Regulation on cross-border exchanges on June 16, 2003. Among the measures required by this directive are full market opening, legal unbundling, and the introduction of sector specific regulation in all Member States in order to ensure non-discriminatory access to networks. These measures will contribute significantly to competition in Europe, and this paper starts from the assumption that Member States will rapidly and comprehensively implement the measures based on their common objective of having a more competitive market. National regulators in particular will play a vital role in setting up and enforcing most of the aspects of the market design that are discussed in this paper. A key part of this will be removing inappropriate technical and financial impediments. Similarly, legally and functionally independent system operators will, by providing non-discriminatory access to networks, be responsible for the day-to-day functioning of the liberalised electricity system. In many cases, independent power exchanges that provide transparent, non-discriminatory access to energy markets and free transactions may be responsible for the day to day functioning of the electricity related markets.
Meanwhile, the regulations for cross-border electricity exchanges will include specific binding guidelines for these transactions. This will allow the development of harmonised conditions of access to the European network for those wishing to buy,
Regional and National Electricity Markets: An Overview

Roadmap towards a Competitive European Energy Market World Energy Council 2010
27
sell, or trade electricity. This should lead to coherent, cost-reflective charges for the use of European transmission networks, the removal of other distortions of cross-border trade, and the operation of the transmission system, in particular congestion management, so as to promote fair competition and economic efficiency.
Technical and theoretical descriptions of the electricity market behaviour are provided in the Annexes 1 and 2 respectively.
In spring 2006, the ERGEG launched the Electricity Regional Initiative (ERI) to speed up the integration of Europe's national electricity markets. The ERI created eight regional electricity markets in Europe, as an intermediary step on the way towards creating a single EU electricity market. The markets created by the ERI include:
Northern (Denmark, Finland, Germany, Norway, Poland, Sweden)
Central-West (Belgium, France, Germany, Luxembourg, Netherlands)
Central-East (Austria, Czech Republic, Germany, Hungary, Poland, Slovakia, Slovenia)
Central-South (Austria, France, Germany, Greece, Italy, Slovenia)
South-West (France, Portugal, Spain)
Baltic (Estonia, Latvia, Lithuania)
France-UK-Ireland (France, Ireland, United Kingdom)
The SEE region (created on June 27, 2008 by an Energy Community Ministerial Council decision. This region includes Bulgaria, Bosnia and Herzegovina, Croatia, Macedonia, Greece, Montenegro, Romania, and Serbia.)
The Regional Initiatives are a project of the energy regulators to speed up the integration of Europe's national energy markets. Launched with the support of the European Commission in spring 2006, the Regional Initiatives create seven electricity and three gas regional markets as a precursor to a single-EU energy market.
The fallout from the 2008 financial crisis continued to affect the energy consumption of the EU Member States throughout the first quarter of 2009. In January and February 2009, colder than normal weather conditions together with the repercussions from the gas conflict between Russia and the Ukraine significantly increased household electricity consumption, especially in the eastern part of the EU. However, as industrial demand receded, total electricity consumption in the first quarter of 2009 actually fell below 2008 levels.
The significant price reduction in the main input fuels used by the marginal producers of electricity combined with a decreasing industrial demand in the majority of the Member States also helped push wholesale electricity prices down across Europe during the first quarter of 2009.

Roadmap towards a Competitive European Energy Market World Energy Council 2010
28
The average monthly value of the Platts Pan European Price Index (PEP) remained stable in January 2009, mainly due to the cold weather conditions in Europe.
However, in February and March 2009 the PEP index fell abruptly, recording a 36% drop in the first quarter of 2009 alone. Compared to its highest volume in September 2008, the Platts index lost more than half of its monthly average value (-58%).
Trading activity on the European electricity exchanges remained relatively stable. Year-on-year, the volume traded in January, February, and March 2009 were respectively 5.7%, 9.9%, and 7.9%, which were less than the volumes of the corresponding months in 2008. The cumulative day-ahead volume for the selected countries stayed above 83 TWh per month between January
and March 2009, suggesting that the lost volumes were roughly equivalent to the drop in industrial demand.
There was no evidence of mass retreat of capital on the exchanges similar to the flight-to-safety behaviour observed in some of the financial markets. It seems that participants continued to rely on and use the electricity trading platforms throughout the bear market period.
Regional European Energy Markets This section looks at the main characteristics of various European wholesale markets. The section starts from the regional map developed in the Commission’s Strategy Paper [1] and some
Figure 11 The Pan European Price Index by Platts demand-weighted day-ahead base load indices indicating price trends for Europe’s free electricity markets as a whole. Europe is moving towards a continental market model, and while transmission constraints mean the reality may be some way off, these indices meet the demand for representative, Europe-wide indices. Source: Platts (price index) and selected European electricity wholesale markets (volumes)

Roadmap towards a Competitive European Energy Market World Energy Council 2010
29
ERGEG, ECRB, EURELECTRIC and UCTE reports [2], [3], [4].
Nordic market
The Nordic Market, composed of Finland, Sweden, Norway, and Denmark, is an advanced market. The market is characterised by a versatile generation mix and by Nordpool, a regional power exchange with a dominant role.
Nordpool offers a physical day-ahead market based on day-ahead auctioning for hourly delivery over the 24 hours of the following day, as well as a continuous hour-ahead Elbas market. As of March 4, 2009, Elbas covers Finland, Sweden, Western Denmark, Eastern Denmark, Norway, and Germany. The supply and demand bids in the day-ahead market form the system price from the supply and demand curve for every hour.
Using the day-ahead price as the reference price, Nordpool also offers cleared forwards, futures, and options contracts and cleared contracts for price area differentials.
The Nordic market has more than 350 generation companies. The three largest generators in the region have a combined market share of about 40%.
Norway In 2007, the total electricity generation in Norway was 137.7 TWh. 0.9 TWh of that came from wind power, and the rest was sourced by hydropower. This represents a production growth of 13% compared to 2006. Wind power alone rose by 34%. Norway’s 2007 net exports were 10 TWh as compared to net import of 0.9 TWh in 2006. The improved figures are a result of heavy rains and high reservoir levels. Total net consumption of electricity in Norway in 2007 was 110.8 TWh, about 3 TWh more than the year before.
Denmark In 2007 electricity consumption in Denmark, including losses in the transmission grid, was 37.0 TWh, equal to the country’s 2006 consumption. However, Denmark’s overall electricity production in 2007 amounted to 37.0 TWh, 15% less than in 2006. This was caused by an increase of
Figure 12 The monthly electricity consumption in TWh for the EU-27. Source: Eurostat database

Roadmap towards a Competitive European Energy Market World Energy Council 2010
30
hydropower production in the Nordic area combined with higher fuel and CO2 prices.
Finland The power demand in Finland increased by 0.4% in 2007 to 90.4 TWh. The Finnish power generation in 2007 was 77.8 TWh, and net imports were 12.7 TWh. Combined heat and power (CHP) covered 34% of the generation, while nuclear power covered 29%, conventional condensing power was 19%, and hydropower was 18%. The share of wind power was 0.2%.
Sweden Sweden’s electricity production is dominated by hydro and nuclear power. The installed capacity of wind power has increased over the last year but is still only about 1% of the total amount of electric energy produced. In 2007, Sweden’s total electricity generation was 145.0 TWh, compared to 140.3 TWh in 2006. 2007 was a wet year resulting in higher hydropower generation (65.5 TWh in 2007 compared to 61.1 in 2006). Sweden’s nuclear power generation was lower 2007 than it had been in 2006 (64.3 TWh compared to 65.0 TWh). One reason for this was rather large refurbishments and upgrading of the capacity in several nuclear plants. 13.8 TWh of electricity was generated by other thermal power plants (fossil and bio fuels), an increase of 0.6TWh from 2006.
Sweden’s consumption was roughly even between 2006 and 2007, hovering at around 146.3 TWh. Sweden’s net imports were 1.3 TWh in 2007 compared to 6.1 TWh in 2006. This decrease was the result of net power exports from Sweden to neighbouring countries of 17.2 TWh and net imports of 18.5 TWh.
Great Britain and Ireland
Currently, Great Britain and Ireland are separate markets, although there is an interconnector between Scotland and Northern Ireland. Additional proposals to construct an interconnector between the Republic of Ireland and Wales are on the table, as are some other routes. Meanwhile, the European Electricity Mini Forum for the Republic of Ireland, France, and the UK has recommended improved co-ordination between these countries.
Great Britain The Office of Gas and Electricity Markets (Ofgem) supports the Gas and Electricity Markets Authority (the Authority), the regulator of the gas and electricity markets in Great Britain. The British wholesale market is based on bilateral trading between generators, suppliers, traders, and customers across a series of markets.
Figure 13 Market shares of the five biggest electricity companies in the Nordic Market (as of 2004). Source: European Commission
20%
14%
9%
8%6%
43%Vattenfall
Fortum
Statkraft
E.ON
Elsam
Others

Roadmap towards a Competitive European Energy Market World Energy Council 2010
31
Important characteristics of the British wholesale electricity market include a relatively high number of different players and the strong role of liquid bilateral markets. Power exchanges account for a relatively small share of electricity trading, and the majority of the trading takes place bilaterally in the OTC markets through power brokers.
The total installed capacity of the British system at the beginning of 2007/08 was 78.4 GW (of this coal was 36%, CCGT was 32%, nuclear was 14%, renewables was 7%, oil and OCGT were 5%, pumped storage was 3%, and interconnector was 3%).
Seven companies had market shares exceeding 5% and, of these, the three largest companies held 39% of the installed capacity (British Energy 15%, RWE 12%, EON 12%, SSE 12%, ScottishPower 7%, EDF 6%, International Power 6%, Centrica 6%, Drax 5%, and other 19%).
Total traded volume on the UKPX for the 2007/8 was 17.1 TWh for all packages, where the total traded volume comprises half hour and four hour (EFA) block trades – this is around 2TWh higher than 2006/7.
Britain typically imports electricity from France and exports to Northern Ireland. Total imports into Britain were 8,927 TWh and 21 GWh respectively, whilst exports were 2,025 GWh and 1,423 GWh respectively.
The British electricity system is connected with France and Northern Ireland via the Interconnexion France Angleterre (IFA), a 2,000MW HVDC
interconnector. It is jointly owned by National Grid Interconnector Limited (NGIL) and (RTE) and Moyle, a 500MW interconnector between Scotland and Northern Ireland and owned by Moyle Interconnector Ltd.. Moyle is capable of exporting at 500 MW to Northern Ireland and importing at 80 MW. The existence of these interconnectors and the current proposals for new interconnectors suggests that new interconnection capacity will be provided to the market when it is economical to do so. BritNed, 1,000 MW interconnector jointly owned by NGIL and TenneT, is currently under construction between Britain and the Netherlands.
The British Electricity Trading and Transmission Arrangements (BETTA) became effective on April 1, 2005. Proposed by Ofgem and the Department of Trade and Industry and bringing together England, Wales, and Scotland, BETTA created a competitive British wholesale electricity market for the first time.
Republic of Ireland and Northern Ireland Thanks to the establishment of the historic Single Electricity Market (SEM) for Ireland and Northern Ireland, 2007 was a defining moment for the Irish Energy Sector. During 2007 CER and NIAUR completed the first phase of the project as set out in the Development Framework Document, namely the establishment of an all-island wholesale electricity market. The SEM consists of a gross pool market, into which all electricity generated or imported onto the island of Ireland must be sold and from which all wholesale electricity for consumption or export from the island of Ireland must be purchased. The SEM has been fully operational since November 1, 2007, and it

Roadmap towards a Competitive European Energy Market World Energy Council 2010
32
replaces the previous bilateral contracts market. The SEM is widely seen as the first major step towards All-Island Energy Markets.
At end of 2007, All Island Market share by installed capacity in the SEM was ESB Power Generation - 45%; NIE PPB - 16%; Hunts town - 8%; Synergen - 4%; Tynagh - 4%; Wind -12%; Coolkeeragh - 4%; Aughinish - 2%; Moyle - 5%.
The North-South interconnector between Northern Ireland and the Republic of Ireland currently has a net transfer capacity (NTC) of 330 MW in a north-south direction. It became an integral part of an all island transmission system with the commencement of the SEM in 2007.
Western European Market
According to the European Commission’s Strategy Paper, the West European Market consists of Germany, France, Belgium, the Netherlands, Luxembourg, Switzerland, and Austria. Some of these countries also provide a bridging function to the new Member States situated on their Eastern borders. Such overlaps between different markets will emerge as markets develop further and become more integrated. As liberalisation advances, market-based solutions will become common.
The market structures in the different countries of this region vary considerably. In some of the countries, the generation structure is diversified, but in other markets only a small number of companies are operating. The overall structure in the region can be seen from the graph below.
The Western European market consists of seven different countries, including Switzerland, even though Switzerland is not a member of the European Union and generally falls outside of the EU’s regulatory frameworks. In Germany, France, the Netherlands, and Austria, power exchanges have been established, all of them with a day-ahead markets and some with a futures market. Belgium, meanwhile, is currently in the process of building up an electricity exchange. In all of these countries, wholesale trading has been evolving.
Despite the lack of politically-driven market integration, a Western European market is clearly emerging through the activities of the market actors and the TSOs themselves.
Figure 14 Market shares of the five biggest electricity companies in the Western European market: FR, DE, BENELUX, AT (as of 2004). Source: European Commission

Roadmap towards a Competitive European Energy Market World Energy Council 2010
33
Upon closer inspection, the following two wholesale regions can be observed already if one compares wholesale prices in the national markets:
Austria, France, Germany, Luxembourg, and Switzerland
Belgium and Netherlands
There is very seldom congestion on the cross-border lines between Austria, France, Germany, Luxembourg, and Switzerland. As a result, the day-ahead and forward prices of these five national wholesale markets are converging. During the last years the spread of the forward prices between France and Germany has been continuously decreasing (see graph above). The same development can be observed for the day-ahead prices. In fact, the prices on the German, French, and Austrian power exchanges are developing almost in parallel, and the end prices are very close to each other.
Germany In Germany, wholesale electricity trading takes place both on the bilateral/OTC market and the power exchange. In 2002, the two existing power exchanges of the time merged to form the European Energy Exchange EEX AG in Leipzig. Since then, there has been a further merger of EEX and France’s PowerNext.
There is a relatively high number of players who are active in the German wholesale market, and a significant number of these actors actually come from outside Germany. As of August 2009, there
were 237 participants from 22 countries active on the EEX. More than 50% of those participants are from outside Germany. As is the case with most other electricity wholesale markets, the majority of deals in Germany are still done on an OTC basis. However, volumes on the EEX have been increasing constantly over the last few years.
EEX operates a day-ahead market with hourly products (anonymous, bilateral auction) and block products (continuous trading). It also operates a futures market where contracts can be traded for delivery up to six years in advance.
The prices formed on the exchange benefit from high credibility and are backed by the large number of market participants and the transparency of the market prices. The EEX prices are the benchmark for the entire market, including OTC wholesale and retail business. In 2007 the day-ahead spot market prices at the EEX showed a decrease of approximately a quarter of the annual mean averages of the Phelix-Day-Base and the Phelix-Day-Peak compared to 2006. At the same time the spot market day-ahead trading volume increased by approximately a third, which resulted in cost-reducing effects for the procurement of electricity on the day-ahead spot market in 2007 compared to 2006.
The four largest German generators comprise approximately 70% of the country’s net electricity generation. During the 2007 reporting period, the market share of the three largest suppliers increased slightly to 46.1% of the total net electricity consumption from the "public supply" network.

Roadmap towards a Competitive European Energy Market World Energy Council 2010
34
France Electricity generation in France shows the characteristics of a generation park strongly dominated by nuclear generation. In general, France exports electricity to neighbouring countries. Most of the trading participants on the OTC and exchange market are also active in the wholesale markets of the neighbouring countries. According to the RTE, internal consumption in 2007, including losses in the distribution and transmission networks, amounted to 480.3 TWh, an increase of 0.4% over 2006. Again according to the RTE, generating capacity in France was 115,900 MW in 2007 compared to 115,500 MW in 2006. EDF is responsible for 83% of France’s generating capacity and 88% of the country’s produced energy. It was the only company to exceed the threshold of 5% of available installed generating capacity. The other two significant generating companies are Electrabel-Suez with 4% of the generating capacity; CNR, SHEM, and its holdings in nuclear power plants with 3% ; SNET (part of the ENDESA Group) with 2% of the generating capacity and 1.5% of energy production at national level. These three generating companies account for 93% of France’s total generating capacity. PowerNext, the French power exchange, started with a day-ahead market in 2002. In June 2004, it also launched a futures market. In 2007, electricity volumes marketed on PowerNext were as follows: volumes traded day-ahead (hourly products or blocks quoted a day-ahead) increased by 49% in the year, rising from 29.6 TWh in 2006 to 44.2 TWh in 2007, and forward-traded volumes remained lower until September 2007 when activity increased
sharply. However, taking 2007 as a whole, activity was generally slightly down on the previous year: 79.4 TWh was traded on PowerNext Futures in 2007 compared with 83.1 TWh in 2006. In 2007, deliveries from OTC transactions remained relatively stable. Their total volume amounted to 262 TWh, an increase of 2.2% over 2006. Day-ahead prices from PowerNext are developing similarly to the German day-ahead prices on the EEX. The movement of PowerNext’s day-ahead market prices is very similar to the movements of the expected loads of the grid. These loads are published by RTE, the French TSO. The Belgian, Dutch, and French electricity markets are already coupled, causing prices in the three organised markets to converge, as illustrated by PowerNext and Belpex prices, which were the same throughout 90% of the year. The prices on the three organised markets were the same for approximately two thirds of the year. By contrast, in 2006, the APX and PowerNext prices were aligned only 10% of the time.

Roadmap towards a Competitive European Energy Market World Energy Council 2010
35
Austria Two separate authorities are responsible for the regulation of the Austrian electricity and gas markets. Fortunately, these entities cooperate well. However, some key regulatory activities, such as monitoring of unbundling in the electricity sector, have been transferred to other bodies, making coherent market regulation harder to achieve.
The Austrian electricity balance in 2007 and the changes from 2006 are shown in Table 4. Between 2006 and 2007, foreign trade in electricity increased slightly, while domestic electricity consumption declined marginally. The largest generator covers about 55% of the overall consumption. Provincial and municipal utilities as well as some foreign companies focus their business on distribution and supply. There are also about 125 additional small utilities serving local customers.
Most of the electricity is traded bilaterally, partly through long-term power purchasing agreements. As there is no congestion at the Austrian-German border, EEX and EXAA are competitors on the same regional market.
Market integration is one of Austria’s key strategic objectives. The high level of integration with the German pricing area is important in this respect, but it also restricts liquidity on the Energy Exchange Austria (EXAA). This is currently having a negative impact, as there is little difference between EXAA and EEX prices. If network congestion rose, increased trading volumes on the EXAA would be likely. However, Austria would then be confronted with a far higher degree of market
concentration during congestion periods. Effective oversight of trading on the EXAA is needed, as is Austrian price formation on the EEX.
Due to its 15,500 MW of transmission capacity into neighbouring countries, Austria seems predestined for strong integration of the wholesale market. In fact, Austrian wholesale prices are in line with those in Germany, and as a result of market integration, Austria “imports” a close linkage between electricity prices, and coal and gas quotations (and consequently also CO2 emission allowance electricity prices); it also enjoys very low off-peak prices.
Netherlands Energiekamer, the Dutch office of energy regulation, is committed to making energy markets work as effectively as possible through the implementation of various regulatory instruments. The Dutch wholesale market can be subdivided into various marketplaces on which supply and demand meet. The following marketplaces can be distinguished:
The trade in bilateral contracts, also known as the bilateral market;
The over-the-counter (OTC) market;
The day-ahead market (spot market, APX); and
The balancing market or the market for control and reserve power.
Table 4 Electricity data for Austria in 2007. Source: Austrian regulator
2007 (GWh) Change vs. 2006Gross electricity generation 63,741 - 0.28% Physical imports 22,130 + 4.10% Physical exports 15,511 + 7.66% Consumption by pumped storage power plants (PSP) 2,985 -10.56% Domestic electricity consumption 67,375 -0.08%

Roadmap towards a Competitive European Energy Market World Energy Council 2010
36
The main wholesale market in the Netherlands is the bilateral market, which covers about 80 to 90% of the market. The remainder is traded on the day-ahead market. Imported volumes have to be traded through APX.
There are approximately 25 active electricity producers in the Netherlands. In terms of the size of generating fleets, the Netherlands has seven large and 18 small electricity producers. The large coal- and gas-fired plants and the combined heat-power plants that provide the bulk of production in the Netherlands are owned by a few large producers. In fact, three-quarters of the Dutch generating fleet belongs to four electricity producers. The market share of the six largest generators accounts for approximately 69% of the total generation, compared to approximately 31% aggregate share for distributed generation. Key 2007 figures are presented in Table 5.
APX offers a day-ahead trading platform for the electricity market in the Netherlands. The Dutch market is connected to the Belgian and German markets through various interconnectors. Under normal operations, the maximum transmission capacity on the five cross-border connections is 3650 MW, 3350 MW of which is available to the market. As of January 1, 2001, the allocation of the available cross-border capacity takes place at an auction organised by TenneT in conjunction with the relevant German and Belgian grid managers. The capacity is auctioned in the categories year-ahead, month-ahead, and day-ahead. On November 21, 2006, the Trilateral Market Coupling with Belgium and France occurred. The power exchanges are now connected and take the
available capacity at the borders into consideration. As of May 2008, a 700 MW cable between the Netherlands and Norway became operational. In this situation, price correlation is not a good indicator of the extent of market integration. Price differences will exist when there are active restrictions on transmission capacity. It is therefore more important to consider the efficient use of interconnectors.
In 2009, some major changes occurred in the Dutch generation market. This was driven by Vattenfall’s acquisition of Nuon and RWE’s acquisition of Essent. These steps will help internationalize the structure of the Dutch generation market. It is also a step towards further integrating the Northwest European electricity market.
Belgium In Belgium, the federal government and individual regions share authority over the electricity and natural gas markets. The CREG is the federal regulator for Belgium.
The day-ahead markets of Belgium (Belpex), the Netherlands (APX), and France (PowerNext) were successfully matched in 2007. The three markets seldom operate in isolation from one another. Belpex and PowerNext had the same prices listed 88% of the time, and Belpex and APX had the same prices 73% of the time. In 2007, the prices on the three markets were usually fairly close to one another and relatively low: the average annual price was 41€/MWh.
Table 5 Electricity data for the Netherlands in 2007. Source: Dutch regulator
Total consumption 112.398 TWh Generation capacity 20,8 GW Net generation volume 99.349 TWh Import capacity 3, 65 GW Net import volume 17.609 TWh

Roadmap towards a Competitive European Energy Market World Energy Council 2010
37
The improved integration of the markets, following the coupling of the Belgian, French, and Dutch markets, did not result in an increase of net imports for Belgium. In fact, net physical imports of electricity amounted to approximately 6.6 TWh in 2007, a fall of around 3.4 TWh compared to 2006. This brought the net physical imports back in line with 2005 levels (6.2 TWh). Gross physical imports in 2007 amounted to approximately 15.7 TWh, compared with 18.7 TWh in 2007. Gross physical exports in 2007 were 9.0 TWh, compared with 8.6 TWh in 2006.
In 2007, the total volume traded on the Belgian electricity exchange was 7.6 TWh, which accounted for nearly 8.5% of total Belgian electricity consumption. During the year under review, the total volume purchased on Belpex amounted to 6.8 TWh; the volume sold to 4.9 TWh. This difference between the volume purchased and the volume sold is precisely due to the market coupling and Belgian’s imports and exports with France and the Netherlands.
Belgium took several steps towards strengthening the electricity transmission grid in 2007. For example, in January, it was decided to strengthen the Belgian-French interconnection by converting the Chooz (F) Monceau line to 220 kV across its entire length and to install a phase-shift transformer at the Monceau substation. Elia also brought two 150 kV connections on line (21 km between Monceau and Thy-le-Château, and 0.5 km between Keerken-Lokeren Vijgenstraat) and strengthened a 150 kV connection (5 km between Trivière and Ville-sur- Haine).
In February 2007, the five regulators of the Central-West European region published their action plan for the 2007-2009 period, focusing on the acceleration of the regional integration of electricity markets. This plan also elaborates a regional investment plan for the transmission grid.
Belgium’s total installed generation capacity amounted to 16,363 MW in 2007, compared with 16,150 MW in 2006. Looking forward, the generation unit plans for the period from 2008-2012, 990 MW are under construction; 2,509 MW are authorised; and 1,821 MW are planned. In September 2007, the CREG took the initiative to make a study on the insufficient electricity generating capacity of Belgium.
Also in 2007, the electric power generated by nuclear facilities represented approximately 55% of all the electric power generated by the generation units connected to the ELIA grid. Natural gas contributed 31%. In terms of capacity, nuclear power generation and the CCGTs and gas turbines represented nearly 37% resp. of the total installed capacity of power stations connected to the ELIA grid.
Switzerland Swiss gross power production amounts to roughly 67 TWh. Approximately 40% comes from nuclear generation and 55% from hydro generation. Switzerland’s hydro power is produced in run-of-river-plants and also in storage- and pump-storage-plants. Other renewable sources and thermal plants are of minor importance. Additionally, Switzerland imports 50TWh and exports about the
Table 6 Electricity data for Switzerland in 2007 and 2008. Source: ATEL
2007 2008 Change % Net production (TWh) 63.8 64.3 +0.7 Hydro production (TWh) 36.4 37.6 +3.3 Nuclear production (TWh) 26.3 26.1 -0.8 Import-export-balance (TWh) -2.0 -1.1 -45.0 Total demand (TWh) 61.8 63.2 +2.3 Final demand per capita (kWh) 7'646 7'538 -1.4 Average Spot price (Euro/MWh) 74.38 45.99 -38.2

Roadmap towards a Competitive European Energy Market World Energy Council 2010
38
same amount. This ensures Switzerland’s role as a major power-transit-country in Europe’s power-grid.
Three dominant producers own large stakes in the above mentioned production capacity. Other utilities might also have some production capacity, but they are more focused on distribution. In total, there are actually around 800 utilities in Switzerland, most of which are very small.
Households, industry, and the tertiary sector each make up approximately one third or 63 TWh of Switzerland’s overall demand for power.
Retail power prices within Switzerland are influenced by production costs of Swiss power plants, long-term contracts between market participants, and market prices in Europe. Cross-border trading with Germany, France, Austria, and Italy is pushing Swiss electricity prices more in line with those of other countries. The German power exchange EEX also fixes prices for Switzerland.
The main characteristics of Switzerland’s power market are shown in Table 6.
Iberian market
MIBEL, a unique wholesale market for Spain and Portugal, came into being on July 1, 2007. The legal framework for this organisation is based on the “Agreement between the Portuguese Republic
and the Kingdom of Spain relative to the constitution of an Iberian Electrical Energy Market” (the MIBEL Agreement). Signed by the respective governments on October 1, 2004, the MIBEL Agreement established the general principles for the organisation and management of MIBEL and, in particular, the framework for the organisation of the spot market and the derivatives market (OMIP). This spot market is run by the Operador del Mercado Iberico de Energía – Polo Español (OMEL). When congestion appears at the Spanish-Portuguese interconnection, market splitting goes into effect. When the Iberian Market came into being, it featured a single daily market and a mechanism for the allocation of capacity by implicit auction.
Figure 15 shows market shares in OMEL. Around 27% of OMEL’s electricity was sold in the liberalised market, and the other 73% of the volume was moved through regulated suppliers.
The launch of the MIBEL daily market, which is managed by OMEL, was one of the most important developments in the Portuguese wholesale market in 2007. On June 15, 2007, all power purchase agreements (PPAs) held by the incumbent EDP Group with the power stations were terminated. This led to the implementation of a compensation mechanism for the stranded costs resulting from the loss of the contracts, with only two PPAs with two power plants remaining in force. The operation
Figure 15 Market shares in the Spanish market. Source: OMEL

Roadmap towards a Competitive European Energy Market World Energy Council 2010
39
of these power plants and the placement of the power generated on the market are handled by an enterprise called REN Trading. REN Trading was created as a subsidiary of the parent company (REN SGPS) that owns the transmission grid operator. On July 1, 2007, shortly after the termination of the PPAs, the standard regime electricity generators began making their sales offers in a market context.
Spain Since the opening of the market in January 1998, all eligible customers are allowed to trade on free terms for their energy needs. Wholesale energy transactions can freely take place either through the organised pool or via bilateral transactions.
Spain’s generation equipment is based on highly diversified technologies, including nuclear, coal-fired (both Spanish and imported coal), fuel oil, conventional cycle fuel oil and gas, combined cycle gas and hydraulic (conventional and pumping) plants, and producers under the special regime (wind, photovoltaic, biomass, etc.). With the introduction of liberalisation in the electricity market in 1998, the demand increase in Spain’s electricity system was accompanied by an increase in production under the special regime, the output of which has reached some 56.433 GWh in 2007. This amounts to 20.5% of total gross demand. Combined cycles continue to be the main driver in new generation capacity, amounting now for 24%
of nation’s power mix. The following graph shows the shares by technology of installed power under the ordinary regime in 2007; total values reached 90.722 MW.
Five companies have more than 5% of Spain’s electricity system’s installed power. These companies are Endesa, Iberdrola, Unión Fenosa, Gas Natural, and HidroCantábrico. In 2007, the total demand in power plant bars increased a 2.8% and amounted to 276.344 GWh. This was broken down as follows: hydroelectric 26.381 TWh; nuclear 55.046 TWh; coal 74.946 TWh; fuel and gas (conventional) 10.771 TWh; gas (combined cycle) 72.461 TWh; special regime 56.422 TWh; international exchanges -5.803 TWh; consumption in generation -9.460 TWh; consumption in pumping -4.421 TWh; total demand 276.344 TWh.
The three largest generators in Spain have a market share of 77.73% of all national production (NOTE: this excludes production from renewables).
Distributors in Spain have an obligation to supply customers who have not used the eligibility option and still remain under the regulated tariff option. Distribution companies that provide their retail business within the regulated market will still have to buy their electricity on the exchange under regulated terms.
Figure 16 Shares by technology of installed power under the ordinary regime in 2007. Source: Eurelectric

Roadmap towards a Competitive European Energy Market World Energy Council 2010
40
Bidding into the exchange is mandatory for generators of over 50 MW for the total of their capacity, excluding the portion of power traded through bilateral contracts. Trading on the pool is done on an hourly basis. There is a daily auction the day before and six intra-day markets to adjust the selling or buying positions of the different traders to their updated needs. For the moment, no organised market exists in Spain for bilateral financial or physical contracts. OMEL also performs the settlement for the results of the matching process of the day-ahead and intra-day markets.
A new scheme of “capacity payments” was passed in the second half of 2007. These payments have a dual nature: to be an “investment incentive” for fostering long-term power commissioning and to be a medium-term “availability service.” Investment incentive may vary in connection with system adequacy ratio; availability service is contracted by System Operator as a further product.
Portugal In 2007, the electricity consumed in Portugal was supplied by the following sources: natural gas (21%), net import (15%), fuel oil (2%), coal (23%), large hydroelectric power stations (19%), and Special Regime Generation (SRG) (20%).
After the total opening of the market for all electricity consumers in 2006, 2007 marked a very important step in the liberalisation of the electricity market on the supply side. With the termination of the power purchase agreements on July 1, 2007, all the electricity generated by the standard regime power plants in Portugal was traded in the spot and forward energy markets in the Iberian market. This
measure achieved the implementation of the liberalisation of the electricity market on the supply side and was, at the same time, an important step towards enacting MIBEL.
REN, the electricity TSO in mainland Portugal, is independent of all other activities carried out in the electricity sector, both legally and in terms of assets.
In 2007, Portuguese electricity consumption increased at the same rate it had in 2006, growing by 1.8% (2.4%, after correction for temperature and the number of working days). Hydroelectric energy capability was below average for the 4th year running, registering a hydraulicity index of 0.76. Hydroelectric power plants supplied 19% of electricity for consumption, while thermal power stations covered 46%. Deliveries by special regime generators to the grid continued to grow significantly, feeding as much as 20% of national consumption.
After MIBEL came into force on July 1, 2007, the exchanges with Spain reached their highest levels ever, with the import balance rising 38% and supplying 15% of electricity consumed.
After full liberalisation of the market, regulated tariff consumption accounted for approximately 88% of total consumption compared to 85% in 2006.
In 2007, there were no significant changes in the installed capacity of thermal power stations (apart from 32 MW excluded in the Tunes plant) or hydropower stations. Installed capacity for SRG was 453 MW, corresponding to 63 MW installed by

Roadmap towards a Competitive European Energy Market World Energy Council 2010
41
thermal generators (co-generators), 3 MW by hydro generators, 377 MW by wind generators, and 10 MW by photovoltaic generators. In the National Transmission Network, attention is drawn to the commissioning of the Bodiosa – Paraimo (operated at 220 kV), Batalha - Pego and Sines – Portimão (operated at 150 kV) 400 kV lines, and the Castelo Branco - Ferro and Fanhões – Trajouce 220 kV lines.
The three main players in the liberalised market have a market share as suppliers of about 97%. The EDP group is still the sole owner of the production in the liberalised market; the rest of the electricity needed comes through interconnectors. Market shares will decrease considerably as soon as MIBEL becomes effective.
Italian Market
Wholesale trading in Italy mainly takes place on the day-ahead power exchange (IPEX). The volume on the OTC market is very small. Italy still remains a national wholesale market with several price areas. Another characteristic of the Italian market is higher wholesale prices compared to other markets in Europe. Average zonal sale prices in 2007 varied from 68.47 €/MWh in Northern Italy to 79.51 €/MWh in Sicily. Compared to 2006, prices decreased in line with the annual Average Purchase Price on the Italian Power Exchange (PUN) decrease, ranging from -7% in northern Italy
and Sardinia to around -3% in the other macro-zones. The exception to this was Sicily, where prices increased by 0.7%.
The Italian market has a relatively small number of market participants, and the biggest generator has a market share of about 47%. The market share of Enel decreased through the forced separation of parts of the generation park as mandated by Italian energy law.
OTC trading started only recently in the Italian market. Deals are still rather infrequent.
Italian electricity prices are high compared to other markets in Europe. The reasons for this are the high variable costs of the current generation park, a delay in building new generation capacity to meet increasing demand, and heavy congestion on the interconnectors from adjacent countries.
In 2007 electricity demand rose by 0.7% against the previous year, settling at 340 TWh. Net national production was stable, while the foreign balance registered a growth of 2.9% over 2006, settling at 46 TWh, (13.6% of annual demand). Imports from Switzerland (29 TWh) increased by 21%, while those from Slovenia decreased by more than 2 TWh. Export transits increased significantly during the year, in particular towards Greece even if France still remains the first export country (1.2 TWh).
Figure 17 Market shares in the Italian market. Source: European Commission

Roadmap towards a Competitive European Energy Market World Energy Council 2010
42
Regarding cross-country exchanges, the rules established in 2007 allowed the joint allocation of interconnection capacity on the French, Greek, and Austrian borders and, as of September 1, 2007, also on the Slovenian border. Interconnection capacity on the Swiss border is allocated by each national grid operator, according to its quota. Annual, monthly, and daily explicit auctions are used for capacity allocation on the basis of procedures defined by grid operators.
In 2007, the demand on the day-ahead market, the Mercato del giorno prima (MGP), reached 330 TWh, in line with the previous year. The transactions on the Power Exchange reached 221 TWh, increasing by 12.6% since 2006. Market liquidity accordingly increased to 67% for 2007.
Electricity demand reached 339.9 TWh in 2007, a 0.7% increase on the year and peaked in December when it reached 56.8 GW. National net generation increased by 0.02%, while the foreign balance increased by 2.9% on the year.
The aggregated electricity balance in Italy in 2007 is presented in Table 7.
In 2007 new elements of the national transmission grid started operations, with around 210 km of 380 kV lines and 28.8 km at 150/132 kV. Approximately 12 km of 150 kV lines were taken out of service. Additionally, the VHV/HV transformation power was increased by roughly 1,763 MVA, and devices were installed to regulate reactive power for around 1,308 MVAR. Three new stations were built for the national grid at 150 kV and another new station at
380 kV. One of the main works completed during 2007 was the 380 kV power line.
North East Market
The European Commission’s Strategy Paper includes Poland, the Czech Republic, the Slovak Republic, Hungary, and Slovenia in the North East Market.
As can be seen in the picture below, there is no common pattern to this market’s generation structure. The market structure differs considerably from country to country. For example, Poland has a rather fragmented generation structure, however still mainly state owned, but the structures in the Czech Republic and Hungary are much more centralised.
The electricity markets in these Eastern European countries are still in development. Although the liberalisation of these markets is not as advanced as it is in the markets of most of the EU-15, considerable progress has been made, and there are ongoing efforts to develop even more competitive markets. That said, interconnected capacity and regulatory barriers still exist, necessitating the description of the national markets in this chapter. A key issue for the countries in this region is the phasing out of existing long-term power purchasing agreements.
Poland The process of vertical consolidation of the electricity sector in Poland resulted in the establishment of a limited number of energy sector groups, all of whom were endowed with powerful
Table 7 Electricity data for Italy in 2006 and 2007. Source: Italian regulator.
GWh 2007 2006 Change Gross production 313,888 314,090.3 -0.1% Ancillary services 12,589 12,864.3 -2.1% Net production 301,299 301,225.9 0.02% Energy for pumping 7,653.6 8,751.9 -12.5% Net production for consumption 293,645.5 292,474 0.4% Foreign balance 46,282.7 44,985 2.9% Grid demand 339,928.2 337,459 0.7% Grid leakages 20,975.7 19,925.7 5.3% Consumption 318,952.5 317,533.2 0.4%

Roadmap towards a Competitive European Energy Market World Energy Council 2010
43
market capacity. Nearly the whole volume of electricity in Poland is sold through bilateral contracts, limiting the wholesale market liquidity. Transactions on the day-ahead market of the Polish Power Exchange amounted to 2.2% of the total electricity sales to final customers, reflecting low liquidity of the exchange market in Poland.
Gross generation of electricity in 2007 in Poland was 159,453 GWh, 1.4% lower than in 2006. Consumption of electricity in Poland tends to increase, but increases in local consumption are satisfied by change of the exchange balance with other countries. This exchange balance decreased by about 48% in 2007. The total available capacity of national power plants at the end of 2007 amounted to 32.6 GW, an increase of 0.6% compared to 2006. The peak demand for capacity in 2007 was 24.6 GW. Currently, the available capacity in Poland exceeds the level of peak demand. Electricity generation is based mainly on hard coal and lignite, and in accordance with the assumptions of Polish energy policy, this will remain constant for the next few years. The sources of Polish electricity generation can be broken down as follows: hard coal 63.13%, lignite 32.63%, natural gas 3.02%, biomass and biogas 1.22%.
In 2007 concentration in the sub-sector of electricity generation increased because of the introduction of a government program based on consolidation of the entities from the sector.
Sales within the framework of long term contracts constituted about 31.5% of the total sales of system producers. In comparison with previous year, this was a decrease of 17.5%. The highest share of 44.4% belonged to sale under bilateral contracts (to trade companies). The highest sale dynamics occurred in segments with low market share, that is energy stock exchange – by 157,2% and among customers exercising the right to switch supplier – by 34,3%.
In 2007 transactions in this market segment still had a balancing character (improvement of the situation before closing the balancing market).
Hungary Until the end of 2007, the Hungarian electricity market was characterised by a hybrid model. This means that a public utility and a free market segment were working parallel. Since 2008, the hybrid model has ceased to exist, replaced by a competitive market model. In the latter model, the competition can be restricted only in the interest of protecting vulnerable consumers or with a view to prevent the abuse of market power. Customers and traders can purchase and producers can sell electricity under free market conditions. In Hungary, there is not any organised energy market. Therefore, electricity trade is conducted within the framework of bilateral contracts.
By the first half of 2007, the consumption of the free market diminished by almost half of the consumption of the previous year (to 62% of the
Figure 18 Market share of biggest electricity generators (Eastern European market: CZ, SK, PL, HU, SL) Source: European Commission

Roadmap towards a Competitive European Energy Market World Energy Council 2010
44
previous year). Due to the long term power purchase agreements (PPAs) concluded with the domestic power plants and import contracts, as much as 80% of the electricity required to satisfy domestic demand got to the suppliers and traders supplying the customers through the MVM group. The market share of the three largest generators was 61% when measured on the basis of installed capacity and 59% when measured on the basis of generation.
The share of net imports within the gross consumption decreased to 10% in 2007 from the 15 to 20% level of the years before the market opening. The export activity of the competitive market strengthened simultaneously with the growing domestic generation.
Czech Republic The Czech electricity market was opened for non-household customers in 2004 with full market opening expected by 2006. The trading system is based on bilateral trades.
In 2007 the installed capacity of thermal power stations, including cogeneration, decreased by 43 MW from 2006 levels. Meanwhile, the installed capacity of gas-fired and combined cycle plants increased by 11 MW year-on-year. The installed capacity of plants that use renewable resources also went up by 86 MW year-on-year. Most of this increase (70 MW) is attributable to wind power plants. The overall year-on-year increase in the installed capacity of generating plants in the electricity grid was 54 MW, and the overall installed capacity in the Czech electricity grid as of December 31, 2007, was 17,562 MW. In 2007 total
domestic net electricity consumption amounted to about 59.7 TWh, 35.7 TWh (59.8%) of which was taken by high-demand customers connected to the high voltage and extra high voltage levels. 7.9 TWh (13.2%) was taken by low-demand business customers connected to the low voltage level, and 14.6 TWh (24.5%) was taken by households. The current structure of generation capacity, by the size of installed capacities, is as follows: 10,648 MW thermal power stations (60.7%), 3,760 MW nuclear power plants (21.4%), 2,176 MW hydroelectric power stations (12.4%), 815 MW gas-fired and combined cycle power plants (4.6%), 163 MW alternative, of which, wind power plants make up 114 MW (0.9%).
The balance of the demand, amounting to 1.5 TWh (2.5%), was taken by the energy sector itself, i.e. it was power stations’ ‘other load’. Net electricity generation totalled 81.4 TWh (gross generation was 88.2 TWh). Electricity was consumed by final customers, and it was also used for covering line losses and, to a limited extent, exporting to other countries. In 2007, 25.6 TWh were exported from the Czech Republic and 9.5 TWh were imported.
The top three generators have a market share of about 86% of all electricity produced in the Czech Republic. Of these three, the ČEZ group is the biggest generator. The most important electricity generator on the Czech market is ČEZ a.s., which holds a share of almost 70% of installed capacity and 74% of the electricity generated. ČEZ, a.s. is also the only market participant that has a market share of more than 5% in relation to the installed capacity or the quantity of electricity generated. In 2007 most of electricity trades continued to take

Roadmap towards a Competitive European Energy Market World Energy Council 2010
45
place under bilateral contracts. The terms of such contracts vary; one-year contracts are usually executed between electricity generators and traders. The remaining volume of electricity is traded on the short-term market (day-ahead and intraday markets) organised by OTE. The short-term market accounts for less than 1% of the total electricity traded in the Czech Republic. All cleared entities, i.e. not only traders and generators but also the eligible customers who are responsible for imbalances (the so-called entities subject to clearing), can go to the short-term markets to procure electricity. OTE, the Czech electricity market operator, was created in 2001. Its main activities include processing of the supply and demand balance of electricity supplies, organising the short-term electricity market, the evaluation of deviations such as differences between real (metered) and contracted electricity, and the settlement of such deviations. So far, the OTE has no specific products of its own. The physical electricity is traded on the day-ahead market and intra-day market.
Since July 2007, it is has also been possible to buy electricity through the Prague Energy Exchange.
Slovak Republic The Slovak electricity market is currently open to all non-households and was fully open as of July 2007. There are not many long-term PPAs in place. The market is based on bilateral trading, and there is no power exchange.
The biggest electricity generator in the Slovak Republic has a market share of 83% of the total
electricity production. The rest is split between another generator and several industrial producers.
There is no official price index in the Slovak Republic, neither for a day-ahead nor for a forwards market. Besides the PPAs, major volumes are traded on an annual basis via a “tender” organised by the biggest generator together with the major Czech power producers. There is hardly any congestion between the Slovak Republic and the Czech Republic.
The overall electricity consumption in Slovakia in 2007 was calculated to 29,632 GWh.
The national legislation does not impose any obligation on any entity to establish a company that would organise a short-term or a long-term electricity trade. Based on the information on the presumed deviations, the supply companies purchase or sell electricity among themselves, and thus on the basis of bilateral contracts of particular stakeholders and electricity traders. In order to enable calculations and prognosis of deviations, an intra-day trade platform (SPX) has been established as a common project of three distribution companies: ZSE, SSE, and VSE. This SPX trade platform was further on being developed in 2006 and 2007. An information exchange in the field of deviations assessment should be performed the way, so that the SPX Company shall, based on reimbursement provision, offer an Internet information portal to particular stakeholders in Slovakia, through which these stakeholders shall inform others on an opportunity to sell, event. purchase electricity within the intra-day trading. After this information is published on the SPX

Roadmap towards a Competitive European Energy Market World Energy Council 2010
46
Internet portal, the further action in contracting business among stakeholders can also be applied through the SPX Internet portal.
There is also positive movement in the cross-border transmission capacity management. An auction system was realized on annual, monthly, and daily bases. Old contracts are excluded from the annual auctions. The capacities obtained in the annual and monthly auctions can be traded on an hourly basis with a D-3 day’s deadline.
Slovenia The Slovenian electricity market was opened for non-household customers on January 1, 2003, full market opening by January 1, 2007. Most of the electricity trade in Slovenia is bilateral.
In 2007 the Slovenian installed capacity was of 3,006 MW, which was distributed as follows: hydroelectric power - 886 MW, thermoelectric power - 1,241 MW, nuclear power - 696 MW and qualified producers and other small producers on the distribution networks - 183 MW. The production of electricity was 13,636 GWh: hydroelectric 2,814 GWh (20.6%), thermoelectric 4,817 GWh (35.3%), nuclear 5,422 GWh (39.8%), and qualified producers and other small producers on the distribution networks 583 GWh (4.2%). The length of the transmission network is 2,563 km (400 kV: 508 km, 220 kV: 328 km; 110 kV: 1,727 km). In 2007 the total consumption of electricity in Slovenia was 12,998 GWh (while the losses on the transmission and distribution networks amounted to 866 GWh). This was 173 GWh or 1.3% more than in 2006. The largest producer’s share was 90.7%.
Electricity prices were largely dependent on the price trends in the neighbouring markets. One of the most important price-trend indicators for Slovenia is the trend at the German exchange, the EEX, where the traders selling electricity in Slovenia also trade.
In 2007 the trading participants at Borzen, d. o. o., the operator of the electricity market, could trade with the electricity to be supplied the following day, every working day. On the basis of the adopted rules, the trading in the daily market took place on every working day between 6.00 am and 10.30 am. The market participants had an opportunity to take part in the continuous trading and auction trading. In the case of continuous trading, the participants traded with five standard products: base load, shoulder load, euro-shoulder load, night load, and euro-night load. At the auctions the products of hourly load were traded.
In 2007 there were 15 full members participating at the electricity exchange. At the annual level, 1852 MWh of energy was traded. The turnover on the daily market was two-thirds higher than in the previous year, yet it represented only 0.014 percent of the total Slovenian consumption.
South-East Market
The South East European electricity market mainly includes EU Member States and Contracting Parties: Albania, Bosnia and Herzegovina, Bulgaria, Croatia, FYR of Macedonia, Greece, Montenegro, Romania, Serbia, and UNMIK.

Roadmap towards a Competitive European Energy Market World Energy Council 2010
47
On October 25, 2005, the European Union from one side and the non-EU Contracting Parties from the other signed the Treaty Establishing the Energy Community, which became legally binding from July 1, 2006. Bulgaria and Romania joined the EU in January 2007 and became Participants to the Treaty along with EU Member States including Austria, Greece, Hungary, Italy, and Slovenia.
By signing and ratifying the Treaty, the Parties committed themselves to developing a regional energy (power and gas) market in South East Europe (SEE). Significant progress has been made in the SEE area in terms of vertical unbundling of state-owned power utilities, regulatory reforms, and establishing frameworks for regional cooperation between Parties to the Treaty. The Treaty also requires the opening of the electricity market in SEE to all non-household consumers by January 2008. As the deadline for electricity market opening has already passed prospects for an effective liberalisation process where non-household industrials and commercial consumers can freely choose their electricity suppliers are not promising. Some of these countries operated in the UCTE I and some in the UCTE II synchronous zone till October 2004, when UCTE was re-synchronised. Since then, the transmission system in the South East Europe has become fully integrated again. This provides good potential for both trading and security of supply considerations.
Trade is typically conducted on a short-term basis, and, as markets are still developing, it is characterised by limited competition, relatively high transaction costs, and some difficulties in exploiting short-term opportunities for trading.
The electricity sector in (SEE) is characterised by small, but in many cases fast-growing, markets. The size of the markets in terms of final electricity consumption varies from 4.6 TWh (Montenegro) to 25.6 TWh (Serbia), excluding Bulgaria, Greece, and Romania. The region exhibits a mixed generation structure with primarily conventional thermal power plants and hydro power plants. The seven Contracting Parties are import dependent, and some of them are suffering from severe shortages. The general trading pattern in the region is a flow from the north to the south. Bosnia and Herzegovina is the only Contracting Party among the seven that has a generation surplus. This highlights the fact that any real regional energy solution would have to cover a broader geographical scope. Losses (commercial and technical) are in many cases very high, and the economies in the region are generally characterised by high-energy intensities and low energy efficiency. The national markets are, in most cases, dominated by one state-owned generator that supplies electricity at regulated rates to tariff customers. The regulated tariffs, although they might cover the current costs, are generally low and are not sufficient to cover the cost of new investments. The tariffs do however vary considerably within the region.
One major task for the harmonisation of the SEE region is the establishment of a Coordinated Auction Office (CAO). In the future, the office should primarily provide auctions on different periodical bases and should organise a “secondary” market for physical transmission rights. This market still has to be developed, but the action plan has been launched, and the first

Roadmap towards a Competitive European Energy Market World Energy Council 2010
48
steps are already being implemented. It is planned that the yearly Auction 2010 will be managed by the CAO. It has also been agreed that the future CAO will be located in Montenegro.
Albania According to the Power Sector Law No. 9072 that entered into force in July 2003, the Albanian Regulatory Authority (ERE) has the responsibility of effectively managing the regulated activities of the participants in the market, in compliance with the rules, regulations, and transparent procedures.
The Albanian power generation system is based primarily on hydro generation, located predominantly in the northern part of the country. In total, hydropower represents about 98% of the country’s total power generation. 88% of the domestic generation is generated in one single river system. 2007 was a drought year, and as a result, electricity production was reduced. Because of an under-developed transmission network, more than 900,000 household customers did not have regular power supply. In 2007 between 60% and 70% of the demand had to be imported.
The growing electricity demand, the lack of long-term investments, and constraints on import capacities have led to load shedding in Albania. The electricity demand has increased by an average of 6% per year over the last 12 years, but this has not been associated with increases in generation capacities. In the period 2007-2011, the generation capacity is expected to increase from 1,460 MW to 1,930 MW. This includes new thermal capacities.
The transmission system consists of 400, 220 ,and 110 kV voltage levels and 220 high voltage sub-stations with a total installed capacity of 5,031 MVA. A new 400 kV power line between Tirana, Albania, and Podgorica, Montenegro, is under construction. It should be operational by July 2009.
The Albanian Power Company, KESH, was established in 1992 as a vertically integrated, state-owned monopoly with 99% market share. By the Government Decree no. 797, dated December 4, 2003, on the establishment of the company ‘Transmission System Operator’ sh.a Tirane, the legal basis for unbundling of the transmission system operator was created.
Three private companies, Shkoder, Elbasan, and Vlora, share the distribution of electricity in the parts of Albania where it is not controlled by KESH. The distribution (DSO and supply part of KESH) has been unbundled and the procedure of privatization of this was finalised in 2009 (it was sold to CEZ from Czech Republic).
The new Albanian Market Model (AMM), which has replaced the previous Transitional Market Model, is broadly characterised by bilateral contracts for electricity between market participants. The market model also outlines the responsibilities of and relationships among the market participants and the regulator.
Bosnia & Herzegovina (BiH) Bosnia and Herzegovina’s power system was developed as part of the common power system of the former Yugoslavia. As a result of the civil war (1992-1995), power generation, transmission, and

Roadmap towards a Competitive European Energy Market World Energy Council 2010
49
distribution infrastructure were seriously damaged. Some assets were completely destroyed, and their remaining parts were dismantled in order to restore supply to the customers to the best extent possible given the war conditions. Therefore, immediately after the end of the war, thanks to the significant donor assistance from the international community for energy sector reconstruction projects, most major electricity infrastructure was recovered. By the late 1990s, regular operation had been more or less re-established.
The State Electricity Regulatory Commission (SERC) regulates the electricity transmission system in Bosnia and Herzegovina and has jurisdiction and responsibility over the transmission of electricity, transmission system operations, and international trade in electricity. This is in accordance with international norms and EU standards.
Thermal generation provides approximately 59% of the total generation in BiH. Import capacity is underutilised because of consumption seasonality
and lack of storage. There is no TPA provision, nor capacity allocation mechanism. The rest of BiH’s electricity (1,960 MW) is generated by hydro power plants. New capacity is being planned. About 130 MW of hydroelectric capacity upgrades are already under construction, and further increases are planned. EPHZHB (one of the three main generation companies) also plans to add over 500 MW of wind capacity. Further coal and lignite capacity is also being considered.
BiH is a fuel rich country. It has proven coal and lignite reserves and significant potential for small-scale hydropower plants. 53% of BiH’s total land area is covered with forest, so there is also a high potential to produce energy from biomass. The Basic Power Indicators for electricity in BiH are shown in Table 8.
The transmission system consists of 400, 220, and 110 kV voltage levels, with an overall length of 5,565 km, and a total transformer capacity of about 4,744 MVA.
Table 8 Electricity data for Bosnia and Herzegovina in 2007 Source: ISO BiH, SERC
2007 GWh
Generation 12161.0
Hydro power plants 4,011.0
Thermal power plants 7972.0
Small and industrial PP 178.0
Total consumption 11,619.8
Total consumption (without transmission losses)
11,307.0
Net consumption 10,030.4
Large consumers 2,224.0
Pumping mode of PHP Čapljin 12.0
Transmission network losses 312.0
Cross-border trade net export 613.4
Import 1,995.5
Export 2,608.9
Roadmap towards a Competitive European Energy Market World Energy Council 2010
50
Bulgaria The power system of Bulgaria was initially developed in the surroundings of the Eastern European interconnection together with former Soviet Union and other states of the socialist block. In 1996, the power system of Bulgaria started parallel operations with UCTE second synchronous zone, and in 2001, Bulgaria became full UCTE member. Consumption decreased in the early 1990s because a significant share of non-profitable industrial capacities was shut-down. This reality, combined with the fact that Bulgaria’s existing generation capacities were, at the time, reasonably reliable and efficient, meant that Bulgaria was the major electricity exporter in the SEE region until the old nuclear units in NPP Kozloduy were shut down at the end of 2006.
During the isolated operation of the UCTE second synchronous zone from the main UCTE grid, the Bulgarian power system, with its electricity surpluses and significant amounts of operational reserves, was important to the stability of this small regional interconnection. The only “weak points” of the Bulgarian power system at the time were the relatively limited cross-border transmission capacity and the aged primary equipment in the transmission grid. At the time, major investments in the Bulgarian power sector were concentrated on refurbishment and upgrading of transmission facilities.
In February 2007, the total demand by final consumers in the country, including technological transmission and distribution losses, was 34,019 ТWh. Compared to previous periods, there was an increase in the demand by approximately 5%. The
total installed capacity in Bulgaria for the reference period was 11,215 MW. The peak load in December 2007 was 6,888 MW, and the available capacity was 8,737 MW. The annual net output for the country during the reference period was 39,106 TWh. Bulgaria’s total electricity generation potential based on electricity generated in 2007 is as follows:
Producers with coal as primary energy source – 51.6%
Producers with nuclear fuel as primary energy source – 33.9%
Hydro producers – 7.6%
Cogeneration fuelled by natural gas – 5.7%
Liquid fuels – 1.2%
The net electric power from commercial export for 2007 was 4.46 TWh. Bulgaria has interconnections with all neighbouring countries.
The Bulgarian electricity market is organised on the basis of power supply contracts and a balancing market. A central feature of this market model is that producers are dispatched according to their contractual quantities of electricity. The electricity market consists of two segments – the market based on regulated prices (regulated market segment) and the market based on freely negotiated prices (competitive market segment). Producers conclude transactions at regulated prices with the Wholesale Public Provider and/or Public Suppliers in accordance with the procedures
Roadmap towards a Competitive European Energy Market World Energy Council 2010
51
of the Energy Act. The parties to such transactions are not subject to balancing; in other words, they do not enter into deals for balancing energy with the TSO.
Croatia From November 1, 2003, Croatia started with opening of electricity market for eligible customers. According to the initial Law on Electricity Market, the threshold for eligible customers was based on annual consumption of 40 GWh or more, approximately 10 % of the Croatian market. Nowadays, all customers are given eligibility status. All eligible customers from the households’ category who do not want to exercise their eligibility right to choose supplier or do not manage to find one, contract electricity supply with the carrier of public service obligation of electricity supply. HEP DSO (as a supplier of last resort) and its parent company HEP are the carriers of public service obligation of electricity supply. The Electricity Market Law foresees a regulatory supervised public tender for procurement of electricity HEP DSO needs to supply households with, starting from 1 January 2011 for the period of 5 years.
In Croatia, access to the transmission network is granted based on the regulated third-party access principle.
The Croatian Energy Regulatory Agency (HERA) is an autonomous, independent, and non-profit public institution whose purpose is to regulate energy activities. HERA is based on the Act on the Regulation of Energy Activities ("Official Gazette", No. 177/04 and 76/07) and is the legal successor
to the Croatian Energy Regulatory Council that was established by energy legislation in 2001.
The Croatian Energy Market Operator (HROTE) was established in 2005 by Hrvatska elektroprivreda d.d. (HEP). Due to the need for separation of the Transmission and Market functions, the HROTE as an independent entity tasked only with market function was handed over to the state in October 2007 (transmission function has remained within vertically integrated HEP). With this action, the market operator HROTE became fully independent.
Croatian generation capacities consist of hydro, thermal and nuclear power plants (owned by HEP), several industrial power plants, and a few privately owned power plants. Hydro power plants account for more than half of Croatia’s electricity production, making Croatia one of the leading countries in energy production from renewable sources in the region. HEP owns 3,645 MW of available generation capacity (excluding half of NPP Krsko; 338 MW). It also owns seven thermal power plants. Of these, Sisak, Rijeka, Plomin, and Jertovec are the condensing type and produce electricity while TE-TO Zagreb, EL-TO Zagreb, and TE-TO Osijek are cogenerating plants that produce both electricity and heat in a combined cycle. The power plants are fuelled by oil, natural gas, and coal. Industrial power plants include units within industrial installations. The total installed capacity within industrial installations is about 210 MW.
The transmission grid in Croatia is well-developed and consists of 400, 220, and 110 kV networks. It is operated by HEP-OPS, a daughter company of

Roadmap towards a Competitive European Energy Market World Energy Council 2010
52
the Croatian Energy Company HEP. Croatia is member of the UCTE and is well connected to its neighbouring countries of Serbia, Hungary, Slovenia, and Bosnia and Herzegovina. In 2006, Croatia started with bilateral coordinated auctions (100% of the capacity) on the border to Hungary. Auctions on other borders began in March 2007 with capacity on individual borders divided 50:50 between neighbours.
Former Yugoslav Republic of Macedonia (FYROM) Similar to the power systems of its neighbours, the power system of FYR of Macedonia has been developed as part of the common power system of the former Yugoslavia. The power system of FYR of Macedonia has, until recently, been self-sufficient from the power balance point of view. It only became vulnerable when interconnections were concerned after the war in Kosovo and when all northern Macedonian power system cross-border transmission capacities were out of operation. The only connections with the rest of UCTE second synchronous zone interconnection were through links to Greece in the South, and Greece subjected these connections to serious operational restrictions. After repairing the 400kV grid in the Kosovo area, the situation regarding power transfers normalised, even in spite of permanent increases in demand for electricity transits towards Greece.
FYR of Macedonia took the first steps towards unbundling on January 1, 2005, when the TSO known as MEPSO separated from the vertically integrated power utility.
The legal framework for the establishment and operation of the Energy Regulatory Commission of the Republic of Macedonia (ERC) is provided by the Energy Law published at the “Official Gazette of the Republic of Macedonia,” no. 63/06, 36/07.
In 2007 the FYR of Macedonia consumed 8.36 TWh of electricity with a peak load demand of 1609.58 MW. FYR of Macedonia’s maximum net generating capacity was 1559 MW. The installed capacity is owned by ELEM AD (83,45%), TPP Negotino (13,47 %), and MAK Hydro project (1.94%). In 2007, 589,850,000 kWh of electricity were sold on the free market, and 7,537,833,64 kWh were sold on the regulated market. Currently, FYR of Macedonia’s available generation capacity is 1559 MW.
FYR of Macedonia has authorised the construction of additional 540 MW of generation capacity. An additional 240 MW of generation capacity are already under construction. An analysis performed by ESM shows that if there is no investment in new capacity and new fuel sources, a capacity imbalance will emerge in the medium term, and that by 2013, should Bitola close, FYR of Macedonia would be almost wholly dependent on imported power. In 2006, the distribution branch (ESM) was privatised (it was sold to EVN from Austria)

Roadmap towards a Competitive European Energy Market World Energy Council 2010
53
Greece Due to its geographic location and territorial characteristics, the Greek electricity system consists of:
The interconnected system on the mainland with certain islands also linked to it, and
The independent systems of the islands of Crete, Rhodes, and the smaller Greek islands.
The interconnected system represents 88% of the installed capacity and 93% of the energy consumption. Electricity is mainly generated in power stations located near to the lignite coalmines in northern Greece. However, the main electricity consumption centres (65%-70%) are located in central and southern Greece. A small number of islands, such as the Ionian and some Aegean islands, are connected to the mainland transmission system through submarine cables.
The remaining islands, referred to as “the autonomous islands,” are served by stand-alone generators, usually oil-fired, but also with a few wind generation facilities. The majority of the power stations on the autonomous islands are small. Exceptions are the plants installed on the populous islands of Crete and Rhodes, which are larger.
In 2007, there were no major developments concerning the market structure of Greece’s electricity sector. In the wholesale market, the incumbent utility, PPC S.A., retained approximately 95% of market share in terms of installed capacity, while also maintaining a 99.9% share in the retail market that includes the last resort obligation.
Wind parks and small hydro units are currently supplying close to 4% of the energy consumed in Greece, and installed capacity has reached 7%. As the number of applications already submitted to RAE reveals, there is tremendous interest in further investment. By 2012, it is expected that installed capacity will exceed 25%.
In 2007, Greece’s total consumption was 56.4 TWh (including losses) and a load peak of 10,610 MW (plus an additional 500 MW of curtailed load). These amounts were measured in the interconnected system, which refers to the mainland of Greece (interconnected islands not included).
During 2007 Greece was electrically interconnected with its northern neighbouring countries (Bulgaria, FYROM, and Albania) and with Italy (submarine, 400 kV DC link, 500 ΜW rated capacity). Northern interconnections are congested for imports to Greece, while the Greece-Italy cable is congested in the export direction. Electricity production by plant type in the interconnected system is shown in Figure 19.
Figure 19 Generation mix in Greece. Source: EURELECTRIC

Roadmap towards a Competitive European Energy Market World Energy Council 2010
54
The total sum of NTC for import is calculated at 650 MW. Thus, the degree of network interconnection is approximately 5.2%. For the reported period the sum of physical imports was 6.411 TWh, while the corresponding figure for exports was 2.057 TWh.
HTSO is a joint stock company owned by the state (51%) and PPC (49%). HTSO operates both the national transmission network and the interconnections, including coordination of maintenance works done by transmission network owner, PPC Transmission Unit. HTSO is also responsible for allocation of interconnection capacity and provision of ancillary services.
Until October 2004, the Greek TSO operated synchronously with the transmission systems of Albania, Macedonia, Serbia, Montenegro, Bosnia and Herzegovina, Bulgaria, and Romania, known as second UCTE synchronous zone. On October 10, 2004, the re-synchronization of the second UCTE zone was successfully completed.
Montenegro The Regulatory Authority of Montenegro (REGAGEN) was founded in 2004 according to the Energy Law of the Republic of Montenegro.
Until recently (beginning of 2009) transmission and distribution system operators were parts of the vertically integrated “holding company” Elektroprivreda Crne Gore (EPCG), which carried out all activities in the area of electricity generation, transmission, distribution, and supply. Starting from early 2009, transmission system operator has been ownership unbundled (AD Prenos), awaiting further
development (capital increase by a strategic partner and construction of HVDC cable to Italy). Moreover, from late 2009 EPCG attracted a strategic partner (A2A from Milan, Italy) into parent company structure.
The TSO also operates five interconnectors to Bosnia and Herzegovina, four to Serbia and Kosovo, and one to Albania. Those ten overhead lines connect the Electric Power System of Montenegro with UCTE interconnection.
Until now, there has been no open wholesale market in Montenegro, as there is only one company acting on the wholesale level. In 2007, the national total consumption was 4.6 TWh and the peak load 0.79 GW. The total installed capacity was 0.87 GW. 1.6 TWh of electricity are imported based on yearly arrangements. KAP, an aluminium smelter, imported 0.75 TWh directly from traders in 2007.
Currently, the electricity market in Montenegro is not well-developed. 30% of the electricity is imported. A yearly tender for electricity import is advertised internationally, and the best offers are selected based on previously established criteria. The contracts include a quite high of elasticity (up to 30%), which, combined with high percentage of hydro power, enables the system to work without day-ahead market. Two hydro-generators are enabled to automatically adjust to the system requirements, and they are a key part of maintaining Montenegro’s energy balance.

Roadmap towards a Competitive European Energy Market World Energy Council 2010
55
Romania Romania’s electricity sector started restructuring in 1998, and it progressively continued the implementation of the acquis communautaire to reach the following configuration by January 1, 2008:
80 generation license holders
1 transmission system operator – TSO
1 market operator
8 regional distribution operators (four state-owned undertakings and four undertakings with majority private shareholding), and 22 distribution operators with fewer than 100,000 customers
Approximately 117 supply license holders
In 2007, Romania’s total net electricity production was 56.4 TWh, about 1.7% lower than it had been in 2006. The internal consumption was 54.13 TWh as compared to 53.02 TWh in 2006 (about 2% higher).
Five producers were responsible for more than 5% of the total installed capacity, and the total weight of the installed capacity of the first three largest producers was 63.7%. Seven generating undertakings delivered more than 5% of the net electricity production in the system, and the total market quota of the first three largest producers was 55.7%.
The wholesale electricity is traded through contracts (regulated contracts for the supply quota for customers who chose not to exercise their eligibility right in 2007 and grid losses, and negotiated for the remaining quota) and through trades on the voluntary day-ahead-market. Differences between the offer and the demand occur in real time. The system operator insures these differences by accepting the offers on the Balancing Market (BM), and the market participants accept their financial responsibility for the generated imbalances. In 2007, about 51% of electricity sold by the producers was traded on the regulated market and 49% was traded on the competitive market.
In 2007, imports reached about 1.3 TWh, and exports were 3.4 TWh (these values are the result of commercial exchanges and do not include the transit). At the end of 2007, the number of eligible customers that changed their supplier or that renegotiated their supply contracts (by renouncing the regulated tariff) represented 50% of customers. Customers that exercised this eligibility right were primarily industrial.
In 2007, 650 MW were commissioned in the nuclear plant, 29 MW in hydropower plants, 23 MW in thermal power plants, and 5 MW in wind plants. In the same year, 22 MW installed in thermal power plants were decommissioned.
Of all the Eastern European countries, Romania has been the most successful in establishing a market. Romania has established the OPCOM power exchange, which is the largest PX in the Eastern European area. Romania has also fulfilled

Roadmap towards a Competitive European Energy Market World Energy Council 2010
56
the EU requirements regarding unbundling and having an independent TSO, regulator, and market operator.
Romania’s transmission infrastructure and system stability will have a significant impact on the future establishment and operation of the Regional Electricity Market in the South East Europe.
Serbia The Energy Agency of the Republic of Serbia (AERS) was founded by the Energy Law, which entered into force in 2004 (The Official Gazette of the Republic of Serbia No.84/2004). It was legally established in June 2005 and became fully operational on January 1, 2006.
Serbia’s generation mix breaks down as follows: installed capacity is 8.355 MW (including 1235 MW installed capacity on Kosovo and Metohija, which are under interim administration of UN); thermal (lignite-fired) is 5,171 MW; hydro generation is 2.831MW; and CHP is 353 MW.
Currently, five distribution companies are operating in Serbia, all of which are subsidiaries of EPS- “Elektrovojvodina” llc, “Elektrodistribucija Beograd” llc, “Elektrosrbija” llc, ED “Jugoistok” llc., ED “Centar” llc. Those companies are responsible both for distribution system operation and supply to tariff customers. Currently, Serbian legislation does not require companies to unbundle their services, distribution, and supply activities, but it is expected that such obligation will be introduced by the amendments to the Energy Law. The activities of DSO and supply are unbundled within the distribution companies in terms of accounting. The
power distribution system consists of a low-voltage network, medium-voltage network, and part of a 110 kV network, as well as other energy facilities, telecommunication systems, information systems, and other infrastructure required for the functioning of distribution system.
Serbia’s power transmission system comprises of about 10,200 km of 400, 220, and 110 kV power lines and about 27 GVA installed in the transformer stations. The transmission of power produced in the country and the exchange with the neighbouring systems are performed through this system. Elektromreza Srbije (EMS) operates and manages the high voltage transmission network and is responsible for its development. EMS has the role of a TSO and of a market operator. The company EMS was established after the unbundling of the formerly vertically integrated electric power industry of Serbia EPS.
In 2007, Serbia’s electricity consumption was 37.8 TWh (including transmission losses) with a peak load of 7.305 GW. The net generation capacity was 8.355 GW whereas the proportion of the installed capacity owned by the three largest generation companies (all subsidiaries of EPS) is 42:22:18. Historically, EPS has been the only major player in the ownership structure of Serbia’s electricity sector. According to the data provided within the UCTE System Adequacy report, changes in generation capacity of Serbia would have occurred not before year 2013.
In 2007, there was no investment in new generation capacity. However, it is expected that the installed generation capacity will increase by

Roadmap towards a Competitive European Energy Market World Energy Council 2010
57
1900 MW by the end of 2015. After more than 50 years of exploration, four units in TPP Kolubara A (with a total installed capacity of 161MW) will gradually be phased out. Revitalization projects in HPP Bajina Basta and HPP Djerdap, with upgrading of installed capacity (Bajina Basta from 364 to 418 MW, Djerdap from 1058 to 1220 MW) have recently been started. Also, pre-investment activities for realization of three TPPs: Kolubara B (2 x 350 MW), Nikola Tesla B3 (700 MW), and gas-fired Novi Sad (450 MW) are under way. The project Buk Bijela (220 MW) will be realized as joint venture with the electric power industry ERS in Bosnia and Herzegovina.
Baltic Market
The three Baltic countries of Estonia, Latvia, and Lithuania are currently linked to the European through Estlink 350 MW DC cable between Estonia and Finland, which has been operating since January 2007. The Baltic countries are also still synchronously connected to the Russian/CIS electricity system. The power systems of the three countries work in parallel with those of Russia and
Belarus, operated by the common organisation of system operators BRELL.
On June 17, 2009, Estonia, Latvia and Lithuania, together with countries surrounding the Baltic Sea, reached an agreement on further development of a single regional energy market. The European Commission, Denmark, Germany, Estonia, Latvia, Lithuania, Poland, Finland, and Sweden signed a joint memorandum of understanding of Baltic Energy Market Interconnection Plan (BEMIP) based on the principles of the development of a single Baltic energy market around the Baltic Sea and based on the respective roadmap of actions necessary for integrating Baltic countries into European energy markets.
Lithuania The rapid development of the Lithuanian economy, the closure of the Ignalina Nuclear Power Plant in 2009, the dependence on imports of primary energy resources from a single source, and the increased prices of fossil fuels have forced Lithuania to adjust its energy policy. The updated National Energy Strategy, which came into effect
Figure 20 Electricity exchange in South East Europe Source: UCTE

Roadmap towards a Competitive European Energy Market World Energy Council 2010
58
on January 27, 2007, acknowledges the necessity of ensuring the continuity, succession, and development of nuclear energy and calls for the development of a new regional nuclear power plant to satisfy the demand of the Baltic States and the entire region. After the publication of this strategy, Lithuanian energy policy underwent significant changes, and the priorities of liberalisation were changed to include the concepts of re-consolidation and monopolization of the electricity sector. Lithuanian policy makers decided that the consolidation of energy assets in a single holding could create favourable conditions for national companies, which, together with partners from neighbouring countries, would be able to construct a new nuclear power plant and interconnections with Poland and Sweden.
2007 was the sixth functional year of Lithuania’s electricity market. Electricity is traded on the market under the Electricity Trading Rules. The electricity sector and the state have negotiated regulated prices. Production prices (electricity and reserve capacity) and independent supply are not regulated except when electricity producers or independent suppliers have more than a 25% of share in the Lithuanian electricity market. Prices of electricity transmission, distribution, and public supplier services are regulated through price caps. The regulated public tariffs apply to all customer categories, including residents and small, medium, and large businesses. Lietuvos Energija AB is the national grid company that acts as the transmission grid operator. It owns the transmission grid (110-330 kV voltage) and is both the system and market operator. Lietuvos Energija AB is also the largest electricity trader, and it owns exclusive cross-
border trading rights in Lithuania. Lithuania has compulsory auction for imported and exported electricity (except for the electricity traded by the TSO). At the auction, the sales side has “get as bid” pricing method, and the purchasing side has “weighted average” pricing method. The Lithuanian market is open for non-household customers. The wholesale market in Lithuania is primarily based on bilateral contracts, and the remainder of the electricity production is used to comply with public service obligations and is sold in auctions.
Lithuanian electricity trading rules are not currently compliant with the EU electricity cross-border trading regulations, and they are subject to revisions in late 2009. According to draft Lithuania trading rules that are scheduled to come into force in January 2010, Lithuania will introduce a day-ahead spot market, using marginal pricing on both sales and purchasing sides. All cross-border capacities from Lithuania to Latvia, Russia, and Byelorussia will be 100% allocated by the spot market. The producers are allowed to enter into bilateral agreements only for base-load electricity. Separation of obligations of system operator and electricity trading will be carried out through the ISO-concept as of January 1, 2010.
There is an ongoing project to interconnect the Lithuanian and Polish power grids before 2016. According to BEMIP, the construction of the up-to-1000 MW DC interconnection between Lithuania and Sweden is scheduled for completion by 2018. In response to the closure of Ignalina NPP on December 31, 2009, Lithuania also plans to erect a new nuclear power plant by 2020.

Roadmap towards a Competitive European Energy Market World Energy Council 2010
59
In 2007, Lithuania’s foreign electricity sales amounted to 2.54 TWh, 0.44 TWh more than in 2006. The most significant change in the export structure was caused by the fact that as of 2007, in addition to traditional export links to Russia, Latvia, and Estonia, electricity was also exported to Scandinavian countries via the Estlink cable. The share of electricity exports was as follows: Latvia 18%, Estonia 13%, Finland 13%, Belarus 19%, and Russia 37%. In 2007 the total volume of electricity imports amounted to 1.17 TWh. Electricity was mainly imported during the spring floods and the repairs at the Ignalina NPP unit. The Ignalina Nuclear Power Plant, which only had one operational unit in 2007, produced and supplied 9.1 TWh to the market.
In 2007, the installed capacity of Lithuanian power plants amounted to approximately 5 GW, with the capacity of nuclear plants amounting to 26% and thermal plants responsible for 53%. The Ignalina Nuclear Power Plant met most domestic electricity needs.
Electricity production in 2007 was distributed as follows: hydro power - 7.38%, nuclear power - 70.14%, thermal power -19.36%, wind power - 0.82%, and other renewables - 0.5%.
The Lithuanian power system is connected with Latvia (4 lines of 330kV), Belarus (5 lines of 330 kV), and with the Kaliningrad region of Russia (3 lines of 330kV). Physical import/export from and to Latvia was 1.4/3.2 TWh. From Belarus it was 3.6/2.0 TWh, and from Russia it was 0/1.1 TWh.
Latvia Latvia’s Electricity Market Law was approved on May 25, 2005. It stipulates the relationships between market participants and system operators, their rights and responsibilities, and it defines the main principles of trading, public service obligations, power system auxiliary services, authorisation procedures for new generation, and transmission. Latvia has limited the use of regulated electricity prices for the household and SME under the universal service provisions. Up to 45% of electricity consumed in Latvia is sold on freely negotiated prices. “Latvenergo,” a joint-stock company, still plays the dominant role on the Latvian electricity market. It is a holding company that comprises several joint-stock companies responsible and licensed for electricity (2013 MWel) and heat production and trading, as well as telecommunication services.
In addition, Latvia’s electricity sector includes about 15 other companies that have trading licenses, 9 companies that are licensed for distribution services, and about 205 small electricity producers with the total capacity of 192 MWel. At the moment, “Latvenergo” has about 65-70% of shares in electricity production in the Latvian electricity market, amounting to 93% of power supply. Latvenergo has exclusive rights to trade with electricity in intra-hour timeframe in Latvia, leading to the dominant position in defining prices for balancing electricity in Latvia and Estonia. The right allows the Latvenergo group as a whole to stay constantly and exclusively in “0”-imbalance. At the moment, there is no day-ahead or forward price approach on the power exchange in Latvia. That is why there are no officially published wholesale

Roadmap towards a Competitive European Energy Market World Energy Council 2010
60
electricity price indexes. When electricity traders conclude bilateral electricity purchase agreements, they use fixed prices or references to the price indexes of neighbouring power exchanges such as Nord Pool. Currently, wholesale electricity prices on the Baltic (and Latvian) electricity market are higher than on the Russian Power Exchange ATS. Total electricity production in Latvia in 2007 was 4536 GWh. 59% of electricity was produced by HPPs and 39% by CHPs. 2% of electricity was produced by wind power plants and other renewables (excluding HP).
Estonia Between now and 2013, Estonia is in a transitional period of electricity market opening. Starting from January 1, 2009, the electricity market should be at least 35% open, but as long as regulated prices are lower compared to the wholesale electricity prices, all customers will use regulated tariffs. The use of regulated tariffs for eligible customers is expected to be prohibited as of April 1, 2010. The Estonian electricity system has been built up as part of the north-western common power system of the former Soviet Union. Estonia is part of the common synchronised system with Russia, Belarus, Latvia, and Lithuania. Estonia currently has synchronised connections with Russia and Latvia and 350 MW DC connection with Finland (Finland is part of the Nordic power system Nordel, which is not synchronised with the north-western Russian system that Estonia belongs to).
In comparison with other EU countries, the Estonian electricity market is very small. In 2006 the load peaked at 1537 MW with an annual production of 8.7 TWh. Out of this 6.9 TWh was
domestic consumption, while exports totalled 0.75 TWh. Another important feature of the Estonian electricity market is an extreme concentration and reliance on a single fuel. 93% of Estonian electricity is produced with oil shale, and the share of other fuels is very modest. The share of natural gas is only 5.3%, and the share of renewables and peat is only 1.2%. Essentially, all the production is controlled by the largest energy enterprise Eesti Energia AS, which owns 96% of installed capacity. In 2006 it was responsible for 95.3% of the Estonian electricity production.
According to the BEMIP, a day-ahead electricity spot market operated by Nord Pool Spot will be opened in Estonia as of April 1, 2010. Additionally, a further 650 MW DC interconnection between Estonia and Finland is planned to be built between now and 2014.
Conclusions As detailed in these national and regional reports, Europe is in the process of transitioning from national markets to a European market. The descriptions show that a pan-European market does not yet exist. However, considerable commercial exchanges of electricity are already taking place between different markets. One indication of the success of ongoing regional and European integration is the convergence of wholesale electricity prices between adjacent areas.
All major markets in Europe now have a national or regional power exchange. This reflects the increasing role of a centralised market-place.

Roadmap towards a Competitive European Energy Market World Energy Council 2010
61
Introduction The objective of this chapter is to give an overview of the situation of renewable energies (RES-E) in Europe. It addresses the following questions:
Why encourage the increase of RES-E in the generation mix?
What are the available mechanisms to promote RES-E?
Which of these mechanisms are the most effective and efficient?
What are the technical issues surrounding integration of the RES-E grid into Europe’s generation mix?
How can RES-E be integrated into the European market?
What are the current status and the future goals for RES-E in Europe?
Why Encourage the Increase of RES-E in the Generation Mix? RES-E can play a fundamental role in managing the challenges of climate change, environmental degradation, and energy security. As these issues become more and more pressing, governments and markets are seeking innovative solutions.
In the EU, all 27 member states have put in place a range of support measures for promoting renewable electricity, to support introducing RES-E
into the market, and to fulfil the RES-E quotas of the EU. These measures include feed-in tariff schemes, tenders or Tradable Green Certificates (TGC), and tax rebates. The intermediate goal for the EU-27 is 12% renewable energy by 2010 and a renewable electricity share of 21%. By 2020, the renewable energy should have a share of 20%. Many of the EU-27 countries have made important progress in promoting renewables in their energy mix. However, obstacles remain, and bigger efforts are needed in order to achieve the EU-27 renewable target for 2020. So far the renewable electricity share is not yet defined by 2020, however, The EU Comissions’ “Renewable Energy Road Map” (2007) assumes RES-E shares in different scenarios between 34.2 and 42.8 % in 2020.
Currently, 27 Member States operate 27 different national support schemes.
RES-E is a key element in developing a sustainable energy mix, and it can contribute to energy policy objectives in a number of ways.
Reducing import dependency and diversifying the fuel mix to enhance energy supply security.
For Europe in particular, RES-E is considered an important part of the energy supply. Since RES-E can be produced within Europe, it helps to reduce import dependency. That said, renewables are only one of several ways to offset the pressures caused by decreasing fossil fuel resources.
Renewable Energy

Roadmap towards a Competitive European Energy Market World Energy Council 2010
62
Lower CO2 and other emissions
Climate change and environmental damage as a result of CO2 and other greenhouse gas emissions must be urgently addressed. In order to do this, RES-E must play a larger role in the global energy supply. If emissions levels and climate change are going to be stabilized at a level of 2°C above pre-industrial levels (a level many environmentalists have identified as the necessary cap to avoid the most serious damages of climate change), major long-term emission reductions adapted from a variety of options - including larger RES-E production - should be undertaken.
Development of new technologies
In January 2008, the European Commission presented the Energy Climate Package, a set of legislative proposals with specific emissions targets for the EU to meet by 2020. The EU's Council of Ministers adopted the final legal texts of the energy and climate change package of legislation in April 2009. The main provisions are:
A reduction of at least 20% in greenhouse gases (GHG), rising to 30% if there is an international agreement committing other developed countries to "comparable emission reductions and economically more advanced developing countries to contributing adequately according to their responsibilities and respective capabilities
A 20% share of renewable energies in EU energy consumption
A 20% increase in energy efficiency (this is so far only an indicative value)
Looking at the EU Emission Trading Scheme (ETS) as a truly European approach, it is clear that creating an internal energy market in Europe would also require enough harmonisation among policies to reach other environmental goals. The interesting argument pro ETS to reduce the macroeconomic costs is in principle also true for renewable energy.
Figure 21 The current subsidy schemes for renewables in Europe. Source: OPTRES 2007
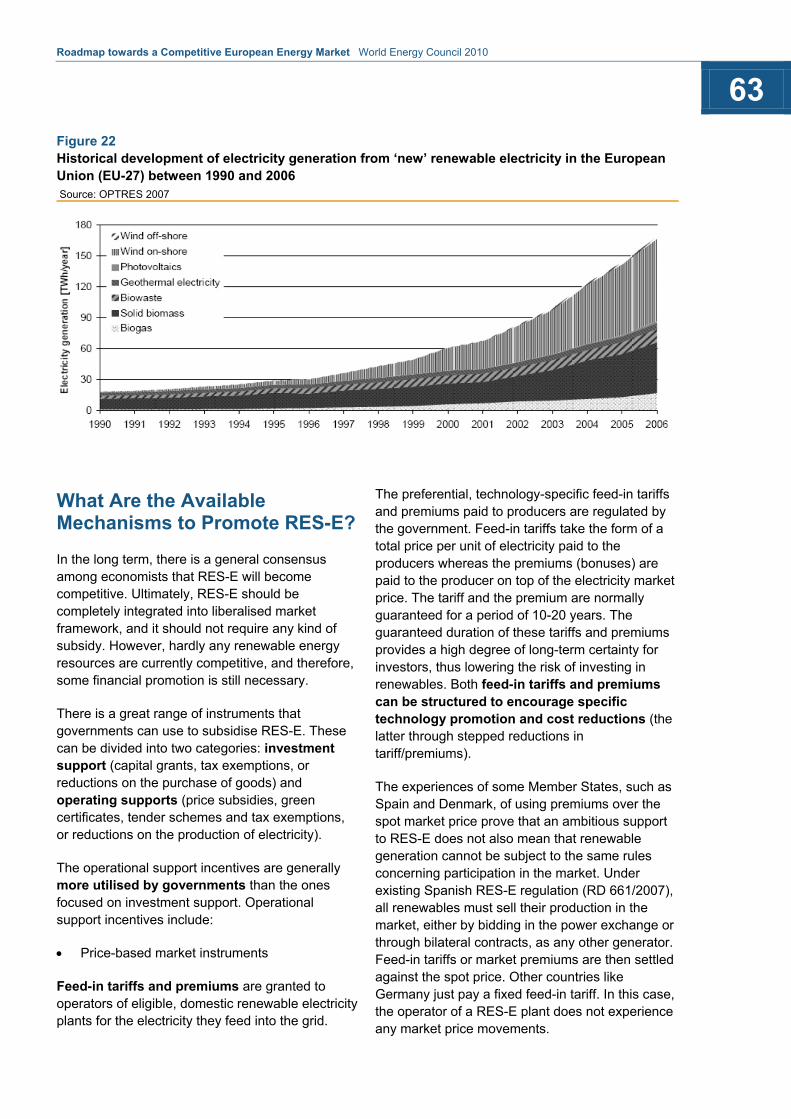
Roadmap towards a Competitive European Energy Market World Energy Council 2010
63
What Are the Available Mechanisms to Promote RES-E?
In the long term, there is a general consensus among economists that RES-E will become competitive. Ultimately, RES-E should be completely integrated into liberalised market framework, and it should not require any kind of subsidy. However, hardly any renewable energy resources are currently competitive, and therefore, some financial promotion is still necessary.
There is a great range of instruments that governments can use to subsidise RES-E. These can be divided into two categories: investment support (capital grants, tax exemptions, or reductions on the purchase of goods) and operating supports (price subsidies, green certificates, tender schemes and tax exemptions, or reductions on the production of electricity).
The operational support incentives are generally more utilised by governments than the ones focused on investment support. Operational support incentives include:
• Price-based market instruments
Feed-in tariffs and premiums are granted to operators of eligible, domestic renewable electricity plants for the electricity they feed into the grid.
The preferential, technology-specific feed-in tariffs and premiums paid to producers are regulated by the government. Feed-in tariffs take the form of a total price per unit of electricity paid to the producers whereas the premiums (bonuses) are paid to the producer on top of the electricity market price. The tariff and the premium are normally guaranteed for a period of 10-20 years. The guaranteed duration of these tariffs and premiums provides a high degree of long-term certainty for investors, thus lowering the risk of investing in renewables. Both feed-in tariffs and premiums can be structured to encourage specific technology promotion and cost reductions (the latter through stepped reductions in tariff/premiums).
The experiences of some Member States, such as Spain and Denmark, of using premiums over the spot market price prove that an ambitious support to RES-E does not also mean that renewable generation cannot be subject to the same rules concerning participation in the market. Under existing Spanish RES-E regulation (RD 661/2007), all renewables must sell their production in the market, either by bidding in the power exchange or through bilateral contracts, as any other generator. Feed-in tariffs or market premiums are then settled against the spot price. Other countries like Germany just pay a fixed feed-in tariff. In this case, the operator of a RES-E plant does not experience any market price movements.
Figure 22 Historical development of electricity generation from ‘new’ renewable electricity in the European Union (EU-27) between 1990 and 2006 Source: OPTRES 2007

Roadmap towards a Competitive European Energy Market World Energy Council 2010
64
• Quantity-based market instruments
Under a quota obligation, governments impose an obligation on consumers, suppliers, or producers to source a certain percentage of their electricity from RES-E. This obligation is usually facilitated by tradable green certificates (TGC).
Accordingly, renewable electricity producers sell the electricity at the market price, but can also sell green certificates, which prove the renewable source of the electricity. Suppliers prove that they reach their obligation by buying these green certificates, or they pay a penalty to the government.
• Tenders
Under tendering, a tool which is used more widely in the United States, a tender is announced or the provision of a certain amount of electricity from a certain technology source. In this case, bidding should ensure the cheapest offer is accepted.
• Fiscal incentives,
In some countries, fiscal incentives such as tax exemptions or tax reductions are the main RES-E support scheme. In countries like the United States, they are used as supplementary instruments. Renewable energy producers are exempted from certain taxes (e.g. carbon taxes) as a means of stimulating more investments into RES-E. The effectiveness of such fiscal incentives depends on the applicable tax rate. In countries like Finland with relatively high energy taxes, these tax exemptions can be sufficient to stimulate the use of
renewable electricity; in countries with lower energy tax rates, fiscal incentives need to be accompanied by other measures.
With the help of premiums, quota/TGC schemes, tendering schemes, tax exemptions and investment support, renewable electricity is normally traded in the electricity market and subject to market prices and conditions. The support is therefore remuneration on top of the electricity price. Since the electricity is sold in the market, the producers participate on the regular electricity market in competition with other producers, and this supply will then have an influence on the final electricity price.

Roadmap towards a Competitive European Energy Market World Energy Council 2010
65
With feed-in tariffs, renewable electricity is not sold directly in the market. Rather, the electricity is paid for through a purchase obligation, something that is normally imposed on the system operator. This electricity is shared among the customers and is paid for through a fee included in the network tariff. Although renewable electricity that receives a feed-in tariff is not sold directly in the market, the additional supply will nonetheless have an indirect impact on the market price.
Which of these Mechanisms Are the Most Effective and Efficient? The answer to this question depends on the specific goals and criteria that have been adopted. The most commonly assumed goal is least cost of generation of RES-E. Another common assumption is that models based on quantitative market-based mechanisms like those used in the United States and the UK will induce renewable production at lower cost, thus producing a result that is economically efficient. This occurs because of promotion of competition between renewable producers, leading to a
defined target of RES-E generation at minimum aggregate social cost.
Additional goals include maximum deployment, reduced risk for investors, building a diversified portfolio of RE generating sources, increased employment, and minimising complexity and administrative costs.
In the United States and the United Kingdom, there is a distinct preference for tradable green certificates as opposed to the feed-in tariffs that are preferred in Germany and Spain among others. This preference is grounded in a theoretical assumption that tenders and RPS laws can provide renewable generation at the lowest cost. Associated with it is the firmly held conviction that the introduction of a feed-in tariff mechanism would inevitably lead to less cost-efficient outcomes. Markets very rarely meet the ideal of perfect competition. Nonetheless, the assumption that even a partially competitive market will produce a more efficient use of resources compared to a fixed price system remains.
Figure 23 Capacity breakdown of non-hydro renewables in the EU Source: CERA
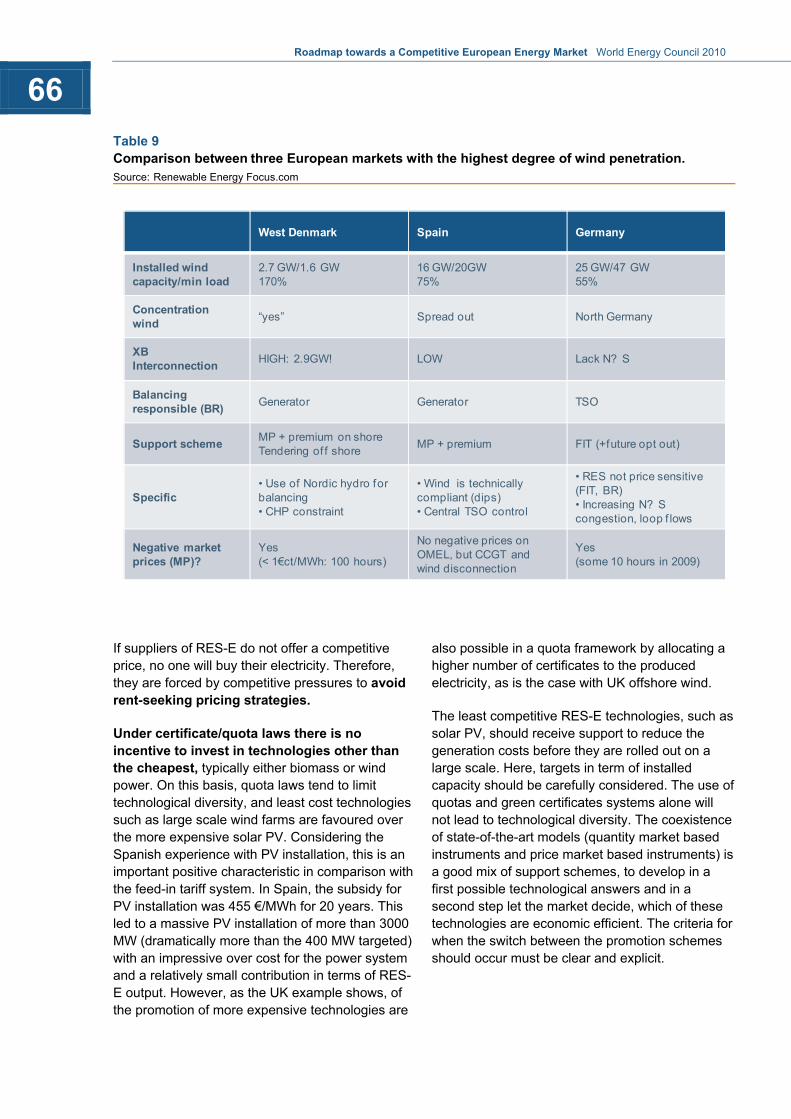
Roadmap towards a Competitive European Energy Market World Energy Council 2010
66
If suppliers of RES-E do not offer a competitive price, no one will buy their electricity. Therefore, they are forced by competitive pressures to avoid rent-seeking pricing strategies.
Under certificate/quota laws there is no incentive to invest in technologies other than the cheapest, typically either biomass or wind power. On this basis, quota laws tend to limit technological diversity, and least cost technologies such as large scale wind farms are favoured over the more expensive solar PV. Considering the Spanish experience with PV installation, this is an important positive characteristic in comparison with the feed-in tariff system. In Spain, the subsidy for PV installation was 455 €/MWh for 20 years. This led to a massive PV installation of more than 3000 MW (dramatically more than the 400 MW targeted) with an impressive over cost for the power system and a relatively small contribution in terms of RES-E output. However, as the UK example shows, of the promotion of more expensive technologies are
also possible in a quota framework by allocating a higher number of certificates to the produced electricity, as is the case with UK offshore wind.
The least competitive RES-E technologies, such as solar PV, should receive support to reduce the generation costs before they are rolled out on a large scale. Here, targets in term of installed capacity should be carefully considered. The use of quotas and green certificates systems alone will not lead to technological diversity. The coexistence of state-of-the-art models (quantity market based instruments and price market based instruments) is a good mix of support schemes, to develop in a first possible technological answers and in a second step let the market decide, which of these technologies are economic efficient. The criteria for when the switch between the promotion schemes should occur must be clear and explicit.
Table 9 Comparison between three European markets with the highest degree of wind penetration. Source: Renewable Energy Focus.com
West Denmark Spain Germany
Installed wind capacity/min load
2.7 GW/1.6 GW170%
16 GW/20GW75%
25 GW/47 GW55%
Concentration wind “yes” Spread out North Germany
XBInterconnection HIGH: 2.9GW! LOW Lack N? S
Balancingresponsible (BR) Generator Generator TSO
Support scheme MP + premium on shoreTendering of f shore MP + premium FIT (+future opt out)
Specific• Use of Nordic hydro for balancing• CHP constraint
• Wind is technically compliant (dips)• Central TSO control
• RES not price sensitive(FIT, BR)• Increasing N? Scongestion, loop f lows
Negative market prices (MP)?
Yes (< 1€ct/MWh: 100 hours)
No negative prices on OMEL, but CCGT and wind disconnection
Yes (some 10 hours in 2009)

Roadmap towards a Competitive European Energy Market World Energy Council 2010
67
The European Commission has developed the following indicators to measure the performance of the different support schemes:
Effectiveness
The effectiveness indicator shows the increase of electricity generation compared to the additional realisable mid-term potential to a particular year (i.e. 2020) for a specific technology.
Cost efficiency
Relationship between costs and results.
The efficiency indicator compares the total amount received for RES-E (level of support) to the generation cost. The closer the level of support is to the generation cost, the more efficient a support mechanism is in terms of covering the actual costs.
Low transaction costs.
Efficiency in finding the right technologies.
Dynamical efficiency
Innovation efficiency.
Incentives for cost reduction.
Being in line with the general framework of
the energy market
Practicability
Low administrative burdens.
Regulatory and monitoring issues.
Flexibility and adaptability of the used technologies.
What Are the Technical Issues Surrounding Integration of the RES-E Grid into Europe’s Generation Mix? The existing grids that developed in the context of large, monopolistic, and conventional fuel-based energy producers still need to adapt to the incorporation of smaller, decentralised RES-E producers into the market. In the long-term, the overall trend for renewables is for more central production, e.g. with off-shore wind plants. Since renewable energy production is strongly dependent on geography, it makes sense to concentrate the production. In the future, the grid will also have to meet the requirements of centralised production.
Conditions on priority grid renewable generation access and generation dispatch must be compatible with security of supply, which remains the first priority for network operators. Grid conditions must also match a functioning electricity market, particularly as RES-E will occupy a large share of the market in the future.

Roadmap towards a Competitive European Energy Market World Energy Council 2010
68
Because of the European Union’s new ambitious targets for RES-E market share (20% by 2020), the degree of competition in the internal electricity market has major implications for renewable electricity.
The electricity market needs to become more transparent and competitive, with independent transmission system operators, improved infrastructure access, and balancing rules for renewable electricity. With the development of regional and European energy markets, it is important that the rules regarding renewables are objective, transparent, harmonised, and non-discriminatory.
The EU’s legal framework requires guaranteed access and provides rules for sharing the cost of various grid investments (such as connections, reinforcements, and extensions) that are necessary to integrate renewable electricity into the grid. The directive 2009/28/EC prioritises generation from renewable sources, thereby influencing operation of conventional generation and increasing its cost and deviates from market-rules. It provides in particular that generation from RES should either be granted priority or guaranteed access to the grid, that TSOs should give it priority in dispatching whenever secure operation of the system is possible, and that they
should be able to minimise and justify curtailing measures.
An increased share of total power production covered by intermittent and not perfectly predictable RES-E power generation leads to a change of the system costs. The connection of RES-E to the grid imposes costs depending on site and voltage level.
In contrast to conventional sources of electricity, RES-E presents three major challenges:
Limited availability
Limited predictability
Geographical allocation
Table 10 Evaluation of different RES-E technologies with respect to certain technological evaluation criteria. Source: Jürgen Neubarth, e3 consult, Austria

Roadmap towards a Competitive European Energy Market World Energy Council 2010
69
Limited availability
Limited availability means that it cannot be guaranteed that a given renewable source will produce the needed amount of electricity. For example, photovoltaic does not work at night or on a cloudy day, and wind turbines do not produce electricity in calm wind situations or in storms. Consequently, the production by renewable sources can result in tremendous variance. To enable a secure production of electricity, back-up conventional power plants are needed. These conventional plants will run in all cases when RES-E is unable to produce. This back up capacity is not without cost, and these costs should be socialised between all customers depending on their final consumption or renewable consumption i.e.).
Limited predictability
The weather forecast plays a crucial role in wind power production. In cases where the wind power forecast deviates from the actual production levels, balancing energy is needed. This is usually supplied by conventional power plants. In the future, technical solutions for energy storage may alleviate this problem, but storage technologies are currently very expensive.
Geographical allocation
As with other forms of electricity production, RES-E is generally connected to network infrastructure. Big wind farms in particular are very dependent on adequate transmission capacity, especially since they are often situated further away from
consumption centres. Thus, adequate development of network infrastructure is a precondition for the development of renewable electricity.
RES-E sources are very location dependent, and the preferred sites for wind mills or solar power plants are usually not close to the consumption centres, hence large-scale transport of electricity is needed. For this reason, an extension of the existing grid usually has to take place. Because of regulatory obstacles, the grid extension may happen at a slower pace than the development of renewable power plants. This results in frictions in the electricity transport system. The non-harmonised promotion of RES-E within Europe will consequently lead to a certain way of grid extension, and this extension might be the wrong grid once the markets become harmonised.
Figure 24 The daily wind power generation shows strong fluctuations Source: E.ON Netz

Roadmap towards a Competitive European Energy Market World Energy Council 2010
70
RES-E Integration Costs
The main costs of integrating RES-E into the existing grid include:
Grid connection costs
Grid reinforcement costs
Investment costs into regulating power plants caused by RES-E power production
Change of operational costs of conventional power plants due to the integration RES-E power plants
Grid Connection Costs
Connecting an RES-E power plant to the existing transmission or distribution grid requires the installation of an additional from the RES-E power plant to the existing transmission or distribution grid and the modification of the existing busbar and transformer. These costs are dependent on:
The distance between the RES-E power plant and the point of coupling with the grid
The voltage of the connection line and the connected grid
The possibility to apply standardised equipment (cables, busbars, etc.)
Grid connection costs are an important economic constraint for the development of RES-E, so it is extremely important that regulators recognise the need to reinforce networks, to authorise investments on a timely basis, and to allocate the appropriate remuneration (or authorise the necessary grid tariffs) to TSOs and DSOs.
Grid reinforcement costs
The integration of large scale RES-E can require additional network capacities in the distribution and transmission grid, depending on the location of the RES-E relative to the load centres and the existing grid structure.
The intermittent feed-in from RES-E must be balanced with regulating conventional power plants that can be located elsewhere in the grid. Also, larger control areas that can make use of regulating capacity from outside a country require sufficient transmission capacities. Basically, RES-E will change the power flows in the transmission system, potentially causing new bottlenecks in existing transmissions or distribution grids.
Figure 25 The difference between the wind production and the 24-hours forecast. The latter is essential for the bidding process in the electricity market Source: E.ON Netz

Roadmap towards a Competitive European Energy Market World Energy Council 2010
71
Another challenge is that the grid reinforcement is technically a national task, but it still has significant cross-border implications. Strong fluctuations in some major wind-electricity producing countries also affect the neighbouring countries. Figure 25 shows the wind feed-in in the German grid and the corresponding cross-border exchange for each hour of the year 2008. When the wind feed is above approximately 5,000 MW, Germany becomes an electricity exporter, but for values below this threshold the situation is more balanced. This clearly indicates that renewable energy production is no longer a national task but an issue for international electricity markets and requires international grid investments.
The European view of the TSOs will become even more important in of the context of implementing a high-voltage DC-grid in Europe, as is mentioned in the Desertec-development.
RES-E-related investment costs for regulating power plants
Due to forecast errors and the fluctuations of RES-E power production, the demand for reserve power both for up- and down-regulation will increase, especially compared to a situation where the same
energy is delivered by a continuously operating plant. In this case, power plants running at part-load (spinning reserve) and eventually additional investments in flexible power generation technologies like gas turbines are necessary.
Change of operation costs of conventional power plants and benefits caused by RES-E
The intermittent RES-E energy feed into the electricity system affects conventional power plant operators’ unit commitment and increases dependence on balancing energy to meet the total generation demand. This is especially true with regards to the notoriously inconsistent wind power. The need for up- and down-regulation can be met by using additional quick start capacity and conventional power plants running at part load (so-called spinning reserve).
More frequent start-ups of conventional thermal power plants forced by drops of RES-E power production result in increased fuel and maintenance costs. Running conventional thermal power plants at partial capacity reduces the efficiency factor and therefore increases the fuel
Figure 26 Dependence of German cross-border exchanges on wind feed-in for the year 2008. Source: Jürgen Neubarth, e3 consult, Austria

Roadmap towards a Competitive European Energy Market World Energy Council 2010
72
usage related to the electricity generated. Thus, the allocation of providing reserve power between standing and spinning plants is a trade-off between the additional costs of the operation of quick start capacity with typical high marginal costs and the costs of running a spinning power plant with efficiency losses. In power systems that are dominated by hydro power plants (for example, the Nordel power system), the needed balancing energy can be provided quickly and with low variable costs. However, the replacement of fossil-fuel-based electricity production with RES-E power production saves fuel and reduces CO2 emissions.
Principles for the treatment of grid connection and reinforcement costs
The further expansion of renewable energy production should be coordinated with future development plans for the European grid. In this context, it is important to carefully consider where to build renewable electricity production plants. They should be located places that will minimise the costs for the grid development or vice versa. The existing grid reinforcement plans can indicate the good sites for renewable production.
The following are possible payment methods for the costs of grid connection and the reinforcement borne by the RES-E power producer and the TSO or DSO: Shallow connection method: The RES-E power producer only has to pay for the grid connection, but not for a possible grid extension. If grid extensions beyond the connection point and at higher voltage levels are necessary, they have to be paid by the corresponding TSO or DSO:
• Shallow connection method: The RES-E power producer only has to pay for the grid connection, but not for a possible grid extension. If grid extensions beyond the connection point and at higher voltage levels are necessary, they have to be paid by the corresponding TSO or DSO.
• Deep connection method: The RES-E power producer pays for the necessary grid reinforcements that result from the connection of a RES-E power plant. In other words, the RES-E power producer has to pay for grid adjustments beyond the point of connection and at higher voltage levels.
Table 11 Grid connection cost parameters for EU-15 countries. Source: Knight et al.,2005
Country Cost allocation approach
Level of transparency
Published connection Cost calculation methods?
Austria Deep Low No Belgium Shallow High Yes Denmark Shallow High Yes Finland No standard Medium No France Shallowish Medium No Germany Shallow Low No Greece Deep Low No Ireland Deep High No Italy Deep Low No Luxembourg Deep Low No Portugal Deep Medium No Spain Deep Low No Sweden Deep Low No The Netherlands Shallow High Yes United Kingdom Shallowish High Yes

Roadmap towards a Competitive European Energy Market World Energy Council 2010
73
Table 12 Goals for the renewable share in the total energy supply for EU member states. Source: Renewable Energy Focus.com
RES share (final consumption) 2005
Target for RES share 2020
Member State GHG limits by 2020, compared to 2005 GHG emission for non - ETS
Belgium 2.2% 13% -15%Bulgaria 9.4% 16% 20%Czech Republic 6.1% 13% 9%Denmark 17.0% 30% -20%Germany 5.8% 18% -14%Estonia 18.0% 25% 11%Ireland 3.1% 16% -20%Greece 6.9% 18% -4%Spain 8.7% 20% -10%France 10.3% 23% -14%Italy 5.2% 17% -13%Cyprus 2.9% 13% -5%Latvia 34.9% 42% 17%Lithuania 15.0% 23% 15%Luxembourg 0.9% 11% -20%Hungary 4.3% 13% 10%Malta 0.0% 10% 5%Netherlands 2.4% 14% -16%Austria 23.3% 34% -16%Poland 7.2% 15% 14%Portugal 20.5% 31% 1%Romania 17.8% 24% 19%Slovenia 16.0% 25% 4%
Slovak Republic 6.7% 14% 13%
Finland 28.5% 38% -16%Sweden 39.8% 49% -17%
United Kingdom 1.3% 15% -16%

Roadmap towards a Competitive European Energy Market World Energy Council 2010
74
• Shallowish connection method: With this
method the grid reinforcement costs are split between the RES-E power producer and the TSO or DSO. This can be difficult because there is no common regulation for the subdivision of these costs.
In some countries, the connection charges are set independently of the actual costs by a public regulator.
Principles for the distribution of regulating power costs
The RES-E power producer is generally the cause of electricity imbalances, but the TSO or DSO normally shoulders the burden of balancing electricity production within its balance area. Therefore, the costs of regulating power are usually borne by one of these two actors.
If the TSO or DSO has to bear the occurring costs of regulating power, those costs will be socialised by transmission or distribution system charges. When the RES-E power producer bears the costs of regulating power, the EU methods essentially penalise the RES-E power producer with prices derived from the bids and offers from a regulated power market.
What Are the Current Status and the Future Goals for RES-E in Europe? The European Union’s goals for RES-E are defined in the so-called 20-20-20 package announced on January 10, 2007. In this package, the EU lays out its objective of achieving 20% RES on the supply side. The overall EU goal for RES (see Table 12) translates into specific RES-E shares for member countries. The potential increases for each country are detailed in Figure 26.
Conclusions It is impossible to envision the future of the European electricity without integrating renewable energy into the liberalised market structure. Renewables will certainly be an important part of the future generation mix in Europe, and the EU goals for renewable energy production will lead to renewables having a substantial market share by 2020 (estimates are 34%). These increases will have a notable impact on the wholesale electricity market.
One of the prerequisites for market integration is technical integration. The difference between supply and demand of electricity can only be
Figure 27 An estimate of how the EU RES-goals could be translated into EU RES-E goals. Source: EURELECTRIC

Roadmap towards a Competitive European Energy Market World Energy Council 2010
75
resolved via transport. Therefore, meeting energy demand is primarily a cross-border grid issue. Maintaining a strictly national view with regards to renewable energy is simply not realistic in this day and age.
Renewables, especially wind energy, need a European-wide grid for multiple reasons, including:
Reducing the impact of inconsistent renewable production
Easier access to balancing energy in the larger international market
Enhancing Europe’s security of supply
Renewable energy’s volatile production should lead to smaller price effects when balanced against a larger market area. Unfortunately, European grids still reflect the national electricity systems, and major investments are needed to develop into a truly pan-European grid. As a European grid develops, international coordination of regulatory bodies must also be improved and harmonised. This will not only benefit renewable promotion schemes but also grid access, balancing energy, liquid intra-day markets, and so on.
Research, Development and Deployment of Renewable Energy is and will continue to be necessary, but policymakers must also keep in mind that different technologies require different treatment. Some technologies like on-shore wind can produce electricity roughly in line with market prices. These technologies will become competitive without major government intervention. For these
technologies, a certificate market is a reasonable tool to help finance projects and to give incentives for investments. Other technologies, like photo-voltaic, are still in the early stages of development. In these instances, it might be preferable for states and the private sector to first fund additional research and to hold back on deployment for the time being. In this way, the EU will avoid a large-scale roll-out of a non-mature technology.
It is imperative that the European Union develop a roadmap outlining how the various national renewable promotion schemes in Europe will be harmonised and how they will be integrated into the existing regional electricity markets. As certain RES technologies become competitive, a market-based programme like the certificate scheme would likely incur the lowest macroeconomic costs.
The roadmap for the integration would consist of
Identifying the renewable technologies that are most advanced and closest to competitiveness
Integrating these technologies into an European-wide incentive system
Harmonising regulation, grid access, balancing energy, etc
This approach would also improve the competitiveness of the electricity market as a whole.

Roadmap towards a Competitive European Energy Market World Energy Council 2010
76
The development of the electricity market is a long-term project. Currently, the process is stalled because various obstacles are in the way. The stable, monopolistic, and country-oriented electricity markets are being reconsidered, but the new target of a European-wide liberalised electricity market has yet to be reached. The process has, quite simply, languished, and the longer the electricity market is in limbo, the more likely it becomes that the final goal will be jeopardised.
The transformation of Europe’s electricity market can be compared to converting a house. Imagine a small but well-functioning house that has to be extended and optimised, but the inhabitants must remain in the house and go about their daily lives during the transformation. As long as the transformation process is occurring, the inhabitants of this house are under significant stress, and naturally, they will take whatever steps possible to ensure that the transformation period will be minimised. If they have to stay in the transition period for a long time, they will inevitably lose their patience and will want to go back to the situation of their old house. Because of these inclinations, it might ultimately be possible to transform the house into a house that is bigger than the original but not as big as the initial vision. For the electricity market, the best way to offset concerns over a transition period will be to focus on first developing a regional market to show that market liberalisation is feasible.
One key challenge of liberalisation is a general mistrust in market systems. This mistrust has been increased by the current financial crisis. Another
obstacle is that the implementation of a European electricity market is taking a very long time. The final results will not come immediately, but unfortunately, there are politicians and consumers who are getting impatient.
Political Obstacles The electricity market competences have been in the past with the countries and in the meantime some of the competences have been shifted to the European level. The future liberalised electricity market will be a European market but if the European Union does not have a compatible political structure, this will present a problematic contradiction. This contradiction will be even more problematic during the transformation period from national to a European market. In an ideal world, political and market integration would go hand-in-hand. In reality, however, this is impossible.
The development of a competitive European electricity market requires strong and ongoing determination from all stakeholders, but the different interests of different nations (economic situation, industry structure, regulation, strategic interest, etc.) can make this difficult. The electricity market is a market oriented towards the long-term. The transformation of the electricity sector will require substantial time, whereas the political mandates are often as short as a single election cycle. Because the time horizons are so different, it is imperative that the integration of the electricity market finds ways to dovetail with political cycles.
Every step in the transformation process must comply with national and EU legislation. This not
Obstacles

Roadmap towards a Competitive European Energy Market World Energy Council 2010
77
only makes the process more complex but also more time consuming. This is a difficult contradiction, especially for consumers and politicians who want to see fast and tangible results.
Technical Obstacles Overall, the European grid has many bottlenecks. With higher energy demand, these bottlenecks will only get worse, largely due to the tendency of shifting production to further away places and especially due to the growing role of often inconsistent renewable electricity (wind and solar, in particular). The grid of today, which is primarily based on national grids, is not equipped to cope with the future requirements. New technical and economic concepts are required to make the transition to a truly European level.
Market Obstacles Currently, there is no clear European market design. As long as this remains undefined, it will be extremely difficult to move the liberalisation of the electricity market forward. It is important that all stakeholders are part of this process.
Also, the electricity industry will have to contribute to the market’s success. The industry needs to have a clear consensus on key aspects and the feasibility of different changes to the market. They have to openly and honestly inform all stakeholders about the possibilities, the options, and the consequences. They also have to have the courage to communicate unpopular aspects and to identify the instances where certain steps are not
feasible. This will help make the debate more practical and less idealistic.
Today, we have a more or less functioning CO2 market. The renewable market is interfering strongly into the CO2 market through CO2 abatement cost by technology. This interference has to be overcome to ensure that both markets can support each other and can work together to ensure market efficiency.
Various countries’ cost-based subsidy systems for renewable energy have already ensured the construction of some renewable energy facilities. For the beginning of the market, this has led to probably the most accelerated development of renewable energy. Renewable energy has now achieved a substantial market share and is already having a dramatic impact on conventional generation, the merit order, and the import/export balance of electricity. Furthermore, the production costs for many renewable technologies are becoming increasingly competitive, but the production volume of renewable energy compared to the amount of subsidies required are more and more burdensome for certain countries. This financial problem has to be solved by reducing production costs. However, the current cost-based subsidy systems are not pushing renewable costs down enough to have them fully integrated into more competitive systems.
Finally, the European Union should focus on technological development so that it can establish itself as a technological leader.

Roadmap towards a Competitive European Energy Market World Energy Council 2010
78
Recommendation 1 Start integration with a core-European market (CORE MARKET).
Looking at the current situation in the European electricity market, we propose starting with integration of regional markets, which might gradually merge and evolve towards a fully-integrated European market. One of the most likely outcomes is the creation of a core-European electricity market. Because of the numerous prerequisites for a country to take part in such an international electricity market, some countries are better poised to start the core-European market than others, specifically the regions defined by the ERGEG initiatives as Nordic and Central Western. A market region defined by the integration of the Nordic market with the Central Western European market is certainly a reasonable possibility. As this market develops, it will become attractive to other regions, and these other regions will gradually be integrated with the more developed regions. Although the recession might delay the development of this integration, it is crucial to at least start the integration as soon as possible. Of course, the core-European market design should be flexible enough to integrate other countries and regions.
The core market would consist of an extended geographical space with a well-balanced electricity mix and a large, liquid wholesale market. The benefits of this market region are numerous. First, the market access to a larger portfolio of power stations should enhance the efficiency of the wholesale market. Having increased competition in the market should benefit consumers. If national
and international transmissions are at a sufficient level, there are also macroeconomic benefits, since a larger portfolio of consumers in the grid means fewer investments are needed for balancing power. Moreover, hydro generation in this newly established region will help balance intermittent wind power (assuming a strong improvement of the grid capacity). Improved grid capacity is needed for the transport of electricity, balancing energy, and to transport wind energy from production centres to demand centres. Indeed, this improved capacity will not only reduce balancing costs, it will also facilitate the further development of renewables. If the region has a harmonised, market-oriented promotion scheme, the core-European market will also demonstrate the macro-economic benefits of liberalised markets by finding the most efficient solutions.
If one assumes that the core-European market consists of Austria, Belgium, Denmark, Finland, France, Germany, Luxemburg, the Netherlands, Norway, and Sweden, then total electricity production would be slightly more than 1,700 TWh (according to production data for 2005, source: EURELECTRIC). This market would represent more than 50% of the EU-29’s production (the EU-29 refers to the EU-27 plus Norway and Switzerland). The neighbouring regions and countries including the Czech Republic, Poland, Italy, Switzerland, and Iberia can decide whether they will take part in this market, and if so, when. The large scope of the core-European market should make it attractive enough to motivate other countries to participate. Adding the latter six countries and regions would result in a market
Roadmap and Recommendations

Roadmap towards a Competitive European Energy Market World Energy Council 2010
79
amounting to almost 80% of the EU-29’s production.
Recommendation 2 The core-European market has to establish a set of common rules valid for the region, according the 3rd package provisions and the guidelines/market codes following the 3rd package approval, and it must identify the requirements for the other regions and countries to join the core market.
In order to make this core-European market work, a basic set of common rules has to be defined. These basic rules will deal with regulatory issues, TSO issues, and market design. They should be strict enough to standardise the market but also flexible enough to eventually allow non-member countries to participate in the market. Countries that want to access the market after the core-European market has already been established will benefit from a well-defined core market and from clear prerequisites for participation. With these processes and requirements clearly defined, countries can develop clear national roadmaps for joining the core-European market. In the current situation, no clear target structure is identified, and as a result, it is sometimes difficult for countries to know in which direction to develop.
In this process all stakeholders (power industry, TSO, EU and national bodies, regulators, consumers, etc.) have to be involved and to give as much practical input as possible. Such widespread collaboration will minimise frictions during the implementation phase.
A clear and understandable description of the targets and the steps to achieve these targets are indispensable. This is crucial for communication.
Recommendation 3 Grid development in Europe is important for improving competition in Europe and for technically integrating renewables into the market system (GRID AS AN ENABLER ALSO FOR RENEWABLES).
Grid enhancement is essential to improving competition in the European electricity market. By 2010, ENTSO will propose a plan for the grid development over the next decade. To be meaningful, the ENTSO plan should describe its underlying assumptions about energy flows in Europe, take the increasing production amount of renewable energy into account, deduce the expected bottlenecks, and derive an investment plan. Grid investments will also be of utmost importance in meeting the EU’s 2020 RES-E target. For conventional electricity production, grid investments will be a fundamental in making decisions about power plant investments that take the price expectations in the new region into account.
The acceptance of the new transmission lines is critical to improving the grid. The TSOs need more political support to overcome local resistance against transmission lines and to communicate the benefits of the new lines to the public.
Roadmap towards a Competitive European Energy Market World Energy Council 2010
80
Recommendation 4 The European electricity industry has to have a seat at the table (STAKEHOLDER DIALOGUE).
A competitive market will only work if all stakeholders are involved in the discussion about the future market and the steps in-between. The European power industry is a key player in this future, and therefore, it must take part in all relevant discussions. Electricity producers have often played a reactionary role, responding to developments if and only if the external forces are strong enough. The sector should outline a clear strategy for increasing competition followed by intense communication about this strategy. Fortunately, the lead electricity industry association, EURELECTRIC, is already deeply involved in the works of the Project Coordination Group, as are other stakeholder associations like ENTSO, EUROPEX, and EFET.
Recommendation 5 Specific recommendations for South East Europe Region, the last defined regional perimeter.
The South East Europe region is characterised by controversy. There are many similarities in terms of historical background, industry development, energy legislation, strong dependence on Russian generation technologies, and the strong dependence on local suppliers and contractors for transmission grid development. However, there are also significant differences related to operational standards and practices.
This region’s top goal is to prioritise investments in generation and transmission infrastructure. The region has indicated strong interest in renewable generation, particularly in wind. The region also has the potential for hydro to enhance the energy and ancillary services deliveries. That said, the countries in the region must become aware that the sector restructuring process should be conducted on both a national and regional level. This is especially true for small countries with extremely small power systems. This has to initiate the idea and the subsequent initiative for South East European (SEE) regional electricity market.
In order to set up a regional energy market, some major obstacles have to be overcome. A first step in the development of an SEE market will be the introduction of state-level wholesale markets. Besides the existing viable Romanian electricity market, which meets the main European model requirements, there are other countries in the newly defined perimeter of the SEE region such as Bulgaria, Serbia, and Greece that have yet to meet their full potential for market opening and competitive structure building. The others must finalise the restructuring process in the power sector.
Main targets for the market opening are the unleash of the generation capacity for the market competition through VPPs if the ownership structure will not change, the more liquidity given by the day-ahead national markets and their integration, as well as incentives for the eligible consumers to use the eligibility rights in order to switch to another supplier. In order to guarantee harmonised development of the relevant electricity

Roadmap towards a Competitive European Energy Market World Energy Council 2010
81
markets, the Commission is currently drafting a proposal on standard market design. The market design should also include a basic structure for the development of a wholesale market in the area. The main features of a proposed design are a contracts-based market with day-ahead trading, administration by a single regional market operator, and simple (non-market) arrangements for balancing. The process mirrors the EC endeavours for gradual integration of in the EU national electricity markets into a regional and ultimately pan-European market.
Recommendation 6 Need to speed up integration of the Central Eastern market
The Pentalateral Forum in the Central Western European market has been successful in the development of the market. In the Central East, however, the progress has been very limited, mostly due to the failure of the Polish, Czech, Slovakian, Hungarian, and Slovenian’s to commit. We recommend that these countries, together with the Commission, begin the process undertaken in the Central Western markets and start making firm commitments for a regional market.

Roadmap towards a Competitive European Energy Market World Energy Council 2010
82
Technical Description of the Electricity Market
1. Institutions for Cross-border Market Development
Following the entry into force of the Directive and Regulation on cross-border trade, there are a variety of bodies with different responsibilities in the regulatory framework. They are detailed below.
The European Commission is responsible for ensuring overall compliance with the Directives and for determining whether Member States create the appropriate legal framework. It is also responsible for chairing the Regulatory Committee (“Comitology”), which will make decisions on cross-border issues under the Regulation.
Member States’ Governments are the voting representatives of the Comitology. They are also responsible for the correct application of the Directives and Regulation into national law.
National Regulators have considerable responsibility for setting up the framework for the functioning of the electricity market. They also provide considerable input through the European Group of Regulators for Electricity and Gas (EGREG). This enables them to make a substantive contribution to any proposals put before the Comitology and to other initiatives associated with a competitive energy sector.
Transmission System Operators have a key role in developing the European electricity market by providing the main technical input towards the formulation of new rules and guidelines. TSOs will have to ensure the day-to-day functioning of the electricity market, within a clear framework, harmonised at EU level, and consistent with the guidelines that come out of the Comitology procedure. It is expected that TSOs will harmonise
network security rules, grid codes, and access and tariff methodologies, thereby making trade within a region as easy as trade within a country or TSO control area.
In December 2008, the creation of the European Network of Transmission System Operators for Electricity (ENTSO-E) was announced. The 42 European Transmission System Operators responsible for running the highest voltage interconnected grid signed an agreement to establish this new organisation which could become the TSO organisation outlined by the 3rd internal market package. The new structure was put in place at the beginning of 2009, and the functions of the existing associations were transferred to the new entity shortly afterwards.
Power Exchanges are also likely to play a pivotal role in developing the Single European Electricity market by providing transparent, non-discriminatory access to electricity trading in the European Union and by insuring the proper functioning of electricity markets. Power exchanges provide their services within the framework approved by the regulators and the guidelines emerging from the Comitology. It is expected that power exchanges will harmonise trading arrangements so as to facilitate the final single electricity market objective.
Market Participants, and especially consumers, will need to be regularly consulted on the expected and actual effects of reform proposals. The Florence Forum is one existing venue for this type of information exchange, and it will continue to provide a place in which market participants can debate ideas and make practical suggestions before new procedures are put into practice. A broad platform for in-depth consultations between all of the above-mentioned bodies will help ensure the progressive development of the competitive market framework.
Annex 1

Roadmap towards a Competitive European Energy Market World Energy Council 2010
83
2. Definition of Market Power
Market power is usually defined as the ability to profitably alter prices away from competitive levels. In the European Union’s approach, Significant Market Power (SMP) is equated with the concept of dominance. A company therefore has SMP if it, alone or jointly with others, has the power to behave independently of competitors, customers, and ultimately consumers.
The exercise of market power in electricity markets may take several forms.
Quantity withholding: a reduction of the output that is being bid into the market for prices that are above the marginal cost of production of this output. This can be done through not bidding, de-rating, or declaring unit outages;
Economic withholding: bidding in prices higher than the competitive bid for a particular unit;
Transmission related strategies: creating or aggravating transmission congestion in order to raise prices in a particular zone or node.
These behaviours would, in principle, not be profitable in a competitive market, as they would result in a smaller market share without any additional revenue for the rest of the company’s portfolio.
Detecting and proving the existence of market power in electricity markets is not an easy task. Economists and regulators have not yet defined a generally accepted and standardised set of market power monitoring procedures. In the mean time, a range of tools, techniques, and measures have been resorted to around the world.
3. Role of Regional Markets
The reality of today’s electricity network is that Member States are not well interconnected. Additionally, certain countries have already adopted common, harmonised rules that, in some cases, go beyond those envisaged by the new package. Therefore, the development of regional markets containing Member States between which interconnection is reasonably strong may be a necessary interim stage. Within these regional markets, that should not be defined according to mere geographical criteria. A more developed harmonisation of the regulatory approach is expected. This includes the degree of market opening, determination of transmission tariffs, the rules for bilateral trading, and congestion management methodologies that involve standardised day-ahead and intraday markets. In some cases, the regulations governing balancing and ancillary services might also be harmonised to some degree. However, any such efforts need to take into account, for example, the different generation plant characteristics in Member States and the varying costs involved in implementing such measures.
However, this regionalisation may only occur to the extent that integration of markets is more rapid than that required. Eventually, it is expected that most rules will be standardised at EU level, and any artificial partitioning of the EU market will be avoided. It is expected that regional market areas will develop “organically” through co-operation between institutions in neighbouring markets.
Thus, the objective of a single internal market will not be compromised. Market arrangements that impede trade or distort competition between regions will be prohibited. In any case, all of the regional markets will be expected to follow the same path of development in order to facilitate eventual full integration.

Roadmap towards a Competitive European Energy Market World Energy Council 2010
84
4. Cross-border Trade
The overall goal is for the EU and wider markets to function in the same way as a national market. Eventually, all system operators should use the same assumptions and mechanisms to manage their networks, and network users should face a single interface. Greater cooperation between system operators across political and transmission network borders that is unencumbered by potential conflicting interests regarding other competitive market activities will be essential to achieving this objective.
Regarding tariffs, it is clear that for the medium term, an approach whereby tariffs for cross-border trade are a combination of different national tariffs schemes and where TSOs are compensated for transit and/or other cost inducing flows is the most sensible. However, in the longer term, a pan-European tariff mechanism may contribute to the further integration of markets.
The following specific objectives should be pursued in the context of regulation.
In the medium term
Inter-TSO compensation should provide suitable compensation between Member States for transit flows and some other cross-border flows;
Transmission charges on generators should be harmonised within a fairly narrow range with, and if appropriate, some locational signals should be introduced at the EU level;
Interconnection capacity should be allocated by non-discriminatory, market-based mechanisms consisting either:
- within regional markets, as a single common coordinated market-based mechanism which allows for both “market
coupling” that encompasses existing day-ahead and possibly intra-day spot markets via the adoption of a common timetable, as well as long term financial hedging; or
- between regional markets, specific market- based mechanisms which as far as possible allow for coupling of wholesale markets;
A high degree of transparency should be provided to network users, including the publication of necessary data relating to transport capabilities of interconnector lines. This is a crucial issue for enabling further third party access and new entry to markets.
In the longer term
both tariffs and inter-TSO compensation should be based on a single common model of the European network ultimately working towards zonal based transmission charges at EU level that cover losses and also potentially fixed investment costs,
Regional market areas may be served by a single wholesale market (allowing both day-ahead and within-day nomination), which would contain different price areas in the case of persistent congestion.

Roadmap towards a Competitive European Energy Market World Energy Council 2010
85
Assessment Tools of the Power Market
1. Fundamental underlying element for the assessment of market power
The geographic boundaries of the market do matter in the assessment of market power. Traditionally, two methods have been used to identify them: the classical “law of one price” test and the “small but significant non-transitory increase in price” (SSNIP) test.
1.1 “Law of one price” test
This test defines the market as the geographic area within which the same thing is sold for the same price at the same time, allowance being made for transportation costs.
1.2 SSNIP test
As stated in Wikipedia, the SSNIP test defines “a relevant market as something worth monopolizing. It is in fact a 'catalogue' of goods and/or services that are considered substitutes by the consumer and on which a supplier could profitably increase its price without its customers turning away. This test asks: if all the generators in a particular geographical location combined into a single company, could a price rise, say 5%, in that region be sustainable? It seeks to identify the smallest relevant market within which a hypothetical monopolist or cartel could impose a profitable significant increase in price. If sufficient numbers of buyers are likely to switch to alternative products and the lost sales would make such price increase unprofitable, then the hypothetical market should not be considered a relevant market for the basis of litigation or regulation. Another, larger basket of products is proposed for a hypothetical monopolist to control and the SSNIP test is performed on that relevant market.”
2. Simulation models
These methods attempt to simulate some aspects of the market for the purposes of ex-post comparison with actual market outcomes or ex-ante simulations of possible market outcomes.
Competitive benchmark analysis
The basic idea of competitive benchmark analysis is to develop an estimate of the market price that would result if all companies behaved as price-takers and to compare that price with the observed market price. This is usually done by collecting data on the generation technologies that are present in the market and then estimating a supply curve for each trading period by stacking generators from least expensive to most expensive.
As with the use of simple bid-cost margin, the major concern with this type of analysis is the simplification that is required in order to construct the marginal costs estimates. Examples of these simplifications include modelling in a static setting, not incorporating start-up costs or minimum load effects, and condensing the market into a single location with a single price. The danger is that these simplifications may in fact underestimate marginal cost by incorrectly incorporating the complexities of the real electricity market.
Oligopoly simulation models
These models explore market power by explicitly incorporating into one model many of the structural, behavioural, and market design factors that are related to market power: concentration, demand elasticity, supply curve bidding, forward contracting, and, in some cases, transmission constraints. Using a game theory framework, these models can be calibrated with cost data to predict the market prices or Lerner Index of a market with a given structure and design.
Annex 2

Roadmap towards a Competitive European Energy Market World Energy Council 2010
86
The most popular behaviour model is the Cournot competition under which companies choose their levels of output knowing that their strategy and the strategies of other companies will affect the market equilibrium. Another alternative is the Bertrand model of oligopoly in which participants choose prices to sell their output. Another approach considers that companies choose a “supply function relating their quantity of output to the market price but this may lead to a wide range of possible equilibriums.
The results of those models are quite sensitive to the level of forward contracting or demand; these are however recognised as being the result of an educated guess.
Equilibrium market models differ in many ways, including the market mechanisms modelled, the type of game assumed, fidelity to the physics of power transmission, and computational methods.
3. Techniques used for detecting market power
There are various methods used for detecting market power. They are shown on Table 13 and distinguish
- between ex-ante (looking for the potential for market power) and ex-post (looking for the actual exercise of market power) techniques and
- between long-term (those often applied in the context of merger analysis or market design evaluation) and short term (those applied close to the real time market, often in the context of immediately mitigating market conduct) analyses.
4. Structural indices
4.1 Market share
The market share concentration ratio is defined as the percentage of market share of the largest n companies in the industry. In this computation, the number of companies is normally four.
To compute this ratio, the relevant product needs to be identified. It can be energy production, energy plus reserves, short-term capacity, or long-term capacity. A time-dimension may also be needed given the non-substitution of electricity between different time periods.
In normal markets, European case law considers that there is a presumption of a lack of significant market power (SMP) if no company has a share greater than 25% and that a finding of SMP normally requires a market share of greater than 40%, with a share above 50% being presumptive of SMP.
Although popular, the market share test is not usually considered to be a useful test for electricity markets, which have very different characteristics from normal markets.
Table 13 Techniques for detecting market power.
Ex-ante Ex-post Long-term analysis Structural indices (market share,
HHI, residual supply index) Competitive benchmark analysis based on historical costs
Simulation models of strategic behaviour
Comparison of market bids with profit maximizing bids
Short-term analysis Bid screens comparing bids to reference bids Forced outage analysis and audits
Some use of structural indices such pivotal supplier indicator and congestion indicators
Residual demand analysis

Roadmap towards a Competitive European Energy Market World Energy Council 2010
87
Annex 3 Inventory of current support systems. Overview of the main policies for renewable electricity in the EU. Source: OPTRES, 2007
Annex 3

Roadmap towards a Competitive European Energy Market World Energy Council 2010
88 Annex 3 (cont.) Inventory of current support systems. Overview of the main policies for renewable electricity in the EU. Source: OPTRES, 2007

Roadmap towards a Competitive European Energy Market World Energy Council 2010
89
References
1. Energy Strategy Paper of the European Commission, Brussels, 01.03.2004;
2. Integrating Electricity Markets through Wholesale Markets: EURELECTRIC Road Map to a Pan-European Market, Brussels, June 2005;
3. UCTE System Adequacy Forecast 2007 - 2020, January 2007;
4. EURELECTRIC Annual Report –
EUROPROG 2007, Brussels, December 2007;
5. Current Status of the Power Sector in the
Balkan Region and Prospects for its Development till 2020, 7th Balkan Power Conference, 10 – 12 September 2008, Sibenik, Croatia.
6. European Electricity Regulations from the
Point of View of Investors, EURELECTRIC, April 2005
7. EU-Retail banking: Wie kann man
Integration messen? (How to measure integration?), Deutsche Bank Research EU-Monitor 63, 3rd March 2009
8. ERGEG; National Reports 2007 (Austria,
Belgia, Bulgaria, Czech Republic, France, Germany, Greece, Hungary, Ireland, Italy, Netherlands, Poland, Portugal, Romania, Slovakia, Slovenia, Spain, United Kingdom)
9. Baltrel, Annual Report 2007 (Denmark, Estonia, Finland, Latvia, Lithuania, Norway, Sweden)
10. ECRB, National Reports 2007 (Albania, Bosnia and Herzegovina, Croatia, Former Yugoslav Republic of Macedonia, Montenegro, Serbia)
11. U. Fahl, „Optimierter Klimaschutz – CO2-
Vermeidungskosten von Massnahmen im Vergleich“, in: N. Metz und U. Brill, Hrsg., Abgas- und Verbrauchsverringerungen – Auswirkungen auf Luftqualität und Treibhauseffekt, Haus der Technik Fachbuch Bd. 72, expert Verlag, Renningen 2006, S. 73 – 94.
12. OECD- Economic Survey of
SWITZERLAND 2007
13. EURELECTRIC 2007, EURELECTRIC, Benefits from Liberalisation: Update to EURELECTRIC-KEMA report confirms price reductions for customers (July 2007)


Albania Algeria Argentina Austria Belgium Botswana Brazil Bulgaria Cameroon Canada China Colombia Congo (Democratic Republic) Côte d'Ivoire Croatia Cyprus Czech Republic Denmark Egypt (Arab Republic) Estonia Ethiopia Finland France Germany Ghana Greece Hong Kong, China Hungary Iceland India
Indonesia Iran (Islamic Republic) Ireland Israel Italy Japan Jordan Kazakhstan Kenya Korea (Rep.) Kuwait Latvia Lebanon Libya/GSPLAJ Lithuania Luxembourg Macedonia (Republic) Mexico Monaco Mongolia Morocco Namibia Nepal Netherlands New Zealand Niger Nigeria Norway Pakistan Paraguay Peru
Philippines Poland Portugal Qatar Romania Russian Federation Saudi Arabia Senegal Serbia Slovakia Slovenia South Africa Spain Sri Lanka Swaziland Sweden Switzerland Syria (Arab Republic) Taiwan, China Tajikistan Tanzania Thailand Trinidad & Tobago Tunisia Turkey Ukraine United Arab Emirates United Kingdom United States Uruguay
Member committees of the World Energy Council

World Energy Council Regency House 1-4 Warwick Street London W1B 5LT United Kingdom T (+44) 20 7734 5996 F (+44) 20 7734 5926 E [email protected] www.worldenergy.org
For sustainable energy. ISBN: 0 946121 38 9