world economic and financial surveys regional economic outlook · publication orders may be placed...
TRANSCRIPT


W o r l d E c o n o m i c a n d F i n a n c i a l S u r v e y s
Regional Economic Outlook
. . . . . . . . . . . . . . . . . . . . . . . . . . . . . . . . .
18
I N T E R N A T I O N A L M O N E T A R Y F U N D
AP
R
Sub-Saharan AfricaDomestic Revenue Mobilization and Private Investment
. . . . . . . . . . . . . . . . . . . . . . . . . . . . . . . . .

©2018 International Monetary Fund
Cataloging-in-Publication Data
Regional economic outlook. Sub-Saharan Africa. — Washington, D.C.: International
Monetary Fund, 2003–
v. ; cm. — (World economic and financial surveys, 0258-7440)
Began in 2003. Some issues have thematic titles.
1. Economic forecasting — Africa, Sub-Saharan — Periodicals. 2. Africa, Sub-Saharan —Economic conditions — 1960 — Periodicals. 3. Economic development — Africa, Sub-Saharan — Periodicals. I. Title: Sub-Saharan Africa. II. International Monetary Fund. III. Series: World economic and financial surveys.
HC800.R4 2017 ISBN: 978-1-48433-398-62 (paper)
ISBN: 978-1-48434-889-5 (Web PDF)
Publication orders may be placed online, by fax, or through the mail: International Monetary Fund, Publication Services P.O. Box 92780, Washington, DC 20090 (U.S.A.)
Tel.: (202) 623-7430 Fax: (202) 623-7201 E-mail : [email protected]
www.imf.org www.elibrary.imf.org
The Regional Economic Outlook: Sub-Saharan Africa is published twice a year, in the spring and fall, to review developments in sub-Saharan Africa. Both projections and policy considerations are those of the IMF staff and do not necessarily represent the
views of the IMF, its Executive Board, or IMF management.

iii
ContentsAbbreviations ............................................................................................................................viAcknowledgments ................................................................................................................... viiExecutive Summary ...................................................................................................................ix1. Slow Recovery amid Growing Challenges ..............................................................................1
Macroeconomic Developments ...............................................................................................2Challenges and Risks .............................................................................................................10Policies ...................................................................................................................................14References ..............................................................................................................................30
2. Domestic Revenue Mobilization in Sub-Saharan Africa: What Are the Possibilities? .........31Trends in Revenue Mobilization in Sub-Saharan Africa ........................................................32Structural Factors Affecting Tax Effort and Potential ............................................................40Lessons from Successful Revenue Mobilization Episodes .......................................................42Conclusions and Policy Implications .....................................................................................48References ..............................................................................................................................58
3. Private Investment to Rejuvenate Growth ............................................................................59Private Investment Trends ....................................................................................................60Determinants of Private Investment Ratios ............................................................................... 62Alleviating Constraints to Private Investment ........................................................................65Conclusions and Policy Recommendations ...........................................................................73References ..............................................................................................................................87
Statistical Appendix ..................................................................................................................89Publications of the IMF African Department, 2012–18 .........................................................109Boxes1.1. Grappling with Rising Insecurities in the Sahel Region ............................................................. 181.2. Regional Spillovers: A Steady Strengthening of Diverse Linkages ............................................. 201.3. African Continental Free-Trade Area (AfCFTA) Agreement: What to Expect .......................... 221.4. CEMAC: Implementation of the Regional Economic Strategy and Road Ahead....................... 251.5. Protecting Social Spending in IMF-supported Programs ........................................................... 272.1. Looking ahead: Digital Revenue Mobilization .......................................................................... 502.2. Modeling the Economic Impacts of Revenue Mobilization in Resource-Rich
Sub-Saharan African Countries. ............................................................................................. 513.1. Policy Reform and Private Investment Growth ......................................................................... 743.2. Public Investment Efficiency in Sub-Saharan Africa .................................................................. 763.3. Developing Domestic Debt Markets in Sub-Saharan Africa ...................................................... 783.4. Fintech in Sub-Saharan Africa .................................................................................................. 80Tables2.1. Sub-Saharan African Revenue Mobilization Episodes: Background Information ...................... 442.2. Sub-Saharan African Revenue Mobilization Episodes: Timeline of Tax Policy and
Administrative Reforms .......................................................................................................... 453.1. Economic Impact on the Private Investment Ratio of a 1 Percentage Point Increase
in GDP Growth, Depending on Institutional and Structural Characteristics ......................... 64

CONTENTSREGiONAL ECONOMiC OUTLOOK: SUB-SAHARAN AFRiCA
viv
FiguresChapter 11.1. Business Cycle Synchronization between Sub-Saharan Africa and China,
European Union, and United States, 2001–16 ........................................................................ 21.2. Sub-Saharan African Frontier Market Economies: International Sovereign Bond Issuances,
2014–18 .................................................................................................................................. 31.3. Sub-Saharan Africa: EMBIG Spreads and Total Public Debt, 2015–17 ..................................... 31.4. Change in Selected Commodity Prices since 2013 ...................................................................... 31.5. Sub-Saharan Africa: Real GDP Growth, 2013–19 ..................................................................... 41.6. Sub-Saharan Africa: Number of Countries with Increasing Real GDP Growth, 2000–19 ........... 41.7. Sub-Saharan Africa: Share of Population Based on Real GDP per Capita Growth
Performance, 2016–18 ............................................................................................................. 41.8. Sub-Saharan Africa: Internally Displaced Persons, 2010–16 ....................................................... 51.9. Sub-Saharan Africa: Total Exports by Partner, 2000–16 ............................................................. 51.10. Sub-Saharan Africa: Current Account Balance Decomposition, 2011–18 ................................... 61.11. Sub-Saharan Africa: Current Account Deficit and Sources of Financing, 2011–18 ..................... 61.12. Sub-Saharan Africa: International Reserves, 2017 ....................................................................... 71.13. Sub-Saharan Africa: Overall Fiscal Balance, 2016–17 ................................................................. 71.14. Sub-Saharan Africa: Total Public Debt, 2011–17 ....................................................................... 81.15. Sub-Saharan Africa: Interest Expenditure, 2011–17 ................................................................... 81.16. Sub-Saharan Africa: Real GDP Growth Decomposition, 2014–18 ............................................. 91.17. Sub-Saharan Africa: Inflation, 2011–18 ...................................................................................... 91.18. Sub-Saharan Africa: Average Change in Base Money, 2016 and 2017 ........................................ 91.19. Sub-Saharan Africa: Depreciation of National Currencies against the US Dollar
from January 2017 to January 2018 ....................................................................................... 101.20. Sub-Saharan Africa: Interest Payments, 2011–17 ...................................................................... 101.21. Sub-Saharan Africa: Public Sector Debt Currency Decomposition, 2011–17 ........................... 111.22. Sub-Saharan Africa: External Debt Service, 2011–17 ................................................................ 111.23. Sub-Saharan Africa: Medium-Term Fiscal Plans, 2018–22 ...................................................... 111.24. Sub-Saharan Africa: External Arrears, 2017 .............................................................................. 121.25. Sub-Saharan Africa: Debt Risk Status for PRGT Eligible Low-Income Developing Countries,
2011–17................................................................................................................................. 121.26. Sub-Saharan Africa: Bank Nonperforming Loans to Total Loans, 2014–16 .............................. 131.27. Sub-Saharan Africa: Private Sector Credit Growth, 2016–17 .................................................... 131.28. Sub-Saharan African Oil Exporters: Fiscal Breakeven Oil Price, 2014 versus 2017 ................... 141.29. Sub-Saharan Africa: Real GDP per Capita Relative to the US, 1985 and 2000 ......................... 161.30. Sub-Saharan Africa: Real GDP per Capita Relative to the US, 2000 and 2017 ......................... 16Chapter 22.1. Sub-Saharan Africa: Total Revenue Excluding Grants, 1995–2016 .......................................... 332.2. Sub-Saharan Africa: Tax Revenue, 1995–2016 ......................................................................... 332.3. Sub-Saharan Africa: Nonresource Revenue to Nonresource GDP, 1995–2015 ......................... 332.4. Sub-Saharan Africa: Tax Revenue to GDP ............................................................................... 332.5. Sub-Saharan Africa: Sources of Revenue, 1995–2016 .............................................................. 332.6. Change in Revenue Excluding Grants ....................................................................................... 342.7. Total Revenue Excluding Grants, Median, 2016 ..................................................................... 342.8. Sub-Saharan Africa: Decomposition of Revenue, 2016 ............................................................. 342.9. Sub-Saharan Africa: Revenue, Oil Exporters, Median, 1995–2016 ........................................... 34

CONTENTSREGiONAL ECONOMiC OUTLOOK: SUB-SAHARAN AFRiCA
viv
2.10. Sub-Saharan Africa: Nonresource Revenue, Fragile and Nonfragile States, Median, 1997–2015............................................................................................................................. 35
2.11. Personal Income Tax Rate, Average Top Rate, 2000–16 .......................................................... 352.12. Corporate Income Tax Rate, Average Top Rate, 2000–16 ....................................................... 352.13. Sub-Saharan Africa: CIT Productivity and CIT to GDP, 2016 or Latest Available ................... 362.14. CIT Productivity, Average ....................................................................................................... 362.15. VAT C-Efficiency, Average ....................................................................................................... 362.16. Sub-Saharan Africa: CIT Productivity, 2016 or Latest Available ............................................... 372.17. Sub-Saharan Africa: VAT C-Efficiency, 2016 or Latest Available .............................................. 372.18. Sub-Saharan Africa: PIT Threshold Relative to per Capita GDP ............................................... 382.19. Sub-Saharan Africa: VAT Threshold Relative to per Capita GDP ............................................. 382.20. Excise Taxes, 2015, Average ...................................................................................................... 392.21. Sub-Saharan Africa: Excise Taxes, 2015 .................................................................................... 392.22. Sub-Saharan Africa: Share of Nonresource Revenue Collected at Customs, 2015 ..................... 402.23. Sub-Saharan Africa: Tax Efforts ................................................................................................ 412.24. Sub-Saharan Africa: Tax Frontier and Gap ............................................................................... 412.25. Non-Sub-Saharan Africa: Tax Frontier and Gap ....................................................................... 412.26. Sub-Saharan Africa: Tax Ratio and Tax Frontier....................................................................... 422.27. Sub-Saharan Africa: Nonresource Revenue Mobilization Episodes ............................................ 432.28. Sub-Saharan Africa: Nonresource Revenue Mobilization Episodes ............................................ 432.29. Progression of Tax Policy and Administrative Reforms ............................................................. 462.30. Revenue Mobilization Episodes and IMF Supported programs, 2001–16 ................................. 47Chapter 33.1. Poverty Headcount Ratio at $2 a Day in Purchase Power Parity Terms and Real Private
Investment Growth, 2000–16 ................................................................................................ 593.2. Selected Regions: Investment to GDP, 2000–16 ..................................................................... 603.3. Sub-Saharan Africa and Developing Economies: Real Investment Index, 2000–16 .................. 613.4. Sub-Saharan Africa: Average Growth of Real Private Investment 2010–14 and 2015–16 ........ 613.5. Selected Groups in Sub-Saharan Africa: Private Investment to GDP Ratios, 2000–16 .............. 613.6. Selected Groups in Sub-Saharan Africa: Contribution of Investment to GDP
Growth, 2006–16 ................................................................................................................. 623.7. Selected Countries: Real Private Investment Growth before and after Conflicts ....................... 623.8. Selected Regions: Corporate Financing, 2011–14 .................................................................... 663.9. Sub-Saharan Africa: Regulatory Capital Ratios and Firms Using Banks
to Finance Investment, 2011–14 .......................................................................................... 663.10. Sub-Saharan Africa: Bond and Equity Allocations .................................................................... 663.11. Selected Regions: Financial Development ................................................................................. 673.12. Sub-Saharan Africa: Safety and Soundness of Banking System and Financing of Investment .... 673.13. Selected Regions: Public-Private Partnership Investment as Share of GDP, 2000–16 ............... 683.14. Sub-Saharan Africa: Public-Private Partnership Investment to GDP by Country,
Average 2000–16 ................................................................................................................... 693.15. Sub-Saharan Africa: Public-Private Partnership Investment by Sector, 2000–16 ....................... 693.16. Selected Regions: Disputed and Cancelled Public-Private Partnerships to GDP, 2006-16 ........ 703.17. Selected Regions: Share of Disputed Projects 2006-16 and Benchmarking of Public-Private
Partnership Management 2016 ............................................................................................. 703.18. Selected Regions: Foreign Direct Investment ............................................................................ 713.19. Sub-Saharan Africa: Foreign Direct Investment by Country, Average 2000–16 ........................ 71

vi
AfCFTA African Continental Free Trade AreaAMU Arab Maghreb UnionBEAC Bank of Central African StatesBOAD West African Development BankCAPB cyclically adjusted primary balanceCBRs correspondent banking relationshipsCEMAC Economic and Monetary Community of Central AfricaCEN-SAD Community of Sahel-Saharan States CIT corporate income taxCOBAC Central African Banking CommissionCOMESA Common Market for Eastern and Southern AfricaDIGNAR debt, investment, growth, and natural resourcesEAC East African CommunityECCAS Economic Community of Central African StatesEMDEs emerging market and developing economiesEMEDEV all emerging market economiesFC financially constrainedFDI foreign direct investment FOCAC Forum on China-Africa CooperationGDP gross domestic productGMM generalized method of momentsIAD intergovernmental authority on developmentICRG International Country Risk GuideICT information and communication technologyICTSD International Centre for Trade and Sustainable DevelopmentIEFX Investor and Exporter Foreign ExchangeIOC Indian Ocean CommissionLPM local projections methodMENA Middle East and North AfricaNFC non–financially constrainedODA official development aidPIT personal income taxPPP public-private partnershipsP-FRAM PPP Fiscal Risk Assessment ModelPRGT Poverty Reduction and Growth TrustREC regional economic communitiesREO Regional Economic Outlook (IMF)ROA return on assetsSACU Southern African Customs UnionSADC Southern African Development CommunitySANRAL South African National Roads Agency LimitedSARB South Africa Reserve BankSDGs Sustainable Development GoalsSEZS special economic zonesSSA Sub-Saharan AfricaTFTA Tripartite Free Trade AreaVAT value-added tax WAEMU West African Economic and Monetary UnionWEO World Economic Outlook (IMF)
Abbreviations

vii
The April 2018 issue of the Regional Economic Outlook: Sub-Saharan Africa (REO) was prepared by a team led by Papa N’Diaye under the direction of David Robinson.
The team included Francisco Arizala, Romain Bouis, Paolo Cavallino, Chuling Chen, Reda Cherif, Xiangming Fang, Jesus Gonzalez-Garcia, Cleary Haines, John Hooley, Gabriel Leost, Miguel Pereira Mendes, Nkunde Mwase, Mustafa Yenice, Toomas Orav, Hector Perez-Saiz, Ashan Rodriguez, Manuel Rosales, Alex Segura-Ubiergo, Jaroslaw Wieczorek, and Ludger Wocken.
Specific contributions were made by Karim Barhoumi, Matthieu Bellon, Dalia Hakura, Nana Hammah, Thordur Jonasson, James Knight, Trevor Lessard, Margaux MacDonald, Edouard Martin, Giovanni Melina, Alice Mugnier, Garth Nicholls, Mathilde Perinet, Marcos Poplawski-Ribeiro, Ivohasina F. Razafimahefa, Sampawende J. Tapsoba, and Shirin Nikaein Towfighian.
Charlotte Vazquez was responsible for document production, with production assistance from Natasha Minges and Sarahalou Pilouzoue. The editing and production were overseen by Linda Long of the Communications Department.
Acknowledgments
The following conventions are used in this publication:
• In tables, a blank cell indicates “not applicable,” ellipsis points (. . .) indicate “not available,” and 0or 0.0 indicates “zero” or “negligible.” Minor discrepancies between sums of constituent figures andtotals are due to rounding.
• An en dash (–) between years or months (for example, 2009–10 or January–June) indicates theyears or months covered, including the beginning and ending years or months; a slash or virgule(/) between years or months (for example, 2005/06) indicates a fiscal or financial year, as does theabbreviation FY (for example, FY2006).
• “Billion” means a thousand million; “trillion” means a thousand billion.
• “Basis points” refer to hundredths of 1 percentage point (for example, 25 basis points are equivalentto ¼ of 1 percentage point).
Editor’s Note
April 30, 2018
Table SA24. External Debt, Official Debt, Debtor Based table on page 116 has been replaced; the new version includes revised figures for Senegal.


ix
Executive Summary
SLOW RECOVERY AMID GROWING CHALLENGES Sub-Saharan Africa is set to enjoy a modest growth uptick, but vulnerabilities have risen and action is needed to raise medium-term growth potential. Average growth in the region is projected to rise from 2.8 percent in 2017 to 3.4 percent in 2018, with growth accelerating in about two-thirds of the countries in the region aided by stronger global growth, higher commodity prices, and improved market access. External imbalances have narrowed, but progress with fiscal consolidation has been mixed and vulnerabilities are rising: about 40 percent of low-income countries in the region are now in debt distress or assessed as being at high risk of debt distress. On current policies, average growth in the region is expected to plateau below 4 percent—barely 1 percent in per capita terms—over the medium term.
Across countries, economic outcomes are far from uniform. Oil exporters are still dealing with the legacy of the largest real oil price decline since 1970, with growth well below past trends and rising debt levels; several other economies, both resource intensive and nonresource intensive and some fragile states, continue to grow at 6 percent or more, while a number of countries are suffering from internal conflicts, with record numbers of refugees and internally displaced people. The two largest economies in the region, Nigeria and South Africa, remain below trend growth, weighing heavily on prospects for the region.
Looking forward, the impetus from the favorable external environment is likely to fade. The current growth spurt in advanced economies is expected to taper off, and the borrowing terms for the region’s frontier markets will likely become less favorable, in step with the normalization of US monetary policy, which could coincide with higher refinancing needs for many countries across the region.
Turning the current recovery into sustained strong growth to improve living standards and meet social demands would require policies to both reduce vulnerabilities and raise medium-term growth prospects. Prudent fiscal policy is needed to rein in public debt, while monetary policy must be geared toward ensuring low inflation. And countries should also continue to advance structural reforms to reduce market distortions, shaping an environment that fosters private investment, and strengthen revenue mobilization to give governments the means to invest in physical and human capital, and protect social spending, even during fiscal consolidation. Reform priorities and sequencing vary with individual country characteristics and strength of fundamentals.
• Oil-exporting countries should continue to adjust their fiscal position and advance economic diversification, taking advantage of the respite provided by the uptick in commodity prices, while taking credible measures to boost non-oil revenues and enhance the efficiency of public spending. Countries that opted for exchange rate flexibility need to eliminate foreign exchange restrictions and multiple currency practices and allow their exchange rate to adjust to reflect economic fundamentals.
• Oil-importing countries, which have experienced rapid growth on the back of large public investment outlays but at the cost of rising debt, must aim to transfer the growth momentum from the public to the private sector and reduce fiscal imbalances to lower vulnerabilities that could threaten the achievement of sustainable growth over the medium term.
The risks to the outlook for the region depend on the decisiveness of policy actions. The uptick in oil prices, impending elections, and political transitions in many countries may reduce appetite for difficult reforms and could lead to further policy slippages. In addition, protracted internal conflicts continue to cloud the outlook

REGIONAL ECONOMIC OUTLOOK: SUB-SAHARAN AFRICA
x
in several countries. At the same time, the regional outlook could significantly strengthen on the back of an improved business environment and strengthened confidence. This will occur, if the uncertainties in countries undergoing political transition dissipate and countries that are still in need of adjustment make decisive progress toward macroeconomic stabilization.
DOMESTIC REVENUE MOBILIZATION IN SUB-SAHARAN AFRICA: WHAT ARE THE POSSIBILITIES? Domestic revenue mobilization is one of the most pressing policy challenges facing sub-Saharan African countries. Nearly all countries are seeking to raise revenues to make progress toward their Sustainable Development Goals while preserving fiscal sustainability. Despite substantial progress in revenue mobilization over the past two decades, sub-Saharan Africa is still the region with the lowest revenue-to-GDP ratio. Examining structural factors that account for this underperformance, it is estimated that the region could, on average, mobilize between 3 and 5 percent of GDP in additional tax revenues—significantly more than what the region has received each year from international aid. Key steps would be to strengthen value-added tax systems; streamline exemptions; and expand coverage of income taxes. Case studies of successful revenue mobilization episodes in the region highlight the importance of medium-term revenue strategies to strengthen the basic building blocks of effective tax administration; emphasizing efforts to broaden the tax base; and modernizing institutional processes. Developing new sources of taxation, such as property taxes, and harnessing new technologies that could facilitate access to more reliable information are also key. Moreover, since revenue mobilization is a process that needs to be sustained for years to have a durable impact, countries need to build a constituency for reform, based on a credible commitment to improved governance and transparency.
PRIVATE INVESTMENT TO REJUVENATE GROWTHIncreasing private investment is critical for the region to achieve sustainable strong growth and improve social outcomes over the medium term. While public investment in the region is at a similar level to other regions of the world, private investment in sub-Saharan Africa lags well below all other regions. Empirical work suggests that the strength of current and prospective economic activity plays a dominant role in driving private firms’ decisions to invest. Beyond that, strengthening the regulatory and insolvency frameworks, increased trade liberalization, and deeper financial markets could also help lift private investment. As such reforms take time, countries have pursued other avenues in an attempt to jump-start private investment, notably public-private partnerships (PPPs), special economic zones (SEZs), and mechanisms to attract foreign direct investment (FDI). PPPs have been widely used in the region, but these partnerships need to be considered carefully in view of the risks involved. Notably, proper management of PPPs requires the adoption of institutional and legal frameworks to assess and limit risks as such projects often entail sizable contingent liabilities. SEZs, while in some cases successful in attracting investors to the region, benefit their host economies more where they establish strong links with host country firms and become better integrated in the national and regional development strategies. Recent international initiatives (for example, the G20 Compact with Africa and the Belt and Road Initiative) potentially provide another opportunity to support private investment in sub-Saharan Africa, including by fostering the institutional reforms to encourage FDI and PPPs.

1
Sub-Saharan Africa is set to enjoy a modest growth uptick. The average growth rate in the region is projected to rise from 2.8 percent in 2017 to 3.4 percent in 2018, with growth accelerating in about two-thirds of the countries in the region. The growth pickup has been driven largely by a more supportive external environment, including stronger global growth, higher commodity prices, and improved market access. While external imbalances have narrowed, the record on fiscal consolidation has been mixed and vulnerabilities are rising: about 40 percent of low-income countries in the region are now assessed as being in debt distress or at high risk of debt distress. On current policies, average growth in the region is expected to plateau below 4 percent—barely 1 percent in per capita terms—over the medium term, highlighting the need for deliberate actions to boost growth potential.
Recent growth performance has been far from uniform. Several economies (Burkina Faso, Côte d’Ivoire, Ethiopia, Ghana, Guinea, Rwanda, Senegal, Tanzania)—a mix of resource-intensive and non-resource-intensive economies—grew 6 percent or faster in 2017 and are expected to maintain robust growth over the medium term. At the other end of the spectrum, 12 countries, home to about a third of sub-Saharan Africa’s population, saw per capita incomes decline in 2017, and most of these countries are expected to see further declines in 2018. A number of countries are facing internal conflicts (Burundi, Democratic Republic of the Congo, South Sudan), resulting in record levels of refugees and internally displaced people, with adverse spillovers to neighboring countries. Nigeria and South Africa, the two largest economies in sub-Saharan Africa and its main economic engines, have been stuck in low gear and are weighing heavily on the region’s overall growth.
External positions have strengthened, reflecting both global developments and in some cases improved policy frameworks. Better terms of trade contributed to the narrowing of the current account deficits in most resource-intensive countries, but demand compression also played an important role
in some countries. Record-low spreads prompted a surge in Eurobond issuances by the region’s frontier markets. Stock markets, fueled by portfolio inflows, were buoyant in the region’s economic hubs. Exchange rate pressure subsided in some countries seeing increased foreign exchange rate flexibility (Angola) and new foreign exchange measures (Nigeria).
Debt levels have continued to rise. Oil exporters have now, mostly, put in place policies to respond to the deep macroeconomic imbalances stemming from the historically large adverse terms-of-trade shock of 2014, but the delayed adjustment and magnitude of the shock have resulted in sharply elevated debt levels. Many other countries continue to rely on public-investment-driven growth, with rising debt levels. The associated balance sheet weaknesses are limiting the extent of the recovery, as shrinking fiscal space, rising debt, slowing private sector credit, and increasing nonperforming loans are exacerbating vulnerabilities in many countries.
Recent political developments in South Africa and Zimbabwe bode well for the economic policy environment, but lingering political uncertainties in many countries, including in those dealing with internal conflict or heightened terrorism, are deterring investment and dampening growth prospects.
Looking forward, the favorable external environ-ment is expected to fade over time. The current growth spurt in advanced economies is expected to taper off, and the borrowing terms for the region’s frontier markets will likely become less favorable, in step with the normalization of US monetary policy and an eventual return of global asset price volatility, which could coincide with higher refi-nancing needs for many countries across the region.
Thus, turning the current recovery into durable growth calls for domestic policy steps to both reduce vulnerabilities and raise medium-term growth potential. The former should be anchored on sustained fiscal discipline to prevent excessive
1. Slow Recovery amid Growing Challenges
This chapter was prepared by a team led by Jaroslaw Wieczorek, coordinated by Francisco Arizala and composed of Reda Cherif, Xiangming Fang, and Cleary Haines.

REGIONAL ECONOMIC OUTLOOK: SUB-SAHARAN AFRICA
2
public debt accumulation and monetary policy geared toward low inflation. With the recent respite provided by the cyclical rebound in commodity prices, resource-intensive countries should guard against the temptation to defer reforms. Achieving the latter involves structural policies to reduce market distortions, shaping an environment that fosters private investment, and strengthening revenue mobilization, so that governments can invest in physical and human capital and protect social spending, even during fiscal consolidation.
Risks to the medium-term outlook for the region are associated with the decisiveness of the policy response. There are upside risks to the subdued medium-term growth prognosis for countries where policy uncertainty or lack of adjustment has delayed macroeconomic stabilization.
The issue of how to enhance domestic revenue mobilization is the focus of Chapter 2. Through a combination of empirical work and country case studies, the chapter highlights the importance of appropriate tax policy implemented by effective revenue administration institutions, and emphasizes the contribution of improved governance and corruption control to stronger revenue mobilization.
The critical role of private investment in ensuring sustainable growth over the medium term is examined in Chapter 3. Private investment in sub-Saharan Africa has remained markedly lower than in other regions. Empirical analysis highlights the importance of strengthening the regulatory and insolvency frameworks, increasing trade liberaliza-tion, and deepening access to credit. These institu-tional changes will take time, and the chapter also looks at other avenues countries have taken in an attempt to jump-start investment—such as public-private partnerships, special economic zones, and mechanisms to target foreign direct investment.
MACROECONOMIC DEVELOPMENTSA More Supportive External Environment
The external environment for sub-Saharan Africa has further improved, with a stronger global recovery and easier financing conditions for the region’s frontier markets. Commodity prices have also increased, providing some relief to oil exporters and other resource-intensive countries.
Global growth has been accelerating on a broad base. The world economy is estimated to have grown by 3.8 percent in 2017 and is expected to accelerate to 3.9 percent in 2018, reflecting stronger-than-expected growth in major advanced economies, especially in the euro area—and in the United States, partly thanks to the recently approved tax reform. Growth in China is also projected to remain solid. The improved growth prospects in all three areas provide a positive stimulus to growth in sub-Saharan Africa, given the correlation between their business cycles (Figure 1.1).
Global financial conditions remain accommoda-tive, prompting a strong rebound in international sovereign bond issuance and sharp compression in yield spreads. Some of the region’s frontier economies (Côte d’Ivoire, Nigeria, Senegal) issued a total of $7.5 billion in 2017, 10 times the level seen in 2016 and a record high. This rapid pace of issuance continued in the first quarter of 2018—Kenya, Nigeria, and Senegal issued sovereign bonds in the amount of $6.7 billion, and several countries stated their intention to issue at least an additional $4.4 billion during the second quarter of 2018 (Figure 1.2). The global search for yield and increased appetite for sovereign bonds of the region’s frontier markets are also reflected in much narrower spreads, both in absolute terms—sub-Saharan African frontier markets’ spreads are half of what they were at their peak of about 900 basis points in 2016—and relative to emerging markets as an asset class, where the premium has narrowed from almost 600 to about 150 basis points.
Figure 1.1. Business Cycle Synchronization between Sub-Saharan Africa and China, European Union, and United States, 2001–16
0.0
0.1
0.2
0.3
0.4
0.5
China European Union United States
Corre
lation
coeff
icien
t 2001–07 2008–16
Sources: IMF, World Economic Outlook database; and IMF staff calculations. Note: Correlations of cyclical components in real GDP derived from Hodrick-Prescott filter.

1. SLOW RECOVERY AMID GROWING CHALLENGES
3
Remarkably, between 2015 and 2017, spreads compressed even for countries with high debt-to-GDP ratios (Figure 1.3).
The strong investor interest is also captured in increased portfolio inflows into some, but not all, countries in 2017. Sharp increases in inflows were observed in Ghana, Nigeria, and Senegal, but levels were low relative to the recent past in Kenya and Zambia, where no Eurobonds were issued in 2017. A similar differentiation among economies is seen in the performance of regional stock markets: between April 2017 and the end of January 2018, stock market indices grew by about 10 percent in South Africa, 40 percent in Kenya, 60 percent in Ghana, and 70 percent in Nigeria, but fell in Senegal, where most of the record level of portfolio inflows were directed into Eurobond issuances.
Commodity prices have strengthened since mid-2017, providing a terms-of-trade boost to sub-Saharan African commodity exporters (Figure 1.4). Oil prices rose by about 20 percent between August 2017 and mid-December 2017 to more than $60 a barrel. In addition, there were sizable increases in the prices of metals (aluminum, copper, iron ore) and agricultural raw materials (cotton, tea, vanilla), although some items (cocoa) witnessed price drops. With the notable exception of oil and iron ore, the prices of most commodities are now projected to approach, regain, or exceed their 2013 highs by 2020.
Growth Performance Is Far from Uniform
While sub-Saharan Africa is seeing a modest growth uptick, the average growth rate in the region remains close to zero on a per capita basis and well below historical trends for most country groups. Growth is expected to rise from 2.8 percent in 2017 to 3.4 percent in 2018 (Figure 1.5). While more than half of the expected pickup reflects the growth rebound in Nigeria, 29 of 45 countries are expected to see growth accelerate in 2018—the highest number since 2010 (Figure 1.6). Excluding the two largest economies (Nigeria and South Africa), growth in the rest of the region is foreseen to pick up from 4.6 percent in 2017 to 4.8 percent in 2018. Nevertheless, in 2017, income per capita is
Figure 1.3. Sub-Saharan Africa: EMBIG Spreads and Total Public Debt, 2015–17
–250–200–150–100
–500
50100
0 20 40 60 80 100Chan
ge in
EMB
IG sp
read
s 201
5–17
, ba
sis po
ints
Total public debt 2015, percent of GDP
Selected emerging market economies Sub-Saharan Africa
Sources: Bloomberg Finance, L.P; and IMF, World Economic Outlook database.Note: EMBIG = Emerging Markets Bond Index Global.
Figure 1.2. Sub-Saharan African Frontier Market Economies: International Sovereign Bond Issuances, 2014–18
0
2
4
6
8
10
12
2014 15 16 17 18¹
Billio
ns of
US
dolla
rs
Planned issuancesActual issuances
Source: Haver Analytics.Note: Sub-Saharan African frontier market economies include Angola, Cameroon, Republic of Congo, Côte d’Ivoire, Ethiopia, Gabon, Ghana, Kenya, Mozambique, Namibia, Nigeria, Senegal, Tanzania, and Zambia.1 Data are as of March 2018.
Figure 1.4. Change in Selected Commodity Prices since 2013
–80
–60
–40
–20
0
20
40
Crud
e oil
Iron o
re
Copp
er
Coal
Cotto
n
Gold
Suga
r
Diam
onds Tea
Coco
a
Coffe
ePerce
nt ch
ange
from
2013
aver
age
Trough 201620172020 projection
Sources: IMF, Commodity Price System; and IMF Global Assumptions.Note: Besides oil, some of the main export commodities in the region are copper (Democratic Republic of the Congo, Zambia), iron ore (Liberia, Sierra Leone, South Africa), coal (Mozambique, South Africa), and gold (Burkina Faso, Ghana, Mali, South Africa, Tanzania).

REGIONAL ECONOMIC OUTLOOK: SUB-SAHARAN AFRICA
4
estimated to have declined in 12 countries, home to about 33 percent of sub-Saharan Africa’s population (320 million people) (Figure 1.7). And for most of those countries, prospects continue to suggest falling GDP per capita in 2018.
• Angola and Nigeria have seen some pickup inhydrocarbon production, but in both countriesnon-oil sector growth remained weak asbalance sheets are still being repaired. Growthin the oil-exporting countries of the CentralAfrican Economic and Monetary Community(CEMAC) in 2017 was negative, except inCameroon, benefiting from a more diversifiedeconomic base.
• The outlook for South Africa is set for a modestgrowth recovery. Growth is estimated to havereached 1.3 percent in 2017, reflecting mainly arebound in agricultural and mining output.In 2018, growth is projected at 1.5 percent.
• Growth in the rest of sub-Saharan Africa(excluding oil-exporting countries and SouthAfrica) is estimated to have reached 5.9 percentin 2017. Economic activity remains robust infast-growing countries, such as Côte d’Ivoireand Senegal, boosted by public investment andstrong agricultural production, and in Ghana,on the back of the expected increase in oilproduction.
• Economic activity in several countries in fragilesituations (Guinea, Guinea-Bissau, Madagascar)has been helped by a strong rebound incommodity prices (aluminum, cashews,vanilla). Political developments in Liberia,Togo, and Zimbabwe weighed on their growthin 2017, but the peaceful political transitionin Liberia and recent political changes inZimbabwe point to opportunities for strongeroutcomes.
• Countries affected by conflict are facingdramatic economic and humanitarian cost.Current or recent conflicts (Burundi, DemocraticRepublic of the Congo, South Sudan) havegiven rise to record levels of refugees anddisplaced people, with negative economicspillovers to neighboring countries. Theseconflicts and lingering terrorist activity in theSahel and parts of East Africa, have resultedin food insecurity and impaired progress onhuman development indicators (Figure 1.8)(Box 1.1).
As intraregional linkages steadily gain strength, intraregional spillovers—through trade, remit-tances, and banking channels—are also having an ever-larger impact on growth outcomes (Figure 1.9).
Figure 1.5. Sub-Saharan Africa: Real GDP Growth, 2013–19
–2–1
012345678
2013 14 15 16 17 18 proj. 19 proj.
Perce
nt
Sub-Saharan AfricaOil exportersOther resource-intensive countriesNon-resource-intensive countries
Source: IMF, World Economic Outlook database. Note: See page 90 for country groupings table.
Figure 1.6. Sub-Saharan Africa: Number of Countries with Increasing Real GDP Growth, 2000–19
05
1015202530354045
2000 02 04 06 08 10 12 14 16 18proj.
Numb
er of
coun
tries
Source: IMF, World Economic Outlook database.Note: Increasing growth refers to an improvement from the previous year.
Figure 1.7. Sub-Saharan Africa: Share of Population Based on Real GDP per Capita Growth Performance, 2016–18
51%33% 33%
49%67% 67%
2016 17 18 proj.
Nega
tiveg
rowt
h P
ositiv
e gro
wth
Source: IMF, World Economic Outlook database.

1. SLOW RECOVERY AMID GROWING CHALLENGES
5
The recent weak economic performance in South Africa has slowed growth in neighboring countries, but countries such as Côte d’Ivoire and Kenya—which have enjoyed sustained robust growth in recent years—have played a significant role in terms of demand for regional exports and as home to regional banking groups. The regional spillovers are likely to be transmitted through various channels, including intraregional trade (Southern African Customs Union (SACU) and West African Economic and Monetary Union (WAEMU) members), banking (Botswana), and remittances (Liberia, Togo) (Box 1.2). These regional ties are likely to become stronger over the medium term if the recently launched African Continental Free Trade Area (AfCFTA) further boosts regional integration and generates substantial long-term economic benefits for African countries (Box 1.3).
External Positions Have Strengthened
Current account deficits are estimated to have narrowed further in the region from an average of 4.1 percent of GDP in 2016 to 2.6 percent in 2017, although with significant dispersion, notably between oil exporters and importers (Figure 1.10). Most of the improvement in the current account stemmed from a compression in private sector demand.
For large oil exporters (Angola and Nigeria), external balances improved noticeably due to higher oil production, the recent uptick in oil prices, compressed imports, and foreign exchange measures (Nigeria). But non-oil exports remain weak. In the CEMAC, the current account deficit is estimated to have declined sharply from 13.8 percent of GDP in 2016 to 4.3 percent in 2017. The external adjustment has been particularly steep in the Republic of Congo, narrowing from a deficit of 74 percent of GDP in 2016 to about 13 percent in 2017, driven mainly by strong fiscal adjustment, the recovery in oil prices, and increased oil production. Elsewhere in the CEMAC, the narrowing of the current account deficit is explained by increased oil exports, some pickup in non-oil exports (Chad, Gabon, Equatorial Guinea), and lower non-oil imports (Cameroon, Gabon, Equatorial Guinea).
The external balances in most other resource-intensive countries appear to have improved in 2017 as well, reflecting a range of factors: weaker import growth (South Africa), stronger commodity exports and lower non-oil imports (Ghana), and import compression and a temporary increase in SACU receipts (Namibia). However, current account deficits have widened in several of those countries following deterioration in the terms of trade (Mali) or a drop in current transfers and income payments (Liberia).
In non-resource-intensive countries, current account deficits remained elevated in 2017 as a result of high food and fuel imports (Kenya), a combination of low exports and high capital goods imports (Ethiopia, Senegal), and increased imports related to public infrastructure projects (Uganda).
Figure 1.9. Sub-Saharan Africa: Total Exports by Partner, 2000–16
0
20
40
60
80
100
2000–07 2008–16 2000–07 2008–16 2000–07 2008–16
Oil exporters Other resource-intensive countries
Non-resource-intensive countries
Perce
nt of
total
expo
rts
Sub-Saharan Africa European Union United StatesChina Rest of the world
Figure 1.9. Sub-Saharan Africa: Total Exports by Partner, 2000–16
Source: IMF, Direction of Trade Statistics.Note: See page XX for country groupings table.
Source: IMF, Direction of Trade Statistics.Note: See page 90 for country groupings table.
Figure 1.8. Sub-Saharan Africa: Internally Displaced Persons, 2010–16
0
2
4
6
8
2010 11 12 13 14 15 16
Millio
ns of
perso
ns
Burundi Cameroon Central African Rep.Chad Congo, Dem. Rep. Congo, Rep. ofCôte d'Ivoire Kenya MaliMozambique Niger NigeriaSouth Sudan Zimbabwe Uganda
Source: United Nations High Commissioner for Refugees.

REGIONAL ECONOMIC OUTLOOK: SUB-SAHARAN AFRICA
6
Current account imbalances have increasingly been financed through portfolio investment inflows, helping to ease pressure on reserves (Figure 1.11). In particular, oil-exporting countries’ reserve levels increased in 2017 for the first time since 2013. For other resource-intensive countries, portfolio investment flows remained the major source of external financing. Non-resource-intensive countries, while experiencing net portfolio outflows, financed their deficits mainly through foreign direct investment.
External Buffers Remain Low
The improvement in current account balances in 2017 boosted international reserves in about half of the region’s economies (Figure 1.12). However, many countries maintained reserves barely at or below the traditional three-months-of-imports benchmark.
For oil exporters, the buildup of reserves reflected the recovery in oil prices and other idiosyncratic factors.
• In Nigeria, gross international reserves rose to a four-year high (more than $39 billion) at the end of 2017, favored by the improvement in the trade balance, sovereign and corporate bond issuances (including $4.8 billion in international bond issuances), swaps, portfolio, and other private and inflows.
• In Angola, foreign exchange reserves fell sharply in 2017 as the authorities maintained a peg to the US dollar ahead of the transition to a more flexible regime in early 2018.
• In the CEMAC, international reserves have started to recover as regional institutions (Bank of the Central African States (BEAC), Central African Banking Commission (COBAC)) have implemented supportive policies to rebuild reserves, and fiscal consolidation has taken place. The recent increase in oil prices, if sustained, could lead to faster reserve accumulation.
Figure 1.11. Sub-Saharan Africa: Current Account Deficit and Sources of Financing, 2011–18
–8–6–4–2
0246
Avg. 2011–13
16 17 18 proj.
Perce
nt of
GDP
Oil exporters
–6–4–202468
101214
Avg. 2011–13
16 17 18 proj.
Perce
nt of
GDP
Non-resource-intensive countries
–2–101234567
Avg. 2011–13
16 17 18 proj.
Perce
nt of
GDP
Other resource-intensive countries
-10010Avg 2011 13 Average 2014 16 2017Pe
rce nt of GD P
Direct investment Portfolio investment Reserve assets Others Errors and omissions Current account deficit
Source: IMF, World Economic Outlook database. Note: See page 90 for country groupings table.
Figure 1.10. Sub-Saharan Africa: Current Account Balance Decomposition, 2011–18
–20
–15
–10
–5
0
5
10
Avg. 2011–13
16 17 18 proj.
Perce
nt of
GDP
Non-resource-intensive countries
g p ,
–8
–6
–4
–2
0
2
4
Avg. 2011–13
16 17 18 proj.
Perce
nt of
GDP
Other resource-intensive countries
–30
–20
–10
0
10
20
30
Avg. 2011–13
16 17 18 proj.
Perce
nt of
GDP
Oil exporters
Oil trade balance Non-oil trade balance Services balance Income balance Current account balanceSource: IMF, World Economic Outlook database.Note: See page 90 for country groupings table.

1. SLOW RECOVERY AMID GROWING CHALLENGES
7
Elsewhere, easier access to international capital markets has also contributed to the buildup of reserves. In the WAEMU, after shrinking in 2016, international reserve coverage stabilized at about four months of imports at the end of 2017, helped by Eurobond issuances by Côte d’Ivoire, Senegal, and the West African Development Bank (BOAD).Meanwhile, in some countries, international reserves have dropped to alarmingly low levels. For example, South Sudan has reserves equal to only 0.1 month of imports, and in the Democratic Republic of the Congo and Zimbabwe, reserves cover only about 0.5 month of imports.
The Record on Fiscal Adjustment Is Mixed
While fiscal deficits widened for the region as a whole, from 4.6 percent of GDP in 2016 to 5.0 percent of GDP in 2017, there is significant variation across countries. Fiscal positions
deteriorated in the largest economies, but improved in most other countries (Figure 1.13). The improve-ment in fiscal positions reflected, in many cases, countries’ continued adjustment to the sharp oil price decline in 2014, the largest in real terms since 1970 (IMF 2016).
• The fiscal position of oil-exporting countriesdeteriorated by 0.7 percent of GDP, as wideneddeficits in Angola and Nigeria outweighed thenarrowing of deficits in CEMAC oil producers.The wider deficit in Angola stemmed fromweak revenues and some recovery in capitalspending, while in Nigeria the deficit increasedbetween 2016 and 2017, mainly on the back ofdoubling capital expenditure amid low revenuecollection. By contrast, CEMAC countriessubstantially reduced their fiscal deficits (from7.6 percent in 2016 to 3.5 percent in 2017)through revenue mobilization efforts (Chad)
Figure 1.12. Sub-Saharan Africa: International Reserves, 2017
–6–4–2
02468
10121416
BWA
MUS
NGA
COM
AGO
ZAF
CPV
UGA
TZA
RWA
SWZ
SYC
MOZ
KEN
MDG
LSO
NAM
STP
MLW
LBR
GMB
SLE
GHA
BDI
ETH
ZMB
ERI
GIN
ZWE
COD
SSD
WAE
MUCE
MAC
Month
s of im
ports
2017 Change 2016–17
3 months of imports
Sources: IMF, World Economic Outlook database; and country authorities. Note: See page 90 for country groupings and page 91 for country abbreviations tables.
Figure 1.13. Sub-Saharan Africa: Overall Fiscal Balance, 2016–17 Figure 1.13. Sub-Saharan Africa: Overall Fiscal Balance, 2016–17
–24–20–16–12
–8–404
Oil e
xpor
ters
AGO
Nige
riaSS
DCO
GGN
QCM
RGA
BTC
DOR
ICSL
EZW
EZM
BZA
FLB
RBF
ATZ
ACO
DGI
NCA
FNA
MGH
ANE
RML
IBW
ANR
ICLS
OBD
IBE
NCI
VET
HRW
AMD
GER
ISW
ZGM
BTG
OKE
NMW
ICO
MMO
ZUG
AGN
BSE
NMU
SCP
VST
PSY
C
Oil exporters Other resource-intensive countries Non-resource-intensive countries
Perce
nt of
GDP
2016 (red indicates deterioration in 2017)2016 (green indicates improvement in 2017)2017
Source: IMF, World Economic Outlook database.Note: ORIC = other resource-intensive countries; NRIC = Non-resource-intensive countries. See page 90 for country groupings and page 91 for country abbreviations tables.

REGIONAL ECONOMIC OUTLOOK: SUB-SAHARAN AFRICA
8
and cuts in capital expenditures (Cameroon, Equatorial Guinea, Gabon, Republic of Congo) and current spending (Cameroon, Gabon). Nevertheless, a sharp and protracted contraction in Equatorial Guinea, debt distress in Chad and the Republic of Congo, and unresolved arrears in the Central African Republic—not an oil exporter—and Gabon continue to strain fiscal positions in the CEMAC area (Box 1.4).
• In other large economies, fiscal deficitscontinued to widen following increased currentexpenditures and revenue underperformance(South Africa) and revenue slippages (Ethiopia).Other economies also experienced a deteriora-tion in their fiscal accounts in 2017, includingseveral resource-intensive (Burkina Faso,Liberia, Zambia, Zimbabwe) and non-resource-intensive countries (Burundi).
• In the WAEMU, fiscal positions remainedmore relaxed than anticipated as the buildupof reserves from recent issuances of Eurobondsappears to have blunted the momentum offiscal consolidation in the region. In 2017, onlyone member country met the overall fiscaldeficit convergence criterion (below 3 percentof GDP), and fewer than half are projected tomeet it by 2019.
• Nevertheless, several countries consolidatedtheir fiscal positions in 2017 both in the otherresource-intensive (Ghana, Mali, Namibia)and in the non-resource-intensive groups(The Gambia, Togo), including becauseof unintended underspending on capitalexpenditures (Uganda).
With fiscal deficits still large in many countries, debt levels have continued to rise (Figure 1.14). Compared to 2011–13, the median public debt level for all three country groups have significantly increased, especially in oil-exporting countries.
In part reflecting the recent debt buildup, the composition of public spending has shifted, with a marked increase in the share of interest payments. This shift in composition, reflected in either higher deficits or the diversion of resources away from more productive spending, has been particularly pronounced among oil-exporting countries. Average interest payments increased from 4 percent of expenditures in 2013 to 12 percent in 2017, owing notably to large increases in Angola, Chad, and Gabon (Figure 1.15). The proportion of interest payments in total spending has also increased among other resource-intensive countries and in many non-resource-intensive countries, partly because of the substantial increases in debt stocks (Côte d’Ivoire, Ghana, Namibia, Senegal, Seychelles, Togo, Uganda, Zambia).
Although fiscal deficits have widened across all country groups since 2015, the public-sector contribution to growth has evolved differently in oil-exporting countries than in other sub-Saharan countries. In the former, the collapse of oil revenues led to tighter government spending, which had a strong contractionary effect on growth in 2015–16 (Figure 1.16). By contrast, in other resource-intensive countries and in non-resource-intensive countries, public spending (on consumption and investment) continued to support growth.
Figure 1.15. Sub-Saharan Africa: Interest Expenditure, 2011–17
02468
101214
Oil exporters Other resource-intensive countries
Non-resource-intensive countries
Perce
nt of
total
expe
nditu
re Avg. 2011–13 2017
Source: IMF, World Economic Outlook database.Note: See page 90 for country groupings table.
Figure 1.14. Sub-Saharan Africa: Total Public Debt, 2011–17
15202530354045505560
Oil exporters Other resource-intensive countries
Non-resource-intensive countries
Media
n, pe
rcent
of GD
P Avg. 2011–13 2017
Source: IMF, World Economic Outlook database.Note: See page 90 for country groupings table.

1. SLOW RECOVERY AMID GROWING CHALLENGES
9
Inflation Pressures Have Receded
Regionwide, annual inflation fell from 12.5 percent in 2016 to just over 10 percent in 2017, and is expected to drop further in 2018 thanks to falling food prices and policy tightening by oil exporters (Figure 1.17).
Monetary policy played an important role in taming inflation in hard-hit oil-exporting countries. In Angola, monetary policy was tight for most of 2017 as reserve money contracted throughout the year, in step with the decline in net international reserves (Figure 1.18). This contributed to tapering inflation from 42 percent in 2016 to 26.3 percent in 2017. In Nigeria, tighter monetary policy also helped contain inflation, as open market operations were used to reduce excess liquidity. In the CEMAC, the BEAC maintained a tight monetary policy stance, increased its policy rate by 50 basis points in March 2017, and maintained strict control on bank refinancing. Monetary conditions also
remained tight in other countries facing high or accelerating inflation (Kenya).
By contrast, monetary policy has been accom-modative in countries where economic activity has weakened or inflation has been receding, including in countries that had experienced drought-related inflation spikes in 2016 and early 2017 (Rwanda, South Africa, Tanzania, Uganda ). In some cases, exchange rate movements have also contributed to easing inflation pressures and enabled a more accommodative policy stance (Rwanda, Zambia).
More Flexibility in Exchange Rate Systems
Exchange rate policies in Angola and Nigeria have shifted toward more flexibility—such as reduction of the number of foreign exchange windows in the case of Nigeria—helping lower external imbalances. In January 2018, Angola allowed the kwanza to depreciate by about 40 percent against
Figure 1.16. Sub-Saharan Africa: Real GDP Growth Decomposition, 2014–18
–10
–5
0
5
10
15
2014 15 16 17 18 proj.
Perce
nt
Oil exporters
–2–1
012345
2014 15 16 17 18 proj.
Perce
nt
Other resource-intensive countries
–5
0
5
10
15
2014 15 16 17 18 proj.
Perce
nt
Non-resource-intensive countries
Private consumption Private investment Public consumption Public investment Net exports Other GDP growth
Source: IMF, World Economic Outlook database. Note: See page 90 for country groupings table.
Figure 1.17. Sub-Saharan Africa: Inflation, 2011–18
02468
101214161820
2011 12 13 14 15 16 17 18 proj.
Perio
d ave
rage
, per
cent
Oil exportersOther resource-intensive countriesNon-resource-intensive countries
Source: IMF, World Economic Outlook database.Note: See page 90 for country groupings table.
Figure 1.18. Sub-Saharan Africa: Average Change in Base Money, 2016 and 2017
–25
–15
–5
5
15
25
35
45
BWA
AGO
NAM
ZMB
KEN
TZA
NGA
ZAF
RWA
STP
UGA
GIN
LSO
SYC
MOZ
MUS
GHA
SWZ
CPV
MDG
SLE
BDI
COD
CEMA
CW
AEMU
Perce
nt
2017 2016
Source: IMF, International Financial Statistics.Note: See page 90 for country groupings and page 91 for country abbreviations tables.

REGIONAL ECONOMIC OUTLOOK: SUB-SAHARAN AFRICA
10
the US dollar. With increased availability of foreign exchange, the parallel official exchange rate spread decreased from 150 to 100 percent. In Nigeria, the introduction of a new investor and exporter foreign exchange (IEFX) window in April 2017 and higher foreign exchange inflows—related to increased oil exports and portfolio inflows—have improved foreign exchange availability and helped narrow the parallel market exchange rate premium, from its 60 percent peak in February 2017 to 20 percent in early 2018.
Other countries experienced large movements in their exchange rates, including depreciations reflecting the deterioration of economic conditions (Democratic Republic of the Congo, Liberia) and appreciations (Mozambique—through a partial reversal of a large depreciation in 2016) (Figure 1.19).
CHALLENGES AND RISKSDebt Vulnerabilities Have Continued to Build Up
Public debt continued to rise in sub-Saharan Africa in 2017, despite the growth pickup and improved external environment. About 40 percent of Poverty Reduction and Growth Trust (PRGT) eligible low-income developing countries in the region are now in debt distress or at high risk of debt distress. Looking ahead, debt dynamics are susceptible to fiscal slippages, subdued growth outcomes, exchange rate depreciations, and tighter financing conditions.
The median level of public debt in sub-Saharan Africa at the end of 2017 exceeded 50 percent of GDP. Debt-to-GDP ratios deteriorated mainly due to large primary deficits and interest bills. Additional factors in some cases were negative growth (Chad, Republic of Congo, Equatorial Guinea); currency depreciations (The Gambia, Sierra Leone); reporting of previously undisclosed debt (Republic of Congo, Mozambique); and below-the-line operations, including the accumula-tion of arrears, incomplete recording of public transactions, operations of state-owned enterprises, and carryover of unspent appropriations above and beyond the annual budgetary process (Cabo Verde, Equatorial Guinea, Gabon, The Gambia, Senegal, Sierra Leone).
With rising debt stocks, interest payments have also been increasing, eating up a growing share of revenues (Figure 1.20). For sub-Saharan Africa as a whole, the median interest-payments-to-revenue ratio nearly doubled from 5 to close to 10 percent between 2013 and 2017, and for oil-exporting countries, it increased from 2 to more than
Figure 1.19. Sub-Saharan Africa: Depreciation of National Currencies against the US Dollar from January 2017 to January 2018
–15–10–5
05
10152025
SSD
AGO
NGA
SLE
COD
BWA
GHA
TZA
LBR
ZMB
GIN
ZAF
ETH
GMB
BDI
RWA
SYC
MDG
UGA
MWI
KEN
MUS
MOZ
Oil exporters Other resource-intensive countries Non-resource-intensive countries
Depr
eciat
ion of
natio
nal c
urre
ncies
ag
ainst
the U
S do
llar,
perce
nt
Sources: Bloomberg Finance, L.P.; and country authorities.Note: Positive indicates a depreciation. See page 90 for country groupings and page 91 for country abbreviations tables.
Figure 1.20. Sub-Saharan Africa: Interest Payments, 2011–17
0
5
10
15
20
2011 12 13 14 15 16 17
Perce
nt of
total
reve
nue
exclu
ding g
rants
Interquartile rangeSub-Saharan Africa medianOil exporters median
Source: IMF, World Economic Outlook database.Note: Shaded area refers to 25–75 percentile range.

1. SLOW RECOVERY AMID GROWING CHALLENGES
11
15 percent over the same period. The largest increases occurred in Angola, Benin, Chad, the Republic of Congo, Gabon, Mozambique, Nigeria, Swaziland, Uganda, and Zambia.
Increased reliance on foreign currency borrowing is another source of vulnerability. Foreign-currency-denominated public debt increased by about 40 percent from 2010–13 to 2017 regionwide (Figure 1.21) and accounted for about 60 percent of total public debt in 2017 on average. The recent increase partly reflects the rebound in Eurobond issuance by sub-Saharan African frontier markets. The share of foreign-currency-denominated debt varies from about 10 percent of total debt in South Africa to 100 percent in Comoros and Zimbabwe. While interest rates on foreign-currency-denom-inated debt are generally lower than domestic interest rates in sub-Saharan Africa, reliance on borrowing in foreign currency exposes debtor countries to exchange rate volatility, and heightens refinancing and interest rate risk.
The favorable external market conditions create an opportunity for improving the debt maturity structure and implementing other strategic debt management operations, but countries need to remain vigilant not to overborrow in a context of rising external debt service and gross financing needs (Figure 1.22). The increased availability of external financing should not detract countries from their medium-term fiscal plans (Figure 1.23).
Furthermore, with the rise in debt accompanied by an increasing share of commercial, domestic, and nontraditional sources, borrowing countries’ exposure to market risk has risen, with increased challenges for debt resolution in the countries that find their debt burdens difficult to manage.
Indeed, several countries, mostly resource-intensive countries in fragile situations, have accumulated external arrears (Figure 1.24). Debt sustainability has deteriorated among sub-Saharan African PRGT eligible low-income developing countries (Figure 1.25). As of the end of 2017, six countries have been assessed to be in debt distress (Chad, Eritrea, Mozambique, Republic of Congo, South Sudan, Zimbabwe). The previous moderate ratings for Zambia and Ethiopia were changed to “high risk of debt distress.”
Figure 1.21. Sub-Saharan Africa: Public Sector Debt Currency Decomposition, 2011–17
14 217
16 10 15 1827
23
32
15
2721
31 28
33
010203040506070
Avg.
2011
–13
2017
Avg.
2011
–13
2017
Avg.
2011
–13
2017
Avg.
2011
–13
2017
Sub-SaharanAfrica
Oil exporters Other resource-intensivecountries
Non-resource-intensivecountries
Simp
le av
erag
e, pe
rcent
of GD
P
Foreign currency debtDomestic currency debt
Sources: IMF, Debt Sustainability Analysis database; and IMF staff calculations. Note: See page 90 for country groupings table.
Figure 1.22. Sub-Saharan Africa: External Debt Service, 2011–17
0123456789
10
Oil exporters Other resource-intensive countries
Non-resource-intensive countries
Perce
nt of
GDP 2011–13
2017
Source: IMF, World Economic Outlook database.Note: See page 90 for country groupings table.
Figure 1.23. Sub-Saharan Africa: Medium-Term Fiscal Plans, 2018–22
–1
0
1
2
3
4
5
Oil exporters Other resource-intensive countries
Non-resource-intensive countries
Cumu
lative
chan
ge, p
erce
ntage
point
s of
GDP
Noncommodity revenueCurrent primary expenditureCapital expenditureFiscal consolidation
Sources: IMF, World Economic Outlook database; and IMF staff calculations.Note: Excludes Burundi, Eritrea, and South Sudan due to data availability. See page 90 for country groupings table.

REGIONAL ECONOMIC OUTLOOK: SUB-SAHARAN AFRICA
12
While the causes of sliding into debt distress are country specific, most of the countries in debt distress are those in fragile situations or those facing adjustment to a very large shock to the price of their major export commodity.
Rising Nonperforming Loans Also Threaten Recovery
Although banking systems have been generally stable, with adequate capital and liquidity buffers, nonperforming loan ratios have surged across the region (Figure 1.26). The increases in nonperforming loans were particularly large among resource-intensive countries, where weak economic activity has translated into a decline in credit quality (Angola, Republic of Congo, Mozambique) and where government arrears have continued to affect the banking sector (Zambia). Nonperforming loans tend to be concentrated in a few banks (Angola and Nigeria) and, in several instances, have been incurred predominantly by public entities
(CEMAC). This is consistent with evidence that periods of declining commodity prices tend to be associated with deteriorating financial sector conditions in commodity-dependent countries, including higher numbers of nonperforming loans and more banking crises (IMF 2015a).
The broad-based deceleration in private sector credit growth raises additional concerns (Figure 1.27). In 2017, private sector credit growth was negative in real terms in many countries and, in several cases (Angola, Gabon, Zambia), it was negative even in nominal terms. With many factors at play simultaneously, in some countries demand-side factors predominated, with the private sector still struggling with the legacy of the crisis, while in other countries supply-side factors were more important, reflecting a combination of tight liquidity (WAEMU), government arrears (Gabon), high levels of nonperforming loans (Angola), crowding out by the public sector (Zambia), or interest rate controls (Kenya). The slowing down of private sector credit poses a threat to recovery in the affected countries, especially where fiscal space became constrained by the rising public debt burden.
In many of these countries, the government’s reliance on domestic banks to carry the rising public debt could crowd out the private sector and undermine banking sector stability. Besides tackling fiscal consolidation, these countries should address this emerging bank-sovereign nexus by rebalancing the incentives in place that favor holding government securities and discourage credit to the private sector (for example, tax deductibility and exemptions); implementing macroprudential measures to limit exposure to sovereign debt; and gradually tightening central bank refinancing of commercial banks (IMF 2017a). In the medium term, enhancing transparency in the corporate sector and reducing information asymmetry (for example, by implementing proper accounting standards, and setting up credit bureaus and property titling), and improving the resolution framework for banks would encourage exposure to the private sector.
Countries where rising nonperforming loans weigh on the recovery must take swift action to address rising vulnerability. The concentration
Figure 1.25. Sub-Saharan Africa: Debt Risk Status for PRGT Eligible Low-Income Developing Countries, 2011–17
12 12 12 116 6 6
11 13 14 1721 19
14
46 5 4 6 7
9
6 2 2 2 2 3 6
048
12162024283236
2011 12 13 14 15 16 17
Numb
er of
coun
tries
Low Moderate High DistressSource: IMF, Debt Sustainability Analysis Low Income Countries database.Note: Debt risk ratings for Cabo Verde begin in 2014 and for South Sudan in 2015. PRGT = Poverty Reduction and Growth Trust.
Figure 1.24. Sub-Saharan Africa: External Arrears, 2017
05
10152025303540
ZWE CAF COG MOZ
Perce
nt of
GDP
Source: IMF, World Economic Outlook database.Note: See page 91 for country abbreviations table.

1. SLOW RECOVERY AMID GROWING CHALLENGES
13
of credit should also be tackled where the rise in nonperforming loans has been driven by a few entities. In parallel, safeguards to address liquidity pressures in the banking sector, enhanced review of asset quality, and prompt recapitalization of weaker banks should help preserve the banking sector’s ability to lend to the private sector.
Fiscal Positions and Debt Dynamics Are Expected to Improve Gradually
In 2018, some fiscal consolidation is expected among non-resource-intensive countries, driven mostly by revenue mobilization efforts (Ethiopia, Lesotho, Mozambique) and cuts in current primary expenditures (The Gambia, Madagascar, Malawi). Similarly, but to a lesser extent, non-resource-intensive countries are expected to strenghten their fiscal positions, with planned increases in revenue mobilization and current expenditure cuts also creating some room for higher capital expenditures (Niger, Zimbabwe). Among oil-exporting countries,
in some cases, modest improvements in fiscal positions are expected to be driven by the pickup in oil revenue helped by price increases and the recovery of production (Nigeria).
The planned fiscal consolidation, together with a further pickup in growth, underlie an expected gradual reduction in debt over the medium term. If either factor fails to materialize, debt vulnerabilities could become more accute. The likelihood that envisaged fiscal consolidations will be implemented and sustained can be enhanced by paying careful attention to the distributional consequences of the adjustment and the need to protect priority spending—a key feature of recent IMF programs (see Box 1.5). Moreover, in designing the fiscal adjustment, preference should be given to measures with low short-term multipliers to mitigate the negative impact on growth with accompanying fiscal reforms to promote long-term growth (IMF 2015b, 2017b).
Figure 1.26. Sub-Saharan Africa: Bank Nonperforming Loans to Total Loans, 2014–16
05
101520253035
SLE
CAF
GNQ
LBR
MLI
NER
TCD
AGO
GHA
CMR
TZA
ZMB
GIN
GAB
BWA
ZAF
NGA
COG
NAM
SEN
MWI
BDI
MDG
SYC
SWZ
UGA
KEN
RWA
MUS
LSO
MOZ
Resource-intensive countries Non-resource-intensive countries
Perce
nt
2014 2017:Q3 or latest available
Sources: Country authorities; and IMF, International Financial Statistics.Note: See page 90 for country groupings and page 91 for country abbreviations tables.
Figure 1.27. Sub-Saharan Africa: Private Sector Credit Growth, 2016–17
–25
–15
–5
5
15
25
35
45
COD
ETH
CIV
BFA
SEN
MLI
MDG
SYC
LBR
RWA
SLE
GHA
TGO
NER
COM
SWZ
NGA
MUS
NAM
UGA
BWA
LSO
CPV
ZAF
CAF
TZA
CMR
KEN
GNQ
BEN
MWI
STP
ZWE
TCD
BDI
COG
GIN
MOZ
GAB
ZMB
AGO
GMB
GNB
12-m
onth
aver
age o
f yea
r-ove
r-ye
ar ch
ange
, per
cent
2016 average 2017 average or latest 12-month average
Sources: Country authorities; and IMF, International Financial Statistics.Note: See page 91 for country abbreviations tables.

REGIONAL ECONOMIC OUTLOOK: SUB-SAHARAN AFRICA
14
The Outlook for Oil Exporters Remains Challenging
Despite recent increases, oil prices remain too low to balance the budgets of most oil exporters. The break-even oil price, the theoretical price at which the budget is balanced for a given level of production, declined between 2014 and 2017 for all sub-Saharan African oil-exporting countries except Gabon and Nigeria.In most cases however, the break-even oil price is still well above the current and projected price of oil (Figure 1.28).1 The drop in the break-even oil price reflects the extent of fiscal consolidation—both reductions in expendi-ture envelopes and increases in nonoil revenues—as well as real depreciation vis-à-vis the US dollar. In Gabon and Nigeria, the increase in the break-even price can, in part, be explained by sizable drops in production volumes and, in the case of Gabon, also by an increase in government expenditure in real terms.
Risks to the Outlook
External risks. The expected monetary policy normalization in advanced economies could tighten financing conditions for many sub-Saharan African sovereigns, especially where public debt levels are already high, and often constrain the availability of financing for the private sector. Moreover, the recent surge in foreign portfolio investment to the region’s capital markets could be reversed. Weaker-than-expected growth in key advanced economies (for example, as a result of inward-looking policies gaining the upper hand) and large emerging market economies, especially in China, would reverberate throughout the region, affecting not only commodity prices and demand for commodity exports but also foreign direct investment inflows and other sources of financing.
Domestic risks. Political uncertainty and security challenges continue to weigh heavily on the economic outlook in some countries. Impending elections and political transitions in many countries may reduce appetite for difficult reforms and could lead to further policy slippages. While recent political developments in some countries (Angola, South Africa, Zimbabwe) could durably benefit the
1 The break-even price is harder to interpret for Cameroon, given that oil represents a relatively small share of government revenue —about 13 percent in 2017—a very high price of oil would be needed to balance the budget.
economic policy environment, continued policy uncertainty is dampening investment in many countries. In addition, lingering internal conflicts continues to be a latent risk in several countries (Burundi, Democratic Republic of Congo, South Sudan, and parts of the Sahel) bearing the socio-economic costs of the rising number of internally displaced people and refugees. Also, if economic conditions deteriorate, governments could be tempted by inward-looking policies, which would hinder growth. However, there is also a consider-able upside risk if the current uncertainties resolve in favor of an improved business climate, if the economies experience a larger-than-anticipated confidence boost, or if policy reforms advance faster than expected (Nigeria, South Africa).
POLICIESEnsuring Macroeconomic Stability
Ensuring macroeconomic stability is necessary to lay the groundwork for transforming the current recovery into sustainable growth. Prudent fiscal policy is needed to rein in the buildup of public debt, while monetary policy must be geared toward ensuring low inflation. Moreover, external buffers should be strengthened in countries that are well positioned to take advantage of the current global growth pickup and favorable external conditions. Beyond these general objectives, macroeconomic policies and supportive reforms should be tailored to sub-Saharan African countries’ structural char-acteristics and cyclical positions.
Figure 1.28. Sub-Saharan African Oil Exporters: Fiscal Break-even Oil Price, 2014 versus 2017
0255075
100125150175200225
CMR NGA COG AGO GAB TCD GNQ SSD Actualoil
price
US do
llars
a bar
rel
2014 2017
2020 proj. oil price
Sources: IMF, World Economic Outlook database; and IMF staff calculations.Note: See page 91 for country abbreviations table.

1. SLOW RECOVERY AMID GROWING CHALLENGES
15
• To achieve a sustainable growth pickup, oil-exporting countries should continue to adjusttheir fiscal positions and advance economicdiversification, taking advantage of the respiteprovided by the uptick in commodity prices.Boosting non-oil revenues and enhancingthe efficiency of public spending will also beessential to ensure macroeconomic stabilityover the medium term. Countries that optedfor exchange rate flexibility need to eliminateforeign exchange restrictions and multiplecurrency practices and allow their exchange rateto adjust to reflect economic fundamentals.
• The oil-importing countries, which have beengrowing on the back of large public investmentoutlays—often resulting in substantial debtaccumulation—must aim to hand over theinvestment momentum from the public to theprivate sector and reduce fiscal imbalancesto ensure sustainable growth over themedium term.
Revenue Mobilization to Reduce Debt Vulnerabilities and Build Fiscal Space
Sub-Saharan Africa has enormous needs in terms of infrastructure and social development. With debt vulnerabilities rising in the region, sub-Saharan African countries will need to further rely on sustainable sources of financing, making domestic revenue mobilization one of the most urgent policy challenges for the region. As discussed in Chapter 2, sub-Saharan African countries could mobilize about 3 to 5 percent of GDP in additional tax revenues in the next few years, making room for spending on infrastructure and human capital (Gaspar and Selassie 2017). Successful revenue mobilization efforts require an appropriate tax policy design—including the expansion of the base for value-added and direct taxes—implemented by effective revenue administration institutions. In addition, pursuing revenue administration reforms in the context of a medium-term plan is a strategy that has proved successful, even in countries starting from low-capacity implementa-tion. Moreover, policies targeting improvement in
governance and control of corruption, and ensuring efficient and transparent public spending, can go a long way in terms of motivating citizens to pay their fair share of taxes, ultimately favoring revenue mobilization.
Sustainable Growth Requires Reinvigorating Private Investment
With countries seeking to transition to sustainable growth paths, nurturing a dynamic private sector is a key priority. As discussed in Chapter 3, sub- Saharan Africa has historically the lowest level of private investment as a share of GDP among regions with similar levels of development. Policies should ensure that there is a favorable economic and institutional environment supported by high-quality infrastructure and a skilled labor force. Essential measures include ensuring macroeco-nomic stability, strengthening the regulatory and insolvency frameworks, increasing trade liberaliza-tion, and deepening access to credit. Innovative financing structures, such as public-private partnerships, can also be considered as long as an appropriate assessment of the contingent liabilities for the public sector is assured.
The Long-Term Challenge: Can Sub-Saharan Africa Catch Up?
Turning the current recovery into a sustainable growth spell is imperative to ensure a sustain-able improvement in living standards and social development indicators. Yet, under current policies, medium-term growth in the region is projected to fall far short of the levels experienced in the 2000s and, at the current rate of population growth, also well below of what is needed to lift the living standards of the region’s population.
Income convergence has proved an elusive goal for many countries. Between 1985 and 2000, most low-income sub-Saharan economies were unable to close the per capita income gap relative to the frontier (that is, the United States) and, in this respect, they were not very different from most other low-income comparator countries

REGIONAL ECONOMIC OUTLOOK: SUB-SAHARAN AFRICA
16
(Figure 1.29).2,3 But, in the 2000s, when growth accelerated in sub-Saharan Africa, most comparator countries from other regions achieved even higher growth rates. This enabled most of them to narrow significantly the income gap relative to the United States, which most sub-Saharan African countries have not been able to accomplish thus far and, on current projections, seem less well-positioned to accomplish in the years to come (Figure 1.30).
There have been many commonalities but also many differences between the economic strategies adopted by the sub-Saharan African countries and fast-growing low-income countries from other regions. During the high-growth years, sub-Saharan Africa was energized by the wave of trade and capital account liberalizations, a boom in commodity prices, and debt relief providing much-needed fiscal space. At the same time, the fast-growing comparators were less dependent on commodities and typically relied more on the easier trading and capital account environment to attract foreign direct investment in support of export diversification (mainly toward manufacturing) and structural transformation.
While many sub-Saharan African countries, especially those that are not resource intensive, have also achieved significant progress in export diversification and structural transformation, the region’s commodity exporters have seen increased specialization in exports of primary commodities (IMF 2017c). In fact, major oil discoveries explain several exceptionally high increases in GDP per capita (Angola, Chad, Equatorial Guinea, Nigeria). Nevertheless, some other sub-Saharan African countries—Burkina Faso, Ethiopia, Ghana, Rwanda, and Tanzania—have also achieved relatively high growth rates since the mid-1990s.4 Although they benefited directly or indirectly from higher commodity prices, their sustained high growth was not driven solely by the exploitation of natural resources.
2 These countries are Egypt, Indonesia, Sri Lanka, Morocco, the Philippines, Paraguay, Thailand, and Vietnam. They managed to grow from low-income to middle-income status without sizable commodity exports.3 Being above (respectively below) the 45-degree line indicates that an economy is converging (respectively diverging); the distance to the line indicates the speed of convergence (or divergence).4 The sample countries were chosen on the basis of average real output growth greater than 5 percent during 1995–2016 and real per capita GDP growth of more than 3 percent over the same period. Angola, Cabo Verde, and Equatorial Guinea also meet these criteria. Angola is excluded from the sample because it is heavily dependent on oil exports, while Cabo Verde and Equatorial Guinea are excluded due to the high volatility in their output growth.
Figure 1.29. Sub-Saharan Africa: Real GDP per Capita Relative to the US, 1985 and 2000
AGO
BWA
CIVCMR
COD
COGCPV
GHAKEN
NAM
NGASEN
SWZ
ZMB
ZWE
EGYIDNLKA
MARPHL
PRY
THA
VNM
0.00
0.05
0.10
0.15
0.20
0.25
0 0.05 0.1 0.15 0.2 0.25
Real
GDP
per c
apita
relat
ive to
US
in 20
00
Real GDP per capita relative to US in 1985Sub-Saharan Africa Non-Sub-Saharan African comparators
45 degree
Sources: Penn World Tables 9.0; IMF, World Economic Outlook database; and IMF staff calculations.Note: See page 91 for country abbreviations table.
Figure 1.30. Sub-Saharan Africa: Real GDP per Capita Relative to the US, 2000 and 2017
AGO
CIVCMR
COD
COG
CPV
GHA
KEN
NAM
NGA
SEN
SWZ
ZAF
ZMB
ZWE
EGYIDN
LKA
MAR PHL
PRY
VNM
0.00
0.05
0.10
0.15
0.20
0.25
0 0.05 0.1 0.15 0.2 0.25
Real
GDP
per c
apita
relat
ive to
US
in 20
17
Real GDP per capita relative to US in 2000Sub-Saharan Africa Non-Sub-Saharan African comparators
45 degree line
Sources: Penn World Tables 9.0; IMF, World Economic Outlook database; and IMF staff calculations.Note: See page 91 for country abbreviations table.

1. SLOW RECOVERY AMID GROWING CHALLENGES
17
The analysis of growth experiences in sub-Saharan Africa reveals many common characteristics. These include improved macroeconomic policies and stability, strong policymaking institutions, high investment in both physical and human capital, effective use of foreign aid, and deeper financial markets (IMF 2013). Sustaining growth in sub-Saharan African countries has been found to be associated with a supportive external environ-ment—whether better terms of trade or favorable global financial conditions—and improvements in the quality of institutions, as well as sound fiscal management to prevent excessive public debt accumulation, monetary policy geared toward low inflation, outward-oriented trade policies, and macro-structural policies to reduce market distor-tions at the domestic level (IMF 2017d). And, to the extent that the growth strategy is to be anchored on economic diversification, the right policy mix should be tailored to the country-specific circum-stances to tap the existing strengths—as illustrated by the success of Botswana—while enabling the private sector to expand.5
In this context, the challenge for sub-Saharan Africa is that growth models that proved successful elsewhere could become more difficult to emulate given current trends. The rapid robotization of manufacturing and the risk of a wave of inward-looking policies may make it more difficult for sub-Saharan African countries to compete in manufacturing. It is therefore of utmost importance to identify and resolve the obstacles and distortions that are holding back private sector activity in order to stimulate productivity growth whether it be in
5 Macroeconomic stability, access to credit, good infrastructure, a conducive regulatory environment, and a skilled workforce, are all associated with higher economic diversification (IMF 2017c).
existing sectors or in new sectors of the economy. In addition, the business environment should be improved by implementing reforms that foster governance, financial market deepening, and trade liberalization.
An additional challenge for sub-Saharan African countries aiming to emulate the successes in other regions is to harness the demographic dividend (IMF 2015c). The implications of current trends include a rapid increase in the working-age population and a demographic transition; in most other parts of the world, similar transitions have been associated with higher saving and investment, raising potential and current growth. However, to harness such a dividend, sub-Saharan African economies would have to create on average about 18 million jobs a year until 2035. Deliberate policies would be needed to encourage gradual structural transformation, allowing resources to move from the informal low-productivity sector to higher-productivity activities.
Finally, while a sustained acceleration in growth is important, it will not by itself result in the improved living standards and social outcomes that the region desires. The rapid growth in per capita income experienced in sub-Saharan Africa during 2000–14 has been accompanied by some progress in improving social outcomes—undernourish-ment rates have fallen from over 25 percent of the population to around 20 percent; poverty headcount rates have fallen from 60 to 40 percent; and school enrollment has increased by 60 percent. But much remains to be done.

REGIONAL ECONOMIC OUTLOOK: SUB-SAHARAN AFRICA
18
Box 1.1. Grappling with Rising Insecurity in the Sahel Region A surge in terrorism in the Sahel region (see Figure 1.1.1) compounds existing challenges for a subregion of about 150 million inhabitants that is already grappling with high rates of poverty, climate change vulnerability, and acute
shortages of physical and human capital. In addition to the human costs—roughly 30 million people are suffering from food insecurity and 5 million are refugees and internally displaced persons—the terrorist activities have resultedin increasing military and other security-related outlays. Accommodating the additional expenditure needs while ensuring macroeconomic stability and debt sustainability, and preserving fiscal space for other expenditures needed for high and sustainable growth is a major challenge. Key steps to address it include strengthening revenue mobilization, improving governance, and increasing the efficiency of public investment.
The incidence of terrorism in the Sahel region is high in both absolute and relative terms: the region experiences more than half of all attacks within sub-Saharan Africa and, except for the Middle East and North Africa, levels
of terrorism far greater than in other larger and more populous regions (Figure 1.1.2). Most countries in the Sahel region have experienced spikes in terrorist activity at different points in time, causing asynchronicities in fiscal and economic effects. And the general trend has been a rise in terrorist activity in recent years, most notably for the countries other than Nigeria. In 2017, for the first time, these countries together experienced more attacks than Nigeria (Figure 1.1.3).
The collapse of the Libyan government in 2011 helped arm extremist militant groups and weaken governance. Mali was the first country to be affected, and, despite the signing of the Algiers peace agreement in mid-2015 to formally end the conflict, attacks from jihadists continue to spill across borders to other Sahel countries. Niger, Chad and northern Cameroon also experienced attacks from Boko Haram in northeastern Nigeria, which have escalated in violence and displaced many people. Senegal and Mauritania, which have largely been spared from terrorist attacks, are the exception.
Increased terrorist activity imposes significant macroeco-nomic and fiscal costs. The share of military expenditure in public expenditure has been on the rise. At the same time, the commodity-producing countries in the Sahel have seen large falls in tax revenues as oil and uranium prices collapsed. Efforts to raise domestic nonresource revenues have been hampered by slowing economies and, particularly in the case of Niger, a fall in customs revenue following disruptions to traditional trade routes due to the conflict (Figure 1.1.4).
Figure 1.1.2. Selected Regions: Regional Distribution of Terrorism, 2010–16
0
20,000
40,000
60,000
80,000
Sub-
Saha
ran
Afric
a
Of w
hich:
G8Sa
hel
Midd
le Ea
st &
North
Afric
a
South
east
Asia
Euro
pe
Amer
icas
Numb
er
AttacksFatalities
Source: Global Terrorism Dataset.
Figure 1.1.3. Sahel Region: Incidence of Terrorism, 2011–17
0
200
400
600
800
2011 12 13 14 15 16 17
Numb
er of
incid
ents
G8 Sahel Sahel (excl. Nigeria) Nigeria
Sources: Control Risks; and IMF staff estimates.
This box was prepared by Dalia Hakura, Trevor Lessard, and Shirin Nikaein Towfighian.
Source: IMF staff.
Mauritania
Nigeria
Niger Chad
Cameroon
Burkina FasoSenegal
Mali Nige
Senegal
Figure 1.1.1. The Sahel Region

1. SLOW RECOVERY AMID GROWING CHALLENGES
19
Beyond the direct fiscal costs, the business environment has deteriorated, with most Sahel countries experienc-ing a sharper increase in terrorism-related business costs in recent years (Figure 1.1.5). At the same time, support from development partners has been declining (Figure 1.1.6).
Against this backdrop, Sahel countries need to continue to pursue their development agendas to achieve high and sustainable growth. Efforts should be centered on creating fiscal space for priority security, social, and infrastructure spending, which is essential for boosting long-term growth, ensure greater inclusion, and improve people’s livelihoods to break the cycle of extremism and violence. This will require strengthening domestic revenue mobilization and boosting the efficiency of public investment. Other actions to strengthen governance and transparency are also important. Meanwhile, given the vastness of the Sahel and the entrenched nature of security threats, a prolonged, calibrated, and coordinated expansion of security operations is envisaged as a comprehensive response to the Sahel crisis. The associated fiscal costs will continue to place a heavy burden on the ability of national authorities to deliver on their sustainable development goals.
Figure 1.1.4. Sahel Region: Military Spending and Fiscal Balance, 2013–16
–5
–4
–3
–2
–1
0
5
6
7
8
9
2013 14 15 16
Perce
nt of
GDP
Perce
nt of
total
expe
nditu
re
Military spending (left scale)Military spending - Sahel G8 excl. Chad (left scale)Overall fiscal balance (right scale)
Sources: IMF, World Economic Outlook database; Stockholm International Peace Research Institute; and IMF staff estimates.
Figure 1.1.5. Selected Regions: Business Costs of Terrorism, 2007–17
3
4
5
6
2007
-08
2008
–09
2009
–10
2010
–11
2011
–12
2012
–13
2013
–14
2014
–15
2015
–16
2016
–17
Scale
= 1
(wor
st) to
7 (b
est)
G8 Sahel¹Sub-Saharan AfricaLow-income countries
Source: Global Competitiveness Index.1 Data for Niger are not available.
Figure 1.1.6. Sahel Countries: Revenue and Official Development Aid, 2007–16
2
3
4
5
468
1012141618
2007 08 09 10 11 12 13 14 15 16
Perce
nt of
GDP
Perce
nt of
GDP
Tax revenue - Sahel oil-producers (left scale)Tax revenue - Rest of Sahel (left scale)Gross ODA (right sclae)
Sources: IMF, World Economic Outlook database; Organisation for Economic Co-operation and Development; and IMF staff estimates.Note: ODA = official development aid.
Box 1.1. (continued)

REGIONAL ECONOMIC OUTLOOK: SUB-SAHARAN AFRICA
20
Box 1.2. Regional Spillovers: A Steady Strengthening of Diverse LinkagesRegional spillovers in sub-Saharan Africa occur through a variety of channels, including trade, banking relations, remit-tances, and conflict (see Box 1.1). After close to two decades of strong economic activity, growth in sub-Saharan Africa decelerated markedly beginning in mid-2014, reaching its lowest level in 2016. While most economies that had suffered a slowdown appear to be rebounding, in some countries—including Nigeria and South Africa, the region’s largest economies—growth remains subdued. Assessing the strength and the pattern of reginal spillovers helps explain the extent to which the current economic conditions in the largest economies spill over to the rest of sub-Saharan Africa.
Regional trade linkages are steadily gaining strength. Regional trade represented 6 percent of total exports in 1980 before taking off in the early 1990s, and eventually reaching 20 percent in 2016 (Figure 1.2.1). These developments are partly explained by faster growth in sub-Saharan Africa compared to the rest of the world on average and partly by subregional trade agreements that have helped reduce tariff barriers and foster economic
integration. Most regional trade and improvements in trade integration have been taking place within, rather than between, zones of economic integration such as the SADC, the EAC, the WAEMU and the CEMAC.1 Nevertheless, compared with advanced economies, regional trade remains low, inhibited by weak infrastructure and transport linkages, misaligned regulatory regimes, and a preponderance of informal trade.
Trade linkages are a primary source of intraregional growth spillovers. Demand for regional exports is highly concen-trated, with 10 sub-Saharan African countries representing 65 percent of total regional demand for intraregional exports and a significant share of the exporting countries’ economies (Figure 1.2.2). Empirical work suggests a spillover of about 0.11 percent to a country’s GDP growth for every percentage point change in the growth of the trading partners (Arizala and others 2018). Thus, an economic deceleration in importing countries, especially large ones like South Africa, has the potential to weaken regional export demand and become a source of negative spillovers.
1 SADC is the Southern African Development Community; EAC is the East African Community; WAEMU is the West African Economic and Monetary Union; CEMAC is the Central African Economic and Monetary Union.
This box was prepared by Matthieu Bellon and Margaux MacDonald.
Figure 1.2.1. Sub-Saharan Africa: Intra-Regional Trade, 1980–2016
0
5
10
15
20
25
1980 82 84 86 88 90 92 94 96 98 2000 02 04 06 08 10 12 14 16
Perce
nt
Regional exports to total exportsRegional imports to total importsTotal regional trade to total trade
Sources: IMF, Direction of Trade Statistics; IMF, World Economic Outlook database; and IMF staff calculations.
Figure 1.2.2. Sub-Saharan Africa: Intra-Regional Trade, 2000–16
CPV
GNB
GMB
SYC
BDI
LBR
GIN
TGO
GNQ
GAB
MDG
BEN
RWA SLE
MUS
BFA
SEN
UGA
MWI
KEN
CMR
TZA
GHA
LSO
AGO
NGA
COG
MOZ
COD
CIV
SWZ
ZWE
ZMB
NAM
BWA
ZAF
Sources: IMF, Direction of Trade Statistics; IMF, World Economic Outlook database; and IMF staff calculations.Note: The thickness of the arrows refers to the size of bilateral exports in percent of GDP of the exporting country. The top 10 destinations are featured in red, the other countries in blue. See page 91 for country abbreviations table.

1. SLOW RECOVERY AMID GROWING CHALLENGES
21
Pan-African and subregional banks are increasingly active in sub-Saharan Africa and represent a second important spillover channel.2 Pan-African banks and subregional banks are highly concentrated, with banking groups based in South Africa, Togo, and Nigeria home to all pan-African bank assets and about 70 percent of subregional bank assets (Figure 1.2.3). These banks have primarily expanded across sub-Saharan Africa as subsidiaries, via the acquisition of smaller existing banks or, to a lesser extent, by establishing branches. The foreign subsidiaries are widely dispersed, and tend to have a larger presence in smaller countries, implying that any spillovers via banking groups could be far-reaching. Growth rates of the countries where banks are headquartered are correlated with credit growth in those countries where pan-African and
subregional banks operate. This could be explained by deposit sharing, syndicated lending, or reputational linkages between parent banks and their subsidiaries, if the subsidiary is systemically important in its host country.
Remittances between countries in sub-Saharan Africa are gaining in relative importance. Remittance inflows to sub-Saharan Africa have reached elevated levels in some countries. Furthermore, the contribution of regional remittances increased to one-third of the total in 2015. The origin of these flows is concentrated, with the top five senders accounting
for 55 percent of total outflows (Figure 1.2.4, left panel). Some recipient countries are substantially exposed to remittance inflows (Figure 1.2.4, right panel). Growth spillovers between countries linked through remittance flows are estimated to be of comparable strengh to those between trading partners (Arizala and others 2018). This suggests that West African countries, for example, can expect increased remittance inflows from fast-growing large remittance senders such as Côte d’Ivoire and Ghana.
2 Pan-African banks refer to sub-Saharan African banking groups majority owned and headquartered in sub-Saharan Africa and operating in 10 or more sub-Saharan African countries. Subregional banks refer to sub-Saharan African banking groups majority owned and headquartered in sub-Saharan Africa operating in between 3 and 10 sub-Saharan African countries.
Figure 1.2.3. Pan-African Banks and Sub-Regional Banks: Home and Host Countries, 2016
0
10
20
30
40
50
South Africa Togo Nigeria
Perce
nt
AssetsDeposits
05
101520253035
ZAF
TGO
KEN
NGA
BWA
MUS
GAB
CMR
Perce
nt
AssetsDeposits
010203040506070
LSO
CAF
BFA
GNB
BEN
MLI
SWZ
SEN
UGA
NAM
Perce
nt
AssetsDeposits
05
1015202530354045
SWZ
LSO
BWA
CAF
COG
TCD
SLE
TZA
ZMB
UGA
NER
Perce
nt
AssetsDeposits
PAB Home Countries(Percent of total PAB assets or deposits outside parent bank country)
Sub-Regional Banking Groups Home Countries(Percent of total SRB assets or deposits outside parent bank country)
PAB Host Countries(Percent of total domestic assets or deposits)
Sub-Regional Banking Groups Host Countries(Percent of total domestic assets or deposits)
Sources: Fitch Connect; IMF, International Financial Statistics; and IMF staff calculations.Note: PAB = pan-African banks; SRB = sub-regional banks. See page 91 for country abbreviations table.
Figure 1.2.4. Sub-Saharan Africa: Remittance Inflows and Outflows, 2010–15
0
5
10
15
20
25
LSO
LBR
TGO
MLI
SEN
UGA
STP
BEN
GMB
GNB
CPV
NGA
COM
KEN
MUS
Perce
nt of
GDP
Intraregional Interregional
02468
1012141618
CMR
CIV
TCD
GHA
ZAF
BEN
GAB
NGA
NER
KEN
Perce
nt of
total
regio
nal o
utflow
s
Share of total intra-regional remittances outflows Average remittances inflows
Source: World Bank, Migration and Remittances database. Note: See page 91 for country abbreviations table.
Box 1.2. (continued)

REGIONAL ECONOMIC OUTLOOK: SUB-SAHARAN AFRICA
22
Box 1.3. The African Continental Free-Trade Area (AfCFTA) Agreement: What to Expect
In addition to increased trade flow both in existing and new products, the recently launched AfCTA could generate substantial long-term economic benefits for African countries. These benefits include increased efficiency and productivity from improved resource allocation; higher cross-border investment flows and technology transfers; and deeper trade integration. To ensure these benefits, African countries will need to reduce their wide infrastructure gaps and improve the business climate. At the same time, measures should be taken to mitigate the differential impact of trade liberalization on certain groups as activities migrate to locations with comparatively lower costs.
Key Elements of the AfCFTA
On March 21, 2018, representatives of a large number of member countries of the African Union (AU) signed the African Continental Free Trade Area (AfCFTA) agreement.1 This agreement comes five years after the AU heads of state decided to move to the AfCFTA, and almost two years after negotiations began. Once fully implemented, the AfCFTA is expected to cover all 55 African countries, with a combined GDP of about $2.2 trillion (based on IMF, World Economic Outlook database) and a population of over 1 billion. The agreement will become effective once at least 22 member countries have ratified it. The AfCFTA builds on negotiations of the Tripartite Free Trade Area (TFTA), composed of the Southern African Development Community (SADC); Common Market for Eastern and Southern Africa (COMESA); and East African Community (EAC), and aims to achieve four objectives: (1) creating a continental customs union; (2) expanding intra-African trade; (3) resolving the challenges of overlapping memberships in regional economic communities (RECs); and (4) enhancing competitiveness. The AfCFTA also seeks to build on the level of integration attained by existing RECs, which are expected to contribute to its insti-tutional structure. In the long-run, the RECs’ trade functions are expected to be consolidated at the continental level.
Phase I of the AfCFTA agreement provides a framework for the liberalization of trade in goods and services, and a mechanism for dispute settlement. For trade in goods, the agreement sets the path for eliminating tariffs on 90 percent of product categories.2 For the remaining 10 percent of product categories, countries can implement tariff reductions over a longer period, in the case of sensitive goods, or maintain the same tariff, for excluded products. Member countries have also agreed to the liberalization of trade in services through a request-and-offer approach and based on seven identified priority sectors; logistics and transport, financial services, tourism, professional services, energy services, construction, and communications.3 Separate negotiations, which are expected to begin in late 2018, will be needed for Phase II of the AfCFTA. This phase will focus on competition policy, investment, and intellectual property rights.
Current State of Trade in Africa
The patchwork of intra-African trade agreements includes eight RECs, and four subregional groupings.4 Nonetheless, Africa conducts much of its export trade, dominated by commodities, with countries outside the continent.
1 See https://au.int/2 International Centre for Trade and Sustainable Development (ICTSD). https://www.ictsd.org/bridges-news/bridges-africa/news/talking-cfta-with-albert-muchanga-the-au%E2%80%99s-commissioner-for-trade.3 International Centre for Trade and Sustainable Development (ICTSD). https://www.ictsd.org/sites/default/files/research/trade_in_services_negotiations_digital_0.pdf.4 The regional economic communities are Arab Maghreb Union (AMU); Community of Sahel-Saharan States (CEN-SAD); Common Market for Eastern and Southern Africa (COMESA); East African Community (EAC); Economic Community of Central African States (ECCAS); Southern African Development Community (SADC); Economic Community of West African States (ECOWAS); and Inter-Governmental Authority on Development (IAD). The subregional groupings are Economic and Monetary Community of Central Africa (CEMAC); Indian Ocean Commission (IOC); Southern African Customs union (SACU); and Southern African Development Community (SADC). See Sebahizi (2017).
This box was prepared by Paolo Cavallino, Nana Hammah, Garth Nicholls, and Hector Perez-Saiz

1. SLOW RECOVERY AMID GROWING CHALLENGES
23
In 2016, 18 percent of Africa’s total trade was conducted within the continent. Much of it was driven by the SADC and the EAC, which had the highest levels of intraunion trade (over 20 percent of total trade) compared with other groupings (Figure 1.3.1). In 2015, manufactured goods accounted for only 19 percent of Africa’s exports to the rest of the world. At the same time, trade within Africa is dominated by manufactured goods, and financial and retail services.5 Tariffs and nontariff barriers among African countries remain high. For example, in 2016, the applied average most-favored-nation tariff for African countries, at 14.5 percent, was about twice that for the European Union.6 Furthermore, the maximum tariff rate on any product in sub-Saharan Africa was close to 400 percent, while the simple average tariff across all products was slightly less than 10 percent, and duty-free line items represented only 28⅓ percent of all tariff lines.7
Potential Benefits of the Agreement
African countries can overall expect to reap four key benefits from the AfCFTA. First, the AfCFTA is expected to invigorate intraregional trade. Mevel and Karingi (2012) estimate that the removal of all tariff barriers within the continent and a 50 percent reduction of nontariff barriers could increase intra-African trade by almost 130 percent within five years. Second, although the effect of greater trade integration on output is likely to be small in the short run, it has been estimated that the above changes, combined with improved trade facilitation, could increase their GDP by as much as 5 percentage points in 15 years (Chauvin and others 2016). Third, Anderson and others (2015) show that the dynamic interaction between growth and capital accumulation can increase the static gains from trade liberalization by more than 60 percent. Finally, the AfCFTA could be a stepping stone toward deeper trade integration. Mevel and Karingi (2012) estimate that the creation of a continental customs union, in addition to the AfCFTA, could increase African exports to the rest of the world by 4 percent within five years. But these potential gains are unlikely to be uniform as activity migrates to locations with comparatively lower costs within the region. Mitigating the differential effects would require countervailing measures (for example, training program for workers) to ensure a smooth reallocation of labor and capital. Furthermore, the elimination of tariffs will lead to significant tariff-revenue losses for governments at a time when fiscal positions need to be strengthened, suggesting the need for further progress in domestic revenue mobilization.
Nontariff Barriers to Trade in Africa
Despite the potential economic benefits of the AfCFTA, fully realizing these benefits would require a reduction in infrastructure gaps and an improvement in the business environment in Africa. Table 1.3.1 shows that several indicators related to the quality of ports, air transportation, and other measures of infrastructure efficiency are relatively low in Africa compared with other regions. The reduction of ground transportation costs is especially critical to encouraging intraregional trade, given the geographic configuration of the continent (World Bank 2009). The table also shows low scores for the region in terms of customs efficiency and other administrative procedures required for international trade.
5 United Nations Economic Commission for Africa (UNECA). https://www.uneca.org/stories/eca-urges-africa-push-ahead-continental-free-trade-area.6 World Trade Organization. https://www.wto.org/english/tratop_e/tariffs_e/tariff_data_e.htm.7 World Bank and United Nations Conference on Trade and Development – World Integrated Trade Solution (WITS). Trains https://wits.worldbank.org/CountrySnapshot/en/SSF/textview.
Figure 1.3.1. Sub-Saharan Africa: Intra-Regional Trade by Regional Economic Community
0
5
10
15
20
25
AMU
CEN-
SAD
COME
SA EAC
ECCA
S
ECOW
AS
IGAD
SADC
Perce
nt of
total
trade
20102016
Source: United Nations Conference on Trade and Development.Note: See page 90 for country groupings table.
Box 1.3. (continued)

REGIONAL ECONOMIC OUTLOOK: SUB-SAHARAN AFRICA
24
In addition, an enabling business environment is particularly relevant to facilitating intraregional trade. Various indicators compiled by the World Bank show room for improvement in decreasing the cost and time necessary to create new businesses. Finally, financial depth and inclusion is lower in Africa compared with other regions, so access to trade finance or bank funding to create or expand businesses will be key to promoting the AfCFTA agenda.
Box 1.3. (continued)
Variable Africa Sub-Saharan
Africa Advanced Economies
North America
South America
Central America Asia
Level of infrastructures: Container port traffic (WDI) 0.09 0.07 0.75 0.11 0.12 0.38 0.65Air transport passengers, per capita (WDI) 0.23 0.25 2.6 1.6 1.43 0.93 1.18Quality of port infrastructure,(1=low to 7=high) (WDI) 3.64 3.64 5.35 5.21 3.65 4.15 4.17Liner shipping connectivity index (WDI) 14.38 12.72 50.64 58.51 24.16 16.36 35.11Infrastructure efficiency score (LPI) 2.32 2.34 3.75 3.73 2.56 2.43 2.92Customs efficiency score (LPI) 2.35 2.39 3.58 3.53 2.52 2.5 2.88International shipments efficiency score (LPI) 2.52 2.52 3.56 3.4 2.76 2.81 3.01Timeliness efficiency score (LPI) 2.87 2.86 4.09 3.88 3.21 3.1 3.44Overall logistics efficiency score (LPI) 2.49 2.51 3.74 3.68 2.77 2.69 3.05
Trading costs: Burden of customs (1=inefficient to 7=efficient) (WDI) 3.6 3.6 5 4.6 3.5 3.7 4.3Time to export (days) (DB) 29.3 30.9 10.2 9.8 19.8 15.4 20Time to import (days) (DB) 36.4 38.5 9.3 9.7 24.3 15.3 21.6Cost to export (USD per container) (DB) 2,149 2,302 1,054 1,395 1,809 1,181 1,026Cost to import (USD per container) (DB) 2,819 3,056 1,102 1,570 2,020 1,329 1,092
Other: Start business (days) (DB) 31.2 33.3 11.2 6.5 72.4 26.9 30.5Start business (cost as % of income per capita) (DB) 69.7 74 4.1 7.2 27 39.8 24.1
Sources: World Bank, Doing Business Indicators; World Bank, Logistics Performance database; and World Bank, World Development Indicators.
Table 1.3.1. Barriers to Trade in Africa
Sources: World Bank, Doing Business Indicators; World Bank, Logistics Performance database; and World Bank, World Development Indicators.
Table 1.3.1. Barriers to Trade in Africa

1. SLOW RECOVERY AMID GROWING CHALLENGES
25
Box 1.4. CEMAC: Implementation of the Regional Economic Strategy and Road Ahead The national authorities and regional institutions of the Central African Economic and Monetary Community (CEMAC) have started implementing the regional strategy, adopted in December 2016 (See Box 1.2 in IMF 2017c) to help avert the depletion of international reserves and continue to support the monetary union arrangement. The member countries’ fiscal adjustment efforts—along with the regional central bank’s tight monetary stance and strict enforcement of foreign exchange regulations, external financing in support of the national programs, and higher oil prices—have contributed to stabilizing international reserve coverage, at 2.5 months of imports at the end of 2017 (Figure 1.4.1).This progress allowed for the completion of IMF program reviews with three CEMAC member countries (Cameroon, Central African Republic, Gabon) in December 2017. Reaching agreement on debt restructuring between the Chadian government and its external creditors paved the way for the conclusion of the IMF program review with Chad. Meanwhile, program negotiations with Republic of Congo and Equatorial Guinea are ongoing.
At the national level, fiscal consolidation efforts are underway, but risks remain. As envisaged at the outset of the regional strategy, these efforts focused primarily on cuts in nonpriority spending, with overall primary spending declining from 27.5 percent of non-oil GDP in 2016 to 22.8 percent of non-oil GDP in 2017. While this stream-lining will continue over the medium term, measures to increase non-oil revenue should play a more prominent role in fiscal consolidation starting in 2018. Also, most of the windfall from higher oil revenues following the recent increase in international oil prices would need to be saved and used to increase fiscal and external buffers or to accelerate the repayment of domestic budgetary arrears relative to program assumptions. Overall, fiscal consoli-dation efforts would provide for a reduction of the overall fiscal deficit (excluding grants) across CEMAC member countries from 4.2 percent of GDP in 2017 to 0.7 percent of GDP in 2020, while preserving social protection programs (Figure 1.4.2). This adjustment will in turn allow both for the repayment of budgetary arrears and, along with the gradual recovery in nominal growth, for a gradual reduction in public debt ratios from 2018 onward, from about 52 percent of GDP at the end of 2017 to 49 percent of GDP at the end of 2020. With the budgetary financing mix shifting toward external financing, domestic debt is expected to drop as a share of GDP from close to 20 percent at the end of 2017 to less than 14 percent at the end of 2020, while external debt would remain broadly stable. While the overall objectives of the regional adjustment strategy are broadly being attained, there are indications that fiscal consolidation is experiencing initial challenges in some countries, highlighting the risks of possibly weaker reform efforts in the face of political or social resistance.
These efforts are supported by the regional central bank’s (BEAC’s) tight monetary stance and decision to eliminate statutory advances. The expansion of the BEAC’s advances to governments in response to the fall in oil prices had allowed public spending to remain well above the level consistent with internal stability. With unchecked tightening of monetary aggregates and a high import content of public spending on infrastructure,
This box was prepared by Edouard Martin.
Figure 1.4.1. CEMAC: Reserves, July 2014–December 2017
2
4
6
8
10
12
14
Jul-1
4
Nov-1
4
Mar-1
5
Jul-1
5
Nov-1
5
Mar-1
6
Jul-1
6
Nov-1
6
Mar-1
7
Jul-1
7
Nov-1
7
Billio
ns of
euro
s
Sources: Central African Economic and Monetary Community (CEMAC) authorities; and IMF staff calculations.
Figure 1.4.2. CEMAC: Fiscal Indicators, 2014–22
–30
–25
–20
–15
–10
–5
0
0
5
10
15
20
25
2014 15 16 17 18proj.
19proj.
20proj.
21proj.
22proj.
Perce
nt of
non-
oil G
DP
Perce
nt of
non-
oil G
DP
Capital expenditure (left scale)Non-oil revenue (left scale)Non-oil overall fiscal balance, excl. grants (right scale)
g ,
Sources: Central African Economic and Monetary Community (CEMAC) authorities; and IMF staff calculations.

REGIONAL ECONOMIC OUTLOOK: SUB-SAHARAN AFRICA
26
this practice has put considerable downward pressure on foreign reserves. The elimination of new central bank credit to government at the end of 2017 is therefore a major step toward restoring fiscal and monetary discipline in the region. In 2018, the central bank will pursue its efforts to modernize its monetary policy operations framework, with a view to anchoring it on the policy rate (rather than monetary aggregates) as the intermediate target and strengthening the transmission mechanism. The BEAC will notably (1) simplify its monetary policy instruments; (2) base liquidity management on the projection of autonomous factors; (3) strengthen the framework for requiredreserves; (4) adjust its collateral framework; and (5) set up an emergency liquidity assistance (ELA) framework.Last, the central bank will support the development of financial markets, including through promoting theestablishment of financial sector databases (on financial information, payment incidents, and credit risks) andof a credit bureau.
The regional banking supervisor has adopted an action plan to improve the effectiveness of bank supervision. This plan aims to help the banks address high nonperforming loans (including by clarifying and better enforcing the provisioning rules), strengthen the implementation of certain prudential regulations (including the risk concentration and connected party lending rules), and resolve banks in difficulty. The supervisor will also continue to implement its strategy plan, which aims primarily at implementing risk-based supervision.
These stabilization policies, which have been essential to avert a deeper crisis, need to be complemented by structural reforms to support more inclusive and sustained growth over the medium term. In this regard, the regional Program of Economic and Financial Reforms outlines specific measures aimed at reducing the region’s excessive dependence on oil exports and related revenues. Measures to enhance the business environment include (1) the establishment of trade courts to facilitate the settlement of commercial disputes; (2) the creation of one-stopshops to reduce the time and cost for creating a new company; and (3) the establishment of incubators to facilitatethe creation of new businesses through sharing best practices. Actions aimed at deepening regional integrationinclude (1) the harmonization and reduction of custom exemptions through a revised customs code; (2) full imple-mentation of the Common External Tariff; and (3) enacting the freedom to establish companies. Efforts are alsonecessary to improve governance, fiscal transparency, and public financial management. Implementation ofall these reforms, together with enhancing investor confidence by sustained macroeconomic stabilization, wouldlead to a gradual pickup in non-oil GDP growth of the CEMAC region to 4.8 percent in 2021.
Box 1.4. (continued)

1. SLOW RECOVERY AMID GROWING CHALLENGES
27
Box 1.5. Protecting Social Spending in IMF-Supported ProgramsSince 2009, almost all IMF-supported programs in sub-Saharan African countries have included quantitative targets or structural benchmarks to preserve or increase social spending, comprising mostly outlays on health, education, and social protection. These program features seem broadly effective in protecting or enhancing social and other priority spending.
The new architecture of IMF facilities in low-income countries adopted in 2009 explicitly aims at assisting them in achieving a stable and sustainable macroeconomic position consistent with strong and durable poverty reduction and growth.1 Under this new architecture, all instruments—Extended Credit Facility, Standby Credit Facility, Rapid Credit Facility, and Policy Support Instrument—should support policies that safeguard social and other priority spending. Such policies are expected to be reflected in the Letter of Intent.
Almost all programs approved since 2009 have included quantitative targets—typically a floor on social or, more precisely defined, priority spending—or structural benchmarks on social sectors.2 During 2006–09, about 50 percent of the programs approved under the Poverty Reduction and Growth Facility included a floor on social spending; since 2009, about 90 percent of IMF-supported programs approved for low-income countries, of which about 95 percent of programs approved were for sub-Saharan African countries, included such a floor. Some programs have included stronger safeguards of social and priority spending, for instance by excluding social spending from the fiscal deficit target or providing the possibility to adjust the target to accommodate larger-than- budgeted amounts of social spending (for example, Malawi, Grenada). Beyond an indicative target, some other programs have included structural benchmarks on social protection measures better targeting the most vulnerable groups, increasing the coverage of the cash transfer system, or redesigning the social safety net system.3
Although the definition of social and priority spending varies across countries, it typically covers outlays on health, education, and social protection. Health and education spending is derived from the functional budget classifica-tion of those two sectors. Social protection spending includes specific programs to support vulnerable groups, such as maternity and child benefits, women’s and old-age group benefits, youth employment benefits, and social security transfers (for example, Armenia, Honduras, Mali, Mauritania). In some instances, safeguarded spending includes projects with an implicit link to poverty or inequality reduction, such as projects on agriculture, rural electrification, sanitation, gender, and the environment (for example, Burkina Faso, Côte d’Ivoire, Ghana, Guinea-Bissau, Togo). The quantitative floors were often designed to consider only domestically financed social and other priority spending, lest shortfalls in external financing cause the targets to be missed.
The application of indicative targets to monitor program implementation was broadly effective in protecting or enhancing social and other priority spending. The floors on social spending were met in more than two-thirds of the programs; this figure is broadly unchanged when examining only the programs with fiscal consolidation. Based on a sample of countries for which data on the indicative targets and other economic aggregates can clearly be compared, the share of social spending protected by these floors increased between 2010 and 2017 by about 2.5 percentage points of total spending (from an average of about 23.5 percent to 26 percent) and by about 1 percentage point of GDP (from an average of 6 percent to 7 percent) (Figures 1.5.1 and 1.5.2). These results are consistent with earlier studies that demonstrated that spending in social sectors, such as health and education, have effectively expanded under programs supported by the IMF in low-income countries.4
1 IMF (2009).2 IMF (2017e).3 IEO (2017). 4 Clements, Gupta, and Nozaki (2011).
This box was prepared by Alice Mugnier, Ivohasina F. Razafimahefa, and Sampawende J. Tapsoba.

REGIONAL ECONOMIC OUTLOOK: SUB-SAHARAN AFRICA
28
Figure 1.5.1. Selected Countries: Change in Social Spending Indicative Targets, 2010–17
8
13
18
23
28
33
38
–15
–10
–5
0
5
10
15
Moldo
va Mali
Sene
gal
Arme
nia
Côte
d'Ivo
ire
Nige
r
Kyrg
yz R
epub
lic
Ugan
da
Togo
Burki
na F
aso
Maur
itania
Guine
a-Bi
ssau
Perce
nt of
total
expe
nditu
re
Perce
nt
Change between 2010 and 2017 (left scale)Average 2010 (right scale)Average 2017 (right scale)
Source: Country authorities; IMF, World Economic Outlook database; and IMF staff calculations.
Figure 1.5.2. Selected Countries: Change in Social Spending Indicative Targets, 2010–17
3
4
5
6
7
8
9
–3
–2
–1
0
1
2
3
Moldo
va
Ugan
da Mali
Arme
nia
Kyrg
yz R
epub
lic
Burki
na F
aso
Sene
gal
Côte
d'Ivo
ire
Maur
itania
Togo
Guine
a-Bi
ssau
Nige
r
Perce
nt of
GDP
Perce
nt
Change between 2010 and 2017 (left scale)Average 2010 (right scale)Average 2017 (right scale)
Source: Country authorities; IMF, World Economic Outlook database; and IMF staff calculations.
Box 1.5. (continued)

1. SLOW RECOVERY AMID GROWING CHALLENGES
29
Annex 1.1. Fiscal Break-even Oil Price: Definition and Decomposition
27
Definition and Interpretation
The fiscal break-even oil price is a standard measure used to assess fiscal vulnerability in oil-exporting countries. It is an approximate measure of the oil price needed to balance the budget. This indicator is illustrative and does not necessarily mean that a balanced budget is the appropriate fiscal target.
The fiscal break-even oil price is defined as follows (all variables are expressed in US dollars):
��������� ����� = ������� � ��� ����������� ��� ��������,
in which ������� is the non-oil fiscal balance. The fiscal break-even oil price can be defined as the non-oil fiscal balance divided by the number of oil barrels allotted to the government—that is, fiscal oil revenue divided by the oil price. The fiscal break-even oil price could be interpreted as the oil price needed to balance the budget, assuming that non-oil revenue does not depend on oil price and that the relationship between fiscal oil revenue and oil price is linear.
Decomposition of Changes in the Fiscal Break-even Oil Price
We suggest a novel method to study the contribution of various factors to the dynamics of fiscal break-even oil price. This calculation of the fiscal break-even oil price produces the relative contributions of real exchange rate depreciation and fiscal adjustment to the changes in the break-even price.
The definition of the fiscal break-even oil price can be rewritten as:
��������� ����� = �� ∗ �� ��������
� � � ��� ����������� ��� ��������,
in which the non-oil fiscal balance ������� is the non-oil fiscal balance in local currency units, e is the nominal exchange rate vis-à-vis the US dollar, and p is the GDP deflator of the oil exporter studied (alternatively the consumer price index could be used). We examine the changes in the fiscal break-even oil price in constant US dollars by dividing it by the US GDP deflator �∗ (alternatively the US consumer price index could be used) as follows:
��������� ������∗ = ��∗�
�∗ � ��������
� � � ��� ����������� ��� ��������.
Taking the difference in logarithms of the fiscal break-even oil price in constant US dollars would show that the fiscal break-even oil price is equal to the difference in logarithms of the real exchange rate vis-à-vis US dollar (depreciation) plus the difference in the logarithm of the non-oil fiscal balance in constant local currency (fiscal adjustment) and a component reflecting the contribution of changes in the (log) volumes of oil exports and/or changes in the oil taxation schedule.
��� ���������� ������∗ � = ��� ��∗�
�∗ � � ��� ��������
� � � ��� ������� ��� ���������� ����� �.

REGIONAL ECONOMIC OUTLOOK: SUB-SAHARAN AFRICA
30
REFERENCES
African Union. 2017. December 8th Press Release. https://au.int/en/pressreleases/20171208/statement-chairperson-commission-african-union-continental-free-trade-area.
Anderson, J., M. Larch, and Y. Yotov. 2015. “Growth and Trade with Frictions: A Structural Estimation Framework.” NBER Working Paper 21377 National Bureau for Economic Research, Cambridge, MA.
Arizala, F., M. Bellon, M. MacDonald, M. Mlachila, and M. Yenice. 2018. “Regional Spillovers in Sub-SaharanAfrica—Exploring Different Channels.” IMF SpilloverNote, International Monetary Fund, Washington, DC.
Chauvin, N., P. Ramos, and G. Porto. 2016. “Trade, Growth, and Welfare Impacts of the CFTA in Africa.” Proceedings of CSAE Conference: Economic Development in Africa, Oxford.
Cherif, R., F. Hasanov, and M. Zhu (eds.). 2016. “Breaking the Oil Spell: The Gulf Falcons’ Path to Diversification.” International Monetary Fund, Washington, DC.
Clements, B., S. Gupta, and M. Nozaki. 2011. “What Happens to Social Spending in IMF-Supported Programs?” International Monetary Fund, Washington, DC.
Gaspar, V., and A. Selassie. 2017. “Taxes, Debt and Development: A One-Percent Rule to Raise Revenues in Africa.” IMF Blog, International Monetary Fund, Washington, DC. https://blogs.imf.org/2017/12/05/taxes-debt-and-development-a-one-percent-rule-to-raise-revenues-in-africa/
Independent Evaluation Office of the International Monetary Fund (IEO). 2017. “The IMF and Social Protection.” Washington, DC.
International Monetary Fund (IMF). 2009. “A New Architecture of Facilities for Low-Income Countries.” IMF Policy Paper, Washington, DC.
. 2013. “Drivers of Growth in Non-resource-Rich Sub-Saharan African Countries.” Chapter 2, Regional Economic Outlook: Sub-Saharan Africa. Washington, DC, October.
. 2015a. “Dealing with the Gathering Clouds” Chapter 1, Regional Economic Outlook: Sub-Saharan Africa. Washington, DC, October.
. 2015b. “Fiscal Policy and Long-Term Growth.” IMF Policy Paper, Washington, DC.
. 2015c. “How Can Sub-Saharan Africa Harness the Demographic Dividend?” Chapter 2, Regional Economic Outlook: Sub-Saharan Africa. Washington, DC, October.
. 2016. “Time for a Policy Reset” Chapter 1, Regional Economic Outlook: Sub-Saharan Africa. Washington, DC, April.
. 2017a. “The Quest for Recovery” Chapter 1, Regional Economic Outlook: Sub-Saharan Africa. Washington, DC, October.
. 2017b. “The Impact of Fiscal Consolidations on Growth in Sub-Saharan Africa.” Chapter 2, Regional Economic Outlook: Sub-Saharan Africa. Washington, DC, October.
. 2017c. “Economic Diversification in Sub-Saharan Africa.” Chapter 3, Regional Economic Outlook: Sub-Saharan Africa. Washington, DC, October.
. 2017d. “Restarting Sub-Saharan Africa’s Growth Engine.” Chapter 2, Regional Economic Outlook: Sub-Saharan Africa. Washington, DC, April.
. 2017e. “Social Safeguards and Program Design in PRGT and PSI-supported Programs”. IMF Policy Paper, Washington, DC.
International Centre for Trade and Sustainable Development (ICTSD). 2017. “Talking CFTA with Albert Muchanga, the AU’s Commissioner for Trade and Industry.” https://www.ictsd.org/bridges-news/bridges-africa/news/talking-cfta-with-albert-muchanga-the-au%E2%80%99s-commissioner-for-trade.
. 2017. “Trade in Services Negotiations: A Southern African Perspective.” https://www.ictsd.org/sites/default/files/research/trade_in_services_negotiations_digital_0.pdf.
Mevel, S., and S. Karingi. 2012. “Deepening Regional Integration in Africa: A Computable General Equilibrium Assessment of the Establishment of a Continental Free Trade Area Followed by a Continental Customs Union.” Proceedings of the African Economic Conference.
Sebahizi, P. 2017. “Update on the Continental Free Trade Area negotiations.” Presentation at the African Prosperity Conference.
United Nations Conference on Trade and Development (UNCTAD). 2015. “Elements of Modalities for the African Continental Free Trade Agreement (CFTA). Some Key Issues for Consideration.” http://unctad.org/en/PublicationsLibrary/ditc2015misc3_en.pdf.
United Nations Economic Commission for Africa (UNECA). 2016. “ECA Urges Africa to Push ahead with Continental Free Trade Area.“https://www.uneca.org/stories/eca-urges-africa-push-ahead-continental-free-trade-area.
World Bank. 2009. “Transport Prices and Costs in Africa. A Review of the International Corridors.” Washington, DC.

31
Domestic revenue mobilization is one of the most pressing policy challenges facing sub-Saharan African countries. While the reasons may vary according to country-specific circumstances, there are three aspects of domestic revenue mobilization that make it so important.
• First, sub-Saharan African countries need toincrease their resources to invest in programsthat support the achievement of the SustainableDevelopment Goals. This includes effortsto reduce poverty and inequality, ensureadequate health and education, and developbasic infrastructure to support more inclusivegrowth. Despite recent progress, the regionstill faces massive development challenges. Thechapter highlights that the region as a wholecould mobilize about 3 to 5 percent of GDP,on average, in additional revenues. This wouldrepresent about $50–80 billion, substantiallymore than the estimated $36 billion in officialdevelopment assistance received bysub-Saharan African countries in 2016.
• Second, at a time when public debt levels havebeen rising rapidly, domestic revenue mobiliza-tion should be a key component of any fiscalconsolidation strategy. Absent adequate effortsto raise domestic revenues, fiscal consolidationtends to rely excessively on reductions in publicspending, which can have a more negativeimpact on growth (IMF 2017) and can becomepolitically more difficult to implement inpractice and sustain over time.
1 The process of development of state capability is very complex and depends on a number of factors. Low state capability is often used as an argument to justify limited state capacity to collect taxes, but the experience of some post-conflict countries (for example, Liberia and Mozambique) suggests that building tax collection institutions may produce positive institutional spillovers by helping to build state capability in other areas (for example, statistical agencies, public finance management reform groups, etc.). Research by Prichard and Leonard (2010) also supports this hypothesis.2 The chapter emphasizes mobilization of nonresource revenues. Resource revenues fluctuate with natural resource production levels and commodity prices, and are much less subject to control by domestic policymakers. Adequate collection and management of resource revenues pose other challenges regarding fiscal regimes and fiscal frameworks that have been studied elsewhere (for example, IMF 2012).
• Third, developing adequate capacity to collecttaxes is also a way to strengthen institutionsand build state capability. Since tax collec-tion is one of the most basic functions of thestate, developing capacity in this area can alsosupport institutional development in otherareas (Gaspar, Jaramillo, and Wingender 2016).This can operate through several channels. Forexample, an emphasis on clear and fair tax lawsand regulations can support a related focus onpublic finance management to convince citizensthat government taxation will be used to fundreasonably efficient and transparent spendingprograms. Similarly, establishing a revenueauthority with highly trained professional staffcan support organizational innovations ascountries extend successful reform efforts toother government areas.1
This chapter analyzes revenue collection efforts in sub-Saharan Africa compared with other regions, with a special emphasis on nonresource revenues.2
The chapter argues that sustained revenue mobiliza-tion is difficult because it requires consistent insti-tutional development over time as well as attention to basic processes and reforms where reversals are frequent. In addition, robust reforms are those that focus not only on ways to increase revenue collec-tion, but also take into account how to do so in ways that consider the efficiency and equity impact of particular policy choices. Technical assistance can support reform efforts, but it requires strong political will, usually based on a well-defined medium-term strategy. The chapter is organized in three sections.
2. Domestic Revenue Mobilization in Sub-Saharan Africa:What Are the Possibilities?
This chapter was prepared by a team led by Alex Segura-Ubiergo and composed of Chuling Chen, John Hooley, Gabriel Leost, Toomas Orav, Miguel Pereira Mendes, Ashan Rodriguez, and Manuel Rosales.

REGIONAL ECONOMIC OUTLOOK: SUB-SAHARAN AFRICA
32
• The first section describes developments inrevenue-to-GDP and tax-to-GDP ratios insub-Saharan Africa compared with otherregions. It shows a substantial improvement insub-Saharan African revenue mobilization overthe past three decades. However, the region stillhas, on average, the lowest revenue-to-GDPratio compared with other regions. The sectionalso shows how low efficiency of some of themost important sources of taxation, such asthe value-added tax (VAT) and the corporateincome tax (CIT), are significant constraintsto better performance. It also discusses otherpotential sources of additional revenue collec-tion, including the role of excise and propertytaxes.
• The second section analyzes some of thestructural conditions that may account forthe lower tax-to-GDP ratios in sub-SaharanAfrica, including the level of development,trade openness, sectoral structure, incomedistribution, and institutional quality. It showsthat sub-Saharan African countries could,on average, mobilize about 3 to 5 percent ofGDP in additional tax collection, througha combination of reforms that improve theefficiency of current systems (including throughthe reduction of tax exemptions), and throughinstitutional changes (such as improvementsin governance and measures to controlcorruption).
• The third section analyzes lessons from revenuemobilization case studies. It emphasizes theelements of successful medium-term strategiesfor revenue mobilization and the importanceof political economy factors, such as buildingbroad-based support for the reform processthrough proactive outreach strategies to boththe public and private sectors. The results areconsistent with findings from other recentresearch in this area (for example, Akitoby andothers, forthcoming).
3 Based on a fixed sample of 40 sub-Saharan African economies for which data are available from 1995 through 2016. Given the skewed distribution of revenue ratios across the region (see Figure 2.4), the median provides a more representative picture of revenue trends than the mean. 4 The tipping point estimated in Gaspar, Jamarillo, and Wingender (2016) is a minimum tax-to-GDP ratio of 12.88 percent to enable the state to perform some of its most important functions, especially adequate spending on developmental programs. While this threshold is statistically significant, the precise number should be interpreted with caution, as it may vary country by country. With nontax revenues typically averaging 2 percent of GDP, a tax-to-GDP revenue of 13 percent, and an overall revenue ratio of 15 percent of GDP, should be viewed as a minimum threshold to allow the state to perform basic functions. Ratios should also be interpreted with care given ongoing GDP rebasing developments in some countries.
Finally, the chapter also discusses the role of new technologies (that is, digitalization) to empower tax policymakers with quicker access to more reliable information and to deepen the tax base (Box 2.1). The section also discusses the economic impact of revenue mobilization on growth and income distri-bution (Box 2.2) focusing on the Central African Economic and Monetary Community (CEMAC) countries, where these issues have become particu-larly important since the sharp drop in commodity prices starting in 2014.
TRENDS IN REVENUE MOBILIZATION IN SUB-SAHARAN AFRICA Steady and Widespread Progress
Over the past three decades, many sub-Saharan African countries have achieved substantial gains in revenue mobilization. For the median sub-Saharan African economy, total revenue excluding grants increased from around 14 percent of GDP in the mid-1990s, to more than 18 percent in 2016, while tax revenue increased from 11 to 15 percent (Figures 2.1. to 2.3).3 These trends have been driven primarily by nonresource revenues (Figure 2.3), which have increased particularly sharply in the past 10 years. In contrast, revenues from natural resources, while representing important sources of overall revenue for many sub-Saharan African countries, have not increased substantially. These revenues have also been volatile, particularly during the episodes of commodity price swings in the late 2000s and since 2014.
Recent progress in revenue mobilization has also been broad. Since the mid-1990s, 15 sub-Saharan African countries have successfully transitioned to tax-to-GDP ratios of about 13 percent and above, the minimum ratio that recent research has suggested can be associated with a significant accel-eration in growth and development (Figure 2.4).4

2. DOMESTIC REVENUE MOBILIZATION IN SUB-SAHARAN AFRICA: WHAT ARE THE POSSIBILITIES?
33
Two-thirds of sub-Saharan African countries now have revenue ratios above 15 percent, compared with fewer than half in 1995.
The sources of sub-Saharan Africa’s gains in revenue mobilization have been mainly an increase in direct and indirect taxes (Figure 2.5). Indirect taxes have received a boost from the introduction of the VAT in several countries. In contrast, the revenue from taxes on imports has declined as a share of GDP, reflecting increased trade liberaliza-tion over the period.
Global Context
Despite sub-Saharan Africa’s recent progress in revenue mobilization, the region still has the lowest revenue-to-GDP ratio compared to other regions in the world. The good news is that there are signs of convergence. Over the past three decades, the increase in sub-Saharan Africa’s revenue ratio has been double that for all emerging market and devel-oping economies (Figure 2.6).
Nonetheless, the median revenue-to-GDP ratio among all emerging market and developing economies is 23 percent, 5 percentage points higher than for sub-Saharan Africa. The region performs slightly better in terms of tax revenue, with a median tax-to-GDP ratio only 2 percentage points lower than that of all emerging market and devel-oping economies, although it still has the second lowest ratio among all regions (Figure 2.7).
Figure 2.1. Sub-Saharan Africa: Total Revenue Excluding Grants, 1995–2016
5
10
15
20
25
30
1995 98 2001 04 07 10 13 16
Perce
nt of
GDP
Interquartile range MedianSource: IMF, World Economic Outlook database.
Figure 2.2. Sub-Saharan Africa: Tax Revenue, 1995–2016
5
10
15
20
25
30
1995 98 2001 04 07 10 13 16
Perce
nt of
GDP
Interquartile range Median
Figure 2.2. Sub-Saharan Africa: Tax Revenue, 1995–2016
Source: IMF, World Economic Outlook database.
Source: IMF, World Economic Outlook database.
Figure 2.3. Sub-Saharan Africa: Nonresource Revenue to Nonresource GDP, 1995–2015
5
10
15
20
25
30
1995 98 2001 04 07 10 13
Perce
nt of
Nonr
esou
rce G
DP
Interquartile range MedianSources: IMF, World Economic Outlook database; IMF Fiscal Affairs Department Sub-Saharan Africa Tax Revenue database.
Less than 13 percentBetween 13 and 18 percentGreater than 18 percentData not available
1995
Figure 2.4. Sub-Saharan Africa: Tax Revenue to GDP (Percentage of GDP)
Source: IMF, World Economic Outlook database.
2016
Figure 2.5. Sub-Saharan Africa: Sources of Revenue, 1995–2016
0
2
4
6
8
1995 98 2001 04 07 10 13 16
Perce
nt of
GDP
Direct taxes Indirect taxesTrade taxes Nontax revenue
Source: IMF Fiscal Affairs Department Sub-Saharan Africa Tax Revenue database.

REGIONAL ECONOMIC OUTLOOK: SUB-SAHARAN AFRICA
34
Regional Context
There are different patterns of revenue mobiliza-tion among sub-Saharan African economies. Oil exporters and fragile states differ from other economies in the region in both the level and sources of their revenue collection.
• Oil exporters. The average revenue-to-GDPratio was 27 percent in oil-exporting economiesover 2000–16, compared with 18 percent fornon-oil economies. Oil exporters tend to havelower non-resource-revenue-to-GDP ratios,possibly reflecting reduced tax effort in nonre-source revenues (Thomas and Treviño 2013).But, this is more than offset by substantialresource revenues from both nontax sources(bonuses, royalties, and production sharingrevenue) and direct taxes (corporate tax on oilcompanies’ profits). On average, nontax revenueaccounts for almost half of oil-exporters’
revenue, compared with less than 20 percent for non-oil exporters (Figure 2.8). Revenues are also more volatile for oil exporters—during 2000–16 the standard deviation of total revenue for oil exporters was seven times that of non-oil exporters. Declines in world oil prices can dramatically affect the level of resource revenue, while nonresource revenue is difficult to mobilize quickly to offset the impact on total revenue (Figure 2.9). Indeed, the decline in the world oil price since 2014 has led to a sharp fall in the overall revenue to GDP ratio for oil exporters, from 31 percent in 2012 to 18 percent in 2016.
• Fragile states. Revenue mobilization is particu-larly difficult in fragile states, where institutionsare often weak and the security and governance
Figure 2.6. Change in Revenue Excluding Grants
0 1 2 3 4 5
1995–2005
2005–16
1995–2016
Percentage points of GDPAll emerging market and developing economies (median)Sub-Saharan Africa (median)
Source: IMF, World Economic Outlook database.
Figure 2.8. Sub-Saharan Africa: Decomposition of Revenue, 2016
0
20
40
60
80
100
Oil exporters Non-oil exporters SSA average
Perce
nt
Direct taxes Indirect taxes Trade taxesOther taxes Nontax revenue
Source: IMF Fiscal Affairs Department Sub-Saharan Africa Tax Revenue database.Note: SSA = sub-Saharan Africa.
Figure 2.9. Sub-Saharan Africa: Revenue, Oil Exporters, Median, 1995–2016
05
10152025303540
1995 98 2001 04 07 10 13 16
Perce
nt of
GDP
Resource revenueNonresource revenueTotal revenue (excluding grants)
Sources: IMF, World Economic Outlook database; and IMF Fiscal Affairs Department Sub-Saharan Africa Tax Revenue database.Note: Data on resource and nonresource revenues are available to 2015 only.
Figure 2.7. Total Revenue Excluding Grants, Median, 2016
05
1015202530354045
SSA EMEDEVAsia
AllEMEDEV
MENA LAC Advancedeconomies
Perce
nt of
GDP
Total revenue Tax revenueSource: IMF, World Economic Outlook database.Note: EMEDEV = Emerging market and developing economies; LAC = Latin America and the Caribbean; MENA = Middle East and North Africa; SSA = sub-Saharan Africa.

2. DOMESTIC REVENUE MOBILIZATION IN SUB-SAHARAN AFRICA: WHAT ARE THE POSSIBILITIES?
35
situation is challenging. Although several fragile states benefit from natural resource revenues, they all tend to struggle in non-resource-rev-enue mobilization. The median non-resource-revenue-to-GDP ratio was less than 14 percent in 2015, compared with 18 percent for nonfrag-ile states (Figure 2.10).
Other Characteristics of Sub-Saharan African Tax Systems
In most regions of the world, there has been a trend in recent years toward reducing rates for the CIT and the personal income tax (PIT). In sub-Saharan African countries, the average top PIT rate has been reduced from about 44 to 32 percent since 2000 (Figure 2.11), while average top CIT rates have been reduced by more than 5 percentage points during the same period (Figure 2.12).
5 Despite the reduction in rates, the tax burden on households can still sometimes be substantial given the existence of fees, ad hoc taxes, and contributions imposed by various levels of government and/or officials.6 CIT productivity is defined as the tax yield in percent of GDP relative to the standard CIT rate and given by: CIT Productivity=(CIT Revenue as a share of GDP)/(CIT rate).
Despite this decline in rates,5 total direct taxes (PIT and CIT) as a percentage of GDP have been trending upward, though substantial potential remains in this area given the low level of produc-tivity (Figures 2.13–2.16).6 On average, sub-Saha-ran African countries’ CIT productivity lags that of advanced and emerging market economies.
There are substantial differences in the productivity of the CIT among sub-Saharan African countries, with some showing the highest productivity due to more streamlined tax incentives. Different fiscal regimes for special economic zones (SEZs) are among several factors (such as differences in the tax base and administrative effort) impacting CIT productivity. Some countries, such as Senegal and South Africa, offer a reduced tax rate of 15 percent for companies located in SEZs, while others with lower productivity or lower tax collection as a share of GDP offer a zero CIT rate, including Côte d’Ivoire, Rwanda, and Tanzania.
Substantial progress has also been made regarding the collection of indirect taxes. Most sub-Saharan African countries have introduced a VAT, replacing general sales taxes. The main advantage of a VAT is that it avoids tax cascading (tax paid on tax) by taxing only the value added at each stage of the supply chain. Sub-Saharan African countries that continue to rely on sales taxes should look to introduce a modern VAT. These include Angola Comoros, Guinea-Bissau, Liberia, and São Tomé and Príncipe. However, before the introduction of the VAT, countries need to develop a capacity to
Figure 2.10. Sub-Saharan Africa: Nonresource Revenue, Fragile and Nonfragile States, Median, 1997–2015
8
10
12
14
16
18
20
1997 99 2001 03 05 07 09 11 13 15
Perce
nt of
GDP
Fragile (median) Nonfragile (median)Sources: IMF, World Economic Outlook database; and IMF Fiscal Affairs Department Sub-Saharan Africa Tax Revenue database.
Figure 2.11. Personal Income Tax Rate, Average Top Rate, 2000–16
101520253035404550
2000 02 04 06 08 10 12 14 16
Perce
nt
Advanced economiesEmerging market economiesLow-income countriesSub-Saharan Africa
Source: IMF Fiscal Affairs Department Tax Rates database.
Figure 2.12. Corporate Income Tax Rate, Average Top Rate, 2000–16
101520253035404550
2000 02 04 06 08 10 12 14 16
Perce
nt
Advanced economiesEmerging market economiesLow-income countriesSub-Saharan Africa
Source: IMF Fiscal Affairs Department Tax Rates database.

REGIONAL ECONOMIC OUTLOOK: SUB-SAHARAN AFRICA
36
administer the credit/debit system, which suggests that the process cannot be rushed.
One advantage of focusing on the VAT is that it is more growth friendly than other types of taxes, especially direct taxes (IMF 2015a). In most cases this can be best achieved by a focus on the effi-ciency of the VAT, rather than through increases in VAT rates, as this is less likely to have a negative impact on growth (Box 2.2). At the same time, in countries where the rate is below 13 percent, a 2 percent rate increase would have virtually no negative impact on growth, while in countries with a rate between 13 and 18 percent, a 1 percent increase would not have much effect on economic activity. With rates above 18 percent, even small increases in the VAT rate can have a substantial negative impact on growth (Gunter and others forthcoming).
7 VAT C-efficiency is defined as actual VAT collections as a share of its potential base (that is, consumption) and is given by VAT C-Efficiency=(VAT Revenue)/((Total final consumption net of VAT revenue)*VAT rate).8 Zero-rating can have a more negative impact on collections than exemptions. In this case, the final consumption good is not taxed, and the seller can claim a VAT refund for the VAT paid on its inputs. When a good is “exempt,”the government does not tax its final sale, but producers cannot claim a VAT refund for the VAT they paid on the inputs used in the production process.
At the same time, the focus on the VAT also requires greater attention to pro-poor spending and social protection measures. Countries should use part of the resources raised through the VAT to ensure that any potentially negative distributional impact is adequately offset on the expenditure side.
In those sub-Saharan African countries that have adopted a VAT, its efficiency is relatively low compared with other regions (Figure 2.15) and varies widely across the region (Figure 2.17).7 Several factors explain this performance:
• Narrow tax bases due to the proliferation ofexemptions and zero rating for goods andservices.8 While all countries have some exemp-tions and zero-rated goods and services, thereare substantial differences across countries.
Figure 2.14. CIT Productivity, Average
02468
10121416
Advancedeconomies
LIDCs Emergingmarkets
SSA
Perce
nt
Sources: World Revenue Longitudinal Database; and IMF Fiscal Affairs Department Sub-Saharan Africa Tax Revenue database.Note: CIT = corporate income tax; LIDCs = low-income developing countries; SSA = sub-Saharan Africa;
Figure 2.15. VAT C-Efficiency, Average
010203040506070
Advancedeconomies
LIDCs Emergingmarkets
SSA
Perce
nt
Sources: World Revenue Longitudinal Database; and IMF Fiscal Affairs Department Sub-Saharan Africa Tax Revenue database.Note: LIDCs = low-income developing countries; SSA = sub-Saharan Africa ; VAT = value-added tax; VAT C-Efficiency = actual VAT collections as a share of potential base.
Figure 2.13. Sub-Saharan Africa: CIT Productivity and CIT to GDP, 2016 or Latest Available
0
5
10
15
20
25
01234567
RWA
CAF
SLE
UGA
CIV
TZA
BDI
BEN
MWI
TGO
ZMB
COD
SEN
ZWE
COG
GMB
MLI
ETH
GHA
CPV
SWZ
MUS
LSO
KEN
NAM
ZAF
MOZ
SYC
Perce
nt
Perce
nt of
GDP
CIT/GDP CIT productivity (right scale)Sources: World Revenue Longitudinal database; IMF Fiscal Affairs Department Tax Rates database; and IMF, World Economic Outlook database. Note: CIT = corporate income tax. See page 91 for country abbreviations table.

2. DOMESTIC REVENUE MOBILIZATION IN SUB-SAHARAN AFRICA: WHAT ARE THE POSSIBILITIES?
37
For example, Lesotho, Mauritius, Senegal, and South Africa have relatively short lists compared with countries such as Cameroon, Malawi, and Zambia, which have more extensive lists of exemptions.
• Different thresholds for which a taxpayer isrequired to register (Figures 2.18 and 2.19).While it is usually advisable to have a relativelyhigh threshold to allow the tax administra-tion to focus on the larger taxpayers, moremature tax administrations can choose lowerthresholds. Substantial differences can alsobe observed for the PIT thresholds. Burundi,Zambia, and Zimbabwe have very generousexempted thresholds that exceed three timestheir per capita GDP, compared with countriessuch as Botswana, Senegal, South Africa, andTanzania, where exempted thresholds aresimilar to the level of per capita GDP.
• Weaknesses in VAT refund systems. The VAT isa tax on consumption that requires both timelyand accurate refunds. A variety of systems areused in sub-Saharan Africa, including the use
of VAT credits against future tax payments (Ghana, Kenya, Madagascar, Malawi, Mali, Mozambique, Senegal), VAT refunds on a quarterly basis (Cameroon, Chad, Equatorial Guinea), and refunds following an audit veri-fication (Mozambique, Namibia). While the latter system can help to reduce refund fraud, administrative delays can result in a buildup of unpaid claims adversely inpacting the private sector, as has been the case in Zambia and Zimbabwe. In this context, tax administrators should consider settling refunds out of gross VAT receipts by establishing escrow accounts to satisfy future refunds and mitigate potential problems in cash management. The use of risk-based audit verification approaches, whereby audits are selective and based on an assessment of risks, can help expedite the settlement of VAT refunds.
In addition to a sound VAT, sub-Saharan Africa also stands to benefit by tapping underexploited taxes, accelerating customs administration reforms, and reviewing policies regarding international corporate taxation. More specifically,
Figure 2.16 Sub-Saharan Africa: CIT Productivity, 2016 or Latest Available
0
5
10
15
20
25
30
UGA
COD
RWA
SLE
CAF
BEN
TGO
ETH
GMB
COG
SWZ
TZA
CIV
BDI
CPV
MWI
MLI
LSO
SEN
GHA
KEN
ZWE
MUS
NAM
SYC
ZAF
MOZ
BWA
AGO
Perce
nt
Sources: World Revenue Longitudinal database; and IMF staff estimates.Note: CIT = corporate income tax. See page 91 for country abbreviations table.
Figure 2.17. Sub-Saharan Africa: VAT C-Efficiency, 2016 or Latest Available
0
15
30
45
60
75
NGA
CAF
CIV
MDG
GNQ
ETH
TZA
MWI
BDI
RWA
UGA
COG
SWZ
ZMB
KEN
BFA
GHA
ZWE
BEN
LSO
MOZ
SEN
BWA
CPV
MUS
NAM
ZAF
Perce
nt
Sources: World Revenue Longitudinal database; and IMF staff estimates.Note: VAT C-Efficiency = actual VAT collections as a share of potential base; VAT = value-added tax. See page 91 for country abbreviations table.

REGIONAL ECONOMIC OUTLOOK: SUB-SAHARAN AFRICA
38
• The excise tax is an underexploited revenuesource. In 2015, on average, sub-SaharanAfrican countries collected 1.4 percent of GDPfrom all forms of excise taxes, less than halfthe level in emerging Europe (Figure 2.20).There are also wide differences in excise col-lection across sub-Saharan Africa, with severalcountries, including Benin, Côte d’Ivoire,Madagascar, Mozambique, Nigeria, andSierra Leone, collecting excise revenues of lessthan 1 percent of GDP (Figure 2.21). Whilespecific advice will depend on country-specificcircumstances, excise taxes are relatively simpleto implement and do not require fundamen-tal changes to the tax system (IMF 2011).Countries need to evaluate the productsthat can be subject to excise taxes (typicallypetroleum, cigarettes, alcohol, motor vehiclesand sometimes telecommunications) and theamount of tax levied, either through a specifictax (a monetary amount based on quantities)—which is typically better suited to address exter-nalities, tends to produce a more predictable
9 In Lesotho, property taxation accounts for half of local government revenue (IMF 2011) and in Cabo Verde this is 70 percent (Norregaard 2013).
revenue stream and is simpler to administer—or ad valorem (based on the value or price of the product), which can in some cases result in lower consumption prices (Delipalla and Keen 1991).
• Property taxation is also underused. Propertytax revenues are quite limited in sub-SaharanAfrica, but the case for property taxation isclear: it provides a stable and reliable source ofrevenue that is less susceptible to short-termeconomic fluctuation, and it is difficult toevade, since property taxes can be securedby the property itself. A further benefit isimproved service delivery and account-ability where property taxes are collected bythe local administration.9 Previous studies(Norregaard 2013) suggest that sub-SaharanAfrican countries can raise 0.5 to 1 percent ofGDP via property taxation, and it is becomingmore common across sub-Saharan Africa. Yetmany countries still rely solely on one-timepayments (for example, Botswana, Lesotho,
Figure 2.18. Sub-Saharan Africa: PIT Threshold Relative to per Capita GDP
00.5
11.5
22.5
33.5
4
MUS
SYC
GMB
MOZ
AGO
ETH
BEN
GNQ
GIN
MDG
STP
GAB
CIV
GHA
COM
BWA
RWA
CPV
MLI
NAM
TZA
ZAF
SEN
LBR
COD
UGA
SLE
MWI
CAF
SWZ
TGO
ZWE
ZMB
BDI
Numb
er of
times
Sources: IMF Fiscal Affairs Department Tax Rates database; and IMF, World Economic Outlook database.Note: PIT= personal income tax. See page 91 for country abbreviations table.
Figure 2.19. Sub-Saharan Africa: VAT Threshold Relative to per Capita GDP
020406080
100120140160180200
AGO
BEN
BFA
CPV
CAF
COD
GNQ
MOZ
NER
SEN
NGA
NAM
SYC
SWZ
BWA
ZAF
GAB
MUS
ETH
GHA
CIV
KEN
RWA
TZA
GMB
LSO
MWI
ZWE
TCD
ZMB
UGA
CMR
GIN
MDG
COG
BDI
Numb
er of
times
Sources: IMF Fiscal Affairs Department Tax Rates database; and IMF, World Economic Outlook database.Note: VAT= value-added tax. See page 91 for country abbreviations table.

2. DOMESTIC REVENUE MOBILIZATION IN SUB-SAHARAN AFRICA: WHAT ARE THE POSSIBILITIES?
39
Malawi, Swaziland, and Zimbabwe, among others, depend on stamp duties or registration fees on property sales). The rollout of recurrent property taxation will require significant capacity-building around property registries and annual appraisal systems, as well as stronger coordination between central and subnational governments, but relatively rapid progress is possible in urbanized areas where information exists on ownership and reference valuations and can be supplemented by harness-ing modern technology to, for example, derive geo-spatial data by global positioning systems.
• Customs administration is key. Customsadministrations collect VAT on imports,trade taxes, and excise taxes on importedgoods. In 2015, on average, sub-SaharanAfrican countries collected a third of theirnonresource revenue through customs attheir border (Figure 2.22). With a smallernumber of taxpayers involved in internationaltrade activities—as compared with a largernumber of taxpayers involved in domestic
operations—customs administration reforms can deliver results on revenue mobilization in a relatively short timeframe. At the same time, better customs administration is also critical for boosting trade. Such reforms have often included the modernization of customs processes (that is, digitalization of transactions and payments) and measures to combat corrup-tion and fraud (that is, strengthening clearance procedures and creating anti-smuggling units). Channeling goods through a few major ports with adequate custom controls can also facilitate custom administration and reduce potential for leakage.
• Cross-border tax rules need to be reviewed.Sub-Saharan African countries need to stayabreast of evolving international corporatepractices. With companies increasingly relianton debt relative to equity, thin capitalizationrules have been adopted to limit tax deductionson interest. By the end of 2016, thin capitaliza-tion rules across sub-Saharan Africa had setdebt-to-equity (or “gearing”) ratios of up to4:1, but recent international trends suggest thatcountries with rules allowing for ratios above2 could look to further limit interest deduc-tions (Botswana, Equatorial Guinea, Namibia,Rwanda, Tanzania, Zambia, Zimbabwe). Anadditional international tax issue is intragrouptransactions, also known as transfer pricing,which can distort taxable income. These newregulations typically embed the “arm’s length”principle to ensure that transfer prices aretransacted on a market-value basis. To limittax avoidance, tax rules and monitoringframeworks covering transactions betweenrelated parties need to be introduced wherethey are absent.
Figure 2.20. Excise Taxes, 2015, Average
0.00.5
1.0
1.5
2.0
2.5
3.0
3.5
EmergingEurope
Advancedeconomies
Asia LatinAmerica
SSA
Perce
nt of
GDP
Sources: World Revenue Longitudinal database; and IMF Fiscal Affairs Department Sub-Saharan Africa Tax Revenue database. Note: SSA = sub-Saharan Africa.
Figure 2.21. Sub-Saharan Africa: Excise Taxes, 2015
0
1
2
3
4
5
6
NGA
NAM CIV
GNB
BEN
ETH
CAF
MOZ
NER
LSO
SLE
MDG
COD
CMR
MLI
MWI
SWZ
GMB
GHA
ZMB
KEN
SEN
TZA
RWA
ZAF
UGA
MUS
COM
SYC
Perce
nt of
GDP
Sources: World Revenue Longitudinal database; and IMF Fiscal Affairs Department Sub-Saharan Africa Tax Revenue database. Note: See page 91 for country abbreviations table.

REGIONAL ECONOMIC OUTLOOK: SUB-SAHARAN AFRICA
40
STRUCTURAL FACTORS AFFECTING TAX EFFORT AND POTENTIALOne way to assess the amount of additional taxes that a state can potentially collect is to compare its tax-to-GDP ratio with that of other countries with similar characteristics, including the level of economic and institutional development. This type of analysis can be done using the notion of a “tax frontier.” The tax frontier (or theoretical tax capacity) can be defined as the highest level of tax revenue (usually measured in percent of GDP) that a country can be expected to achieve given certain underlying macroeconomic and institutional condi-tions. The distance between actual tax revenues or tax effort and the tax frontier in a particular year measures the theoretical tax gap or tax potential.Tax potential reflects the tax revenue gains that a country could achieve through tax policy changes or improvement in the efficiency of collection. Estimates should be used with care, as they can be sensitive to modeling assumptions and estimation techniques.
Following Fenochietto and Pessino (2010, 2013), the tax frontier for sub-Saharan African countries can be computed using a stochastic panel data model that covers 121 countries during 2002–16 (Annex 2.1). The model uses a set of independent variables commonly found to be associated with the level of tax revenue. These include income per capita, trade openness, the share of agriculture in GDP, income inequality and public spending on education. To assess the impact of institutions, some variables measuring corruption and govern-ment effectiveness are also included. Countries
differ widely in the height and distance to the frontier, as explained later (Figures 2.23 and 2.26).
Consistent with other studies, the analysis finds that higher income levels, more trade openness, higher spending on education, and better govern-ment effectiveness are associated with higher tax-to-GDP ratios. Similarly, countries with lower income inequality, and lower corruption levels also tend to have higher tax ratios. These factors determine the height of the frontier for each country.
The average tax frontier for Sub-Saharan African countries is around 7½ percentage points of GDP lower than the average tax frontier for the rest of the world. This is not surprising given the fact that sub-Saharan African countries have lower levels of economic and institutional development than countries in other regions. However, deeper analysis identifies nuances in the assessment of revenue mobilization across sub-Saharan Africa. In particular,
• The average tax gap is slightly lower in sub-Saharan Africa than elsewhere. This means thatcontrolling for the effect of structural factorsthat affect tax collection, sub-Saharan Africancountries are not showing, on average, higherlevels of inefficiency in their tax collectionefforts than other regions (Figure 2.24). Theaverage tax gap (or tax potential) for sub-Saha-ran African countries ranges between 3 and5 percent of GDP. Addressing inefficiencies insub-Saharan African countries may be a morepressing priority than in other regions giventhat overall tax revenues are lower and hencethe cost of this inefficiency is arguably higher.
Figure 2.22. Sub-Saharan Africa: Share of Nonresource Revenue Collected at Customs, 2015
0
10
20
30
40
50
60
05
101520253035404550
LSO
GNQ
BDI
AGO
NGA
COD
CPV
MLI
ZAF
GIN
RWA
KEN
TCD
NAM
ZWE
SYC
GNB
MWI
MOZ
BEN
CMR
GAB
MUS
GMB
CAF
SLE
COM
BFA
TZA
NER
ZMB
CHA
BWA
SEN
UGA
ETH
STP
TGO
DRC
CIV
SWZ
MDG
Perce
nt
Perce
nt of
GDP
Nonresource taxes as a share of GDP (lhs) Share of nonresource taxes collected at customs (rhs)Sources: World Revenue Longitudinal database; and IMF Fiscal Affairs Department Sub-Saharan Africa Tax Revenue database. Note: lhs = left scale; rhs = right scale. See page 91 for country abbreviations table.

2. DOMESTIC REVENUE MOBILIZATION IN SUB-SAHARAN AFRICA: WHAT ARE THE POSSIBILITIES?
41
• While improvements in the functioning of taxsystems can help close tax gaps, this may notbe enough to attain key fiscal objectives suchas supporting higher levels of public spendingto achieve the Sustainable Development Goals.Additional revenue mobilization would alsorequire reforms to tackle the underlying struc-tural factors—notably corruption, governmenteffectiveness, and inequality—that are currentlyacting as constraints.
While the tax frontier is on average similar across country groups in sub-Saharan Africa, large variations exist in tax effort and tax gaps. Oil producers have the lowest tax effort and highest average tax potential, at 5 percent of GDP or more. This suggests that revenue performance in these countries is relatively weak, while other resource and nonresource countries show lower levels of tax potential of about 3 percent of GDP. A similar pattern exists for non–sub-Saharan countries, but with substantially different tax frontiers (Figures 2.24 and 2.25).
The results suggest that most sub-Saharan African countries still have considerable potential to collect higher taxes through reforms (Figure 2.26). Also, the relatively lower tax frontier in sub-Saharan Africa implies that improvement in macroeconomic fundamentals and institutional factors could raise the tax frontier, and hence increase the possibilities to mobilize greater tax revenue. Regression analysis comparing the tax frontiers based on changes in income inequality, corruption, and government effectiveness show that policies addressing institu-tional weakness could also help boost revenue col-lection. This can operate through several channels, including an increase in tax compliance, as citizens realize the government is more likely to use their taxes for more transparent and efficient spending programs (IMF 2015b).
It is also useful to consider the revenue mobilization challenges facing countries with different tax collec-tion levels.
• Countries with low tax collection levels thathave not reached a minimum threshold ofabout 12½ to 13 percent of GDP (earlierreferred to as a “tipping point”) will needreforms to increase the efficiency of collectionbut will also need to find ways to push the taxfrontier to a higher level. For example, Nigeriacould double its tax-to-GDP ratio and exceed10 percent of GDP with reforms to improvethe efficiency of the system, but it would bedifficult to surpass the tipping point withoutimproving the structural factors that couldpush its tax frontier to a higher level. Thiscould be achieved, for example, with policiesthat reduce corruption and improve
Figure 2.23. Sub-Saharan Africa: Tax Efforts
0
10
20
30
40
50
60
0 10 20 30 40 50 60
Perce
nt of
GDP
Tax frontier (percent)Sources: IMF, World Economic Outlook database; and IMF staff estimates.
Figure 2.24. Sub-Saharan Africa: Tax Frontier and Gap0
Figure 2.24. Sub-Saharan African Countries:Tax Frontier and Gap
Source: IMF, World Economic Outlook database; and IMF staff estimates.
0
5
10
15
20
25
SSA Oilproducers
Otherresource-intensivecountries
Non-resource-intensivecountries
Perce
nt of
GDP
Tax to GDP Tax gap
Note: SSA = Sub-Saharan Africa.
Sources: IMF, World Economic Outlook database; and IMF staff estimates.Note: SSA = sub-Saharan Africa.
Figure 2.25. Non-Sub-Saharan Africa: Tax Frontier and Gap
05
101520253035
Allnon-SSA
Oilproducers
Otherresource-intensivecountries
Non-resource-intensivecountries
Perce
nt of
GDP
Tax to GDP Tax gap
Sources: IMF, World Economic Outlook database, and IMF staff estimates.Note: SSA = sub-Saharan Africa.

REGIONAL ECONOMIC OUTLOOK: SUB-SAHARAN AFRICA
42
governance, or by increasing the level of spending on education, which could simulta-neously help to reduce inequality and create incentives to collect more taxes (for example through increases in the VAT rate) to finance the new spending levels.
• Countries with medium tax collection levels(tax-to-GDP ratio in the 13–18 percent ofGDP range) tend to have larger tax gaps. Thesecountries could mobilize, on average, about3½ percent of GDP in additional revenuesthrough reforms aimed at improving the effi-ciency of their current systems; for example,through a thorough review of existing taxes andexemptions. At the same time, there are somecountries, such as Côte d’Ivoire, Ethiopia, andMali, that seem to be relatively close to the taxfrontier. In these cases, efficiency gains couldproduce more limited results, and the focusshould also be on structural reforms to pushthe frontier to a higher level. While some of thefactors that affect the frontier move slowly overtime (GDP per capita) or are difficult to changequickly given capacity constraints, policies thatfocus on more inclusive growth or tackle cor-ruption can help in this regard.
• For countries with higher tax collection levels(over 18 percent of GDP), the tax frontier isalready at a relatively elevated level. As illus-trated in the next section, these are countriesthat have already invested substantially in
10 To help ensure that the episode is due to underlying rather than ephemeral factors, the algorithm rules out instances where the mobilization episode is preceded by large drops in nonresource revenue, possibly suggesting a bounce-back recovery, and rules out episodes that are followed by an immediate deterioration of performance during the subsequent two years. The algorithm also excludes episodes in countries with revenue ratios above 20 percent (relatively strong performers) and those that remained below 10 percent of GDP.
developing stronger tax collection institutions despite still-modest per capita income levels (Liberia, Mozambique) or that have higher levels of development and good governance (Botswana, Mauritius, Namibia, Seychelles). In this group of countries, despite having already achieved comparatively high tax-to-GDP ratios, there is still an average distance to the frontier of about 4 percent of GDP, suggesting that there is potential to mobilize additional revenues. However some countries may maintain lower taxes as a public policy choice; for example, on the desired size of government.
LESSONS FROM SUCCESSFUL REVENUE MOBILIZATION EPISODESThis section aims to identify lessons from success stories in revenue mobilization efforts. It focuses on nonresource revenues, where specific policy actions are under the control of country authori-ties, and finds that strong political commitment, as well as comprehensive reform strategies focused on building basic institutions and the tax base, are prerequisites for success. A simple algorithm is used to identify episodes of strong and steady improve-ment in nonresource revenues. In this instance, a successful episode is defined as a total increase of 2 percentage points of nonresource GDP over a three-year period, with no substantial declines in the revenue ratio within or immediately following the period.10
Figure 2.26. Sub-Saharan Africa: Tax Ratio and Tax Frontier
05
10152025303540
NGA
CAF
GNB
SLE
TCD
COD
MDG
BDI
COM
TZA
ETH
COG
UGA
ZMB
RWA
CMR
GAB
CIV
BFA
TGO
GHA
MLI
BEN
MWI
KEN
NER
GMB
CPV
SEN
MUS
LBR
GIN
MOZ
BWA
ZAF
ZWE
SWZ
SYC
NAM
Perce
nt of
GDP
Tax revenue to GDP ratio Tax frontier
Low Tax Collection
Medium Tax Collection High Tax Collection
Tipping Point
Sources: IMF, World Economic Outlook database; and IMF staff estimates.Note: Figure is computed based on 2015 data to ensure data coverage of key variables in the model. Recent GDP rebasing (for example, Liberia) has not been incorporated in the analysis. See page 91 for country abbreviations table.

2. DOMESTIC REVENUE MOBILIZATION IN SUB-SAHARAN AFRICA: WHAT ARE THE POSSIBILITIES?
43
Sustained revenue mobilization is difficult. Using a data set covering 44 sub-Saharan African countries from 2000–16, the analysis finds only six episodes of sustained revenue mobilization (Figure 2.27).11 The nonresource revenue gain during the three-year episodes ranges from 2.2 to 8 percent of nonre-source GDP, with an average annual increase of 1.2 percentage points and an average total revenue gain of 3.5 percentage points. In all cases, gains continued in subsequent years, with increases averaging 1 percentage point a year over the next three years. Data for 2016 indicate that the current level of revenue is at least at the same level it was at the end of the episode, and on average 3.4 percent of GDP higher than the episode end point, suggest-ing that the previous gains have become permanent.
Success is possible in a variety of circumstances and initial conditions. Successful episodes reflect a diverse cross section of countries, ranging from relatively low to medium levels of tax effort (Figure 2.28), and including a range of geography, income levels, fragility, and resource intensity (Table 2.1). One common factor is that countries tended to experience robust growth during the revenue mobilization episode (possibly indicating
11 Oil producers are omitted from the group of case studies in view of the potentially large spillover impact of cyclical commodity price swings on economic activity and nonresource revenues. 12 A review of country cases where revenue mobilization exceeded 2 percentage points of GDP over three years, but where such gains were not sustained over subsequent years, suggests a variety of factors can undermine robust performance. In Benin and The Gambia (2005–07), the post-episode deterioration in revenues stemmed from the same exogenous shock, that is the 2008 global financial crisis. In the cases of Burkina Faso (2010–13), Burundi (2009–11), Malawi (2008–10), and Mali (2013–15), the reversals resulted from a combination of factors, including weakening political stability and internal security, or policy changes with a negative impact on revenue mobilization. In the cases of Comoros (2010–12) and Ghana (2009–11), endogenous factors explain the failure to sustain revenue gains, such as reduced receipts from changes to the Comorian citizenship program, and weakening tax administration in Ghana.
tax buoyancy as a factor in revenue gains). However, an acceleration in growth was not required. In fact, only Liberia saw a significant acceleration in growth, while growth in other countries decelerated modestly from an average growth rate of 6.7 percent prior to the episode to 5.7 percent during the episode. Most episodes overlapped with intensified engagement with the IMF in the form of both lending and nonlend-ing programs and substantial technical assistance efforts.
The reform process does not follow a set template, but rather seems tailored to country circumstances (Table 2.2). However, all cases point to the need for a broad range of tax policy and revenue administra-tive reforms prior to and during the episode.12
Pursuing a Comprehensive Reform Strategy
Each country in the study embarked on a compre-hensive and multiyear reform strategy. There are some common elements, including a focus on basic institutions, measures to broaden the tax base, and modernization of tax administration institutions.
Figure 2.27 Sub-Saharan Africa: Nonresource Revenue Mobilization Episodes
5
10
15
20
25
30
t – 2 t – 1 t = 0 t + 1 t + 2 t + 3 t + 4 t + 5
Perce
nt of
nonr
esou
rce G
DP
Senegal 2001–03 Liberia 2006–10Mozambique 2007–12 Rwanda 2012–14Uganda 2014–16 Tanzania 2005–07
Sources: IMF, World Economic Outlook database; and IMF Fiscal Affairs Department Sub-Saharan Africa Tax Revenue database.Note: t + 1 is the first year of the revenue mobilization episode.
Figure 2.28 Sub-Saharan Africa: Nonresource Revenue Mobilization Episodes
0
5
10
15
20
25
30
LBR 2006–10
MOZ 2007–12
RWA 2012–14
SEN 2001–03
TZA 2005–07
UGA 2014–16
Perce
nt of
Nonr
esou
rce G
DP
Increase in revenue ratio during 3-year episodeInitial revenue ratio (at start of episode)2016 revenue ratio (2015 for Mozambique)
Sources: IMF, World Economic Outlook database and IMF Fiscal Affairs Department Sub-Saharan Africa Tax Revenue database.

REGIONAL ECONOMIC OUTLOOK: SUB-SAHARAN AFRICA
44
A key element was an emphasis on the basic building blocks of the tax system. The apparatus of national taxation can be conceived of as a pyramid, where foundational institutions provide the base for more complex administrative and technological transformations (Figure 2.29). While the sequencing depends on country circumstances, all the countries invested significant effort in the basic building blocks of an effective and modern tax policy and administration, such as a taxpayer identification number, a semiautonomous revenue authority, the VAT, and taxpayer segmenta-tion. Ex post assessments have found that the introduction of such reforms has been associated with increased revenue in a wide range of sub-Saharan African countries (Ebeke, Mansoor, and Rota Graziosi 2016). These institutions were largely well entrenched before the revenue
mobilization episodes. The exceptions were Liberia and Mozambique, two countries emerging from prolonged internal conflict. Liberia was still in the incipient stages of rebuilding, but quickly embarked on a broad reform agenda to introduce several elements of these building blocks. Mozambique was more advanced, having pursued a broad reform agenda since the mid-1990s that started with overhauls of customs and domestic indirect taxes and introduction of a VAT, before shifting to establishment of a revenue authority and a large taxpayer unit early in the episode. Although these institutions were already established in the other countries, the record indicates continued attention to improve their functioning, notably in the form of reorganizations and medium-term strategies to strengthen capacity and coverage.
Table 2.1. Sub-Saharan African Revenue Mobilization Episodes: Background Information
Preceding 5-Year
Average
In Episode
Liberia 2006–10 Low Other Yes Yes –2.3 7.6
• Sustain economic reconstruction by creating a stable macroeconomic environment
• Strengthen revenue collection and expenditure control to channel resouces to poverty reduction; ensure transparency and accountability
Mozambique 2007–12 Low Non No Yes 9.1 6.9
• Consolidate macroeconomic stability; strengthen the financial sector and improve the lending environment
• Strengthen revenue, enhance efficiency and transparency of government operations, and improve social service delivery
Rwanda 2012–14 Low Non No Yes 8.0 7.0• Consolidate macroeconomic stability while reducing aid dependency
• Maintain a sustainable fiscal position while increasing domestic revenues
Senegal 2001–03 Mid Non No Yes 4.1 4.0
• High and equitable growth via better service delivery and a more attractive invesment climate
• Expand infrastructure and social services while safeguarding macroeconomic and debt sustainability
Tanzania 2005–07 Low Other No Yes 6.3 6.5• Contain inflation and support broad-based growth via infrastructure investment
• Steadily increase the revenue ratio to bolster macroeconomic performance and reduce aid dependency
Uganda 2014–16 Low Other No Yes 5.9 4.2
• Support the reform agenda for growth, focused on institutions, financial sector, and invesment climate
• Scale up investment; broaden and deepen tax base; PFM effectiveness; preparing for oil
Macroeconomic Objectives Fiscal ObjectivesCountry Episode Income Resource Intensity Fragile IMF
Program
Real Growth
Sources: IMF Article IV Reports; IMF Techical Assistance Reports; IMF Staff Memorandum; and IMF World Economic Outlook database.Note: PFM = public financial management.

2. DOMESTIC REVENUE MOBILIZATION IN SUB-SAHARAN AFRICA: WHAT ARE THE POSSIBILITIES?
45
Tabl
e 2.2
. Sub
-Sah
aran
Afri
can
Reve
nue M
obili
zatio
n Ep
isode
s: T
imeli
ne o
f Tax
Pol
icy an
d Ad
min
istra
tive R
efor
ms.
2005
Crea
ted si
ngle
tax op
erati
on20
04PI
T ra
te inc
reas
ed fr
om 20
to27
.6 pe
rcent
2010
RRA
starts
colle
cting
socia
l sec
urity
co
ntribu
tions
, impr
oving
cove
rage
20
00Si
ngle
rate
VAT
at 18
perce
nt20
03Re
venu
e auth
ority
adop
ts me
dium-
term
corp
orate
plan
for
mode
rniza
tion
2012
Roll o
ut e-
tax se
rvice
s to u
pcou
ntry
statio
ns; ta
xpay
er ed
ucati
on on
e-tax
2006
Stre
ngthe
n lar
ge-ta
xpay
er au
dit
functi
on; in
creas
e lar
ge
taxpa
yer b
ase
2004
Orga
nic La
w for
Tax
Trib
unals
20
11Cu
stome
r sati
sfacti
on su
rvey t
oinf
orm
strate
gic fo
cus
2000
Mana
geme
nt of
centr
al an
d loc
al go
vern
ment
taxes
in a
single
dir
ector
ate20
04Ne
w tax
law:
self a
sses
smen
t, sim
plify
small
busin
ess t
ax, r
estor
e ca
pital
gains
tax
2013
Issua
nce o
f nati
onal
IDs
2006
Web
posti
ng of
finan
cial
statem
ents
of re
venu
e-ge
nera
ting a
genc
ies20
06PI
T ra
te inc
reas
ed to
32 pe
rcent
2012
Revis
ed in
vestm
ent c
ode t
o red
uce
exem
ption
s20
00Si
ngle
taxpa
yer r
egist
ratio
n sys
temat
tax an
d cus
toms d
epar
tmen
ts20
04Do
uble
VAT
thres
hold,
incre
ase
pres
umpti
ve ta
x20
13Inc
reas
e fue
l exc
ise an
d new
levy
on
mob
ile m
oney
tran
sfers
2007
Broa
dene
d tax
base
by vo
iding
tax
conc
essio
ns an
d duty
ex
empti
ons
2006
Estab
lishe
d Rev
enue
Auth
ority
, de
velop
ed m
edium
-term
stra
tegic
plan
2012
Elec
tronic
sing
le wi
ndow
syste
m at
custo
ms20
01St
udy o
n rev
enue
impa
ct,
bene
ficiar
ies, a
nd le
gal b
asis
of tax
ex
empti
ons
2004
Imple
ment
functi
on-b
ased
larg
etax
paye
rs de
pt, ex
pand
cove
rage
2013
Impr
ove r
isk pr
ofiles
for t
axpa
yer
segm
ents
focus
ing on
key a
ctors
2007
Imple
ment
new
taxpa
yer
identi
ficati
on nu
mber
2008
Spec
ific ta
xes o
n fue
l incre
ased
, au
tomati
c qua
rterly
adjus
tmen
t20
12Int
rodu
ced s
pecia
l tax r
egim
e for
sm
all an
d micr
o ente
rpris
es20
03Int
egra
tion o
f the I
T sy
stems
of th
e tax
, cus
toms,
and t
reas
ury
direc
torate
s20
05VA
T an
d inc
ome t
ax ad
minis
tratio
n un
der D
omes
tic R
even
ue
Depa
rtmen
t20
13Tr
ansit
ion to
ASY
CUDA
Wor
ld
2008
Reor
ganiz
e dom
estic
tax
admi
nistra
tion b
y tax
paye
r se
gmen
tation
2008
Larg
e tax
paye
rs un
it cre
ated;
expa
nded
larg
e tax
paye
r bas
e20
12E-
filing
and e
-pay
ment
syste
ms;
pens
ion an
d med
ical in
sura
nce i
n e-
Tax s
ystem
2003
Sing
le tax
paye
r ID
numb
er20
05Am
ende
d Inv
estm
ent A
ct, lim
its
fisca
l stab
ility c
lause
s to a
t mos
t 5
year
s20
14Pu
blica
tion o
f tax e
xemp
tion
bene
ficiar
ies; ta
x pro
cedu
re co
de
2010
Resta
rt tax
paye
r aud
its20
09Ini
tiated
paym
ent o
f taxe
s thr
ough
bank
s20
13Me
dium-
term
reve
nue m
obiliz
ation
plan
2003
Synth
etic t
ax fo
r sma
ll bus
iness
es
in lie
u of th
e VAT
, the C
IT, a
nd th
e bu
sines
s lice
nsing
fee
2005
Publi
cize b
enefi
ciarie
s of ta
x ex
empti
ons u
nder
vouc
her s
chem
e20
14Na
tiona
l-sub
natio
nal c
oord
inatio
n on
taxp
ayer
iden
tifica
tion
2010
Deve
loped
new
Inves
tmen
t Act
2010
Revis
ions t
o exc
ise ta
xes o
n alc
ohol
and t
obac
co20
13On
e-sto
p bor
der p
osts
2004
Stre
amlin
ed In
vestm
ent C
ode t
ofoc
us on
prior
ity in
dustr
ies20
06AS
YCUD
A++,
crea
te ris
k ma
nage
ment
datab
ase a
nd po
st-cu
stoms
audit
polic
y20
14CI
T ex
pand
ed to
eligi
ble pr
oper
ty,
inter
est e
arne
d on l
oans
to ce
rtain
secto
rs
2010
Autom
ated a
dmini
strati
on of
tax
(ITAS
) 20
11De
ploye
d reg
istra
tion s
ystem
for
VAT
modu
le of
e-Ta
x sys
tem20
14Ne
w pr
oper
ty tax
legis
lation
2004
New
softw
are f
or pr
oper
ty tax
base
; dig
itizati
on of
land
and f
ores
t re
gistry
2006
Index
exise
s on n
on-p
etrol
items
, e.g
. alch
ohol,
toba
cco,
and m
obile
airtim
e20
14VA
T ga
p ana
lysis
and s
trateg
y; re
view
VAT
regis
ter an
d led
ger
2010
Custo
ms au
tomati
on
(ASY
CUDA
) and
roll o
ut of
one-
stop c
ustom
s at p
orts
2013
Simp
lified
tax s
ystem
for s
mall
taxpa
yers
2014
Expa
nding
use o
f elec
tronic
billi
ngma
chine
s20
05Si
mplifi
ed C
IT an
d red
uced
its
effec
tive r
ate fr
om 35
to 33
perce
nt20
07Es
tablis
h ded
icated
units
at si
x RA
office
s to s
erve
med
ium-si
zed
taxpa
yers
2014
Elim
inate
spec
ific st
atutor
y inc
ome
and V
AT ex
empti
ons;
cut n
umbe
r of
zero
rate
good
s
2010
Lowe
red C
IT/P
IT fr
om 35
pe
rcent
to 25
perce
nt, br
oadly
ali
gned
to re
gion
2014
Revis
ed ex
empti
on an
d zer
o-ra
ting
sche
dules
unde
r the
VAT
-code
2015
High
er V
AT th
resh
old
2010
Incre
ased
taxe
s and
excis
e on
alcoh
ol, ai
rlines
, cell
phon
e us
age,
and h
otels
2014
Tax e
xpen
ditur
e bud
get
2015
Estab
lishe
d Nati
onal
Targ
eting
Ce
ntre
2014
The R
RA st
arts
colle
cting
de
centr
alize
d tax
es
Outso
urcin
g of c
ustom
s adm
inistr
ation
(1
996)
; VAT
and e
xcise
taxe
s ado
pted
(199
9); ta
x inc
entiv
es co
de (2
002)
; refo
rm
of inc
ome t
ax (2
003)
Reve
nue A
uthor
ity (1
998)
; VAT
(200
1); R
RA
functi
onal
reor
ganiz
ation
(200
3); S
IGTA
S (2
003–
07);
Incom
e tax
refor
m (2
005)
; exc
ise
tax am
ende
d (20
06);
segm
entat
ion (2
009)
VAT
(198
0); V
AT ad
minis
tratio
n co
mpute
rizati
on (1
999)
; larg
e tax
paye
r unit
(2
000)
; WAE
MU co
mmon
exter
nal ta
riff
(200
0)
Reve
nue a
uthor
ity (1
996)
; VAT
(199
8);
Trad
e tar
iffs re
duce
d (19
99);
Larg
e Ta
xpay
ers D
epar
tmen
t (20
01);
Taxp
ayer
ID
numb
er
Reve
nue A
uthor
ity (1
991)
; VAT
(199
6);
Larg
e tax
paye
rs off
ice (2
005)
; Med
ium
taxpa
yers
office
(200
9); P
IT to
p rate
inc
reas
e (20
12)
Prior
refor
ms
2014
–16
Libe
riaMo
zam
biqu
eRw
anda
Sene
gal
Tanz
ania
Ugan
da20
06–1
020
07–1
220
12–1
420
01–0
320
05–0
7
Foun
datio
nalr
efor
ms
Inte
rmed
iater
efor
ms
Adva
nced
refo
rms
Not
e: C
IT =
cor
pora
te in
com
e ta
x; P
IT =
per
sona
l inc
ome
tax:
VA
T =
valu
e ad
ded
Tax;
ITA
S =
Inte
grat
ed T
ax A
dmin
istra
tion
Sys
tem
; RR
A =
Rw
anda
Rev
enue
Aut
horit
y; A
SY
CU
DA
= A
utom
ated
S
yste
m fo
r Cus
tom
s D
ata;
SIG
TAS
= S
tand
ard
Inte
grat
ed G
over
nmen
t Tax
Adm
inis
tratio
n S
yste
m; W
AE
MU
= W
est A
frica
n E
cono
mic
and
Mon
etar
y U
nion
.

REGIONAL ECONOMIC OUTLOOK: SUB-SAHARAN AFRICA
46
All countries paid special attention to measures to build the tax base, simplify the tax system, and tackle exemptions and incentives. The countries in the study appear to have made limited use of tax policy rate adjustments. The focus was instead on measures to improve the effectiveness of tax policies and expand the tax base. All countries adopted measures to reduce base-narrowing exemptions by voiding or suspending certain tax exemptions (Liberia, Uganda), revising investment codes (Mozambique, Rwanda, Senegal, Tanzania), and eliminating distortions on value-added taxation (Rwanda, Senegal, Uganda). Measures were also adopted with an aim to reach certain “hard to tax sectors” by introducing simplified tax regimes for small businesses (Mozambique, Rwanda, Senegal, Tanzania), making changes to VAT thresholds to better target high-value businesses (Tanzania, Uganda), expanding the network of withholding agents (Uganda), and strengthening specialized taxes, such as those on property and investment income (Rwanda, Senegal).
A focus on institutional development and modern-ization was also at the core of the reform program. This included efforts to improve tax administration processes, particularly to refocus core opera-tions, and developing effective information and communication technology (ICT) systems. This initiative included efforts to customize services and enforcement to different taxpayer segments (small, medium, and large) by deploying specialized units, among other things. In fact, all countries in the
study adopted some form of taxpayer segmentation, with Rwanda, Tanzania, and Uganda dedicating resources to, and initiating specific risk-based com-pliance strategies for, different taxpayer segments. ICT reforms have helped these SSA countries to leapfrog from basic infrastructure to recent technol-ogies as part of broader efforts to reduce compliance costs, and to simplify taxpayer registration, filing and payment, audit, collection enforcement, and appeals (Box 2.1). Platforms were also developed to combine domestic tax and customs operations, and to simplify customs clearance operations. All countries in the study appear to have been fast adopters of automating systems across domestic tax and customs administration. Several rolled out their first e-tax platforms during 2011–13. Rwanda further advanced with the introduction of mobile tax payments, integration of social contributions into the e-tax system, and the rollout of electronic billing machines to underpin the buoyancy of the VAT.
Need for Strong and Sustained Political Commitment
Clearly, a sound reform strategy that seeks to build effective and modern institutions is essential, but so too is political commitment to carry out reforms. Progress on revenue mobilization is usually slow, requiring perseverance to implement reforms. Transparency can be a helpful tool to maintain the momentum of reform.
Gains are usually incremental over prolonged periods of time. Countries that are rebuilding institutions following internal conflict can rebuild a fractured revenue base relatively quickly with the help of an ambitious reform plan, as was the case with Liberia, where the nonresource revenue ratio rose by 2.6 percentage points each year over three years. However, the norm appears to be that the dividend from structural reform accrues more slowly. Among this group of strong perform-ers, where considerable progress had been made on several foundational reforms even before the revenue episode, average annual increases in nonre-source revenue were about 0.9 percentage point of GDP a year during the episode. After the episode, gains tended to slow to 0.7 percentage point, although there has been considerable variation in the outcomes.
Figure 2.29 Progression of Tax Policy and Administrative Reforms
- Optimization of existing taxes- Modernization and innovation, e.g., e-tax- Tax expenditure
- Tax base broadening- Strengthening tax administration- Comprehensive monitoring, reporting,
and publication of tax exemptions
- Basic institutions, e.g., revenue authority- Basic taxes, e.g., VAT- Limited exemptions- Identification of taxpayers- Basic enforcement and taxpayer segmentation- Basic technical resources, e.g., IT system
Source: IMF staff estimates.

2. DOMESTIC REVENUE MOBILIZATION IN SUB-SAHARAN AFRICA: WHAT ARE THE POSSIBILITIES?
47
As a result, perseverance and the capacity to sustain reform momentum over time are essential. Higher and more reliable revenue streams are achieved over a period of several years. It is therefore not surpris-ing that the countries studied here each pursued a broad range of policy and administrative reforms over a prolonged period, highlighting the impor-tance of strong political commitment. Such reforms are ultimately a product of the political process, and are likely to face resistance from entrenched interests. Sustained commitment is needed to enact new laws, effect policy changes, and find sufficient resources for effective implementation. Elements that have supported implementation include the following:
Medium-term revenue strategies. A multi-year revenue mobilization strategy enhances the impetus and commitment for reform. Such plans were adopted ahead of, or concurrently with, the mobilization episodes in Senegal (2003), Tanzania (2003), Mozambique (2006), and Rwanda (2013). An important aspect to ensure the success of the strategy is the focus on taxpayer-centric policies to improve compliance, which typically includes more consultation with the private sector and more accountability and responsiveness of tax authorities to taxpayers.
• Stability. Peace and stability are preconditionsfor success. Fragile countries subject to frequentcoups d’état, armed conflict, or the incapacityof the state to maintain law and order in a sub-stantial part of the territory tend to have verylow tax-to-GDP ratios (often below 10 percent
of GDP). At the same time, consistent commit-ment of the political leadership to the reform strategy played a key role in several cases. While ministerial-level changes can energize reforms, they often result in delays or disruptions as plans are reassessed. The mobilization episodes in Mozambique and Senegal coincided with long-tenured ministers of finance, both in office for more than 10 years. The other case studies had at most two ministers of finance in the years leading up to and during the episode. Rapid turnover in key revenue administration staff, or inadequate attention to human resource management (for example, not providing adequate training or some degree of autonomy to the revenue authority), can also prevent progress.
• Technical assistance and IMF engagement.All countries received prolonged technicalassistance from the IMF and maintained IMF-supported programs containing a substantialemphasis on revenue mobilization efforts(Figure 2.30). An intensified engagement withthe IMF, as was the case across this group ofcountries, can provide a useful sounding boardin the development and implementation ofa strategy. However, it cannot substitute forsteadfast political will. In the cases under study,there were considerable technical challenges inthe implementation of revenue mobilizationmeasures, as well as delays in implementation ofstructural reforms related to the elimination oftax exemptions in the cases of Liberia, Rwanda,and Uganda.
Figure 2.30. Revenue Mobilization Episodes and IMF Supported Programs, 2001–16
2001 02 03 04 05 06 07 08 09 10 11 12 13 14 15 16
SENEGAL
RWANDA
LIBERIA
MOZAMBIQUE
ECF
ECF ECF
ECF
PSI SCF
ECF
ECF
TANZANIAECFECF
UGANDA
EFF
PSI
PSI
PSI
PSI
PSI PSIPSI SCF
PSI PSI SCF
PSI PSIPSI
SMP
ECF
PSI
Source: Monitoring of Fund Arrangements (MONA) database.Note: ECF = Extended Credit Facility; EFF = Extended Fund Facility; PSI = Policy Support Instrument; SMP = Staff-Monitored Program; SCF = Standby Credit Facility.

REGIONAL ECONOMIC OUTLOOK: SUB-SAHARAN AFRICA
48
Transparency and outreach can play a decisive role. Explaining the importance of reform objectives to the public and private sectors can build support for the reforms and help develop a change in the taxpayers’ culture and in taxpayer compliance. Several of the countries emphasized outreach strategies to help build support for key reforms. Tanzania and Uganda regularly published the names of beneficiaries of tax breaks to help support efforts to reduce the prevalence of exemptions, and Uganda published a VAT compliance gap analysis. Liberia published the financial accounts of revenue-generating agencies to address mismanagement of public funds. Rwanda and Uganda launched taxpayer education programs to foster compliance and improve service delivery.
CONCLUSION AND POLICY IMPLICATIONSSub-Saharan African countries could mobilize on average up to 5 percent of GDP in additional tax revenues in the next few years. Historical experience suggests that the conditions for success require attention to many factors related to policy design, institutional development, and political support. Not surprisingly, economic and political stability are preconditions for success.
Policy design is key, and inadequate tax policies cannot be offset by institutional reforms. If a country does not have a sound VAT, provides excessive tax incentives, and does not have a framework to ensure tax compliance, there is little the revenue administration can do to close tax gaps. Successful experiences in revenue mobilization have relied on efforts to implement broad-based VATs, gradually expand the base for direct taxes (CIT and PIT), and implement a system to tax small businesses and levy excises on a few key items (IMF 2011). While the specifics may vary by country, these are basic tax policy principles that have endured the test of time. Attention to contemporary issues like the role of property taxes or modern technologies is useful, but getting the basics right is a precondition for success.
Institutional development and ongoing revenue administration reforms based on a medium-term plan are essential. Countries have shown progress
when they focus on adequate risk management (that is, allocating resources where revenue potential is greatest) and taxpayer segmentation (starting with a large taxpayer office). This requires developing the capacity to study which economic sectors offer the greatest potential, building a reliable registry of the largest taxpayers, and developing the capacity to conduct well-targeted audits. In countries with very low tax-to-GDP ratios, the potential gains from institutional reforms are larger, but the capacity to implement them is also more limited. However, the experience of Liberia and Mozambique, two postconflict countries, suggests that sustained reforms over time are possible even when the initial level of capacity is low.
Improving governance, controlling corruption, and focusing on the efficiency and transparency of public spending also appear to be preconditions for success. The level of tax compliance depends on the availability of mechanisms to ensure enforce-ment and the willingness of citizens to accept the legitimacy of the state to collect taxes. When citizens perceive that the tax system is fair (for example, it does not exclude powerful individuals and politically connected firms) and that revenues are used to finance productive spending programs, they are more likely to accept their tax obliga-tions. Therefore, the transparent publication of who benefits from tax exemptions or incentives, as well as public financial management reforms that increase the efficiency and transparency of public spending, can be helpful instruments to support tax reform efforts. At the same time, customs and tax officials are more likely to remain professional and preserve the integrity of the system when political leaders, at the highest level show their commitment to reform through an adequate system of incentives and sanctions. This is illustrated by the case of Rwanda, a country that has one of the best track records in its anti-corruption efforts and has made remarkable progress in revenue mobilization efforts.
Finally, specific reform efforts and policies need to be defined at the country level using local knowledge, and country authorities are best placed to lead this exercise. There are, however, five steps that could usefully guide this process:

2. DOMESTIC REVENUE MOBILIZATION IN SUB-SAHARAN AFRICA: WHAT ARE THE POSSIBILITIES?
49
1. Identify the taxes that offer the greatestpotential. For most sub-Saharan Africancountries, improving the VAT offers substantialpotential given its current low efficiency in mostcases. But there should be a systematic assess-ment of the potential associated with othertaxes, including the CIT (where excessivetax exemptions/incentives have been erodingthe base), the PIT (where there should be aneffort to gradually expand coverage), and excisetaxes. Despite the general decline in customsduties, stricter enforcement of customs rulesand procedures could also help mobilize addi-tional revenues. There is also potential in otherareas, such as real estate taxes, though manycountries have so far achieved limited progressin this area.
2. Review the legal framework and tax policydesign. Once the potential of the various taxeshas been established, there will be a need toalign tax policies with the new objectives. Insome cases, this may mean the introduction ofa VAT, or the reduction of exemptions and theintroduction of sanctions for noncompliance.
3. Assess the institutional framework. Thisshould be done at two levels. First, there is theunderlying supporting framework coveringgovernance aspects. Countries that have weakgovernance are less likely to be effective in theirrevenue mobilization efforts. A greater emphasison improving governance and controlling cor-ruption seems crucial. In sub-Saharan Africa,the countries that are ranked highest in termsof control of corruption and good governance
13 Seven of the 10 countries that are ranked highest in the control of corruption dimension of the World Bank Worldwide Governance Indicators have a relatively high tax-to-GDP ratio (above 18 percent of GDP). These include Botswana, Cabo Verde, Mauritius, Namibia, Senegal, Seychelles, and South Africa. Rwanda also scores high in control of corruption and has made great progress in revenue mobilization. The two other countries have lower tax-to-GDP ratios associated with other factors, such as fragility (São Tomé and Príncipe) or some political instability (Burkina Faso).
also tend to have higher levels of tax effort. And this effect is statistically significant even after controlling for the impact of per capita GDP. This finding confirms recent research on this issue (IMF 2016).13 But there is also the opera-tional framework, which covers institutional arrangements that have proven effective, such as the establishment of a revenue authority that follows specific principles.
4. Define a medium-term revenue strategy.There is consensus in the literature that this is akey step. The strategy should provide medium-term objectives and short-term goals, and couldalso define capacity-building needs. A convinc-ing strategy would need to explain why thestate is seeking to collect additional taxes.
5. Build a constituency for reform. The successof the medium-term strategy will dependon the structures of horizontal and verticalaccountability. Horizontal accountability refersto the capacity of the government to convinceother political parties that revenue mobilizationis in the broader interest of the country. This isimportant to avoid reversals in cases of govern-ment changes after elections, given that revenuemobilization takes time. Vertical accountabilityrefers to the social contract between the stateand its citizens to ensure compliance. The stateexercises its legitimate right to collect taxes inexchange for effective and transparent govern-ment spending. Public outreach efforts wouldbe helpful, but they would need to be based ona credible commitment to better governanceand transparency.

REGIONAL ECONOMIC OUTLOOK: SUB-SAHARAN AFRICA
50
Box 2.1. Looking ahead: Digital Revenue Mobilization
Digitalization has enabled a massive increase in the capacity to capture, retain, and process vast amounts of data. Its impact on tax policy and administration is multifaceted. It empowers tax policymakers with quick access to more reliable information. It reduces costs for both administrators and taxpayers, as digital infrastructure eliminates numerous manual processes related to recording, counting, and collecting tax files and payments. It can also deepen the tax base by reducing the use of cash and facilitating analysis of chains of transactions. And it can significantly benefit the business climate by clarifying tax rules and speeding up processes.
Sub-Saharan African tax authorities have seized upon digitalization as an opportunity to leapfrog from basic infrastructure to recent technologies. Several countries have already introduced online e-tax portals, mobile tax payments, and online reimbursement of value-added tax (VAT) credits. Nonetheless, progress has been uneven and halting, as implementation faces important hurdles in the region, including
• Low levels of internet penetration that limit the reach of some platforms.
• Inherent complexity, where platforms require extensive development and adaptation in a context ofincomplete or low-quality data, with potentially significant financial and reputational risks.
• Sociopolitical challenges, including weak enforcement and little trust in government.
With these shared problems in mind and with a desire to design solutions appropriate to national circumstances, a number of peer-to-peer learning workshops on technology-enabled ideas and navigating the political economy of such reforms have been organized, including the 2016 Hackathon in Senegal and the 2017 Ideas Workshop in Uganda. These events brought together participants from different nations, institutions, and the private sector to identify issues and brainstorm solutions. Experts then evaluated these homegrown proposals, picking the most practicable areas for further work. In Senegal, the participants considered that expanding the menu of mobile options could help improve e-tax accessibility. In Uganda, the interest was in encouraging the deployment of elec-tronic fiscal devices—portable and increasingly inexpensive devices that record business transactions—in order to improve compliance with sales taxes and the VAT. Participants also suggested establishing a gateway for the collection of third-party data to help identify and cross-check tax liabilities.
These initiatives suggest a useful approach to building ownership by ensuring that reforms are homegrown, driven by an intimate knowledge of local circumstances, and informed by a pragmatic dialogue among policymakers and practitioners. Indeed, in the preparation of specific medium-term revenue mobilization plans, country authorities should consider organizing similar seminars to draw on inputs and ideas from a broad range of stakeholders.

2. DOMESTIC REVENUE MOBILIZATION IN SUB-SAHARAN AFRICA: WHAT ARE THE POSSIBILITIES?
51
Box 2.2. Modeling the Economic Impacts of Revenue Mobilization in Resource-Rich Sub-Saharan African Countries
Application to the Central African Economic and Monetary Community
Sub-Saharan African countries need to raise revenues to support their efforts to reach the United Nations Sustainable Development Goals and ensure debt sustainability. The need for revenue mobilization is particularly important in sub-Saharan Africa’s resource-rich countries, which have suffered the impact of the large drop in commodity prices since 2014, and have the lowest tax effort and biggest tax gap in the region. This box analyzes the potential economic impact of revenue mobilization in the Central African Economic and Monetary Community (CEMAC) region, which is rich in natural resources, and where these issues have become particularly important. The analysis examines two questions:1
• What are the main macroeconomic and distributional impacts of an improvement in non-oil revenuemobilization?
• How can undesirable distributional effects be addressed by using some of the newly created fiscal space?
Through the calibration of a theoretical macroeconomic model for the CEMAC region, the analysis first simulates how private consumption and investment, public debt, and other key macroeconomic variables are affected by two different sources of higher non-oil revenue mobilization: (1) an increase in value-added tax (VAT) rates, one of the most important sources of non-oil tax revenue in the region; and (2) an improvement in the efficiency of collection of existing taxes. The analysis then investigates how the enhanced revenue mobilization deriving from a higher VAT rate can be used to mitigate undesirable distributional effects.
The simulation analysis uses the IMF Debt, Investment, Growth and Natural Resources (DIGNAR) model developed in Melina, Yang, and Zanna (2016). DIGNAR is a real model of a small open economy with three production sectors, productive public capital, and three types of debt: commercial, external, and concessional. Importantly, there are two types of households: (1) non–financially constrained (NFC) households with access to capital and financial markets; and (2) financially constrained (FC) households, which are poor and consume all their disposable income each period.
Key results are as follows:
1. Non-oil revenue mobilization helps reduce government debt and can increase long-term growth,but with potentially undesirable distributional effects.
Figure 2.2.1. presents simulations of the macroeconomic effects of an increase in the VAT rate or an expansion of the tax base through greater efficiency. Both policy measures would increase non-oil revenues while reducing public debt and private consumption for NFC households. Initially, non-oil GDP falls, in line with the empirical literature on short-term fiscal multipliers. It recovers in the medium term, driven by an increase in private invest-ment—in turn boosted by higher savings—and net export and reaches a higher-than-initial level in the long run when revenue gains are realized due to an improvement in tax collection efficiency.
In terms of differences between the two revenue-increasing measures, the improvement in revenue collection through efficiency allows for lower tax rates for a given level of debt. It also has more desirable distributional properties as the negative impact falls largely on the consumption of NFC and not of FC consumers. Importantly, the impact on non-oil GDP is smaller, and its recovery is stronger, when the focus is on collection efficiency rather than on increases in the VAT rate. In contrast, the increase in VAT rate negatively affects particularly the con-sumption of FC consumers because they have a larger marginal propensity to consume than NFC households.
This box was prepared by Giovanni Melina and Marcos Poplawski-Ribeiro with support from Mathilde Perinet.1 For an analysis of the economic effects of shocks on oil revenues, see Araujo, Poplawski-Ribeiro, and Zanna (2016).

REGIONAL ECONOMIC OUTLOOK: SUB-SAHARAN AFRICA
52
2. Policies targeting the most vulnerable improve distributional outcomes
A second set of simulations (Figure 2.2.2) shows the effects of channeling a fraction (for example, half) of the additional non-oil revenue obtained from higher VAT rates either to targeted transfers toward FC households or to public investment. The combination of an increase in VAT rates and additional public investment is especially good at mitigating the negative effects of the fiscal consolidation on non-oil GDP. In addition, the mix of an increase in VAT rates with targeted cash transfers is a powerful tool to mitigate adverse effects on FC households.
One caveat is in order: it is possible that by channeling public investment to projects that affect the poor—projects that reduce unemployment in poor households, this policy may also act as a mitigating mechanism for inequality. This channel is missing in the DIGNAR model. Indeed, Furceri and Li (2017) empirically find that increases in public investment reduce income inequality, although Furceri and others (2018) find that total government expen-ditures, including transfers, have a bigger multiplier effect on inequality.
This analysis focusing on the CEMAC region reinforces some key considerations in the design of fiscal adjustment strategies: revenue mobilization is a powerful means to create fiscal space and reduce government indebtedness, but it may also generate undesirable effects on inequality that can be addressed by mitigating policies such as cash transfer programs targeted to the most vulnerable groups of the population and the choice of revenue raising strategies.
DIGNAR Model and Calibration to CEMAC
To conduct the simulation analysis the box relies on the IMF Debt, Investment, Growth and Natural Resources (DIGNAR) model of Melina, Yang, and Zanna (2016). DIGNAR is a real model of a small open economy with two types of households and three production sectors. The intertemporal NFC households have access to capital and financial markets, while the FC households are poor and consume all the disposable income each period. The modeling of two types of households allows the simulations to shed light on consumption-inequality impacts of the different revenue mobilization strategies in the region. In turn, the three production sectors include a nontraded goods sector, a (nonresource) traded goods sector, and a natural resource sector. Each period the government’s total receipts consist of (1) taxes, including consumption taxes, labor income taxes, and resource revenues; (2) foreign aid; (3) bond sales; and (4) user fees on infrastructure services. The government’s total expenditures consist of (1) government consumption, (2) public investment, (3) transfers to households, and (4) debt service payments. As in Buffie and others (2012), borrowing can be done through issuing domestic debt, external commercial debt, and external concessional debt. The key investment-growth link in DIGNAR is that public investment creates produc-tive capital, which enters the production functions of traded and nontraded goods. Public investment, however, is subject to some investment inefficiency and absorptive capacity constraints. Dabla-Norris and others (2012) argue that high productivity of infrastructure can often coexist with very low returns on public investment in developing economies, because of investment inefficiencies that may be associated with corruption, among other things. As a result, all public investment spending does not necessarily increase the stock of productive capital. Similarly, absorptive capacity constraints related to administrative and management capacity and supply bottlenecks—which negatively affect project selection, management, and implementation, and raise input costs—can further reduce the efficiency of public invest-ment and have negative effects on growth, as suggested by Esfahani and Ramirez (2003).
We calibrate the initial steady state of the main macro-economic aggregates in the model using average values of observed variables over the last five years. The rest of the parameters are set at values appropriate for low-income countries as discussed in Melina, Yang, and Zanna (2016). Table 2.1.1 summarizes the CEMAC-specific calibration.
Target (Percent of GDP) ValueExports 40.1Imports 38.7Government consumption 14.6Government investment 11.9Private investment 16.2Resource sector 24.5Government domestic debt 12Government external concessional debt 13.2Government external commercial debt 10.4Grants 0.7
Source: IMF staff calculations.
Table 2.1.1. Calibration
Box 2.2. (continued)

2. DOMESTIC REVENUE MOBILIZATION IN SUB-SAHARAN AFRICA: WHAT ARE THE POSSIBILITIES?
53
–2.5
–2.0
–1.5
–1.0
–0.5
0.0
0.5
–1 0 1 2 3 4 5 6 7 8Perce
nt de
viatio
n fro
m ini
tial y
ear
3. [A] Consumption — FC
–1.0–0.5
0.00.51.01.52.02.53.0
–1 0 1 2 3 4 5 6 7 8
[A]–[
B]
5. Difference in Consumption Changes
–0.6–0.5–0.4–0.3–0.2–0.1
0.00.10.20.3
–1 0 1 2 3 4 5 6 7 8Perce
nt de
viatio
n fro
m ini
tial y
ear
7. Non-Oil GDP
–2.5
–2.0
–1.5
–1.0
–0.5
0.0
–1 0 1 2 3 4 5 6 7 8Perce
nt de
viatio
n fro
m ini
tial y
ear
4. [B] Consumption — NFC
–0.4
–0.2
0.0
0.2
0.4
0.6
-1 0 1 2 3 4 5 6 7 8Perce
nt de
viatio
n fro
m ini
tial y
ear
6. Private Investment
–5.0
–4.0
–3.0
–2.0
–1.0
0.0
–1 0 1 2 3 4 5 6 7 8
Perce
nt of
GDP
8. Change in Total Public Debt
Increase in the VAT rateImprovement in corporate tax collection efficiency
0.0
0.2
0.4
0.6
0.8
1.0
1.2
–1 0 1 2 3 4 5 6 7 8
Perce
nt of
GDP
1. Change in Non-Oil Tax Revenue
–2.5
–2.0
–1.5
–1.0
–0.5
0.0
–1 0 1 2 3 4 5 6 7 8Perce
nt de
viatio
n fro
m ini
tial y
ear
2. Private Consumption
Figure 2.2.1. Macroeconomic Effects of an Increase In Tax Revenues through Either the VAT Rate or Corporate Tax Collection Efficiency (Years on x-axis)
Source: IMF staff calculations.Note: FC = financially constrained; NFC = non–financially constrained; VAT = value-added tax.
Box 2.2. (continued)

REGIONAL ECONOMIC OUTLOOK: SUB-SAHARAN AFRICA
54
–0.6
–0.4
–0.2
0.0
0.2
0.4
0.6
–1 0 1 2 3 4 5 6 7 8Perce
nt de
viatio
n fro
m ini
tial y
ear
7. Non-Oil GDP
–5.0–4.5–4.0–3.5–3.0–2.5–2.0–1.5–1.0–0.5
0.00.5
–1 0 1 2 3 4 5 6 7 8
Perce
nt of
GDP
8. Change in Total Public Debt
Increasing revenues only via VATCombining with an increase in public investmentCombining with an increase in cash transfers
–0.8
–0.6
–0.4
–0.2
0.0
0.2
0.4
–1 0 1 2 3 4 5 6 7 8
[A]–[
B]
5. Difference in Consumption Changes
–2.5
–2.0
–1.5
–1.0
–0.5
0.0
–1 0 1 2 3 4 5 6 7 8Perce
nt de
viatio
n fro
m ini
tial y
ear
3. [A] Consumption — FC
0.0
0.2
0.4
0.6
0.8
1.0
1.2
-1 0 1 2 3 4 5 6 7 8
Perce
nt of
GDP
1. Change in Non-Oil Tax Revenue
–0.3–0.2–0.1
0.00.10.20.30.40.50.60.7
–1 0 1 2 3 4 5 6 7 8Perce
nt de
viatio
n fro
m ini
tial y
ear
6. Private Investment
–2.5
–2.0
–1.5
–1.0
–0.5
0.0
–1 0 1 2 3 4 5 6 7 8Perce
nt de
viatio
n fro
m ini
tial y
ear
4. [B] Consumption — NFC
–2.5
–2.0
–1.5
–1.0
–0.5
0.0
–1 0 1 2 3 4 5 6 7 8Perce
nt de
viatio
n fro
m ini
tial y
ear
2. Private Consumption
Figure 2.2.2. Mitigating Effects of Cash Transfers or Public Investment. (Years on x-axis)
Source: IMF staff calculations.Note: FC = financially constrained; NFC = non–financially constrained; VAT = value-added tax.
Box 2.2. (continued)

2. DOMESTIC REVENUE MOBILIZATION IN SUB-SAHARAN AFRICA: WHAT ARE THE POSSIBILITIES?
55
ANNEX 2.1: ESTIMATING TAX EFFORT AND TAX POTENTIAL
Definitions
The tax frontier is defined as the maximum theoretical level of tax revenues (measured in percent of GDP) that a country can achieve given certain underlying structural conditions (level of development, trade openness, sectoral structure, income distribution, institutions, etc.).
Tax effort is defined as the ratio of actual tax revenue to corresponding frontier tax revenue.
Tax potential reflects the distance between the tax frontier and the actual tax revenue level.
Tax potential can be achieved through higher taxation or better collection efficiency, which may be the result of specific policy choices.
Estimation Strategy
Step 1: Estimate the tax frontier from a cross-country panel data set
��� = �� � ����� � ��� � ��� ,
where ��� is the log of the tax revenue-to-GDP ratio for country � at period year � ��� is a vector of independent variables that affect ��� ��� is the inefficiency, which is correlated with ���, but independent from ���, and ��� is the residual, and normal distribution with �(���)
Step 2: Determine the tax effort
���� = ��� (���)��� (���������) = ��� (�� � ����� � ��� � ���)
��� (�� � ����� � ���) = �� �(����) .
Step 3: Determine the tax frontier and tax potential
���� = ���� � ��� = �������
� ��� .
Data and Variables
Log of tax to GDP: World Economic Outlook (WEO) Log of tax on goods and services to GDP: WEO Lag of log of real GDP per capita: WEO Lag of log of real GDP per capita squared: WEO Trade openness—sum of imports and exports in percent of GDP: WEO Agriculture: Value added of agriculture in percent of GDP: World Bank, World Development Indicators (WDI) Gini coefficient: WDI Oil: dummy for oil exporters General Government: dummy for General Government tax revenues. Corruption and Government Effectiveness: Worldwide Governance Indicators (WGI).
Annex 2.1. Estimating Tax Effort and Tax Potential

REGIONAL ECONOMIC OUTLOOK: SUB-SAHARAN AFRICA
56
Annex Table 2.1.1. Main Regression ResultsDependent Variable: Log of tax/GDP
Log of real GDP per capita 2.939 *** 2.866 *** 2.885 *** 2.781 *** 2.691 *** 2.716 ***Trade openness 0.002 *** 0.002 *** 0.002 *** 0.002 *** 0.002 *** 0.002 ***Agriculture –0.001 –0.001 –0.001 –0.001 –0.001 –0.001Gini coefficient –0.006 *** –0.006 *** –0.007 *** –0.006 *** –0.006 *** -0.006 ***General government 0.105 ** 0.109 *** 0.110 *** 0.091 ** 0.093 ** 0.098 **Education 0.015 *** 0.016 *** 0.016 *** 0.016 *** 0.018 *** 0.017 ***Oil dummy 0.080 ** 0.035 0.031 0.043 0.030 0.026Log of real GDP per capita squared –0.152 *** –0.148 *** –0.150 *** –0.142 *** –0.138 *** –0.140 ***Corruption 0.117 *** 0.083 * 0.134 *** 0.100 **Government effectiveness 0.091 * 0.088 *
Constant 4.165 *** 4.186 *** 4.256 *** 5.279 *** 4.945 ** 5.267 **Sigma_u 0.515 *** 0.515 *** 0.516 *** 0.525 *** 0.526 *** 0.526 ***Sigma_u 0.099 *** 0.098 *** 0.098 *** 0.106 *** 0.106 *** 0.105 ***
Number of observations 1,366 1,360 1,360 1,109 1,103 1,103Number of countries 122 121 121 99 98 98
All Sample Emerging Market and Developing Economies
Dependent Variable: Log of Goods and Services Tax/GDP
Log of real GDP per capita 2.379 *** 2.332 *** 2.353 *** 2.228 *** 2.173 *** 2.207 ***Trade openness 0.002 *** 0.002 *** 0.002 *** 0.002 *** 0.002 *** 0.002 ***Agriculture 0.000 0.001 0.001 0.000 0.001 0.001Gini coefficient –0.008 *** –0.008 *** –0.008 *** –0.009 *** –0.009 *** –0.009 ***General government dummy 0.142 0.146 0.152 0.140 0.164 * 0.168 *Education 0.003 0.007 0.006 0.004 0.009 0.008Oil dummy –0.642 *** –0.626 *** –0.634 *** –0.646 *** –0.581 *** –0.587 ***Log of real GDP per capita squared –0.122 *** –0.120 *** –0.122 *** –0.113 *** –0.111 *** –0.114 ***Corruption 0.123 0.052 0.140 0.065Government effectiveness 0.170 ** 0.172 *
Constant –0.615 –0.636 –0.615 0.621 1.258 1.075Sigma_u 0.660 *** 0.665 *** 0.665 *** 0.667 *** 0.672 *** 0.672 ***Sigma_u 0.162 *** 0.159 *** 0.159 *** 0.177 *** 0.174 *** 0.174 ***
Number of observations 1,152 1,146 1,146 930 924 924Number of countries 105 104 104 85 84 84
All Sample Emerging Market and Developing Economies
Source: IMF staff calculations.Note: *p < .10; **p < .05; ***p < .01.

2. DOMESTIC REVENUE MOBILIZATION IN SUB-SAHARAN AFRICA: WHAT ARE THE POSSIBILITIES?
57
Country Tax to GDP¹
A B C A B C A B CNigeria 5.9 11.1 11.1 12.0 10.7 10.4 12.0 8.1 8.3 8.5Central African Rep. 6.2 8.4 8.5 9.7 8.0 8.2 8.8 8.1 7.9 8.8Guinea-Bissau 7.0 9.8 9.7 9.8 9.6 9.5 9.5 10.0 9.5 9.7Sierra Leone 8.6 12.0 11.9 11.7 11.6 11.5 11.3 11.9 11.4 11.8Chad 8.9 10.9 10.4 11.5 10.2 10.1 11.5 9.2 9.1 9.2Congo, Dem. Rep. 9.4 11.2 11.1 12.2 11.0 11.1 11.8 10.4 10.6 11.2Madagascar 9.9 16.7 17.3 19.5 16.6 16.7 19.4 14.8 15.8 18.4Burundi 11.3 14.6 15.2 13.9 14.7 14.5 12.4 12.7 12.5 11.7Comoros 11.8 12.1 14.7 14.2 12.1 14.5 14.0 12.2 14.7 14.3Tanzania 12.4 20.3 20.9 19.5 20.2 19.8 19.7 18.3 18.6 19.4Ethiopia 12.7 13.8 14.2 13.2 13.9 13.8 13.1 13.3 13.3 13.1Congo, Rep. 12.8 19.3 18.6 19.5 19.0 19.1 19.6 17.5 17.8 19.2Uganda 13.0 18.3 19.1 22.1 18.9 18.4 21.0 18.4 17.7 20.8Zambia 13.3 13.7 14.1 21.2 13.8 13.9 21.5 14.6 14.8 21.7Rwanda 13.5 16.4 17.2 16.0 16.5 16.3 15.7 15.2 15.7 15.5Cameroon 14.0 19.6 19.0 20.7 18.9 18.6 21.3 18.7 18.1 20.9Gabon 14.3 20.2 19.3 26.6 20.3 20.6 24.1 15.2 15.6 16.0Côte d'Ivoire 15.1 15.7 15.6 15.7 15.7 15.7 15.8 15.8 15.8 15.9Burkina Faso 15.7 17.9 18.3 18.8 17.7 17.8 17.8 16.9 17.3 18.0Togo 16.2 18.2 17.7 18.9 17.6 17.8 18.6 18.2 18.1 18.6Ghana 16.3 23.7 25.2 21.4 25.0 23.9 22.0 24.8 24.3 22.9Mali 16.6 17.3 17.2 17.4 17.1 17.1 17.2 17.1 17.1 17.5Benin 16.7 19.1 19.2 19.2 19.0 18.8 19.4 17.8 18.1 18.9Malawi 16.8 18.5 20.1 21.4 19.3 18.9 19.6 17.7 17.6 18.8Kenya 17.5 21.6 22.2 19.3 22.0 21.0 19.3 22.9 21.1 20.2Niger 17.6 20.2 20.6 20.3 20.4 20.3 18.7 18.7 18.7 18.2Gambia, The 17.7 18.5 18.7 22.4 18.6 18.5 21.9 19.0 18.8 22.0Cabo Verde 18.4 20.9 21.0 22.0 21.1 21.2 22.7 20.1 21.0 21.8Senegal 18.7 21.4 21.8 22.6 21.7 21.8 22.5 20.4 21.4 22.3Mauritius 19.2 24.4 24.2 29.3 26.0 25.7 28.5 22.3 22.5 23.8Liberia 19.2 19.7 19.7 23.0 19.9 19.9 22.3 20.0 20.0 21.1Guinea 19.5 20.6 21.3 24.1 20.7 20.6 23.1 20.0 20.1 22.4Mozambique 21.7 31.5 33.4 36.1 32.7 32.3 33.9 27.5 28.5 29.9Botswana 24.3 32.8 33.3 32.7 34.8 34.8 31.4 31.4 31.9 27.3South Africa 24.7 26.9 26.9 31.1 27.9 27.6 30.5 25.5 25.4 26.2Zimbabwe 26.9 27.7 27.6 27.5 27.7 27.6 27.5 27.8 27.7 27.6Swaziland 28.3 30.4 29.8 30.1 30.4 30.4 30.5 30.3 30.4 29.6Seychelles 29.2 36.2 34.8 49.4 39.4 39.0 48.3 34.5 34.2 37.1Namibia 32.1 33.5 33.4 33.9 34.2 33.9 35.4 33.7 33.8 33.2
Average 16.2 19.6 19.9 21.3 19.9 19.8 20.9 18.7 18.9 19.6
All Countries Emerging Marktet and Developing Economies SSA Countries
Annex Table 2.1.2. Estimates of Sub-Saharan African Countries’ Tax Frontier (Percent of GDP)
Source: IMF staff calculations.Notes: Models A, B and C are based on the specifications listed in Annex Table 2.1.1, with log of tax to GDP as the dependent variable. Model A includes institutional factors and public spending on education. Model B includes public spending on education but not corruption or government effectiveness. Model C does not include corruption, government effectiveness or public spending on education.¹ Data correspond to 2015 in most cases, with the exception of Comoros, Seychelles, and Swaziland (all 2014), and Cabo Verde, Democratic Republic of the Congo, and Guinea-Bissau (all 2013). Year selection requires data availability for the set of independent variables in the model.

REGIONAL ECONOMIC OUTLOOK: SUB-SAHARAN AFRICA
58
REFERENCES
Akitoby, B., A. Baum, C. Hackney, O. Harrison, K. Primus, and V. Salins. Forthcoming “Large Tax Revenue Mobilization in Low-Income Countries and Emerging Markets: Lessons from a New Database.” IMF Working Paper, International Monetary Fund, Washington, DC.
Araujo, J., B. Li, M. Poplawski-Ribeiro, and L. Zanna. 2016. “Current Account Norm in Natural Resource Rich and Capital Scarce Economies.” Journal of Development Economics 120: 144–156.
Baum, A., S. Gupta, E. Kimani, and S. J. Tapsoba. 2017. “Corruption, Taxes and Compliance.” IMF Working Paper 17/255, International Monetary Fund, Washington, DC.
Buffie, E. F., A. Berg, C. Pattillo, R. Portillo, and L.-F. Zanna. 2012. “Public Investment, Growth, and Debt Sustainability: Putting Together the Pieces.” IMF Working Paper 12/144, International Monetary Fund, Washington, DC.
Casey, R., and P. Castro. 2015. “Electronic Fiscal Devices: An Empirical Study of the Impact on Taxpayer Compliance and Administrative Efficiency.” IMF Working Paper 15/73, International Monetary Fund, Washington, DC.
Crivelli, E., and S. Gupta. 2014. “Does Conditionality in IMF-Supported Programs Promote Revenue Reform?” IMF Working Paper 14/206, International Monetary Fund, Washington, DC.
Dabla-Norris, E., J. Brumby, A. Kyobe, Z. Mills, and C. Papageorgiou. 2012 “Investing in Public Investment: an Index of Public Investment Efficiency.” Journal of Economic Growth 17: 235–66.
Delipalla, S., and M. Keen. 1991. “The Comparison Between Ad Valorem and Specific Taxation under Imperfect Competition,” Journal of Public Economics 49: 351–67.
Ebeke, C., M. Mansour, and G.Rota Graziosi. 2016. “The Power to Tax in Sub-Saharan Africa: LTUs, VATs, and SARAs.” Études et Documents, no 11, Centre for Study and Research on International Development, Clermont-Ferrand, France.
Esfahani, H. S., and M. T. Ramirez. 2003. “Institutions, Infrastructure, and Economic Growth,” Journal of Development Economics 70(2): 443–77.
Fenochietto, R. and C. Pessino. 2010. Determining Countries’ Tax Effort. Hacienda Pública 195(4): 65–87.
Fenochietto, R., and C. Pessino. 2013. “Understanding Countries’ Tax Effort.” IMF Working Paper 13/244, International Monetary Fund, Washington, DC.
Furceri, D., J. Ge, P. Loungani, and G. Melina. 2018. “The Distributional Effects of Government Spending Shocks in Developing Economies.” IMF Working Papers 18/57, International Monetary Fund, Washington, DC.
Furceri, D. and G. Bin, Li. 2017. “The Macroeconomic (and Distributional) Effects of Public Investment in Developing Economies,” IMF Working Papers 17/217, International Monetary Fund, Washington, DC.
Gaspar, V., L. Jaramillo, and P. Wingender. 2016. “Tax Capacity and Growth: Is There a Tipping Point? “IMF Working Paper 16/234, International Monetary Fund, Washington, DC.
Gunter, S., D. Riera-Crichton, C. Vegh, and G. Vuletin. Forthcoming. “Non-Linear Effects of Tax Changes on Output: The Role of the Initial Level of Taxation,” World Bank, Washington, DC.
Gunter, S., D. Riera-Crichton, C. Vegh, and G. Vuletin. Forthcoming. “Policy Implications of Non-Linear Effects of Tax Changes on Output.” World Bank, Washington, DC.
International Monetary Fund, (IMF). 2011. “Revenue Mobilization in Developing Countries.” IMF Policy Paper, Washington, DC.
. 2012. “Macroeconomic Policy Frameworks for Resource-Rich Developing Countries.” IMF Staff Report, Washington, DC.
. 2015a. “Estimating the Tax Frontier.” Annex 1.1., Regional Economic Outlook: Sub-Saharan Africa, Washington, DC, October.
. 2015b. “Current Challenges in Revenue Mobilization: Improving Tax Compliance.” IMF Staff Report, Washington, DC.
. 2015c. “Fiscal Policy and Long-Term Growth.” IMF Policy Paper, Washington, DC.
. 2016. “Corruption: Costs and Mitigating Strategies.” IMF Staff Discussion Note, Washington, DC.
. 2017. “Sub-Saharan Africa’s Revenue Potential.” Chapter 2, Regional Economic Outlook: Sub-Saharan Africa, Washington, DC, October.
Melina, G., S.-C. S. Yang, and L.-F. Zanna. 2016. “Debt Sustainability, Public Investment, and Natural Resources in Developing Countries: The DIGNAR Model.” Economic Modelling 52(PB): 630–49.
Norregaard, J., 2013. “Taxing Immovable Property: Revenue Potential and Implementation Challenges.” IMF Working Paper 13/129, International Monetary Fund, Washington, DC.
Prichard, W., and D. Leonard. 2010. “Does Reliance on Tax Revenue Build State Capacity in Sub-Saharan Africa?” International Review of Administrative Sciences, 76(4): 653–75.
Thomas, A., and J. Treviño. 2013. “Resource Dependence and Fiscal Effort in Sub-Saharan Africa.” IMF Working Paper 13/188, International Monetary Fund, Washington, DC.

59
Private investment in sub-Saharan Africa is low compared with other countries with similar levels of economic development. The low level of private investment is constraining the region’s efforts to improve social outcomes by holding back labor productivity and the resulting gains in real wages and households’ income. In general, there appears to be a negative association between investment and poverty rates (Figure 3.1). The benefits from increasing investment are well recognized in the region. For example, many countries have engaged in major public investment programs to close large infrastructure gaps with a view to catalyzing private investment. But such a strategy can only be sustained for a limited amount of time, particularly if the private sector growth response is weak. With debt levels high and rising in many countries in the region, there is an increased focus on other options. Countries are participating in external investment initiatives such as the Group of Twenty’s (G20) Compact with Africa, which coordinates efforts to facilitate private investment and increase the provision of infrastructure, and China’s Belt and Road Initiative, which aims to help the region better integrate into global value chains. These initiatives aim to spur private and public invest-ment by improving the business environment and by increasing the availability of financing. These efforts could improve the availability and alloca-tion of resources for investment, and thus have the potential to raise medium-term growth prospects and living standards.
Against this backdrop, this chapter aims to shed light on what influences the level of private investment in sub-Saharan Africa. It does so by following a two-pronged approach that (1) uses econometric techniques to study the importance of the traditional determinants of private investment in a sample of emerging market and developing economies; and (2) examines the role of additional options, such as public-private partnerships (PPPs),
1 Throughout the chapter we use data for investment, private and public, available in the World Economic Outlook database and supplemented with data from the UN National Accounts database. Given the state of development of statistical systems in many countries in sub-Saharan Africa it is possible that some public investment ends up classified as private investment, especially in the case of investment undertaken by nonfinancial public sector entities not included in the central government accounts.
foreign direct investment (FDI), and special economic zones (SEZs), that have been implemented in some countries in an attempt to promote private investment.1
The main findings of the chapter are the following:
• Sub-Saharan Africa is the region with the lowest private-investment-to-GDP ratio among developing regions. Within sub-Saharan Africa, however, there is some heterogene-ity, with private investment ratios averaging about 14 percent in oil-exporting countries, 17 percent in other resource-intensive countries, and 15 percent in non-resource-intensive countries during 2010–16.
• Sub-Saharan African countries that have expe-rienced sustained increases in private invest-ment benefited from macroeconomic stability, stronger institutions, the discovery of natural resources, and the resolution of long-standing conflicts.
3. Private Investment to Rejuvenate Growth
This chapter was prepared by a team led by Jesus Gonzalez-Garcia and composed of Romain Bouis, Paolo Cavallino, Nkunde Mwase, Hector Perez-Saiz, Ludger Wocken, and Mustafa Yenice.
Figure 3.1. Poverty Headcount Ratio at $2 a Day in Purchasing Power Parity Terms and Real Private Investment Growth, 2000–16 (Percent of population and percent)
y = –0.06***x – 0.53
–3.5–3.0–2.5–2.0–1.5–1.0–0.5
0.00.51.0
–5 0 5 10 15 20
Chan
ge in
pove
rty he
adco
unt,
2000
–16
Average yearly real investment growth, 2000–16
Rest of the worldSub-Saharan Africa
Source: World Bank, World Development Indicators database.Note: The regression line is estimated using observations for sub-Saharan Africa and the rest of the world. To control for the effect of outliers, observations below the 5th percentile and above the 95th percentile were eliminated for each variable. *p < .10; **p < .05; ***p < .01.

REGIONAL ECONOMIC OUTLOOK: SUB-SAHARAN AFRICA
60
• Much as in advanced and emerging market economies, strong current and prospective economic activity is needed for firms to invest in new capital (IMF 2015c). Furthermore, such investment tends to be larger if it takes place in an environment with a strong regulatory and insolvency framework, efficient public infra-structure, greater trade openness, and deeper financial systems.
• Public investment can support private invest-ment, for example, by providing better infra-structure. Policymakers need to be mindful, however, that public investment may crowd out private investment. This could happen when public investment competes with private invest-ment (either for funding or in activities) in an environment with scarce financial resources or potentially binding supply bottlenecks. While this risk could be mitigated by promoting alter-native sources of financing for both public and private investment—including through PPPs and deepening of domestic financial markets—it would be imperative to ensure that the associ-ated risks are well managed. Attracting FDI and setting up SEZs could help, although the experience with the latter has been mixed.
The remainder of the chapter is organized as follows. The first section describes recent trends in private investment. The second section presents the empirical determinants of private investment. The third section zooms in on the various ways
2 Annex 3.1 explains the construction of these averages and the index shown in Figure 3.3, both of which use weights based on purchasing power parity GDP for the regional aggregation.
to alleviate the constraints to private investment, including financial deepening, new financial technologies (known as “fintech”), PPPs, FDI, and SEZs.
PRIVATE INVESTMENT TRENDS While public investment has been on par with other regions, private investment across countries in sub-Saharan Africa is, on average, 2 percent of GDP lower than in other developing economies (Figure 3.2). It averaged 15 percent of GDP during 2010–16, compared with 22 percent for developing economies in Asia, 18 percent in Europe, 17 percent in Latin America, and 16 percent in the Middle East and North Africa (MENA). This difference has, however, fallen by half since the early 2000s, due to a decade of rapid growth in sub-Saharan Africa, when private investment grew at an average rate of 14 percent a year. Since 2010, however, private investment has slowed, growing on average at 5 percent a year through 2014 and contracting during 2015–16 (Figure 3.3).2 There are reasons to believe that both global and domestic factors were at play in explaining this slowdown.
Indeed, the slowdown happened more gradually in sub-Saharan Africa than in other emerging market and developing economies, which also experienced a weakening of investment in the aftermath of the global financial crisis. Empirical studies attribute this general slowdown of investment to weaknesses in economic prospects in the United States and the
Figure 3.2. Selected Regions: Investment to GDP, 2000–16Figure 3.2: Developing Countries in Selected Regions: Investment to GDP, 2000–16
10
15
20
25
30
2000 02 04 06 08 10 12 14 16
Perce
nt of
GDP
1. Private Investment
15
20
25
30
35
2000 02 04 06 08 10 12 14 16
Perce
nt of
GDP
3. Total Investment
0
5
10
15
20
2000 02 04 06 08 10 12 14 16
Perce
nt of
GDP
2. Public Investment
051015202000 02 04 06 08 10 12 14 16
SSA Asia LAC EUR MENASource: IMF, World Economic Outlook database.Note: In the figure and throughout the chapter, investment refers to gross fixed capital formation. EUR = Europe; LAC = Latin America and the Caribbean; MENA = Middle East and North Africa; SSA = sub-Saharan Africa.

3. PRIVATE INVESTMENT TO REJUVENATE GROWTH
61
euro area, the rebalancing of the Chinese economy toward domestic consumption, and a surge in the volatility of capital flows (World Bank 2017).
The slowdown in investment in sub-Saharan African countries was less pronounced during 2010–14, owing in part to elevated commodity prices, robust growth prospects in non-resource-intensive countries, and resilient FDI inflows. But since 2015, investment in the region has weakened more than in other developing economies, contract-ing by 4 percent each year on average in 2015–16.
The decline has been generalized across sub-Saharan Africa, as private investment slowed in two-thirds of the countries and fell in half of them (Figure 3.4). The reasons for the decline
3 For the list of countries considered in each group, see the Statistical Appendix.
differ across countries, and include the collapse of commodity prices, adverse spillovers from large economies in the region, and various idiosyncratic shocks. In particular,
• The sharp fall in commodity prices reducedinvestment in commodity-exporting countries,especially the oil exporters (Cameroon, Gabon,Nigeria).
• Policy and political uncertainty seem to haveplayed a role in weakening investment inSouth Africa.
• The attendant slowdown in economic activityin large countries such as Angola, Nigeria, andSouth Africa (with a combined GDP weight ofabout 50 percent of the region) has likely hadadverse spillovers to the rest of the region, con-tributing to the investment slowdown.
• Other countries experienced idiosyncraticshocks. In Kenya, a sharp slowdown in creditgrowth weighed on private investment, whilein Namibia investment slowed following thecompletion of a large mining project.
In general, oil exporters have the lowest levels of private investment to GDP, averaging 14 percent over 2010–16, compared with 17 percent in other resource-intensive countries and 15 percent in non-resource-intensive countries (Figure 3.5).3
Figure 3.3. Sub-Saharan Africa and Developing Economies: Real Investment Index, 2000–16
Figure 3.3. Sub-Saharan Africa and Developing Economies: Real Investment Inde
0
1
2
3
4
5
2000 02 04 06 08 10 12 14 16
Index
(200
0 = 1)
SSA public investmentSSA private investmentDeveloping economies public investmentDeveloping economies private investment
Source: IMF, World Economic Outlook database.
Figure 3.4. Sub-Saharan Africa: Average Growth of Real Private Investment, 2010–14 and 2015–16
Figure 3.4. Sub-Saharan Africa: Average Growth of Real Investment, 2010–14 a
AGO
CMR
TCD
COG
GABNGA
BWA
BFA
CAF
COD
GHA MLI
NAM
NER
SLE
ZAFTZA
ZMB
BENBDI
CPVCOM
CIV
ERIGMB
GNB
KENLSO
MDG
MWIMUS
RWA
STPSEN
SYCSWZTGOUGA
–30
–20
–10
0
10
20
30
–10 –5 0 5 10 15 20
Aver
age r
eal p
rivate
inve
stmen
t gr
owth,
2015
–16
Average real private investment growth, 2010–14
45 degree line
Oil exportersOther resource-intensive countriesNon-resource-intensive countries
Source: IMF, World Economic Outlook database.Note: See page 90 for country groupings and page 91 for country abbreviations tables.
Figure 3.5. Selected Groups in Sub-Saharan Africa: Private Investment to GDP Ratios, 2000–16
Figure 3.5. Selected Groups in Sub-Saharan Africa: Private Invest
5
10
15
20
25
2000 02 04 06 08 10 12 14 16
Perce
nt of
GDP
Oil exportersOther resource-intensive countriesNon-resource-intensive countries
Source: IMF, World Economic Outlook database.Note: See page 90 for country groupings table.

REGIONAL ECONOMIC OUTLOOK: SUB-SAHARAN AFRICA
62
Weaker investment has weighed on GDP growth. In oil-exporting countries, the negative impact of declining private investment on growth was compounded by sharp cuts in public investment. In other countries, weaker private investment was in part offset by more public investment, but it is unclear how long this can continue, as high debt levels and rising debt servicing costs are constrain-ing fiscal space (Figure 3.6).
DETERMINANTS OF PRIVATE INVESTMENT RATIOSCountry experiences in sub-Saharan Africa provide some insights on the potential drivers of private investment. They show that surges in private invest-ment have been associated with various factors, some of which were exogenous, such as conflicts and increases in commodity prices.
• Commodity prices: Private investment rosemarkedly in Nigeria during 2007–14 amidelevated oil prices and favorable global financialconditions, while other sub-Saharan Africancountries benefited from discoveries of naturalresources (Equatorial Guinea, Ghana). Atthe same time, there were instances wherecommodity importers benefited from a fall incommodity prices that created space to financemore investment, both public and private(Rwanda).
• Resolution of long-standing conflicts: The endof conflicts in Côte d’Ivoire, Ethiopia, Rwanda,and Uganda was followed by marked increasesin private investment following the end ofconflicts (Figure 3.7).
However, these events were generally not enough to sustain the momentum in private investment, especially when they were not supported by mac-roeconomic stability and a sound institutional environment. Some countries upgraded their insti-tutional environment, which helped sustain private investment growth. (See Box 3.1 for an analysis of the relationship between policy reforms and private investment growth.)
While these country experiences point to an asso-ciation between private investment and exogenous and institutional factors, they are not sufficient to identify the determinants of private investment. For that purpose, the chapter follows existing literature and estimates the historical relationship between private investment to GDP and its traditional deter-minants (such as real GDP growth, public invest-ment as a share of GDP, the level of GDP per capita in purchasing power parity, the relative price of
Figure 3.6. Selected Groups in Sub-Saharan Africa: Contribution of Investment to GDP Growth, 2006–16
–6–4–2
02468
10
2006 08 10 12 14 16
Perce
nt
–6–4–2
02468
10
2006 08 10 12 14 16Pe
rcent
Private Public Total
–6–4–2
02468
10
2006 08 10 12 14 16
Perce
nt
1. Oil Exporters 2. Other Resource-Intensive Countries 3. Non-Resource-Intensive Countries
Source: IMF, World Economic Outlook database.Note: See page 90 for country groupings table.
Figure 3.7. Selected Countries: Real Private Investment Growth before and after ConflictsFigure 3.7. Selected Countries: Real Private Investment Growth Be
–20
–10
0
10
20
Conflict Post conflict(10-year average)
Perce
nt
Côte d'IvoireEthiopiaRwandaUganda
–256
61
Source: IMF, World Economic Outlook database.Note: Private investment growth is computed as private gross fixed capital formation, current prices, deflated by GDP deflator. Conflict episodes: Côte d’Ivoire (2002–05), Ethiopia (1974–91), Rwanda (1990–94), and Uganda (1979–86).

3. PRIVATE INVESTMENT TO REJUVENATE GROWTH
63
capital, and the real interest rate).4 The regressions also consider several structural and institutional variables, including the quality of the business environment, trade openness, financial develop-ment, and capital account openness (Annex 3.2).
The selected variables are expected to affect private investment as follows. Strong economic activity captured by real GDP growth provides opportuni-ties for firms to sell more goods and services and make profits, and thus is expected to prompt firms to invest in new capital (the accelerator effect).5 The effect of public investment is ambiguous and depends on whether public investment comple-ments or crowds out private investment. Private investment is expected to fall as the cost of capital (proxied here by the fixed capital formation deflator to the GDP deflator ratio and the real interest rate) increases. Finally, because investment ratios tend to show persistence, the regressions include the lagged value of the private-investment-to-GDP ratio.6 The estimation sample is composed of an unbalanced panel of 101 emerging market and developing economies covering 1980–2015.7
Strong Economic Activity Is Key for Private Investment to Expand
Private investment increases when economic activity is strong—that is, when real GDP growth is high. This result is consistent with an accelerator effect (a similar result is found in IMF 2005).
4 The analysis focuses on private investment ratios (rather than on investment growth) as the interest is in the factors that can increase the provision of capital for a given output. In the run-up to the global financial crisis and the commodity price shock, strong investment growth indeed occurred in parallel with strong output growth, implying that economies in the region have not become more capital-intensive. For an analysis of the growth of total investment (public and private) in emerging market and developing economies, see World Bank (2017).5 According to the accelerator model of investment, firms adjust their capital stock gradually toward a level that is proportional to output so that investment should react positively to changes in GDP. Jorgenson and Siebert (1968) provided a theoretical derivation of the accelerator model.6 To deal with possible endogeneity between the variables included, the estimations are performed using the system generalized method of moments (system GMM) estimator (see Annex 3.2 for details).7 Given that we are interested in the effects on investment of institutional characteristics (some of which do not vary much over time), the sample includes emerging market and developing economies other than those in sub-Saharan Africa to ensure enough variability in those characteristics. In addition, the econometric method requires a sufficiently large number of countries. As recommended by Roodman (2009), the number of countries should be at least equal to or larger than the number of instru-ments used in the system GMM method. Even in the baseline models the number of instruments is larger than the number of sub-Saharan African countries.8 The relative price of investment is also found to reduce private investment ratios, but neither the level of GDP per capita nor the real interest rate is significant. Several other control variables have been considered in the regressions and are either generally not significant or do not materially alter the main results presented here.9 The Regulatory Quality Index in the World Bank’s Worldwide Governance Indicators covers product markets, labor markets, taxation, and other factors that affect the ease of starting and running a business. Business creation can be hampered by excessive regulations, so the entry of new firms and private investment may be limited even in times of rising demand.
Interestingly, the impact of GDP growth is nonlinear. Private investment increases with real GDP growth when the latter is high (above the country historical average), but not when it is low (below the country historical average). This possibly reflects a wait-and-see attitude of firms during periods when the economy is rebounding from subdued activity, or when there is idle productive capacity (economic slack).8
A Sound Business Environment, Well-Developed Infrastructure, Trade Openness, and Financial Development Strengthen the Effect of Growth on Investment
The empirical estimates also suggest that the effects of economic activity on investment strengthen with countries’ institutional and structural characteris-tics. These include the regulatory quality, the insol-vency and resolution framework, the importance of public infrastructure, trade openness, and financial development. More specifically,
• Regulatory quality and resolution frameworks: Private investment reacts more strongly to economic growth if regulatory quality is better and the cost of resolving insolvencies is lower.9
• Infrastructure: The private sector invests more in new capital when improved economic activity is supported by better public

REGIONAL ECONOMIC OUTLOOK: SUB-SAHARAN AFRICA
64
infrastructure, as measured by the larger pro-portion of paved roads as a share of total roads or greater access to electricity as a share of the population.10
• Trade openness: Firms are likely to invest more in response to strong economic activity in more open economies, perhaps reflecting the incentive to expand production for exporting purposes.
• Capital account openness:11 The impact of GDP growth on investment is stronger in countries with less open capital accounts. While this result has been found in other studies, the arguments are not obvious. Some studies attribute it to differences in the returns to capital (higher abroad) or to the fact that greater capital account openness could be associated with a higher occurrence of financial crises.
• Financial deepening: There are indications that a very low level of financial development can be a significant constraint to private investment, even when the economic climate is favorable. Indeed, the empirical estimates show that in countries with very low levels of financial devel-opment, firms do not invest in new capital in response to stronger demand.12
The incremental gains from better structural and institutional characteristics are economically signifi-cant. Table 3.1 shows, for example, that with each percentage point increase in GDP growth, countries with weak regulatory quality (typically the case of
10 In the current context, the priorities for public investment spending in sub-Saharan Africa are (1) maintaining levels compatible with fiscal sustainability, and (2) improving the efficiency of that spending to provide better services. As shown in detail in Box 3.2, there is ample room to improve the efficiency of public investment.11 Capital account openness is proxied by the Chinn-Ito (2006) indicator.12 Considering all these variables together would significantly restrict the estimation sample due to the limited availability of the World Bank’s Doing Business and Worldwide Governance Indicators. When trade openness, capital account openness, and financial development are considered simultaneously, financial development appears to be the most significant variable in driving private investment ratios. Also, the interaction between GDP growth and the first component obtained from a principal component analysis of these three normalized variables (that is, a summary measure that contains most of the variance of the three variables) is significantly positive (on top of the coefficient for real GDP growth), indicating that investment benefits more from growth when there is greater trade openness, capital account openness, and financial development.13 Following Servén (2003), countries are classified in groups of high and low levels of infrastructure (proxied by paved roads and access to electricity), trade openness, financial development, and capital account openness based on the country-average value of each of the variables compared with the median value of the whole sample. This allows each group to carry a different coefficient on the GDP growth variable in the regressions.
the average sub-Saharan African economy) experi-ence an increase in their investment ratio of less than ⅓ of a percentage point. On the other hand, countries with stronger regulatory quality experi-ence an increase in their investment ratio of ½ percentage point. Similarly, for each percentage point increase in GDP growth, the private invest-ment ratio increases by about ⅓ percentage point for countries with more developed infrastructure (roads or access to electricity) and trade openness, and by ½ percentage point for countries with more developed financial systems.13 These gains are larger than those estimated for the whole sample of countries—including economies with strong and weak structural and institutional characteristics—which are 1/5 of 1 percentage point.
Table 3.1. Economic Impact on the Private Investment Ratio of a 1 Percentage Point Increase in GDP Growth, Depending on Institutional and Structural Characteristics
Effect on private investment ratio of a 1 pp increase in GDP growth (pps)
Whole Sample 0.21Low Regulatory Quality (SSA average) – High Regulatory Quality (non-SSA EMDEs average) 0.29 – 0.48
High Insolvency Cost (SSA average) – Low Insolvency Cost (non-SSA EMDEs average) 0.02 – 0.24
Higher Proportion of Paved Roads 0.28Higher Access to Electicity 0.33Higher Trade Openness 0.26Lower Capital Account Openness 0.33Higher Financial Development 0.47
Source: Authors’ calculations based on regression results in Annex 3.2.Note: EMDEs = emerging market and developing economies; pp = percentage point; SSA = sub-Saharan Africa.

3. PRIVATE INVESTMENT TO REJUVENATE GROWTH
65
Public Investment Can Crowd in Private Investment, but Not Always
The impact of public investment on private invest-ment is not clear a priori. On the one hand, public investment could be complementary to private investment, for example, public spending on infra-structure or on goods that raise the productivity of private capital.14 On the other hand, stronger public investment could crowd out private investment through the following channels:
• By competing for scarce physical and financial resources. For instance, the financing of public investment—through debt issuance, bank credit, higher taxes, or inflation—reduces resources available to the private sector, dampening private investment.
• In cases where public investment is carried out by state enterprises producing output in direct competition with the goods and services provided by the private sector (Erden and Holcombe 2005).
• By discouraging investment due to increased macroeconomic instability when public invest-ment is financed through the accumulation of debt that is unsustainable.
The empirical work presented here identifies the two opposite effects of public investment on private investment depending on the degree of financial development: public investment crowds out private investment when the financial system is less developed and crowds it in when the financial system is more developed. For example, given the levels of financial development currently observed across regions,15 a 1 percentage point increase in the public investment ratio would lead to a ½ percent-age point contraction of the private investment ratio in the average sub-Saharan African country and to a ½ percentage point increase in other emerging market and developing economies included in the sample (which are on average much more financially developed than sub-Saharan African countries). This crowding-out effect of private
14 The positive effects of paved roads and access to electricity on private investment identified here also lend support to the idea that public investment contributes positively to private investment in the long run through the buildup of infrastructure.15 Proxied by the Financial Development Index detailed in Svirydzenka (2016).
investment by public investment has also been found in previous studies (Cavallo and Daude 2011; IMF 2017, Box 1.3; IMF 2014a, Box 1.4).
The ultimate impact of public investment on private investment depends on country-specific factors, such as whether the project is financed domestically or externally or is an efficient infrastructure project. Nevertheless, given the low level of financial devel-opment, large infrastructure gaps, scarce resources in sub-Saharan Africa, and constraints on avail-ability of foreign financing (or the ability to service the attendant debt) there is a real danger that public investment could crowd out private investment. The region may thus benefit from promoting alterna-tive ways of financing investment (both public and private), including deepening financial markets, engaging in PPPs, and mobilizing more domestic fiscal revenue (Chapter 2 and IMF 2017, Box 1.3). Beyond these measures, there are additional levers that could support higher private investment in sub-Saharan Africa, notably FDI, SEZs, and global initiatives. These possibilities are explored below.
ALLEVIATING CONSTRAINTS TO PRIVATE INVESTMENTDeepening Financial Systems
Beyond the evidence presented above on the impact of financial development on private investment, there are various reasons to believe that the avail-ability of and access to credit are a major constraint in sub-Saharan Africa. First, when compared with other regions, bank financing of investment in sub-Saharan Africa is the lowest, while equity financing is the highest. Second, sub-Saharan Africa has both the lowest share of firms that do not need a bank loan and the highest number of firms that identify access to credit as a major constraint (Figure 3.8). Finally, small and medium-sized firms, which account for most firms in the region, typically face greater obstacles to obtaining financing than larger firms (Beck and Cull 2014).
The financial landscape in most of sub-Saharan Africa is largely dominated by banks. Other financial institutions such as stock exchanges and

REGIONAL ECONOMIC OUTLOOK: SUB-SAHARAN AFRICA
66
bond markets remain underdeveloped, but have been expanding rapidly in recent years (Sy 2015). Banks are the primary source of financing for private investment, followed by equity financing. Banking systems in sub-Saharan Africa are char-acterized by relatively high capital ratios compared with other regions.
Typically, higher capital ratios are found in financial systems that are relatively more unstable, as banks accumulate buffers to cover future loses (Beck and others 2011). But while increases in capital ratios may make banking systems more resilient and help to maintain the provision of credit in difficult times (Kapan and Minoiu 2013), they can also hamper the provision of credit in other periods (Bernanke, Lown, and Friedman 1991).16 In sub-Saharan Africa, it seems that there
16 Higher capital ratios could also be driven by and excessive presence of sovereign assets in the banks’ balance sheets, which usually have low risk weights. However, the Basel framework includes regulations that set bounds to large exposures, which should limit this effect.
is a negative association between capital ratios and credit availability to firms (Figure 3.9).
Further developing financial markets, including the quickly expanding bond and equity markets (Figure 3.10), would provide additional means of financing investment. Compared with other regions, there is ample room for further deepening financial markets in sub-Saharan Africa (Figure 3.11). But doing so would require improving the judicial system’s independence, strengthening investor protection and auditing standards, and reducing key constraints in financial market infrastructures (IMF 2016, Chapter 3). Developing bond markets, in particular, would require an appropriate technical and regulatory infrastructure (for example, registries to give legal titles to instruments, central depositories, and clearing and settlement systems); a large and
Figure 3.8. Selected Regions: Corporate Financing, 2011–14
02468
10121416
SSA MENA Asia EURCIS
Perce
nt
Share of purchases of fixed assets financed with bank loansShare of purchases of fixed assets financed with equity
10
20
30
40
50
60
70
SSA MENA Asia EURCIS
Perce
nt
Share of firms that did not apply for loan because did not need itShare of firms identifying access to finance as a major constraint
1. Financing of Purchases of Fixed Assets 2. Access to Bank Financing
Source: World Bank, Global Financial Development database.Note: EURCIS = Europe and Commonwealth of Independent States; MENA = Middle East and North Africa; SSA = sub-Saharan Africa.
Figure 3.9. Sub-Saharan Africa: Regulatory Capital Ratios and Firms Using Banks to Finance Investment, 2011–14
Figure 3.9. Sub-Saharan Africa: Regulatory Capital Ratios and Firms Using B
y = –1.17**x + 41.75
0
10
20
30
40
10 15 20 25 30 35 40
Shar
e of fi
rms
Regulatory capital ratioSource: World Bank, Global Financial Development database.Note: *p < .10; **p < .05; ***p < .01.
Figure 3.10. Sub-Saharan Africa: Bond and Equity Allocations
0
20
40
60
80
100
Dec-1
0Ju
n-11
Dec-1
1Ju
n-12
Dec-1
2Ju
n-13
Dec-1
3Ju
n-14
Dec-1
4Ju
n-15
Dec-1
5Ju
n-16
Dec-1
6Ju
n-17
Dec-1
7
Billio
ns of
US
dolla
rs
EquitiesBonds
Source: Haver Analytics.

3. PRIVATE INVESTMENT TO REJUVENATE GROWTH
67
heterogeneous investor base to ensure a strong and stable demand for securities; a sound banking system as banks play a key role as final investors or intermediaries in bond markets; and market-deter-mined interest rates (Box 3.3). For equity markets, regional integration of individual countries’ stock exchanges would help enhance liquidity and effi-ciency and bring about economies of scale.
However, financial deepening would need to proceed cautiously to reduce risks of financial instability, which could discourage private invest-ment. Indeed, empirical studies show that stressed financial systems supply less credit to the private sector (Freixas, Laeven, and Peydró 2015).
In sub-Saharan Africa, several countries have suffered from banking crises that have hampered their capacity to finance investment (Beck and others 2011). There also appears to be a positive relationship between the strength of the financial system and the provision of private credit. For example, the z-score—a widely used indicator of the level of safety and soundness of the financial system, with lower values indicating a situation closer to default (Figure 3.12)17—is positively related to various indicators of credit to the private sector. In sum, promoting private investment would require deepening financial markets while ensuring financial stability. This, in turn, would entail further strengthening institutions and promoting
17 The z-score indicators for banks is calculated as the ratio of the sum of the return on assets (ROA) and equity over assets, divided by the standard deviation of the ROA: Z = (ROA +(equity/assets))/(ROA standard deviation) (Čihák and others 2012).18 There are other market frictions, such as interest rate caps, that could affect negatively the supply of credit in sub-Saharan Africa and are not covered in this chapter (see Maimbo and Henriquez-Gallegos 2014).
sound judicial and regulatory and supervisory frameworks.18 At the same time, fintech could provide a leapfrogging opportunity for greater financial industry efficiency, with positive effects on financial depth and inclusion (Box 3.4).
Public-Private Partnerships
In theory, PPPs could help improve the quality of much-needed infrastructure in sub-Saharan Africa, bring in private sector expertise to enhance the effi-ciency of infrastructure, and alleviate some of the financial constraints to investment. But in practice, the global experience with PPPs does not support the notion that they provide infrastructure more efficiently than public procurement. Furthermore, PPPs imply complex arrangements for which it
Figure 3.11. Selected Regions: Financial Development
10
20
30
40
50
60
70
2000 02 04 06 08 10 12 14 16
Perce
nt of
GDP
0.00
0.05
0.10
0.15
0.20
0.25
0.30
0.35
2000 02 04 06 08 10 12 14
Index
1020SSA Asia EURCIS LAC MENA
1. Index of Financial Development 2. Credit to the Private Sector to GDP
Sources: Svirydzenka (2016); and World Bank, World Development Indicators database.Note: EURCIS = Europe and Commonwealth of Independent States; LAC = Latin America and the Caribbean; MENA = Middle East and North Africa; SSA = sub-Saharan Africa.
Figure 3.12: Sub-Saharan Africa: Safety and Soundness of Banking System and Financing of Investment
Figure 3.12: Sub-Saharan Africa: Safety and Soundness of Bankin
y = 1.05***x + 7.10
0
10
20
30
40
50
0 5 10 15 20 25
Shar
e of in
vestm
ent fi
nanc
ed
by ba
nks
z-scoreSource: World Bank, Global Financial Development database.Note: *p < .10; **p < .05; ***p < .01.
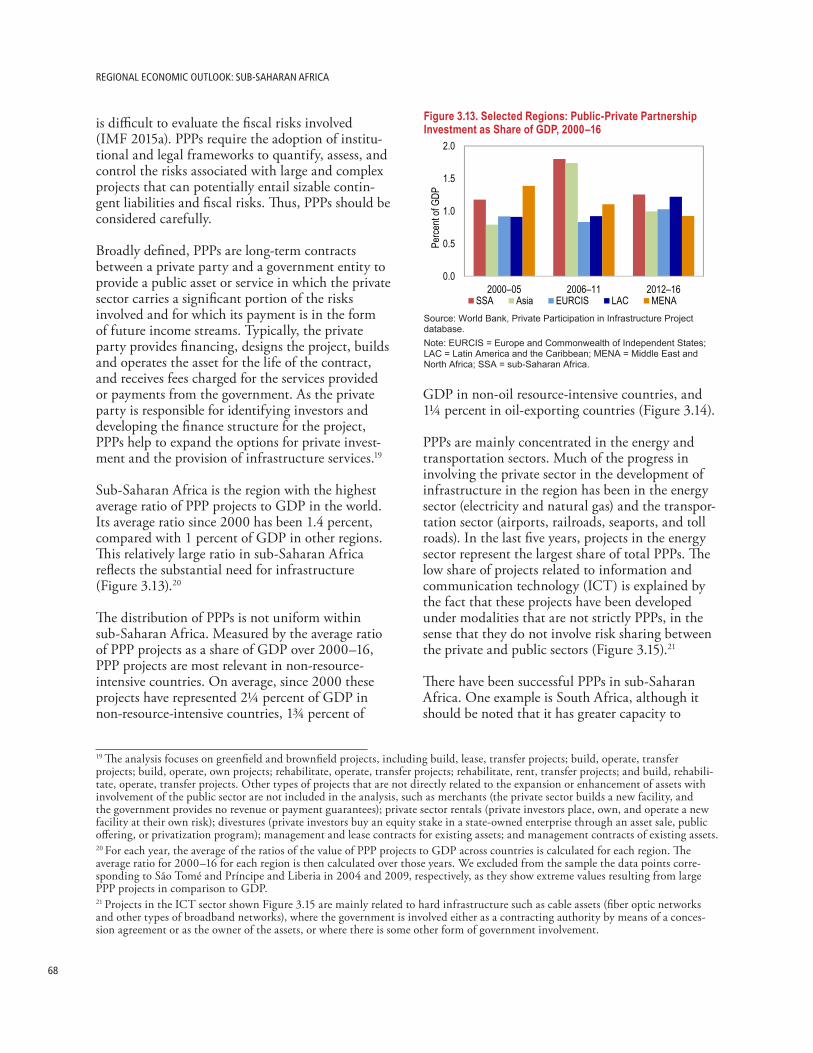
REGIONAL ECONOMIC OUTLOOK: SUB-SAHARAN AFRICA
68
is difficult to evaluate the fiscal risks involved (IMF 2015a). PPPs require the adoption of institu-tional and legal frameworks to quantify, assess, and control the risks associated with large and complex projects that can potentially entail sizable contin-gent liabilities and fiscal risks. Thus, PPPs should be considered carefully.
Broadly defined, PPPs are long-term contracts between a private party and a government entity to provide a public asset or service in which the private sector carries a significant portion of the risks involved and for which its payment is in the form of future income streams. Typically, the private party provides financing, designs the project, builds and operates the asset for the life of the contract, and receives fees charged for the services provided or payments from the government. As the private party is responsible for identifying investors and developing the finance structure for the project, PPPs help to expand the options for private invest-ment and the provision of infrastructure services.19
Sub-Saharan Africa is the region with the highest average ratio of PPP projects to GDP in the world. Its average ratio since 2000 has been 1.4 percent, compared with 1 percent of GDP in other regions. This relatively large ratio in sub-Saharan Africa reflects the substantial need for infrastructure (Figure 3.13).20
The distribution of PPPs is not uniform within sub-Saharan Africa. Measured by the average ratio of PPP projects as a share of GDP over 2000–16, PPP projects are most relevant in non-resource-intensive countries. On average, since 2000 these projects have represented 2¼ percent of GDP in non-resource-intensive countries, 1¾ percent of
19 The analysis focuses on greenfield and brownfield projects, including build, lease, transfer projects; build, operate, transfer projects; build, operate, own projects; rehabilitate, operate, transfer projects; rehabilitate, rent, transfer projects; and build, rehabili-tate, operate, transfer projects. Other types of projects that are not directly related to the expansion or enhancement of assets with involvement of the public sector are not included in the analysis, such as merchants (the private sector builds a new facility, and the government provides no revenue or payment guarantees); private sector rentals (private investors place, own, and operate a new facility at their own risk); divestures (private investors buy an equity stake in a state-owned enterprise through an asset sale, public offering, or privatization program); management and lease contracts for existing assets; and management contracts of existing assets.20 For each year, the average of the ratios of the value of PPP projects to GDP across countries is calculated for each region. The average ratio for 2000–16 for each region is then calculated over those years. We excluded from the sample the data points corre-sponding to São Tomé and Príncipe and Liberia in 2004 and 2009, respectively, as they show extreme values resulting from large PPP projects in comparison to GDP.21 Projects in the ICT sector shown Figure 3.15 are mainly related to hard infrastructure such as cable assets (fiber optic networks and other types of broadband networks), where the government is involved either as a contracting authority by means of a conces-sion agreement or as the owner of the assets, or where there is some other form of government involvement.
GDP in non-oil resource-intensive countries, and 1¼ percent in oil-exporting countries (Figure 3.14).
PPPs are mainly concentrated in the energy and transportation sectors. Much of the progress in involving the private sector in the development of infrastructure in the region has been in the energy sector (electricity and natural gas) and the transpor-tation sector (airports, railroads, seaports, and toll roads). In the last five years, projects in the energy sector represent the largest share of total PPPs. The low share of projects related to information and communication technology (ICT) is explained by the fact that these projects have been developed under modalities that are not strictly PPPs, in the sense that they do not involve risk sharing between the private and public sectors (Figure 3.15).21
There have been successful PPPs in sub-Saharan Africa. One example is South Africa, although it should be noted that it has greater capacity to
Figure 3.13. Selected Regions: Public-Private Partnership Investment as Share of GDP, 2000–16Figure 3.13. Selected Regions: PPP Investment as Share of GDP,
0.0
0.5
1.0
1.5
2.0
2000–05 2006–11 2012–16
Perce
nt of
GDP
SSA Asia EURCIS LAC MENASource: World Bank, Private Participation in Infrastructure Project database.Note: EURCIS = Europe and Commonwealth of Independent States; LAC = Latin America and the Caribbean; MENA = Middle East and North Africa; SSA = sub-Saharan Africa.

3. PRIVATE INVESTMENT TO REJUVENATE GROWTH
69
manage these projects than other countries in the region. There, the power purchase agreements were the most successful, with 60 projects over three years, for a total commitment of 118 billion rand (about 2½ percent of 2017 GDP). This benefited from strong competition from the private sector, which drove down costs, and a steady pipeline of projects to attract investors. The transport sector has also seen successful PPPs. In particular, the South African National Roads Agency Limited (SANRAL) has concessioned 1,288 km of its 19,700-km-wide road network under long-term PPP-type concessions for the design, building, financing, and operation of the roads before their transfer back to SANRAL. The Western Cape Chapman’s Peak Toll Road is considered an engi-neering success, given very difficult geological
22 In Figure 3.16, the benchmarking exercise for MENA covers only nine countries, and two of them are fragile countries with very low benchmarking scores (Afghanistan and Iraq), while other regions have larger samples. This helps to explain why the bench-marking score for MENA is the lowest, since without those two countries the average for MENA would be higher than that for sub-Saharan Africa. The sample of benchmarking scores for sub-Saharan Africa covers 20 countries.23 By institutional framework we mean a variety of elements necessary for the management of PPPs, such as the legal and regulatory context, the governance guidelines and public investment practices, and monitoring and reporting mechanisms.
conditions, and the Gautrain Rapid Rail System ensures good transport services for commuters between Pretoria and Johannesburg.
Nevertheless, sub-Saharan African countries need to improve their capacity to manage PPPs.22 Since 2006, the value of disputed projects in sub-Saharan Africa as a share of countries’ GDP has averaged ¾ percent of GDP, which is the highest ratio among emerging market and developing economies. At the same time, there is evidence that higher rates of disputed contracts and lower quality in the selection of PPP projects are related to weaker institutions involved in the management of public investment (Figures 3.16 and 3.17). Thus, disputes could be reduced with improvements in the quality of public investment management and budget transparency (Nose 2017).
PPPs are useful instruments to finance investment, but using them without an appropriate institutional framework and expertise carries several fiscal risks.23 First, PPPs may be used to bypass budgetary constraints or treat projects outside the budget. Second, PPPs usually require some form of public sector support, including in the form of capital grants. Third, PPPs may require the government to provide debt guarantees, or minimum revenue guarantees, which imply contingent liabilities for the government that usually materialize with failed or disputed projects. Finally, as the contracts involved are for the long term, PPPs may involve
Figure 3.14. Sub-Saharan Africa: Public-Private Partnership Investment to GDP by Country, Average 2000–16
0123456789
COG
GAB
CMR
NGA
AGO
LBR
SLE
ZMB
GIN
GHA
BWA
ZAF
MLI
TZA
ZWE
TGO
BEN
CPV
MOZ
MUS
RWA
UGA
SEN
CIV
KEN
MDG
SYC
ETH
COM
Oil exporters Other resource-intensive countries Non-resource-intensive countries
Perce
nt of
GDP
Source: World Bank, Private Participation in Infrastructure Project database.Note: See page 90 for country groupings and page 91 for country abbreviations tables.
Figure 3.15. Sub-Saharan Africa: Public-Private Partnership Investment by Sector, 2000–16
Figure 3.15. Sub-Saharan Africa: Public-Private Partnership Inves
0
20
40
60
80
100
2000 02 04 06 08 10 12 14 16
Perce
nt
Energy ICT Transport Water and sewerageSource: World Bank, Private Participation in Infrastructure Project database.Note: ICT = information and communication technology.

REGIONAL ECONOMIC OUTLOOK: SUB-SAHARAN AFRICA
70
the commitment to realize payments for many years and thus introduce rigidity in future budgets (IMF 2014b, Chapter 3).
There are various instruments for managing fiscal risks related to PPPs. The IMF and the World Bank have developed a specialized tool to assess fiscal risks related to PPP projects.
The PPP Fiscal Risk Assessment Model (P-FRAM) is aimed at evaluating the potential fiscal costs and risks arising from PPP projects, including a sen-sitivity analysis under alternative assumptions for macro variables and contract termination (IMF and WB 2016). The goal of the P-FRAM is to help authorities develop a strategy to mitigate risks. To date, P-FRAM pilots have been conducted in three sub-Saharan African countries: Côte d’Ivoire, Mauritius, and Niger.
24 This section focuses on foreign direct investment net inflows which complement domestic resources. On the other hand, net outward outflows, which are significantly smaller in sub-Saharan Africa, reduce available resources for domestic private investment.
In addition, Public Investment Management Assessments (PIMA) performed by the IMF and the World Bank help identify key weaknesses in public investment practices and provide country-tailored solutions (IMF 2015a). This tool is not focused on PPPs, but some components are related to them. To date, PIMA evaluations have been conducted in the following sub-Saharan African countries: Botswana, Burkina Faso, Cameroon, Côte D’Ivoire, Ghana, Liberia, Madagascar, Mauritius, Mozambique, Togo, and Zambia.
Foreign Direct Investment
FDI is another useful lever to raise private invest-ment.24 The benefits of FDI do not come only in the form of expanded resources for investment, but also through the transfer of knowledge and technol-ogy. In the past decade, sub-Saharan Africa has been the main recipient of FDI in percent of GDP among emerging market and developing regions in the world. Its ratio of FDI to GDP over the past decade has averaged slightly above 5 percent, higher than Latin America and the Caribbean, while other regions show ratios ranging from 2.5 to 4 percent (Figure 3.18).
FDI flows relative to GDP tend to be concentrated in some countries in the region, but not just in resource-intensive countries. For instance, Cabo Verde, Mauritius, Mozambique Seychelles, São Tomé and Príncipe, and The Gambia, have shown ratios since 2000 well above the regional average of about 4 percent. On the other hand, several countries have not been very successful in
Figure 3.17. Selected Regions: Share of Disputed Projects 2006–16 and Benchmarking of Public-Private Partnership Management 2016
0
1
2
3
SSA Asia LAC EURCIS MENA
Perce
nt of
total
PPP
contr
acts
0
20
40
60
80
SSA Asia LAC EURCIS MENA
Benc
hmar
k (0 –
100)
1. Disputed Projects 2. Benchmarking of PPP Management
Source: World Bank, Private Participation in Infrastructure Project database; and World Bank (2016).Note: EURCIS = Europe and Commonwealth of Independent States; LAC = Latin America and the Caribbean; MENA = Middle East and North Africa; SSA = sub-Saharan Africa.
Figure 3.16. Selected Regions: Disputed and Cancelled Public-Private Partnerships to GDP, 2006–16
Figure 3.16. Selected Regions: Disputed and Cancelled Public-Private Partners
0
0.2
0.4
0.6
0.8
1
SSA MENA Asia LAC EURCIS
Perce
nt of
GDP
Source: World Bank, Private Participation in Infrastructure Project database.Note: EURCIS = Europe and Commonwealth of Independent States; LAC = Latin America and the Caribbean; MENA = Middle East and North Africa; SSA = sub-Saharan Africa.

3. PRIVATE INVESTMENT TO REJUVENATE GROWTH
71
attracting FDI—two-thirds of the countries in the region show ratios below the regional average (Figure 3.19).25
The literature on the determinants of FDI indicates that the following factors help attract these flows: large domestic markets and natural resources, the provision of infrastructure, the level of education of the labor force, openness to trade, macroeconomic and political stability, and the quality of institu-tions (Asiedu 2002, 2006; Dupasquier and Osakwe 2006). This suggests that policymakers could foster even stronger FDI inflows into sub-Saharan Africa by improving macroeconomic and political stability, providing better infrastructure services and a more skilled labor force, and improving the institutional environment.
25 It should be noted that some countries have other important sources of financial flows (portfolio and loans), including Kenya, Senegal, and South Africa.
Special Economic Zones
Closely related to FDI is the development of SEZs, which are second-best solutions compared with economy-wide reforms (IMF 2011), but can have a catalytic role in promoting structural transforma-tion. China’s economic transition since the 1980s is often cited as an example of how to increase FDI through SEZs (UNDP 2015). However, in sub-Saharan Africa, the experience with SEZs during the past two decades has been mixed at best, as most of them have either had an unsuccessful record or have fallen short of expectations (IMF 2011; Farole and Moberg 2017). One reason might be that SEZs in sub-Saharan Africa have relied primarily on corporate tax holidays, with little else offered in terms of nontax incentives and regula-tions. And when it comes to investment location decisions, there is evidence that taxes are not the only factor considered (IMF 2015b).
Nonetheless, in recent years, some countries have adjusted their approach to developing SEZs, with better results, as in the case of Rwanda (Steenbergen and Javorcik 2017). Other countries, such as Ethiopia, have been more successful in attracting investors. The more positive recent experiences are related to the focus on developing clusters to create more dynamic export sectors by fostering competition and quality improvements, and relying more on the countries’ comparative advantages.
Figure 3.18. Selected Regions: Foreign Direct Investment (Three-year averages)
Figure 3.18. Selected Regions: Foreign Direct Investment(Three-year averages)
0
2
4
6
8
1999–01 2002–04 2005–07 2008–10 2011–13 2014–16
Perce
nt of
GDP
SSA Asia EURCIS LAC MENASource: IMF, World Economic Outlook database.Note: EURCIS = Europe and Commonwealth of Independent States; LAC = Latin America and the Caribbean; MENA = Middle East and North Africa; SSA = sub-Saharan Africa.
Figure 3.19. Sub-Saharan Africa: Foreign Direct Investment by Country, Average 2000–16
02468
101214161820
COG
MUS
MOZ
LBR
SYC
STP
GMB
SLE
TCD
CPV
NAM
NER
ZMB
GHA
COD
MDG
GIN
GAB
UGA
TZA
BWA
LSO
MLI
AGO
ERI
BEN
ETH
CAF
SWZ
CMR
SEN
CIV
NGA
RWA
MWI
BFA
ZWE
GNB
ZAF
COM
KEN
Perce
nt of
GDP
Oil exportersOther resource-intensive countriesNon-resource-intensive countriesAverage
Source: IMF, World Economic Outlook database.Note: EURCIS = Europe and Commonwealth of Independent States; LAC = Latin America and the Caribbean; MENA = Middle East and North Africa; SSA = sub-Saharan Africa. See page 90 for country groupings and page 91 for country abbreviations tables.

REGIONAL ECONOMIC OUTLOOK: SUB-SAHARAN AFRICA
72
Many SEZs in sub-Saharan Africa focus on the apparel, textile, and agroprocessing industries, where these economies typically have a competi-tive edge (Ethiopia, Ghana, Kenya, Madagascar, Malawi, Mauritius, Seychelles, Zimbabwe). Only a few economies (Mozambique, Namibia, Nigeria, South Africa, Zambia) have been able to establish SEZs in more capital-intensive industries, for instance, automotive and aluminum (UNDP 2015).
Potential ways to increase the effectiveness of SEZs in the region include better integrating SEZ programs into national and regional development strategies; promoting investments that can be better linked to domestic firms; encouraging stronger ownership by foreign investors; improving the provision of infrastructure and energy; promoting relationships and joint ventures of local corpora-tions with foreign investors; developing training and education aligned with the labor requirements of SEZs; and improving compliance with global production and environmental standards (Farole and Moberg 2017; Zeng 2015). Long-term success will also depend on the capacity of SEZs to catalyze the transformation of the broader economy.
International Initiatives to Support Private Investment in Sub-Saharan Africa
There are various international initiatives to support private investment in sub-Saharan Africa, notably the Belt and Road Initiative and the G20 Compact with Africa (CwA).
The Chinese initiative unveiled in 2013 to form the Silk Road Economic Belt and the 21st Century Maritime Silk Road is a framework to connect China with south, central, and west Asia, Europe, and Africa through trade, infrastructure, invest-ment, and finance. This initiative aims to build a land bridge by developing five major economic corridors as well as maritime transport routes that connect major seaports. It is expected to raise up to $1 trillion in financing from China over 10 years, mainly for infrastructure development. Specific plans involving sub-Saharan African countries include developing transport and energy infrastructure as well as more SEZs. So far, Kenya (maritime ports and railways) has been the focus. But Ethiopia, Mozambique, South Africa, and Tanzania, are also seeking active involvement, and
coverage is likely to be expanded over time. It is also worth noting that, two years after the Belt and Road Initiative was introduced, China more than doubled its pledges ($60 billion) in both project finance and technical assistance to support Africa’s development during the last Forum on China-Africa Cooperation (FOCAC) in 2015.
The CwA is an international initiative to foster private investment in the region that may bring new momentum for FDI flows. It was launched in early 2017 and involves the cooperation of the G20, African Development Bank, IMF, World Bank, and participating countries. The focus is on coordinat-ing the efforts of the parties involved to facilitate projects for private investment (IMF, African Development Bank, and World Bank 2017).
With the support of the IMF and the World Bank, the G20 is setting up a monitoring mechanism for the CwA that will support continuity and ensure consistency as well as initiate benchmarking and peer-learning processes. In general terms, the moni-toring mechanism will involve assessing progress on meeting the commitments made under the three frameworks that are the pillars of the CwA: the macroeconomic framework, which focuses on maintaining macroeconomic stability while providing for adequate investment in infrastructure; the business framework, which lays out how to make countries more attractive for private investors; and the financing framework, which aims to increase the availability of financing with reduced costs and risks.
Eight countries in sub-Saharan Africa have joined the CwA initiative: Benin, Côte d’Ivoire, Ethiopia, Ghana, Guinea, Rwanda, Senegal, and Togo (and three more in the rest of Africa). Progress on actual reforms is still mixed, as participating countries are at various stages of the process, and some have joined only recently.
In Ghana, the measures catalyzed under the CwA focus on renewable energy and energy efficiency and target the promotion of private investment, complemented with training and improved access to appropriate financing. Meanwhile, the govern-ment is actively engaged in structural reform of the energy sector, including the restructuring of its debt, and privatization plans. This has been

3. PRIVATE INVESTMENT TO REJUVENATE GROWTH
73
complemented by an in-depth assessment of the main opportunities and constraints for private sector development (IFC 2017).
In Côte d’Ivoire, the priorities are promoting private activity and employment and increasing the capacity of the electricity sector while maintaining its financial sustainability. There are also projects underway to support value addition in the cocoa industry.
Rwanda has three focus areas: ensuring an investor-friendly tax regime without eroding the tax base, strengthening the responsiveness of government to private sector concerns, and establishing instru-ments to ease access to finance for private investors in specific sectors. Related measures include improving coordination between national develop-ment authorities, establishing a quarterly investor roundtable, and putting in place an investor response mechanism to provide faster private sector feedback to the authorities.
In Senegal, the authorities plan to use a specific approach that involves developing regional develop-ment poles with special economic development zones. The IMF, World Bank, and other interna-tional institutions are supporting efforts by the Senegalese authorities to promote the acceleration of reforms aimed at creating a sustainable export-oriented industry and thereby jobs for unemployed young people and women in these regional develop-ment poles.
Ethiopia is focusing on aligning its participation in the CwA with implementation of its own plan for growth and transformation. The main priorities are further development of targeted export-oriented industrialization, development of industrial parks, and creation of so-called plug-and-play business environments.
Togo recently joined the CwA after the preparation of its policy matrix and investment prospectus, with the aim of improving the conditions for private investment.
Benin and Guinea are in the process of developing their policy matrices containing the main policy lines and setting up the requirements for their implementation. The involvement of bilateral G20 partners is under preparation.
CONCLUSIONS AND POLICY RECOMMENDATIONSSub-Saharan Africa needs to increase private investment to achieve its social and development objectives. While private investment has increased since 2000, private-investment-to-GDP ratios in sub-Saharan Africa remain the lowest compared with other countries at similar levels of economic development.
Increasing private investment sustainably would require a favorable macroeconomic and institu-tional environment. On the macroeconomic side, this would mean ensuring macroeconomic stability, improving current and prospective economic activity, opening to trade, deepening financial systems, and building efficient public infrastruc-ture. On the institutional side, what is needed is strengthening judicial, regulatory, and insolvency frameworks. Country experiences also show that the resolution of long-standing conflicts is typically followed by increases in private investment.
Many countries in the region have engaged in large public infrastructure projects given the substantial infrastructure gaps in the region. While this type of public investment can support private invest-ment, policymakers need to be mindful that public investment can, in specific circumstances, crowd out private investment. Mitigating this risk would require promoting alternative sources of financing for both public and private investment, including deepening domestic financial markets and PPPs, while ensuring that the associated risks are well managed. At the same time, promoting FDI could help foster private investment, while recent experi-ences with SEZs in attracting investment have been promising.

REGIONAL ECONOMIC OUTLOOK: SUB-SAHARAN AFRICA
74
Box 3.1. Policy Reform and Private Investment GrowthThis box describes the analytical framework used to assess the relationship between policy reform and private investment. The main findings are that strong and sustained improvements in public debt, inflation, and strengthened institutions are associated with an increase in private investment growth. Policy setbacks are generally associated with reductions in private investment growth, as risk-averse investors anticipate a slowdown or reversals in reforms.
The analysis in this box extends the World Bank (2017) framework on the causes, implications, and policy responses to weakness in investment growth. The focus is on private investment growth, as opposed to total investment, and on the impact of macroeconomic stability and policy reforms. Three definitions of a “spurt” and “setback” are used:
• Spurts and setbacks in governance are defined in the same way as in World Bank (2017).
• For the macroeconomic variables, a spurt (setback) is defined as a two-year decrease (increase) that is bigger(smaller) than the mean minus (plus) one standard deviation in the public-debt-to-GDP ratio or inflation.
Episodes in which there were improvements in one measure and simultaneous setbacks in another are excluded. The sample spans 97 emerging market and developing economies over 1996–2015, and excludes those with populations of less than 3 million.1
A panel regression is run in which the dependent variable is real private investment growth. The regressors are dummy variables for spurts (t) and setbacks (s) over the ([t−2, t+2] [s−1, s+2]) window around these episodes, for which the leads and lags are determined considering statistical significance and degrees of freedom. All estimates include time fixed effects to control for global common shocks and country fixed effects to control for time-invariant heterogeneity at the country level. Significant robust standard error estimates are identified with asterisks.
The key finding is that private investment increases after key improvements in public debt, inflation, and the quality of institutions (Figures 3.1.1 and 3.1.2; Table 3.1.1). Typically, setbacks tend to be anticipated by investors, who curtail investments. Economic growth and per capita income growth are also controlled for, but their coefficients tend to be statistically insignificant, and the main findings are unchanged. Similarly, policy spurts and setbacks remain statistically significant even after removing time effects.
1 The sample set is as follows: sub-Saharan Africa: Angola, Burundi, Benin, Burkina Faso, Chad, Côte d’Ivoire, Republic of Congo, Ethiopia, Ghana, Guinea, Kenya, Liberia, Madagascar, Malawi, Mali, Mozambique, Niger, Nigeria, Senegal, Sierra Leone, Tanzania, Togo, Uganda, Zambia, Zimbabwe. Other emerging market and developing economies: Afghanistan, Algeria, Argentina, Azerbaijan, Bangladesh, Belarus, Bolivia, Bosnia and Herzegovina, Brazil, Bulgaria, Cambodia, Chile, China, Colombia, Costa Rica, Croatia, Dominican Republic, Ecuador, Egypt, El Salvador, Eritrea, Georgia, Guatemala, Haiti, Honduras, Hungary, India, Indonesia, Iran, Iraq, Jordan, Kazakhstan, Kosovo, Kuwait, Kyrgyz Republic, Lao P.D.R., Lebanon, Libya, Malaysia, Mauritania, Mexico, Moldova, Morocco, Myanmar, Nepal, Nicaragua, Oman, Pakistan, Panama, Papua New Guinea, Paraguay, Peru, Philippines, Poland, Romania, Russia, Saudi Arabia, Serbia, Sri Lanka, Sudan, Tajikistan, Thailand, Tunisia, Turkey, Ukraine, United Arab Emirates, Uruguay, Venezuela, Vietnam.
This box was prepared by Nkunde Mwase based on Mwase (forthcoming).
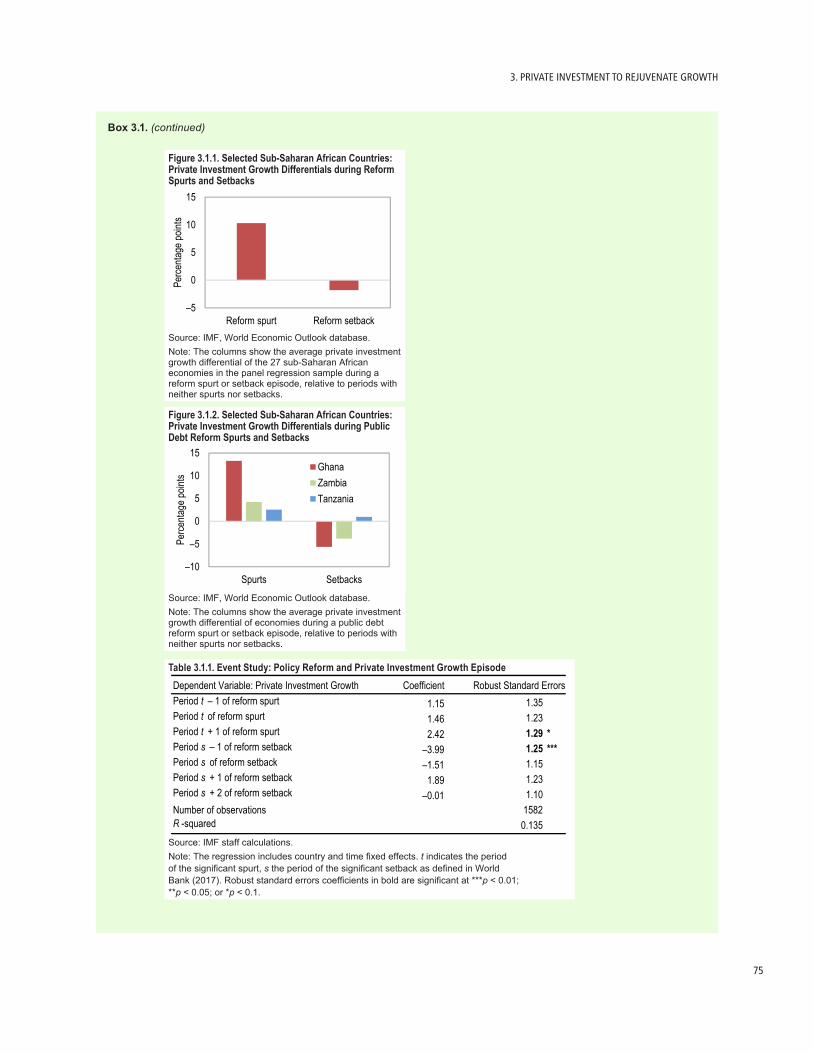
3. PRIVATE INVESTMENT TO REJUVENATE GROWTH
75
Figure 3.1.1. Selected Sub-Saharan African Countries: Private Investment Growth Differentials during Reform Spurts and Setbacks
–5
0
5
10
15
Reform spurt Reform setback
Perce
ntage
point
s
Source: IMF, World Economic Outlook database.Note: The columns show the average private investment growth differential of the 27 sub-Saharan African economies in the panel regression sample during a reform spurt or setback episode, relative to periods with neither spurts nor setbacks.
Figure 3.1.2. Selected Sub-Saharan African Countries: Private Investment Growth Differentials during Public Debt Reform Spurts and Setbacks
k–10
–5
0
5
10
15
Spurts Setbacks
Perce
ntage
point
s
GhanaZambiaTanzania
Source: IMF, World Economic Outlook database.Note: The columns show the average private investment growth differential of economies during a public debt reform spurt or setback episode, relative to periods with neither spurts nor setbacks.
Table 3.1.1. Event Study: Policy Reform and Private Investment Growth EpisodeDependent Variable: Private Investment Growth CoefficientPeriod t – 1 of reform spurt 1.15 1.35Period t of reform spurt 1.46 1.23Period t + 1 of reform spurt 2.42 1.29 *Period s – 1 of reform setback –3.99 1.25 ***Period s of reform setback –1.51 1.15Period s + 1 of reform setback 1.89 1.23Period s + 2 of reform setback –0.01 1.10Number of observations 1582R -squared 0.135
Robust Standard Errors
Source: IMF staff calculations.Note: The regression includes country and time fixed effects. t indicates the period of the significant spurt, s the period of the significant setback as defined in World Bank (2017). Robust standard errors coefficients in bold are significant at ***p < 0.01; **p < 0.05; or *p < 0.1.
Box 3.1. (continued)

REGIONAL ECONOMIC OUTLOOK: SUB-SAHARAN AFRICA
76
Box 3.2. Public Investment Efficiency in Sub-Saharan AfricaImproving the efficiency of public investment could contribute to more solid economic growth and help achieve desired social priorities and development goals. Public investment efficiency in sub-Saharan Africa compares unfavorably with other regions and could be improved by about 35 percent. Doing so would require improving the quality of institutions in the region. This in turn would require strengthening the planning and selection of public-private partnerships (PPPs), the credibility of multiyear budgeting, the effectiveness of project appraisal and selection, the monitoring of projects during implementation, and the registration of infrastructure assets.
Improving the efficiency of public investment in sub-Saharan Africa is a priority because countries continue to have substantial infrastructure needs and have limited fiscal space. In addition to the infrastructure gap, the region’s infrastructure is generally assessed to be of relatively low quality (Figure 3.2.1). For instance, the quality of electricity supply, roads, and railroads is scored below regional peers. The results also show substantial scope for improving efficiency (Table 3.2.1). Based on the three efficiency score indices used, the results suggest that sub-Saharan African countries could increase investment efficiency by about 35 percent.
There is wide variation in the efficiency of public investment across countries. A comparison of the efficiency scores across country groups within sub-Saharan Africa suggests that investment efficiency in resource-intensive countries is
lower than in non-resource-intensive countries. At the same time, countries in the East African Community perform better than those in the Central African Economic and Monetary Community and West African Economic and Monetary Union (Table 3.2.2). Oil exporters perform worse than other resource-intensive countries.
Considering the determinants of public investment efficiency in sub-Saharan African countries, cross-country regressions suggest that the quality of institutions is the most important factor. These regressions cover the period 2000–15, and the efficiency scores are a function of a set of explanatory variables, including (1) the quality of institutions as measured by two World Economic Forum indicators (control of corruption and regulatory quality), (2) official development assistance, (3) the percentage of urban population, and (4) dependence on natural resources, represented by a dummy variable for countries rich in nonrenewable natural resources.
Figure 3.2.1. Selected Regions: Perception of Infrastructure Quality, 2006–13
Figure 3.2.1: Selected Regions: Perception of Infrastructur
2.5
3.0
3.5
4.0
4.5
2006 07 08 09 10 11 12 13Infra
struc
ture
quali
ty (sc
ale: 1
–7)
Sub-Saharan AfricaLatin America and the CaribbeanEmerging and developing Asia
Sources: IMF Fiscal Affairs Department, Public Investment Management Assessment database; and IMF staff calculations.
Table 3.2.1. Average Efficiency Score by Regions
RegionPhysical
InfrastructureQuality
Infrastructure Hybrid IndicatorCommonwealth of Independent States 0.935 0.716 0.788Emerging and Developing Asia 0.501 0.788 0.659Emerging and Developing Europe 0.753 0.708 0.727Latin America and the Caribbean 0.580 0.769 0.709Middle East, North Africa, Afghanistan, and Pakistan 0.472 0.791 0.676
Sub-Saharan Africa 0.460 0.803 0.642Advanced Economies 0.733 0.888 0.880
Sources: IMF Fiscal Affairs Department, Public Investment Management Assessment database; and IMF staff calculations.
Table 3.2.2. Average Efficiency Score by Groups
RegionPhysical
Infrastructure Quality Infrastructure Hybrid IndicatorSub-Saharan Africa 0.460 0.803 0.642
CEMAC 0.305 0.625 0.511EAC 0.487 0.874 0.735WAEMU 0.369 0.814 0.619Oil exporters 0.196 0.594 0.269Non-resource-intensive countries 0.446 0.858 0.698Other resource-intensive countries 0.602 0.813 0.656
Sources: IMF Fiscal Affairs Department, Public Investment Management Assessment database; and IMF staff calculations.Note: CEMAC = Central African Economic and Monetary Community; EAC = East African Community; WAEMU = West African Economic and Monetary Union. See page 90 for country groupings table.
This box was prepared by Karim Barhoumi based on Barhoumi and others (forthcoming).

3. PRIVATE INVESTMENT TO REJUVENATE GROWTH
77
Overall, the estimates show a positive correlation between public investment efficiency and the quality of institutions and a negative association between dependence on natural resources and public investment efficiency.
The initial Public Investment Management Assessment results (for 21 pilot countries) show that sub-Saharan African countries have generally similar regulatory frameworks compared with the average in other regions. Figure 3.2.2 shows the average scores for regulatory frameworks for sub-Saharan Africa and emerging market and developing economies. Sub-Saharan Africa has slightly better frameworks in the areas of national and sectoral planning, multiyear budgeting, and project management. However, the region has weaker regulations in the areas of central-local coordination, management of PPPs, regulation of firms, and monitoring of assets. In addition, Figure 3.2.3 shows that in the areas of management of PPPs, multiyear budgeting, project appraisal and selection, project management, and monitoring of assets, certain regulations exist but are not used effectively to achieve public investment efficiency.
The efficiency of public investment has important implications for growth. As shown in Figure 3.2.4, which splits sub-Saharan African countries into “high-efficiency” countries (red dots) and “low-efficiency” countries (blue dots) relative to the median efficiency scores estimated, the relationship between investment and growth is stronger for the high-efficiency than for the low-efficiency countries.
Strengthening institutions could help improve the efficiency of public investment in sub-Saharan Africa. Specifically, a 10 percent increase in the Control of Corruption Index or the Regulatory Quality Index could lead to a reduction in the efficiency gap in sub-Saharan African countries of about 12 percent. For more detailed results, see Barhoumi and others (forthcomimg).
In sum, there is potential for strengthening a wide range of public investment management areas in sub-Saharan African countries, which in turn would increase public investment efficiency. This could be done by strengthening the planning and selection of PPPs, the credibility of multiyear budgeting, the effectiveness of project appraisal and selection, the monitoring of projects during implementation, and the registration of infrastructure assets.
Figure 3.2.2: Sub-Saharan Africa: PIMA Scores Regulatory Framework
1. Fiscal Rules2. National & Sectoral
Planning3. Central-Local
Coordination
4. Management ofPPPs
5. Company Regulation
6. Multiyear Budgeting
7. BudgetComprehensiveness
8. Budget Unity9. Project Appraisal10. Project Selection
11. Protection ofInvestment
12. Availability ofFunding
13.Transparency ofExecution
14.ProjectManagement
15. Monitoring ofAssets
SSA ( n = 10) Non SSA ( n = 10)Non SSA (n = 10)SSA (n = 10)Sources: IMF Fiscal Affairs Department, Public Investment Management Assessment database; and IMF staff calculations.Note: PIMA = public investment management assessment.
Figure 3.2.3. Sub-Saharan Africa: PIMA Scores Regulatory Framework and Effectiveness
1. Fiscal Rules2. National & Sectoral
Planning3. Central-Local
Coordination
4. Management ofPPPs
5. CompanyRegulation
6. MultiyearBudgeting
7. BudgetComprehensiveness
8. Budget Unity9. Project Appraisal10. Project Selection
11. Protection ofInvestment
12. Availability ofFunding
13.Transparency ofExecution
14.ProjectManagement
15. Monitoring ofAssets
SSA regulatory SSA effective
Sources: IMF Fiscal Affairs Department, Public Investment Management Assessment database; and IMF staff calculations.Note: PIMA = public investment management assessment.
Figure 3.2.4. Sub-Saharan Africa: Investment and Growth
Figure 3.2.4 Sub-Saharan Africa: Investment and Growth
NGA
MDG
SLETZA LSOBFA
UGABENCMR
GINMLI
MOZBWA
MWICPVSEN
SYCZWE GHA
ETH
MUSKEN
ZAF
CIV
BDIGMB
LBRNAM
RWA
–2–1
0123456789
0 5 10 15 20
Aver
age a
nnua
l per
capit
a GDP
gr
owth
(201
0–15
)
Average annual public investment, percent of GDP (2010–15)
Low efficiencyHigh efficiency
Sources: IMF Fiscal Affairs Department, Public Investment Management Assessment database; IMF, World Economic Outlook database; and IMF staff calculations.Note: See page 91 for country abbreviations table.
Box 3.2. (continued)

REGIONAL ECONOMIC OUTLOOK: SUB-SAHARAN AFRICA
78
Box 3.3. Developing Domestic Debt Markets in Sub-Saharan AfricaThe development of domestic government bond markets in Africa has attracted growing interest among policymakers, investors, and analysts in recent years. Governments have been induced, or felt compelled, to finance their growing budgetary deficits through domestic issuance. Factors pushing in that direction include the limitations of direct banking sector financing; limited availability of foreign aid and/or concessional foreign loans from the official sector (foreign gov-ernments and multilateral institutions); and increasing awareness of the risks associated with borrowing abroad and in foreign currencies. More positively, developing the domestic bond market may contribute to overall financial deepening.
Several African countries have extended maturities on their domestic debt, a result of developing their government bond markets. For example, Côte d’Ivoire, Namibia, and Uganda have more than doubled issuance of local currency government bonds, with the stock of local currency bonds in these countries now equivalent to 8.5 percent of GDP on average. The maturity of bonds issued rose on average from 1.5 years to 6.4 years, with some countries, such as Ghana, Kenya, Namibia, Nigeria, and Tanzania, issuing local currency bonds at maturities of or over 15 years.
To develop a sustainable bond market, the following would be required:
• A stable political environment for credible policymaking. The political environment should be secure, and the government should be a credible policymaker.
• A suitable environment for domestic issuance and an effective framework for coordination of debt management and monetary policy.
• A legal and regulatory framework that facilitates the operations of primary and secondary markets of both government and corporate instruments. A clear, modern legal framework for government securities is essential in defining the authority to borrow, and for market transactions and the settlement system.
• Adherence to sound debt management policies and practice that promotes the development of a broader domestic bond market. The existence of a medium-term debt management strategy and a publicly available annual borrowing plan provide the transparency and predictability that allow for the wider market to develop.
• A commitment from the government to pay market interest rates. The market cannot develop if the government creates a captive investor base by compelling some institutions to buy debt instruments using regulations, or if it regularly intervenes in the issuance process to manage the yields at which it issues.
• A sound financial system. Banks are typically the initial investors in any domestic government bond market. Their soundness also ensures that bank failures do not increase the government’s financing burden.
• A market infrastructure to support trading, transparency, and financial stability. Adequate clearing, settlement, and custody frameworks should be established for government and corporate securities.
• A diversified investor base. A large and heterogeneous investor base with varied risk preferences, investment horizons, and trading motives can ensure demand for government debt securities across a range of market conditions, as well as support secondary market liquidity.
• Availability of sufficient resources for bond market development. Resource constraints, particularly in terms of staff and capacity in the debt management office, central banks, regulators, and the private sector, can be a constraining factor. Moreover, the authorities will have to bear some costs during the start-up phase, for example, in terms of higher yields and greater rollover risk.
This box was prepared by Thordur Jonasson and James Knight.

3. PRIVATE INVESTMENT TO REJUVENATE GROWTH
79
Developing domestic debt markets can bring several benefits. Domestic bond issuance (corporate or public) complements funding from external sources and banks. It can help support the implementation of monetary policy, strengthen financial markets, reduce foreign exchange risks, enable the market for private savings, and facilitate the availability of longer-term financing for infrastructure. In addition, developing debt markets should be part of a broader strategy to mobilize domestic finance.
Developing domestic sources of financing would also help mitigate some of the risks from existing Eurobonds. First, Eurobond issuances have surged during a prolonged period of low interest rates since the global financial crisis. Currently, global interest rates are starting to move higher, and capital flow reversals could coincide with the initial wave of Eurobonds reaching maturity. Refinancing risk could become acute, particularly for countries with macroeconomic imbalances; in this context, domestic markets could become even more important.
But developing domestic bond markets can have financial stability implications. A more dynamic market, which may possibly attract international investors, will be helpful in diversifying the investor base and possibly extending maturities. Foreign capital inflows may be most valuable to a country without large nonbank financial institutions with ongoing demand for securities. Foreign investor demand may also reduce crowding out. However, external capital flows may be especially sensitive to risk and relative returns, making national markets susceptible to slight changes in global interest rates and resulting in booms and busts in asset price and credit flows. This is particularly relevant for some sub-Saharan African countries where domestic debt markets have become a destination for foreign investment. For example, nonresidents hold about 40 percent of domestic government bonds in South Africa and about 50 percent of domestic government debt in Ghana. This compares with an average of 25 percent for emerging market economies.
Box 3.3. (continued)

REGIONAL ECONOMIC OUTLOOK: SUB-SAHARAN AFRICA
80
Box 3.4. Fintech in Sub-Saharan AfricaFintech (the development of financial technology based on innovations of processes, applications, products, and business models) can promote efficiency in the financial industry by transforming the delivery of core financial sector functions, such as the settling of payments, borrowing and saving, risk sharing, and the allocation of capital.
How Can Fintech Support Private Investment?
Fintech could support private investment in sub-Saharan Africa using existing mobile platforms to reduce frictions in the intermediation of funds between savers and investors. Even though the surge in mobile payments in sub-Saharan Africa is not directly related to financial intermediation services, mobile-payment providers have started to leverage their experience, mature technological platform, and large customer base to also provide financial intermediation services. For instance, M-Pesa offers the mobile banking services M-Kesho and M-Shwari to provide access to savings accounts and microcredit products in Kenya. Other examples are Zoona and EasyEquities in South Africa. Zoona has partnered with a crowd-lending platform to offer funding services to entrepreneurs, while EasyEquities enables investment in share in a variety of products (equities, exchange-traded funds, exchange-traded notes, etc.). In this regard, the successful emergence of mobile payments in the region provides a good starting point. Even though financial inclusion ratios are still low compared with other regions, sub-Saharan Africa is a world leader in mobile money payments, with some very successful mobile payment systems, such as M-Pesa in Kenya, Tanzania, and other countries (Figure 3.4.1). The success of these services is most probably the result of several factors, including a large unfulfilled demand for payment services in a market with a relatively developed mobile infrastructure; an appropriate pricing structure to attract customers; and adequate regulation of central banks that provide M-Pesa with space to enter in the market.
Fintech can also support the region’s investment growth by helping improve efficiency in the infrastructure of financial markets, including payment, settlement, and clearing systems—all of which are underdeveloped in sub-Saharan Africa compared with other regions. Since infrastructure helps reduce various sources of financial risks, such as systemic, credit, and liquidity risks (BIS 2012), its development can promote the growth of financial markets such as derivatives, bond, or money markets. This could have positive spillovers on the financing of investment in sub-Saharan Africa. For instance, central counterparties can improve the functioning of derivatives markets, which can help banks more efficiently transfer the credit risk from their loan portfolio. Also, riskless settlement securities systems reduce trading frictions in bond markets, which can facilitate the issuance of corporate bonds to finance investment projects. The use of distributed ledger technologies is also being explored because of potential efficiency gains.
Balancing the Safety-Efficiency Trade-off
Overall, it is important to stress that efficiency gains from the emergence of fintech are not free of social costs. Fintech may exacerbate some of the well-known vulnerabilities of financial systems or create new weaknesses (BCBS 2017). For instance, a proliferation of innovative products and services may increase the complexity of financial services delivery, making it more difficult to manage and control operational risk. Fintech can also increase difficulties in meeting compliance requirements, obligations concerning money laundering and combating the financing of terrorism, and the effective management of cyber-risks.
Figure 3.4.1. Selected Regions: Mobile Subscriptions and Mobile Money Accounts
0
50
100
150
200
250
300
SSA Asia EURCIS LAC MENAMobil
e mon
ey ac
coun
ts pe
r 1,0
00 ad
ults
020406080
100120140
SSA Asia EURCIS LAC MENA
Mobil
e sub
scrip
tions
per
100 p
eople
1. Mobile Subscriptions
2. Mobile Money Accounts
Sources: World Bank, Global Financial Inclusion; and World Bank, World Development Indicators database.Note: EURCIS = Europe and Commonwealth of Independent States; LAC = Latin America and the Caribbean; MENA = Middle East and North Africa; SSA = sub-Saharan Africa.
This box was prepared by Hector Perez-Saiz based on Maino and others (forthcoming).

3. PRIVATE INVESTMENT TO REJUVENATE GROWTH
81
Annex 3.1. Calculation of the Real Investment Index and Regional Growth Rates
32
Annex 3.1. Calculation of the Real Investment Index and Regional Growth Rates This annex describes how the Real Investment Index in Figure 3.3 in the main text is computed. First, for each country �, total annual real investment growth is decomposed into the contributions of private and public components:
��,� = ��,�����,��� + �1 � ��,������,�
�� = ��,��� + ��,�
��, In which ��,��� is the share of private investment over total investment in country �, and ��,�
�� and ��,��� are the rates
of growth of private and public investment, respectively. Then, the weighted average across countries using purchasing-power-parity GDP weights of each component is computed, such that the regional total investment growth rate can be decomposed as �� = ��
�� + ����. Finally, the Real Investment Index �� is computed recursively
using �� = �������� + ������
��, starting from ����� = 1, and ������� = ����� and �����
�� = 1 � �����, in which
�� = ∑ ���,���,���∑ ��,��
is the purchasing-power-parity GDP-weighted average of the share of private investment across countries. To control for the effect of extreme values, and to be consistent with the decomposition presented above, the regional private and public investment growth rates for each year are computed as follows:
����� = ��
��
����
����� = ��
��
1 � ���� ,
such that the regional total investment growth rate can be expressed as a weighted average between the private and public component growth rates:
�� = ��������� + �1 � ��������
��.
(A3.1.1)
(A3.1.2)
(A3.1.3)
(A3.1.4)

REGIONAL ECONOMIC OUTLOOK: SUB-SAHARAN AFRICA
82
Annex 3.2. Determinants of Private Fixed Investment Ratios in Emerging Market and Developing Economies
This annex presents the empirical approach for the analysis of the institutional drivers of private fixed investment ratios in emerging marketand developing economies. It provides details on the econometric methodology, data, and estimation results.
Baseline Regressions
In the baseline regressions, the ratio of private investment to GDP is explained by its lagged value and by traditional determinants of investment identified in the literature (including Servén 2003; IMF 2005; Cavallo and Daude 2011; Lim 2014; World Bank 2017) using the dynamic fixed-effects panel data equation:
33
Annex 3.2. Determinants of Private Fixed Investment Ratios in Emerging and Developing Economies
This annex presents the empirical approach for the analysis of the institutional drivers of private fixed investment ratios in emerging and developing economies. It provides details on the econometric methodology, data, and estimation results.
Baseline Regressions
In the baseline regressions, the ratio of private investment to GDP is explained by its lagged value and by traditional determinants of investment identified in the literature (including Servén 2003; IMF 2005; Cavallo and Daude 2011; Lim 2014; World Bank 2017) using the dynamic fixed-effects panel data equation:
0 1 2 3 , 4 5 , 6 , ,, , 1 , ,
ln ,i t i t i t i t i ti t i t i t i t
I I IG PIYpc IR gY Y Y PY
where I/Y is the private-fixed-investment-to-GDP ratio, IG/Y is the public-fixed-investment-to-GDP ratio, Ypc is the real GDP per capita in purchasing power parity, PI/PY is the ratio of the deflator of gross fixed investment to the GDP deflator (the relative price of capital), IR is the real interest rate, g is the real GDP growth, ηi and γt denote country and year fixed effects (to control for unobserved cross-country heterogeneity and for global shocks, respectively), and εi,t is the error term. The final estimation sample is comprised of 101 emerging and developing economies over the years 1980 to 2015.27 Data sources are presented in Annex Table 3.2.3.
The estimation uses the system GMM estimator (Arellano and Bover 1995; Blundell and Bond 1998) to address the Nickell (1981) bias arising from the lagged dependent variable, and possible endogeneity issues between the variables.28
27 Countries include Algeria, Angola, Antigua and Barbuda, Argentina, Armenia, Azerbaijan, The Bahamas, Bahrain, Bangladesh, Barbados, Belarus, Belize, Benin, Bhutan, Bolivia, Bosnia and Herzegovina, Botswana, Brazil, Bulgaria, Burkina Faso, Burundi, Cabo Verde, Cameroon, Central African Republic, Chad, Chile, China, Colombia, Comoros, Democratic Republic of the Congo, Republic of the Congo, Costa Rica, Côte d'Ivoire, Croatia, Djibouti, Dominica, Dominican Republic, Ecuador, Egypt, Equatorial Guinea, Ethiopia, Gabon, The Gambia, Ghana, Grenada, Guatemala, Guinea, Guinea-Bissau, Haiti, Honduras, Hungary, India, Indonesia, Iran, Jordan, Kenya, Kuwait, Kyrgyz Republic, Lebanon, Lesotho, Malaysia, Mauritius, Mexico, Moldova, Mongolia, Republic of Montenegro, Morocco, Mozambique, Myanmar, Namibia, Nepal, Nicaragua, Niger, Oman, Panama, Peru, Poland, Romania, Russia, Rwanda, São Tomé and Príncipe, Senegal, Serbia, Seychelles, Sierra Leone, South Africa, Sri Lanka, St. Lucia, St. Vincent and the Grenadines, Suriname, Swaziland, United Republic of Tanzania, Thailand, Togo, Tunisia, Uganda, Ukraine, Uruguay, Venezuela, Yemen, Zambia.
28 The null hypothesis of the Im-Pesaran-Shin test that all panels of the sample have a unit root is rejected at less than 0.1 percent significance level. GMM regressions are performed using the two-step procedure with the Windmeijer’s finite-sample correction. The lagged dependent variable is treated as predetermined and instrumented with one to two lags. The other regressors are treated as endogenous variables and are instrumented with two lags and more, while fixed effects and some institutional variables, like regulatory quality or the cost of resolving insolvencies, are treated as exogenous. The validity of the instruments is tested using the Hansen test, with the number of instruments being lower than the number of countries to limit a weakening of the Hansen test, as suggested by Roodman (2009). The absence of serial correlation of residuals is
in which I/Y is the private-fixed-investment-to-GDP ratio, IG/Y is the public-fixed-investment-to-GDP ratio, Ypc is the real GDP per capita in purchasing power parity, PI/PY is the ratio of the deflator of gross fixed investment to the GDP deflator (the relative price of capital), IR is the real interest rate, g is the real GDP growth,
33
Annex 3.2. Determinants of Private Fixed Investment Ratios in Emerging and Developing Economies
This annex presents the empirical approach for the analysis of the institutional drivers of private fixed investment ratios in emerging and developing economies. It provides details on the econometric methodology, data, and estimation results.
Baseline Regressions
In the baseline regressions, the ratio of private investment to GDP is explained by its lagged value and by traditional determinants of investment identified in the literature (including Servén 2003; IMF 2005; Cavallo and Daude 2011; Lim 2014; World Bank 2017) using the dynamic fixed-effects panel data equation:
0 1 2 3 , 4 5 , 6 , ,, , 1 , ,
ln ,i t i t i t i t i ti t i t i t i t
I I IG PIYpc IR gY Y Y PY
where I/Y is the private-fixed-investment-to-GDP ratio, IG/Y is the public-fixed-investment-to-GDP ratio, Ypc is the real GDP per capita in purchasing power parity, PI/PY is the ratio of the deflator of gross fixed investment to the GDP deflator (the relative price of capital), IR is the real interest rate, g is the real GDP growth, ηi and γt denote country and year fixed effects (to control for unobserved cross-country heterogeneity and for global shocks, respectively), and εi,t is the error term. The final estimation sample is comprised of 101 emerging and developing economies over the years 1980 to 2015.27 Data sources are presented in Annex Table 3.2.3.
The estimation uses the system GMM estimator (Arellano and Bover 1995; Blundell and Bond 1998) to address the Nickell (1981) bias arising from the lagged dependent variable, and possible endogeneity issues between the variables.28
27 Countries include Algeria, Angola, Antigua and Barbuda, Argentina, Armenia, Azerbaijan, The Bahamas, Bahrain, Bangladesh, Barbados, Belarus, Belize, Benin, Bhutan, Bolivia, Bosnia and Herzegovina, Botswana, Brazil, Bulgaria, Burkina Faso, Burundi, Cabo Verde, Cameroon, Central African Republic, Chad, Chile, China, Colombia, Comoros, Democratic Republic of the Congo, Republic of the Congo, Costa Rica, Côte d'Ivoire, Croatia, Djibouti, Dominica, Dominican Republic, Ecuador, Egypt, Equatorial Guinea, Ethiopia, Gabon, The Gambia, Ghana, Grenada, Guatemala, Guinea, Guinea-Bissau, Haiti, Honduras, Hungary, India, Indonesia, Iran, Jordan, Kenya, Kuwait, Kyrgyz Republic, Lebanon, Lesotho, Malaysia, Mauritius, Mexico, Moldova, Mongolia, Republic of Montenegro, Morocco, Mozambique, Myanmar, Namibia, Nepal, Nicaragua, Niger, Oman, Panama, Peru, Poland, Romania, Russia, Rwanda, São Tomé and Príncipe, Senegal, Serbia, Seychelles, Sierra Leone, South Africa, Sri Lanka, St. Lucia, St. Vincent and the Grenadines, Suriname, Swaziland, United Republic of Tanzania, Thailand, Togo, Tunisia, Uganda, Ukraine, Uruguay, Venezuela, Yemen, Zambia.
28 The null hypothesis of the Im-Pesaran-Shin test that all panels of the sample have a unit root is rejected at less than 0.1 percent significance level. GMM regressions are performed using the two-step procedure with the Windmeijer’s finite-sample correction. The lagged dependent variable is treated as predetermined and instrumented with one to two lags. The other regressors are treated as endogenous variables and are instrumented with two lags and more, while fixed effects and some institutional variables, like regulatory quality or the cost of resolving insolvencies, are treated as exogenous. The validity of the instruments is tested using the Hansen test, with the number of instruments being lower than the number of countries to limit a weakening of the Hansen test, as suggested by Roodman (2009). The absence of serial correlation of residuals is
and
33
Annex 3.2. Determinants of Private Fixed Investment Ratios in Emerging and Developing Economies
This annex presents the empirical approach for the analysis of the institutional drivers of private fixed investment ratios in emerging and developing economies. It provides details on the econometric methodology, data, and estimation results.
Baseline Regressions
In the baseline regressions, the ratio of private investment to GDP is explained by its lagged value and by traditional determinants of investment identified in the literature (including Servén 2003; IMF 2005; Cavallo and Daude 2011; Lim 2014; World Bank 2017) using the dynamic fixed-effects panel data equation:
0 1 2 3 , 4 5 , 6 , ,, , 1 , ,
ln ,i t i t i t i t i ti t i t i t i t
I I IG PIYpc IR gY Y Y PY
where I/Y is the private-fixed-investment-to-GDP ratio, IG/Y is the public-fixed-investment-to-GDP ratio, Ypc is the real GDP per capita in purchasing power parity, PI/PY is the ratio of the deflator of gross fixed investment to the GDP deflator (the relative price of capital), IR is the real interest rate, g is the real GDP growth, ηi and γt denote country and year fixed effects (to control for unobserved cross-country heterogeneity and for global shocks, respectively), and εi,t is the error term. The final estimation sample is comprised of 101 emerging and developing economies over the years 1980 to 2015.27 Data sources are presented in Annex Table 3.2.3.
The estimation uses the system GMM estimator (Arellano and Bover 1995; Blundell and Bond 1998) to address the Nickell (1981) bias arising from the lagged dependent variable, and possible endogeneity issues between the variables.28
27 Countries include Algeria, Angola, Antigua and Barbuda, Argentina, Armenia, Azerbaijan, The Bahamas, Bahrain, Bangladesh, Barbados, Belarus, Belize, Benin, Bhutan, Bolivia, Bosnia and Herzegovina, Botswana, Brazil, Bulgaria, Burkina Faso, Burundi, Cabo Verde, Cameroon, Central African Republic, Chad, Chile, China, Colombia, Comoros, Democratic Republic of the Congo, Republic of the Congo, Costa Rica, Côte d'Ivoire, Croatia, Djibouti, Dominica, Dominican Republic, Ecuador, Egypt, Equatorial Guinea, Ethiopia, Gabon, The Gambia, Ghana, Grenada, Guatemala, Guinea, Guinea-Bissau, Haiti, Honduras, Hungary, India, Indonesia, Iran, Jordan, Kenya, Kuwait, Kyrgyz Republic, Lebanon, Lesotho, Malaysia, Mauritius, Mexico, Moldova, Mongolia, Republic of Montenegro, Morocco, Mozambique, Myanmar, Namibia, Nepal, Nicaragua, Niger, Oman, Panama, Peru, Poland, Romania, Russia, Rwanda, São Tomé and Príncipe, Senegal, Serbia, Seychelles, Sierra Leone, South Africa, Sri Lanka, St. Lucia, St. Vincent and the Grenadines, Suriname, Swaziland, United Republic of Tanzania, Thailand, Togo, Tunisia, Uganda, Ukraine, Uruguay, Venezuela, Yemen, Zambia.
28 The null hypothesis of the Im-Pesaran-Shin test that all panels of the sample have a unit root is rejected at less than 0.1 percent significance level. GMM regressions are performed using the two-step procedure with the Windmeijer’s finite-sample correction. The lagged dependent variable is treated as predetermined and instrumented with one to two lags. The other regressors are treated as endogenous variables and are instrumented with two lags and more, while fixed effects and some institutional variables, like regulatory quality or the cost of resolving insolvencies, are treated as exogenous. The validity of the instruments is tested using the Hansen test, with the number of instruments being lower than the number of countries to limit a weakening of the Hansen test, as suggested by Roodman (2009). The absence of serial correlation of residuals is
denote country and year fixed effects (to control for unobserved cross-country heterogeneity and for global shocks, respectively), and
33
Annex 3.2. Determinants of Private Fixed Investment Ratios in Emerging and Developing Economies
This annex presents the empirical approach for the analysis of the institutional drivers of private fixed investment ratios in emerging and developing economies. It provides details on the econometric methodology, data, and estimation results.
Baseline Regressions
In the baseline regressions, the ratio of private investment to GDP is explained by its lagged value and by traditional determinants of investment identified in the literature (including Servén 2003; IMF 2005; Cavallo and Daude 2011; Lim 2014; World Bank 2017) using the dynamic fixed-effects panel data equation:
0 1 2 3 , 4 5 , 6 , ,, , 1 , ,
ln ,i t i t i t i t i ti t i t i t i t
I I IG PIYpc IR gY Y Y PY
where I/Y is the private-fixed-investment-to-GDP ratio, IG/Y is the public-fixed-investment-to-GDP ratio, Ypc is the real GDP per capita in purchasing power parity, PI/PY is the ratio of the deflator of gross fixed investment to the GDP deflator (the relative price of capital), IR is the real interest rate, g is the real GDP growth, ηi and γt denote country and year fixed effects (to control for unobserved cross-country heterogeneity and for global shocks, respectively), and εi,t is the error term. The final estimation sample is comprised of 101 emerging and developing economies over the years 1980 to 2015.27 Data sources are presented in Annex Table 3.2.3.
The estimation uses the system GMM estimator (Arellano and Bover 1995; Blundell and Bond 1998) to address the Nickell (1981) bias arising from the lagged dependent variable, and possible endogeneity issues between the variables.28
27 Countries include Algeria, Angola, Antigua and Barbuda, Argentina, Armenia, Azerbaijan, The Bahamas, Bahrain, Bangladesh, Barbados, Belarus, Belize, Benin, Bhutan, Bolivia, Bosnia and Herzegovina, Botswana, Brazil, Bulgaria, Burkina Faso, Burundi, Cabo Verde, Cameroon, Central African Republic, Chad, Chile, China, Colombia, Comoros, Democratic Republic of the Congo, Republic of the Congo, Costa Rica, Côte d'Ivoire, Croatia, Djibouti, Dominica, Dominican Republic, Ecuador, Egypt, Equatorial Guinea, Ethiopia, Gabon, The Gambia, Ghana, Grenada, Guatemala, Guinea, Guinea-Bissau, Haiti, Honduras, Hungary, India, Indonesia, Iran, Jordan, Kenya, Kuwait, Kyrgyz Republic, Lebanon, Lesotho, Malaysia, Mauritius, Mexico, Moldova, Mongolia, Republic of Montenegro, Morocco, Mozambique, Myanmar, Namibia, Nepal, Nicaragua, Niger, Oman, Panama, Peru, Poland, Romania, Russia, Rwanda, São Tomé and Príncipe, Senegal, Serbia, Seychelles, Sierra Leone, South Africa, Sri Lanka, St. Lucia, St. Vincent and the Grenadines, Suriname, Swaziland, United Republic of Tanzania, Thailand, Togo, Tunisia, Uganda, Ukraine, Uruguay, Venezuela, Yemen, Zambia.
28 The null hypothesis of the Im-Pesaran-Shin test that all panels of the sample have a unit root is rejected at less than 0.1 percent significance level. GMM regressions are performed using the two-step procedure with the Windmeijer’s finite-sample correction. The lagged dependent variable is treated as predetermined and instrumented with one to two lags. The other regressors are treated as endogenous variables and are instrumented with two lags and more, while fixed effects and some institutional variables, like regulatory quality or the cost of resolving insolvencies, are treated as exogenous. The validity of the instruments is tested using the Hansen test, with the number of instruments being lower than the number of countries to limit a weakening of the Hansen test, as suggested by Roodman (2009). The absence of serial correlation of residuals is
is the error term. The final estimation sample is composed of 101 emerging market and developing economies over the years 1980 to 2015.1 Data sources are presented in Annex Table 3.2.3.
The estimation uses the system generalized methods of moments (GMM) estimator (Arellano and Bover 1995; Blundell and Bond 1998) to address the Nickell (1981) bias arising from the lagged dependent variable and possible endogeneity issues between the variables.2
Results reported in Annex Table 3.2.1 confirm the persistence of the private investment ratio. In line with a crowding-out effect of public investment on private investment (Cavallo and Daude 2011; IMF 2017), the coefficient on the public-investment-to-GDP ratio is significant with the expected negative sign. However, this crowding-out effect is mitigated if the availability of financing in the economy increases, as implied by a higher degree of financial development (column (2)). Real GDP growth is also significant, both statistically and economically: a 1 standard deviation increase in real GDP growth (+6.2 percent) translates into a 1.3 percentage point increase in the investment ratio. The relative price of investment reduces private investment ratios, while neither the level of GDP per capita nor the real interest rate is significant.3
1 Countries are Algeria, Angola, Antigua and Barbuda, Argentina, Armenia, Azerbaijan, The Bahamas, Bahrain, Bangladesh, Barbados, Belarus, Belize, Benin, Bhutan, Bolivia, Bosnia and Herzegovina, Botswana, Brazil, Bulgaria, Burkina Faso, Burundi, Cabo Verde, Cameroon, Central African Republic, Chad, Chile, China, Colombia, Comoros, Democratic Republic of the Congo, Republic of Congo, Costa Rica, Côte d’Ivoire, Croatia, Djibouti, Dominica, Dominican Republic, Ecuador, Egypt, Equatorial Guinea, Ethiopia, Gabon, The Gambia, Ghana, Grenada, Guatemala, Guinea, Guinea-Bissau, Haiti, Honduras, Hungary, India, Indonesia, Iran, Jordan, Kenya, Kuwait, Kyrgyz Republic, Lebanon, Lesotho, Malaysia, Mauritius, Mexico, Moldova, Mongolia, Montenegro, Morocco, Mozambique, Myanmar, Namibia, Nepal, Nicaragua, Niger, Oman, Panama, Peru, Poland, Romania, Russia, Rwanda, São Tomé and Príncipe, Senegal, Serbia, Seychelles, Sierra Leone, South Africa, Sri Lanka, St. Lucia, St. Vincent and the Grenadines, Suriname, Swaziland, Tanzania, Thailand, Togo, Tunisia, Uganda, Ukraine, Uruguay, Venezuela, Yemen, Zambia. 2 The null hypothesis of the Im-Pesaran-Shin test that all panels of the sample have a unit root is rejected at less than 0.1 percent significance level. GMM regressions are performed using the two-step procedure with the Windmeijer’s finite-sample correction. The lagged dependent variable is treated as predetermined and instrumented with one to two lags. The other regressors are treated as endogenous variables and are instrumented with two lags and more, while fixed effects and some institutional variables, such as regulatory quality or the cost of resolving insolvencies, are treated as exogenous. The validity of the instruments is tested using the Hansen test, with the number of instruments being lower than the number of countries to limit a weakening of the Hansen test, as suggested by Roodman (2009). The absence of serial correlation of residuals is tested using the AR(2), test while in all regressions, the AR(1) test is rejected, suggesting, as expected, a first-order serial correlation of the differenced error term.3 Other control variables considered include inflation, a real effective exchange rate index to control for competitiveness, the terms of trade, oil prices interacted with a dummy variable for oil exporters, foreign direct investment, estimates of the stocks of public and private capital, public consumption as a share of GDP, public external debt, and the current account as a share of GDP. None of these variables are significant, and their inclusion does not modify the results presented here.
(A3.2.1)

3. PRIVATE INVESTMENT TO REJUVENATE GROWTH
83
Decomposing the effect of GDP growth between low and high levels of growth indicates the presence of a nonlinear effect (column (3)).4 Finally, the regressions also include structural variables such as the World Bank’s Doing Business, Worldwide Governance, and International Country Risk Guide indicators; variables for infrastructure like paved roads as a proportion of total roads, or access to electricity in percent of the population (results not reported); financial development, measured by the IMF’s Financial Development Index (Svirydzenka 2016); capital account openness (proxied by the Chinn-Ito index); and trade openness. However, none of these variables have a significant direct effect on private investment (columns (5)–(7)). The effect of real GDP growth on investment is significant only in the richer countries of the sample (that is, those countries with an average level of GDP per capita above the median of the sample, which is $5,072 in 2011 purchasing-power-parity terms). This probably reflects better institutions in these economies (column (4)). Thus, the next section investigates whether the institutional environment matters for the relationship between growth and investment.
Interactions of GDP Growth with Institutions and GDP Growth Effects by Country Groups
The baseline regressions are extended by adding interactions between real GDP growth and some of the above-mentioned structural variables or by classifying countries by groups according to their structural characteristics. Annex Table 3.2.2 reports results of the regressions. Considering the interaction effects with the World Bank’s Doing Business, Worldwide Governance, and International Country Risk Guide indicators, only a few variables are significant, although the findings should be interpreted with caution, since these indicators are available only from the end of the 1990s or from the mid-2000s, implying a significant reduction in the size of the sample. In particular, the effect of GDP growth on investment is larger when regulatory quality is higher and when the cost of resolving insolvency (as a percent of the real estate property value of the firm) is lower (columns (1) and (2)).5
Following Servén (2003), countries are classified into groups with high and low infrastructure (paved roads and access to electricity), trade openness, financial development, or capital account openness according to whether the country-average level of each structural variable is above or below the sample median, allowing each group to carry a different coefficient on the GDP growth variable in the regressions.6 Results indicate a positive effect of GDP growth in the groups of countries with high levels of paved roads, access to electricity, and trade openness (columns (3)–(5)), low capital account openness (column (6)), and a high level of financial development (column (7)).
4 For each country, real GDP growth is considered high (low) if it is above (below) the country-specific historical mean measured over the estimation period.5 As defined by the Worldwide Governance Indicators “regulatory quality captures perceptions of the ability of the government to formulate and implement sound policies” and “regulations that permit and promote private sector development.” Regulatory quality covers product markets, labor markets (for example, “How problematic are labor regulations for the growth of your business?”), taxation, and other aspects affecting the ease of starting and running a business. Because this indicator is based mainly on a survey of perceptions rather than on objective information, results obtained with this indicator should be interpreted with caution.6 Regressions also include the square of real GDP growth to control for the possibility that countries with better institutions might also show higher levels of growth, and therefore higher investment ratios. However, including this variable does not alter the signifi-cance of the coefficients of interactions with structural variables.

REGIONAL ECONOMIC OUTLOOK: SUB-SAHARAN AFRICA
84
Dependent Variable: Private-Investment-to-GDP Ratio (1) (2) (3) (4) (5) (6) (7)Private-investment-to-GDP ratio, one-year lagged 0.793*** 0.764*** 0.800*** 0.811*** 0.781*** 0.858*** 0.775***
(10.58) (8.88) (9.69) (11.23) (10.43) (14.30) (10.03)Public-investment-to-GDP ratio –0.557** –1.362** –0.546** –0.521** –0.625** –0.514*** –0.471**
(–2.45) (–2.37) (–2.48) (–2.36) (–2.03) (–2.76) (–2.53)Real GDP per capita in logs 2.885 –0.406 0.691 1.777 1.689 1.821 2.071
(0.96) (–0.13) (0.30) (0.55) (0.81) (1.15) (0.48)Relative price of investment in logs –1.516** –0.999 –1.273** –1.751*** –1.219* –0.761 –1.354**
(–2.39) (–1.32) (–2.07) (–2.70) (–1.82) (–1.23) (–2.00)Real interest rate –0.034 –0.022 –0.037 –0.025 –0.013 0.045 –0.031
(–1.01) (–0.72) (–0.86) (–0.89) (–0.44) (0.72) (–1.06)Real GDP growth 0.209* 0.239* 0.181* 0.190*** 0.209*
(1.86) (1.91) (1.83) (2.86) (1.87)Low real GDP growth 0.372
(1.25)High real GDP growth 0.228*
(1.90)Financial development × public investment ratio 5.946**
(2.02)Financial Development Index –25.888 0.232
(–1.52) (0.02)Real GDP growth × low Income country1 –0.263
(–0.87)Real GDP growth × high income country1 0.321***
(3.50)Trade openness 0.027
(1.13)Capital account openness 0.096
(0.29)Year fixed effects Yes Yes Yes Yes Yes Yes YesObservations 2,194 2,185 2,194 2,194 2,194 2,143 2,185Number of countries 101 100 101 101 101 99 100Number of instruments 51 58 54 54 50 69 54AR(2) test p -value 0.693 0.544 0.603 0.687 0.835 0.994 0.662Hansen test p -value 0.303 0.305 0.347 0.237 0.097 0.146 0.17
Annex Table 3.2.1. Determinants of Private Investment Ratios in Emerging Market and Developing Economies: Baseline Regressions
Source: IMF staff calculations.Note: Estimates using the Arellano and Bond system—generalized method of moments estimator. Constant term included but not reported. Real GDP per capita in purchasing power parity terms. Robust z-statistics in parentheses. *p < .10; **p < .05; ***p < .01.1 Lower and higher than the median country, respectively, following Sérven (2003).

3. PRIVATE INVESTMENT TO REJUVENATE GROWTH
85
Dependent Variable: Private-Investment-to-GDP Ratio (1) (2) (3) (4) (5) (6) (7)Private investment-to-GDP ratio, one-year lagged 0.878*** 0.877*** 0.824*** 0.879*** 0.867*** 0.880*** 0.873***
(14.11) (7.78) (9.92) (14.53) (11.52) (12.97) (11.98)Public-investment-to-GDP ratio -0.508** -0.414** -0.528*** -0.546** -0.488** -0.340* -0.471**
(-1.84) (-2.28) (-2.70) (-2.33) (-2.17) (-1.76) (-2.14)Real GDP per capita in logs 1.465 -0.480 1.324 3.017 1.458 0.767 3.665
(1.63) (-0.18) (0.52) (0.85) (0.98) (0.29) (0.92)Relative price of investment in logs 0.193 -1.127 -1.322 -1.203 -1.001 -0.530 -1.219
(0.12) (-1.41) (-1.41) (-1.57) (-1.43) (-0.78) (-1.37)Real interest rate 0.211 0.036 -0.059* -0.001 -0.008 0.028 0.008
(2.14) (0.19) (-1.66) (-0.01) (-0.25) (0.59) (0.24)Real GDP growth 0.542* 0.692**
(1.67) (2.00)Regulatory quality -3.566
(-1.37)Real GDP growth × regulatory quality 0.425**
(2.39)Cost of resolving insolvency (% of estate) 0.026
(0.27)Real GDP growth × cost of resolving insolvency -0.030***
(-3.35)High-paved-roads country 4.840
(1.09)Real GDP growth × low-paved-roads country1 0.215
(1.29)Real GDP growth × high-paved-roads country1 0.281*
(1.93)High-access-to-electricity country -2.936
(-0.64)Real GDP growth × low-access-to-electricity country1 0.107
(0.46)Real GDP growth × high-access-to-electricity country1 0.332**
(1.99)Trade openness 0.017
(1.01)Real GDP growth × low-trade-openness country1 0.262
(1.09)Real GDP growth × high-trade-openness country1 0.257*
(1.78)Capital account openness 0.111
(0.21)Real GDP growth × low-capital-account-openness country1 0.331*
(1.77)Real GDP growth × high-capital-account-openness country1 0.217
(1.47)Financial Development Index -10.365
(-0.98)Real GDP growth × low-financial-development country1 -0.119
(-0.74)Real GDP growth × high-financial-development country1 0.465***
(3.28)Real GDP growth, squared -0.011** -0.001 -0.002** -0.003* 0.000
(-2.18) (-0.70) (-2.09) (-1.95) (0.32)Year fixed effects Yes Yes Yes Yes Yes Yes YesObservations 1,623 778 2,113 2,194 2,194 2,143 2,185Number of countries 100 89 98 101 101 99 100Number of instruments 45 32 59 58 60 58 60AR(2) test p -value 0.979 0.863 0.407 0.743 0.944 0.939 0.591Hansen test p -value 0.425 0.402 0.364 0.210 0.696 0.216 0.392
Annex Table 3.2.2. Determinants of Private Investment Ratios in Emerging Market and Developing Economies: Interaction Effects with GDP Growth and GDP Growth Effects by Country Groups
Source: IMF staff calculations.Notes: Estimates using the Arellano and Bond system-generalized method of moments estimator. Constant term included but not reported. Real GDP per capita in purchasing power parity terms. Robust z-statistics in parentheses. *p < .10; **p < .05; ***p < .01. 1 Lower and higher than the median country, respectively, following Sérven (2003).

REGIONAL ECONOMIC OUTLOOK: SUB-SAHARAN AFRICA
86
Variable Source
Private fixed gross capital formation (percent of GDP) IMF, World Economic Outlook database; United Nations National Accounts
Public gross fixed capital formation (percent of GDP) IMF, World Economic Outlook database; United Nations National Accounts
Real GDP growth IMF, World Economic Outlook database; United Nations National Accounts
Real GDP per capita, in purchasing power parity IMF, World Economic Outlook database; United Nations National Accounts
Relative price of investment (capital formation price index to GDP deflator) Penn World Tables 9.0
Real interest rate World Bank, World Development Indicators
Regulatory quality World Bank, Doing Business Indicator database
Cost of resolving insolvency (percentage of business real estate) World Bank, Worldwide Governance Indicators database
Roads paved, percent of total roads World Bank, World Development Indicators
Access to electricity, percent of population World Bank, World Development Indicators
Trade openness ((imports + exports), percent of GDP) IMF, World Economic Outlook database
De jure financial openness (Chinn–Ito Index) Chinn and Ito (2006), updated July 2017
Financial Development Index Svirydzenka (2016)
Annex Table 3.2.3. Definitions of Variables and Sources

3. PRIVATE INVESTMENT TO REJUVENATE GROWTH
87
REFERENCES Arellano, M., and O. Bover. 1995. “Another Look at the
Instrumental Variable Estimation of Error-Components Models.” Journal of Econometrics 68: 29–51.
Asiedu, E. 2002. “On the Determinants of Foreign Direct Investment to Developing Countries: Is Africa Different?” World Development, 30 (1): 107–19.
. 2006. “Foreign Direct Investment in Africa: The Role of Natural Resources, Market Size, Government Policy, Institutions and Political Stability.” World Economy 29(1): 63–77.
Bank for International Settlements (BIS). 2012. “Principles of Financial Market Infrastructures.” Basel.
Barhoumi, K., H. Va, S. Nikaein Towfighian, and R. Maino. Forthcoming . “Public Investment Efficiency in sub-Saharan African Countries: What Lies Ahead?” IMF African Department Paper, International Monetary Fund, Washington, DC.
Basel Committee on Banking Supervision (BCBS). 2017. “Sound Practices: Implications of Fintech Developments for Banks and Bank Supervisors.” Basel.
Beck, T., and R. Cull. 2014. “Small- and Medium-Sized Enterprise Finance in Africa.” Africa Growth Initiative Working Paper 16, Brookings Institution, Washington, DC.
Beck, T., S. Munzele Maimbo, I. Faye, and T. Triki. 2011. “Financing Africa: Through the Crisis and Beyond.” World Bank, Washington, DC
Bernanke, B., C. Lown, and B. Friedman. 1991. “The Credit Crunch.” Brookings Papers on Economic Activity 2: 205–47.
Blundell, R., and S. Bond. 1998. “Initial Conditions and Moment Restrictions in Dynamic Panel Data Models.” Journal of Econometrics 87: 115–43.
Cavallo, E., and C. Daude. 2011. “Public Investment in Developing Countries: A Blessing or a Curse?” Journal of Comparative Economics 39(1), 65–81.
Chinn, M. D., and H. Ito. 2006. “What Matters for Financial Development? Capital Controls, Institutions, and Interactions.” Journal of Development Economics 81(1): 163–92.
Čihák, M., A. Demirgüç-Kunt, E. Feyen, and R. Levine. 2012. “Benchmarking Financial Systems around the World,” Policy Research Working Paper 6175, World Bank, Washington, DC.
Dupasquier, C., and P. Osakwe. 2006. “Foreign Direct Investment in Africa: Performance, Challenges, and Responsibilities,” Journal of Asian Economics 17(2): 241–60.
Erden, L., and R. G. Holcombe. 2005. “The Effects of Public Investment on Private Investment in Developing Economies.” Public Finance Review 33(5): 575–602.
Farole, T., and L. Moberg. 2017. “Special Economic Zones in Africa, Political Economy Challenges and Solutions.” In The Practice of Industrial Policy: Government-Business Coordination in Africa and East Asia, edited by J. Page and F. Tarp. Oxford: Oxford University Press.
Freixas, X., L. Laeven, and J-L. Peydró. 2015. “Systemic Risk, Crises, and Macroprudential Regulation.” MIT Press, Cambridge, MA.
International Finance Corporation (IFC). 2017. “Creating Markets in Ghana. County Private Sector Diagnostic.” World Bank, Washington, DC.
International Monetary Fund (IMF). 2005. “Global Imbalances: A Saving and Investment Perspective.” Chapter 2, World Economic Outlook. Washington, DC, October.
. 2011. Regional Economic Outlook: Sub-Saharan Africa. Washington, DC, October.
. 2014a. “Is it Time for an Infrastructure Push? The Macroeconomic Effects of Public Investment.” Chapter 3, World Economic Outlook. Washington, DC, October.
. 2014b. Regional Economic Outlook: Sub-Saharan Africa. Washington, DC, October.
. 2015a. “Making Public Investment More Efficient.” Staff Report, Washington, DC.
. 2015b. “Options for Low Income Countries’ Effective and Efficient Use of Tax Incentives for Investments, A Report to the G20 Development Working Group by the IMF, OECD, UN and World Bank.” Washington, DC.
.2015c. “Private Investment: What’s the Holdup?” Chapter 4, World Economic Outlook. Washington, DC, April.
.2016. Regional Economic Outlook: Sub-Saharan Africa. Washington, DC, April.
. 2017. Regional Economic Outlook: Sub-Saharan Africa. Washington, DC, April.
International Monetary Fund (IMF) and World Bank (WB). 2016. “Public-Private Partnerships Fiscal Risk Assessment Mode User Guide.” Washington, DC.
International Monetary Fund (IMF), African Development Bank and World Bank Group. 2017. “The G20 Compact with Africa, A Joint AfDB, IMF and WBG Report.” Baden-Baden. www.compactwithafrica.org.
Jorgenson, D., and C. Siebert. 1968. “A Comparison of Alternative Theories of Corporate Investment Behavior.” American Economic Review 58: 681–712.

REGIONAL ECONOMIC OUTLOOK: SUB-SAHARAN AFRICA
88
Kapan, T., and C. Minoiu. 2013. “Balance Sheet Strength and Bank Lending during the Global Financial Crisis.” IMF Working Paper 13/102, International Monetary Fund, Washington, DC.
Lim, J. 2014. “Institutional and Structural Determinants of Investment Worldwide.” Journal of Macroeconomics 41: 160–77.
Maimbo, S., and C. Henriquez-Gallegos. 2014. “Interest Rate Caps around the World. Still Popular, but a Blunt Instrument.” Policy Research Working Paper 7070, World Bank, Washington, DC.
Maino, R., A. Massara, H. Perez-Saiz, P. Sharma, and A. Sy, Forthcoming. “FinTech in SSA: A Game Changer.” African Department Paper. International Monetary Fund, Washington, DC.
Mwase, N. Forthcoming. “Policy Reform and Private Investment Growth.” IMF Working Paper, International Monetary Fund, Washington, DC.
Nickell, S. 1981. “Biases in Dynamic with Fixed Effects.” Econometrica 49 (6): 1417–26.
Nose, M. 2017. “Enforcing Public-Private Partnership Contract: How do Fiscal Institutions Matter.” IMF Working Paper 17/243, Washington, DC.
Roodman, D. 2009. “How to do xtabond2: An Introduction to Difference and System GMM in Stata.” Stata Journal 9(1): 86–136.
Servén, L., 2003. “Real-Exchange-Rate Uncertainty and Private Investment in LDCs.” Review of Economics and Statistics 85(1): 212–18.
Steenbergen, V., and B. Javorcik. 2017. “Analyzing the Impact of the Kigali Special Economic Zone on Firm Behavior.” Working Paper F-38419-RWA-1, London School of Economics, International Growth Center.
Svirydzenka, K. 2016. “Introducing a New Broad-based Index of Financial Development.” IMF Working Paper 16/5, International Monetary Fund, Washington, DC.
Sy, A. 2015. “Trends and Developments in African Frontier Bond Markets.” Brookings Policy Paper 2015-01, Brookings Institution, Washington, DC.
United Nations Development Program (UNDP). 2015. “If Africa Builds Nests, Will the Birds Come? Comparative Study on Special Economic Zones in Africa and China.” UNDP-IPRRC Working Paper, New York.
World Bank. 2016. “Benchmarking Public-Private Partnerships Procurement 2017.” World Bank, Washington, DC.
. 2017. “Weak Investment in Uncertain Times: Causes, Implications, and Policy Response.” Chapter 3, Global Economic Prospects, Washington, DC, January.
Zeng, D. 2015. “Global Experiences with Special Economic Zones. Focus on China and Africa.” World Bank Policy Research Working Paper 7240. World Bank, Washington, DC.

89
Unless noted otherwise, data and projections pre- sented in this Regional Economic Outlook are IMF staff estimates as of March 30, 2018, consistent with the projections underlying the April 2018 World Economic Outlook (WEO).
The data and projections cover 45 sub-Saharan African countries followed by the IMF’s African Department. Data definitions follow established international statistical methodologies to the extent possible. However, in some cases, data limitations limit comparability across countries.
Country GroupingsCountries are aggregated into three (non-overlapping) groups: oil exporters, other resource-intensive countries, and non-resource-intensive countries (see table on page 90 for the country groupings).
• The oil exporters are countries where net oilexports make up 30 percent or more of totalexports.
• The other resource-intensive countries are thosewhere nonrenewable natural resources represent25 percent or more of total exports.
• The non-resource-intensive countries refer to those that are not classified as either oil exporters or other resource-intensive countries.
Countries are also aggregated into four (overlapping) groups: oil exporters countries, middle-income countries, low-income countries, and countries in fragile situations (see page 90 for the country groupings table).
Classification into these groups reflects the most recent data on per capita gross national income (averaged over three years) and the World Bank, Country Policy and Institutional Assessment (CPIA) score, (averaged over three years).
• The middle-income countries had per capitagross national income in the years 2014–16 ofmore than US$1,005.00 (World Bank, usingthe Atlas method).
• The low-income countries had average percapita gross national income in the years
2014–16 equal to or lower than US$1,005.00 (World Bank, Atlas method).
• The countries in fragile situations had averageCPIA scores of 3.2 or less in the years 2014–16and/or had the presence of a peace-keeping orpeace-building mission within the last threeyears.
• The membership of sub-Saharan Africancountries in the major regional cooperationbodies is shown on page 90: CFA franc zone,comprising the West African Economic andMonetary Union (WAEMU) and CEMAC;the Common Market for Eastern and SouthernAfrica (COMESA); the East Africa Community(EAC-5); the Economic Community of WestAfrican States (ECOWAS); the SouthernAfrican Development Community (SADC);and the Southern Africa Customs Union(SACU). EAC-5 aggregates include data forRwanda and Burundi, which joined the grouponly in 2007.
Methods of AggregationIn Tables SA1–SA3, SA6–SA7, SA13, SA15–SA16, and SA22–SA23, country group composites are calculated as the arithmetic average of data for individual countries, weighted by GDP valued at purchasing power parity as a share of total group GDP. The source of purchasing power parity weights is the World Economic Outlook database.
In Tables SA8–SA12, SA17–SA21, and SA24–SA26, country group composites are calculated as the arithmetic average of data for individual countries, weighted by GDP in US dollars at market exchange rates as a share of total group GDP.
In Tables SA4–SA5 and SA14, country group composites are calculated as the geometric average of data for individual countries, weighted by GDP valued at purchasing power parity as a share of total group GDP. The source of purchasing power parity weights is the World Economic Outlook database.
In Tables SA27–SA28, country group composites are calculated as the unweighted arithmetic average of data for individual countries.
Statistical Appendix

REGIONAL ECONOMIC OUTLOOK: SUB-SAHARAN AFRICA
90
The West African Economic and Monetary Union (WAEMU)
Economic and Monetary Community of Central African States (CEMAC)
Common Market for Eastern and Southern Africa (COMESA)
East Africa Community (EAC-5)
Southern African Development Community (SADC)
Southern Africa Customs Union (SACU)
Economic Community of West African States (ECOWAS)
BeninBurkina FasoCôte d’IvoireGuinea-BissauMaliNigerSenegalTogo
Cameroon Central African Rep.ChadCongo, Republic ofEquatorial GuineaGabon
BurundiComorosCongo, Dem. Rep. ofEritreaEthiopia KenyaMadagascar Malawi Mauritius Rwanda Seychelles Swaziland Uganda Zambia Zimbabwe
BurundiKenya RwandaTanzania Uganda
AngolaBotswanaCongo, Dem. Rep. ofLesothoMadagascarMalawiMauritiusMozambiqueNamibiaSeychellesSouth AfricaSwazilandTanzaniaZambiaZimbabwe
BotswanaLesothoNamibiaSouth AfricaSwaziland
BeninBurkina FasoCabo VerdeCôte d’IvoireGambia, The GhanaGuineaGuinea-BissauLiberiaMaliNigerNigeriaSenegalSierra LeoneTogo
Sub-Saharan Africa: Member Countries of Regional Groupings
Sub-Saharan Africa: Member Countries of GroupingsOil exporters Other resource-
intensive countriesNon-resource-intensive countries
Middle-income countries
Low-income countries Countries in fragile situations
AngolaCameroonChadCongo, Republic of Equatorial Guinea GabonNigeriaSouth Sudan
BotswanaBurkina FasoCentral African Rep.Congo, Dem. Rep. ofGhanaGuineaLiberiaMaliNamibiaNigerSierra LeoneSouth AfricaTanzaniaZambiaZimbabwe
BeninBurundiCabo VerdeComorosCôte d’IvoireEritreaEthiopiaGambia, TheGuinea-BissauKenyaLesothoMadagascarMalawiMauritiusMozambiqueRwandaSão Tomé & PríncipeSenegalSeychellesSwazilandTogoUganda
AngolaBotswanaCabo VerdeCameroonCongo, Republic of Côte d’IvoireEquatorial GuineaGabonGhanaKenyaLesothoMauritiusNamibiaNigeriaSenegalSeychellesSão Tomé & PríncipeSouth AfricaSwazilandZambia
BeninBurkina FasoBurundiCentral African Rep.ChadComorosCongo, Dem.Rep. ofEritreaEthiopiaGambia, TheGuineaGuinea-BissauLiberiaMadagascar
MalawiMaliMozambiqueNigerRwandaSierra LeoneSouth SudanTanzaniaTogoUgandaZimbabwe
BurundiCentral African Rep. ChadComorosCongo, Dem. Rep. ofCongo, Republic ofCôte d’IvoireEritreaGambia, TheGuineaGuinea-BissauLiberiaMadagascarMalawiMaliSão Tomé & PríncipeSierra LeoneSouth SudanTogoZimbabwe

STATISTICAL APPENDIX
91
List of Country Abbreviations:
AGO Angola ETH Ethiopia MLI Mali SWZ SwazilandBDI Burundi GAB Gabon MOZ Mozambique SYC SeychellesBEN Benin GHA Ghana MUS Mauritius TCD ChadBFA Burkina Faso GIN Guinea MWI Malawi TGO TogoBWA Botswana GMB Gambia, The NAM Namibia THA TanzaniaCAF Central African Republic GNB Guinea-Bissau NER Niger TZA TanzaniaCIV Côte d'Ivoire GNQ Equatorial Guinea NGA Nigeria UGA UgandaCMR Cameroon IDN Indonesia PHL Philippines VNM VitenamCOD Congo, Dem. Rep. of KEN Kenya PRY Paraguay ZAF South AfricaCOG Congo, Rep. of LBR Liberia RWA Rwanda ZMB ZambiaCOM Comoros LKA Sri Lanka SEN Senegal ZWE ZimbabweCPV Cabo Verde LSO Lesotho SLE Sierra LeoneEGY Egypt MAR Morocco SSD South SudanERI Eritrea MDG Madagascar STP São Tomé & Príncipe
List of Sources and Footnotes for Appendix Tables SA1—SA28
Tables SA22–SA23 Source: IMF, Information Notice System.1 An increase indicates appreciation. Note: “...” denotes data not available.
Table SA26Sources: IMF, Common Surveillance database, and IMF, World Economic Outlook database, April 20181 As a member of the West African Economic and Monetary Union (WAEMU), see WAEMU aggregate for reserves data.2 As a member of the Central African Economic and Monetary Community (CEMAC), see CEMAC aggregate for reserves data.3 Fiscal year data.4 In constant 2009 U.S. dollars. The Zimbabwe dollar ceased circulating in early 2009. Data are based on IMF staff estimates of price and exchange rate developments in US dollars. Staff estimates of US dollar values may differ from authorities’ estimates.Note: “...” denotes data not available.
Table SA27 Source: IMF, International Financial Statistics.1 Includes offshore banking assets. Note: “...” denotes data not available.
Table SA28 Source: IMF, International Financial Statistics.1 Loan-to-deposit ratio includes deposits and loans of commercial banks to the public sector.Note: “...” denotes data not available.
Tables SA1–SA3, SA6–SA19, SA21, SA24–SA26 Sources: IMF, Common Surveillance database, and IMF, World Economic Outlook database, April 2018.1 Fiscal year data.2 The GDP data are staff estimates and are based on the preliminary results of the 2016 Household Income and Expenditure Survey, and on the ongoing STA technical assistance for National Accounts.3 In constant 2009 C dollars. The Zimbabwe dollar ceased circulating in early 2009. Data are based on IMF staff estimates of price and exchange rate developments in US dollars. Staff estimates of US dollar values may differ from authorities’ estimates.Note: “...” denotes data not available.
Tables SA4–SA5 Sources: IMF, World Economic Outlook database, April 2018.1 In constant 2009 US dollars. The Zimbabwe dollar ceased circulating in early 2009. Data are based on IMF staff estimates of price and exchange rate developments in US dollars. Staff estimates of US dollar values may differ from authorities’ estimates.Note: “...” denotes data not available.
Table SA20 Source: IMF, World Economic Outlook database, April 2018.1 Including grants.2 Fiscal year data.3 In constant 2009 U.S. dollars. The Zimbabwe dollar ceased circulating in early 2009. Data are based on IMF staff estimates of price and exchange rate developments in US dollars. Staff estimates of US dollar values may differ from authorities’ estimates.Note: “...” denotes data not available.

REGIONAL ECONOMIC OUTLOOK: SUB-SAHARAN AFRICA
92
SA1. Real GDP Growth ..................................................................................................................... 93SA2. Real Non-Oil GDP Growth ....................................................................................................... 94SA3. Real Per Capita GDP Growth .................................................................................................... 95SA4. Consumer Prices, Average .......................................................................................................... 96SA5. Consumer Prices, End of Period ................................................................................................ 97SA6. Total Investment ........................................................................................................................ 98SA7. Gross National Savings .............................................................................................................. 99SA8. Overall Fiscal Balance, Including Grants ................................................................................... 100SA9. Overall Fiscal Balance, Excluding Grants .................................................................................. 101SA10. Government Revenue, Excluding Grants .................................................................................. 102SA11. Government Expenditure .......................................................................................................... 103SA12. Government Debt ..................................................................................................................... 104SA13. Broad Money ............................................................................................................................ 105SA14. Broad Money Growth ............................................................................................................... 106SA15. Claims on Nonfinancial Private Sector Growth (Percent change) .............................................. 107SA16. Claims on Nonfinancial Private Sector (Percent of GDP) ......................................................... 108SA17. Exports of Goods and Services .................................................................................................. 109SA18. Imports of Goods and Services .................................................................................................. 110SA19. Trade Balance on Goods ........................................................................................................... 111SA20. External Current Account ......................................................................................................... 112SA21. Net Foreign Direct Investment ................................................................................................. 113SA22. Real Effective Exchange Rates ................................................................................................... 114SA23. Nominal Effective Exchange Rates ............................................................................................ 115SA24. External Debt, Official Debt, Debtor Based .............................................................................. 116SA25. Terms of Trade on Goods ......................................................................................................... 117SA26. Reserves .................................................................................................................................... 118SA27. Banking Penetration .................................................................................................................. 119SA28. Banking Sector: Loan-to-Deposit Ratio ..................................................................................... 120
List of Tables:

STATISTICAL APPENDIX
93
2004-08 2009 2010 2011 2012 2013 2014 2015 2016 2017 2018 2019Angola 17.4 2.4 3.5 3.9 5.2 6.8 4.7 3.0 –0.8 0.7 2.2 2.4Benin 4.2 2.3 2.1 3.0 4.8 7.2 6.4 2.1 4.0 5.6 6.0 6.3Botswana 6.0 –7.7 8.6 6.0 4.5 11.3 4.1 –1.7 4.3 2.2 4.6 4.5Burkina Faso 5.9 3.0 8.4 6.6 6.5 5.8 4.3 3.9 5.9 6.4 6.0 6.0Burundi 4.4 3.8 5.1 4.0 4.4 5.9 4.5 –4.0 –1.0 0.0 0.1 0.4Cabo Verde 7.1 –1.3 1.5 4.0 1.1 0.8 0.6 1.0 3.8 4.0 4.3 4.0Cameroon 4.1 2.2 3.4 4.1 4.5 5.4 5.9 5.7 4.5 3.2 4.0 4.5Central African Rep. 3.3 1.7 3.0 3.3 4.1 –36.7 1.0 4.8 4.5 4.0 4.0 4.0Chad 9.8 4.1 13.6 0.1 8.8 5.8 6.9 1.8 –6.4 –3.1 3.5 2.8Comoros 1.3 1.8 2.1 2.2 3.0 3.5 2.0 1.0 2.2 2.5 3.0 3.0Congo, Dem. Rep. of 6.1 2.9 7.1 6.9 7.1 8.5 9.5 6.9 2.4 3.4 3.8 4.0Congo, Rep. of 4.3 7.8 8.7 3.4 3.8 3.3 6.8 2.6 –2.8 –4.6 0.7 4.6Côte d'Ivoire 1.8 3.3 2.0 –4.2 10.1 9.3 8.8 8.8 8.3 7.8 7.4 7.1Equatorial Guinea 15.5 1.3 –8.9 6.5 8.3 –4.1 –0.7 –9.1 –9.7 –4.4 –8.5 -2.8Eritrea –2.1 3.9 2.2 8.7 7.0 4.6 2.9 2.6 1.9 5.0 4.2 3.8Ethiopia1 11.8 10.0 10.6 11.4 8.7 9.9 10.3 10.4 8.0 10.9 8.5 8.3Gabon 1.3 –2.3 6.3 7.1 5.3 5.5 4.4 3.9 2.1 0.8 2.7 3.7Gambia, The 3.3 6.4 6.5 –4.3 5.6 4.8 0.9 4.3 2.2 3.5 5.4 5.2Ghana 6.2 4.8 7.9 14.0 9.3 7.3 4.0 3.8 3.7 8.4 6.3 7.6Guinea 3.7 –1.5 4.2 5.6 5.9 3.9 3.7 3.5 6.6 6.7 5.8 5.9Guinea-Bissau 5.1 3.4 4.6 8.1 –1.7 3.3 1.0 6.1 5.8 5.5 5.5 5.5Kenya 4.6 3.3 8.4 6.1 4.6 5.9 5.4 5.7 5.8 4.8 5.5 6.0Lesotho 4.1 3.1 6.3 6.7 4.9 2.2 3.0 2.5 3.1 3.1 1.7 2.6Liberia2 7.5 5.2 6.4 7.7 8.4 8.8 0.7 0.0 –1.6 2.5 3.2 4.7Madagascar 5.8 –4.7 0.3 1.5 3.0 2.3 3.3 3.1 4.2 4.1 5.1 5.6Malawi 6.1 8.3 6.9 4.9 1.9 5.2 5.7 2.9 2.3 4.0 3.5 4.5Mali 4.2 4.7 5.4 3.2 –0.8 2.3 7.0 6.0 5.8 5.3 5.0 4.7Mauritius 4.3 3.0 4.1 3.9 3.2 3.2 3.6 3.5 3.9 3.9 3.9 4.0Mozambique 8.1 6.4 6.7 7.1 7.2 7.1 7.4 6.6 3.8 2.9 3.0 2.5Namibia 4.3 0.3 6.0 5.1 5.1 5.6 6.4 6.0 1.1 –1.2 1.2 3.3Niger 5.2 –0.7 8.4 2.2 11.8 5.3 7.5 4.0 5.0 5.2 5.1 5.4Nigeria 7.7 8.4 11.3 4.9 4.3 5.4 6.3 2.7 –1.6 0.8 2.1 1.9Rwanda 9.0 6.3 7.3 7.8 8.8 4.7 7.6 8.9 6.0 6.1 7.2 7.8São Tomé & Príncipe 5.7 4.0 4.5 4.8 4.5 4.3 4.1 4.0 4.1 4.0 5.0 5.5Senegal 4.5 2.4 4.3 1.9 4.5 3.6 4.1 6.5 6.7 7.2 7.0 7.0Seychelles 4.8 –1.1 5.9 5.4 3.7 6.0 4.5 5.0 4.5 4.2 3.3 3.3Sierra Leone 5.8 3.2 5.3 6.3 15.2 20.7 4.6 –20.5 6.3 3.5 3.5 5.6South Africa 4.8 –1.5 3.0 3.3 2.2 2.5 1.8 1.3 0.6 1.3 1.5 1.7South Sudan ... ... ... ... –52.4 29.3 2.9 –0.2 –13.8 –11.1 –3.8 -2.6Swaziland 4.2 4.5 3.5 2.0 3.5 4.8 3.6 1.1 –0.0 0.2 –0.9 0.2Tanzania 6.5 5.4 6.4 7.9 5.1 7.3 7.0 7.0 7.0 6.0 6.4 6.6Togo –0.0 5.5 6.1 6.4 6.5 6.1 5.9 5.7 5.1 4.4 4.9 5.2Uganda 8.3 8.1 7.7 6.8 2.2 4.7 4.6 5.7 2.3 4.5 5.2 5.8Zambia 7.7 9.2 10.3 5.6 7.6 5.0 4.7 2.9 3.7 3.6 4.0 4.5Zimbabwe3 –7.4 7.4 15.4 16.3 13.6 5.3 2.8 1.4 0.7 3.0 2.4 4.2
Sub-Saharan Africa 6.6 3.9 7.0 5.1 4.4 5.3 5.1 3.4 1.4 2.8 3.4 3.7Median 4.9 3.3 6.1 5.2 4.9 5.3 4.5 3.5 3.8 3.9 4.0 4.5
Excluding Nigeria and South Africa 6.9 3.9 6.1 6.1 5.4 6.6 5.7 4.7 3.6 4.6 4.8 5.4
Oil-exporting countries 8.7 6.7 9.2 4.7 3.9 5.7 5.8 2.6 –1.5 0.5 2.0 2.1 Excluding Nigeria 11.1 2.4 3.5 4.2 2.8 6.4 4.6 2.3 –1.3 –0.3 1.7 2.6Oil-importing countries 5.3 2.0 5.4 5.4 4.8 5.1 4.6 4.0 3.5 4.4 4.3 4.7
Excluding South Africa 5.6 4.4 7.0 6.7 6.3 6.6 6.1 5.5 5.1 5.9 5.7 6.1
Middle-income countries 6.7 3.6 6.9 4.5 4.3 4.7 4.6 2.7 0.5 1.9 2.7 2.9Excluding Nigeria and South Africa 7.4 2.8 5.1 5.3 6.1 5.9 4.9 3.9 3.0 3.6 4.1 4.9
Low-income countries 6.3 5.1 7.4 7.1 4.7 7.3 6.7 5.6 4.3 5.5 5.6 5.9Excluding low-income countries in fragile situations 8.1 6.7 7.8 8.1 6.3 7.3 7.5 7.4 6.1 7.2 6.7 6.8
Countries in fragile situations 3.5 3.3 6.0 3.7 3.8 7.4 6.1 3.9 2.5 3.3 4.3 4.8
CFA franc zone 5.0 2.7 4.0 2.9 6.1 4.5 5.7 4.2 3.4 3.6 4.4 5.0CEMAC 6.6 2.3 3.6 4.4 5.9 2.8 4.7 2.0 –0.5 –0.1 1.7 3.3WAEMU 3.5 3.0 4.5 1.3 6.3 6.1 6.7 6.2 6.6 6.6 6.4 6.3
COMESA (SSA members) 6.2 5.7 8.1 7.4 6.1 6.3 6.4 6.0 4.7 5.9 5.6 6.0EAC-5 6.2 5.2 7.4 6.9 4.5 6.1 5.9 6.1 5.4 5.2 5.8 6.2ECOWAS 6.8 7.0 9.7 5.0 5.1 5.8 6.1 3.2 0.4 2.6 3.3 3.4SACU 4.8 –1.6 3.4 3.5 2.4 3.0 2.1 1.3 0.8 1.3 1.6 1.9SADC 6.2 0.5 4.3 4.4 3.8 4.4 3.6 2.7 1.7 2.2 2.6 3.0
Table SA1. Real GDP Growth (Percent)
See sources and footnotes on page 91.

REGIONAL ECONOMIC OUTLOOK: SUB-SAHARAN AFRICA
94
See sources and footnotes on page 91.
2004-08 2009 2010 2011 2012 2013 2014 2015 2016 2017 2018 2019Angola 17.9 8.1 7.6 9.5 5.6 10.8 8.0 1.6 –0.4 1.2 2.0 3.5Benin 4.2 2.3 2.1 3.0 4.8 7.2 6.4 2.1 4.0 5.6 6.0 6.3Botswana 6.0 –7.7 8.6 6.0 4.5 11.3 4.1 –1.7 4.3 2.2 4.6 4.5Burkina Faso 5.9 3.0 8.4 6.6 6.5 5.8 4.3 3.9 5.9 6.4 6.0 6.0Burundi 4.4 3.8 5.1 4.0 4.4 5.9 4.5 –4.0 –1.0 0.0 0.1 0.4Cabo Verde 7.1 –1.3 1.5 4.0 1.1 0.8 0.6 1.0 3.8 4.0 4.3 4.0Cameroon 4.2 3.1 4.4 4.9 4.6 5.2 5.4 4.4 5.1 4.4 4.2 4.9Central African Rep. 3.3 1.7 3.0 3.3 4.1 –36.7 1.0 4.8 4.5 4.0 4.0 4.0Chad 6.3 6.3 17.3 0.2 11.5 8.1 7.1 –2.9 –6.0 –0.5 1.4 2.5Comoros 1.3 1.8 2.1 2.2 3.0 3.5 2.0 1.0 2.2 2.5 3.0 3.0Congo, Dem. Rep. of 5.9 2.8 7.2 7.0 7.2 8.6 9.5 7.1 2.4 3.7 3.6 3.9Congo, Rep. of 5.7 3.9 6.4 7.5 9.7 8.2 7.9 5.3 –3.2 –9.2 –6.3 1.6Côte d'Ivoire 1.8 2.1 2.6 –4.8 12.5 9.0 9.4 8.4 7.9 8.3 7.4 7.1Equatorial Guinea 29.0 18.2 –10.2 15.9 6.8 1.5 –2.3 –10.1 –5.9 –2.5 –5.3 -0.4Eritrea –2.1 3.9 2.2 8.7 7.0 4.6 2.9 2.6 1.9 5.0 4.2 3.8Ethiopia1 11.8 10.0 10.6 11.4 8.7 9.9 10.3 10.4 8.0 10.9 8.5 8.3Gabon 5.0 –3.3 13.1 10.5 7.1 7.7 5.1 3.8 3.3 1.7 3.0 4.5Gambia, The 3.3 6.4 6.5 –4.3 5.6 4.8 0.9 4.3 2.2 3.5 5.4 5.2Ghana 6.2 4.8 7.6 8.6 8.6 6.7 4.0 4.0 5.0 4.0 5.0 6.0Guinea 3.7 –1.5 4.2 5.6 5.9 3.9 3.7 3.5 6.6 6.7 5.8 5.9Guinea-Bissau 5.1 3.4 4.6 8.1 –1.7 3.3 1.0 6.1 5.8 5.5 5.5 5.5Kenya 4.6 3.3 8.4 6.1 4.6 5.9 5.4 5.7 5.8 4.8 5.5 6.0Lesotho 4.1 3.1 6.3 6.7 4.9 2.2 3.0 2.5 3.1 3.1 1.7 2.6Liberia2 7.5 5.2 6.4 7.7 8.4 8.8 0.7 0.0 –1.6 2.5 3.2 4.7Madagascar 5.8 –4.7 0.3 1.5 3.0 2.3 3.3 3.1 4.2 4.1 5.1 5.6Malawi 6.1 8.3 6.9 4.9 1.9 5.2 5.7 2.9 2.3 4.0 3.5 4.5Mali 4.2 4.7 5.4 3.2 –0.8 2.3 7.0 6.0 5.8 5.3 5.0 4.7Mauritius 4.3 3.0 4.1 3.9 3.2 3.2 3.6 3.5 3.9 3.9 3.9 4.0Mozambique 8.1 6.4 6.7 7.1 7.2 7.1 7.4 6.6 3.8 2.9 3.0 2.5Namibia 4.3 0.3 6.0 5.1 5.1 5.6 6.4 6.0 1.1 –1.2 1.2 3.3Niger 5.2 –0.7 8.4 1.3 4.2 3.2 8.9 5.3 4.6 4.9 5.2 5.5Nigeria 10.8 10.0 12.4 5.3 5.9 8.3 7.3 3.6 –0.3 0.5 1.3 1.5Rwanda 9.0 6.3 7.3 7.8 8.8 4.7 7.6 8.9 6.0 6.1 7.2 7.8São Tomé & Príncipe 5.7 4.0 4.5 4.8 4.5 4.3 4.1 4.0 4.1 4.0 5.0 5.5Senegal 4.5 2.4 4.3 1.9 4.5 3.6 4.1 6.5 6.7 7.2 7.0 7.0Seychelles 4.8 –1.1 5.9 5.4 3.7 6.0 4.5 5.0 4.5 4.2 3.3 3.3Sierra Leone 5.8 3.2 5.3 6.3 15.2 20.7 4.6 –20.5 6.3 3.5 3.5 5.6South Africa 4.8 –1.5 3.0 3.3 2.2 2.5 1.8 1.3 0.6 1.3 1.5 1.7South Sudan ... ... ... ... –0.8 4.1 –17.5 –1.2 –7.0 –18.8 –7.0 -6.6Swaziland 4.2 4.5 3.5 2.0 3.5 4.8 3.6 1.1 –0.0 0.2 –0.9 0.2Tanzania 6.5 5.4 6.4 7.9 5.1 7.3 7.0 7.0 7.0 6.0 6.4 6.6Togo –0.0 5.5 6.1 6.4 6.5 6.1 5.9 5.7 5.1 4.4 4.9 5.2Uganda 8.3 8.1 7.7 6.8 2.2 4.7 4.6 5.7 2.3 4.5 5.2 5.8Zambia 7.7 9.2 10.3 5.6 7.6 5.0 4.7 2.9 3.7 3.6 4.0 4.5Zimbabwe3 –7.4 7.4 15.4 16.3 13.6 5.3 2.8 1.4 0.7 3.0 2.4 4.2
Sub-Saharan Africa 7.7 4.9 7.7 5.5 5.2 6.3 5.4 3.5 2.0 2.6 3.1 3.5Median 5.2 3.6 6.2 5.6 5.1 5.2 4.5 3.8 3.8 4.0 4.0 4.5
Excluding Nigeria and South Africa 7.4 5.0 6.8 6.8 6.2 6.8 5.8 4.4 3.9 4.3 4.6 5.3
Oil-exporting countries 11.5 9.1 10.7 6.2 5.9 8.2 6.6 2.9 –0.3 0.3 1.3 1.9 Excluding Nigeria 5.1 7.0 6.2 8.6 6.1 7.9 4.8 1.1 –0.3 –0.0 1.1 3.0Oil-importing countries 5.2 1.9 5.4 5.1 4.7 5.0 4.6 4.0 3.6 4.1 4.2 4.6
Excluding South Africa 5.6 4.3 7.0 6.2 6.3 6.5 6.2 5.5 5.2 5.6 5.6 5.9
Middle-income countries 8.1 4.8 7.7 5.1 5.0 6.3 5.2 2.9 1.2 1.7 2.2 2.8Excluding Nigeria and South Africa 8.4 4.8 6.2 6.5 6.5 7.1 5.6 3.5 3.4 3.3 3.8 4.9
Low-income countries 6.1 5.2 7.6 7.1 6.0 6.6 6.1 5.5 4.5 5.5 5.5 5.8Excluding low-income countries in fragile situations 8.1 6.7 7.8 8.1 6.0 7.3 7.6 7.4 6.1 7.2 6.7 6.8
Countries in fragile situations 3.3 2.9 6.2 3.9 7.4 6.4 5.1 3.7 2.8 3.0 3.6 4.5
CFA franc zone 6.5 4.3 4.8 4.3 6.8 5.5 5.8 3.8 3.7 4.0 4.1 5.1CEMAC 9.7 5.9 4.9 7.6 7.1 5.1 4.5 1.1 0.5 0.5 1.0 3.4WAEMU 3.5 2.6 4.6 1.1 6.5 5.9 7.0 6.2 6.4 6.7 6.4 6.3
COMESA (SSA members) 6.1 5.7 8.1 7.4 6.1 6.4 6.4 6.1 4.7 5.9 5.6 6.0EAC-5 6.2 5.2 7.4 6.9 4.5 6.1 5.9 6.1 5.4 5.2 5.8 6.2ECOWAS 9.0 8.1 10.6 4.9 6.3 7.8 6.8 3.8 1.5 2.0 2.7 3.0SACU 4.8 –1.6 3.4 3.5 2.4 3.0 2.1 1.3 0.8 1.3 1.6 1.9SADC 6.3 1.2 4.9 5.1 3.9 4.9 4.0 2.5 1.7 2.3 2.6 3.1
Table SA2. Real Non-Oil GDP Growth(Percent)

STATISTICAL APPENDIX
95
2004-08 2009 2010 2011 2012 2013 2014 2015 2016 2017 2018 2019Angola 14.0 –0.6 0.4 0.8 2.1 3.7 1.7 –0.0 –3.7 –2.2 –0.8 -0.6Benin 1.2 –0.5 –0.7 0.1 1.9 4.3 3.5 –0.6 1.2 2.8 3.3 3.6Botswana 4.6 –8.9 7.2 4.8 3.2 10.0 2.9 –2.8 3.1 1.0 3.3 3.3Burkina Faso 2.7 –0.1 5.2 3.5 3.3 2.7 1.3 0.9 4.1 3.5 3.2 3.2Burundi 1.8 0.5 1.9 0.9 1.3 2.8 1.5 –6.8 –4.1 –3.1 –2.8 -2.5Cabo Verde 6.4 –1.5 1.1 3.3 –2.0 –0.4 –0.6 –0.2 2.6 2.7 3.0 2.7Cameroon 1.3 –0.6 0.9 1.6 2.0 2.8 3.3 3.1 1.9 0.7 1.5 1.9Central African Rep. 1.5 –0.2 1.1 1.3 2.1 –37.9 –0.9 2.8 2.5 2.0 2.0 2.0Chad 7.1 1.6 10.8 –2.3 6.2 3.2 4.3 –0.7 –8.7 –5.8 1.0 0.3Comoros –1.2 –0.8 –0.5 –0.5 0.3 0.8 –0.7 –1.6 –0.5 –0.2 0.3 0.3Congo, Dem. Rep. of 3.0 –0.1 4.0 3.8 4.0 5.3 6.3 3.8 –0.6 0.4 0.7 0.9Congo, Rep. of 1.7 5.2 6.1 0.9 1.3 0.8 4.2 0.1 –5.2 –6.9 –1.7 2.1Côte d'Ivoire –0.8 0.6 –0.6 –6.6 7.3 6.5 6.0 6.1 5.6 5.0 4.6 4.3Equatorial Guinea 12.1 –1.5 –11.5 3.6 5.3 –6.8 –3.4 –11.6 –12.1 –6.9 –10.8 -5.2Eritrea –4.7 1.3 –0.3 6.2 4.5 2.3 0.7 0.4 –0.2 3.0 2.2 1.9Ethiopia1 9.1 8.3 8.9 9.6 7.0 8.2 8.6 8.7 6.3 9.1 6.8 6.6Gabon –1.5 –5.9 2.4 3.2 1.4 1.5 2.9 2.4 0.7 –0.5 1.3 2.3Gambia, The 0.1 3.1 3.2 –7.3 2.3 1.6 –2.2 1.1 –0.8 0.3 2.2 2.0Ghana 3.6 2.2 5.2 11.2 6.6 4.6 1.4 1.2 1.1 5.7 3.6 4.9Guinea 1.4 –4.1 1.5 2.9 3.2 1.3 1.1 1.0 4.0 4.1 3.2 3.3Guinea-Bissau 2.8 1.1 3.8 5.8 –3.8 1.0 –1.2 3.8 3.5 3.2 3.2 3.2Kenya 1.8 0.5 6.1 3.4 1.5 3.1 2.4 2.8 2.9 1.9 2.6 3.2Lesotho 4.0 2.9 6.0 6.4 4.6 1.9 2.7 1.7 2.6 2.7 1.4 1.7Liberia2 5.9 0.9 2.0 5.0 5.7 6.1 –1.9 –2.5 –3.9 0.1 0.8 2.3Madagascar 2.8 –7.4 –2.5 –1.4 0.2 –0.6 0.5 0.3 1.3 1.3 2.3 2.7Malawi 3.5 5.3 3.9 1.9 –1.0 2.3 2.7 0.1 –0.6 1.1 0.6 1.6Mali 0.9 1.3 2.1 0.1 –3.7 –0.7 3.6 2.6 2.4 1.9 1.6 1.4Mauritius 3.8 2.8 3.9 3.7 2.9 3.0 3.4 3.4 3.8 3.5 3.5 3.6Mozambique 5.0 3.4 3.7 4.1 4.2 4.2 4.5 3.7 1.0 0.2 0.2 -0.2Namibia 2.9 –1.2 4.5 3.5 3.1 3.7 4.4 4.0 –0.8 –2.0 0.4 2.4Niger 1.5 –4.1 5.1 –0.9 8.5 2.1 4.3 0.8 1.9 2.0 2.0 2.2Nigeria 4.9 5.5 8.3 2.1 1.5 2.6 3.5 –0.1 –4.2 –1.9 –0.6 -0.8Rwanda 6.8 4.1 4.1 5.7 5.7 2.4 5.0 6.3 3.4 3.5 4.6 5.2São Tomé & Príncipe 3.0 1.0 1.5 1.9 1.8 1.7 1.6 1.4 1.6 1.6 2.6 3.2Senegal 1.7 –0.4 1.3 –1.1 1.4 0.5 1.1 3.4 3.7 4.1 4.0 4.0Seychelles 3.7 –1.5 3.0 8.2 2.7 4.1 2.9 3.0 3.8 3.5 2.2 2.3Sierra Leone 2.3 0.8 3.0 3.9 12.6 18.0 1.3 –22.2 4.0 1.3 1.3 3.3South Africa 3.5 –2.9 1.6 1.8 0.7 1.0 0.3 –0.3 –1.0 –0.3 –0.1 0.1South Sudan ... ... ... ... –54.1 25.2 –0.2 –3.1 –16.3 –13.6 –6.7 -5.5Swaziland 3.2 3.4 2.4 0.8 2.2 3.6 2.4 –0.1 –1.2 –1.1 –2.1 -1.1Tanzania 3.6 2.7 3.8 5.3 2.7 5.2 4.9 4.9 4.8 3.1 4.3 4.5Togo –3.4 2.7 3.3 3.6 3.7 3.3 3.2 3.1 2.5 1.8 2.3 2.6Uganda 4.7 4.5 4.2 3.4 –0.9 1.7 1.6 2.6 –0.7 1.4 2.1 2.6Zambia 4.7 6.0 7.1 2.4 4.4 1.8 1.5 –0.2 0.6 0.5 0.9 1.3Zimbabwe3 –8.1 6.4 14.4 15.2 8.4 2.4 0.2 –1.1 –1.9 0.4 –0.2 1.5
Sub-Saharan Africa 4.2 1.5 4.6 2.7 1.9 2.9 2.7 1.0 –0.9 0.4 1.0 1.3Median 2.9 0.9 3.3 3.3 2.7 2.6 2.4 1.0 1.2 1.3 2.0 2.3
Excluding Nigeria and South Africa 4.2 1.2 3.5 3.5 2.7 3.9 3.2 2.2 1.2 2.0 2.3 2.9
Oil-exporting countries 5.8 3.8 6.2 1.9 1.0 2.8 3.0 –0.2 –4.2 –2.2 –0.7 -0.6 Excluding Nigeria 8.0 –0.5 0.7 1.3 –0.1 3.4 1.9 –0.4 –3.9 –2.9 –1.0 0.0Oil-importing countries 3.2 –0.1 3.3 3.3 2.5 2.9 2.4 1.8 1.4 2.1 2.1 2.5
Excluding South Africa 2.9 1.8 4.5 4.2 3.7 4.1 3.6 3.0 2.7 3.3 3.2 3.6
Middle-income countries 4.4 1.2 4.5 2.2 1.9 2.3 2.2 0.3 –1.8 –0.4 0.3 0.6Excluding Nigeria and South Africa 4.7 0.2 2.6 2.6 3.3 3.2 2.3 1.3 0.5 1.1 1.6 2.3
Low-income countries 3.5 2.5 4.7 4.5 2.0 4.8 4.1 3.1 1.9 2.9 3.2 3.4Excluding low-income countries in fragile situations 5.1 4.0 5.2 5.6 3.8 5.0 5.2 5.1 3.8 4.7 4.4 4.5
Countries in fragile situations 0.9 0.6 3.3 1.1 0.9 4.5 3.2 1.2 –0.2 0.5 1.5 2.0
CFA franc zone 2.1 –0.2 1.2 0.0 3.2 1.6 3.0 1.6 0.8 1.0 1.8 2.4CEMAC 3.7 –0.5 0.8 1.6 3.0 –0.0 2.3 –0.3 –2.8 –2.4 –0.6 0.9WAEMU 0.6 0.1 1.6 –1.5 3.4 3.2 3.7 3.3 3.8 3.6 3.5 3.4
COMESA (SSA members) 3.5 3.2 5.7 4.9 3.3 3.8 3.9 3.6 2.3 3.4 3.1 3.5EAC-5 3.2 2.3 4.7 4.1 1.6 3.5 3.2 3.5 2.8 2.2 3.2 3.6ECOWAS 3.9 4.1 6.8 2.2 2.3 3.0 3.2 0.4 –2.2 –0.1 0.6 0.6SACU 3.5 –2.9 2.0 2.0 1.0 1.5 0.6 –0.2 –0.8 –0.3 0.1 0.3SADC 4.4 –1.3 2.4 2.5 1.8 2.4 1.6 0.6 –0.3 0.1 0.6 0.9
Table SA3. Real Per Capita GDP Growth(Percent)
See sources and footnotes on page 91.

REGIONAL ECONOMIC OUTLOOK: SUB-SAHARAN AFRICA
96
See sources and footnotes on page 91.
2004-08 2009 2010 2011 2012 2013 2014 2015 2016 2017 2018 2019Angola 20.9 13.7 14.5 13.5 10.3 8.8 7.3 10.3 32.4 31.7 27.9 17.0Benin 3.9 0.4 2.2 2.7 6.7 1.0 –1.1 0.3 –0.8 0.1 2.9 2.9Botswana 9.4 8.1 6.9 8.5 7.5 5.9 4.4 3.1 2.8 3.3 3.7 3.8Burkina Faso 3.8 0.9 –0.6 2.8 3.8 0.5 –0.3 0.9 –0.2 0.4 2.0 2.0Burundi 11.4 10.6 6.5 9.6 18.2 7.9 4.4 5.6 5.5 16.6 12.7 22.1Cabo Verde 2.9 1.0 2.1 4.5 2.5 1.5 –0.2 0.1 –1.4 0.8 1.0 1.5Cameroon 2.7 3.0 1.3 2.9 2.4 2.1 1.9 2.7 0.9 0.6 1.1 1.3Central African Rep. 3.5 3.5 1.5 1.2 5.9 6.6 11.6 4.5 4.6 3.8 3.5 3.2Chad 1.5 10.1 –2.1 1.9 7.7 0.2 1.7 6.8 –1.1 –0.9 2.1 2.6Comoros 4.0 4.8 3.9 2.2 5.9 1.6 1.3 2.0 1.8 1.0 2.0 2.0Congo, Dem. Rep. of 14.6 46.1 23.5 14.9 0.9 0.9 1.2 1.0 18.2 41.5 25.8 13.7Congo, Rep. of 3.7 4.3 0.4 1.8 5.0 4.6 0.9 3.2 3.2 0.5 1.5 1.6Côte d'Ivoire 3.2 1.0 1.4 4.9 1.3 2.6 0.4 1.2 0.7 0.8 1.7 2.0Equatorial Guinea 4.4 5.7 5.3 4.8 3.4 3.2 4.3 1.7 1.4 0.7 0.6 2.8Eritrea 16.4 33.0 11.2 3.9 6.0 6.5 10.0 9.0 9.0 9.0 9.0 9.0Ethiopia 18.0 8.5 8.1 33.2 24.1 8.1 7.4 10.1 7.3 9.9 11.2 8.6Gabon 0.9 1.9 1.4 1.3 2.7 0.5 4.5 –0.1 2.1 3.0 2.8 2.5Gambia, The 6.2 4.6 5.0 4.8 4.6 5.2 6.3 6.8 7.2 8.0 5.8 5.0Ghana 13.3 13.1 6.7 7.7 7.1 11.7 15.5 17.2 17.5 12.4 8.7 8.0Guinea 25.0 4.7 15.5 21.4 15.2 11.9 9.7 8.2 8.2 8.9 8.2 8.0Guinea-Bissau 4.2 –1.6 1.1 5.1 2.1 0.8 –1.0 1.5 1.5 1.1 2.0 2.2Kenya 8.3 10.6 4.3 14.0 9.4 5.7 6.9 6.6 6.3 8.0 4.8 5.0Lesotho 6.9 5.8 3.3 6.0 5.5 5.0 4.6 4.3 6.2 5.6 5.5 5.5Liberia 9.8 7.4 7.3 8.5 6.8 7.6 9.9 7.7 8.8 12.4 11.7 10.5Madagascar 12.5 9.0 9.2 9.5 5.7 5.8 6.1 7.4 6.7 8.1 7.8 6.8Malawi 11.5 8.4 7.4 7.6 21.3 28.3 23.8 21.9 21.7 11.5 10.4 7.6Mali 3.1 2.2 1.3 3.1 5.3 –0.6 0.9 1.4 –1.8 1.8 1.4 1.7Mauritius 7.4 2.5 2.9 6.5 3.9 3.5 3.2 1.3 1.0 3.7 5.1 4.5Mozambique 10.2 3.3 12.7 10.4 2.1 4.2 2.3 2.4 19.2 15.3 6.7 5.7Namibia 5.4 9.5 4.9 5.0 6.7 5.6 5.3 3.4 6.7 6.1 5.8 5.8Niger 4.0 4.3 –2.8 2.9 0.5 2.3 –0.9 1.0 0.2 2.4 3.9 2.0Nigeria 11.6 12.5 13.7 10.8 12.2 8.5 8.0 9.0 15.7 16.5 14.0 14.8Rwanda 10.9 10.3 2.3 5.7 6.3 4.2 1.8 2.5 5.7 4.8 2.8 5.0São Tomé & Príncipe 20.8 17.0 13.3 14.3 10.6 8.1 7.0 5.3 4.6 5.5 5.4 4.7Senegal 3.3 –2.2 1.2 3.4 1.4 0.7 –1.1 0.1 0.9 1.4 1.5 1.5Seychelles 9.0 31.8 –2.4 2.6 7.1 4.3 1.4 4.0 –1.0 2.9 3.8 3.0Sierra Leone 12.5 9.2 17.8 18.5 13.8 9.8 8.3 9.0 11.5 18.0 13.9 11.2South Africa 5.5 7.1 4.3 5.0 5.6 5.8 6.1 4.6 6.3 5.3 5.3 5.3South Sudan ... ... ... ... 45.1 –0.0 1.7 52.8 379.8 187.9 104.1 108.2Swaziland 6.2 7.4 4.5 6.1 8.9 5.6 5.7 5.0 8.0 6.3 5.4 5.4Tanzania 6.6 12.1 7.2 12.7 16.0 7.9 6.1 5.6 5.2 5.3 4.8 5.0Togo 3.8 3.7 1.4 3.6 2.6 1.8 0.2 1.8 0.9 –0.7 0.4 1.2Uganda 7.5 13.0 3.7 15.0 12.7 4.9 3.1 5.4 5.5 5.6 3.6 4.3Zambia 13.7 13.4 8.5 8.7 6.6 7.0 7.8 10.1 17.9 6.6 8.2 8.0Zimbabwe1 39.9 6.2 3.0 3.5 3.7 1.6 –0.2 –2.4 –1.6 1.3 5.2 6.3
Sub-Saharan Africa 8.8 9.8 8.1 9.4 9.2 6.6 6.3 7.0 11.3 11.0 9.5 8.9Median 7.2 7.3 4.3 5.4 6.0 4.9 4.4 4.3 5.5 5.3 5.1 5.0
Excluding Nigeria and South Africa 9.2 9.4 6.5 10.6 9.1 5.7 5.3 6.7 10.7 10.3 8.7 7.1
Oil-exporting countries 10.9 11.4 12.0 9.9 11.1 7.5 7.1 8.8 17.7 17.2 14.6 13.9 Excluding Nigeria 9.0 8.6 7.3 7.5 8.3 4.8 4.6 8.4 23.2 19.1 16.1 11.6Oil-importing countries 7.7 8.6 5.4 9.0 7.9 5.9 5.7 5.6 6.9 7.1 6.3 5.7
Excluding South Africa 9.3 9.7 6.2 11.6 9.3 6.0 5.5 6.1 7.2 8.0 6.8 5.9
Middle-income countries 8.6 9.5 8.5 8.3 8.4 6.9 6.8 7.1 11.6 11.1 9.7 9.3Excluding Nigeria and South Africa 8.8 8.3 6.1 8.3 6.4 5.9 6.0 6.7 11.1 9.8 8.4 6.6
Low-income countries 9.8 10.8 6.9 13.4 12.2 5.4 4.5 6.6 10.3 10.9 8.9 7.6Excluding low-income countries in fragile situations 9.4 8.9 5.8 16.6 14.4 6.0 4.6 5.9 6.0 6.8 6.5 5.8
Countries in fragile situations 8.3 10.4 6.7 7.4 7.4 4.2 3.4 6.2 13.3 13.3 10.1 8.4
CFA franc zone 3.0 2.7 1.1 3.2 3.3 1.7 1.2 1.8 0.6 0.9 1.7 1.9CEMAC 2.7 4.5 1.5 2.7 3.8 2.2 2.7 2.7 1.3 0.9 1.6 1.9WAEMU 3.4 0.9 0.8 3.6 2.8 1.3 –0.1 1.0 0.1 1.0 1.9 1.9
COMESA (SSA members) 11.5 13.0 7.3 15.4 11.3 6.1 5.8 6.7 8.4 10.3 8.8 7.3EAC-5 7.8 11.6 5.1 13.2 12.3 6.3 5.5 5.7 5.7 6.5 4.6 5.1ECOWAS 10.3 10.3 11.1 9.6 10.3 7.6 7.3 8.2 12.8 13.1 11.1 11.4SACU 5.7 7.2 4.4 5.1 5.8 5.8 6.0 4.5 6.2 5.2 5.2 5.3SADC 7.9 9.8 6.9 7.6 7.1 6.3 6.0 5.5 10.4 10.1 9.0 7.2
Table SA4. Consumer Prices(Annual average, percent change)

STATISTICAL APPENDIX
97
2004-08 2009 2010 2011 2012 2013 2014 2015 2016 2017 2018 2019Angola 17.3 14.0 15.3 11.4 9.0 7.7 7.5 14.3 41.9 26.3 24.6 15.0Benin 4.1 –0.5 4.0 1.8 6.8 –1.8 –0.8 2.3 –2.7 3.0 2.8 3.0Botswana 9.9 5.8 7.4 9.2 7.4 4.1 3.8 3.1 3.0 2.9 3.5 3.7Burkina Faso 4.1 –1.8 –0.3 5.1 1.7 0.1 –0.1 1.3 –1.6 2.1 2.0 2.0Burundi 12.5 4.6 4.1 14.9 11.8 9.0 3.7 7.1 9.5 10.5 18.9 24.7Cabo Verde 3.5 –0.4 3.4 3.6 4.1 0.1 –0.4 –0.5 –0.3 0.3 1.0 1.5Cameroon 3.1 0.9 2.6 2.7 2.5 1.7 2.6 1.5 0.3 0.8 1.1 1.3Central African Rep. 4.7 –1.2 2.3 4.3 5.9 5.9 9.7 4.8 4.7 3.6 3.6 3.4Chad 3.3 4.7 –2.2 10.7 2.1 0.9 3.7 4.1 –4.9 7.2 –2.3 5.4Comoros 4.4 2.2 6.7 4.9 1.0 3.5 0.0 2.0 0.8 2.9 3.5 2.0Congo, Dem. Rep. of 17.2 53.4 9.8 8.7 2.8 1.1 1.0 0.9 23.6 55.0 29.5 15.8Congo, Rep. of 6.0 –1.8 2.6 1.8 7.5 2.1 0.5 4.1 –0.0 1.8 1.8 1.9Côte d'Ivoire 3.9 –1.7 5.1 2.0 3.4 0.4 0.9 1.4 –0.2 1.1 2.0 2.0Equatorial Guinea 4.3 5.0 5.4 4.9 2.6 4.9 2.6 1.6 2.0 –0.2 1.3 4.0Eritrea 17.5 22.2 14.2 12.3 2.9 9.5 10.0 9.0 9.0 9.0 9.0 9.0Ethiopia 19.3 7.1 14.6 35.9 15.0 7.7 7.1 10.0 6.7 13.6 10.0 8.0Gabon 1.1 0.9 0.7 2.3 2.2 3.3 1.7 –1.2 4.1 3.0 2.8 2.5Gambia, The 5.2 2.7 5.8 4.4 4.9 5.6 6.9 6.7 7.9 6.9 5.1 4.8Ghana 13.7 9.5 6.9 8.4 8.1 13.5 17.0 17.7 15.4 11.8 8.0 8.0Guinea 24.6 7.9 20.8 19.0 12.8 10.5 9.0 7.3 8.7 9.5 8.0 8.0Guinea-Bissau 4.9 –6.4 5.7 3.4 1.6 –0.1 –0.1 2.4 1.6 –1.3 2.0 2.3Kenya 9.0 8.0 5.8 18.9 3.2 7.1 6.0 8.0 6.3 4.5 5.1 5.0Lesotho 7.2 3.5 3.6 7.2 5.0 5.5 2.0 7.5 4.4 6.0 5.5 5.5Liberia 9.5 9.7 6.6 11.4 7.7 8.5 7.7 8.0 12.5 13.9 11.0 10.0Madagascar 13.6 8.0 10.2 6.9 5.8 6.3 6.0 7.6 7.0 8.1 7.9 6.2Malawi 11.6 7.6 6.3 9.8 34.6 23.5 24.2 24.9 20.0 7.1 9.0 7.5Mali 3.7 1.7 1.9 5.3 2.4 0.0 1.2 1.0 –0.8 1.1 1.6 1.7Mauritius 7.3 1.5 6.1 4.9 3.2 4.1 0.2 1.3 2.3 4.2 5.9 4.7Mozambique 9.2 4.2 16.6 5.5 2.2 3.0 1.1 11.1 21.1 7.2 6.5 5.5Namibia 6.1 7.9 3.1 7.4 6.4 4.9 4.6 3.7 7.3 5.2 5.7 5.8Niger 5.3 –3.1 1.4 1.4 0.7 1.1 –0.6 2.2 –2.2 4.8 1.9 2.1Nigeria 10.3 13.9 11.8 10.3 12.0 8.0 8.0 9.6 18.5 15.4 14.5 16.6Rwanda 11.4 5.7 0.2 8.3 3.9 3.6 2.1 4.5 7.3 0.7 5.0 5.0São Tomé & Príncipe 21.9 16.1 12.9 11.9 10.4 7.1 6.4 4.0 5.1 5.8 5.0 4.5Senegal 3.8 –4.5 4.3 2.7 1.1 –0.1 –0.8 0.4 2.1 0.3 1.5 1.5Seychelles 16.1 –2.5 0.4 5.5 5.8 3.4 0.5 3.2 –0.2 3.5 3.8 3.3Sierra Leone 12.4 10.8 18.4 16.9 12.0 8.5 9.8 10.1 17.4 13.8 13.0 9.9South Africa 6.4 6.3 3.5 6.2 5.7 5.4 5.3 5.3 6.7 4.7 5.6 5.3South Sudan ... ... ... ... 25.2 –8.8 9.9 109.9 479.7 117.7 96.4 125.1Swaziland 7.7 4.5 4.5 7.8 8.3 4.4 6.2 4.9 9.0 4.7 6.0 4.9Tanzania 7.1 12.2 5.6 19.8 12.1 5.6 4.8 6.8 5.0 4.0 5.0 5.0Togo 4.9 0.6 3.8 1.5 2.8 –0.4 1.8 1.6 0.5 –1.6 2.4 0.2Uganda 8.4 10.9 1.5 23.7 4.3 5.5 2.1 8.4 5.7 3.3 4.0 4.5Zambia 13.4 9.9 7.9 7.2 7.3 7.1 7.9 21.1 7.5 6.1 8.0 8.0Zimbabwe1 ... –7.7 3.2 4.9 2.9 0.3 –0.8 –2.5 –0.9 3.5 7.9 4.9
Sub-Saharan Africa 8.9 9.1 7.7 10.0 8.2 6.1 6.1 8.1 12.5 10.3 9.6 9.3Median 7.3 4.7 5.3 7.0 5.0 4.4 3.7 4.5 5.1 4.7 5.1 4.9
Excluding Nigeria and South Africa 9.6 7.6 7.1 11.8 6.9 5.2 5.2 8.5 11.3 9.6 8.4 7.0
Oil-exporting countries 9.8 12.0 10.8 9.5 10.5 6.8 7.1 10.1 21.0 15.6 14.4 15.1 Excluding Nigeria 8.4 7.3 8.0 7.3 6.6 4.0 5.0 11.6 27.8 16.1 14.3 11.4Oil-importing countries 8.4 7.1 5.5 10.4 6.5 5.5 5.3 6.7 6.8 6.8 6.5 5.7
Excluding South Africa 10.0 7.7 6.8 13.3 7.0 5.6 5.2 7.5 6.9 7.9 6.9 5.9
Middle-income countries 8.5 9.1 7.8 8.5 8.1 6.6 6.6 8.0 12.9 10.0 9.8 9.8Excluding Nigeria and South Africa 8.8 6.2 7.2 8.4 5.5 5.9 5.9 8.4 11.6 8.2 7.9 6.3
Low-income countries 10.7 9.3 7.1 15.9 8.5 4.4 4.4 8.6 11.0 11.2 8.9 7.7Excluding low-income countries in fragile situations 10.1 7.5 7.1 20.6 9.1 5.0 3.9 7.5 5.7 6.9 6.2 5.6
Countries in fragile situations 9.3 8.2 6.4 7.0 6.9 2.9 4.1 8.1 14.7 14.0 10.4 9.0
CFA franc zone 3.7 0.1 2.8 3.5 2.9 1.2 1.3 1.6 –0.1 1.7 1.6 2.1CEMAC 3.4 1.9 2.2 4.0 3.2 2.5 2.4 1.9 0.5 2.0 1.1 2.5WAEMU 4.0 –1.6 3.3 3.0 2.7 0.0 0.3 1.3 –0.5 1.4 2.0 1.9
COMESA (SSA members) 12.5 10.7 7.5 17.6 7.4 6.3 5.3 8.5 7.9 10.8 9.1 7.2EAC-5 8.4 9.9 4.4 19.6 6.6 6.1 4.5 7.5 5.9 4.0 5.0 5.2ECOWAS 9.6 10.7 10.2 9.1 10.2 7.1 7.4 8.7 14.6 12.3 11.3 12.6SACU 6.5 6.3 3.6 6.3 5.8 5.3 5.2 5.1 6.6 4.7 5.5 5.2SADC 8.4 9.0 6.1 8.2 6.9 5.6 5.3 7.2 11.5 9.3 9.0 7.0
Table SA5. Consumer Prices(End of period, percent change)
See sources and footnotes on page 91.

REGIONAL ECONOMIC OUTLOOK: SUB-SAHARAN AFRICA
98
See sources and footnotes on page 91.
2004-08 2009 2010 2011 2012 2013 2014 2015 2016 2017 2018 2019Angola 27.7 42.8 28.2 26.4 26.7 26.1 27.5 34.5 26.9 26.5 24.9 26.5Benin 20.7 21.9 23.1 24.1 22.6 27.8 28.6 25.6 24.6 28.4 28.3 26.3Botswana 30.0 37.3 38.1 38.6 38.8 32.7 27.9 32.0 28.6 28.1 29.9 30.6Burkina Faso 18.5 17.9 18.0 15.4 14.9 18.7 21.5 13.8 15.8 17.7 16.7 17.0Burundi 14.6 14.2 15.1 14.7 14.3 15.4 15.9 11.0 9.0 7.0 6.0 5.0Cabo Verde 40.8 43.8 47.6 47.5 37.2 31.6 37.0 38.8 37.4 38.4 36.0 37.8Cameroon 20.9 29.1 28.0 28.0 27.9 28.3 29.3 27.7 27.5 26.2 26.2 26.4Central African Rep. 10.1 13.2 14.3 12.2 15.0 8.7 10.2 13.9 13.7 13.2 14.0 14.6Chad 22.5 30.1 34.4 28.4 31.4 27.4 30.4 26.9 16.7 21.2 22.8 24.0Comoros 10.7 12.4 15.4 14.9 16.8 20.4 18.5 18.4 21.0 21.2 21.2 21.1Congo, Dem. Rep. of 11.0 13.9 13.7 10.1 14.2 16.8 22.8 20.2 11.8 12.0 12.2 13.2Congo, Rep. of 24.4 27.9 22.2 25.7 31.0 33.0 48.0 47.2 46.3 23.7 19.2 18.7Côte d'Ivoire 10.0 8.7 13.4 4.0 16.1 20.7 19.7 20.1 20.7 21.1 22.6 24.0Equatorial Guinea 29.5 39.4 38.1 32.0 41.1 30.3 29.5 21.7 10.4 7.0 7.5 22.8Eritrea 15.9 9.3 9.3 10.0 9.5 9.3 8.5 8.1 8.1 7.8 7.2 7.0Ethiopia1 22.7 24.7 25.5 32.1 37.1 34.1 38.0 39.4 38.0 39.0 37.7 38.6Gabon 25.4 29.1 26.1 23.8 29.1 33.3 35.9 34.8 34.2 31.5 30.9 31.8Gambia, The 21.1 19.6 21.3 18.9 27.8 20.0 20.9 19.7 18.7 27.7 30.5 27.3Ghana 22.2 21.4 25.9 12.8 17.0 13.3 18.8 16.7 14.5 13.6 14.2 15.3Guinea 12.0 6.3 5.5 9.1 14.7 11.6 6.4 7.3 25.2 22.3 17.9 13.8Guinea-Bissau 11.0 10.8 10.8 9.9 6.7 7.2 11.4 8.2 8.0 8.8 11.6 11.8Kenya 18.9 19.3 20.7 21.7 21.5 20.1 22.4 17.7 14.9 17.0 18.1 19.1Lesotho 22.6 27.9 26.8 25.2 31.4 30.2 30.7 28.7 27.9 32.3 37.1 35.4Liberia2 ... ... ... ... ... ... ... ... ... ... ... ...Madagascar 29.7 35.6 23.4 17.6 17.6 15.9 15.6 13.1 15.3 15.9 17.4 19.8Malawi 19.4 24.4 22.8 12.4 12.0 12.7 12.0 12.2 10.8 13.7 13.4 12.9Mali 22.4 22.0 24.0 19.7 17.2 17.8 20.4 18.4 18.6 18.9 19.6 19.5Mauritius 25.6 21.3 23.7 26.0 24.8 25.2 23.0 21.2 20.4 20.5 20.6 20.7Mozambique 15.1 14.6 18.3 25.7 47.4 54.5 55.4 45.3 42.7 44.0 54.7 86.3Namibia 23.7 24.7 22.9 18.9 25.6 21.2 34.8 32.9 25.6 22.7 23.5 23.7Niger 23.2 32.1 49.5 43.9 39.5 40.2 39.3 42.5 37.0 36.6 38.3 38.9Nigeria 16.5 19.4 17.3 16.2 14.9 14.9 15.8 15.5 12.6 12.9 13.2 13.4Rwanda 18.1 23.4 23.0 23.5 25.8 26.5 25.3 26.5 25.9 23.4 24.9 25.9São Tomé & Príncipe 41.6 38.9 55.9 44.6 35.6 28.2 25.2 32.1 27.7 32.2 22.3 22.7Senegal 26.3 22.1 22.1 25.6 29.3 27.5 24.5 25.2 26.9 26.3 27.6 27.6Seychelles 28.6 27.3 36.6 35.4 38.1 38.5 37.7 33.8 30.2 30.7 29.9 30.9Sierra Leone 10.2 10.0 31.1 41.9 27.9 12.7 13.1 13.8 12.3 19.1 18.4 17.8South Africa 20.2 20.7 19.5 19.7 20.0 21.2 20.5 21.0 19.4 18.6 18.7 18.8South Sudan ... ... ... 5.5 10.7 12.8 20.6 14.5 17.3 8.4 6.3 6.7Swaziland 16.6 15.2 14.3 12.8 12.1 12.7 12.9 12.1 11.7 11.7 12.0 11.6Tanzania 26.3 25.1 27.3 33.2 28.5 30.3 30.1 27.2 24.6 27.9 30.0 30.8Togo 21.3 21.1 21.6 25.7 23.3 29.6 27.9 32.2 31.1 23.4 27.7 26.2Uganda 29.3 27.1 26.7 28.7 28.4 27.4 25.7 24.8 24.4 25.0 27.6 30.7Zambia 33.2 30.3 29.9 33.6 31.8 34.0 34.0 42.8 41.8 41.9 43.1 42.5Zimbabwe3 ... 14.7 22.4 20.3 12.0 11.5 11.9 12.6 15.6 19.6 18.8 18.2
Sub-Saharan Africa 20.3 22.6 21.3 20.5 21.1 21.1 22.1 22.0 19.8 19.9 20.4 21.4Median 21.7 22.0 23.0 23.6 25.2 23.2 23.8 21.5 20.8 21.8 21.7 22.7
Excluding Nigeria and South Africa 22.6 25.6 24.8 23.7 25.7 25.1 26.9 26.5 24.4 24.5 25.1 26.7
Oil-exporting countries 19.1 24.3 20.4 18.7 18.7 18.4 19.7 19.9 16.4 15.9 16.0 16.7 Excluding Nigeria 25.5 36.6 29.0 25.0 28.5 27.3 30.0 31.4 26.6 24.1 23.3 25.2Oil-importing countries 21.1 21.4 21.9 21.8 22.9 23.2 23.9 23.5 22.2 22.6 23.3 24.4
Excluding South Africa 21.7 21.9 23.4 23.2 24.7 24.4 25.9 25.0 23.7 24.6 25.6 27.0
Middle-income countries 19.9 22.6 20.6 19.5 19.8 19.8 20.6 20.8 18.3 17.9 18.2 18.7Excluding Nigeria and South Africa 23.3 28.1 25.6 23.3 25.7 24.6 26.6 27.1 23.9 23.0 23.2 24.3
Low-income countries 21.8 22.6 23.8 24.1 25.7 25.7 27.3 25.9 24.8 26.2 27.1 29.1Excluding low-income countries in fragile situations 23.7 24.2 26.0 30.0 31.4 31.9 33.1 31.6 30.1 31.7 33.0 35.7
Countries in fragile situations 17.3 18.5 19.3 14.7 17.8 18.2 20.7 19.5 18.9 17.8 17.9 18.3
CFA franc zone 20.8 24.2 25.2 22.6 26.1 26.6 28.1 26.2 24.7 23.1 23.6 24.8CEMAC 23.7 30.9 29.4 27.5 31.4 29.7 32.9 30.4 27.0 23.2 23.1 25.4WAEMU 18.1 17.7 21.2 17.8 21.0 23.6 23.6 22.6 22.7 23.0 24.0 24.4
COMESA (SSA members) 22.5 23.0 23.0 24.2 24.9 24.4 26.1 25.8 24.3 25.5 26.0 27.1EAC-5 23.3 23.1 24.2 27.1 25.4 25.4 25.8 22.9 20.8 22.7 24.5 25.8ECOWAS 17.2 19.1 18.5 16.4 16.2 16.1 17.1 16.6 14.7 15.0 15.5 15.8SACU 20.7 21.4 20.3 20.4 20.9 21.6 21.2 21.8 19.9 19.2 19.4 19.6SADC 22.1 24.7 22.3 22.5 22.8 23.7 23.9 24.9 22.2 22.3 22.8 24.1
Table SA6. Total Investment(Percent of GDP)

STATISTICAL APPENDIX
99
2004-08 2009 2010 2011 2012 2013 2014 2015 2016 2017 2018 2019Angola 42.3 32.7 37.3 39.0 38.8 32.8 24.5 24.5 21.8 22.0 22.7 26.4Benin 14.0 13.6 14.9 16.8 15.1 20.4 20.0 16.6 15.2 19.0 19.8 18.4Botswana 40.4 25.2 34.7 41.4 40.3 41.5 43.2 40.2 40.2 38.9 38.2 38.1Burkina Faso 8.1 13.2 15.8 11.5 8.2 7.4 13.4 5.3 8.5 9.3 8.7 10.1Burundi 1.5 9.2 3.7 1.0 –3.8 –4.3 –3.4 –6.7 –4.1 –5.7 –7.2 -6.9Cabo Verde 31.3 29.2 35.2 31.2 24.6 26.8 27.9 35.6 34.7 29.6 26.5 27.8Cameroon 19.5 25.9 25.5 25.2 24.6 24.8 25.3 23.9 24.3 23.7 23.7 24.1Central African Rep. 4.6 4.1 4.1 4.6 10.4 5.7 4.6 4.9 4.6 4.4 3.8 5.8Chad 23.0 21.9 25.9 22.6 23.6 18.2 21.5 13.3 7.5 16.0 18.5 18.5Comoros 4.4 5.5 15.0 8.9 11.3 13.3 12.2 17.8 13.6 16.4 14.2 12.6Congo, Dem. Rep. of 7.0 8.4 12.5 8.0 6.2 11.8 18.2 16.5 8.7 11.5 12.5 12.3Congo, Rep. of 27.7 13.3 29.6 39.7 48.8 46.8 49.3 –6.9 –27.8 11.1 22.2 23.5Côte d'Ivoire 11.1 15.4 15.3 14.4 14.9 19.4 21.2 19.5 19.6 19.9 21.1 22.7Equatorial Guinea 36.0 29.7 17.8 26.4 40.0 27.8 25.2 4.0 –1.5 6.5 6.6 9.4Eritrea 12.8 1.6 3.2 13.2 12.2 12.9 12.5 6.8 6.0 5.5 5.7 4.8Ethiopia1 19.7 15.4 24.5 33.1 31.2 28.1 30.7 32.4 32.7 32.1 31.2 32.3Gabon 41.7 33.5 41.0 47.8 47.0 40.5 43.5 29.2 24.1 26.7 29.3 29.9Gambia, The 12.6 7.1 5.0 7.3 20.8 9.7 10.0 4.7 9.9 13.4 12.0 10.3Ghana 14.1 16.0 17.3 3.8 5.3 1.3 9.3 9.0 7.8 9.1 10.1 11.3Guinea 8.1 0.6 –0.9 –9.3 –5.2 –1.0 –7.0 –8.1 –6.7 –0.7 –1.2 3.8Guinea-Bissau 7.5 5.0 2.5 8.7 –1.7 2.6 12.0 10.5 9.3 8.9 8.4 9.2Kenya 16.3 14.9 14.8 12.5 13.1 11.3 12.0 10.9 9.8 10.6 12.0 13.5Lesotho 37.6 29.5 17.9 11.7 23.0 24.6 25.8 24.2 20.5 25.4 25.0 23.3Liberia ... ... ... ... ... ... ... ... ... ... ... ...Madagascar 16.7 14.6 13.2 10.7 10.2 10.1 15.3 11.2 15.8 12.5 13.4 15.0Malawi 12.8 20.5 26.2 3.8 2.8 4.3 3.7 2.8 –2.8 3.7 4.4 4.8Mali 15.6 15.6 13.3 14.7 15.0 14.9 15.7 13.0 11.4 12.7 12.7 13.1Mauritius 20.0 15.0 14.3 13.2 18.5 19.0 17.0 16.3 16.3 13.5 12.3 11.0Mozambique 9.4 4.4 8.1 4.4 14.9 11.5 17.2 5.0 3.4 27.9 37.8 41.7Namibia 30.4 23.2 19.4 15.9 19.9 17.2 24.1 20.3 11.5 21.3 19.9 18.6Niger 14.1 7.7 25.5 18.8 23.4 23.4 23.7 22.0 21.6 23.4 22.2 22.2Nigeria 30.6 24.1 20.8 18.8 18.7 18.6 16.0 12.3 13.2 15.3 13.8 13.9Rwanda 6.0 6.6 6.4 4.9 7.3 10.5 10.0 7.5 6.1 12.5 12.6 13.5São Tomé & Príncipe 14.3 14.2 33.0 16.9 13.7 14.5 3.3 19.5 21.8 19.3 11.0 12.8Senegal 16.7 15.4 17.7 17.6 18.4 17.0 15.5 18.2 21.3 16.9 19.7 20.1Seychelles 14.8 12.4 17.2 12.4 17.0 26.5 14.6 15.2 12.0 14.7 15.5 17.0Sierra Leone 4.5 –1.7 9.6 –16.9 –4.0 –4.8 –7.2 –5.9 –6.4 –0.8 1.8 -2.8South Africa 16.0 18.0 18.0 17.5 14.8 15.3 15.2 16.6 16.1 16.3 15.8 15.8South Sudan ... ... ... 23.3 –5.2 8.9 18.9 7.3 19.0 2.5 0.2 2.4Swaziland 15.2 6.4 3.2 9.1 16.9 19.6 20.1 17.5 28.4 26.3 27.4 26.6Tanzania 20.9 18.3 21.2 21.6 19.3 14.9 21.8 24.9 23.1 24.1 24.6 24.8Togo 13.2 15.9 15.8 17.9 15.7 16.4 17.9 21.2 21.5 15.2 19.9 19.8Uganda 26.6 21.4 18.8 18.8 21.7 20.2 17.9 18.1 21.0 20.4 20.8 21.2Zambia 32.1 36.2 37.4 38.3 37.1 33.4 36.1 38.9 37.3 38.6 40.5 40.6Zimbabwe3 ... 5.6 21.2 22.0 6.5 5.6 7.2 8.0 19.1 24.8 23.6 23.1
Sub-Saharan Africa 22.6 20.3 20.5 19.6 19.1 18.3 18.2 16.1 15.9 17.6 17.5 18.2Median 15.4 15.0 17.3 15.3 15.4 15.9 17.1 15.8 14.4 15.7 15.7 16.4
Excluding Nigeria and South Africa 21.6 19.1 21.6 21.1 21.3 19.4 20.9 18.4 17.5 19.4 20.3 21.4
Oil-exporting countries 31.5 25.4 23.8 23.0 23.1 21.8 19.2 14.2 14.0 16.5 15.8 16.5 Excluding Nigeria 33.8 28.9 31.7 33.4 34.5 30.0 27.5 19.0 16.1 19.6 21.2 23.4Oil-importing countries 16.9 16.7 18.1 17.0 16.1 15.7 17.4 17.6 17.3 18.3 18.7 19.2
Excluding South Africa 17.6 15.8 18.2 16.8 16.9 15.9 18.7 18.2 17.9 19.4 20.1 20.9
Middle-income countries 24.2 22.0 21.3 20.2 19.9 19.1 18.1 15.7 15.4 16.9 16.6 17.1Excluding Nigeria and South Africa 25.7 23.3 24.9 24.4 25.8 23.0 23.0 19.2 17.3 19.2 20.3 21.6
Low-income countries 16.2 13.9 17.5 17.5 16.1 15.4 18.5 17.5 17.7 19.7 20.3 21.1Excluding low-income countries in fragile situations 18.6 15.6 19.7 21.6 21.7 19.5 22.6 22.5 22.6 24.8 25.3 26.1
Countries in fragile situations 13.4 12.2 15.6 14.2 12.0 13.7 16.3 10.0 8.7 12.6 14.0 14.8
CFA franc zone 20.0 19.6 21.1 22.6 24.5 23.1 24.3 15.9 14.1 17.7 19.3 20.1CEMAC 27.5 25.2 26.5 30.2 34.0 29.7 30.7 15.4 10.7 18.8 21.3 22.2WAEMU 12.9 14.3 16.0 15.3 15.1 16.8 18.3 16.4 17.0 16.9 17.9 18.6
COMESA (SSA members) 18.2 16.4 19.0 19.4 18.8 18.0 19.7 19.6 19.8 20.6 21.0 21.8EAC-5 19.1 16.9 17.2 16.3 16.4 14.0 16.3 16.8 16.4 17.3 18.0 18.8ECOWAS 25.5 21.3 19.4 16.4 16.6 16.5 15.3 12.3 13.0 14.7 13.9 14.3SACU 17.4 18.3 18.5 18.3 16.1 16.6 16.9 17.8 17.2 17.7 17.2 17.1SADC 20.2 19.8 21.4 20.9 19.3 18.5 18.8 19.3 18.3 19.6 19.9 20.4
Table SA7. Gross National Savings(Percent of GDP)
See sources and footnotes on page 91.

REGIONAL ECONOMIC OUTLOOK: SUB-SAHARAN AFRICA
100
See sources and footnotes on page 91.
2004-08 2009 2010 2011 2012 2013 2014 2015 2016 2017 2018 2019Angola 4.6 –7.4 3.4 8.7 4.6 –0.3 –6.6 –3.3 –4.8 –5.6 –1.7 -2.2Benin –0.6 –3.1 –0.4 –1.3 –0.3 –1.9 –2.3 –7.6 –5.9 –5.8 –4.7 -2.0Botswana 4.5 –13.6 –7.9 –0.1 0.9 5.6 3.7 –4.6 –1.1 0.4 –1.2 1.1Burkina Faso –0.8 –4.7 –4.6 –2.3 –3.1 –4.0 –2.0 –2.4 –3.5 –8.2 –5.0 -3.0Burundi –8.2 –5.1 –3.6 –3.5 –3.8 –1.8 –3.6 –5.3 –6.2 –8.4 –9.3 -9.6Cabo Verde –3.4 –5.8 –10.5 –7.7 –10.3 –9.3 –7.6 –4.6 –3.1 –3.0 –3.2 -5.9Cameroon 7.8 –0.0 –1.0 –2.4 –1.4 –3.7 –4.2 –4.4 –6.2 –4.3 –2.2 -1.8Central African Rep. 0.5 –0.6 –1.5 –2.4 –0.0 –6.5 3.0 –0.6 1.6 –1.4 1.5 0.3Chad 1.2 –9.2 –4.2 2.4 0.5 –2.1 –4.2 –4.4 –2.0 –0.9 0.9 -0.1Comoros –1.7 0.6 7.0 1.4 3.3 17.8 –0.5 4.3 –7.3 –3.1 –2.8 -3.6Congo, Dem. Rep. of 0.1 1.0 –0.9 –0.9 2.0 2.0 0.1 –0.2 –1.0 –2.5 0.1 0.1Congo, Rep. of 14.6 4.9 15.5 15.4 7.5 –5.0 –16.7 –27.2 –22.6 –7.2 3.9 5.0Côte d'Ivoire –1.0 –1.4 –1.8 –4.0 –3.1 –2.2 –2.2 –2.8 –3.9 –4.3 –3.7 -3.0Equatorial Guinea 16.3 –6.5 –4.5 0.8 –7.2 –4.4 –7.6 –16.3 –12.0 –2.9 –1.1 -0.4Eritrea –17.9 –14.7 –16.9 –16.1 –15.7 –15.5 –14.8 –14.8 –14.7 –14.5 –13.2 -12.9Ethiopia1 –3.4 –0.9 –1.3 –1.6 –1.2 –1.9 –2.6 –1.9 –2.3 –3.3 –2.5 -2.4Gabon 8.5 6.8 2.7 1.7 6.2 –3.1 6.0 –1.1 –4.7 –1.8 0.8 1.0Gambia, The –3.2 –2.7 –4.7 –4.7 –4.4 –8.5 –5.8 –8.1 –9.7 –3.9 –2.2 -2.4Ghana –5.2 –7.2 –10.1 –7.4 –11.3 –12.0 –10.9 –5.4 –8.9 –5.0 –5.0 -3.6Guinea –1.1 –4.9 –9.6 –0.9 –2.5 –3.9 –3.2 –6.9 –0.1 –0.3 –2.1 -2.0Guinea-Bissau –5.4 2.9 –0.2 –1.4 –2.3 –1.8 –2.6 –3.0 –4.7 –1.5 –2.2 -2.3Kenya –1.9 –4.3 –4.4 –4.1 –5.0 –5.7 –7.4 –8.1 –8.3 –8.5 –7.5 -6.2Lesotho 7.6 –2.9 –3.8 –8.9 4.5 –1.7 0.3 –1.0 –6.3 –6.5 –5.3 -4.9Liberia –1.1 –11.2 –6.9 –4.2 –2.9 –5.9 –3.1 –4.4 –3.7 –4.5 –4.1 -4.0Madagascar –2.6 –2.5 –0.9 –2.4 –2.6 –4.0 –2.3 –3.3 –1.3 –3.5 –3.0 -5.1Malawi –2.3 –3.6 1.8 –4.1 –1.8 –6.4 –4.8 –6.2 –7.3 –6.8 –2.8 -3.7Mali 3.6 –3.7 –2.6 –3.4 –1.0 –2.4 –2.9 –1.8 –3.9 –2.9 –3.3 -3.0Mauritius –3.8 –3.5 –3.2 –3.2 –1.8 –3.5 –3.2 –3.5 –3.6 –3.3 –3.4 -3.3Mozambique –2.9 –4.9 –3.8 –4.8 –3.9 –2.7 –10.7 –7.2 –6.2 –5.5 –7.5 -10.8Namibia 2.0 –0.1 –4.6 –7.0 –2.4 –3.3 –6.0 –8.2 –9.1 –6.1 –7.7 -9.5Niger 7.1 –5.3 –2.4 –1.5 –1.1 –2.6 –8.0 –9.1 –6.1 –5.1 –6.1 -5.8Nigeria 4.7 –5.4 –4.2 0.4 0.2 –2.3 –2.1 –3.5 –3.9 –5.8 –4.8 -4.6Rwanda 0.6 0.3 –0.7 –0.9 –2.5 –1.3 –4.0 –2.8 –2.3 –2.5 –2.0 -2.0São Tomé & Príncipe 30.7 –19.3 –11.7 –12.5 –11.2 1.9 –5.3 –6.3 –2.7 –2.6 –2.4 -2.8Senegal –2.5 –4.6 –4.9 –6.1 –5.2 –5.5 –5.0 –4.8 –4.2 –4.5 –3.5 -3.0Seychelles –0.7 4.8 0.5 3.4 2.9 0.4 3.7 1.9 0.2 1.0 0.6 1.1Sierra Leone 2.2 –2.3 –5.0 –4.5 –5.2 –2.4 –3.6 –4.5 –8.5 –9.2 –8.2 -6.5South Africa 0.1 –5.2 –5.0 –4.1 –4.4 –4.3 –4.3 –4.8 –4.1 –4.5 –4.2 -4.1South Sudan ... ... ... 4.6 –14.8 –3.5 –9.2 –20.3 –21.3 –2.9 –4.8 -4.0Swaziland 1.3 –2.9 –9.0 –3.8 3.5 0.8 –1.1 –4.5 –10.4 –7.9 –7.4 -6.0Tanzania –2.5 –4.5 –4.8 –3.6 –4.1 –3.9 –3.0 –3.3 –2.2 –2.7 –4.4 -4.6Togo –1.5 –3.7 –2.3 –6.3 –6.5 –5.2 –6.8 –8.8 –9.6 –0.5 –3.2 -0.7Uganda –0.8 –2.1 –5.7 –2.7 –3.0 –4.0 –4.7 –4.6 –4.9 –3.2 –5.3 -6.5Zambia 2.1 –2.1 –2.4 –1.8 –2.8 –6.2 –5.7 –9.3 –5.8 –7.3 –7.8 -7.4Zimbabwe2 –3.5 –2.0 0.7 –0.5 0.0 –1.7 –1.4 –1.0 –8.4 –9.6 –3.1 -1.9
Sub-Saharan Africa 1.7 –4.6 –3.6 –1.2 –1.8 –3.2 –3.8 –4.5 –4.6 –5.0 –4.0 -3.9Median –0.8 –3.5 –3.7 –2.4 –2.5 –3.3 –3.6 –4.5 –4.8 –4.3 –3.3 -3.0
Excluding Nigeria and South Africa 1.2 –3.7 –2.1 –0.4 –1.7 –3.3 –4.8 –5.0 –5.2 –4.8 –3.6 -3.4
Oil-exporting countries 5.5 –5.0 –2.2 2.2 0.7 –2.2 –3.3 –4.3 –4.7 –5.4 –3.6 -3.6 Excluding Nigeria 7.1 –4.1 2.3 5.6 1.7 –1.9 –6.0 –6.4 –6.4 –4.8 –1.2 -1.3Oil-importing countries –0.6 –4.3 –4.5 –3.8 –3.8 –4.0 –4.3 –4.6 –4.5 –4.7 –4.3 -4.1
Excluding South Africa –1.2 –3.5 –4.0 –3.5 –3.3 –3.9 –4.3 –4.5 –4.8 –4.8 –4.4 -4.0
Middle-income countries 2.3 –4.9 –3.7 –1.1 –1.7 –3.3 –3.8 –4.6 –4.9 –5.3 –4.2 -4.0Excluding Nigeria and South Africa 2.7 –4.1 –1.5 0.6 –1.1 –3.7 –5.7 –5.8 –6.4 –5.4 –3.8 -3.3
Low-income countries –1.3 –3.1 –3.0 –1.9 –2.5 –2.6 –3.7 –4.1 –3.7 –3.9 –3.4 -3.5Excluding low-income countries in fragile situations –1.6 –2.9 –3.4 –2.6 –2.6 –3.0 –4.0 –3.6 –3.2 –3.7 –4.0 -4.1
Countries in fragile situations 0.4 –2.3 –0.7 –0.1 –1.7 –2.4 –4.0 –5.4 –5.0 –4.4 –2.5 -2.3
CFA franc zone 4.7 –2.0 –0.8 –0.4 –1.3 –3.4 –4.0 –6.0 –5.9 –4.1 –2.5 -1.8CEMAC 9.2 –0.8 1.0 2.4 0.1 –3.8 –4.7 –8.1 –7.6 –3.5 –0.3 -0.1WAEMU –0.1 –3.2 –2.7 –3.7 –2.9 –3.1 –3.4 –4.1 –4.5 –4.6 –4.0 -3.0
COMESA (SSA members) –1.7 –2.2 –2.7 –2.5 –2.2 –3.2 –4.0 –4.4 –4.8 –5.5 –4.5 -4.2EAC-5 –1.9 –3.7 –4.5 –3.4 –4.2 –4.5 –5.2 –5.6 –5.5 –5.6 –6.0 -5.6ECOWAS 2.9 –5.1 –4.5 –0.9 –1.1 –3.2 –2.8 –3.7 –4.4 –5.4 –4.6 -4.2SACU 0.4 –5.3 –5.1 –4.0 –4.0 –3.8 –3.9 –4.8 –4.2 –4.4 –4.2 -4.1SADC 0.3 –5.0 –3.4 –1.8 –2.2 –2.9 –4.3 –4.3 –4.1 –4.6 –3.7 -3.7
Table SA8. Overall Fiscal Balance, Including Grants(Percent of GDP)

STATISTICAL APPENDIX
101
2004-08 2009 2010 2011 2012 2013 2014 2015 2016 2017 2018 2019Angola 4.4 –7.4 3.4 8.7 4.6 –0.3 –6.6 –3.3 –4.8 –5.6 –1.7 -2.2Benin –2.7 –6.0 –1.8 –3.7 –2.1 –2.8 –3.2 –8.2 –6.6 –6.8 –6.1 -3.7Botswana 3.8 –14.6 –8.2 –0.6 0.8 5.3 3.4 –4.7 –1.2 0.3 –1.4 1.0Burkina Faso –10.2 –10.6 –9.0 –7.3 –8.0 –9.5 –6.1 –6.1 –6.2 –10.9 –8.5 -6.7Burundi –24.2 –24.0 –26.3 –25.3 –21.9 –19.2 –17.3 –14.9 –9.1 –11.2 –12.0 -12.3Cabo Verde –9.1 –11.4 –17.3 –10.6 –13.1 –11.9 –9.4 –7.0 –5.8 –6.5 –5.1 -7.2Cameroon 2.0 –0.8 –1.5 –2.8 –1.8 –4.0 –4.4 –4.5 –6.4 –4.5 –2.5 -2.1Central African Rep. –5.5 –5.9 –7.0 –4.9 –4.9 –9.3 –7.8 –7.8 –4.4 –5.9 –6.1 -6.1Chad –0.7 –11.8 –5.5 0.8 –2.2 –4.3 –6.1 –7.8 –4.9 –4.7 –3.5 -3.6Comoros –7.8 –9.1 –7.8 –6.0 –6.0 –9.7 –9.8 –10.8 –16.1 –17.0 –15.9 -14.6Congo, Dem. Rep. of –1.0 –1.9 –4.4 –2.8 –0.1 0.2 –4.2 –3.4 –3.5 –4.4 –1.8 -1.8Congo, Rep. of 14.2 4.6 15.5 14.9 7.3 –5.4 –17.2 –28.1 –23.4 –7.8 3.3 4.5Côte d'Ivoire –2.1 –1.9 –2.3 –4.3 –3.7 –3.5 –3.9 –4.3 –5.2 –5.4 –4.9 -4.6Equatorial Guinea 16.3 –6.5 –4.5 0.8 –7.2 –4.4 –7.6 –16.3 –12.0 –2.9 –1.1 -0.4Eritrea –24.8 –17.3 –21.7 –19.1 –16.8 –16.8 –15.8 –15.6 –15.8 –15.5 –14.1 -13.7Ethiopia1 –7.5 –5.2 –4.5 –4.8 –2.9 –3.4 –3.7 –3.0 –3.2 –4.0 –3.3 -3.2Gabon 8.5 6.8 2.7 1.7 6.2 –3.1 6.0 –1.1 –4.7 –1.8 0.8 1.0Gambia, The –4.8 –6.9 –8.7 –9.9 –13.4 –10.8 –9.5 –10.0 –11.4 –15.0 –14.9 -12.5Ghana –8.6 –10.2 –12.4 –9.5 –12.8 –12.5 –11.7 –7.3 –9.5 –5.8 –5.3 -3.9Guinea –1.7 –5.1 –9.9 –3.5 –4.6 –5.0 –6.3 –8.1 –1.4 –1.9 –4.2 -3.5Guinea-Bissau –14.2 –13.0 –9.8 –8.1 –4.7 –5.2 –12.1 –9.5 –8.7 –6.1 –6.8 -7.2Kenya –2.9 –5.0 –5.0 –4.6 –5.5 –6.2 –7.9 –8.6 –8.7 –9.0 –8.1 -6.7Lesotho 6.1 –5.6 –10.4 –15.8 –3.0 –5.8 –1.4 –4.0 –8.9 –8.6 –7.4 -6.9Liberia –1.7 –16.4 –10.8 –7.8 –8.2 –12.7 –17.8 –22.1 –21.5 –20.5 –19.1 -17.8Madagascar –9.2 –4.2 –2.8 –4.3 –3.8 –5.3 –4.6 –4.8 –4.8 –6.8 –5.9 -7.8Malawi –12.3 –11.1 –8.2 –7.7 –10.6 –13.1 –8.0 –9.9 –10.3 –10.5 –7.0 -6.2Mali –6.2 –7.8 –5.1 –6.6 –1.2 –5.2 –5.1 –4.5 –5.5 –4.5 –4.5 -4.5Mauritius –4.1 –5.0 –3.9 –3.9 –2.5 –3.9 –3.4 –3.6 –4.2 –4.8 –4.9 -4.8Mozambique –9.7 –13.3 –12.0 –12.3 –8.9 –7.9 –15.0 –10.2 –8.3 –7.0 –8.8 -12.0Namibia 1.9 –0.4 –4.7 –7.1 –2.5 –3.5 –6.1 –8.3 –9.1 –6.2 –7.7 -9.6Niger –7.6 –9.7 –7.0 –5.2 –7.2 –10.6 –13.5 –14.5 –12.2 –12.3 –13.0 -13.4Nigeria 4.7 –5.4 –4.2 0.4 0.2 –2.3 –2.1 –3.5 –3.9 –5.8 –4.8 -4.6Rwanda –9.8 –11.1 –12.5 –12.3 –10.2 –10.6 –11.7 –9.0 –7.4 –7.3 –6.8 -6.0São Tomé & Príncipe –7.9 –34.6 –31.4 –32.0 –29.4 –11.0 –15.3 –17.7 –17.6 –16.8 –15.5 -15.5Senegal –4.5 –7.6 –7.4 –8.3 –8.0 –8.1 –8.4 –7.7 –7.0 –7.3 –6.2 -5.6Seychelles –1.8 0.8 –0.3 0.9 –1.9 –3.9 0.5 1.1 –1.1 –0.9 –1.3 -0.3Sierra Leone –7.5 –8.4 –10.3 –10.1 –9.0 –5.0 –7.8 –9.9 –11.5 –11.7 –10.4 -8.4South Africa 0.1 –5.2 –5.0 –4.1 –4.4 –4.3 –4.3 –4.8 –4.1 –4.5 –4.2 -4.1South Sudan ... ... ... 1.7 –20.9 –9.9 –15.6 –26.8 –21.4 –2.9 –4.8 -4.0Swaziland 0.8 –3.4 –9.0 –3.8 3.4 0.3 –2.8 –5.1 –11.2 –8.6 –8.1 -6.6Tanzania –7.2 –8.1 –8.2 –6.9 –7.0 –6.3 –4.7 –4.1 –2.9 –3.6 –5.4 -5.6Togo –2.5 –5.1 –4.2 –9.3 –8.9 –8.6 –9.2 –11.1 –12.4 –3.0 –7.1 -4.6Uganda –6.0 –4.5 –8.2 –4.4 –4.9 –5.0 –5.8 –5.9 –6.0 –4.5 –6.6 -7.6Zambia –5.7 –4.5 –3.9 –2.4 –4.5 –7.6 –6.5 –9.5 –6.0 –7.6 –8.7 -8.0Zimbabwe2 –3.5 –2.5 0.7 –0.5 0.0 –1.7 –1.4 –1.0 –8.4 –9.6 –3.1 -1.9
Sub-Saharan Africa 0.4 –5.6 –4.4 –2.0 –2.5 –3.9 –4.5 –5.1 –5.2 –5.5 –4.7 -4.4Median –4.3 –6.3 –7.0 –4.8 –4.7 –5.3 –6.5 –7.8 –7.0 –6.2 –6.1 -5.6
Excluding Nigeria and South Africa –1.9 –5.9 –4.0 –2.1 –3.3 –4.8 –6.4 –6.4 –6.3 –5.9 –4.8 -4.5
Oil-exporting countries 5.0 –5.1 –2.3 2.0 0.5 –2.4 –3.5 –4.5 –4.7 –5.5 –3.7 -3.6 Excluding Nigeria 5.7 –4.5 2.1 5.2 1.2 –2.5 –6.6 –7.0 –6.7 –5.0 –1.5 -1.6Oil-importing countries –2.3 –5.9 –5.9 –5.0 –4.9 –5.2 –5.5 –5.7 –5.4 –5.6 –5.3 -5.0
Excluding South Africa –5.0 –6.5 –6.7 –5.9 –5.4 –5.8 –6.3 –6.2 –6.2 –6.2 –5.8 -5.4
Middle-income countries 1.7 –5.2 –3.9 –1.3 –1.9 –3.5 –4.0 –4.7 –5.0 –5.5 –4.4 -4.2Excluding Nigeria and South Africa 0.9 –5.0 –2.3 0.0 –1.7 –4.2 –6.2 –6.4 –6.9 –6.0 –4.3 -3.8
Low-income countries –6.4 –7.2 –6.8 –5.3 –5.5 –5.6 –6.6 –6.5 –5.5 –5.8 –5.4 -5.3Excluding low-income countries in fragile situations –7.4 –7.5 –7.5 –6.6 –5.7 –5.9 –6.2 –5.4 –4.7 –5.2 –5.6 -5.7
Countries in fragile situations –2.8 –4.9 –3.2 –2.3 –4.0 –4.9 –7.2 –8.3 –7.3 –6.5 –4.6 -4.4
CFA franc zone 1.3 –3.7 –2.1 –1.7 –2.6 –5.1 –5.7 –7.6 –7.4 –5.7 –4.2 -3.7CEMAC 6.8 –1.5 0.5 1.9 –0.5 –4.2 –5.3 –8.8 –8.4 –4.2 –1.2 -0.8WAEMU –4.6 –6.0 –4.9 –6.0 –5.0 –6.0 –6.1 –6.6 –6.7 –6.7 –6.3 -5.6
COMESA (SSA members) –5.3 –5.1 –5.5 –4.6 –4.0 –4.9 –5.7 –5.7 –6.0 –6.6 –5.7 -5.3EAC-5 –5.6 –6.6 –7.5 –6.2 –6.4 –6.5 –6.8 –6.9 –6.4 –6.6 –7.0 -6.6ECOWAS 1.8 –5.9 –5.1 –1.5 –1.6 –3.7 –3.4 –4.3 –5.0 –6.0 –5.3 -4.8SACU 0.3 –5.4 –5.2 –4.1 –4.1 –3.8 –4.0 –4.9 –4.2 –4.5 –4.3 -4.1SADC –0.5 –5.8 –4.1 –2.4 –2.7 –3.5 –4.8 –4.7 –4.5 –5.0 –4.1 -4.1
Table SA9. Overall Fiscal Balance, Excluding Grants(Percent of GDP)
See sources and footnotes on page 91.

REGIONAL ECONOMIC OUTLOOK: SUB-SAHARAN AFRICA
102
See sources and footnotes on page 91.
2004-08 2009 2010 2011 2012 2013 2014 2015 2016 2017 2018 2019Angola 45.5 34.5 43.4 48.8 46.5 40.2 35.3 27.3 18.6 16.4 18.4 18.3Benin 16.6 17.2 17.5 16.4 17.4 17.6 16.3 16.7 14.7 17.6 17.5 17.4Botswana 41.5 36.8 33.9 35.8 36.6 37.4 38.1 31.1 31.9 32.5 30.4 30.3Burkina Faso 13.1 13.6 15.3 15.7 17.5 18.9 17.4 17.0 18.4 19.0 19.7 20.3Burundi 13.9 13.9 14.5 16.9 15.6 14.0 14.4 12.3 12.1 11.2 10.8 10.7Cabo Verde 22.7 22.1 21.8 22.7 21.6 21.9 21.1 24.4 24.2 24.9 27.9 26.8Cameroon 16.5 15.0 14.4 15.8 15.9 16.0 16.4 16.4 14.7 14.7 15.4 15.7Central African Rep. 9.4 10.8 11.6 10.8 11.5 5.6 4.9 7.1 8.2 8.3 8.9 9.2Chad 14.1 12.3 18.9 23.2 21.7 18.5 15.8 10.5 9.6 10.3 11.3 11.3Comoros 14.1 13.9 14.3 16.1 19.3 15.5 14.5 16.5 14.5 14.4 14.3 15.7Congo, Dem. Rep. of 8.6 10.7 12.1 11.8 14.4 12.9 14.3 13.6 9.2 8.5 9.3 9.3Congo, Rep. of 42.2 29.9 36.6 40.9 42.5 44.7 39.2 25.1 26.6 22.5 27.2 27.7Côte d'Ivoire 17.5 18.0 17.7 14.0 18.6 18.4 17.1 18.5 18.0 18.0 18.1 18.4Equatorial Guinea 33.7 33.4 26.6 28.3 28.0 24.9 24.4 28.8 18.7 19.8 18.9 17.8Eritrea 22.3 13.3 13.3 14.8 14.2 14.1 14.1 14.0 13.8 13.7 14.2 14.1Ethiopia1 13.9 11.9 14.0 13.4 13.8 14.3 13.8 14.4 15.0 14.2 14.3 14.7Gabon 28.7 29.4 25.8 23.5 30.2 31.6 29.7 21.1 17.1 17.4 19.0 19.5Gambia, The 15.8 16.2 14.9 16.1 16.4 16.3 18.5 19.7 18.4 19.3 20.0 18.2Ghana 13.6 13.4 14.4 17.1 17.0 16.3 17.7 17.6 16.6 16.7 17.7 17.8Guinea 9.5 11.1 10.6 12.5 15.5 13.7 13.8 13.7 15.0 15.3 16.0 17.0Guinea-Bissau 9.4 9.1 10.8 10.1 9.1 8.0 12.6 13.8 12.2 12.7 14.3 15.0Kenya 18.7 18.1 19.2 19.0 18.7 19.2 19.3 18.7 18.4 18.2 18.4 18.4Lesotho 48.0 54.7 40.5 39.6 50.6 48.2 48.1 44.2 38.4 37.7 35.8 35.0Liberia 15.1 16.9 21.9 21.4 22.0 20.2 14.4 14.0 14.0 14.6 15.3 15.5Madagascar 11.7 9.9 11.2 9.7 9.6 9.6 10.1 10.4 11.2 11.7 12.1 12.3Malawi 16.4 19.4 21.8 18.4 18.3 21.6 21.8 21.1 20.8 21.8 21.9 21.4Mali 15.0 15.1 15.2 14.0 14.4 14.5 14.9 16.4 16.7 18.5 19.4 18.7Mauritius 18.6 20.5 21.2 20.7 20.8 21.0 20.5 21.1 20.6 22.5 22.5 22.5Mozambique 12.7 15.6 17.9 19.8 21.9 26.2 27.5 25.0 24.0 25.1 22.1 22.0Namibia 29.3 31.5 28.4 31.2 32.5 33.1 34.5 34.9 31.8 33.6 32.4 30.5Niger 13.7 14.3 13.6 14.2 15.3 16.6 17.6 18.0 14.4 14.2 15.2 15.5Nigeria 21.2 10.1 12.4 17.7 14.3 11.0 10.5 7.6 5.6 6.0 7.6 7.3Rwanda 12.7 12.4 12.8 13.9 15.5 16.2 16.5 18.4 18.4 18.1 18.5 18.0São Tomé & Príncipe 32.1 17.4 18.5 20.2 16.8 20.6 15.1 16.5 14.5 16.3 15.1 15.3Senegal 20.8 19.0 19.6 20.5 20.5 20.0 21.5 22.2 24.0 21.3 22.8 22.6Seychelles 36.5 32.9 34.2 37.2 36.7 33.8 34.3 33.4 36.6 38.2 37.0 36.3Sierra Leone 8.8 9.1 9.9 11.4 11.3 10.7 9.8 10.8 11.9 12.6 13.6 13.6South Africa 27.5 26.5 26.4 26.8 26.9 27.3 27.6 28.1 28.6 28.4 29.0 29.3South Sudan ... ... ... 22.7 10.8 15.4 20.8 14.6 33.6 40.0 42.7 42.7Swaziland 29.6 29.0 20.8 20.6 30.4 29.1 29.5 27.6 23.3 25.8 23.4 22.2Tanzania 10.8 12.1 12.0 12.3 12.7 13.1 13.3 13.7 14.7 15.0 14.8 15.1Togo 15.1 14.9 16.7 16.2 17.8 18.1 18.3 19.5 18.8 18.2 19.8 19.5Uganda 12.2 10.8 10.6 12.8 11.6 11.6 12.3 13.5 13.9 14.4 14.8 15.5Zambia 15.2 13.3 14.2 17.1 17.0 16.2 18.1 18.6 18.0 17.5 17.9 17.8Zimbabwe2 6.2 11.2 21.8 24.2 24.9 24.6 23.8 24.3 21.7 22.5 23.0 22.8
Sub-Saharan Africa 23.3 19.0 20.4 22.9 21.7 20.0 19.1 17.4 16.4 17.0 17.8 17.5Median 15.5 15.0 17.1 17.1 17.5 18.1 17.6 18.0 18.0 17.6 18.4 18.0
Excluding Nigeria and South Africa 21.5 19.8 21.7 23.7 23.7 22.5 21.6 19.4 17.4 17.2 17.8 17.9
Oil-exporting countries 25.2 16.3 18.8 24.1 21.2 17.8 16.2 12.0 9.2 9.8 11.3 10.7 Excluding Nigeria 33.7 28.8 33.4 36.2 35.8 32.4 29.4 23.3 17.9 16.7 18.4 18.3Oil-importing countries 22.2 20.8 21.6 22.0 22.1 21.8 21.8 21.8 21.3 21.5 21.7 21.8
Excluding South Africa 16.4 15.9 16.7 17.2 17.9 17.8 18.0 17.9 17.3 17.4 17.7 17.7
Middle-income countries 25.5 20.4 21.6 24.5 23.1 21.0 20.0 17.9 16.8 17.5 18.5 18.1Excluding Nigeria and South Africa 27.4 24.7 26.6 29.2 29.5 27.4 26.1 22.7 19.5 18.8 19.6 19.6
Low-income countries 12.3 12.6 14.3 15.4 15.2 15.5 15.6 15.4 15.0 15.2 15.6 15.7Excluding low-income countries in fragile situations 12.7 12.7 13.5 14.1 14.6 15.4 15.3 15.5 15.6 15.7 15.7 16.0
Countries in fragile situations 15.5 15.0 17.8 18.5 18.7 18.3 17.9 16.2 15.4 15.6 16.5 16.6
CFA franc zone 20.8 19.6 19.9 20.5 21.9 21.5 20.4 18.7 17.3 17.3 18.2 18.3CEMAC 24.6 22.5 22.7 24.6 25.6 24.9 23.2 19.1 16.1 16.0 17.2 17.3WAEMU 16.7 16.6 16.9 15.6 17.6 17.8 17.5 18.4 18.2 18.3 18.9 19.0
COMESA (SSA members) 15.0 14.3 15.8 16.2 16.5 16.4 16.7 16.7 16.0 15.9 16.2 16.3EAC-5 14.5 14.3 14.7 15.2 15.2 15.5 15.8 16.1 16.4 16.5 16.6 16.8ECOWAS 19.5 11.6 13.3 17.3 15.0 12.5 12.0 9.9 8.9 9.7 11.1 10.8SACU 28.2 27.2 26.7 27.2 27.7 28.0 28.4 28.6 28.9 28.8 29.1 29.4SADC 27.2 25.4 26.7 28.2 28.4 27.5 26.9 25.3 23.6 23.2 23.9 24.0
Table SA10. Government Revenue, Excluding Grants(Percent of GDP)

STATISTICAL APPENDIX
103
2004-08 2009 2010 2011 2012 2013 2014 2015 2016 2017 2018 2019Angola 41.1 41.9 40.0 40.2 41.8 40.5 41.9 30.6 23.4 22.0 20.1 20.4Benin 19.4 23.2 19.2 20.1 19.5 20.4 19.4 24.9 21.3 24.4 23.6 21.1Botswana 37.6 51.4 42.1 36.4 35.8 32.0 34.7 35.8 33.1 32.3 31.8 29.3Burkina Faso 23.3 24.2 24.4 23.0 25.5 28.4 23.5 23.1 24.5 29.9 28.1 27.0Burundi 38.1 38.0 40.8 42.2 37.5 33.2 31.8 27.2 21.2 22.4 22.8 23.0Cabo Verde 31.8 33.4 39.2 33.3 34.7 33.8 30.5 31.4 30.1 31.4 33.0 34.0Cameroon 14.5 15.7 16.0 18.6 17.8 20.0 20.8 20.9 21.2 19.2 17.9 17.8Central African Rep. 14.9 16.6 18.6 15.7 16.4 14.9 12.7 14.9 12.6 14.3 15.0 15.4Chad 14.8 24.1 24.4 22.4 23.9 22.8 22.0 18.3 14.5 15.0 14.7 14.9Comoros 21.9 23.0 22.1 22.1 25.3 25.2 24.3 27.3 30.6 31.5 30.2 30.3Congo, Dem. Rep. of 9.6 12.6 16.5 14.6 14.5 12.7 18.5 17.0 12.7 12.9 11.1 11.1Congo, Rep. of 28.0 25.3 21.1 26.1 35.2 50.1 56.4 53.2 50.0 30.3 23.8 23.2Côte d'Ivoire 19.6 19.9 20.0 18.2 22.3 21.9 21.0 22.8 23.3 23.4 23.1 23.0Equatorial Guinea 17.4 39.8 31.2 27.5 35.2 29.3 32.0 45.1 30.7 22.7 19.9 18.2Eritrea 47.1 30.6 35.1 33.9 31.0 30.8 30.0 29.6 29.6 29.2 28.3 27.9Ethiopia1 21.5 17.1 18.5 18.2 16.6 17.8 17.5 17.3 18.2 18.2 17.6 17.9Gabon 20.2 22.6 23.1 21.7 23.9 34.7 23.8 22.3 21.8 19.2 18.2 18.5Gambia, The 20.6 23.1 23.6 26.0 29.8 27.0 28.0 29.7 29.8 34.3 34.9 30.7Ghana 22.1 23.6 26.8 26.6 29.8 28.7 29.4 25.0 26.1 22.5 23.0 21.7Guinea 11.2 16.2 20.5 16.0 20.0 18.6 20.2 21.8 16.4 17.1 20.2 20.5Guinea-Bissau 23.6 22.1 20.5 18.2 13.8 13.2 24.7 23.4 20.9 18.8 21.2 22.2Kenya 21.6 23.1 24.2 23.6 24.2 25.4 27.2 27.3 27.2 27.2 26.5 25.0Lesotho 41.9 60.4 51.0 55.4 53.6 54.0 49.5 48.2 47.3 46.3 43.2 41.9Liberia 15.9 33.3 32.6 29.2 30.3 33.0 32.3 36.1 35.5 35.1 34.5 33.4Madagascar 20.9 14.1 14.0 14.1 13.4 14.9 14.7 15.1 16.0 18.5 18.0 20.1Malawi 28.6 30.5 30.0 26.1 28.9 34.7 29.8 31.0 31.1 32.4 28.9 27.6Mali 21.2 22.8 20.3 20.6 15.5 19.7 20.0 20.9 22.2 23.0 23.9 23.3Mauritius 22.6 25.6 25.1 24.6 23.3 24.9 23.9 24.6 24.9 27.3 27.3 27.3Mozambique 22.5 28.9 29.9 32.2 30.8 34.1 42.5 35.2 32.4 32.1 30.9 34.0Namibia 27.4 31.9 33.1 38.4 35.0 36.6 40.6 43.2 40.9 39.8 40.1 40.0Niger 21.3 23.9 20.6 19.4 22.5 27.2 31.1 32.5 26.6 26.4 28.2 28.8Nigeria 16.5 15.5 16.6 17.4 14.1 13.4 12.7 11.1 9.5 11.7 12.4 11.9Rwanda 22.5 23.5 25.3 26.2 25.7 26.8 28.3 27.4 25.8 25.4 25.3 24.0São Tomé & Príncipe 40.0 51.9 49.9 52.2 46.2 31.5 30.5 34.3 32.1 33.1 30.6 30.9Senegal 25.3 26.6 27.0 28.8 28.5 28.1 29.8 29.9 31.0 28.6 29.0 28.2Seychelles 38.3 32.1 34.6 36.3 38.6 37.8 33.8 32.4 37.7 39.1 38.2 36.6Sierra Leone 16.4 17.5 20.2 21.5 20.3 15.7 17.6 20.7 23.3 24.3 24.0 22.0South Africa 27.4 31.7 31.4 30.9 31.4 31.6 31.9 32.9 32.7 32.9 33.2 33.4South Sudan ... ... ... 21.0 31.6 25.3 36.4 41.3 55.0 42.9 47.5 46.8Swaziland 28.8 32.4 29.8 24.4 27.0 28.8 32.2 32.7 34.5 34.4 31.5 28.8Tanzania 18.0 20.2 20.2 19.1 19.8 19.4 17.9 17.8 17.7 18.6 20.2 20.8Togo 17.7 20.0 20.9 25.5 26.7 26.7 27.5 30.7 31.2 21.2 27.0 24.1Uganda 18.1 15.3 18.8 17.2 16.6 16.7 18.2 19.4 19.9 19.0 21.4 23.0Zambia 21.0 17.8 18.1 19.5 21.5 23.8 24.6 28.1 24.0 25.2 26.6 25.8Zimbabwe2 9.7 13.7 21.2 24.7 24.8 26.2 25.2 25.3 30.2 32.1 26.2 24.7
Sub-Saharan Africa 22.9 24.5 24.8 24.9 24.2 23.8 23.6 22.5 21.5 22.5 22.5 22.0Median 21.5 23.6 23.9 24.4 25.5 26.8 27.5 27.3 26.1 25.4 26.2 24.1
Excluding Nigeria and South Africa 23.4 25.7 25.8 25.8 26.9 27.2 28.0 25.8 23.8 23.1 22.6 22.4
Oil-exporting countries 20.2 21.4 21.1 22.0 20.7 20.2 19.7 16.5 14.0 15.2 14.9 14.4 Excluding Nigeria 28.0 33.3 31.3 31.0 34.6 34.9 36.0 30.4 24.5 21.7 19.8 19.8Oil-importing countries 24.5 26.7 27.4 27.0 27.0 27.0 27.3 27.4 26.8 27.0 27.0 26.8
Excluding South Africa 21.4 22.4 23.4 23.1 23.3 23.6 24.3 24.1 23.5 23.6 23.5 23.2
Middle-income countries 23.7 25.6 25.5 25.7 25.0 24.5 24.0 22.7 21.8 23.0 22.9 22.2Excluding Nigeria and South Africa 26.5 29.8 28.8 29.2 31.2 31.6 32.3 29.1 26.4 24.8 23.9 23.4
Low-income countries 18.6 19.8 21.1 20.6 20.7 21.0 22.2 21.9 20.5 20.9 20.9 21.1Excluding low-income countries in fragile situations 20.1 20.2 20.9 20.6 20.3 21.3 21.5 20.9 20.3 20.8 21.3 21.7
Countries in fragile situations 18.3 19.9 21.0 20.8 22.7 23.2 25.1 24.5 22.7 22.0 21.2 20.9
CFA franc zone 19.5 23.4 22.0 22.2 24.5 26.5 26.0 26.3 24.7 23.0 22.4 22.0CEMAC 17.8 24.1 22.2 22.6 26.1 29.1 28.4 27.9 24.4 20.2 18.4 18.2WAEMU 21.3 22.6 21.8 21.7 22.6 23.8 23.5 25.0 24.8 25.0 25.2 24.6
COMESA (SSA members) 20.3 19.4 21.3 20.8 20.6 21.3 22.4 22.5 22.0 22.5 21.9 21.6EAC-5 20.2 20.9 22.3 21.4 21.6 22.0 22.6 23.0 22.9 23.1 23.7 23.3ECOWAS 17.7 17.4 18.3 18.8 16.6 16.2 15.3 14.3 13.9 15.7 16.4 15.7SACU 27.9 32.5 31.9 31.4 31.7 31.9 32.4 33.5 33.1 33.2 33.4 33.5SADC 27.7 31.2 30.8 30.6 31.1 31.0 31.7 30.0 28.0 28.2 28.0 28.1
Table SA11. Government Expenditure(Percent of GDP)
See sources and footnotes on page 91.

REGIONAL ECONOMIC OUTLOOK: SUB-SAHARAN AFRICA
104
See sources and footnotes on page 91.
2004-08 2009 2010 2011 2012 2013 2014 2015 2016 2017 2018 2019Angola 27.8 22.7 44.3 33.8 29.9 32.9 40.7 64.6 79.8 65.3 73.0 71.6Benin 24.4 25.6 28.7 29.9 26.7 25.3 30.5 42.4 49.7 54.6 55.1 52.6Botswana 7.7 17.9 20.4 20.4 19.1 17.4 17.3 16.3 15.5 15.6 14.9 12.8Burkina Faso 32.8 29.1 30.7 28.1 28.2 28.8 30.4 35.8 38.3 38.3 41.0 41.3Burundi 134.4 25.7 46.9 42.7 41.4 36.1 35.8 45.3 47.2 56.7 65.1 69.4Cabo Verde 73.8 65.2 72.4 78.8 91.1 102.5 115.9 126.0 129.5 126.0 124.7 126.7Cameroon 29.9 12.0 14.7 15.7 15.4 18.2 21.5 30.9 31.5 33.8 34.3 34.1Central African Rep. 69.6 21.1 21.4 21.8 23.5 38.5 69.2 64.0 56.0 53.4 48.6 44.4Chad 25.8 31.6 30.1 30.6 28.8 30.5 41.5 43.8 52.4 52.5 48.1 45.4Comoros 65.1 53.6 50.7 45.7 42.6 17.8 22.6 25.9 31.7 28.4 28.4 28.5Congo, Dem. Rep. of 101.6 84.5 30.9 24.5 22.7 20.0 17.5 16.1 16.8 15.7 14.5 13.3Congo, Rep. of 119.1 63.3 22.2 23.8 28.6 34.2 47.6 97.1 114.6 119.1 110.4 105.0Côte d'Ivoire 76.6 64.2 63.0 69.2 45.0 43.4 44.8 47.3 47.0 46.4 48.0 46.9Equatorial Guinea 2.0 4.3 7.9 7.2 7.1 6.3 12.7 36.4 47.9 42.7 45.6 48.4Eritrea 158.4 144.6 143.8 132.4 128.3 127.5 128.7 132.5 132.8 131.2 129.4 127.3Ethiopia1 67.9 37.8 40.5 45.3 37.7 42.9 46.8 54.0 55.0 56.2 58.3 56.7Gabon 41.7 26.0 21.3 21.4 21.4 31.1 34.1 44.7 64.2 61.1 59.3 59.3Gambia, The 107.3 62.6 69.6 77.3 77.0 89.1 104.9 105.3 118.5 123.2 111.4 105.2Ghana 39.2 36.1 46.3 42.6 47.9 57.2 70.2 72.2 73.4 71.8 69.1 65.9Guinea 79.9 61.3 68.8 58.1 27.2 34.0 35.1 42.1 42.9 39.7 43.7 44.7Guinea-Bissau 197.5 159.0 68.3 49.8 53.1 53.7 54.9 50.3 48.8 42.0 40.1 37.6Kenya 45.2 41.1 44.4 43.0 43.9 44.0 48.6 51.6 53.5 55.6 58.1 56.9Lesotho 48.2 35.3 31.4 33.2 35.3 37.2 36.8 41.2 35.4 34.7 39.5 41.7Liberia 357.1 113.2 21.7 19.3 17.6 17.9 21.6 25.8 28.3 34.4 38.7 39.1Madagascar 56.6 33.7 31.7 32.2 33.0 33.9 34.7 35.5 38.4 37.3 37.2 38.0Malawi 62.9 35.6 29.6 30.6 43.9 59.3 55.2 61.1 60.3 59.3 57.8 57.6Mali 29.2 21.9 25.3 24.0 25.4 26.4 27.3 30.7 35.9 35.6 35.9 36.6Mauritius 47.3 50.8 52.0 52.2 51.5 53.9 57.5 60.2 60.1 60.2 59.9 59.1Mozambique 49.7 41.9 43.3 38.0 40.1 53.1 62.4 88.1 118.8 102.2 110.1 116.6Namibia 24.1 15.9 16.3 27.4 24.6 25.0 25.2 40.3 44.8 46.1 52.4 58.5Niger 43.3 27.7 24.3 27.8 26.9 26.3 32.0 41.0 45.1 46.5 46.2 47.5Nigeria 15.8 8.6 9.6 12.1 12.7 12.9 13.1 16.0 19.6 23.4 26.8 27.4Rwanda 45.2 19.5 20.0 19.9 20.0 26.7 29.1 33.4 37.3 40.6 41.3 43.1São Tomé & Príncipe 207.5 72.4 79.5 78.0 81.0 71.1 69.6 86.0 94.0 83.3 76.9 72.2Senegal 32.5 34.2 35.5 40.7 42.8 46.9 54.5 56.9 60.4 61.2 60.6 58.8Seychelles 155.7 106.1 82.2 82.5 80.1 68.2 72.7 68.0 69.0 63.3 58.5 53.7Sierra Leone 94.1 48.1 46.8 44.8 36.8 30.5 35.0 45.3 54.9 58.4 63.7 64.0South Africa 30.5 30.1 34.7 38.2 41.0 44.1 47.0 49.3 51.6 52.7 54.9 55.7South Sudan ... ... ... 0.0 8.9 17.6 38.3 69.3 86.5 66.3 51.0 48.6Swaziland 14.1 10.2 13.7 14.2 14.8 15.3 14.3 18.4 24.8 29.2 36.2 41.0Tanzania 33.5 24.4 27.3 27.8 29.2 30.9 33.8 37.2 38.0 38.2 39.3 40.7Togo 92.7 80.6 46.7 47.2 47.2 55.7 60.4 72.2 81.6 78.6 75.6 70.6Uganda 39.4 19.2 22.4 23.4 24.6 27.7 30.8 33.5 37.2 39.0 41.5 44.5Zambia 54.4 20.5 18.9 20.8 25.4 27.1 36.1 62.3 60.7 62.2 65.5 68.0Zimbabwe2 51.5 71.7 59.3 48.3 45.3 48.3 49.6 51.9 69.8 78.4 75.2 72.6
Sub-Saharan Africa 33.3 26.3 27.9 28.5 28.5 30.1 32.4 38.9 44.0 45.9 48.1 47.6Median 49.0 34.8 31.5 32.2 29.9 33.9 36.8 45.3 51.6 53.4 52.4 52.6
Excluding Nigeria and South Africa 47.0 34.8 35.7 32.8 32.0 35.0 40.0 50.2 54.7 53.5 55.2 54.7
Oil-exporting countries 21.5 13.2 16.2 16.3 16.3 17.5 19.8 27.3 34.0 36.4 39.3 38.3 Excluding Nigeria 33.6 22.4 31.2 24.2 23.8 27.3 35.3 56.5 67.7 60.2 63.4 62.1Oil-importing countries 40.8 35.5 36.2 37.8 38.2 40.9 44.1 48.4 50.9 51.7 53.4 53.5
Excluding South Africa 52.4 40.1 37.7 37.3 35.8 38.6 42.2 47.8 50.5 51.2 52.5 52.4
Middle-income countries 28.5 23.0 26.4 27.9 27.9 29.1 31.0 37.3 42.8 45.2 47.6 47.0Excluding Nigeria and South Africa 39.7 30.6 36.0 33.6 32.3 35.4 41.3 54.7 60.2 57.4 59.6 58.6
Low-income countries 58.4 40.9 35.2 31.6 31.5 34.3 38.3 44.8 48.0 48.4 49.6 49.7Excluding low-income countries in fragile situations 43.6 29.3 31.1 32.2 31.1 35.0 39.1 46.8 49.8 50.2 52.3 52.7
Countries in fragile situations 79.9 59.1 43.3 36.5 33.9 35.3 39.5 45.8 48.8 49.2 49.3 48.6
CFA franc zone 44.8 33.0 29.4 29.8 26.8 29.3 34.5 44.6 49.6 49.8 49.9 49.0CEMAC 38.6 22.0 17.8 18.1 18.3 22.0 28.9 43.9 51.6 52.0 51.1 50.2WAEMU 51.6 44.2 42.1 43.7 36.5 37.2 40.4 45.3 48.1 48.2 49.0 48.1
COMESA (SSA members) 59.4 42.3 36.9 36.2 36.0 37.9 41.2 46.7 49.3 51.2 53.0 52.8EAC-5 42.1 29.8 33.2 32.8 33.9 35.5 39.1 42.8 45.0 47.0 49.2 49.7ECOWAS 27.5 18.6 18.4 20.1 19.2 20.2 20.7 24.4 29.8 33.5 36.1 35.7SACU 29.4 29.1 33.5 37.0 39.4 42.1 44.6 47.3 49.2 50.4 52.7 53.6SADC 34.0 31.3 34.9 35.5 36.4 38.7 42.1 49.3 53.6 52.2 54.9 55.3
Table SA12. Government Debt(Percent of GDP)

STATISTICAL APPENDIX
105
2004-08 2009 2010 2011 2012 2013 2014 2015 2016 2017 2018 2019Angola 21.9 42.5 35.3 37.6 35.4 36.5 41.0 46.4 41.8 31.0 25.1 25.8Benin 25.0 33.1 35.3 36.2 34.4 37.0 41.3 42.9 41.5 39.8 46.4 46.8Botswana 46.7 52.7 46.9 37.5 36.1 32.1 27.3 27.9 27.3 27.7 26.7 26.2Burkina Faso 20.4 25.9 27.4 27.5 28.4 30.5 32.1 38.0 39.1 41.5 43.7 46.0Burundi 22.3 24.3 27.5 25.7 25.4 23.5 23.0 22.5 21.8 20.7 23.5 22.8Cabo Verde 75.1 77.5 80.1 78.5 82.1 89.4 95.6 98.9 104.1 102.2 102.5 101.9Cameroon 17.7 20.0 21.2 21.9 20.7 21.3 21.8 22.5 22.7 23.3 23.5 23.5Central African Rep. 15.9 16.1 17.8 19.2 18.3 28.5 29.1 27.5 26.2 24.6 24.0 24.1Chad 8.9 11.0 11.4 12.0 12.4 13.3 15.6 15.9 15.8 16.3 16.6 17.0Comoros 26.0 30.4 34.1 34.9 38.3 36.9 38.2 43.5 45.8 45.8 45.8 45.8Congo, Dem. Rep. of 6.6 10.1 10.5 10.6 11.6 11.5 11.8 12.1 12.5 13.3 15.4 15.4Congo, Rep. of 17.1 23.3 23.3 27.2 33.1 33.5 37.7 46.1 42.7 39.1 38.1 37.0Côte d'Ivoire 11.3 14.1 15.7 18.7 15.3 14.9 15.0 15.6 15.2 17.2 19.7 21.1Equatorial Guinea 6.4 10.5 12.3 10.6 14.8 16.7 14.7 19.3 19.2 19.1 19.7 21.5Eritrea 130.2 121.6 123.2 114.6 111.8 113.3 113.5 96.1 100.8 101.4 101.8 101.7Ethiopia1 34.6 24.8 27.0 27.6 25.3 27.1 28.1 28.5 28.9 31.7 31.4 31.4Gabon 17.0 20.3 19.5 20.5 23.2 24.8 24.4 25.4 24.7 23.9 24.8 26.2Gambia, The 39.0 48.7 49.9 55.7 54.5 56.6 58.6 52.3 55.0 58.7 58.6 57.9Ghana 22.8 28.0 29.9 30.4 30.0 28.8 32.5 33.9 33.9 32.3 32.3 32.7Guinea 13.6 18.4 26.4 25.1 22.2 22.6 23.8 26.9 25.5 24.5 24.5 24.5Guinea-Bissau 20.3 25.3 28.8 35.3 32.6 32.7 46.4 49.2 47.5 32.7 33.9 35.3Kenya 35.7 36.5 40.1 40.6 34.5 35.5 37.0 36.0 33.0 30.9 30.2 32.5Lesotho 28.6 35.5 36.3 32.2 31.6 34.1 30.8 31.3 31.1 31.2 29.4 27.2Liberia 13.0 20.2 22.7 26.8 23.3 22.2 22.2 22.3 20.5 19.9 19.9 19.9Madagascar 23.6 24.5 24.7 26.1 25.7 25.2 25.4 26.2 28.4 29.8 29.6 29.9Malawi 15.8 19.8 22.1 25.1 25.7 26.0 24.5 24.3 22.9 24.0 24.0 24.0Mali 25.6 24.7 24.5 24.4 27.0 28.2 27.8 28.9 28.8 29.0 31.6 32.2Mauritius 98.5 99.5 100.4 98.8 100.5 99.8 102.9 108.5 110.6 115.6 115.6 115.6Mozambique 17.0 24.2 24.7 27.7 30.6 33.4 38.5 42.1 37.0 34.3 34.1 34.1Namibia 40.8 63.2 62.6 64.0 57.2 56.7 53.6 55.5 53.4 54.1 54.1 54.1Niger 13.7 17.6 19.5 19.5 21.9 22.6 26.2 26.1 27.1 26.8 27.1 27.4Nigeria 16.0 24.3 20.8 18.8 21.3 19.3 20.9 20.9 22.8 20.7 20.3 20.5Rwanda 16.6 17.2 18.3 20.0 19.8 20.9 22.4 24.8 23.9 23.6 24.9 26.1São Tomé & Príncipe 33.4 37.1 38.7 38.0 39.0 38.3 38.8 40.3 34.6 32.4 32.4 32.4Senegal 34.7 36.9 39.7 40.0 39.9 42.6 46.0 48.9 50.8 50.8 51.3 51.3Seychelles 84.6 55.5 62.1 60.2 52.0 58.3 69.1 66.4 71.7 78.5 79.0 79.0Sierra Leone 16.7 22.6 23.5 23.1 21.9 19.8 21.7 24.0 25.1 25.2 25.8 25.5South Africa 72.5 77.7 75.8 74.6 72.9 71.0 70.8 73.5 72.6 72.6 72.6 72.6South Sudan ... ... ... 9.5 19.8 14.7 17.6 38.2 28.8 21.3 24.5 22.7Swaziland 19.3 25.1 25.3 24.8 24.7 26.2 25.0 26.4 29.5 29.0 29.2 32.5Tanzania 21.8 23.3 25.1 24.7 23.8 22.7 23.3 24.3 21.9 21.4 21.1 21.0Togo 30.0 36.8 39.8 43.4 44.1 47.7 46.7 51.5 54.2 56.0 56.0 56.0Uganda 18.5 17.9 21.7 19.8 19.8 19.9 21.0 20.9 21.9 22.5 23.4 24.3Zambia 18.0 17.8 18.4 19.1 19.6 20.5 20.9 25.8 20.6 20.8 23.2 24.1Zimbabwe2 10.8 16.5 23.1 25.7 26.5 25.5 27.6 29.5 34.5 46.0 44.8 45.7
Sub-Saharan Africa 34.7 39.0 37.3 36.2 36.1 35.0 35.8 37.2 37.0 35.9 35.6 35.9Median 21.1 24.6 25.8 26.8 26.5 28.2 27.8 28.9 28.9 29.8 29.4 29.9
Excluding Nigeria and South Africa 24.5 28.4 29.1 29.1 28.4 28.8 30.2 32.2 31.0 30.2 30.1 30.6
Oil-exporting countries 16.4 25.6 22.2 20.8 22.9 21.7 23.5 24.9 25.5 22.4 21.5 21.8 Excluding Nigeria 17.4 28.8 26.0 25.6 26.9 27.7 30.2 35.1 32.4 27.0 24.7 25.1Oil-importing countries 46.3 48.5 48.4 47.7 45.8 44.8 45.0 46.3 45.1 45.0 45.0 45.0
Excluding South Africa 26.7 28.3 30.1 30.3 29.0 29.2 30.2 31.3 30.6 31.1 31.5 32.1
Middle-income countries 37.9 43.3 40.7 39.6 39.4 37.9 38.7 40.1 40.1 38.4 37.9 38.2Excluding Nigeria and South Africa 26.5 33.0 32.7 33.4 31.8 32.2 33.9 36.3 34.5 32.1 31.3 32.2
Low-income countries 22.1 22.8 24.7 24.2 24.6 24.9 26.1 27.6 27.3 28.2 28.8 29.1Excluding low-income countries in fragile situations 23.5 23.0 25.2 25.2 24.6 25.3 26.9 28.0 27.3 28.1 28.5 28.9
Countries in fragile situations 18.2 20.9 22.5 22.5 23.7 23.3 24.1 26.2 25.9 26.7 27.8 28.1
CFA franc zone 17.6 20.8 22.1 23.2 23.6 24.9 26.0 28.2 28.2 28.5 30.0 30.8CEMAC 14.2 17.2 18.1 18.8 20.4 21.7 22.4 24.9 24.4 24.0 24.3 24.7WAEMU 20.9 24.2 25.9 27.5 26.8 27.9 29.2 31.1 31.3 32.0 34.2 35.1
COMESA (SSA members) 29.9 28.5 30.7 30.8 29.0 29.6 30.4 30.9 30.6 31.8 32.1 32.8EAC-5 26.3 26.7 29.7 29.3 26.7 26.7 27.8 27.9 26.1 25.2 25.1 26.2ECOWAS 17.6 24.7 22.6 21.4 23.1 21.7 23.4 23.9 25.4 24.0 24.3 24.8SACU 69.7 75.4 73.4 71.8 70.0 67.9 67.4 69.9 69.0 69.0 68.9 68.9SADC 53.3 58.5 56.4 55.6 54.0 52.5 52.7 55.1 53.3 52.1 51.2 51.1
Table SA13. Broad Money(Percent of GDP)
See sources and footnotes on page 91.

REGIONAL ECONOMIC OUTLOOK: SUB-SAHARAN AFRICA
106
See sources and footnotes on page 91.
2004-08 2009 2010 2011 2012 2013 2014 2015 2016 2017 2018 2019Angola 64.6 21.5 5.3 37.1 4.9 14.1 16.2 11.8 14.3 –2.1 14.6 21.2Benin 15.4 9.1 9.9 9.6 7.2 17.0 18.3 6.1 0.4 1.1 27.0 10.2Botswana 17.4 –1.3 4.9 –3.1 0.7 1.3 –0.7 2.0 14.3 5.6 4.5 6.9Burkina Faso 13.7 23.8 19.0 14.2 16.6 10.9 9.3 19.3 11.8 15.6 13.9 13.9Burundi 21.1 19.8 29.4 5.7 18.0 9.7 11.3 1.5 6.4 7.9 33.4 21.6Cabo Verde 12.5 3.5 5.4 4.6 6.3 11.4 7.4 6.3 8.4 2.2 6.0 5.0Cameroon 10.5 6.9 11.3 10.6 1.4 10.8 10.8 9.2 5.5 5.9 5.6 5.6Central African Rep. 7.5 11.7 16.1 13.8 1.6 5.6 14.6 5.3 5.8 1.1 4.9 8.0Chad 23.6 –4.6 25.3 14.2 13.4 8.6 26.5 –4.7 –7.7 –0.9 7.6 7.8Comoros 7.6 13.3 19.4 9.6 16.0 2.8 8.1 17.1 10.3 3.8 5.4 5.3Congo, Dem. Rep. of 52.5 49.7 30.9 22.9 21.8 18.6 12.6 10.5 22.2 46.6 49.5 18.5Congo, Rep. of 30.1 5.3 37.6 34.5 21.1 0.7 13.1 –11.2 –15.4 –2.0 9.2 0.3Côte d'Ivoire 12.0 24.4 19.3 17.2 –7.6 9.7 13.8 17.0 7.0 23.4 24.2 16.6Equatorial Guinea 30.7 29.9 33.5 7.7 57.8 7.3 –14.1 –10.9 –16.4 2.9 0.9 6.4Eritrea 11.2 15.7 15.6 14.6 14.3 16.5 12.9 –5.1 18.2 16.8 16.0 14.7Ethiopia1 18.1 19.9 24.4 36.5 32.9 24.2 26.9 24.2 20.4 28.8 20.0 18.9Gabon 14.2 2.2 19.2 26.5 15.7 6.1 1.6 –1.4 –5.2 2.8 11.3 9.0Gambia, The 16.5 19.4 13.7 11.0 7.8 15.1 11.2 –0.9 15.3 19.3 11.0 9.1Ghana 31.3 26.0 34.4 32.2 24.3 19.1 36.8 26.1 22.0 16.7 17.9 18.0Guinea 35.5 25.9 74.4 9.4 1.0 14.1 12.3 20.3 9.9 11.7 14.0 14.0Guinea-Bissau 27.1 4.9 22.9 50.7 –10.0 2.8 42.8 24.8 8.8 –21.8 10.8 12.3Kenya 14.9 16.0 21.6 19.1 –3.0 14.5 18.6 12.8 4.8 7.5 8.8 20.4Lesotho 16.8 17.9 14.5 1.0 7.3 21.2 4.0 12.6 5.5 10.0 1.6 0.0Liberia 33.5 30.2 27.4 41.4 –1.4 7.8 2.1 1.7 –5.2 –2.5 1.4 6.1Madagascar 17.2 10.2 9.6 16.4 6.9 5.3 11.1 14.6 20.1 18.1 12.5 14.2Malawi 27.6 23.9 33.9 35.7 22.9 35.1 20.7 23.7 15.2 20.6 12.6 11.6Mali 5.6 16.0 9.0 15.3 15.2 7.4 7.1 13.2 7.3 7.4 16.0 8.3Mauritius 13.0 2.4 6.9 6.4 8.2 5.8 8.7 10.2 9.1 9.3 7.4 9.8Mozambique 22.2 34.6 17.6 23.9 25.6 21.2 27.3 21.7 2.4 7.9 8.4 8.3Namibia 17.3 59.6 8.7 11.6 6.0 13.7 6.9 10.2 4.9 6.3 7.0 9.2Niger 16.2 20.3 23.4 6.8 31.3 10.2 24.5 4.6 8.7 6.1 10.1 8.6Nigeria 37.2 17.1 6.9 4.0 29.1 1.0 20.4 5.9 17.4 1.6 13.6 17.6Rwanda 23.6 13.0 16.9 26.7 14.1 15.8 18.8 21.1 7.6 12.3 16.5 18.8São Tomé & Príncipe 29.8 8.2 25.1 10.4 20.3 13.9 16.8 13.1 –4.8 –0.3 8.3 9.7Senegal 9.5 10.9 14.1 6.7 6.8 8.0 11.4 13.4 12.0 9.6 10.2 8.9Seychelles 7.9 7.0 13.5 4.5 –0.6 23.7 26.6 2.9 12.1 16.4 8.2 6.4Sierra Leone 24.5 31.3 28.5 22.6 22.5 16.7 16.6 4.9 17.9 10.1 18.4 14.9South Africa 18.9 1.8 6.9 8.3 5.2 5.8 7.2 10.5 6.1 6.9 6.8 7.1South Sudan ... ... ... ... 34.0 –1.7 21.5 117.4 142.5 67.8 104.5 63.8Swaziland 15.7 26.8 7.9 5.5 10.0 15.9 3.9 13.6 26.4 3.8 4.6 16.8Tanzania 22.0 17.7 25.4 18.2 12.5 10.0 15.6 18.8 2.9 8.6 9.9 11.7Togo 16.9 14.3 15.3 17.3 10.2 16.6 3.7 20.6 12.6 8.3 6.8 7.5Uganda 19.1 16.6 41.5 10.5 14.9 9.5 15.2 11.7 11.1 12.8 13.0 13.9Zambia 25.6 7.7 29.9 21.7 17.9 20.8 12.6 35.2 –5.7 13.5 29.1 17.6Zimbabwe2 1.4 340.0 68.6 33.1 19.9 4.6 12.6 8.2 17.5 44.4 8.1 10.8
Sub-Saharan Africa 25.4 14.8 13.5 12.6 15.9 7.7 15.3 11.1 11.4 8.2 13.1 14.0Median 17.4 16.3 19.1 14.2 13.4 10.8 12.6 11.7 8.8 7.9 10.2 10.2
Excluding Nigeria and South Africa 22.7 20.6 21.6 20.9 13.0 13.1 15.7 14.9 10.1 12.7 15.3 14.8
Oil-exporting countries 36.6 16.4 8.8 9.3 24.4 3.4 17.9 6.8 14.8 1.9 13.5 16.7 Excluding Nigeria 35.8 14.6 14.2 25.3 12.9 9.8 11.6 9.1 8.2 2.8 13.3 14.5Oil-importing countries 18.8 13.7 17.0 15.0 10.0 11.0 13.4 14.5 9.1 12.6 12.8 12.3
Excluding South Africa 18.8 22.7 24.2 19.5 13.0 14.2 17.1 16.8 10.7 15.7 15.8 14.9
Middle-income countries 27.0 12.2 10.2 10.4 15.2 6.0 14.6 9.3 10.8 5.1 11.6 13.8Excluding Nigeria and South Africa 25.2 17.0 17.6 20.9 8.6 12.5 14.2 12.6 7.3 7.9 13.2 14.9
Low-income countries 19.7 25.2 26.7 20.9 18.3 13.7 17.5 17.5 13.3 18.2 17.6 14.6Excluding low-income countries in fragile situations 19.1 19.0 25.6 21.3 20.3 15.4 19.9 18.5 10.4 15.7 14.9 14.5
Countries in fragile situations 19.4 30.6 27.3 20.7 11.5 10.2 13.9 13.9 13.5 21.0 22.1 14.3
CFA franc zone 14.8 13.6 18.9 14.8 11.8 8.9 9.9 6.8 2.2 8.5 12.8 9.5CEMAC 18.5 9.2 22.1 16.0 17.7 7.6 6.8 –1.1 –4.6 2.9 6.7 5.9WAEMU 11.5 18.1 15.9 13.5 6.2 10.2 12.9 14.3 8.2 13.0 17.6 12.2
COMESA (SSA members) 19.1 24.7 26.4 22.0 14.8 16.1 17.4 17.0 12.1 19.9 17.8 17.2EAC-5 18.6 16.7 26.9 16.9 7.2 11.8 16.7 14.9 5.5 9.2 10.8 15.8ECOWAS 31.3 18.1 11.1 7.7 24.2 4.1 20.0 8.8 15.9 5.0 14.6 16.4SACU 18.7 3.3 7.0 7.8 5.1 6.1 6.8 10.1 6.6 6.8 6.7 7.2SADC 23.6 11.9 11.5 14.5 7.9 9.2 10.2 12.7 7.9 9.0 11.0 10.8
Table SA14. Broad Money Growth(Percent)

STATISTICAL APPENDIX
107
2004-08 2009 2010 2011 2012 2013 2014 2015 2016 2017Angola 71.9 60.5 19.2 28.8 24.2 15.0 1.1 17.6 –0.2 –5.0Benin 17.7 19.5 8.1 12.9 6.0 13.1 6.3 –0.0 7.3 –0.8Botswana 21.1 10.3 11.2 21.9 21.6 13.8 13.7 9.0 9.0 5.6Burkina Faso 14.4 1.7 14.7 23.5 24.1 26.3 18.9 7.0 7.5 8.9Burundi 8.4 25.5 27.0 51.1 2.5 7.8 9.4 6.0 17.3 –13.9Cabo Verde 20.3 11.8 9.0 13.3 –0.6 2.0 –0.9 0.4 3.6 4.0Cameroon 8.2 9.1 8.2 28.3 2.6 14.9 14.4 11.4 7.2 2.3Central African Rep. 8.7 8.7 30.2 19.2 31.0 –18.1 5.4 –2.1 13.2 25.7Chad 17.3 21.0 30.2 24.4 32.1 2.7 40.2 2.3 –5.1 –3.2Comoros 11.4 44.1 25.9 8.9 22.4 12.6 9.6 16.8 7.2 2.2Congo, Dem. Rep. of 91.1 41.1 18.0 17.1 25.2 26.5 23.0 17.4 29.3 15.8Congo, Rep. of 19.1 31.0 50.4 40.6 44.2 17.0 26.3 9.3 7.1 –5.4Côte d'Ivoire 10.0 10.8 8.7 0.4 12.2 22.9 21.7 29.7 15.0 13.4Equatorial Guinea 50.1 13.8 30.6 30.7 –13.6 34.3 18.4 14.1 4.2 0.2Eritrea 6.3 1.2 1.8 14.7 19.8 131.0 35.8 –65.6 7.6 13.1Ethiopia1 42.1 11.0 28.1 25.0 37.7 10.8 19.9 31.0 23.0 30.4Gabon 10.0 –7.9 1.9 42.0 24.1 23.6 –2.0 –9.8 –5.6 –7.5Gambia, The 13.2 10.3 14.8 8.8 4.3 20.5 –7.5 –7.9 –12.3 –1.2Ghana 44.1 16.2 24.8 29.0 32.9 29.0 41.8 24.5 15.4 13.7Guinea 19.2 15.8 43.8 93.4 –3.2 35.0 44.0 27.1 5.9 9.0Guinea-Bissau 61.1 –3.0 36.5 107.0 38.2 –16.1 –6.6 50.1 6.9 –54.0Kenya 19.9 13.9 20.3 30.9 10.4 20.1 22.2 16.0 4.1 2.4Lesotho 28.3 23.9 28.8 25.1 42.2 10.3 11.8 8.2 5.8 10.9Liberia 36.0 31.5 40.1 32.4 11.2 27.2 5.6 8.1 2.3 14.7Madagascar 24.8 6.5 11.2 7.0 4.8 16.2 18.4 16.5 8.2 18.4Malawi 41.2 39.5 52.4 20.5 25.4 14.4 20.0 29.9 4.6 1.4Mali 7.2 11.0 13.5 24.1 4.8 11.7 18.7 19.9 17.6 11.1Mauritius 15.4 0.5 12.5 12.3 17.4 14.2 –2.2 8.7 –0.6 11.8Mozambique 27.5 58.6 29.3 6.4 19.9 15.4 25.2 22.1 14.5 –12.0Namibia 14.7 10.5 9.8 10.4 18.4 13.4 17.9 13.8 8.6 4.5Niger 34.3 16.7 15.2 17.2 16.1 8.7 7.7 12.8 12.7 2.1Nigeria 47.0 22.0 –5.6 2.6 6.6 9.4 18.0 4.6 23.4 –4.2Rwanda 30.2 5.7 10.3 27.5 34.8 11.3 19.3 30.0 9.1 13.9São Tomé & Príncipe 53.5 39.3 35.8 15.4 11.0 –3.3 –1.4 7.3 8.3 3.6Senegal 13.1 3.8 10.1 19.0 10.0 12.6 6.4 7.1 5.9 7.7Seychelles 21.9 –9.2 23.6 5.2 8.5 4.5 26.2 7.8 10.3 17.8Sierra Leone 35.5 45.4 31.5 21.8 –6.9 11.9 5.4 9.1 16.7 11.5South Africa 19.4 2.0 3.1 6.7 9.3 7.1 7.2 8.0 4.7 4.4South Sudan ... ... ... –34.0 125.7 45.4 49.8 51.2 221.5 32.9Swaziland 21.4 13.1 –0.5 26.0 –1.7 20.2 9.8 4.2 11.6 3.9Tanzania 35.8 9.6 20.0 27.2 18.2 15.3 19.4 24.8 7.2 1.7Togo 19.5 13.6 19.4 43.6 19.3 27.6 –0.2 17.3 15.3 –4.1Uganda 27.5 17.3 41.8 28.3 11.8 6.2 14.1 15.1 6.4 15.8Zambia 43.2 –5.7 15.4 28.2 37.0 12.6 26.4 29.3 –9.4 6.4Zimbabwe2 5.8 388.2 143.3 62.8 27.1 3.7 4.7 –2.3 –3.6 10.3
Sub-Saharan Africa 30.7 16.2 8.3 13.0 13.3 12.5 15.5 11.4 12.5 3.3Median 20.7 13.3 19.3 23.5 18.2 13.8 14.4 11.4 7.3 4.5
Excluding Nigeria and South Africa 28.7 20.6 21.7 23.7 19.8 17.2 17.7 17.4 9.6 7.4
Oil-exporting countries 43.8 24.7 0.6 7.8 10.3 11.8 16.2 6.9 18.7 –3.5 Excluding Nigeria 36.8 31.8 19.5 21.8 20.6 18.2 11.5 13.4 7.3 –1.8Oil-importing countries 23.2 10.6 14.3 17.1 15.5 13.1 15.0 14.7 8.3 8.2
Excluding South Africa 26.2 17.0 22.4 24.4 19.6 16.9 19.8 18.7 10.3 10.2
Middle-income countries 31.6 14.6 3.8 10.7 10.9 11.7 14.4 9.3 11.7 0.8Excluding Nigeria and South Africa 29.7 18.9 17.2 25.7 17.9 18.9 16.2 16.3 4.9 3.7
Low-income countries 27.5 22.7 27.4 21.6 22.0 15.3 19.4 18.5 14.9 11.5Excluding low-income countries in fragile situations 30.5 14.2 24.9 23.9 23.0 12.5 17.9 22.3 12.8 12.6
Countries in fragile situations 21.8 31.1 28.3 16.8 20.8 20.0 21.9 15.5 17.1 9.4
CFA franc zone 15.2 10.6 15.7 23.3 11.9 17.5 15.6 11.7 7.8 3.6CEMAC 18.0 11.5 20.0 31.8 11.3 17.6 17.1 6.2 2.8 –1.2WAEMU 13.0 9.7 11.7 15.6 12.5 17.5 14.2 16.8 12.0 7.4
COMESA (SSA members) 28.5 20.2 26.7 26.1 21.6 15.1 18.6 18.1 9.7 14.1EAC-5 26.7 12.9 24.2 29.3 14.4 14.7 19.1 19.4 6.2 4.9ECOWAS 39.2 19.5 –0.0 7.6 9.1 12.5 19.1 8.2 20.1 –0.4SACU 19.4 2.8 3.7 7.7 10.1 7.7 7.8 8.1 5.1 4.5SADC 27.4 14.7 11.1 14.1 14.9 10.8 9.9 12.8 4.9 3.6
Table SA15. Claims on Nonfinancial Private Sector(Percent change)
See sources and footnotes on page 91.

REGIONAL ECONOMIC OUTLOOK: SUB-SAHARAN AFRICA
108
See sources and footnotes on page 91.
2004-08 2009 2010 2011 2012 2013 2014 2015 2016 2017Angola 8.5 21.5 20.2 20.2 22.5 23.4 22.9 27.2 21.5 15.4Benin 14.4 19.8 20.8 22.0 20.6 21.5 21.5 21.0 21.8 20.5Botswana 22.0 28.8 27.2 27.3 31.8 31.7 31.0 33.7 31.5 32.0Burkina Faso 16.7 17.0 17.3 18.8 20.7 25.3 29.0 30.8 30.4 30.4Burundi 14.1 13.7 15.2 20.3 17.4 15.8 15.3 15.5 16.6 12.6Cabo Verde 41.4 58.0 61.9 65.7 64.3 64.2 63.3 61.8 62.2 62.2Cameroon 8.6 9.7 9.9 11.9 11.4 12.2 12.9 13.5 13.9 13.7Central African Rep. 6.9 7.2 8.9 10.1 12.3 14.9 14.0 12.3 12.5 14.6Chad 2.6 3.9 4.2 4.8 5.8 5.9 7.6 8.4 8.6 8.6Comoros 8.9 14.8 17.5 17.8 20.6 21.7 22.8 25.9 26.6 26.2Congo, Dem. Rep. of 2.1 4.4 4.1 4.0 4.5 4.8 5.3 5.8 6.4 5.3Congo, Rep. of 2.8 5.0 5.4 6.6 9.6 11.3 14.2 21.3 25.0 22.1Côte d'Ivoire 14.3 16.4 16.6 16.9 16.8 18.3 19.7 22.7 23.8 24.8Equatorial Guinea 2.7 5.8 6.7 7.0 5.3 7.5 9.1 15.4 19.1 18.5Eritrea 24.5 16.6 14.8 13.8 14.1 28.3 34.1 10.4 10.0 9.7Ethiopia1 10.9 9.3 10.4 9.8 9.3 8.8 8.7 9.3 9.6 10.7Gabon 9.1 10.1 8.3 9.8 11.9 14.8 14.0 13.4 12.9 11.2Gambia, The 12.6 15.4 15.9 17.4 16.5 17.9 15.4 12.8 10.3 9.1Ghana 11.7 15.5 15.4 15.3 16.1 16.8 19.6 20.2 19.1 17.8Guinea 3.9 3.5 4.2 7.0 5.9 7.2 9.7 11.6 10.6 9.9Guinea-Bissau 2.5 5.2 6.6 11.1 15.8 13.0 12.0 15.3 14.5 5.9Kenya 23.5 25.8 28.0 31.2 30.1 32.5 34.9 34.9 31.8 28.3Lesotho 8.2 11.1 12.8 14.1 18.3 18.0 17.4 17.0 17.0 17.2Liberia 4.6 7.7 9.6 10.6 10.3 11.7 12.0 12.9 12.8 14.6Madagascar 10.1 11.3 11.5 11.2 10.8 11.7 12.6 13.2 12.9 13.6Malawi 6.7 10.9 13.8 13.9 14.6 12.5 11.7 12.2 10.4 9.2Mali 15.9 15.5 16.0 17.1 17.3 18.8 20.5 22.6 24.7 25.6Mauritius 75.1 82.7 87.9 91.3 100.8 108.1 100.3 104.3 96.9 103.7Mozambique 12.4 23.8 26.8 25.7 27.2 28.2 32.0 35.1 34.5 26.1Namibia 48.0 48.0 48.0 48.6 48.5 47.9 49.9 53.4 53.2 53.0Niger 6.5 11.3 11.7 12.8 12.7 12.9 13.0 13.9 15.0 14.3Nigeria 12.0 21.1 15.9 14.2 13.3 13.0 13.8 13.7 15.7 13.4Rwanda 9.9 11.8 11.8 13.0 15.2 15.4 16.6 19.7 19.3 19.3São Tomé & Príncipe 25.0 34.9 39.5 40.6 38.4 32.0 27.4 27.0 26.4 25.6Senegal 22.5 24.7 25.6 28.8 29.5 32.9 34.0 34.1 33.4 32.8Seychelles 25.1 20.1 24.4 23.9 22.5 21.3 25.2 25.3 26.9 29.8Sierra Leone 4.0 7.2 7.7 7.5 5.4 4.7 4.7 5.3 5.5 5.6South Africa 68.3 72.3 68.0 65.9 66.9 65.9 65.7 66.6 65.0 63.4South Sudan ... ... ... 0.2 0.6 0.7 1.0 1.5 1.5 0.9Swaziland 18.2 20.3 18.9 22.1 19.7 21.7 21.8 21.1 20.9 20.5Tanzania 10.4 13.2 13.7 14.4 14.7 14.6 15.6 17.1 16.0 14.6Togo 15.1 18.3 20.5 27.3 30.1 35.6 33.6 36.0 38.8 35.5Uganda 9.2 10.6 12.9 13.7 13.2 12.9 13.5 13.9 13.9 14.7Zambia 8.8 10.0 9.2 10.0 12.0 11.7 13.4 15.7 12.1 11.5Zimbabwe2 3.8 8.2 16.5 22.5 24.5 23.5 23.7 22.8 21.9 22.3
Sub-Saharan Africa 27.3 31.2 28.5 27.4 27.5 27.3 27.6 28.3 28.0 26.4Median 10.7 14.2 15.3 14.4 16.1 16.8 16.6 17.1 19.1 17.2
Excluding Nigeria and South Africa 13.2 16.4 17.0 17.4 18.3 19.2 19.9 21.4 20.4 19.2
Oil-exporting countries 10.6 19.1 15.2 13.8 13.6 13.8 14.4 15.2 16.1 13.6 Excluding Nigeria 7.1 13.9 13.4 12.6 14.6 15.7 16.0 19.2 17.4 14.3Oil-importing countries 37.9 39.7 38.1 37.5 37.7 37.4 37.5 38.0 36.4 35.0
Excluding South Africa 15.1 17.2 18.2 19.2 19.5 20.3 21.2 22.1 21.3 20.6
Middle-income countries 31.8 36.4 32.7 31.6 31.6 31.3 31.5 32.3 32.1 30.2Excluding Nigeria and South Africa 16.2 20.4 20.7 21.8 22.7 24.1 25.0 27.3 25.4 23.6
Low-income countries 9.6 11.4 12.5 12.6 13.2 13.5 14.2 14.9 15.0 14.5Excluding low-income countries in fragile situations 10.9 12.9 13.9 14.2 14.3 14.5 15.2 16.3 16.0 15.4
Countries in fragile situations 8.7 10.2 11.2 11.1 12.3 13.1 14.1 15.3 16.1 16.0
CFA franc zone 10.9 12.6 13.0 14.4 14.7 16.6 17.8 20.0 21.1 20.9CEMAC 6.0 7.5 7.6 8.9 9.3 10.7 11.8 14.1 15.3 14.4WAEMU 15.5 17.6 18.1 19.7 20.1 22.2 23.4 25.2 26.0 25.9
COMESA (SSA members) 15.5 16.6 18.0 19.2 19.4 20.0 20.4 20.6 19.4 18.9EAC-5 15.3 17.2 18.8 20.5 20.2 20.9 22.3 23.0 21.6 19.9ECOWAS 12.5 19.8 16.1 15.1 14.5 14.7 15.7 16.0 17.6 16.0SACU 64.9 68.9 64.8 62.9 64.0 62.9 62.7 63.7 62.1 60.7SADC 46.2 49.5 46.8 45.7 46.6 45.8 45.4 46.6 44.3 42.2
Table SA16. Claims on Nonfinancial Private Sector(Percent of GDP)

STATISTICAL APPENDIX
109
See sources and footnotes on page 91.
2004-08 2009 2010 2011 2012 2013 2014 2015 2016 2017 2018 2019Angola 77.3 54.9 62.3 65.4 63.1 55.7 48.0 33.6 29.7 27.2 35.1 32.8Benin 13.7 14.3 17.9 16.0 13.2 15.5 15.8 17.6 16.3 18.1 18.9 19.8Botswana 50.9 40.7 43.7 49.8 44.2 61.5 60.8 52.1 49.7 44.3 44.0 44.5Burkina Faso 10.6 12.6 21.4 23.8 23.9 26.4 25.9 26.6 27.4 27.5 24.4 23.6Burundi 7.8 6.7 8.9 10.1 9.4 8.8 7.2 5.6 5.5 5.1 4.8 4.5Cabo Verde 35.8 33.2 38.3 42.2 45.0 47.0 48.1 41.3 44.9 48.0 50.3 51.0Cameroon 25.3 19.7 22.0 25.4 25.4 24.8 24.6 21.8 19.4 18.5 17.6 16.6Central African Rep. 13.2 10.7 11.8 13.5 12.5 14.4 13.0 12.6 12.8 12.9 12.9 13.2Chad 45.6 35.2 37.8 40.6 38.2 33.4 31.5 26.5 24.4 27.5 29.9 28.3Comoros 14.8 13.8 15.7 16.6 14.9 15.6 18.2 16.5 17.8 17.1 16.7 16.3Congo, Dem. Rep. of 29.5 27.4 43.0 41.6 32.8 38.4 35.4 27.4 25.5 31.6 37.6 40.4Congo, Rep. of 80.2 66.9 73.3 77.8 75.3 67.8 67.5 59.4 54.6 65.8 72.2 70.8Côte d'Ivoire 48.5 50.7 50.5 53.1 48.9 41.5 39.2 37.7 31.2 31.0 29.6 29.8Equatorial Guinea 79.7 72.6 81.2 76.3 74.3 64.9 59.7 49.0 43.6 46.3 44.9 41.1Eritrea 5.8 4.5 4.8 26.3 20.8 19.5 21.8 13.6 9.5 9.2 10.0 8.3Ethiopia1 14.6 10.6 15.5 18.2 13.9 12.5 11.6 9.7 8.3 7.7 8.3 8.9Gabon 59.0 52.0 59.2 64.1 64.8 61.5 54.5 43.5 36.2 40.6 43.9 42.6Gambia, The 30.6 25.4 23.8 26.5 30.9 29.4 29.2 24.7 24.0 21.6 23.5 24.0Ghana 23.8 29.7 29.3 36.9 40.1 33.9 39.4 44.7 40.8 43.3 40.0 38.2Guinea 22.0 19.1 22.3 25.5 28.2 23.0 22.3 18.7 29.2 32.3 34.5 37.9Guinea-Bissau 17.0 18.8 20.1 25.7 15.5 18.3 20.2 28.3 26.3 28.3 26.9 26.3Kenya 23.5 20.0 22.5 24.0 22.2 19.9 18.3 16.6 14.6 14.8 15.5 15.9Lesotho 46.9 39.5 39.6 41.1 38.7 34.0 34.1 41.8 39.9 40.3 41.2 41.9Liberia 38.4 25.9 32.0 36.5 42.6 37.1 33.1 25.6 23.5 22.9 22.0 20.9Madagascar 27.1 22.5 25.0 26.8 28.6 30.1 32.8 32.1 33.5 31.2 30.0 30.4Malawi 17.1 17.0 19.6 17.6 23.8 30.6 29.1 25.5 29.3 27.3 27.5 28.1Mali 24.0 22.9 22.9 21.6 26.9 24.9 22.5 24.0 23.4 23.2 21.8 21.1Mauritius 55.6 47.0 50.9 51.7 52.9 47.3 49.8 48.0 43.0 41.4 40.0 39.7Mozambique 29.0 24.5 24.7 26.5 30.6 29.8 27.5 27.9 33.4 38.0 40.0 40.6Namibia 38.5 42.6 41.7 41.4 42.0 43.7 44.3 42.9 37.3 35.4 37.1 37.6Niger 17.6 20.3 22.2 20.9 21.9 22.6 21.0 18.3 16.3 16.5 16.2 16.4Nigeria 28.4 19.6 22.4 24.7 21.4 19.3 14.8 10.1 9.5 12.8 14.8 12.6Rwanda 11.3 11.1 10.8 14.1 13.9 15.4 16.4 18.3 18.8 22.4 22.4 24.0São Tomé & Príncipe 11.2 10.4 12.3 12.6 13.1 17.8 25.4 28.3 27.5 26.1 24.3 23.6Senegal 26.3 24.4 24.9 26.4 27.9 28.3 28.1 29.4 27.5 27.8 26.6 26.2Seychelles 85.1 108.0 93.8 100.2 105.2 94.7 102.2 94.2 94.7 99.0 104.6 103.2Sierra Leone 15.0 15.0 16.2 18.3 32.4 35.9 30.2 17.8 22.8 27.3 30.2 33.9South Africa 29.6 27.9 28.6 30.5 29.7 30.9 31.2 30.4 30.2 29.9 30.2 29.9South Sudan ... ... ... 72.4 9.3 28.0 34.0 21.0 54.9 75.6 83.6 91.4Swaziland 58.4 48.9 45.9 35.2 38.7 44.7 49.6 49.2 45.6 43.3 44.9 45.1Tanzania 18.2 18.9 20.6 22.4 20.9 19.4 18.4 19.6 18.8 18.0 18.2 18.5Togo 34.6 35.6 37.8 43.6 45.2 46.5 39.7 35.8 34.2 34.1 32.7 33.1Uganda 16.3 18.1 17.2 20.4 20.1 19.1 17.5 18.7 18.9 18.9 19.6 20.5Zambia 35.1 32.0 39.7 40.1 41.2 41.4 40.8 38.7 35.3 33.9 39.2 41.1Zimbabwe2 27.6 22.5 35.5 40.7 30.8 27.6 25.8 24.9 25.4 24.3 22.6 21.5
Sub-Saharan Africa 32.5 27.8 30.4 33.6 31.0 29.5 26.7 22.7 22.1 23.7 25.0 24.0Median 27.3 23.7 24.8 26.5 29.7 29.8 29.2 26.6 27.5 27.5 29.6 28.3
Excluding Nigeria and South Africa 37.7 32.7 37.3 41.4 38.2 35.9 33.5 28.1 25.8 26.1 27.7 27.3
Oil-exporting countries 39.1 29.6 32.9 37.2 32.6 29.2 24.0 16.6 15.7 18.9 21.8 19.1 Excluding Nigeria 62.1 49.8 56.7 60.9 56.0 50.5 45.5 33.3 30.4 30.1 35.4 33.3Oil-importing countries 28.7 26.5 28.7 30.8 29.7 29.8 29.3 27.7 26.5 26.7 27.0 27.0
Excluding South Africa 27.9 25.3 28.8 31.2 29.8 29.0 28.0 26.1 24.4 24.8 25.2 25.5
Middle-income countries 34.6 29.7 31.8 34.5 32.7 30.8 27.7 23.4 22.7 24.6 26.0 24.5Excluding Nigeria and South Africa 48.1 42.0 46.1 49.6 48.3 44.2 41.4 34.7 30.7 30.2 32.3 31.3
Low-income countries 21.7 19.2 23.5 28.9 23.3 24.1 22.8 20.2 19.9 20.8 21.8 22.3Excluding low-income countries in fragile situations 17.1 16.0 18.6 20.7 19.3 18.6 17.5 16.9 16.0 16.1 16.6 17.1
Countries in fragile situations 36.0 32.7 38.1 43.7 35.8 35.5 34.2 28.7 28.2 30.3 31.7 31.9
CFA franc zone 40.7 37.2 41.5 43.9 43.0 39.3 36.7 31.9 28.1 29.2 29.0 28.1CEMAC 50.3 43.5 49.8 53.2 52.1 47.0 43.5 34.5 29.8 32.4 33.6 31.9WAEMU 30.3 30.8 32.4 33.0 32.6 31.0 29.6 29.7 26.7 26.9 25.6 25.6
COMESA (SSA members) 26.4 21.9 27.4 29.3 26.4 26.2 24.8 21.6 19.7 20.1 21.4 22.0EAC-5 19.5 18.5 19.8 21.9 20.7 19.1 17.9 17.8 16.6 16.6 17.1 17.5ECOWAS 28.2 22.3 24.5 26.9 24.6 22.3 18.5 15.3 15.5 18.8 19.8 18.0SACU 31.0 29.0 29.7 31.5 30.8 32.6 33.1 32.0 31.6 31.0 31.3 31.1SADC 35.4 32.4 34.7 37.1 36.4 36.7 35.3 31.4 30.3 29.7 31.8 31.4
Table SA17. Exports of Goods and Services(Percent of GDP)

REGIONAL ECONOMIC OUTLOOK: SUB-SAHARAN AFRICA
110
See sources and footnotes on page 91.
2004-08 2009 2010 2011 2012 2013 2014 2015 2016 2017 2018 2019Angola 48.3 55.4 42.9 42.2 40.2 39.4 42.2 37.0 28.8 25.7 30.1 25.8Benin 24.9 27.0 29.2 26.1 25.2 28.3 31.0 29.7 29.2 30.9 30.6 31.2Botswana 40.3 53.0 51.4 53.5 55.0 61.4 53.9 53.4 43.2 40.0 40.8 41.1Burkina Faso 25.4 23.2 29.0 33.0 34.7 39.8 34.9 36.3 35.9 37.3 33.7 31.7Burundi 34.3 28.2 43.4 43.5 46.7 41.5 37.3 32.9 24.9 23.4 23.4 20.9Cabo Verde 64.5 63.4 66.8 73.8 68.1 62.8 66.4 56.7 61.6 68.2 69.7 70.8Cameroon 25.8 24.1 24.8 28.0 28.0 27.3 27.7 25.2 22.0 20.7 19.8 18.9Central African Rep. 22.1 23.2 26.5 24.4 23.9 25.0 37.6 34.6 31.7 32.5 34.1 32.7Chad 44.3 46.8 48.6 48.1 48.0 43.1 43.9 42.9 39.4 41.5 43.0 41.6Comoros 39.5 47.9 50.3 52.0 53.1 50.6 48.8 45.3 43.7 43.5 44.0 42.3Congo, Dem. Rep. of 34.9 36.9 51.9 48.0 39.9 38.6 44.0 33.2 30.1 33.1 38.3 42.0Congo, Rep. of 57.7 73.7 59.4 53.9 51.0 51.3 64.9 111.2 119.1 68.2 58.5 56.1Côte d'Ivoire 41.2 39.8 43.2 36.8 44.7 38.6 34.4 34.2 28.6 27.7 27.4 27.7Equatorial Guinea 35.9 47.9 58.9 43.4 41.3 41.9 42.1 48.0 37.3 28.4 29.7 41.5Eritrea 41.6 23.4 23.3 32.3 24.2 21.3 22.8 19.8 16.9 16.3 15.5 14.1Ethiopia1 36.3 27.9 33.1 36.5 32.8 28.8 28.2 30.3 27.6 23.7 23.1 23.7Gabon 27.5 34.6 29.5 23.7 36.2 43.7 41.3 38.9 34.4 33.3 32.7 32.6Gambia, The 45.5 41.9 42.7 40.5 43.3 41.2 48.5 50.4 41.9 49.3 55.3 53.5Ghana 40.0 42.9 43.5 49.3 52.5 47.1 49.6 56.3 48.0 47.3 44.8 42.7Guinea 24.2 21.1 25.4 43.2 44.4 31.6 33.0 30.7 60.7 54.5 51.7 44.3Guinea-Bissau 28.7 35.2 35.2 30.9 25.7 25.8 31.4 32.6 30.3 32.9 33.4 32.5Kenya 31.9 30.5 33.9 39.4 35.5 33.2 33.0 27.7 23.4 24.3 24.4 24.3Lesotho 105.8 105.1 99.1 96.2 98.3 85.4 82.0 84.8 79.7 83.6 86.8 85.2Liberia 128.1 87.8 82.8 87.0 90.0 73.6 91.8 88.0 72.3 59.8 56.7 50.8Madagascar 43.5 45.8 39.2 38.2 39.1 38.7 37.2 35.5 35.8 38.4 37.0 37.6Malawi 35.0 31.7 34.9 28.0 38.2 42.4 39.7 36.6 46.0 41.0 40.7 39.4Mali 33.7 34.0 37.9 29.7 31.8 39.9 38.0 39.6 40.3 39.0 37.8 36.7Mauritius 64.2 57.5 63.0 65.6 66.0 61.6 62.3 58.8 53.3 56.6 57.6 59.1Mozambique 38.6 39.7 45.2 58.0 81.7 81.2 72.6 71.7 71.1 54.3 54.4 81.0Namibia 41.8 55.8 52.1 50.6 55.7 59.3 66.7 68.1 57.7 45.8 48.2 48.7Niger 31.2 46.7 49.0 47.8 39.4 39.1 38.9 40.9 33.5 32.9 34.1 34.7Nigeria 17.7 16.6 19.2 21.9 17.5 14.9 15.1 14.9 11.6 12.5 15.1 13.5Rwanda 26.1 28.7 28.6 34.2 34.0 32.0 33.2 35.6 36.7 32.3 33.6 35.0São Tomé & Príncipe 55.6 54.7 61.0 63.1 54.0 58.9 66.0 58.9 53.1 54.2 53.4 50.6Senegal 45.1 41.3 40.3 44.7 48.9 49.2 47.4 46.0 42.1 45.3 42.1 40.9Seychelles 94.7 117.0 108.1 116.6 122.5 101.5 118.0 103.2 104.9 105.7 110.2 108.3Sierra Leone 24.4 30.5 43.9 84.4 65.7 46.2 57.4 43.8 47.9 54.1 53.7 59.1South Africa 30.6 27.5 27.4 29.7 31.2 33.3 33.0 31.4 30.1 28.6 29.7 29.8South Sudan ... ... ... 30.4 34.1 29.9 31.6 28.9 59.1 86.1 87.1 92.2Swaziland 67.5 62.2 58.3 41.3 41.4 43.3 45.5 39.5 40.7 40.0 39.1 38.1Tanzania 26.8 28.4 29.5 34.2 33.0 30.2 28.3 27.1 22.1 20.5 22.0 22.8Togo 50.7 50.2 53.4 64.5 59.2 66.3 57.7 57.8 54.3 52.5 51.6 50.6Uganda 27.0 28.1 30.6 35.3 31.6 28.7 27.8 29.1 25.3 26.6 29.6 32.6Zambia 30.4 26.7 27.6 32.2 36.3 39.3 37.7 41.7 37.9 36.5 41.0 42.3Zimbabwe2 37.0 48.9 64.0 76.8 59.7 56.5 51.7 46.7 39.9 36.5 35.0 32.9
Sub-Saharan Africa 30.3 30.3 30.6 32.8 31.9 30.7 30.4 29.5 27.1 26.6 28.0 27.3Median 36.7 39.8 43.1 42.2 41.3 41.2 41.3 39.5 39.4 38.4 38.3 39.4
Excluding Nigeria and South Africa 38.0 40.2 40.8 41.9 42.0 40.4 40.5 38.8 34.5 32.4 33.3 33.2
Oil-exporting countries 24.8 27.0 26.2 27.8 24.5 22.4 22.8 21.6 18.2 18.3 20.7 18.4 Excluding Nigeria 39.9 48.0 42.0 39.0 39.2 38.6 40.8 39.0 33.7 28.9 31.4 29.1Oil-importing countries 33.8 32.5 33.8 36.6 37.7 37.9 37.4 36.0 33.1 31.7 32.4 32.8
Excluding South Africa 37.3 36.8 40.3 43.4 43.3 41.2 40.3 38.7 34.8 33.6 33.9 34.5
Middle-income countries 29.6 29.5 29.1 31.0 30.1 29.0 28.7 27.9 25.2 25.1 26.6 25.3Excluding Nigeria and South Africa 40.9 44.8 42.4 42.4 43.2 42.0 42.7 41.6 35.5 32.8 33.8 32.8
Low-income countries 33.6 33.5 38.3 41.2 40.2 38.0 37.5 35.5 33.3 31.9 32.6 33.8Excluding low-income countries in fragile situations 30.1 29.7 32.8 37.4 37.5 35.4 33.5 33.6 29.6 27.0 27.5 29.9
Countries in fragile situations 40.2 41.8 46.4 44.7 44.5 41.6 42.8 40.8 40.3 38.1 38.1 37.6
CFA franc zone 35.6 38.4 40.3 37.2 39.2 39.7 39.2 40.5 36.5 33.7 32.6 32.6CEMAC 34.1 39.8 40.8 36.9 38.2 38.7 40.4 43.2 38.8 32.0 31.1 31.6WAEMU 37.1 37.0 39.7 37.6 40.3 40.8 38.0 38.2 34.8 34.9 33.7 33.3
COMESA (SSA members) 36.8 34.3 39.1 42.2 38.9 36.9 36.7 33.9 30.4 29.8 30.8 31.4EAC-5 29.1 29.2 31.7 36.7 34.1 31.4 30.6 28.3 24.0 23.9 24.9 25.5ECOWAS 23.7 22.6 24.6 27.3 24.3 21.6 21.1 21.5 19.9 21.4 22.9 21.1SACU 32.1 30.0 29.6 31.6 33.3 35.6 35.4 34.0 32.1 30.2 31.3 31.5SADC 34.5 35.3 33.8 35.9 37.2 38.4 38.7 36.1 32.6 30.5 32.5 32.7
Table SA18. Imports of Goods and Services(Percent of GDP)

STATISTICAL APPENDIX
111
2004-08 2009 2010 2011 2012 2013 2014 2015 2016 2017 2018 2019Angola 50.4 24.1 41.1 45.2 41.6 33.5 24.1 12.2 14.7 13.8 18.2 18.1Benin –10.7 –9.9 –10.2 –9.9 –11.1 –10.1 –11.0 –7.4 –8.4 –7.5 –6.0 -5.7Botswana 9.5 –12.8 –7.8 –4.5 –12.3 –2.3 3.3 –5.6 2.0 0.2 –0.9 -0.7Burkina Faso –9.5 –5.8 –1.6 –2.5 –3.6 –5.6 –2.1 –2.3 –1.4 –3.1 –3.0 -2.0Burundi –16.4 –14.5 –30.2 –29.0 –32.2 –29.1 –24.4 –21.7 –14.9 –14.6 –15.4 -13.1Cabo Verde –39.0 –39.6 –40.9 –45.1 –36.6 –33.6 –32.5 –29.6 –32.6 –37.5 –39.0 -40.3Cameroon 1.7 –1.6 –0.8 –2.2 –0.9 –0.6 –1.3 –1.2 –0.7 –0.9 –0.9 -1.1Central African Rep. –4.0 –7.8 –8.8 –5.7 –6.2 –7.3 –18.5 –16.4 –13.7 –14.8 –16.7 -15.7Chad 24.4 4.8 8.0 10.8 7.7 6.6 2.9 0.5 2.2 3.1 5.8 5.0Comoros –22.9 –28.9 –29.2 –30.3 –32.2 –30.5 –31.3 –28.6 –24.9 –24.3 –24.7 -23.6Congo, Dem. Rep. of 0.2 –3.2 2.1 2.3 0.2 6.8 –0.9 –0.6 –0.5 2.2 5.1 4.4Congo, Rep. of 47.1 22.8 37.1 45.5 43.1 33.1 24.6 –13.0 –23.8 27.5 39.1 38.5Côte d'Ivoire 15.0 17.5 14.5 23.2 11.4 9.6 10.9 9.6 9.1 9.8 8.6 8.3Equatorial Guinea 54.8 40.7 37.8 48.2 47.5 37.8 33.3 17.8 20.3 26.9 24.9 7.9Eritrea –33.9 –19.9 –19.6 –8.6 –5.3 –3.3 –2.4 –7.4 –8.8 –8.1 –7.3 -7.0Ethiopia1 –20.6 –15.8 –16.3 –16.6 –16.9 –17.6 –17.9 –20.8 –18.9 –15.9 –15.0 -15.1Gabon 41.6 29.8 38.7 49.4 42.3 32.2 28.1 15.5 13.3 18.7 22.1 21.1Gambia, The –21.3 –22.4 –22.8 –21.2 –22.0 –19.1 –25.4 –29.4 –22.8 –31.6 –35.5 -33.4Ghana –14.9 –8.6 –9.2 –7.7 –10.0 –8.0 –3.6 –8.4 –4.1 2.3 0.4 -0.5Guinea 2.2 1.8 1.8 –9.3 –3.5 –0.4 –5.0 –7.2 –23.8 –15.3 –10.7 -0.8Guinea-Bissau –6.0 –9.8 –8.2 –0.2 –5.1 –2.9 –4.6 4.8 4.6 4.4 2.3 1.9Kenya –12.2 –13.4 –15.6 –20.1 –18.5 –18.6 –17.4 –13.1 –11.2 –12.1 –11.9 -11.4Lesotho –38.4 –45.8 –43.1 –39.3 –45.1 –38.9 –36.1 –32.3 –29.7 –31.7 –32.7 -30.5Liberia –22.0 –19.9 –10.2 –16.5 –19.0 –12.3 –33.3 –34.4 –23.7 –16.5 –15.4 -14.8Madagascar –13.5 –19.2 –11.8 –10.1 –11.2 –8.0 –5.1 –3.4 –2.6 –7.1 –6.5 -6.7Malawi –12.8 –10.3 –10.7 –7.9 –10.9 –7.8 –7.4 –7.6 –11.1 –9.4 –9.2 -7.8Mali –4.4 –6.0 –8.6 –2.6 0.9 –1.9 –3.5 –3.6 –4.1 –3.9 –4.5 -4.4Mauritius –15.2 –17.5 –19.5 –20.9 –21.5 –19.0 –18.0 –16.0 –16.9 –21.4 –23.8 -25.6Mozambique –5.5 –11.3 –11.3 –17.1 –26.7 –31.1 –27.7 –28.1 –12.5 –4.8 –3.6 -23.5Namibia –4.0 –14.0 –9.9 –8.8 –16.4 –15.6 –21.5 –25.0 –19.7 –10.9 –11.3 -11.1Niger –6.9 –14.7 –14.2 –14.4 –6.6 –5.6 –8.6 –12.3 –9.1 –8.5 –9.8 -10.2Nigeria 15.3 8.5 8.2 7.9 8.5 8.2 3.7 –1.3 –0.1 2.6 2.3 1.7Rwanda –10.3 –14.2 –13.6 –17.2 –18.8 –15.1 –15.8 –14.9 –15.3 –9.5 –9.7 -9.6São Tomé & Príncipe –35.6 –39.7 –43.2 –44.9 –38.2 –38.2 –36.6 –33.9 –30.1 –30.8 –31.0 -29.9Senegal –18.4 –15.9 –14.9 –17.4 –20.3 –20.1 –18.4 –15.8 –14.0 –16.3 –14.8 -14.0Seychelles –29.5 –37.6 –39.3 –43.0 –38.5 –29.7 –40.3 –34.4 –37.2 –43.4 –48.4 -49.3Sierra Leone –7.5 –14.3 –20.2 –56.9 –24.1 –0.6 –6.8 –18.0 –17.1 –17.4 –13.6 -13.8South Africa –0.6 1.1 2.2 1.6 –1.1 –2.1 –1.7 –0.9 0.3 1.5 0.7 0.3South Sudan ... ... ... 49.1 –19.6 1.9 9.5 –1.3 15.2 11.7 14.7 18.7Swaziland –3.5 –3.6 –3.3 –0.9 1.9 9.6 11.8 14.7 10.4 8.7 11.5 12.8Tanzania –9.8 –10.0 –9.5 –12.2 –13.0 –12.2 –11.4 –9.4 –5.9 –5.7 –6.9 -7.5Togo –13.2 –12.2 –13.3 –21.7 –14.4 –20.1 –19.4 –24.7 –22.8 –21.0 –21.2 -20.0Uganda –8.9 –8.1 –10.9 –11.7 –10.0 –8.3 –8.5 –9.1 –5.9 –6.5 –7.9 -9.1Zambia 4.7 6.3 13.7 9.8 6.3 5.9 6.0 –0.3 –0.2 0.4 1.1 1.5Zimbabwe2 –7.4 –18.2 –17.9 –23.9 –18.6 –18.8 –15.9 –14.7 –9.1 –7.2 –7.7 -7.0
Sub-Saharan Africa 6.0 2.6 4.5 5.7 3.5 3.0 0.7 –3.1 –2.0 –0.1 0.0 -0.6Median –8.2 –10.8 –10.2 –9.3 –11.1 –7.8 –7.4 –9.1 –9.1 –7.2 –7.3 -7.0
Excluding Nigeria and South Africa 5.4 –0.2 3.6 6.9 2.8 1.9 –0.3 –5.4 –4.0 –2.0 –1.4 -2.1
Oil-exporting countries 22.3 12.5 15.2 18.2 16.0 13.7 8.4 1.3 2.8 6.1 6.9 5.7 Excluding Nigeria 37.5 20.4 31.3 37.9 31.7 25.7 19.5 8.0 9.6 12.5 15.7 14.4Oil-importing countries –4.0 –4.3 –3.1 –3.8 –6.4 –6.3 –6.3 –6.8 –5.3 –3.8 –4.1 -4.5
Excluding South Africa –7.5 –9.0 –8.5 –9.2 –10.9 –9.4 –9.4 –10.4 –8.3 –6.9 –6.8 -7.2
Middle-income countries 8.6 5.4 7.2 8.2 6.7 5.8 3.3 –1.0 0.2 2.3 2.3 1.7Excluding Nigeria and South Africa 13.8 6.7 11.9 15.7 12.4 9.5 6.8 –0.5 0.5 2.6 3.4 2.6
Low-income countries –7.5 –10.1 –9.3 –6.5 –11.3 –9.1 –9.8 –11.2 –9.5 –7.9 –7.4 -8.0Excluding low-income countries in fragile situations –11.3 –11.5 –11.5 –13.1 –14.1 –14.1 –13.8 –14.7 –11.6 –9.9 –9.8 -11.2
Countries in fragile situations 4.7 –0.4 1.7 8.1 –0.2 2.1 0.2 –4.0 –4.0 –0.4 1.1 1.4
CFA franc zone 12.9 7.4 9.8 14.8 12.3 8.2 6.3 0.3 –0.0 3.1 3.6 2.5CEMAC 26.9 15.9 20.5 27.1 25.1 19.1 14.7 3.4 2.4 9.7 11.7 9.0WAEMU –2.0 –1.2 –1.9 0.4 –2.5 –3.4 –2.4 –2.4 –1.9 –1.9 –2.2 -2.0
COMESA (SSA members) –9.9 –11.1 –9.9 –11.3 –11.7 –10.1 –10.9 –11.4 –10.3 –9.4 –9.0 -9.1EAC-5 –10.8 –11.4 –12.9 –15.9 –15.3 –14.5 –13.8 –11.5 –9.0 –9.2 –9.7 -9.8ECOWAS 9.2 5.1 4.9 4.8 5.0 5.0 2.0 –2.4 –1.5 0.9 0.6 0.4SACU –0.6 –0.1 1.2 0.9 –2.2 –2.6 –2.2 –2.0 –0.4 0.9 0.1 -0.2SADC 3.8 1.7 5.3 5.8 3.3 2.6 1.0 –1.4 0.6 1.7 1.9 1.0
Table SA19. Trade Balance on Goods(Percent of GDP)
See sources and footnotes on page 91.

REGIONAL ECONOMIC OUTLOOK: SUB-SAHARAN AFRICA
112
See sources and footnotes on page 91.
2004-08 2009 2010 2011 2012 2013 2014 2015 2016 2017 2018 2019Angola 14.7 –10.0 9.1 12.6 12.2 6.7 –3.0 –10.0 –5.1 –4.5 –2.2 -0.1Benin –6.7 –8.3 –8.2 –7.3 –7.4 –7.4 –8.6 –9.0 –9.4 –9.4 –8.5 -7.9Botswana 10.7 –6.3 –2.8 3.1 0.3 8.9 15.4 7.8 11.7 10.8 8.3 7.5Burkina Faso –10.4 –4.7 –2.3 –4.0 –6.7 –11.3 –8.1 –8.5 –7.3 –8.3 –7.5 -6.5Burundi –7.8 1.7 –12.2 –14.4 –18.6 –19.3 –18.5 –17.7 –13.1 –12.7 –13.2 -11.9Cabo Verde –9.5 –14.6 –12.4 –16.3 –12.6 –4.9 –9.1 –3.2 –2.8 –8.8 –9.5 -10.0Cameroon –0.9 –3.1 –2.5 –2.7 –3.3 –3.6 –4.0 –3.8 –3.2 –2.5 –2.5 -2.4Central African Rep. –5.5 –9.1 –10.2 –7.6 –4.6 –3.0 –5.6 –9.0 –9.1 –10.2 –9.3 -9.2Chad 0.4 –8.2 –8.5 –5.8 –7.8 –9.1 –8.9 –13.6 –9.2 –5.2 –4.3 -5.5Comoros –6.3 –6.9 –0.4 –6.0 –5.5 –7.0 –6.3 0.0 –7.4 –4.9 –6.9 -8.5Congo, Dem. Rep. of –0.2 –6.1 –10.5 –5.2 –4.6 –5.0 –4.6 –3.7 –3.1 –0.5 0.3 -0.9Congo, Rep. of 3.2 –14.6 7.3 14.0 17.7 13.8 1.4 –54.1 –74.1 –12.7 3.0 4.8Côte d'Ivoire 1.1 6.6 1.9 10.4 –1.2 –1.4 1.4 –0.6 –1.1 –1.2 –1.5 -1.3Equatorial Guinea 13.6 –9.7 –20.2 –5.7 –1.1 –2.5 –4.3 –17.7 –11.8 –0.5 –0.9 -13.3Eritrea –3.1 –7.6 –6.1 3.2 2.7 3.6 4.0 –1.4 –2.1 –2.4 –1.5 -2.1Ethiopia2 –8.4 –6.7 –1.4 –2.5 –6.9 –5.9 –6.4 –10.2 –9.0 –8.1 –6.5 -6.3Gabon 17.2 4.4 14.9 24.0 17.9 7.3 7.6 –5.6 –10.1 –4.8 –1.5 -1.9Gambia, The –8.5 –12.5 –16.3 –11.7 –7.0 –10.3 –10.8 –15.0 –8.9 –14.3 –18.4 -16.9Ghana –8.1 –5.5 –8.6 –9.0 –11.7 –11.9 –9.5 –7.7 –6.7 –4.5 –4.1 -4.0Guinea –3.9 –5.7 –6.4 –18.4 –20.0 –12.5 –13.4 –15.4 –31.9 –23.0 –19.1 -10.0Guinea-Bissau –3.6 –5.8 –8.3 –1.3 –8.4 –4.6 0.5 2.3 1.3 0.1 –3.3 -2.6Kenya –2.6 –4.4 –5.9 –9.2 –8.4 –8.8 –10.4 –6.7 –5.2 –6.4 –6.2 -5.7Lesotho 15.1 1.6 –8.9 –13.4 –8.4 –5.5 –4.9 –4.5 –7.4 –6.9 –12.2 -12.1Liberia –9.0 –15.0 –20.7 –17.6 –17.3 –21.6 –26.3 –26.5 –18.5 –22.4 –22.5 -22.4Madagascar –12.9 –21.1 –10.2 –7.0 –7.6 –5.9 –0.3 –1.9 0.6 –3.4 –4.0 -4.8Malawi –12.9 –10.2 –8.6 –8.6 –9.2 –8.4 –8.3 –9.4 –13.6 –10.0 –8.9 -8.1Mali –7.3 –10.8 –10.7 –5.1 –2.2 –2.9 –4.7 –5.3 –7.2 –6.2 –6.9 -6.4Mauritius –6.3 –7.4 –10.3 –13.8 –7.3 –6.3 –5.7 –4.9 –4.4 –6.0 –7.4 -8.7Mozambique –8.9 –10.9 –16.1 –25.3 –44.7 –42.9 –38.2 –40.3 –39.2 –16.1 –16.9 -44.6Namibia 6.7 –1.5 –3.5 –3.0 –5.7 –4.0 –10.8 –12.6 –14.1 –1.4 –3.6 -5.1Niger –9.2 –24.4 –19.8 –25.1 –16.1 –16.8 –15.4 –20.5 –15.5 –13.2 –16.1 -16.7Nigeria 14.0 4.7 3.6 2.6 3.8 3.7 0.2 –3.2 0.7 2.5 0.5 0.4Rwanda –3.3 –7.0 –7.2 –7.4 –11.2 –8.7 –11.8 –13.3 –14.3 –6.8 –8.4 -9.2São Tomé & Príncipe –27.3 –24.7 –22.9 –27.7 –21.9 –13.8 –21.9 –12.6 –6.0 –13.0 –11.3 -9.9Senegal –9.6 –6.7 –4.4 –8.0 –10.9 –10.5 –9.0 –7.0 –5.5 –9.4 –7.9 -7.5Seychelles –13.7 –14.8 –19.4 –23.0 –21.1 –11.9 –23.1 –18.6 –18.3 –16.0 –14.4 -13.9Sierra Leone –6.9 –13.3 –22.7 –65.0 –31.8 –17.5 –18.2 –17.4 –19.4 –21.9 –18.9 -21.6South Africa –4.3 –2.7 –1.5 –2.2 –5.1 –5.9 –5.3 –4.4 –3.3 –2.3 –2.9 -3.1South Sudan ... ... ... 18.2 –15.9 –3.9 –1.6 –7.2 1.8 –6.0 –6.1 -4.3Swaziland –3.1 –11.4 –8.6 1.0 12.7 19.3 21.6 26.7 16.7 14.6 15.4 15.0Tanzania –6.5 –7.6 –7.7 –10.8 –11.6 –10.6 –10.1 –8.4 –4.5 –3.8 –5.4 -6.0Togo –8.1 –5.2 –5.8 –7.8 –7.6 –13.2 –10.0 –11.0 –9.6 –8.2 –7.8 -6.4Uganda –2.7 –5.6 –8.0 –9.9 –6.8 –7.2 –7.8 –6.7 –3.4 –4.5 –6.9 -9.5Zambia –1.1 6.0 7.5 4.7 5.4 –0.6 2.1 –3.9 –4.5 –3.3 –2.6 -1.9Zimbabwe3 0.3 –11.2 –14.3 –20.1 –13.1 –16.6 –14.2 –9.5 –3.4 –2.6 –2.6 -2.4
Sub-Saharan Africa 2.2 –2.4 –0.8 –0.6 –1.7 –2.2 –3.8 –6.0 –4.1 –2.6 –2.9 -3.1Median –4.9 –7.2 –8.3 –7.3 –7.4 –6.3 –7.8 –8.4 –7.2 –6.0 –6.5 -6.4
Excluding Nigeria and South Africa –0.0 –6.5 –3.3 –1.6 –3.5 –4.5 –5.9 –8.7 –7.1 –5.1 –4.6 -5.0
Oil-exporting countries 12.7 0.5 3.5 4.8 4.8 3.6 –0.6 –5.4 –2.1 0.1 –0.4 -0.2 Excluding Nigeria 9.7 –7.8 3.5 9.2 7.0 3.4 –2.5 –11.2 –8.8 –4.4 –2.1 -1.5Oil-importing countries –4.2 –4.4 –3.9 –4.7 –6.9 –7.3 –6.6 –6.5 –5.4 –4.2 –4.5 -5.0
Excluding South Africa –4.0 –5.9 –6.3 –7.2 –8.5 –8.3 –7.5 –7.8 –6.5 –5.4 –5.4 -6.0
Middle-income countries 3.7 –1.0 0.7 1.0 0.3 –0.4 –2.3 –4.9 –2.7 –1.4 –1.8 -1.7Excluding Nigeria and South Africa 3.7 –4.9 0.0 2.7 1.7 –0.5 –3.2 –7.4 –5.9 –3.8 –2.9 -2.6
Low-income countries –5.8 –8.7 –8.6 –8.1 –11.1 –10.2 –9.6 –10.3 –8.5 –6.8 –6.8 -7.9Excluding low-income countries in fragile situations –6.9 –8.0 –7.1 –9.8 –12.4 –11.9 –11.3 –12.1 –9.3 –7.3 –7.6 -9.6
Countries in fragile situations –2.7 –6.7 –6.4 –1.8 –5.8 –5.3 –5.1 –8.8 –9.0 –5.3 –4.2 -3.9
CFA franc zone 0.4 –4.7 –3.5 0.8 –1.0 –3.1 –3.5 –9.3 –9.1 –5.2 –4.3 -4.6CEMAC 5.7 –5.5 –2.5 3.6 3.3 0.3 –2.0 –13.2 –13.8 –4.3 –1.9 -3.3WAEMU –5.2 –4.0 –4.6 –2.5 –5.9 –6.7 –5.1 –5.9 –5.5 –5.9 –5.9 -5.5
COMESA (SSA members) –4.1 –6.1 –5.7 –6.5 –5.8 –6.4 –6.4 –6.7 –5.6 –5.2 –4.9 -5.1EAC-5 –4.0 –5.7 –7.1 –9.9 –9.4 –9.3 –10.0 –7.9 –5.3 –5.5 –6.3 -6.6ECOWAS 8.2 2.0 1.0 0.2 0.7 0.6 –1.5 –4.2 –1.7 –0.6 –1.9 -1.6SACU –3.3 –2.9 –1.7 –2.1 –4.8 –5.0 –4.3 –3.8 –2.7 –1.5 –2.2 -2.5SADC –1.7 –4.9 –1.4 –1.3 –3.2 –4.3 –5.3 –6.3 –4.2 –2.7 –2.9 -3.4
Table SA20. External Current Account1(Percent of GDP)

STATISTICAL APPENDIX
113
2004-08 2009 2010 2011 2012 2013 2014 2015 2016 2017 2018 2019Angola –0.6 2.9 –5.5 –4.9 –8.5 –10.5 –1.8 8.0 1.4 1.3 1.5 1.8Benin 2.1 1.5 2.8 1.3 2.6 3.3 4.0 1.4 1.4 4.5 5.8 7.6Botswana 4.2 2.0 1.7 9.0 5.3 5.3 2.5 2.1 –3.7 –3.2 –1.3 -1.2Burkina Faso 1.6 1.1 0.4 0.4 2.3 3.6 2.3 2.1 2.7 3.4 2.8 2.0Burundi 0.1 0.0 0.0 0.2 0.0 2.6 2.4 1.5 1.2 1.1 1.1 0.9Cabo Verde 9.4 7.0 6.7 5.6 3.8 3.5 6.8 7.0 6.4 6.1 8.2 8.5Cameroon 1.7 1.8 1.6 1.6 2.8 2.7 2.6 1.9 1.7 1.6 1.6 1.7Central African Rep. 3.3 2.1 3.1 1.7 3.2 0.1 0.1 0.3 0.4 0.9 0.9 1.2Chad 6.4 4.4 3.6 3.0 3.4 2.8 3.6 4.3 2.0 3.0 3.0 3.2Comoros 0.6 2.6 1.5 3.8 1.7 1.4 0.7 0.8 0.4 1.3 1.3 1.3Congo, Dem. Rep. of 5.3 –1.5 13.3 6.5 10.5 5.2 5.1 3.0 2.4 2.6 2.7 2.7Congo, Rep. of 11.2 13.6 7.6 1.3 –2.1 4.3 15.9 33.4 45.6 20.4 19.1 18.4Côte d'Ivoire 1.8 1.6 1.3 1.1 1.2 1.3 1.2 1.4 1.7 1.7 1.9 2.0Equatorial Guinea 9.3 12.1 20.4 12.8 15.7 9.8 5.3 9.8 2.0 –0.8 2.6 17.5Eritrea 1.4 4.9 4.3 1.5 1.4 1.2 1.2 1.1 1.0 1.0 0.9 0.9Ethiopia1 1.4 0.7 1.0 2.0 0.6 2.6 2.6 3.4 4.5 5.2 4.9 5.2Gabon 4.2 5.2 3.5 4.1 3.9 5.1 5.8 6.9 8.9 8.4 10.1 10.7Gambia, The 9.6 8.1 9.0 6.7 11.2 9.5 9.2 8.2 7.5 8.3 8.9 9.3Ghana 2.9 11.3 7.9 8.1 7.9 6.7 8.7 8.1 8.1 6.9 6.0 5.0Guinea 4.0 2.1 2.2 5.6 8.8 1.6 0.7 3.0 18.8 15.9 11.5 7.4Guinea-Bissau 1.2 2.1 3.3 2.2 0.7 1.9 2.5 1.6 1.4 1.4 2.3 2.5Kenya 0.5 0.2 0.4 3.3 2.3 1.7 1.2 0.6 0.5 0.5 0.6 0.6Lesotho 2.2 3.6 0.9 2.2 2.1 1.9 4.2 4.5 3.1 2.0 2.0 2.0Liberia 3.7 8.7 16.2 17.0 16.6 17.6 11.0 9.1 7.1 7.4 10.2 11.1Madagascar 3.7 8.1 3.9 7.8 7.8 5.2 2.9 4.5 4.5 3.6 3.4 3.4Malawi 1.8 0.9 2.3 0.8 1.4 1.7 0.8 1.8 3.1 2.0 2.2 2.3Mali 1.8 7.3 3.7 4.2 3.1 2.3 1.0 1.5 1.8 2.3 2.3 2.2Mauritius 1.6 2.5 127.6 –9.0 49.5 10.1 4.4 2.9 107.0 97.5 86.5 72.4Mozambique 3.8 8.0 9.8 27.1 37.1 38.6 29.1 26.1 27.4 12.1 12.4 34.5Namibia 6.3 5.7 7.0 7.0 8.6 6.5 4.7 8.1 2.8 3.8 3.7 3.0Niger 2.3 13.4 17.5 16.5 12.1 8.1 8.9 6.9 3.5 3.6 5.1 5.7Nigeria 2.1 2.4 1.4 1.9 1.2 0.8 0.5 0.3 0.8 0.8 0.7 0.6Rwanda 1.2 2.2 0.7 1.6 2.2 3.4 3.9 2.7 2.9 2.7 2.6 3.1São Tomé & Príncipe 16.8 8.1 25.6 13.5 8.6 1.5 6.6 8.1 5.9 11.3 2.5 2.5Senegal 1.6 2.0 2.0 2.0 1.5 1.9 2.5 2.8 1.6 2.7 2.7 2.8Seychelles 11.8 20.2 19.2 19.5 23.8 12.2 16.1 10.8 12.8 10.9 9.4 8.7Sierra Leone 3.9 4.5 9.2 32.3 19.0 7.3 7.7 6.2 13.2 15.1 14.1 16.8South Africa 1.1 2.1 1.0 1.1 0.4 0.5 –0.5 –1.3 –0.4 –1.7 –0.7 -0.2South Sudan ... ... ... –0.4 –0.5 –3.8 –0.1 0.1 –1.5 –0.3 0.5 0.3Swaziland 1.8 1.6 2.9 2.2 0.8 2.0 0.6 1.1 0.7 –2.1 0.5 0.5Tanzania 3.5 3.7 4.0 4.5 4.4 4.5 3.8 3.4 2.9 2.6 2.6 2.9Togo 2.8 0.3 1.4 –13.9 –7.7 4.7 –6.7 –2.2 –2.4 –2.4 –2.4 -2.8Uganda 4.7 4.4 2.5 4.3 4.7 4.4 3.7 2.9 2.1 2.3 3.7 5.4Zambia 5.9 2.8 3.1 4.7 9.5 6.0 11.8 5.5 7.3 6.3 6.3 6.4Zimbabwe2 0.7 1.3 1.2 2.9 2.5 2.5 3.0 2.5 2.1 1.8 1.9 1.8
Sub-Saharan Africa 2.0 2.9 2.9 2.2 2.2 1.4 1.7 2.1 3.0 2.3 2.5 2.8Median 2.6 2.7 3.1 3.0 3.1 3.3 3.0 2.9 2.4 2.6 2.6 2.8
Excluding Nigeria and South Africa 2.8 3.7 5.2 3.1 4.0 2.4 3.6 4.9 5.6 4.7 4.7 5.1
Oil-exporting countries 2.3 3.1 1.2 1.2 0.1 –0.6 0.8 2.3 1.8 1.4 1.6 1.7 Excluding Nigeria 2.7 4.6 0.6 –0.3 –2.1 –3.7 1.4 7.5 4.1 2.6 3.2 4.3Oil-importing countries 1.9 2.8 4.1 3.0 3.9 3.2 2.6 1.9 3.8 2.8 3.0 3.4
Excluding South Africa 2.9 3.3 7.2 4.9 6.9 5.2 4.6 3.9 6.1 5.4 5.1 5.3
Middle-income countries 1.8 2.9 2.5 1.6 1.4 0.5 1.1 1.6 2.6 1.8 2.0 2.1Excluding Nigeria and South Africa 2.6 4.1 5.7 1.8 2.6 0.2 3.0 5.5 6.7 5.2 5.2 5.2
Low-income countries 3.2 3.2 4.5 5.1 6.1 5.4 4.5 4.1 4.3 4.0 4.0 5.0Excluding low-income countries in fragile situations 2.9 3.4 3.6 6.0 6.6 7.1 5.9 5.1 4.8 4.3 4.5 6.3
Countries in fragile situations 3.9 3.5 5.0 3.4 4.1 2.9 3.4 3.9 5.1 4.0 3.8 3.6
CFA franc zone 3.7 4.8 5.1 3.5 3.9 3.8 3.9 4.7 4.3 3.4 3.8 4.6CEMAC 5.5 6.3 6.9 4.6 5.4 4.9 5.6 7.8 7.6 4.7 5.5 7.3WAEMU 1.9 3.2 3.1 2.2 2.3 2.8 2.1 2.0 1.7 2.4 2.6 2.7
COMESA (SSA members) 2.6 1.7 9.8 3.1 6.6 3.8 3.8 2.7 7.1 6.5 6.2 5.8EAC-5 2.3 2.2 2.0 3.7 3.4 3.2 2.7 2.0 1.6 1.5 1.8 2.2ECOWAS 2.2 3.1 2.2 2.7 2.1 1.7 1.3 1.2 1.9 2.0 1.9 1.7SACU 1.3 2.2 1.2 1.5 0.8 0.9 –0.2 –0.8 –0.4 –1.6 –0.6 -0.1SADC 1.5 2.5 3.2 1.4 2.0 0.6 1.5 2.4 3.6 2.1 2.5 3.1
Table SA21. Net Foreign Direct Investment(Percent of GDP)
See sources and footnotes on page 91.

REGIONAL ECONOMIC OUTLOOK: SUB-SAHARAN AFRICA
114
See sources and footnotes on page 91.
2004-08 2009 2010 2011 2012 2013 2014 2015 2016 2017Angola 76.2 106.0 100.0 103.2 114.3 121.6 126.8 128.1 125.0 157.8Benin 103.6 107.0 100.0 99.4 97.7 99.1 98.0 87.4 87.5 87.3Botswana 89.9 91.8 100.0 99.6 107.6 92.2 87.8 88.5 90.4 97.4Burkina Faso 101.1 109.0 100.0 101.8 101.1 102.8 107.0 100.1 94.9 91.8Burundi 87.4 97.5 100.0 99.5 102.4 102.5 106.7 121.9 122.1 135.5Cabo Verde 98.0 102.6 100.0 102.1 99.7 103.1 103.0 100.1 98.7 99.1Cameroon 101.3 106.7 100.0 100.2 96.7 99.6 100.9 97.9 99.9 100.1Central African Rep. 94.9 104.8 100.0 98.9 99.2 107.4 119.8 118.6 124.1 127.1Chad 95.9 108.1 100.0 94.0 101.8 101.8 103.2 101.2 97.7 92.3Comoros 103.4 105.1 100.0 100.3 95.6 99.2 98.2 81.7 76.9 73.0Congo, Dem. Rep. of 142.6 141.9 100.0 105.7 118.8 119.1 120.4 137.7 131.5 106.0Congo, Rep. of 97.7 107.2 100.0 99.0 96.4 103.1 104.8 98.8 102.4 102.9Côte d'Ivoire 102.2 106.4 100.0 102.0 97.9 102.3 103.3 98.8 99.3 99.2Equatorial Guinea 88.3 101.2 100.0 103.6 99.8 104.0 106.8 98.3 100.1 100.7Eritrea 58.2 89.5 100.0 110.6 130.8 151.8 176.8 227.0 271.5 324.2Ethiopia 101.7 116.8 100.0 105.1 124.7 126.2 129.3 148.2 151.4 154.2Gabon 98.9 103.9 100.0 98.6 96.5 98.4 102.8 98.8 100.7 102.5Gambia, The 102.2 103.0 100.0 92.5 90.2 83.5 76.2 76.1 91.3 93.0Ghana 102.5 93.7 100.0 95.1 89.1 89.7 69.6 70.6 80.6 79.1Guinea 95.9 107.8 100.0 96.5 107.6 120.7 131.0 147.4 133.9 139.3Guinea-Bissau 98.5 104.5 100.0 102.1 99.6 101.2 100.3 97.8 99.7 99.6Kenya 91.8 101.3 100.0 95.7 108.8 112.7 116.8 122.1 126.8 130.8Lesotho 90.1 87.8 100.0 100.6 94.7 84.7 79.2 73.8 68.8 76.6Liberia 91.6 98.4 100.0 99.8 109.0 107.7 107.9 132.0 132.1 119.4Madagascar 85.8 100.2 100.0 105.3 104.2 107.9 104.2 101.7 100.6 108.1Malawi 95.9 106.5 100.0 97.0 79.2 66.9 72.8 83.6 72.6 74.6Mali 98.4 105.4 100.0 100.5 101.0 101.5 103.4 99.7 97.9 98.6Mauritius 94.1 96.8 100.0 106.3 107.9 107.8 111.2 110.0 111.2 115.9Mozambique 102.8 103.4 100.0 105.8 113.3 112.8 112.7 104.6 81.3 84.8Namibia 91.7 88.9 100.0 98.5 94.7 86.5 81.5 79.5 77.0 85.3Niger 101.1 107.2 100.0 100.0 94.7 98.2 97.7 92.8 92.9 94.3Nigeria 88.0 92.0 100.0 100.4 111.5 119.0 127.4 126.5 116.2 105.5Rwanda 87.0 102.5 100.0 96.7 99.1 96.7 92.5 100.0 97.4 93.5São Tomé & Príncipe 82.4 102.8 100.0 111.7 117.4 128.5 137.5 138.4 147.6 154.2Senegal 105.0 106.6 100.0 101.1 97.3 99.5 98.7 92.8 94.2 93.7Seychelles 129.8 95.7 100.0 92.7 91.8 108.1 104.7 116.8 116.9 110.8Sierra Leone 95.0 103.4 100.0 100.7 117.4 127.1 131.0 142.8 130.0 112.2South Africa 92.0 86.5 100.0 98.0 92.7 83.0 77.8 77.4 71.8 81.0South Sudan ... ... ... ... ... ... ... ... ... ...Swaziland 93.9 92.6 100.0 100.1 100.2 94.2 90.4 89.8 87.5 94.3Tanzania 99.7 104.5 100.0 93.4 108.6 116.4 119.2 113.8 110.5 109.3Togo 100.6 106.5 100.0 100.7 96.8 98.9 100.1 93.0 94.0 92.5Uganda 103.5 107.3 100.0 95.9 107.9 109.1 111.2 105.7 103.1 99.7Zambia 90.7 94.4 100.0 97.4 100.7 104.4 100.2 91.1 88.6 96.5Zimbabwe ... ... ... ... ... ... ... ... ... ...
Sub-Saharan Africa 92.6 96.2 100.0 99.5 104.1 104.7 105.5 105.4 101.1 101.9Median 95.9 103.4 100.0 100.1 100.2 102.8 103.4 100.0 99.7 99.6
Excluding Nigeria and South Africa 95.5 104.7 100.0 99.7 105.1 107.5 107.3 107.9 107.7 110.5
Oil-exporting countries 87.5 95.5 100.0 100.6 109.8 116.5 123.5 122.3 114.8 110.0 Excluding Nigeria 87.0 105.7 100.0 101.3 105.1 110.0 113.4 111.4 111.0 123.7Oil-importing countries 96.3 96.7 100.0 98.7 100.1 96.8 93.8 94.4 91.9 96.0
Excluding South Africa 98.7 104.4 100.0 99.2 105.1 106.7 105.4 106.7 106.6 107.0
Middle-income countries 90.7 93.1 100.0 99.4 102.8 103.1 103.4 102.6 97.9 99.5Excluding Nigeria and South Africa 91.9 101.1 100.0 99.6 102.1 104.5 102.5 101.2 103.4 110.0
Low-income countries 100.5 109.5 100.0 99.8 109.0 111.4 113.5 116.6 113.4 111.7Excluding low-income countries in fragile situations 100.7 108.7 100.0 99.1 111.1 114.1 116.1 117.2 114.3 114.0
Countries in fragile situations 100.3 109.5 100.0 101.1 103.0 105.5 107.6 110.5 108.4 105.4
CFA franc zone 99.4 106.1 100.0 100.4 98.2 101.1 102.6 97.6 98.0 97.7CEMAC 96.9 105.4 100.0 99.6 98.0 101.2 103.4 99.1 100.6 100.4WAEMU 101.8 106.7 100.0 101.1 98.4 101.0 101.9 96.3 95.8 95.4
COMESA (SSA members) 97.9 107.2 100.0 100.2 110.1 111.6 113.4 119.4 119.5 120.0EAC-5 96.2 103.6 100.0 95.1 107.9 112.1 114.8 114.3 114.0 114.0ECOWAS 91.3 94.7 100.0 100.0 107.4 113.4 117.3 116.1 110.1 102.5SACU 91.9 86.8 100.0 98.1 93.4 83.6 78.4 78.0 72.8 81.8SADC 92.2 93.7 100.0 99.0 99.2 94.1 91.3 90.8 85.7 94.2
Table SA22. Real Effective Exchange Rates1
(Annual average; index, 2010 = 100)

STATISTICAL APPENDIX
115
2004-08 2009 2010 2011 2012 2013 2014 2015 2016 2017Angola 114.0 118.9 100.0 94.2 96.9 96.6 95.5 88.9 66.6 64.1Benin 104.1 105.8 100.0 101.2 96.1 99.6 102.2 93.1 96.3 99.1Botswana 115.5 95.7 100.0 95.4 98.3 81.4 75.5 74.2 73.7 78.5Burkina Faso 92.1 103.4 100.0 104.2 104.0 110.4 121.7 120.9 124.2 128.9Burundi 108.4 99.2 100.0 96.1 87.8 84.4 87.1 96.8 94.3 89.9Cabo Verde 101.7 102.4 100.0 101.1 99.1 102.8 104.4 102.7 104.1 106.3Cameroon 100.4 104.6 100.0 101.2 98.1 101.7 103.3 99.5 103.1 105.8Central African Rep. 101.7 104.4 100.0 100.8 97.8 101.3 103.0 98.6 99.8 100.5Chad 98.4 103.0 100.0 101.1 98.8 100.7 102.1 98.5 101.0 102.4Comoros 99.6 104.5 100.0 102.9 100.1 105.2 106.7 99.3 102.2 107.9Congo, Dem. Rep. of 194.0 113.1 100.0 94.9 100.0 100.9 102.4 117.9 111.6 75.8Congo, Rep. of 101.7 105.2 100.0 101.1 98.2 102.0 103.4 97.1 99.2 99.8Côte d'Ivoire 101.6 105.1 100.0 100.6 97.9 102.0 104.6 100.5 101.8 102.9Equatorial Guinea 98.9 104.7 100.0 102.0 97.0 99.4 99.2 90.2 91.2 92.8Eritrea 96.9 98.1 100.0 98.7 102.7 104.1 105.6 118.2 123.1 130.7Ethiopia 164.0 122.3 100.0 81.9 81.4 78.3 76.6 81.7 79.4 75.7Gabon 101.6 103.5 100.0 100.3 97.8 100.7 102.0 98.8 99.8 100.4Gambia, The 107.9 105.2 100.0 91.7 88.2 79.1 69.5 66.3 75.4 72.7Ghana 155.6 101.1 100.0 90.8 80.4 74.4 51.1 44.9 44.4 39.7Guinea 167.0 120.9 100.0 82.3 81.7 84.0 85.0 90.1 77.0 75.1Guinea-Bissau 100.9 103.6 100.0 100.5 98.3 100.7 101.9 98.6 100.1 100.7Kenya 107.4 102.5 100.0 89.0 96.7 97.6 97.2 97.7 97.3 95.5Lesotho 106.8 89.2 100.0 98.8 89.8 78.1 70.8 64.5 57.3 62.1Liberia 122.9 103.4 100.0 95.0 99.7 93.5 86.3 98.7 91.4 76.1Madagascar 113.0 107.0 100.0 99.6 95.7 95.6 88.6 81.3 76.2 77.2Malawi 115.5 110.3 100.0 94.3 67.7 45.4 41.3 40.5 29.8 28.3Mali 99.5 103.8 100.0 101.2 99.3 102.8 105.9 102.9 105.1 106.7Mauritius 104.9 96.9 100.0 103.3 104.0 102.8 104.8 103.8 105.6 108.3Mozambique 143.7 128.9 100.0 112.4 121.0 118.9 119.2 109.4 73.4 68.2Namibia 104.5 90.6 100.0 97.6 90.8 81.0 74.3 71.5 66.6 71.7Niger 99.7 104.9 100.0 100.9 98.1 102.1 104.9 100.8 102.8 104.4Nigeria 118.4 101.8 100.0 94.1 95.9 96.7 98.0 91.2 74.3 58.8Rwanda 102.9 101.9 100.0 97.4 98.5 95.2 91.8 99.7 93.9 88.7São Tomé & Príncipe 156.6 114.1 100.0 101.0 98.4 101.4 103.1 99.7 101.9 103.0Senegal 100.5 104.7 100.0 101.4 99.1 103.1 105.7 101.5 103.6 104.1Seychelles 200.7 91.4 100.0 93.5 88.9 102.6 99.2 108.5 110.9 107.4Sierra Leone 139.6 119.1 100.0 87.9 92.4 93.2 90.4 91.5 75.8 64.1South Africa 110.4 88.2 100.0 96.3 88.3 76.2 68.4 65.7 57.9 63.2South Sudan ... ... ... ... ... ... ... ... ... ...Swaziland 105.7 93.7 100.0 98.3 94.1 87.2 82.5 80.3 75.3 79.1Tanzania 120.0 108.2 100.0 87.4 90.2 92.0 91.3 84.5 79.6 76.7Togo 100.2 104.7 100.0 101.6 98.6 102.3 106.3 99.7 102.7 105.6Uganda 122.8 108.3 100.0 85.4 88.7 88.3 89.9 81.0 78.6 74.2Zambia 119.5 99.6 100.0 94.9 94.9 94.7 86.8 73.8 61.9 65.0Zimbabwe ... ... ... ... ... ... ... ... ... ...
Sub-Saharan Africa 116.6 101.0 100.0 94.5 93.0 89.9 86.9 82.8 73.5 68.7Median 106.8 104.4 100.0 98.7 97.8 99.4 99.2 97.7 94.3 89.9
Excluding Nigeria and South Africa 118.0 107.6 100.0 93.9 93.4 92.5 89.5 86.4 81.1 78.5
Oil-exporting countries 114.6 104.1 100.0 95.1 96.3 97.3 98.3 91.7 76.4 64.2 Excluding Nigeria 106.3 110.8 100.0 97.9 97.5 98.9 99.0 93.2 82.5 81.8Oil-importing countries 117.6 98.7 100.0 94.1 90.7 84.8 79.3 76.7 71.2 71.5
Excluding South Africa 122.3 106.5 100.0 92.6 92.1 90.5 86.7 84.2 80.5 77.4
Middle-income countries 114.2 98.6 100.0 95.2 93.4 89.6 85.8 80.9 70.5 65.7Excluding Nigeria and South Africa 111.6 105.0 100.0 95.7 94.8 93.8 88.6 83.5 78.0 77.2
Low-income countries 126.6 110.9 100.0 91.8 91.7 90.9 90.7 89.9 85.0 80.1Excluding low-income countries in fragile situations 127.6 112.4 100.0 89.4 90.7 90.5 90.5 88.3 83.6 80.5
Countries in fragile situations 117.6 107.4 100.0 97.4 94.8 94.5 94.5 94.7 91.3 85.2
CFA franc zone 100.0 104.5 100.0 101.3 98.5 102.1 104.6 100.0 102.3 104.0CEMAC 100.2 104.3 100.0 101.2 97.9 101.0 102.2 97.2 99.6 101.3WAEMU 99.9 104.6 100.0 101.4 99.0 103.2 107.0 102.8 104.8 106.6
COMESA (SSA members) 127.4 107.8 100.0 90.1 91.2 89.1 87.4 87.6 83.4 78.8EAC-5 114.3 105.5 100.0 88.2 92.6 93.2 93.0 89.3 86.4 83.4ECOWAS 117.9 102.6 100.0 94.7 94.8 95.4 94.1 87.9 75.8 63.7SACU 110.3 88.6 100.0 96.4 88.9 76.7 69.1 66.4 58.9 64.2SADC 115.3 96.7 100.0 95.6 91.4 83.2 77.5 74.0 64.3 65.8
Table SA23. Nominal Effective Exchange Rates1
(Annual average; index, 2010 = 100)
See sources and footnotes on page 91.

REGIONAL ECONOMIC OUTLOOK: SUB-SAHARAN AFRICA
116
See sources and footnotes on page 91.
2004-08 2009 2010 2011 2012 2013 2014 2015 2016 2017 2018 2019Angola 28.2 20.2 20.6 19.5 19.0 23.6 27.4 35.3 46.7 36.5 41.0 42.1Benin 20.1 15.0 17.0 15.8 15.7 17.3 18.4 20.9 21.4 23.1 23.5 24.9Botswana 3.6 13.6 15.3 12.3 12.4 12.1 11.6 11.3 15.6 15.2 12.0 10.2Burkina Faso 29.4 25.6 26.7 21.7 22.9 22.1 21.8 25.9 26.1 24.4 23.1 22.7Burundi 120.2 21.2 22.4 24.0 22.6 21.0 18.9 18.2 16.7 25.9 35.2 41.1Cabo Verde 46.0 45.5 51.2 53.2 70.0 81.4 82.6 95.1 92.7 100.0 94.7 94.9Cameroon 17.9 4.9 5.6 6.3 8.2 11.4 14.9 19.4 19.9 23.2 23.2 24.5Central African Rep. 61.0 9.0 9.0 8.0 9.9 15.0 35.0 32.6 28.2 28.8 25.8 24.1Chad 23.4 27.4 24.6 20.7 20.5 21.8 29.1 25.0 27.1 28.5 26.1 25.5Comoros 73.0 51.9 48.9 44.9 41.4 18.7 18.7 24.4 29.0 28.5 26.5 26.5Congo, Dem. Rep. of 86.0 67.1 23.2 18.9 17.9 15.9 13.7 12.5 11.6 11.0 10.7 10.4Congo, Rep. of 61.5 11.1 17.1 17.0 25.3 26.0 25.1 43.8 50.1 46.3 36.8 34.7Côte d'Ivoire 67.6 52.9 47.0 48.1 29.1 27.2 24.5 28.9 26.9 30.7 33.0 31.8Equatorial Guinea 2.0 4.5 8.0 6.7 7.3 6.2 5.6 9.6 10.0 10.5 12.0 15.7Eritrea 60.0 49.1 45.8 35.8 29.4 25.1 22.5 22.6 20.5 20.1 20.1 19.9Ethiopia1 37.2 14.7 18.8 24.4 20.6 23.5 25.2 37.9 33.8 33.5 29.8 30.2Gabon 32.8 20.3 16.8 15.4 16.6 24.2 25.3 33.3 35.6 42.1 42.8 45.4Gambia, The 83.7 41.0 39.7 43.0 41.3 49.4 53.9 55.9 56.5 62.2 61.4 59.4Ghana 24.1 19.6 19.4 19.3 21.8 24.9 35.8 42.8 38.5 36.5 35.3 32.0Guinea 61.9 47.7 45.9 53.3 17.9 18.8 20.8 21.4 22.8 22.7 28.6 31.9Guinea-Bissau 161.7 128.7 38.7 24.5 27.3 25.7 22.7 23.4 21.7 19.5 17.4 17.1Kenya 25.2 20.9 21.5 22.4 21.1 19.3 22.8 24.7 26.2 28.3 30.7 29.7Lesotho 39.7 33.0 29.3 27.6 29.4 33.0 31.2 35.8 34.2 31.1 31.5 31.4Liberia 345.4 95.5 6.9 6.9 6.6 7.5 11.5 16.3 20.1 24.7 28.7 31.4Madagascar 46.0 26.0 23.5 21.6 22.8 22.5 22.7 26.0 25.4 25.5 26.2 28.2Malawi 42.2 12.9 12.4 11.4 20.1 26.6 30.0 27.8 32.7 32.6 30.8 31.3Mali 27.9 20.9 21.4 19.0 22.2 22.2 19.5 22.2 23.7 25.7 23.5 23.4Mauritius 11.9 11.0 11.9 12.7 13.2 16.1 15.7 16.3 14.7 12.8 11.7 10.3Mozambique 46.6 36.8 38.4 33.7 33.2 47.0 52.4 66.6 89.3 89.9 93.7 99.7Namibia 4.7 4.9 4.3 6.4 7.8 7.9 8.0 13.1 17.1 16.4 16.7 17.0Niger 31.2 19.6 16.9 15.5 17.1 18.2 20.5 27.2 29.7 30.6 30.2 31.9Nigeria 11.4 3.5 3.2 3.5 3.8 2.6 2.6 3.1 4.0 7.4 8.3 7.7Rwanda 36.3 13.7 13.5 15.2 14.5 20.4 22.8 26.9 34.1 37.1 37.1 38.6São Tomé & Príncipe 207.5 72.4 79.5 78.0 81.0 71.1 69.6 86.0 79.6 72.8 66.0 62.4Senegal 28.7 28.2 27.2 27.8 31.2 33.6 37.5 40.2 40.3 49.8 51.3 49.2Seychelles 61.5 87.6 49.3 48.1 48.3 39.2 37.3 35.6 31.7 29.8 28.2 26.2Sierra Leone 71.4 28.2 30.4 32.4 25.8 21.3 22.5 29.4 36.1 43.5 45.1 47.2South Africa 7.2 7.6 9.5 10.0 14.1 14.4 15.3 12.9 18.9 19.5 18.2 18.4South Sudan ... ... ... ... ... ... ... ... ... ... ... ...Swaziland 12.2 9.8 7.9 7.2 7.1 7.7 7.6 9.4 9.2 10.3 12.6 14.2Tanzania 26.7 17.4 19.3 21.1 21.7 22.8 23.6 27.6 28.7 28.5 28.9 29.9Togo 70.2 51.8 16.7 11.9 13.7 14.8 16.8 21.2 19.3 20.8 22.6 24.3Uganda 27.1 12.2 13.4 14.2 14.7 16.2 15.2 19.5 21.3 24.4 27.0 30.6Zambia 41.6 9.0 7.3 8.0 13.7 13.6 19.9 34.5 38.2 37.1 40.5 43.1Zimbabwe2 56.9 64.8 58.4 47.3 42.9 41.2 39.6 40.6 42.1 38.9 36.2 33.8
Sub-Saharan Africa 19.6 13.5 12.4 12.5 13.5 13.9 14.8 17.2 20.8 22.5 22.8 22.5Median 38.5 20.9 20.0 19.4 20.5 21.5 22.6 26.0 27.0 28.5 28.7 30.1
Excluding Nigeria and South Africa 34.9 23.2 20.8 20.1 19.7 21.6 23.7 29.3 31.1 30.8 31.5 31.8
Oil-exporting countries 15.9 7.5 7.3 7.5 7.8 8.0 8.5 10.4 13.9 16.5 17.4 16.6 Excluding Nigeria 25.7 15.8 16.6 15.7 16.6 20.2 23.2 30.4 37.5 33.3 35.2 36.3Oil-importing countries 22.1 17.7 16.1 16.1 17.9 18.9 20.5 22.8 25.6 26.1 26.0 26.2
Excluding South Africa 38.6 26.5 22.6 22.3 21.1 22.2 24.0 28.9 29.2 30.0 30.4 30.4
Middle-income countries 14.3 10.1 10.2 10.5 11.8 11.9 12.7 14.3 18.4 20.4 20.8 20.2Excluding Nigeria and South Africa 27.7 19.6 19.1 18.6 18.5 20.6 23.6 29.7 32.8 31.8 33.3 33.1
Low-income countries 45.8 28.5 23.5 22.7 21.6 23.1 23.9 28.7 29.1 29.6 29.2 30.2Excluding low-income countries in fragile situations 31.4 18.0 19.9 21.2 20.6 23.6 24.9 32.8 33.0 33.6 32.8 34.1
Countries in fragile situations 63.9 42.7 30.9 28.1 24.3 23.7 23.2 25.1 25.3 26.2 26.6 26.5
CFA franc zone 34.8 23.2 21.1 19.6 18.7 20.1 21.2 26.2 26.8 29.8 29.9 30.2CEMAC 25.3 11.1 12.3 11.5 13.5 16.0 18.4 24.1 25.7 28.3 27.5 28.7WAEMU 44.9 35.5 30.8 29.1 24.6 24.5 24.2 28.0 27.7 30.9 31.7 31.2
COMESA (SSA members) 39.8 24.6 20.0 20.0 19.9 20.2 21.6 26.8 26.9 27.6 27.7 28.1EAC-5 28.5 17.6 18.7 19.9 19.7 19.9 21.6 24.7 26.4 28.2 30.1 30.6ECOWAS 21.4 11.7 9.4 9.4 8.5 7.9 8.0 9.7 11.7 15.5 16.6 15.5SACU 7.3 7.9 9.7 10.0 13.9 14.1 15.0 12.9 18.7 19.2 17.9 18.1SADC 16.0 14.6 13.7 13.6 16.5 18.1 19.8 20.9 26.5 25.1 25.1 25.6
Table SA24. External Debt, Official Debt, Debtor Based(Percent of GDP)

STATISTICAL APPENDIX
117
2004-08 2009 2010 2011 2012 2013 2014 2015 2016 2017 2018 2019Angola 91.7 83.8 100.0 124.4 131.4 129.4 118.4 69.2 59.3 72.1 86.7 80.5Benin 42.1 78.5 100.0 107.4 74.5 63.9 62.4 60.0 58.7 55.3 52.2 47.5Botswana 105.3 97.2 100.0 102.0 112.4 126.7 121.1 125.9 139.3 112.4 111.0 111.9Burkina Faso 158.8 140.4 100.0 100.1 116.4 107.6 89.0 101.4 109.7 113.7 114.6 109.3Burundi 68.8 65.9 100.0 91.0 72.3 65.3 81.9 47.0 60.2 58.5 54.3 56.0Cabo Verde 101.2 86.7 100.0 107.4 106.7 95.1 89.3 67.4 69.2 77.7 86.5 84.1Cameroon 113.8 89.7 100.0 100.5 110.5 108.9 100.9 87.0 89.1 84.6 78.4 75.2Central African Rep. 93.3 99.4 100.0 100.6 103.5 124.4 134.0 165.8 205.8 182.1 165.5 167.7Chad 76.1 78.3 100.0 121.2 123.1 134.8 128.2 67.0 62.3 79.9 92.7 87.7Comoros 109.4 91.8 100.0 135.8 148.1 121.2 99.6 101.9 155.6 167.7 164.3 149.3Congo, Dem. Rep. of 93.8 85.1 100.0 89.4 83.9 79.8 87.0 87.6 88.1 120.0 130.7 130.8Congo, Rep. of 102.4 67.4 100.0 124.9 110.8 102.2 97.9 73.7 64.0 93.2 96.1 93.8Côte d'Ivoire 65.1 85.8 100.0 96.6 91.5 93.2 101.1 108.9 135.2 137.0 123.8 124.3Equatorial Guinea 71.9 85.2 100.0 111.1 129.0 95.2 77.2 43.5 47.1 56.4 68.1 65.1Eritrea 157.9 99.4 100.0 100.5 100.9 101.3 101.3 101.3 101.3 101.3 101.3 101.3Ethiopia1 62.8 76.7 100.0 120.2 127.5 106.2 108.6 109.3 109.7 113.1 111.2 110.9Gabon 90.4 81.5 100.0 131.4 122.0 120.7 109.6 60.4 54.2 69.4 80.5 74.4Gambia, The 158.1 117.3 100.0 93.7 118.1 137.1 120.0 96.4 111.8 83.5 81.4 86.9Ghana 60.9 83.1 100.0 118.7 116.8 107.8 100.0 85.7 87.4 82.6 82.0 80.7Guinea 97.3 88.9 100.0 78.2 119.0 128.5 134.5 150.4 159.0 150.1 155.1 169.0Guinea-Bissau 124.2 87.3 100.0 142.2 100.5 98.8 122.3 168.8 171.2 224.7 219.7 226.1Kenya 86.7 100.9 100.0 81.3 79.1 79.5 81.0 98.5 95.1 93.5 85.5 87.0Lesotho 128.8 100.0 100.0 98.1 97.9 99.2 98.9 108.2 103.9 100.5 99.0 101.9Liberia 72.8 70.6 100.0 99.8 76.6 84.6 77.7 57.2 65.8 71.6 65.5 65.7Madagascar 87.5 77.3 100.0 108.6 123.5 152.6 172.5 159.9 197.0 183.4 188.1 182.1Malawi 83.3 94.5 100.0 100.2 85.6 83.3 85.3 87.4 87.2 77.2 75.6 74.9Mali 76.0 91.6 100.0 130.8 144.9 122.0 129.4 147.9 170.3 169.5 163.7 167.3Mauritius 97.5 104.2 100.0 96.4 96.4 97.6 96.6 112.4 115.7 112.0 108.0 103.9Mozambique 91.2 87.9 100.0 101.5 93.0 93.1 91.7 89.6 91.3 94.2 94.2 93.8Namibia 78.3 91.5 100.0 110.2 106.0 116.3 119.5 114.3 94.1 94.1 94.1 94.1Niger 69.5 94.7 100.0 100.3 103.0 99.8 80.8 74.4 72.9 69.0 67.0 65.8Nigeria 96.0 90.8 100.0 113.0 113.0 114.2 111.0 81.4 76.2 83.5 90.0 86.3Rwanda 73.9 85.0 100.0 96.9 102.9 117.9 114.3 130.1 112.8 121.5 120.4 122.9São Tomé & Príncipe 152.5 93.7 100.0 87.6 141.6 106.9 114.4 95.0 125.2 125.8 141.5 147.2Senegal 83.6 100.4 100.0 94.8 95.0 87.5 89.3 100.2 101.0 96.5 100.5 102.7Seychelles 103.7 99.2 100.0 99.6 101.5 101.7 101.9 98.9 96.0 97.5 100.1 99.1Sierra Leone 98.8 93.6 100.0 93.0 95.9 92.7 77.9 60.5 65.9 74.1 73.7 74.1South Africa 84.5 94.7 100.0 106.8 102.3 101.5 100.1 103.5 105.0 112.3 109.3 107.8South Sudan ... ... ... ... ... ... ... ... ... ... ... ...Swaziland 88.5 98.4 100.0 85.8 87.9 115.6 120.3 121.4 115.1 104.2 106.6 105.8Tanzania 66.1 93.4 100.0 103.0 103.8 100.8 97.1 96.2 98.4 94.9 91.5 92.3Togo 96.6 97.0 100.0 105.1 101.0 99.6 103.0 110.1 106.2 105.7 103.6 104.2Uganda 102.0 120.2 100.0 112.4 106.5 109.0 117.7 126.0 143.4 132.2 126.8 125.3Zambia 78.8 73.2 100.0 106.1 91.6 86.0 83.8 80.9 80.2 91.9 97.5 98.0Zimbabwe2 51.3 70.5 100.0 152.1 126.5 99.7 91.8 93.2 96.8 86.6 86.5 84.3
Sub-Saharan Africa 88.2 91.1 100.0 109.7 108.9 107.6 105.0 92.0 92.7 98.3 99.8 97.7Median 90.8 91.1 100.0 101.7 103.7 101.6 100.5 97.4 97.6 95.7 98.3 98.5
Excluding Nigeria and South Africa 85.9 89.1 100.0 109.4 110.1 106.0 102.8 94.3 97.0 99.1 100.3 99.2
Oil-exporting countries 95.4 88.3 100.0 115.2 116.9 116.2 110.8 78.3 72.7 80.3 88.1 84.1 Excluding Nigeria 94.1 83.4 100.0 119.9 125.6 121.0 110.5 69.9 64.2 74.4 84.4 79.2Oil-importing countries 83.3 93.0 100.0 105.6 102.7 100.3 99.7 103.0 106.4 109.2 106.8 106.2
Excluding South Africa 82.2 91.5 100.0 104.4 103.1 99.4 99.5 102.8 107.2 107.4 105.4 105.3
Middle-income countries 89.2 91.2 100.0 109.8 108.9 108.5 105.2 89.0 88.0 94.3 96.3 93.7Excluding Nigeria and South Africa 87.7 88.0 100.0 109.7 110.8 107.6 102.0 86.9 87.5 89.4 91.7 90.0
Low-income countries 83.0 90.6 100.0 108.9 109.0 103.6 103.9 103.4 108.6 111.7 111.4 111.0Excluding low-income countries in fragile situations 80.4 94.7 100.0 108.1 109.0 102.1 100.8 103.7 106.7 106.0 103.0 102.2
Countries in fragile situations 83.0 83.8 100.0 109.0 106.0 103.1 106.2 102.7 114.4 122.9 122.8 122.9
CFA franc zone 88.3 89.7 100.0 110.0 111.2 103.7 99.1 90.5 99.7 103.4 101.5 100.3CEMAC 95.3 83.5 100.0 114.8 118.3 110.6 101.3 72.8 73.6 80.6 83.4 79.8WAEMU 80.6 96.0 100.0 104.4 103.1 96.2 96.8 105.9 119.8 120.3 114.5 114.4
COMESA (SSA members) 84.2 90.3 100.0 103.0 100.2 95.7 98.4 103.6 105.7 108.8 107.3 106.8EAC-5 82.0 100.9 100.0 95.6 93.6 94.0 94.9 103.3 104.3 100.7 94.6 95.4ECOWAS 91.1 91.1 100.0 111.5 111.7 111.1 108.3 85.8 85.8 91.7 95.4 92.7SACU 85.3 94.8 100.0 106.4 102.6 103.0 101.8 105.0 106.4 111.5 108.7 107.5SADC 85.6 91.4 100.0 108.8 106.6 106.1 103.4 96.6 96.9 102.9 104.8 102.9
Table SA25. Terms of Trade on Goods(Index, 2010 = 100)
See sources and footnotes on page 91.

REGIONAL ECONOMIC OUTLOOK: SUB-SAHARAN AFRICA
118
See sources and footnotes on page 91.
2004-08 2009 2010 2011 2012 2013 2014 2015 2016 2017 2018 2019Angola 3.1 4.4 5.0 7.1 7.8 7.2 8.8 10.7 9.2 6.0 6.9 7.1Benin1 ... ... ... ... ... ... ... ... ... ... ... ...Botswana 20.7 15.9 11.5 10.9 10.0 10.6 12.9 13.4 14.2 14.3 15.3 17.6Burkina Faso1 ... ... ... ... ... ... ... ... ... ... ... ...Burundi 3.6 4.4 4.1 3.3 3.5 3.5 3.9 2.1 1.7 2.6 3.0 3.9Cabo Verde 3.2 4.1 3.4 3.7 4.0 4.5 7.4 6.0 6.1 5.2 5.4 5.2Cameroon2 ... ... ... ... ... ... ... ... ... ... ... ...Central African Rep.2 ... ... ... ... ... ... ... ... ... ... ... ...Chad2 ... ... ... ... ... ... ... ... ... ... ... ...Comoros 6.3 6.4 5.5 6.4 6.8 6.0 8.4 9.2 7.1 6.2 6.5 6.2Congo, Dem. Rep. of 0.3 1.1 1.1 1.3 1.5 1.4 1.6 1.2 0.5 0.4 0.8 1.0Congo, Rep. of 2 ... ... ... ... ... ... ... ... ... ... ... ...Côte d'Ivoire1 ... ... ... ... ... ... ... ... ... ... ... ...Equatorial Guinea2 ... ... ... ... ... ... ... ... ... ... ... ...Eritrea 2.1 2.6 1.9 2.2 2.4 2.0 2.3 2.2 2.0 1.5 1.6 1.6Ethiopia3 2.3 1.9 2.0 2.6 2.0 1.8 1.5 1.9 2.1 1.9 2.1 2.4Gabon2 ... ... ... ... ... ... ... ... ... ... ... ...Gambia, The 3.7 5.3 5.2 5.2 6.0 4.8 3.0 2.3 1.4 2.9 3.5 3.8Ghana 2.7 2.7 2.9 2.9 2.9 2.9 2.5 2.6 2.6 2.9 3.3 2.7Guinea 0.5 2.4 1.2 3.2 2.9 2.9 3.3 1.1 1.3 1.5 2.1 2.2Guinea-Bissau1 ... ... ... ... ... ... ... ... ... ... ... ...Kenya 2.9 3.4 2.9 2.8 3.7 3.9 5.3 5.5 4.7 4.0 4.1 4.3Lesotho 4.7 5.3 4.3 3.9 5.5 5.4 6.2 5.9 4.5 3.6 3.1 2.7Liberia 0.3 2.2 2.2 1.9 2.0 1.6 1.7 2.3 2.8 2.7 2.9 2.9Madagascar 2.5 3.5 2.6 3.6 3.1 2.3 2.7 2.8 3.1 3.6 3.7 3.9Malawi 1.3 0.9 1.6 1.0 1.1 2.0 3.0 3.2 2.9 3.3 3.0 3.1Mali1 ... ... ... ... ... ... ... ... ... ... ... ...Mauritius 3.8 4.5 4.2 4.4 5.0 5.3 6.9 7.8 8.4 8.6 8.3 8.6Mozambique 4.2 5.0 3.4 2.3 2.6 3.1 3.5 3.7 3.4 3.8 2.7 2.0Namibia 2.0 3.9 3.0 2.9 2.8 2.1 1.8 2.9 2.7 3.4 2.9 2.7Niger1 ... ... ... ... ... ... ... ... ... ... ... ...Nigeria 10.7 7.2 4.3 4.8 6.9 6.0 5.6 7.2 6.9 7.6 8.1 7.3Rwanda 3.5 6.5 5.2 6.5 5.6 4.8 3.9 3.6 4.1 4.2 4.0 4.0São Tomé & Príncipe 4.6 6.6 3.9 4.6 3.5 3.3 4.1 4.7 3.7 3.4 3.5 3.6Senegal1 ... ... ... ... ... ... ... ... ... ... ... ...Seychelles 0.8 2.2 2.6 2.6 2.7 3.2 3.9 4.3 4.0 3.8 3.5 3.5Sierra Leone 3.8 3.4 1.6 1.8 2.2 2.0 3.5 3.8 3.1 2.8 2.8 2.8South Africa 3.5 4.6 4.3 4.7 5.0 5.1 5.9 6.2 5.7 5.5 5.4 5.1South Sudan ... ... ... 6.3 3.5 2.5 1.4 0.3 0.2 0.1 0.1 0.1Swaziland 2.5 4.0 4.0 3.2 4.2 4.7 5.2 4.2 3.8 3.8 4.0 3.8Tanzania 4.8 4.6 4.1 3.5 3.6 4.0 4.3 4.7 5.0 5.0 4.6 4.6Togo1 ... ... ... ... ... ... ... ... ... ... ... ...Uganda 5.6 4.9 3.9 3.7 4.7 4.8 5.3 5.4 5.2 5.1 4.5 4.3Zambia 1.7 3.8 3.0 2.8 2.7 2.6 3.4 3.4 2.4 1.8 2.0 2.0Zimbabwe4 0.2 0.8 0.6 0.5 0.6 0.4 0.5 0.6 0.8 0.5 0.5 0.5
Sub-Saharan Africa 5.1 5.1 4.1 4.5 5.2 4.9 5.2 5.8 5.2 5.0 5.3 5.1Median 3.1 4.1 3.4 3.3 3.5 3.3 3.9 3.7 3.4 3.6 3.5 3.6
Excluding Nigeria and South Africa 3.6 4.1 3.8 4.2 4.3 4.1 4.6 4.7 4.0 3.6 3.9 4.0
Oil-exporting countries 7.3 6.4 4.4 5.3 6.7 6.0 6.0 7.3 6.6 6.5 7.1 6.8 Excluding Nigeria 3.6 4.8 4.7 6.1 6.4 5.9 6.8 7.5 6.0 4.6 5.3 5.7Oil-importing countries 3.5 4.2 3.8 4.0 4.1 4.0 4.5 4.6 4.2 4.1 4.1 4.1
Excluding South Africa 3.6 3.8 3.3 3.2 3.3 3.2 3.6 3.6 3.4 3.3 3.4 3.5
Middle-income countries 5.5 5.5 4.3 4.9 5.8 5.5 5.8 6.7 6.0 5.8 6.2 5.9Excluding Nigeria and South Africa 4.1 4.7 4.5 5.1 5.3 5.1 6.0 6.5 5.3 4.6 5.1 5.3
Low-income countries 2.9 3.2 2.7 2.8 2.7 2.6 2.7 2.5 2.4 2.3 2.3 2.4Excluding low-income countries in fragile situations 3.8 3.8 3.2 2.8 3.0 3.0 3.1 3.2 3.2 3.1 3.0 3.1
Countries in fragile situations 2.1 3.0 3.0 3.8 3.1 2.7 2.7 2.0 1.6 1.7 2.2 2.4
CFA franc zone 3.6 4.6 4.1 4.1 4.1 3.9 4.0 3.5 2.2 2.5 3.1 3.4CEMAC 4.3 5.4 4.6 5.4 5.6 5.4 5.8 4.3 2.4 2.5 3.3 4.0WAEMU 5.4 5.9 6.6 5.7 5.1 4.5 4.7 5.0 4.0 4.2 4.2 4.3
COMESA (SSA members) 2.4 3.0 2.7 2.7 3.0 2.9 3.4 3.4 3.1 2.8 2.9 3.1EAC-5 4.1 4.3 3.7 3.4 4.0 4.1 4.9 5.0 4.8 4.4 4.3 4.4ECOWAS 7.4 6.2 4.0 4.4 5.9 5.3 5.0 6.2 5.6 6.0 6.4 5.9SACU 4.0 5.0 4.4 4.9 5.1 5.2 6.1 6.3 6.0 5.8 5.7 5.5SADC 3.7 4.5 4.2 4.8 5.0 5.0 5.8 6.2 5.7 5.1 5.2 5.1
Table SA26. Reserves(Months of imports of goods and services)

STATISTICAL APPENDIX
119
2004-08 2009 2010 2011 2012 2013 2014 2015 2016 2017Angola 27.6 58.4 57.4 57.2 57.1 57.7 60.5 72.7 68.9 53.0Benin 31.6 43.0 46.9 50.9 51.5 55.6 60.3 67.7 70.0 65.2Botswana 51.4 64.2 61.0 53.0 57.7 54.6 52.1 60.6 55.3 55.0Burkina Faso 26.5 31.7 35.5 37.8 39.6 45.1 52.0 60.5 65.8 70.5Burundi 28.8 31.5 36.1 36.1 35.1 33.7 34.7 34.9 35.2 37.1Cabo Verde 90.0 98.5 103.0 111.2 120.6 134.5 137.0 141.1 148.8 151.4Cameroon 20.7 23.5 26.0 26.9 25.7 27.4 27.6 28.6 29.5 30.1Central African Rep. 12.6 15.8 17.3 19.1 19.2 25.7 25.4 24.6 24.1 ...Chad 7.3 9.4 10.0 10.3 11.0 11.7 14.6 17.0 21.3 21.7Comoros 25.1 34.4 37.6 41.5 44.5 42.5 42.9 47.4 53.4 49.7Congo, Dem. Rep. of 6.7 12.3 11.4 12.2 14.0 14.0 14.3 14.9 15.6 ...Congo, Rep. of 12.2 17.0 18.4 23.1 28.0 29.6 34.2 44.8 47.5 ...Côte d'Ivoire 22.3 27.0 29.5 35.0 33.9 35.1 38.1 42.0 44.0 46.8Equatorial Guinea 9.0 14.2 16.1 14.1 18.0 20.2 21.8 29.6 32.1 30.4Eritrea 143.7 126.0 124.7 113.1 105.6 110.0 104.9 ... ... ...Ethiopia ... ... ... ... ... ... ... ... ... ...Gabon 23.6 26.5 23.4 25.5 28.8 32.3 29.9 33.2 34.6 24.5Gambia, The 48.3 61.7 66.8 70.5 70.6 73.6 81.1 ... ... ...Ghana 29.7 40.1 39.5 38.1 37.3 39.6 46.4 47.6 50.2 47.6Guinea 12.5 13.0 19.9 24.1 19.4 19.8 21.7 24.6 23.5 ...Guinea-Bissau 10.8 19.2 24.3 27.6 27.0 28.4 30.2 31.8 32.0 22.7Kenya 57.4 54.1 56.0 57.6 58.1 60.7 63.6 63.3 59.2 55.3Lesotho 37.5 45.4 45.7 41.3 39.8 46.4 43.2 44.2 39.6 43.9Liberia ... ... ... ... ... ... ... ... ... ...Madagascar 23.8 25.6 25.5 26.2 26.3 24.8 25.0 25.3 26.3 ...Malawi 15.3 23.5 27.3 29.8 31.8 31.6 30.2 32.1 ... ...Mali 27.6 32.3 34.9 33.2 33.9 39.1 45.0 49.4 51.8 49.3Mauritius1 284.6 316.8 369.9 377.9 377.4 365.1 352.7 349.7 326.8 348.4Mozambique 33.2 46.5 52.7 53.7 61.0 63.7 71.7 80.0 78.1 73.1Namibia 66.3 95.3 93.3 93.6 88.1 85.2 82.1 88.3 88.5 91.8Niger 13.2 20.0 22.7 23.1 24.4 26.0 28.7 29.6 31.1 32.3Nigeria 27.5 39.0 31.2 30.4 29.2 30.1 30.5 29.7 31.2 30.4Rwanda 23.9 22.7 25.5 31.5 31.7 35.3 37.8 38.1 37.7 37.9São Tomé & Príncipe 63.1 80.3 77.2 74.7 85.6 81.4 78.4 80.5 73.5 64.0Senegal 36.6 44.5 47.3 49.9 49.8 55.6 60.7 66.6 71.5 69.6Seychelles 118.8 100.0 109.3 113.0 102.2 117.5 116.5 93.0 93.7 99.0Sierra Leone 16.2 25.9 24.9 24.5 23.0 21.3 23.1 26.5 27.8 30.2South Africa 116.4 120.9 116.3 115.4 115.1 111.4 113.0 122.4 114.8 113.6South Sudan ... ... ... 6.7 14.7 13.4 19.3 68.7 75.2 51.5Swaziland 27.3 34.3 34.2 34.9 33.2 35.2 34.1 35.9 37.8 38.1Tanzania 24.2 27.7 30.0 28.8 29.0 28.8 29.4 31.3 28.4 ...Togo 34.6 44.2 48.9 58.4 65.2 74.2 72.9 77.8 90.1 86.4Uganda 24.0 23.1 26.6 26.1 27.1 28.0 29.1 28.9 30.5 31.1Zambia 24.9 25.9 25.5 25.8 27.6 29.2 31.8 38.1 33.1 32.6Zimbabwe … ... ... ... ... ... ... ... ... ...
Sub-Saharan Africa 42.4 49.2 51.9 52.0 52.8 54.6 55.9 58.1 58.9 63.2Median 26.6 32.3 34.9 34.9 33.9 35.2 38.0 43.1 44.0 49.3
Excluding Nigeria and South Africa 40.8 47.6 50.8 50.9 51.9 53.8 55.1 57.1 58.2 62.6
Oil-exporting countries 18.3 26.8 26.1 24.3 26.6 27.8 29.8 40.5 42.5 34.5Excluding Nigeria 16.7 24.8 25.2 23.4 26.2 27.5 29.7 42.1 44.2 35.2
Oil-importing countries 47.3 53.7 57.3 58.5 59.0 61.0 62.1 62.5 63.2 70.9Excluding South Africa 45.2 51.7 55.5 56.8 57.3 59.4 60.5 60.5 61.4 69.2
Middle-income countries 57.3 66.3 69.0 69.9 70.7 72.4 72.7 75.6 74.0 75.0Excluding Nigeria and South Africa 55.7 64.8 68.5 69.6 70.5 72.6 72.8 75.5 74.1 75.4
Low-income countries 28.1 32.8 35.7 35.7 36.6 38.5 40.7 40.6 43.0 47.0Excluding low-income countries in fragile situations 25.2 30.7 34.3 36.0 37.7 40.4 44.2 48.0 48.8 51.7
Countries in fragile situations 30.1 35.2 37.3 37.0 38.3 39.4 40.9 40.1 42.7 45.9
Table SA27. Banking Penetration(Total banking sector assets in percent of GDP)
See sources and footnotes on page 91.

REGIONAL ECONOMIC OUTLOOK: SUB-SAHARAN AFRICA
120
See sources and footnotes on page 91.
2004-08 2009 2010 2011 2012 2013 2014 2015 2016 2017Angola 42.6 55.8 72.5 79.3 89.1 85.8 75.0 67.2 60.2 62.0Benin 74.7 76.0 72.6 74.8 73.2 72.5 72.2 63.4 61.0 76.9Botswana 55.8 55.4 55.4 67.5 74.0 79.1 82.5 76.4 76.9 76.7Burkina Faso 84.8 78.1 73.3 74.3 79.2 85.6 90.4 87.2 79.9 80.9Burundi 67.7 59.3 66.1 81.8 81.4 75.6 75.7 73.9 72.1 59.1Cabo Verde 54.8 72.5 74.2 80.2 73.9 64.7 59.2 57.2 53.6 54.0Cameroon 69.3 68.3 69.4 70.3 80.1 81.4 82.3 87.9 90.3 87.1Central African Rep. 118.0 98.2 103.7 99.6 109.1 108.3 108.2 99.1 100.9 ...Chad 82.7 85.5 73.4 73.5 77.5 80.2 80.9 83.3 87.7 94.9Comoros 49.5 54.2 57.6 55.1 56.5 64.7 67.9 70.0 67.0 75.5Congo, Dem. Rep. of 49.7 58.6 57.5 68.8 68.0 68.7 71.4 73.7 80.0 ...Congo, Rep. of 36.4 38.7 39.5 38.3 49.8 59.6 55.3 72.8 82.0 ...Côte d'Ivoire 89.3 84.7 77.3 66.9 71.1 76.1 75.0 79.4 81.7 84.3Equatorial Guinea 43.0 56.6 59.0 68.1 38.0 48.1 54.1 74.9 91.5 95.5Eritrea 24.6 25.3 23.8 24.0 24.7 23.3 21.9 ... ... ...Ethiopia ... ... ... ... ... ... ... ... ... ...Gabon 62.5 59.6 62.7 62.9 65.1 77.7 81.4 73.3 80.0 82.4Gambia, The 38.0 42.1 43.7 40.8 39.9 37.5 30.8 ... ... ...Ghana 73.3 73.4 65.5 57.9 63.2 69.5 70.6 70.3 65.8 62.9Guinea ... ... ... ... ... ... ... ... ... ...Guinea-Bissau 42.8 93.5 66.0 65.9 92.0 83.3 72.0 84.2 82.8 62.5Kenya 76.6 72.5 72.6 77.8 76.9 80.5 83.7 87.0 88.6 83.5Lesotho 26.4 34.9 36.6 37.2 50.9 45.3 47.9 45.7 50.8 44.9Liberia ... ... ... ... ... ... ... ... ... ...Madagascar 72.2 72.2 73.8 69.1 64.0 68.9 72.7 77.0 68.4 69.8Malawi ... ... ... ... ... ... ... ... ... ...Mali 78.7 71.9 71.3 75.7 76.3 80.3 78.9 79.3 84.1 92.2Mauritius 65.5 67.7 68.2 80.9 77.2 72.6 74.9 68.0 66.8 66.1Mozambique 53.3 67.7 74.4 74.4 71.1 74.4 73.5 61.7 66.2 67.2Namibia 110.1 73.6 73.9 74.8 78.3 81.1 88.8 92.5 95.4 92.8Niger 77.1 90.2 78.3 93.8 89.9 98.7 89.9 96.1 101.3 111.0Nigeria 76.3 79.1 64.0 56.2 54.8 57.4 65.3 68.3 77.9 72.1Rwanda 78.4 85.9 83.2 88.7 94.9 84.4 86.2 81.3 85.9 89.8São Tomé & Príncipe 66.7 74.9 108.1 110.0 84.0 78.2 58.9 76.0 72.3 63.8Senegal 80.8 78.8 77.8 83.8 84.4 87.6 84.9 78.8 81.6 91.4Seychelles 30.9 30.7 35.9 33.9 34.7 28.9 31.8 42.6 43.8 43.4Sierra Leone 38.7 47.2 47.5 46.5 40.5 37.0 34.4 31.9 30.6 33.3South Africa 122.8 120.1 120.7 113.2 119.0 118.7 117.3 118.1 117.5 115.6South Sudan ... ... ... 9.8 11.8 15.2 11.3 7.7 8.7 8.7Swaziland 96.7 79.6 74.4 85.8 79.8 81.7 86.2 79.3 72.8 73.9Tanzania 52.0 64.6 62.1 67.1 69.9 71.2 75.6 81.4 87.3 ...Togo 72.7 63.1 67.8 73.4 77.5 85.9 75.0 78.2 71.6 71.2Uganda 58.8 71.4 77.2 85.5 79.5 80.0 74.6 75.4 75.8 71.2Zambia 50.5 60.1 52.9 56.5 65.2 61.1 65.7 60.1 54.1 49.7Zimbabwe … ... ... ... ... ... ... ... ... ...
Sub-Saharan Africa 65.2 67.8 67.5 68.6 69.7 70.8 70.1 73.2 74.1 72.5Median 66.1 71.4 69.4 71.8 73.9 75.9 74.8 75.7 77.4 73.0
Excluding Nigeria and South Africa 63.3 66.0 66.2 67.7 68.8 69.9 69.0 72.1 72.8 71.2
Oil-exporting countries 59.0 63.4 62.9 57.3 58.3 63.2 63.2 66.9 72.3 71.8Excluding Nigeria 56.1 60.8 62.8 57.4 58.8 64.0 62.9 66.7 71.5 71.8
Oil-importing countries 66.5 68.7 68.5 71.4 72.5 72.7 71.8 74.8 74.6 72.7Excluding South Africa 64.7 67.1 66.9 70.1 71.0 71.2 70.4 73.3 73.1 71.1
Middle-income countries 66.5 66.9 68.0 70.1 70.5 71.8 72.0 73.8 75.2 73.8Excluding Nigeria and South Africa 62.8 63.2 65.3 68.4 68.6 69.9 69.9 71.6 72.7 71.4
Low-income countries 63.7 68.7 67.0 67.1 68.8 69.8 68.2 72.5 72.8 70.9Excluding low-income countries in fragile situations 68.4 76.3 74.4 79.8 79.7 81.0 80.3 78.1 79.6 82.8
Countries in fragile situations 61.6 64.6 65.2 62.4 64.0 65.2 61.9 70.5 70.7 65.0
Table SA28. Banking Sector: Loan-to-Deposit Ratio1
(Percent of deposits)
See sources and footnotes on page 91.

121
BOOKS AND MONOGRAPHS2017
Women, Work, and Economic Growth: Leveling the Playing FieldKochhar, Kalpana, Monique Newiak, Sonali Jain-Chandra
2016Building Integrated Economies in West Africa: Lessons in Managing Growth, Inclusiveness and VolatilityAlexei KireyevAfrica on the Move: Unlocking the Potential of Small Middle-Income StatesLamin Leigh, Ali M Mansoor
2015The Quest for Regional Integration in the East African Community: Drummond, Paulo, S.K. Wajid, Oral Williams
2014The Mystery of Missing Real Spillovers in Southern Africa: Some Facts and Possible ExplanationsBasdevant, Olivier, Andrew W. Jonelis, Borislava Mircheva, Slavi T. Slavov
2013Building a Common Future in Southern Africa Mongardini, Joannes, Tamon Asonuma, Olivier Basdevant, Alfredo Cuevas, Xavier Debrun, Lars Holger Engstrom, Imelda M. Flores Vazquez, Vitaliy Kramarenko, Lamin Leigh, Paul R. Masson, Geneviève Verdier
2012Oil Wealth in Central Africa: Policies for Inclusive GrowthCoorey, Sharmini, Bernardin Akitoby
DEPARTMENTAL PAPERS 17/4
Structural Transformation in Employment and Productivity: What Can Africa Hope For?Louise Fox, Alun H. Thomas, Cleary Haines
17/4A Rebalancing Act for China and Africa : The Effects of China’s Rebalancing on Sub-Saharan Africa’s Trade and Growth Wenjie Chen, Roger Nord
16/6A Work in Progress: Integrating Markets for Goods, Labor, and Capital in the East African CommunityAlper, Emre, Fan Yang, Hervé Joly, Jemma Dridi, Wenjie Chen
16/5 Financial Development in Sub-Saharan Africa: Promoting Inclusive and Sustainable GrowthMontfort Mlachila, Larry Cui, Ahmat Jidoud, Monique Newiak, Bozena Radzewicz-Bak, Misa Takebe, Yanmin Ye, Jiayi Zhang
16/4Cyclical Behavior of Fiscal Policy among Sub-Saharan African CountriesTetsuya Konuki, Mauricio Villafuerte
16/3Walking a Find Line: Public Investment Scaling-Up and Debt Sustainability in Burkina FasoLonkeng Ngouana, Constant A., Malangu Kabedi-Mbuyi, Mame Astou Diouf
16/2Trade Integration and Global Value Chains in Sub-Saharan Africa: In Pursuit of the Missing Link Allard, Céline , Jorge Iván Canales Kriljenko, Jesus Gonzalez-Garcia, Emmanouil Kitsios, Juan P. Trevino, Wenjie Chen
16/1Make Investment Scaling-up Work in Benin: A Macro-Fiscal AnalysisBarhoumi, Karim, Larry Cui, Christine Dieterich, Nicolas End, Matteo Ghilardi, Alexander Raabe, Sergio Sola
15/10Strengthening the West African Economic and Monetary Union: The Role of Fiscal and Market Institutions in Economic Stabilization Basdevant, Olivier, Patrick A. Imam, Tidiane Kinda, Aleksandra Zdzienicka
15/8Evolving Banking Trends in Sub-Saharan Africa: Key Features and Challenges Mecagni, Mauro, Daniela Marchettini, Rodolfo Maino
15/7Monitoring and Managing Fiscal Risks in the East African Community Mauro, Paolo, Herve Joly, Ari Aisen, Emre Alper, François Boutin-Dufresne, Jemma Dridi, Nikoloz Gigineishvili, Tom Josephs, Clara Mira, Vimal Thakoor, Alun H. Thomas, Fan Yang
15/6Toward a Monetary Union in the East African Community: Asymmetric Shocks, Exchange Rates, and Risk-Sharing MechanismsDrummond, Paulo, Ari Aisen, C. Emre Alper, Ejona Fuli, Sebastien Walker
15/5Building Resilience in Sub-Saharan Africa’s Fragile StatesGelbard, Enrique, Corinne Délechat, Ejona Fuly, Mumtaz Hussain, Ulrich Jacoby, Dafina Mulaj, Marco Pani, Gustavo Ramirez, Rui Xu
15/4Dollarization in Sub-Saharan Africa: Experiences and Lessons Mecagni, Mauro, Juan S. Corrales, Jemma Dridi, Rodrigo Garcia-Verdu, Patrick A. Imam, Justin Matz, Carla Macario, Rodolfo Maino, Yibin Mu, Ashwin Moheeput, Futoshi Narita, Marco Pani, Manuel Rosales, Sebastian Weber, Etienne B. Yehoue
Publications of the IMF African Department, 2012–18

REGIONAL ECONOMIC OUTLOOK: SUB-SAHARAN AFRICA
122
15/3Pan-African Banking: Opportunities and Challenges for Cross-Border Oversight Enoch, Charles, Paul Henri Mathieu, Mauro Mecagni, Jorge Iván Canales Kriljenko
15/2Sustaining More Inclusive Growth in the Republic of CongoHakura, Dalia, Adrian Alter, Matteo Ghilardi, Rodolfo Maino, Cameron McLoughlin, Maximilien Queyranne
15/1Making Senegal a Hub for West Africa: Reforming the State, Building to the Future Kireyev, Alexei, Ali M. Mansoor
14/4Mozambique Rising: Building a New TomorrowRoss, Doris C., Victor Duarte Lledo, Alex Segura-Ubiergo, Yuan Xiao, Iyabo Masha, Alun H. Thomas, Keiichiro Inui
14/3The Mystery of Missing Real Spillovers in Southern Africa: Some Facts and Possible ExplanationsBasdevant, Olivier, Andrew W Jonelis, Borislava Mircheva, Slavi T. Slavov
14/2Issuing International Sovereign Bonds: Opportunities and Challenges for Sub-Saharan AfricaMecagni, Mauro, Jorge Iván Canales Kriljenko, Cheikh A. Gueye, Yibin Mu, Masafumi Yabara, Sebastian Weber
14/1Managing Volatile Capital Flows: Experiences and Lessons for Sub-Saharan African Frontier MarketsGueye, Cheikh A., Javier Arze del Granado, Rodrigo Garcia-Verdu, Mumtaz Hussain, B. Jang, Sebastian Weber, Juan S. Corrales
13/8Mali: Achieving Strong and Inclusive Growth with Macroeconomic StabilityJosz, Christian
13/7Responding to Shocks and Maintaining Stability in the West African Economic and Monetary UnionKolerus, Christina, Aleksandra Zdzienicka, Ermal Hitaj, Douglas J. Shapiro
13/6West African Economic and Monetary Union: Financial Depth and MacrostabilityImam, Patrick A., Christina Kolerus
13/5Senegal: Financial Depth and MacrostabilityImam, Patrick A., Christina Kolerus
13/4Senegal: Achieving High and Inclusive Growth While Preserving Fiscal SustainabilityKireyev, Alexei, Gaston K. Mpatswe
13/3Banking in Sub-Saharan Africa: The Macroeconomic ContextMlachila, Montfort, Seok Gil Park, Masafumi Yabara
13/2Energy Subsidy Reform in Sub-Saharan Africa: Experiences and LessonsAlleyne, Trevor, Mumtaz Hussain
13/2Boom, Bust, or Prosperity? Managing Sub-Saharan Africa’s Natural Resource WealthLundgren, Charlotte J., Alun H. Thomas, Robert C. York
13/1Restoring Sustainability in a Changing Global Environment: Options for SwazilandBasdevant, Olivier, Emily Forrest, Borislava Mircheva
POLICY PAPERS12/14
Pan-African Banks - Opportunities and Challenges for Cross-Border OversightPrepared by a staff team led by Charles Enoch, Paul Mathieu, Mauro Mecagni.
SPILLOVER NOTES2016/Issue 9
Sub-Saharan Migration: Patterns and SpilloversGonzalez-Garcia, Jesus, Ermal Hitaj, Montfort Mlachila, Arina Viseth, Mustafa Yenice
STAFF DISCUSSION NOTES15/11
Is the Glass Half Empty or Half Full? Issues in Managing Water Challenges and Policy InstrumentsKalpana Kochhar, Catherine Pattillo, Yan Sun, Nujin Suphaphiphat, Andrew Swiston, Robert Tchaidze, Benedict Clements, Stefania Fabrizio, Valentina Flamini, Laure Redifer, Harald Finger, and an IMF Staff Team
12/13Economic Diversification in LICs: Stylized Facts and Macroeconomic Implications Papageorgiou, Chris, Nicola Spatafora
WORKING PAPERS17/281
The Impact of Fiscal Consolidations on Growth in Sub-Saharan AfricaFrancisco Arizala, Jesus R Gonzalez-Garcia, Charalambos G Tsangarides, Mustafa Yenice
17/243Enforcing Public-Private Partnership Contract: How do Fiscal Institutions Matter?Manabu Nose

PUBLICATIONS OF THE IMF AFRICAN DEPARTMENT, 2012–18
123
17/236Inequality in Financial Inclusion and Income InequalityGoksu Aslan, Corinne Deléchat, Monique Newiak, and Fan Yang
17/203Medium-Term Budget Frameworks in Sub-Saharan African Countries Richard Allen, Taz Chaponda, Lesley Fisher, and Rohini Ray
17/202Growth Breaks and Growth Spells in Sub-Saharan AfricaTsangarides, Charalambos, Francisco Arizala, Jesus Gonzalez-Garcia, Mustafa Yenice.
17/163Financial Resource Curse in Resource-Rich CountriesMlachila, Montfort , Rasmané Ouedraogo
17/156The Informal Economy in Sub-Saharan: Size and DeterminantsMedina, Leandro, Andew W. Jonelis, Mehmet Cangul
17/112Farms, Fertiliser, and Financial Frictions: Yields from DSGE ModelSébastien Walker
17/48Understanding Inflation in Malawi: A Quantitative InvestigationWu, Dong Frank
17/109Evaluating the Impact of Non-Financial IMF Programs Using the Synthetic Control MethodNewiak, Monique, Tim Willems
16/247Food Inflation in Sub-Saharan Africa: Causes and Policy ImplicationsUppal, Ali, Emre Alper, Niko Hobdari
16/205Surprise, Surprise: What Dirves the Rand/U.S. Dollar Exchange Rate Volatility?Schimmelpfennig, Axel, Nasha Maveé, Roberto Perrelli
16/140Gender Equality and Economic DiversificationKazandjian, Romina, Lisa Kolovich, Kalpana Kochhar, Monique Newiak
16/137South Africa: Labor Market Dynamics and Inequality Anand, Rahul, Siddharth Kothari, Naresh Kumar
16/120Monetary Policy Implementation and Volatility Transmission along the Yield Curve: The Case of Kenya Alper, Emre, R. Armando Morales, Fan Yang
16/118Women’s Opportunities and Challenges in Sub-Saharan African Job MarketsDieterich, Christine, Anni Huang, Alun H. Thomas
16/115Investing in Electricity, growth, and Debt Sustainability: The Case of LesothoAndreolli, Michele, Aidar Abdychev
16/113The Consequences of Policy Uncertainty: Disconnects and Dilutions in the South African Real Effective Exchange Rate-Export RelationshipHlatshwayo, Sandile, Magnus Saxegaard
16/111Inequality, Gender Gaps and Economic Growth: Comparative Evidence for Sub-Saharan AfricaHakura, Dalia, Mumtaz Hussain, Monique Newiak, Vimal Thakoor, Fan Yang
16/24South Africa’s Exports Performance: Any Role for Structural Factors?Anand, Rahul, Roberto Perrelli, Boyang Zhang
16/17Unintended Consequences: Spillovers from Nigeria’s Fuel Pricing Policies to Its Neighbor Mlachila, Montfort, Edgardo Ruggiero, David Corvino
16/12Commodity Price Shocks and Financial Sector FragilityKinda, Tidiane, Montfort Mlachila, Rasmané Ouedraogo
15/268Exiting From Fragility in sub-Saharan Africa: The Role of Fiscal Policies and Fiscal InstitutionsDeléchat, Corinne, Ejona Fuli, Dafina Mulaj, Gustavo Ramirez, Rui Xu
15/236Public Investment in a Developing Country Facing Resource Depletion Alter, Adrian, Matteo Ghilardi, Dalia Hakura
15/235Financial Inclusion and Development in the CEMACAlter, Adrian, Boriana Yontcheva
15/221Spillovers from China onto Sub-Saharan Africa: Insights from the Flexible System of Global Models (FSGM) Anderson, Derek, Jorge Iván Canales Kriljenko, Paulo Drummond, Pedro Espaillat, Dirk Muir
15/190Systemic Risk Assessment in Lo Income Countries: Balancing Financial Stability and Development Marchettini, Daniela, Rodolfo Maino
15/189On the Drivers of Inflation in Sub-Saharan AfricaNguyen, Anh D. M., Jemma Dridi, D. Filiz Unsal, Oral Williams
15/185Sub-Saharan Employment Developments: The Important Role of Household Enterprises with an Application to Rwanda Thomas, Alun H.
REGIONAL ECONOMIC OUTLOOK: SUB-SAHARAN AFRICA
124
15/169Household Financial Acces and Risk Sharing in NigeriaCarlson, Stacey, Era Dabla-Norris, Mika Saito, Yu Shi
15/149Network Effects of International Shocks and SpilloversKireyev, Alexei, Andrei Leonidov
15/126Pension Reforms in Mauritius: Fair and Fast—Balancing Social Protection and Fiscal SustainabilitySoto, Mauricio, Vimal Thakoor, Martin Petri
15/99How to Improve the Effectiveness of Monetary Policy in the West African Economic and Monetary UnionKireyev, Alexei
15/83Do Resource Windfalls Improve the Standard of Living in Sub-Saharan African Countries?: Evidence from a Panel of CountriesMunseob Lee, Cheikh A. Gueye
15/49Remittances and Macroeconomic Volatility in African CountriesAhmat Jidoud
15/25Harnessing Resource Wealth for Inclusive Growth in Fragile StatesDelechat, Corinne, Will Clark, Pranav Gupta, Malangu Kabedi-Mbuyi, Mesmin Koulet-Vickot, Carla Macario, Toomas Orav, Manuel Rosales, Rene Tapsoba, Dmitry Zhdankin, Susan Yang
15/17Fiscal Policy Implications for Labor Market Outcomes in Middle-Income CountriesStepanyan, Ara, Lamin Leigh
15/12Revisiting teh Concept of Dollarization: The Global Financial Crisis and Dollarization in Low-Income CountriesMwase, Nkunde, Francis Y. Kumah
14/241Global Financial Transmission into Sub-Saharan Africa– A Global Vector Autoregression AnalysisCanales Kriljenko, Jorge Iván, Mehdi Hosseinkouchack, Alexis Meyer-Cirkel
14/231Safe Debt and Uncertainty in Emerging Markets: An Application to South AfricaSaxegaard, Magnus
14/172A Quality of Growth Index for Developing Countries: A ProposalMlachila, Montfort, Rene Tapsoba, Sampawende J.-A. Tapsoba
14/159Introducing a Semi-Structural Macroeconomic Model for RwandaCharry, Luisa, Pranav Gupta, Vimal Thakoor
14/150How Solid is Economic Growth in the East African Community?Gigineishvili, Nikoloz, Paolo Mauro, Ke Wang
14/149Islamic Finance in Sub-Saharan Africa: Status and ProspectsGelbard, Enrique, Mumtaz Hussain, Rodolfo Maino, Yibin Mu, Etienne B. Yehoue
14/143Africa Rising: Harnessing the Demographic DividendDrummond, Paulo, Vimal Thakoor, Shu Yu
14/94Does Openness Matter for Financial Development in Africa?David, Antonio, Montfort Mlachila, Ashwin Moheeput
14/51Surging Investment and Declining Aid: Evaluating Debt Sustainability in RwandaClark, Will, Birgir Arnason
13/261Natural Gas, Public Investment and Debt Sustainability in Mozambique Melina, Giovanni, Yi Xiong
13/250Africa’s Rising Exposure to China: How Large Are Spillovers Through Trade? Drummond, Paulo, Estelle X. Liu
13/239Money Targeting in a Modern Forecasting and Policy Analysis System: an Application to Kenya Andrle, Michal, Andrew Berg, Enrico Berkes, Rafael A. Portillo, Jan Vlcek, R. Armando Morales
13/237The Investment-Financing-Growth Nexus: The Case of Liberia Clark, Will, Manuel Rosales
13/226Making Monetary Policy More Effective: The Case of the Democratic Republic of the Congo Fischer, Felix, Charlotte J. Lundgren, Samir Jahjah
13/216Fiscal Discipline in WAEMU: Rules, Institutions, and MarketsHitaj, Ermal, Yasin Kursat Onder
13/215Inclusive Growth and Inequality in SenegalKireyev, Alexei
13/201Africa’s Got Work to Do: Employment Prospects in the New CenturyFox, Louise, Cleary Haines, Jorge Huerta Muñoz, Thomas, Alun H.

PUBLICATIONS OF THE IMF AFRICAN DEPARTMENT, 2012–18
125
13/188Resource Dependence and Fiscal Effort in Sub-Saharan AfricaThomas, Alun H., Juan P. Treviño
13/176Benchmarking Structural Transformation Across the WorldDabla-Norris, Era, Alun H. Thomas, Rodrigo Garcia-Verdu, Yingyuan Chen
13/173Tax Administration Reform in the Francophone Countries of Sub-Saharan AfricaFossat, Patrick, Michel Bua
13/161Financial Depth in the WAEMU: Benchmarking Against Frontier SSA CountriesAhokpossi, Calixte, Kareem Ismail, Sudipto Karmakar, Mesmin Koulet-Vickot
13/147Investing Volatile Oil Revenues in Capital-Scarce Economies: An Application to AngolaRichmond, Christine, Irene Yackovlev, Shu-Chun Yang
13/144Fiscal Sustainability, Public Investment, and Growth in Natural Resource-Rich, Low-Income Countries: The Case of CameroonSamaké, Issouf, Priscilla Muthoora, Bruno Versailles
13/139Inclusive Growth: An Application of the Social Opportunity Function to Selected African CountriesAdedeji, Olumuyiwa, Huancheng Du, Maxwell Opoku-Afari
13/116Inclusive Growth and the Incidence of Fiscal Policy in Mauritius — Much Progress, But More Could be DoneDavid, Antonio, Martin Petri
13/53The Quality of the Recent High-Growth Episode in Sub-Saharan AfricaMlachila, Montfort, Marcelo Martinez
13/51Benchmarking Banking Sector Efficiency Across Regional Blocks in Sub-Saharan Africa: What Room for Policy?Boutin-Dufresne, Francois, Santiago Peña, Oral Williams, Tomasz A. Zawisza
13/39Monetary Transmission Mechanism in the East African Community: An Empirical Investigation Davoodi, Hamid, Shiv Dixit, Gabor Pinter
13/34Determinants of Bank Interest Margins in Sub-Saharan AfricaAhokpossi, Calixte
13/32Exchange Rate Liberalization in Selected Sub-Saharan African Countries: Successes, Failures, and Lessons Mæhle, Nils, Haimanot Teferra, Armine Khachatryan
13/31Inward and Outward Spillovers in the SACU Area Canales-Kriljenko, Jorge Iván, Farayi Gwenhamo, Thomas, Saji
13/12Bond Markets in Africa Mu, Yibin, Peter Phelps, Janet Stotsky
12/290Inequalities and Growth in the Southern African Customs Union (SACU) Region Basdevant, Olivier, Dalmacio Benicio, Yorbol Yakhshilikov
12/280Striking an Appropriate Balance Among Public Investment, Growth, and Debt Sustainability in Cape Verde Mu, Yibin
12/272The East African Community: Prospects for Sustained Growth McAuliffe, Catherine, Sweta Saxena, Masafumi Yabara
12/249Financing Growth in the WAEMU through the Regional Securities Market: Past Successes and Current Challenges Diouf, Mame Astou, Francois Boutin-Dufresne
12/208Exchange Rate and Foreign Interest Rate Linkages for Sub-Saharan Africa FloatersThomas, Alun H.
12/196A Financial Conditions Index for South AfricaGumata, Nombulelo, Nir Klein, Eliphas Ndou
12/177Estimating the Implicit Inflation Target of the South African Reserve BankKlein, Nir
12/160Monetization in Low- and Middle-Income CountriesMcLoughlin, Cameron, Noriaki Kinoshita
12/148The Relationship between the Foreign Exchange Regime and Macroeconomic Performance in Eastern AfricaStotsky, Janet Gale, Olumuyiwa Adedeji, Manuk Ghazanchyan, Nils O. Maehle
12/141Exchange Rate Pass-Through in Sub-Saharan African Economies and its DeterminantsRazafimahefa, Ivohasina Fizara
12/136Welfare Effects of Monetary Integration: The Common Monetary Area and BeyondAsonuma, Tamon, Xavier Debrun, Paul R. Masson
12/127As You Sow So Shall You Reap: Public Investment Surges, Growth, and Debt Sustainability in TogoAndrle, Michal, Antonio David, Raphael A. Espinoza, Marshall Mills, Luis-Felipe Zanna

REGIONAL ECONOMIC OUTLOOK: SUB-SAHARAN AFRICA
126
12/119Tracking Short-Term Dynamics of Economic Activity in Low-Income Countries in the Absence of High-Frequency GDP DataOpoku-Afari, Maxwell, Shiv Dixit
12/108Mobilizing Revenue in Sub-Saharan Africa: Empirical Norms and Key DeterminantsDrummond, Paulo,Wendell Daal, Nandini Srivastava, Luiz E. Oliveira
12/94Monetary Policy in Low-Income Countries in the Face of the Global Crisis: The Case of ZambiaBaldini, Alfredo, Jaromir Benes, Andrew Berg, Mai Dao, Rafael Portillo
12/93Fiscal Policies and Rules in the Face of Revenue Volatility Within Southern Africa Customs Union Countries (SACU)Basdevant, Olivier
12/92Real Wage, Labor Productivity, and Employment Trends in South Africa: A Closer LookKlein, Nir
12/73Exchange Rate Volatility Under Peg: Do Trade Patterns Matter?Lonkeng Ngouana, Constant
12/32Assessing Bank Competition within the East African CommunitySanya, Sarah, Matthew Gaertner
12/20Prudential Liquidity Regulation in Developing Countries: A Case Study of RwandaSanya, Sarah, Wayne Mitchell, Angelique Kantengwa
12/18Capital Market Integration: Progress Ahead of the East African Community Monetary UnionYabara, Masafumi
12/7International Reserves in Low-Income Countries: Have They Served as Buffers?Cripolti, Valerio, George Tsibouris