world customs journalworldcustomsjournal.org/archives/volume 6, number 1 (mar 2012)/00... · excise...
TRANSCRIPT

World Customs Journal
March 2012
Volume 6, Number 1

ii Volume 6, Number 1
International Network of Customs Universities
World Customs Journal Published by the University of Canberra, Australia and the University of Münster, Germany in association with the International Network of Customs Universities (INCU) and the World Customs Organization (WCO).
The World Customs Journal provides a forum for customs professionals, academics, industry researchers, and research students to contribute items of interest and share research and experiences to enhance its readers’ understanding of all aspects of the roles and responsibilities of Customs. The Journal is published electronically and in print twice a year. The website is at: www.worldcustomsjournal.org.
Guidelines for Contributors are included at the end of each issue. More detailed guidance about style is available on the Journal’s website.
Correspondence and all items submitted for publication should be sent in Microsoft Word or RTF, as email attachments, to the Editor-in-Chief: [email protected].
ISSN: 1834-6707 (Print) 1834-6715 (Online)
Volume 6, Number 1
Published March 2012
© 2012 University of Canberra, Australia and University of Münster, Germany
Both universities are founding members of the INCU, an association that provides the WCO and other organisations with a single point of contact with universities and research institutes that are active in the field of customs research, education and training.
Copyright. All rights reserved. Permission to use the content of the World Customs Journal must be obtained from the copyright owner. Please apply to the Editor-in-Chief.
Disclaimer. The views expressed in the World Customs Journal are those of individual contributors and are not necessarily those of the Editorial Board, the INCU, the World Customs Organization or its individual membership, or the publishers.

World Customs Journal
Volume 6, Number 1 iii
ContentsEditorial ................................................................................................................................................ v
SECTION 1 – ACADEMIC CONTRIBUTIONS
Excise taxation of key commodities across South East Asia: a comparative analysis ahead of the ASEAN Economic Community in 2015
Rob Preece ....................................................................................................................................... 3
The impact of customs procedures on business performance: evidence from Kosovo
Mario Holzner and Florin Peci ...................................................................................................... 17
De minimis thresholds in APEC
Stephen Holloway and Jeffrey Rae ................................................................................................. 31
Coordinated border management: the experience of Asia and the Pacific region
Sandeep Raj Jain ............................................................................................................................ 63
SECTION 2 – PRACTITIONER CONTRIBUTIONS
The Time Release Study as a performance measurement tool for a supply chain and an international corridor
Shingo Matsuda .............................................................................................................................. 79
The standardisation of customs services in the European Union
Ewa Gwardzińska ........................................................................................................................... 93
Warehousekeepers: bridges connecting Customs and small and medium-sized enterprises (SMEs)
Dafang Liu.................................................................................................................................... 101
SECTION 3 – SPECIAL REPORT
Lines and flows: the beginning and end of borders
Assistant Secretary Alan D Bersin, US Department of Homeland Security ................................ 115
SECTION 4 – REFERENCE MATERIAL
Guidelines for Contributors ............................................................................................................ 129
Editorial Board................................................................................................................................. 130
iv Volume 6, Number 1
International Network of Customs Universities
World Customs Journal
Volume 6, Number 1 v
Editorial
At first glance, this edition of the World Customs Journal comprises what appears to be a disparate array of topics. However, I invite your attention to the underlying theme of contrasting approaches to universal imperatives which permeates several of the contributions. Rob Preece, for example, introduces his comparative analysis of excise taxation across the ASEAN region and identifies the need for standardisation in readiness for the impending introduction of the ASEAN Economic Community. Stephen Holloway and Jeffrey Rae present the results of their research into the diversity of de minimis arrangements in the APEC region, highlighting their impact on economic benefits and costs. Sandeep Raj Jain examines a variety of regional
approaches to coordinated border management, and Ewa Gwardzińska examines the introduction of the EU’s electronic customs environment as a means of achieving regional standardisation.
The underlying commonality of border management imperatives is also reflected in this edition’s Special Report. In his insightful article ‘Lines and Flows: the Beginning and End of Borders’ Alan Bersin challenges the traditional concept of international borders, and introduces a paradigm that views global cooperation as a fundamental requirement for effective border management. The Editorial Board would like to thank Mr Bersin for his valuable contribution.
In response to the requests of many of our readers, the next edition of the Journal will focus on excise policy and practice, and will include papers presented at the World Customs Organization’s Global Excise Summit which will be held on 2-3 July at the WCO Headquarters in Brussels. Another important date for your diaries is this year’s PICARD conference that will be held in Marrakech, Morocco in the last week of September. I look forward to seeing you there!
David Widdowson Editor-in-Chief

vi Volume 6, Number 1
International Network of Customs Universities

Section 1
Academic Contributions

2 Volume 6, Number 1
International Network of Customs Universities
Volume 6, Number 1 3
World Customs Journal
Excise taxation of key commodities across South East Asia: a comparative analysis ahead of the
ASEAN Economic Community in 2015Rob Preece
Abstract
As the Association of Southeast Asian Nations (ASEAN) moves towards the formation of its Economic Community (AEC) in 2015, it is worth considering the extent, if any, of any major differences in the excise taxation systems across the ASEAN membership. The issues which could arise will ultimately be determined by the actual final ‘shape’ of the AEC on its commencement, and the extent to which the ‘single market’ objectives of the AEC will allow for the free movement of goods and investment. Without harmonisation or indeed any form of standardisation or at least coordination of excise and like taxes, there could well be issues for ASEAN members to manage in the areas of local production and distribution moving across borders; import and regional distribution arrangements being reviewed; and cross-border ‘shopping’ or trade in non-commercial volumes of excise duty paid goods. Each of these issues potentially requires a regional level policy discussion, as well as local policy consideration, but most importantly, the need to look at various administrative arrangements to monitor the movement of excisable goods across ASEAN. This paper looks at various analytical approaches to comparing the differences across the ASEAN excise tax systems.
In 2003, the leaders of the various states of the Association of Southeast Asian Nations (ASEAN)1 agreed to the formation of an Economic Community (AEC) as part of its larger ‘ASEAN Vision 2020’ plan.2 A ‘road map’ for implementation was then laid out in 2007 in a document titled the ‘ASEAN Economic Community Blueprint’ in which the following ‘characteristics’ of the new regional economic integration were outlined as being:3
• the creation of a single market and single production base• a highly competitive economic region• a region which is equitable in terms of economic development• a region which is fully integrated into the global economy.
As this paper is focused on the area of excise taxation, of interest in this study is the first of these characteristics: the formation of a single market and a single production base with the ASEAN region. Excise is primarily a tax on the production (or import) of certain goods, although it can also be found being applied to some services.
Significantly, excise taxes represent different priorities for different countries in terms of being a source of revenue, and increasingly, excise taxes are now often being set by governments to meet certain policy objectives around the consumption of those goods, for example, tobacco excises may be utilised so that retail pricing meets a certain level and reduces demand, or fuel excises may have exemptions on alternative clean burning fuels to stimulate demand for those fuels over fossil fuels.

4 Volume 6, Number 1
International Network of Customs Universities
In terms of a move towards the ‘single market’ aims of the AEC, there is the potential for issues to arise in policy particularly where production (or import) of excisable goods occurs in one member state, but consumption occurs in another. This situation could arise in a truly single market where industry could be expected to look at distribution arrangements that saw all production (or import) moving to low excise rate member states for ‘free flow’ to higher taxing member states.
Therefore, to set some context to the comparative study, a review of the AEC blueprint was made to identify the actual nature of the 2015 vision of a single market and determine to what extent there would be a ‘free flow’, and within this, would ‘free flow’ be extended to excisable goods. This question is important in terms of the future movement of excise goods across ASEAN, as indeed there are several possibilities to consider in the operation of a single market – firstly, that excise becomes payable at the place of manufacture (or the first post of import into the ASEAN region), or secondly, excise is payable in the country of consumption irrespective of place of manufacture (or import) and, as such, will need some form of border tax adjustment or administration over the movement of those goods to that place of consumption. These types of single market operations need to be understood so that potential impacts can be understood in terms of the potential movement of investment in production and re-structure of distribution from 2015, should the excise tax systems of the 10 ASEAN members be significantly different.
At this point it is important to define ‘excise taxation’ as this is not a term used by all members of ASEAN despite the fact they all levy ‘excise type’ taxes. Therefore, in this paper, the term ‘excise’ will relate to a form of indirect taxation which is applied to a narrow base of goods (and often services), being goods which are primarily ‘luxury’ or ‘consumer based’ in nature. Excise taxation is common throughout ASEAN as it is an important component of the overall tax systems of each member.
This approach is consistent with the classification of ‘excise taxes’ by the OECD4 which considers excise taxes to be those taxes that are:
levied on particular products, or on a limited range of products … imposed at any stage of production or distribution and are usually assessed by reference to the weight or strength or quantity of the product, but sometimes by reference to the value (OECD 2004).
Excise is not a value added tax (VAT) or sales tax, which the OECD differentiates by reference to the application of such taxes (and tax credits for business inputs) at each stage or tier within the supply chain, as well as a generally broader tax base.5 Excise is not usually levied instead of such taxes but rather levied in addition to such taxes.
To determine what taxes are included in this study, we will use the OECD classification above. In this context for example, it is noted that the Vietnamese have a ‘Special Consumption Tax’, the Indonesians have a ‘Luxury Sales Tax’, the Thai’s have both a ‘Liquor Tax’ and a ‘Tobacco Tax’, although increasingly many ASEAN members have been reforming these types of taxes and incorporating the term ‘excise’ in many recent amendments.6
Returning to an initial analysis of the ASEAN AEC to provide context to our comparative analysis of excise tax systems, the blueprint states that there will be a creation of a single market and single production base which is to be achieved in several ways. The first of these has been described as providing for a ‘free flow of goods’,7 however the extent of the term ‘free’ will need further discussion as it appears that despite the stated objective of a ‘single market’, there will be no ‘un-restricted movements’ across intra-regional borders of ASEAN origin goods, or ‘un-restricted movements’ across intra-regional borders of any imported goods fully cleared through Customs in a member state, but indeed full border controls will remain in place between member states.
Instead, it appears that the term ‘free flow’ is more likely to relate to import duties applying to ASEAN origin goods as they pass intra-regional borders, in conjunction with a removal of any remaining non-

Volume 6, Number 1 5
World Customs Journal
tariff barriers to trade. This position is based primarily on the statements contained in paragraph 13 of the blueprint which indicates that under the Common Effective Preferential Tariffs for ASEAN Free Trade Area (CEPT AFTA) the elimination of import duties on ASEAN origin goods by 2015 in the Free Trade Area for the ASEAN 6 (and by 2018 for ASEAN CLMV)8 – although some flexibility will be allowed for sensitive goods. Further, a review of paragraph 14 seeks the elimination of non-tariff barriers, in a transparent fashion by 2015, again with some flexibility for ASEAN CLMV to remove such barriers by 2018. As such, ‘free flow’ of goods in the blueprint is not akin to the ‘free circulation’ of goods say, under the European Union (EU) definition which allows goods of EU origin, or non-EU goods which have cleared customs controls (and not subject to other procedures) to move freely across intra-regional borders in most cases.9 In the case of the AEC, ‘free flow’ appears to be a reference to the fact that duties, levies, fees and other restrictions will not apply should the goods be of ASEAN origin.
‘Free flow’ of goods will also be enhanced by improvements to procedures and technology, thus increasing the speed at which goods may be cleared at intra-regional borders. Paragraphs 15 to 18 of the AEC Blueprint call for better trade facilitation initiatives such as the simplification and transparency of relevant import/export procedures, as well as calling for improved customs integration between member states of ASEAN.
The call for increased customs integration in conjunction with the calls for full tariff reductions and removal of non-tariff barriers actually suggests that the concept of the AEC is a little confusing, and perhaps economic integration is not achieving the ‘single market’ or ‘common market’ objective as is generally understood by those terms. Therefore, it is useful to briefly look at the progressive stages of economic integration and understand what stage ASEAN is seeking to reach by 2015 and from here, the study can then better determine the impacts of members having differing excise taxation systems.
Holden (2003) has summarised the literature into the key stages of economic integration as being:
• Free trade agreement (FTA) or preferential trade in which members reduce tariffs to zero for intra-regional trade and reduce non-tariff barriers
• Customs Union which is an FTA with a common external tariff, free flow of goods across borders but maintenance of national economic policies
• Common Market which is a Customs Union with free flows of services, investment, labour and capital, with some harmonisation of economic policies
• Economic Union which is a Common Market with common economic policies and common political and economic institutions.
If these stages are analysed against the ASEAN context, it appears that the blueprint suggests that ASEAN is moving from a Free Trade Area to a Common Market without first implementing a Customs Union. Certainly the Free Trade Area of AFTA will be close to, if not fully implemented with further commitments to remove non-tariff barriers, however, there are no components of a Customs Union and confusion has crept in by the desire to implement, by 2015, a free flow of services, investment, labour and capital.
From this, the study believes that the AEC 2015 is not realistically a ‘single market’ but rather an enhanced Free Trade Area with enhanced facilitation of intra-regional cross border movements and free flows of services, investment, labour and capital. This position will now form the basis of the following review of excise taxation policies across the ASEAN membership.
The issues for excise taxation from 2015 for policymakers now seem to focus on several key areas:
• Will production of certain excisable goods move to certain low taxing members, and duty paid products move to other member states for consumption, and if so, how will this be administered at the borders by way of any border tax adjustments, including ensuring compliance by importers and the possible need to monitor the movement of excise goods?

6 Volume 6, Number 1
International Network of Customs Universities
• Will production of certain excisable goods move to lower production cost members to reduce excise duty liabilities in the member state where goods will be consumed?
• Will policies and procedures be needed to manage the non-commercial movement of excisable goods from member states with low excise rates to member states with higher excise rates?
To begin analysis of these questions there needed to be some form of benchmarking of existing ASEAN excise systems. This proved to be a very difficult exercise given a lack of consistency across these regional excise systems. The main obstacles to a clear analysis and benchmarking of excise systems included:
• Differing ranges of goods (and services) subject to excise. Only five commodities were found to be taxed across all ASEAN member states and these were: motor vehicles; beer; wine, distilled spirits; and packaged tobacco (cigarettes). These five commodities will be used as a guide in this study to understand the extent of differences between the excise taxation systems of the ASEAN members.
• Some categories of goods (and services) are subject to excise in only limited numbers of member states. Examples of goods here include non-alcoholic beverages which are subject to excise in Cambodia, Laos PDR, Malaysia and Thailand, whilst examples of services include karaoke club revenues which are payable only in Cambodia, Laos PDR, Myanmar, Thailand and Vietnam.
• Approaches to excise taxation vary between member states and include:- value based or ‘ad valorem’ duties
- quantity-based or ‘unitary’, ‘specific’ or ‘volumetric’ duties
- a mixture of both an ad valorem and a specific rate of duty, and
- in the case of Thailand,10 a mixed rate ad valorem and specific excise rate tariff in which the tax payer calculates against both rates and pays the higher of the two.
• Approaches to the tax base, or basis of excise tax calculation differed across the members’ excise tax systems. Here the study found that in:- Ad valorem excise systems, taxable value was ex-factory selling price (or CIF + import duties
for like imported goods) being the most common; in Thailand, it is an excise and local tax inclusive ex-factory selling price (or CIF + customs duty + excise duty + local tax for like imported goods); in Cambodia, it is 65% of the customer’s invoice price; and in Myanmar, it is sales receipt value.
- Specific rate excise systems, taxable volume was either per litre (for liquid fuels, alcoholic beverages, non-alcohol beverages); per litre of alcohol (for alcoholic beverages); per stick for cigarettes; or per kilogram for cigarettes and tobacco.
- Some definitions of tobacco contain reference to either ‘per stick’, or ‘per pack’, in the case to cigarettes.
- Some classifications for excise items are linked to retail pricing (in the Philippines, for alcohol) and then for tobacco, there are also classifications which are in terms of per stick (Indonesia) or per pack (Philippines) for tobacco products.
• A lack of transparency in ‘effective excise rates’ particularly in the taxation of fuels with a range of both subsidies in place, and the use of ‘temporarily cut’ excise rates and ‘rate discounts’ for goods meeting certain criteria.
In order to overcome some of these issues, the study looked to standardise the various excise systems of ASEAN. In this process, two approaches were adopted depending upon the nature of the goods. Where pure ad valorem taxation was utilised across ASEAN, such as motor vehicles, the items under that commodity were reviewed to establish whether any commonalities or similarities were present on which

Volume 6, Number 1 7
World Customs Journal
a ‘standard’ commodity classification could be developed. In terms of motor vehicles, see Table 1 below, it was noted that where the commodity item was broken down into sub-items, the division was based upon engine size for passenger cars, and for larger passenger transports like buses, sub-items were based upon number of passenger seats. This approach was therefore taken in Table 1, however, it needs to be clearly stated that the engine size divisions created here are not consistent across the excise systems of all member states but, generally, it has been possible to use these divisions and not impact on the prescribed excise of each engine size in each excise system.
Also of note was the concession given for the ‘pick-up’ vehicle by Thailand and Vietnam, the pick-up vehicle being one which contains both a passenger cab and a goods carrying capacity. Because of this, a separate sub-item was created for this scenario.
Table 1: A comparative analysis of motor vehicle excise duties in ASEAN
Country <2000cc 2-3000cc >3000cc 10-16 seat >16 seat Pick-up
Indonesia 20% 40% 75% 10% Brunei 20% 20% 20% 20% 10% 20% Cambodia 45% 45% 45% Laos PDR 65% 75% 90% 20% 20% 20% Malaysia 80% 90% 105% 105% 105% Myanmar 25% 25% 25% 20% 20% Philippines 15% 50% 100% Singapore 20% 20% 20% 20% 20% 20% Thailand 30% 40% 50% 3% Viet Nam 45% 50% 60% 30% 15% 15%
Source: Preece 2012.
A common feature here is the increase in excise rate with increasing engine size, with the exception of Brunei, Myanmar and Singapore, although none of these countries has a vehicle manufacturing sector. Five countries have a concessional rate of excise for the pick-up truck, with the other five countries having the engine size determine the excise rate for all passenger vehicles. There are some quite large rate differentials across the countries, with Malaysia having the highest rates in all categories, and these rate differentials stay fairly consistent as engine size increases. Analysis in terms of production costs would be interesting at some point, as vehicle production requires significant long term investment. With the AEC providing for free flow of capital and investment, one issue to explore is whether vehicle producers looking at high excise rate markets like Malaysia, or at certain high excise rate market segments like large engine vehicles in Indonesia or the Philippines, could look to invest in production in low cost centres to reduce the taxable value of the vehicle and therefore its competitiveness in those markets or market segments.
There would also seem to be some attractiveness for ‘cross border shopping’ or private individuals purchasing their vehicles in lower taxed neighbouring countries and then driving these vehicles home. With a ‘free flow’ of people across borders, it may become increasingly difficult to even identify potentially excisable vehicles in such border crossing settings.
More difficult to analyse are those excise tariffs relating to alcoholic beverages and tobacco products as they possess a range of different approaches to the way in which the goods are taxed. Table 2 (alcohol) required all types of beverage to be bought to a standard ‘litre of pure alcohol’ rate. For Brunei, Indonesia, Malaysia and the Philippines, this meant making an assumption that beer is a standard 5% alcohol by volume (a/v), wine 12.5% a/v and spirits 40% a/v. The specific rates were then further standardised to Thai Baht equivalent.11

8 Volume 6, Number 1
International Network of Customs Universities
Table 2: A comparative analysis of alcohol excise duties in ASEAN
Country Beer Tax Wine Tax Spirits Tax
Indonesia 740 1,047 (local)
1,392 (import)
815 (local)
1,415 (import) Brunei 1,415 1,038 1,475 Cambodia 25% 10% 10% Laos PDR 50% 60% 70% Malaysia 1,525 + 15% 987 + 15% 308 +15%
Myanmar 50% 50%
50% (rural)
60% (local)
200% (import)
Philippines12
157 (cheap)
230 (mid price)
303 (premium)
131 (still wine <14%)
262 (still wine >14%)
1,093 (sparkling cheap)
3,07 (sparkling premium)
118 (cheap)
236 (mid price)
473 (premium)
Singapore 1,161 1,694 1,694
Thailand 100 or 60% 100 or 60%
400 (special spirit) or 50%
300 (mix spirit) or 50%
120 (local white) or 50%Viet Nam 45% 25% 45%
Source: Preece 2012.
The study still has a problem with comparative analysis across Table 2, as there remains the issue of trying to compare tax systems which are ad valorem, specific excise, and in the case of Malaysia, mixed rates, or Thailand which has the ‘greater of’ an ad valorem or a specific rate. To overcome this issue, it was decided that the study would select three representative products from the Thai alcoholic beverage market, one each of beer, wine and spirits, and then proceed to classify each of these beverages in each ASEAN member’s excise tax system, and calculate the respective excise duty payable in each system – and use this ‘excise payable per representative product’ as a guide only as to the extent of excise rate differentials across the region.
The three representative products mentioned in Table 3 had information on their labels to identify the volume and alcohol strength or the product to determine the ‘litres of pure alcohol’ (lals) and used details of the taxable ex-factory value from the Excise Department’s authoritative assessment list.13
Table 3: Representative alcoholic beveragesBeer Wine SpiritsChang 330ml Monsoon 750ml Songsam Rum 700ml 5% a/v 12.5% a/v 40% a/v 0.0165 lals 0.09375 lals 0.28 lalsEx-factory THB 19.13 Ex-factory THB 165 Ex-factory THB 180
Source: Preece 2012.
Volume 6, Number 1 9
World Customs Journal
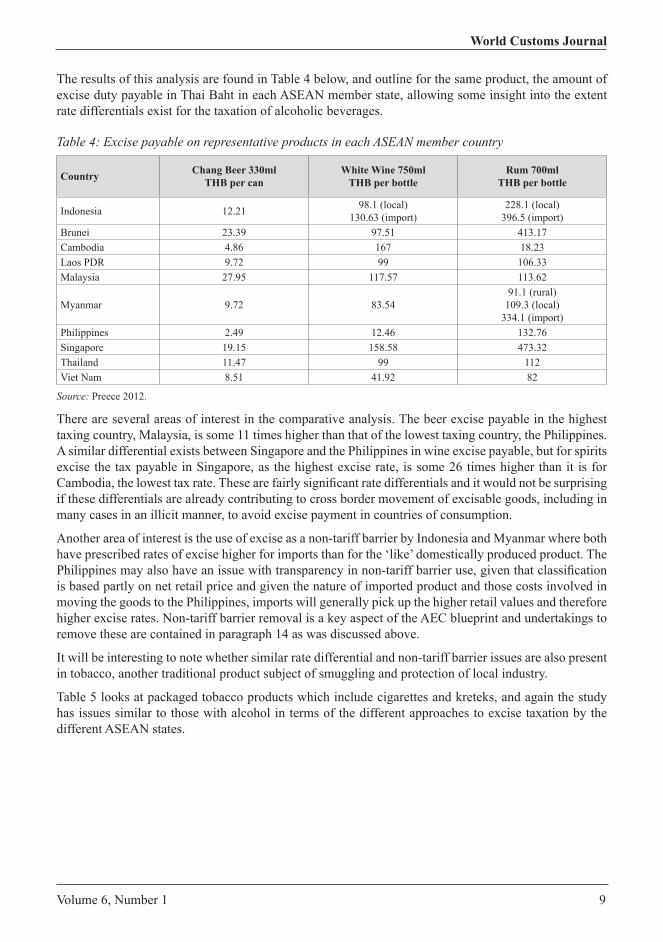
The results of this analysis are found in Table 4 below, and outline for the same product, the amount of excise duty payable in Thai Baht in each ASEAN member state, allowing some insight into the extent rate differentials exist for the taxation of alcoholic beverages.
Table 4: Excise payable on representative products in each ASEAN member country
Country Chang Beer 330ml THB per can
White Wine 750ml THB per bottle
Rum 700ml THB per bottle
Indonesia 12.21 98.1 (local) 130.63 (import)
228.1 (local) 396.5 (import)
Brunei 23.39 97.51 413.17 Cambodia 4.86 167 18.23 Laos PDR 9.72 99 106.33 Malaysia 27.95 117.57 113.62
Myanmar 9.72 83.54 91.1 (rural)
109.3 (local) 334.1 (import)
Philippines 2.49 12.46 132.76 Singapore 19.15 158.58 473.32 Thailand 11.47 99 112Viet Nam 8.51 41.92 82
Source: Preece 2012.
There are several areas of interest in the comparative analysis. The beer excise payable in the highest taxing country, Malaysia, is some 11 times higher than that of the lowest taxing country, the Philippines. A similar differential exists between Singapore and the Philippines in wine excise payable, but for spirits excise the tax payable in Singapore, as the highest excise rate, is some 26 times higher than it is for Cambodia, the lowest tax rate. These are fairly significant rate differentials and it would not be surprising if these differentials are already contributing to cross border movement of excisable goods, including in many cases in an illicit manner, to avoid excise payment in countries of consumption.
Another area of interest is the use of excise as a non-tariff barrier by Indonesia and Myanmar where both have prescribed rates of excise higher for imports than for the ‘like’ domestically produced product. The Philippines may also have an issue with transparency in non-tariff barrier use, given that classification is based partly on net retail price and given the nature of imported product and those costs involved in moving the goods to the Philippines, imports will generally pick up the higher retail values and therefore higher excise rates. Non-tariff barrier removal is a key aspect of the AEC blueprint and undertakings to remove these are contained in paragraph 14 as was discussed above.
It will be interesting to note whether similar rate differential and non-tariff barrier issues are also present in tobacco, another traditional product subject of smuggling and protection of local industry.
Table 5 looks at packaged tobacco products which include cigarettes and kreteks, and again the study has issues similar to those with alcohol in terms of the different approaches to excise taxation by the different ASEAN states.

10 Volume 6, Number 1
International Network of Customs Universities
Table 5: A comparative analysis of packaged tobacco excise duties in ASEAN
Country Cigarettes Kretek/handmade
Indonesia
(factory makes >2bn sticks)
(factory makes <2bn sticks)
1,525
512, 796, or 985 (depending on RSP)
NB: RSP = Retail Selling Price
817 or 1,068 (hand kretek/RSP)
1,362–1,494 (machine kretek/RSP)
441–525 (hand kretek/RSP)
988 or 1,136 (machine kretek/RSP) Brunei 1,467
Cambodia 10%
Laos PDR
15% (<5.7 prod cost/pack)
30% (5.7+ prod cost/pack)
3,570 per 500 fixed excise (import)
Malaysia 20% + 70.23 Myanmar 50%
Philippines
3.59 (<3.3/pack)
9.98 (3.3-4.2/pack)
15.84 (4.2-0.6.6/pack)
37.36 (>6.6/pack)
3.59 (handmade)
Singapore 8619Thailand 85% Viet Nam 65%
Source: Preece 2012.
With the range of differing structures of tobacco taxes and the different approaches to taxing tobacco across ASEAN, it was again decided to utilise a ‘representative product’ to classify and calculate excise for each country. The representative product is Thailand’s largest selling brand ‘Krong Thip 90’14 where details of the product, including contents and cost builds as at 2010 were taken from the World Health Organization (WHO).15 Details of the product are in Table 6 below.
Table 6: Representative tobacco products Retail Price: THB 58
Pack size: 20 sticks (20 x 0.8 grams)
Excise: THB 34.79 (ad valorem)
Ex-factory: THB 30.4Source: Preece 2012.
Using the representative product, classification based on ex-factory, retail price or weight as appropriate, Table 7 is the results of the exercise expressed as excise per pack in Thai Baht for each ASEAN country.

Volume 6, Number 1 11
World Customs Journal
Table 7: Excise payable on representative product in each ASEAN member country
Country Krong Thip excise in THB per pack
Indonesia 30.5 (if factory >2bn)
19.7 (if factory <2bn) Brunei 29.34
Cambodia 3.04 Laos PDR 9.62 (69.58 imports) Malaysia 48.63 Myanmar 15.03
Philippines 18.23 Singapore 172.38 Thailand 34.79 Viet Nam 19.76
Source: Preece 2012.
Again it is seen that considerable rate differentials exist with the excise payable in Singapore (the highest excise rate) some 57 times that of the excise payable in Cambodia (the lowest excise rate) for this representative product. Such differentials could again facilitate the possibility of smuggling, including the cross border movement of duty paid products from low excise countries into higher taxed neighbours. Laos PDR also has a substantial trade barrier in the form of an excise rate which is fixed for imports and in the case of this representative product, that rate will be effectively seven times greater than for a ‘like’ domestic product.
Finally, the study looked at a range of other goods and services but limited this to those commodities which are subject to excise in at least four ASEAN countries. These goods and services are outlined in Table 8 below and where applicable, have been standardised to Thai Baht equivalent rates per litre.
Table 8: Excise rates on selected goods and services in ASEAN
Country Gasoline Diesel Fuel Ethanol Non-alcohol beverages
Karaoke/Nightclub
Indonesia Brunei
Cambodia 4.35% 10% 10%
Laos PDR 20% 10% 5%
10% (imports)10%
Malaysia* 5.92 1.99 10%Myanmar 170% 90% 20% 30%
Philippines 1.74 0.65 2.01 Singapore 8.4** 8.4**
Thailand 7.00 0.05*** Ex
25% (soda) or 0.77 per 440ml
20% (other) or 0.37per 440ml
10%
Viet Nam 10% 10% 10% 30%
* Specific rate sales tax ** Assume regular unleaded *** Temporary rate, usually 5.31 THB/litre Source: Preece 2012.
12 Volume 6, Number 1
International Network of Customs Universities
Table 8 is not so significant for rate differentials but for the important point that there are inconsistencies in terms of excise tax scope in the first instance. For many commodities, and in particular fuels, excise is levied to both raise significant amounts of revenue and to achieve certain policy outcomes such as road user externalities, emissions externalities and energy supply management. In relation to fuels, these could be seen as ASEAN-wide issues, and increasingly so from 2015. Take, for example, a Vietnamese registered vehicle filling up with fuel for a journey through Laos, into Thailand, and back through Laos under a transit arrangement. The excise paid fuel will be purchased in Vietnam, but externalities addressed through the excise system will mostly occur in Laos and Thailand.
Further issues will also arise where excise is payable on certain goods in one member country but not in another in the same fashion as where goods have significant excise rate differentials. Simply, it makes business or consumer sense to purchase such goods excise free in one country with a view to bringing those goods back to a country that has excise payable. However, the added risk in this case is that any goods not subject to excise in one particular country – manufacture of such goods will be outside the licensed excise system meaning no controls will be in place for the movement and future export of those goods – that is, no audit trail will commence. This could be an administrative issue that needs to be addressed in the future.
Excise on services will also be significant and warrants separate studies. In terms of this study, only nightclub revenues were analysed and the risk to the revenue may not be material for cross border movements to visit nightclub entertainment venues. However, the issue will be significant for services such as telecommunications and gambling.16 The AEC blueprint will allow for a free flow of services,17 and with technological capabilities for example, consumers of excisable mobile phone services in one country may be able to select a mobile phone service provider from a neighbouring excise free country.
Looking at these types of issues, including the substantive differences in approach to excise tax across ASEAN, there may be merit in the membership of ASEAN looking at some form of standardisation and/or harmonisation of at least excise taxation policy. This does not mean that any member of ASEAN needs to give up sovereignty over their domestic tax systems and reform excise taxes to align with all members but rather, some benchmarks for reform are agreed to in which there are some common standards across the region.
The EU is a full ‘economic union’, however in terms of excise, individual member states have retained the right to set their own excise tariffs, albeit under the guidance of a set of ‘Directives’ issued by the European Parliament. These differences do mean that certain administrative arrangements are needed to manage the differences, and indeed this will be a question for ASEAN also as 2015 approaches.
In the EU, excises are generally limited to alcoholic beverages, tobacco products as well as hydrocarbon fuels and energy. EU Directives binding on member states then set out standards by which EU members must reform their excise systems. In summary, this today includes:
• Alcohol – use of specific rate taxation, with minimum excise rates per hector-litre of pure alcohol.18
• Tobacco – taxation by all members must consist of a ‘proportional (ad valorem) duty, calculated as a % of the maximum Retail Selling Price (RSP), and a specific duty, calculated per unit of the product’. Ad valorem rates are set as a percentage of the ‘tax inclusive’ Retail Selling Price (TIRSP). Specific rates are set per unit of product (usually per 1,000 sticks). In terms of the ad valorem and specific components of the duty, these are to be set by reference to cigarettes falling into the ‘most popular price category’ (MPPC). Total excise must be at least 57% of the ‘TIRSP’ of MPPC and total excise must be a minimum of €64 per 1,000 sticks. Specific duty may be set so that it is between 5% and 55% of the total tax burden (excise + VAT).19
• Fuel and energy – minimum excise rates per litre (with some country-based reduced rates and exemptions) are set for categories of fuel including fuels used for motor vehicles, and fuels used for heating and electricity generation, with an objective of eventual harmonisation of rates.20
Volume 6, Number 1 13
World Customs Journal
This study sees merit in further research in the area of developing and proposing a set of ‘ASEAN Excise Guidelines’ for members to follow in future excise tax reform so that certain consistencies can occur in terms of potential:
• standard use of ad valorem or specific rate taxation for certain goods, including standard weight/volume measures, taxable values
• standard definitions where appropriate, for use in all excise tariff legislation • minimum rates of excise for certain products, particularly tobacco, and possibly alcohol and certain
fuels • use of some reduced rates or some exemptions in cases where member states can demonstrate
problems with the standard • adoption of a ‘harmonised nomenclature’ for excise goods similar to AHTN.
Such ‘guidelines’ do not mean that all ASEAN members will have identical excise tax systems, certainly the members of the EU Community do not, however, there will be a degree of harmony, standardisation and transparency that will allow policymakers, administrators and industry to better understand excise taxation in the region. It may also begin to remove certain issues such as the need for industry to restructure supply chains, move investments, or indeed remove some of the current incentives and opportunities for cross border smuggling and manipulation of excisable values.
Finally, the study believes that further research is required in terms of future administration of excise duties, which may need to take on a regionally coordinated approach from 2015. Whilst the study believes there will not be a true free flow of excisable goods in the foreseeable future, and excise will be collected in the country where those goods are consumed, the study does believe the intra-regional movement of excisable goods will begin increasing substantially from 2015.
Given the nature of excise goods with their high tax rates, price sensitivities and high consumer demand, there will continue to be a link to smuggling and tax evasion, and this increased movement of excisable goods will need to be managed to protect revenues in the countries of consumption. In this context, and with the non-harmonisation of excise rates and the anticipated increased volumes of their intra-regional movement from 2015, the following areas of administration need further study:
• The principle of excise duties payable in country of consumption and the need to manage the movement of excisable goods from place of manufacture or place of first import into the ASEAN region to that country of consumption. In other words, some form of transit arrangement to manage the physical movement of excisable goods from origin to destination, including the possibility of those goods crossing several borders.
• Options to manage the safe transit of excisable goods across ASEAN, such as:- documentary approaches with audit trails and reconciliations between member states involved
in the movement
- IT-based approaches, perhaps the use of connected National (and eventually) ASEAN Single Window
- use of securities to cover losses of excise duties
- use of border tax adjustments.
• Consideration of supporting technology-based solutions for managing the movement of excisable goods across ASEAN such as ‘Track & Trace’ products, Radio Frequency Identification (RFID), and Global Position Systems (GPS).
• The establishment of some form of regional coordination in managing the movement of excisable goods across ASEAN.

14 Volume 6, Number 1
International Network of Customs Universities
ConclusionsIn conclusion, as ASEAN moves towards its version of a ‘single market’ by 2015, significant differences that exist in the excise systems could well see changes in investment in production and distribution arrangements in the major excise goods categories of motor vehicles, tobacco products and alcoholic beverages. An analysis of the 10 ASEAN excise tax systems suggests that certain excise rate differentials will create this incentive to move production and distribution arrangements. This will allow producers to lower production costs and reduce taxable values in the country of intended consumption. As a result, there will likely be an increase in the movement of excisable goods across ASEAN and risks will be associated with this. Therefore, this study believes that ASEAN should look at a number of areas to reduce this risk:
• standardise and/or harmonise some aspects of excise taxation policy to remove some of this potential movement of production and distribution, for example, guide-lines for member states that perhaps introduce specific rates of excise to remove the incentive to reduce excisable values, and/or set minimum rates of excise on certain goods
• regional coordination of the intra-regional movement of excisable goods by creating a regional excise transit system which is supported by technology such as ‘track & trace’, RFID or GPS-based solutions
• standardise definitions and structures of excise taxation systems again through ASEAN-issued guidelines to improve transparency and ease of business and administration in the intra-regional trade of excise goods.
References
ASEAN 2007, ASEAN Economic Community Blueprint, ASEAN Secretariat, Jakarta.ASEAN 2008, ASEAN Trade in Goods Agreement, ASEAN Secretariat, Jakarta. ASEAN 2011, ASEAN Economic Community Guide for Business, ASEAN Secretariat, Jakarta.Commercial Tax Law 1991, as amended, Myanmar. Commission Regulation (EEC) No. 2454/93 of 2 July 1993 laying down provisions for the implementation
of Council Regulation (EEC) No. 2913/92 establishing the Community Customs Code.Council Directive 92/79/EEC of 19 October 1992 on the approximation of taxes on cigarettes.Council Directive 92/84/EEC of 19 October 1992 on the approximation of the rates of excise duty on
alcohol and alcoholic beverages.Council Directive 2003/96/EC of 27 October 2003 on restructuring the Community Framework for the
taxation of energy products and electricity. Excise Duties Order 2004, as amended, Malaysia.Excise Duties Order 2007, Brunei Darussalam.Excise Tax Act (BE 2527), Thailand.Holden M 2003, Stages of economic integration: from autarky to economic union, viewed 29 March
2012, http://publications.gc.ca/Collection-R/LoPBdP/inbrief/prb0249-e.htm. Law on Excise Tax 2010, Socialist Republic of Vietnam.Liquor Act (BE 2493), Thailand. National Internal Revenue Code 1991, as amended, The Philippines.Organisation for Economic Co-operation and Development (OECD) 2004, Classification of taxes and
interpretative guide, OECD, Paris.

Volume 6, Number 1 15
World Customs Journal
Regulation of the Finance Minister 62/PMK.011/2010 on Excise Tariff on Alcoholic Beverages 2010, Indonesia.
Regulation of the Finance Minister 181/PMK.011/2009 on Excise Tariff for Tobacco Products 2009, Indonesia.
Sales Tax on Luxury Goods Act 1983, as amended, Indonesia. Singapore Customs 2012, List of Dutiable Goods, www.customs.gov.sg/leftNav/trad/val/
List+of+Dutiable+Goods.htm.Specific Tax on Certain Merchandise and Services Act 1994, Cambodia.Tax Law 2005, Article 28, Chapter 2 ‘Excise Tax’, Peoples Democratic Republic of Laos.Tax on Domestic Goods Act 1985, Cambodia.Tobacco Act (BE 2509), Thailand.World Health Organization (WHO) 2011, WHO Report on the Global Tobacco Epidemic 2011: Country
Profile Thailand, WHO, Geneva.
Notes1 ASEAN membership includes Brunei Darussalam, Cambodia, Indonesia, Laos PDR, Malaysia, Myanmar, Philippines,
Singapore, Thailand and Vietnam.2 Paragraph 1, ‘Declaration of ASEAN Concord II’ (Bali Concord II) 2003, viewed 29 March 2012, www.aseansec.org/15159.
htm.3 Paragraph 8, ASEAN Economic Community Blueprint 2007.4 OECD 2004, Classification of taxes and interpretative guide, paragraph 61, classification sub-heading 5121.5 OECD 2004, Classification of taxes and interpretative guide, paragraphs 53-58, classification heading 5100, sub-headings
5110-5113.6 See, for example, Indonesia’s reform of alcohol and tobacco items in the Luxury Sales Tax to be ‘Excise Tariffs’, Vietnam to
use the term ‘excise in reforms of alcohol and tobacco items of the Special Consumption Tax, and Thailand’s proposal to bring provisions of the Liquor Act and Tobacco Act into the general Excise Act.
7 Paragraphs 10-19, ASEAN Economic Community Blueprint (2007).8 ASEAN 6 includes Brunei Darussalam, Indonesia, Malaysia, the Philippines, Singapore, and Thailand, and ASEAN CLMV
includes Cambodia, Laos PDR, Myanmar, and Vietnam. 9 Articles 79-90, Section 2, Community Customs Code established under Council Regulation EEC 2913/92, 12 October 1992.10 In many cases this value is actually set by the Excise Department itself in a system known as ‘authoritative assessment’.11 Currency conversions at 12 February 2012 via XE Currency conversion.12 Philippines uses Net Retail Price per litre for classification. In table 2, Beer cheap = less than 14.50 peso, mid price = 14.50
to 22 peso, and premium = greater than 22 peso. Wine cheap sparkling = less than 500 peso and premium = greater than 500 peso. Spirits (except made with local raw materials: cheap = less than 250 peso, mid price = 250 to 675 person, and premium = greater than 675 peso.
13 As per latest 19/12/2552 BE (2009).14 Manufactured by the Thai Tobacco Monopoly (TTM).15 World Health Organization (WHO) 2011.16 Telecommunications is subject to excise in Thailand, and gaming is subject to excise in Thailand and Vietnam.17 Paragraphs 20-22, AEC Blueprint.18 EU 92/883 EEC approximation of excise duties on alcohol.19 EU 92/79 EEC approximation of tobacco excise.20 EU 2003/96 EU restructuring Community framework on energy and electricity.
16 Volume 6, Number 1
International Network of Customs Universities
Rob PreeceAdjunct Associate Professor Rob Preece is an Associate Director with the Centre for Customs and Excise Studies (CCES), University of Canberra, and is currently based in Bangkok, Thailand. Rob is the Convener of CCES’s Post Graduate Diploma in Excise Studies program and undertakes various research and training programs in the area of customs and excise taxation. He undertakes capacity building, vocational training, policy development, and research, including development of economic modelling on behalf of governments, the private sector and academic partners. Rob holds a Masters degree in International Customs Law & Administration, and has 27 years’ experience in the areas of excise and customs law, including 15 years with the Australian Customs Service.
Volume 6, Number 1 17
World Customs Journal
The impact of customs procedures on business performance: evidence from Kosovo
Mario Holzner and Florin Peci
Abstract
This paper aims to identify formal and informal institutional factors in customs procedures and their impact on the performance of small and medium-sized enterprises (SMEs) involved in international trade in Kosovo based on a questionnaire carried out in 2009. The econometric findings show that one of the most important obstacles encountered by SMEs are regular appeals against customs decisions, particularly those which reflect frequent changes in over-complicated laws and regulations. However, there is a positive and significant effect of the formal customs instruments that facilitate the trade in imported goods, namely ‘customs procedures with economic impact’.
1. IntroductionThe government institutions in transition countries are still regarded as ill-performing, fragile and weak in terms of the design and implementation of state policies. This has affected the economies of these countries, which suffer from a lack of general continuity in the economic sector; in particular, these obstacles are more pronounced for small and medium-sized enterprises (SMEs) (Hashi 2001). One of the biggest barriers for enterprises in transition countries is the low level of institutional development in relation to business regulation, as well as the business tax system (Aidis & Sauka 2005). The multitude of institutional policies affects the regular functioning of businesses and often plays a destructive role in the growth and performance of SMEs. Another example of the destructive role of state institutions in transition countries is the considerable number of unnecessary laws and regulations which regulate entrepreneurial activities and business operations. Such regulatory overload causes an increase in corruption and nepotism (Bartlett & Bukvič 2001; Smallbone & Welter 2001a; Djankov et al. 2002).
The role of SMEs in a country’s economic, political, social and technical development continues to be the focus of an intensive debate between academics and policymakers. Generally, the scholars investigating SMEs consider these enterprises to be a key factor in economic growth, raising employment, supporting the formation of competitive markets, technical innovation and other aspects of socioeconomic development (Acs & Audretsch 1990; Storey 1994; Johnson & Loveman 1995). The importance of the role played by SMEs derives from the fact that the vast majority of enterprises are SMEs. Therefore, SMEs are considered to be generators of economic growth (Storey 1994; McMillan & Woodruff 2002; Audretsch 2007).
SME growth is also of great importance for countries in transition because of the radical changes that have occurred in command economies which discriminated against private companies whilst providing institutional and commercial support to public ones. The creation of a supportive environment which encourages the development of SMEs and bold entrepreneurship is one of the biggest challenges for transition countries.
Many authors have investigated the various obstacles faced by SMEs, including those that occur in transition economies (Bartlett & Prasnikar 1995; Blanchard 1997; Bartlett & Bukvič 2001; Hashi, 2001; Smallbone 2002; Pissarides, Singer & Svenjar 2003; Aidis 2005; Estrin, Meyer & Bytchkova

18 Volume 6, Number 1
International Network of Customs Universities
2005; Aidis & Estrin 2006). Their findings point to the fact that barriers caused by the existing business environment can usually be avoided and reflect an imperfect institutional framework. Such barriers include the uncertainty of duty and tax regulations, access to financial systems, as well as other obstacles which are particularly found in the early stages of transition (Schaffer & Weder 2001; Smallbone & Welter 2001b; Aidis 2005; Krasniqi 2007). The discussion on issues of entrepreneurship lies at the heart of the transition debate and focuses on the way entrepreneurship functions and the cost of obstacles which arise in this regard (Smallbone & Welter 2006).
The traditional role of customs as a state institution is characterised by responsibilities that include the collection of duties on internationally traded commodities, which is a common extension of the collection of other forms of taxes such as the Value Added Tax (VAT) and excise duties. However, the responsibility of the customs administration differs from one country to another. In developing countries, import duties are mainly collected as revenues for the national budget whereas in developed countries the main role of customs institutions is to protect the economy and enforce the law (Widdowson 2007). Certainly, customs procedures represent an important source of barriers to economic activity, especially for SMEs.
Hence, there are good reasons to analyse the impact of customs procedures on the business performance of SMEs in the case of Kosovo. This is a country where the private sector is dominated highly by SMEs, while the remaining socially-owned enterprises operate with minimum capacities at a time when they are awaiting the final phase of the privatisation process. SMEs make up 98% of all enterprises in Kosovo and represent a potential for significant economic growth (Riinvest Institute 2005). Given the small size of the country, involvement in international trade is of utmost importance even for very small companies. Also, the most recent historical developments make Kosovo an interesting subject to investigate.
Kosovo, as a country that is undergoing a process of transition, is characterised by various barriers inherited from the previous system and a high level of uncertainty in a marginalised context (Hoxha 2009). Kosovo is a developing country which is entering a new phase in its history as one of the world’s most recent independent states.1 However, even before the war in 1999, the economy of Kosovo faced many problems in relation to its political and institutional setup and this remains the case today. Problems include a privatisation process that is accompanied by high unemployment, excessive import growth, weak export sector, growing budget deficits and an informal economy (Riinvest Institute 2005). Thus, Kosovo – as one of the last Southeast European (SEE) countries to undergo the process of transition – provides a unique case study for investigating formal and informal barriers that have an impact on the growth and development of entrepreneurship.
Kosovo is also interesting due to the fact that several international and supranational organisations helped establish state institutions, including the customs administration. Kosovo Customs was established in August 1999 by the pillar of the European Union (EU) that was working under the auspices of the United Nations Mission in Kosovo (UNMIK). The UNMIK Customs Service was responsible for ensuring the application of fair and uniform trade regulations and other provisions applicable to goods subject to customs procedures. In December 2008, UNMIK transferred its competencies entirely to the Kosovan institutions. The activities and functions of Kosovo Customs are regulated by the new Customs Code of Kosovo which was adopted by the Assembly of Kosovo on 11 November 2008.
Considering the issues mentioned above, this study contributes to the available literature by analysing how customs procedures affect SMEs’ growth and performance. In many respects, Kosovo represents an extreme case. It is a tiny country which has a small-scale business community dependent on foreign trade, is exposed to highly frequent institutional change and exists within a unique post-war environment characterised by a transitional economy. Kosovo is therefore a case study of general interest which could provide insights into the role of compliance costs.
The remainder of the paper is organised as follows. In section 2 we develop the research questions and a set of hypotheses tested in this paper. Section 3 describes the data and research methodology employed. The results of the investigation are discussed in section 4 and the final section presents the conclusions.

Volume 6, Number 1 19
World Customs Journal
2. Research questions and hypothesesOn the basis of the discussion above, we can formulate the following research questions: what are the main factors affecting the turnover growth of SMEs engaged in international trade? Are there differences regarding the effects of these factors on the level of turnover achieved by SMEs engaged in international trade? What are the main formal and informal barriers to the activities of firms involved in international trade? Are customs institutions really making efforts to facilitate trade? Based on these questions we can develop a number of hypotheses.
We start from the assumption that an increase in the educational level of human capital in a firm will have a positive effect on its growth. This is supported by a number of authors who have analysed other aspects contributing towards the growth of firms. Becker (1964) focuses on differences between formal education and the acquisition of skills and knowledge that has a narrower scope of application, thereby defining general and specific human capital. Highly educated entrepreneurs play an important role in identifying and exploiting opportunities (Ucbasaran, Westhead & Wright 2006). According to Chandler and Hanks (1998), increased levels of human capital can act as a substitute for financial capital. Highly educated entrepreneurs are particularly successful when they own the firm in question; their educational level enables them to identify and select firms which have high growth expectations (Wasilczuk 2000; Almus 2002). Thus, we propose the following hypothesis:
H1: SMEs engaged in international trade that are managed by well-educated managers have higher turnover growth.
Individuals with higher levels of specific human capital are better suited to understanding neglected business opportunities and making effective strategic decisions (Colombo & Grilli 2005). These agents have what is usually referred to as ‘know-how’, and ‘tacit abilities’ that are often decisive for a successful enterprise (Jovanovic 1982; Westhead & Storey 1996). Specific knowledge on customs transactions is also an aspect of specific human capital. If it is not present in the enterprise, external consultants can be hired. Thus, we formulate the following hypothesis:
H2: SMEs engaged in international trade that hire consultants for customs transactions will achieve higher turnover growth.
Based on Gibrat’s Law (1931), firm growth is independent of the size and age of the firm. Jovanovic (1982) has opposed this view, claiming that new firms learn from previous periods and experience which enables them to grow faster and survive. Other rejections of Gibrat’s Law can be found in Geroski (1995), Suton (1997), Caves (1998) and Almus (2002). The results of the research regarding the validity of Gibrat’s Law largely depend on the methodology applied. Using a standard regression model and kernel regression estimators in a sample of 2,188 Spanish firms, Farinas and Moreno (2000) conclude that both failure rates and the mean growth rate of successful firms decline with the size and age of firms. It should be stressed that their analysis was built on Jovanovic’s (1982) theoretical growth model for firms called ‘the noisy selection model’, which is based on the lifecycle learning theory approach. The validity of Gibrat’s Law for newly established firms was tested also by Lotti, Santarelli and Vivarelli (2003) in a sample of 1,570 such firms in the Italian manufacturing sector. While Gibrat’s Law applies after the new firms have achieved the size necessary to overcome the minimum efficient scale, it does not hold true for firms in five out of six industries analysed in the years immediately following their start-up. In the case of Kosovo, the validity of Gibrat’s Law was investigated by Krasniqi (2006), who concluded that the Law does not hold true for the firms he analysed in the SME sector. These included firms involved in trade, production and services. Accordingly, we can make the following two hypotheses regarding the size and age of firms:
H3: SMEs engaged in international trade that have a higher number of employees have lower rates of growth of turnover.

20 Volume 6, Number 1
International Network of Customs Universities
H4: SMEs engaged in international trade that exist for a longer period of time have lower rates of growth of turnover.
The frequency of the exchange of information with customs authorities and the way in which this information is gathered and exchanged can be seen as factors in improving a firm’s efficiency because of their potential to reduce transaction costs (Verwaal & Donkers 2003). In general, the procedures applied in exchanging this information include the filing of a declaration for each import or export transaction. Simplifying this procedure by combining various transaction data into a single administrative customs declaration (SAD) will reduce the filing frequency and thereby the transaction costs. It is also possible to reduce the frequency of filing if firms that have met certain conditions are allowed to declare imports on a monthly basis. In turn, these simplified procedures enable firms to spend less time on gathering data and preparing customs documentation. We therefore state the following hypothesis:
H5: SMEs engaged in international trade using simplified customs procedures will face a decrease in transaction costs and experience higher turnover growth.
Firms involved in international trade can also use other beneficial customs procedures, namely ‘procedures with economic impact’. These offer, for example, exemption from the obligation to pay customs duties on imports provided the goods are not released into free circulation. These procedures form part of the trade facilitation measures introduced by the World Trade Organization (WTO) and the World Customs Organization (WCO) as a result of the pressure brought by businesses to abolish trade barriers in the interests of economic development. The firms authorised by customs authorities to use these procedures will obtain the same benefits as in hypothesis H5, (that is, a reduction in compliance costs). These considerations result in the following hypothesis:
H6: SMEs engaged in international trade that use procedures with economic impact have higher turnover growth.
In transition countries, many formal barriers are caused by the general regulatory environment, high levels of taxation, skills requirements, complicated laws and regulations that are amended frequently as well as a low level of law enforcement (Bohata & Mladek 1999; Glas, Drnovsek & Mirtic 2000; Barlett & Bukvič 2001; Hashi 2001; Ačevska, Bartlett & Stojanova 2002; Pissarides, Singer & Svenjar 2003; Aidis 2005; Xheneti 2006; Krasniqi 2007). The early years of transition are characterised by state employees’ lack of experience and knowledge of the market economy which results in their inability to provide appropriate services to businesses. This results in procedures which are costly and time-consuming, an inadequate legal system and deficiencies typical of the process of transformation which are serious obstacles for business growth (Krasniqi 2007). Thus, we can develop the following hypothesis:
H7: SMEs engaged in international trade that put forward regular complaints and appeals against the customs decisions have less turnover growth.
The growth of firms is not only hindered by formal barriers to trade. Informal barriers, particularly those relating to corruption and the unofficial economy are also problematic. We will refer to them as barriers confronted by the firms as a consequence of the low ethics of officials. In both developed and developing economies, a heavy-handed bureaucracy is considered a risk for business growth. This includes an inappropriate tax system and various discriminatory legal regulations – particularly complicated laws, rules and regulations – that regulate the functioning of companies (Bartlett & Bukvič 2001). It is important to note that the over-regulation of companies often leads to regulatory evasion by entrepreneurs. This, in turn, increases the grey economy and encourages the devotion of resources to influence the regulatory environment in their favour, thereby encouraging ‘unproductive entrepreneurship’ (Baumol 1990).
Surprisingly, Xheneti (2006) has found evidence that corruption-related barriers positively affect firms’ growth: he argues that corruption seems to be a way to cope with transitional problems and ‘buy’ a rapid pace of institutional change. He concludes that corruption can be an informal institutional mechanism

Volume 6, Number 1 21
World Customs Journal
(that is, ‘grease for the wheels’ of growth), which is apparently effective in overcoming many of the frictions which would otherwise inhibit business growth.
The report of the World Bank (2005) shows that corruption has been mentioned as a severe obstacle to investment by 20% of respondents in emerging markets, as well as a major obstacle by 15% of respondents in a survey of more than 26,000 firms in 53 countries (World Bank 2005). The interdependence of formal and informal barriers and their interrelationship have been analysed by Smallbone et al. (2001) for Belarus and Aidis (2005) for Lithuania. It is important to note that in his study, Aidis identifies the implementation of business regulations, the high frequency of tax inspections, the long time spent on negotiations and the corruption of tax inspectors as the most frequent informal barriers. In Kosovo’s context, Krasniqi (2007) surveyed 600 SMEs during 2002, concluding that the growth of Kosovo’s SMEs is impeded by several informal barriers, unfair competition and corruption. Consequently, corruption harms the development of the SME sector for the simple reason that it increases the transaction costs of businesses. Based on what has been said above, we can make the following two hypotheses:
H8: SMEs engaged in international trade that are confronted by low ethical standards among customs officials have lower turnover growth.
H9: SMEs engaged in international trade that are subject to frequent customs audit controls have lower turnover growth.
The density of imports to be cleared at certain entry points (‘clearance density’) is yet another important variable that influences business efficiency, by increasing or decreasing the transaction costs of imports. In Kosovo, the highest clearance density – and consequently, the most time spent on clearance – is at the Hani i Elezit entry point, which is the busiest border crossing for imports in the Balkans. The clearance times here are considerably longer than at other entry points. Therefore, firms importing their goods via this border crossing face higher transaction costs due to the longer time needed for clearance. Accordingly, we formulate our final hypothesis as follows:
H10: SMEs engaged in international trade that declare goods at the entry point with the highest density of clearance will have higher transaction costs and thus a lower rate of turnover growth.
3. Data and methodological approachIn this section, we present empirical evidence for the impact of transaction costs and other impediments on the business performance of 122 SMEs that operate in the trade and manufacturing sectors in Kosovo. The sample was randomly selected from the business register in the database of the Ministry of Trade in Kosovo, where more than 4,000 operational firms are involved in international trade.2 This figure represents more than 3% of the total population of Kosovan SMEs engaged in international trade. The sample covers businesses across all regions of Kosovo and reflects their size, including micro enterprises, small enterprises and medium-sized enterprises. Out of 160 contacts, 122 agreed to be interviewed, resulting in a response rate of over 76%.
According to the European Commission’s3 definition of SMEs (which is based on the number of employees), the sample contains 42 micro enterprises (less than nine employees), 77 small enterprises (between 10 and 49 employees) and three medium-sized enterprises (between 50 and 249 employees). The firms represented have an average age of 7.5 years in the year of the survey (2009) and an average of 13 employees. As far as the legal form is concerned, the sample contains three public limited companies, 10 limited liability companies and 109 private companies.
Approximately 73% of the firms included in our sample belong to the trade sector, another 10% are involved in manufacturing production and the rest are active in other services sectors. Around 10% of the firms in our sample have an annual turnover of more than one million euros.
22 Volume 6, Number 1
International Network of Customs Universities
The questionnaire was developed in accordance with various stakeholders involved in international trade in Kosovo: the business committee, chamber of trade and industry, trade alliances, border agencies, and others. The questionnaire was completed between February and March 2009, with the resulting data processed in April 2009. From this, we created and developed a database with several indicators. The questionnaire covers general information about the firm’s turnover, number of employees, company age, etc. The interviews were conducted face-to-face with the key people responsible for the activities of each enterprise (that is, mainly owners or general managers). The survey also contains information concerning the perception of entrepreneurs regarding the business environment and customs procedures.
One of the main issues in firm growth studies is the lack of longitudinal research (Davidsson 2005) – growth being a phenomenon that necessarily happens over time. In this study, however, the time dynamic that would illustrate the effects of the institutional environment is limited to only one period of SMEs’ growth between 2008 and 2007. This is because our database does not contain longitudinal data. Only the data on turnover and employment exist separately for the years 2007 and 2008 respectively. Considering this, future research should try to include panel data techniques when studying the growth of firms, particularly within the context of transition where the formal and informal institutional environment changes constantly and thus affects SMEs’ growth. Future research into the growth of Kosovan firms should also take into account growth indicators other than turnover growth (for example, sales, profits and employment growth), compare results and observe any changes which occur when a particular growth indicator is introduced.
The analysis is based on a cross-sectional database for the year 2008 with limited information for 2007. The dependent variable is the rate of turnover growth experienced by a firm in 2008 that trades on the international market (GRO). A firm is considered to be an ‘exporter-importer’ if it is more than three years old and has submitted more than 20 customs declarations on a cross-border entry point (that is, a Terminal Clearance Station of Kosovo).
The independent variables are mostly qualitative in nature whereas variables such as the number of employees, consultancy costs and firm age are measured quantitatively. The remaining variables such as the education of managers, Hani border crossing location, use of simplified procedures, ethics of customs officials, appeals, audit control, and procedures with economic impact are converted into dummy variables of one if the respective barrier to firm turnover growth is recorded and zero otherwise.
1. Education of managers (EDU): This human capital variable is expected to positively correlate to the firms’ turnover growth. The variable is one if the respondent has a university education and zero otherwise.
2. Consultant costs (CON): It is expected that firms which hire costly but knowledgeable and helpful experts for the trade and customs transactions will have higher turnover growth. Consultant costs are measured in euros.
3. Employees (EMP): We take the number of employees in the year 2007. It is expected that this variable will have a negative influence on turnover growth.
4. Age of firms (AGE): It is expected that this variable will have a negative influence on turnover growth. It measures the number of years that the firm is active.
5. Use of simplified procedures (SIM): Under this procedure, imported goods will have a higher turnover and transaction costs should be reduced. The variable will be one if firms use simplified procedures and zero otherwise.
6. Use of procedure with economic impact (ECO): Traders who use procedures with economic impact are expected to have higher rates of turnover growth. Thus, for firms that use procedures with economic impact the variable will be one and zero otherwise.

Volume 6, Number 1 23
World Customs Journal
7. Appeals (APP): Appeals are time-consuming and costly. Therefore, they will cause an increase in transaction costs. The variable is one if the trader has appealed and zero otherwise.
8. Customs officials’ ethics (CUS): This variable represents the ‘bad behaviour’ of customs officials such as red tape and corruption. Where such behaviour occurs, the variable is one and zero otherwise. This represents a qualitative variable and we evaluate answers rating one on the scale (‘very bad’) with one, and those from 2 to 5 with zero.
9. Audit control (AUD): This is also time-consuming and increases compliance costs for the firms. The variable is one if the firm has undergone an audit and zero otherwise.
10. Hani location of clearance (HAN): It is expected that this variable will have a negative influence on turnover growth because 40% of all customs clearance is concentrated at the Hani location, which involves congestion costs.
The empirical model is defined as follows and will be estimated using a stepwise ordinary least squares (OLS) estimator:
GROi = α0 + α1 EDUi + α2 CONi + α3 EMPi + α4 AGEi + α5 SIMi + α6 ECOi + α7 APPi + α8 CUSi + α9 AUDi + α10 HANi + εi.
In addition, we include a dummy variable for the few exporting firms4 in the sample to see whether it improves performance. We perform a stepwise estimation procedure, starting with the full model and progressively removing the least significant variable. Thus, we will only present the results for an empirical model whose co-efficients have a significance of at least 10%. A Breusch-Pagan/Cook-Weisberg test for heteroskedasticity in our data rejects the zero hypothesis of constant variance and thus all calculations are performed in a robust way. None of the variables correlates with each other to a great extent and we can therefore rule out any multi-collinearity (see correlation matrix in the appendix). As a robustness check we also calculate different sub-samples such as one without exporting firms and one without firms having negative turnover growth. Moreover, in an alternative calculation we use the 2008 turnover level in euros as the dependent variable with additional explanatory variables such as the turnover in 2007 as well as the squared terms of the number of employees and consulting costs in order to check for possible endogeneity and non-linearity for some of the variables.
4. Empirical findingsUsing the equation above, our calculations provide the following results. Hypotheses 1 and 2 regarding the higher education of managers and involvement of consultants for customs transactions are valid. Both coefficients are positive and significant and can be interpreted as follows. An increase in consulting costs of 1,000 euros increases a firm’s turnover growth by 1.4%. If a firm’s manager has tertiary education, the turnover growth was found to be higher by almost 13%. Our calculations also support hypotheses 3 and 4. We find a negative correlation between the number of employees and number of years that the firm has been active in terms of turnover growth, with both coefficients being highly significant. These results do not support Gibrat’s Law but are in line with the findings of other studies (see Krasniqi 2006, 2007). From the set of customs-related indicators, only two were significant. These are the use of procedures with economic impact as well as the appeals variable. While the former coefficient is highly significant, the latter is only significant at the 10% level. The coefficient for the use of procedures with economic impact is positive and the coefficient for the appeals variable negative. The coefficients of both dummy variables are similar in size, indicating that the use of the former relates to higher turnover growth of approximately 12%, whereas turnover growth is 11% less for firms involved in appeals. All other customs-related coefficients are insignificant, indicating that the use of simplified procedures, perceived bad customs behaviour, audits and congested customs clearance locations are not significantly related to the turnover growth of Kosovan SMEs. The exporter dummy variable proved to be insignificant. The

24 Volume 6, Number 1
International Network of Customs Universities
R² of the model is at about 28%. Thus, there are obviously other important determinants of turnover growth which are missing in our database. Using hierarchical procedures to calculate delta R²s allows us to estimate how the individual explanatory variables add to the explained variance of the model. Of the overall 28% of the model’s R² about one quarter is related to the variable years of a firm’s activity, while approximately one-fifth of the model fit is attributed to the education of managers and procedures with economic impact. Each of the other three significant variables covers about one-tenth of the model’s explanatory power.
Table 1: Determinants of Kosovo SMEs’ turnover growth, 2008Coefficients P-value
Constant 35.752 0.000Education of managers 12.950 0.003Consulting costs 0.001 0.017Number of employees 2007 -0.459 0.002Years of firm’s activity -2.381 0.000Procedure with economic impact 11.698 0.006Appeals against customs decisions -11.280 0.082N = 122R² = 27.7%Estimator: Stepwise OLS, robust standard errors.
The robustness check using different sub-samples (such as one without exporting firms and one without both exporting firms as well as firms having negative turnover growth) yielded the following results: in both cases the appeals coefficient turned insignificant; all other results remained stable compared to our main calculation. This draws attention to the fact that exporters and firms with negative growth were more likely to be involved in troublesome customs appeals.
We also conducted an alternative calculation explaining the level of 2008 turnover in euros as the dependent variable with additional explanatory variables such as turnover in 2007 as well as the squared terms of the number of employees and consulting costs in order to check for possible endogeneity and non-linearities. One abnormal observation had to be removed from the data set. Interestingly, the results do not differ greatly from the growth model. Almost the same variables have coefficients of the same sign (that is, positive/negative) and significance. Again, the managers’ education as well as the consultancy costs prove to be positively correlated with the dependent variable. Only now, the squared consulting costs have a negative coefficient. This implies that expenditure on consultancy in customs issues exhibits a diminishing return. Instead of the number of employees, the squared number of employees is significant in explaining less turnover. This indicates that, in terms of employees, only larger firms are at a disadvantage. The number of ‘firm years’ again has a negative coefficient. There are no changes concerning the customs-related coefficients either. The coefficient for the use of procedures with economic impact is positive and the coefficient for the appeals variable negative. In this model, the R² is more than 99%. This is certainly due to the inclusion of the lagged turnover variable.

Volume 6, Number 1 25
World Customs Journal
Table 2: Determinants of Kosovo SMEs’ turnover level, 2008Coefficients P-value
Constant 20862.060 0.172Turnover level 2007 1.104 0.000Education of managers 20531.520 0.015Consultancy costs 10.271 0.000Consultancy costs squared -0.001 0.029Number of employees 2007 squared -42.722 0.036Years of firm’s activity -3492.184 0.004Procedure with economic impact 26436.700 0.001Appeals against customs decisions -15595.480 0.097N = 121
R² = 99.4%Estimator: Stepwise OLS, robust standard errors
5. Conclusions and policy implicationsOur research suggests that regular appeals against customs decisions represent one of the most important institutional obstacles encountered by SMEs in the import-export sector. This supports earlier results on Kosovo by Krasniqi (2007). However, there is also a positive and significant correlation of formal customs institutions that facilitate the trade of imported goods, namely ‘procedures with economic impact’. This result supports the efforts made by the WTO and WCO in the field of trade facilitation. In this respect, another determinant that is positively related to turnover growth is the engagement of experts in the field of customs clearance procedures. However, the level of turnover will suffer if the expenditure for consultancy is too high. This suggests that institutional support should be directed towards the simplification of customs procedures in order to reduce the compliance costs of firms. Also, law enforcement needs to be put in place more effectively.
The fact that a large number of employees and many years of business activity negatively influence both growth and the level of turnover send a reassuring signal to new entrants in this market. Also, this reaffirms earlier results by Krasniqi (2006, 2007) and complements literature that empirically rejects Gibrat’s Law (1931). However, it was also found that it is beneficial for a firm to have a well-educated management team. This should be an additional incentive for the public and private sectors to invest in the education of Kosovo’s population. Although not very surprising, this result confirms the earlier findings of Wasilczuk (2000) and Almus (2002).
It is interesting to note that, contrary to popular belief, customs behaviour perceived as ‘bad’ such as red tape and corruption as well as audit controls, apparently do not influence the level and growth of turnover of Kosovan SMEs engaged in international trade. Here, our findings do not match earlier results on Albania and Kosovo. In the former case, Xheneti (2006) found a positive relationship and in the latter case, Krasniqi (2007) observed a negative correlation. Thus, it seems that reforms of formal customs procedures are most likely to improve the efficiency of doing business in Kosovo. However, simplified procedures aimed at reducing the time spent filling out declarations have not proved significant. This contrasts to what Verwaal and Donkers (2003) found in their Dutch sample.
Thus, while it has to be noted that the policy recommendations offered do not necessarily follow directly from our empirical research, the assumption is that some of the main barriers to doing business in the import-export sector in Kosovo are a consequence of frequent changes in over-complicated laws and regulations. The link between state laws, regulations and policies and the parameters important for economic well-being of SMEs in Kosovo is a subject which deserves more detailed analysis in future research.

26 Volume 6, Number 1
International Network of Customs Universities
Appendix
Appendix Table 1: Correlation between coefficients at a 10% level of significance
growth turnov. educat. consult. empl. years simple econ appeals behav. audit hanigrowth 1turnov. -0.197 1educat. 0.229 1consult. 0.165 0.224 1empl. -0.166 0.503 0.268 1years -0.293 1simple 1econ 0.223 -0.207 -0.287 1appeals -0.211 1behav. -0.210 1audit 0.205 1hani 0.165 1
Appendix Table 2: Descriptive statisticsVariables Mean Std. Dev. Minimum Maximum
Turnover growth 2008 19.9 23.9 -88.8 131.6Turnover level 2008 418942 507901 28000 3135000
Education of managers 0.344 0.477 0 1Consulting costs 2207 3201 0 13800
Number of employees 2007 11.8 8.2 2 55Years of firm activity 5.7 2.3 3 23
Simplified procedure 0.238 0.427 0 1Procedure with economic impact 0.434 0.498 0 1
Appeals against customs decisions 0.836 0.372 0 1Bad customs behaviour 0.500 0.502 0 1
Audit 0.861 0.348 0 1Hani 0.459 0.500 0 1

Volume 6, Number 1 27
World Customs Journal
References
Acemoglu, D 1995, ‘Reward structures and the allocation of talent’, European Economic Review, vol. 39, no. 1, pp. 17-33.
Ačevska, B, Bartlett, W & Stojanova, V 2002, ‘Barriers to SME development in the Republic of Macedonia’, in W Bartlett, M Bateman & M. Vehovec (eds), Small enterprise development in South East Europe: policy issues and future perspectives, Kluwer, Dordrecht.
Acs, Z & Audretsch, D 1990, Innovation and small firms, MIT Press, Cambridge.Aidis, R 2005, ‘Institutional barriers to small- and medium-sized enterprise development in transition
countries’, Small Business Economics, vol. 25, no. 4, pp. 305-18.Aidis, R & Estrin, S 2006, ‘Institutions, networks and entrepreneurship development in Russia: an
exploration’, Discussion Paper Series, IZA, DP no. 2161.Aidis, R, Estrin, S & Mickiewizs, T 2009, ‘Entrepreneurial entry: which institutions matter?’, Discussion
Paper Series, IZA, DP, no. 4123.Almus, M 2002, ‘What characterizes a fast-growing firm?’, Applied Economics, vol. 34, no. 12, pp. 1497-
1508.Audretsch, DB 2007, The entrepreneurial society, Oxford University Press, Oxford.Bartlett, W & Bukvič, B 2001, ‘Barriers to SME growth in Slovenia’, Economic Policy in Transition
Economies, vol. 11, no. 2, pp. 177-95.Bartlett, W & Prasnikar, J 1995, ‘Small firms and economic transformation in Slovenia’, Communist
Economies and Economic Transformation, vol. 7, no. 1, pp. 81-101.Baumol, W 1990, ‘Entrepreneurship: productive, unproductive, and destructive’, Journal of Political
Economy, vol. 98, no. 5, pp. 893-921. Becker, G 1964, Human capital, National Bureau of Economic Research, Columbia University Press,
New York.Becker, G 1975, Human capital, University of Chicago Press, Chicago.Blanchard, O 1997, The economics of post-communist transition, Oxford University Press, Oxford.Bohata, M & Mladek, J 1999, ‘The development of the Czech SME sector’, Journal of Business
Venturing, vol. 14, nos 5-6, pp. 461-73.Caves, RE 1998, ‘Industrial organization and new findings on the turnover and mobility of firms’,
Journal of Economic Literature, vol. 36, no. 4, pp. 1947-83.Chandler, G & Hanks, S 1998, ‘An examination of the substitutability of founders, human and financial
capital in emerging business ventures’, Journal of Business Venturing, vol. 13, no. 5, pp. 353-69.Colombo, MG & Grilli, L 2005, ‘Founders’ human capital and the growth of new technology-based
firms: a competence-based view’, Research Policy, vol. 34, no. 6, pp. 795-816.Davidsson, P 2005, ‘Method challenges and opportunities in the psychological study of entrepreneurship’,
in R Baum, M Frese & R Baron (eds), The psychology of entrepreneurship, Lawrence Erlbaum Associates, Mahwah, NJ.
Dixit, A 1989, ‘Entry and exit decision under uncertainty’, Journal of Political Economy, vol. 97, no. 3, pp. 620-38.
Djankov, S, La Porta, R, Lopez-de-Silanes, F & Shleifer, A 2002, ‘The regulation of entry’, Quarterly Journal of Economics, vol. 67, pp. 1-37.
Estrin, S, Meyer, K & Bytchkova, M 2005, ‘Entrepreneurship in transition economies’, in M Casson, B Yeung, A Basu & N Wadeson (eds), The handbook of entrepreneurship, Oxford University Press, London.

28 Volume 6, Number 1
International Network of Customs Universities
Farinas, JC & Moreno, L 2000, ‘Firm growth, size and age: a nonparametric approach’, Review of Industrial Organization, vol. 17, no. 3, pp. 249-65.
Geroski, PA 1995, ‘What do we know about entry?’, International Journal of Industrial Organization, vol. 13, no. 4, pp. 421-40.
Gibrat, R 1931, Les Inégalités Économiques, Librairie du Recueil Sirey, Paris.Glas, M, Drnovsek, M & Mirtic, D 2000, ‘Problems faced by new entrepreneurs: Slovenia and Croatia:
a comparison’, paper presented at the 30th ESBS Seminar, Gent.Hashi, I 2001, ‘Financial and institutional barriers to SME growth in Albania: results of an enterprise
survey’, MOCT—MOST, vol. 11, no. 3, pp. 221-38.Henrekson, M 2007, ‘Entrepreneurship and institutions’, Comparative Labor Law and Policy Journal,
vol. 28, no. 3, pp. 717-42.Hoxha, D 2009, ‘Barriers to doing business in Kosova: an institutional approach’, International Journal
of Entrepreneurship and Small Business, vol. 8, no. 2, pp. 186-99.Johnson, S & Loveman, G 1995, Starting over in Eastern Europe: entrepreneurship and economic
renewal, Harvard Business School Press, Cambridge.Jovanovic, B 1982, ‘Selection and the evolution of industry’, Econometrica, vol. 50, pp. 649-70.Krasniqi, B 2006, ‘Size, age and firm growth: econometric evidence from SME sector in Kosova’,
International Journal of Management and Entrepreneurship, vol. 2, no. 1, pp. 57-68.Krasniqi, B 2007, ‘Barriers to entrepreneurship and SME growth in transition: the case of Kosova’,
Journal of Developmental Entrepreneurship, vol. 12, no. 1, pp. 71-94.Lotti, F, Santarelli, E & Vivarelli, M 2003, ‘Does Gibrat’s Law hold among young, small firms?’, Journal
of Evolutionary Economics, vol. 13, no. 3, pp. 213-35.McMillan, J & Woodruff, C 2002, ‘The central role of entrepreneurs in transition economies’, Journal
of Economic Perspectives, vol. 16, no. 3, pp. 153-70.Pissarides, F, Singer, M & Svenjar, J 2003, ‘Objectives and constraints of entrepreneurs: evidence from small
and medium size enterprises in Russia and Bulgaria’, Journal of Comparative Economics, vol. 31, no. 3, pp. 503-31.
Riinvest Institute for Development Research 2005, ‘SME development in Kosova’, Research report, Riinvest, Prishtina.
Schaffer, M & Weder, B 2001, ‘Firm size and the business environment: worldwide survey results’, International Finance Corporation, Discussion Paper no. 4.
Shane, S & Venkataraman, S 2000, ‘The promise of entrepreneurship as a field of research’, Academy of Management Review, vol. 25, no. 1, pp. 217-26.
Smallbone, D 2002, ‘Institutions, administrative reform and SME development in transition economies: some policy issues’, paper presented at the Conference on Economic Development and Reconstruction Policies in SEE, Dubrovnik, 25-28 April.
Smallbone, D & Welter, F 2001a, ‘The distinctiveness of entrepreneurship in transition economies’, Small Business Economics, vol. 16, no. 4, pp. 249-62.
Smallbone, D & Welter, F 2001b, ‘The role of government in SME development in transition countries’, International Small Business Journal, vol. 19, no. 4, pp. 63-77.
Smallbone, D & Welter, F 2006, ‘Conceptualizing entrepreneurship in a transition context’, International Journal of Entrepreneurship and Small Business, vol. 3, no. 2, pp. 190-206.
Smallbone, D, Welter, F, Isakova, N & Slonimski, A 2001, ‘The contribution of small and medium enterprises to economic development in Ukraine and Belarus: some policy perspectives’, Most, vol. 11, no. 3, pp. 253-73.

Volume 6, Number 1 29
World Customs Journal
Solymossy, E 2005, ‘Entrepreneurship in extreme environments: building an expanded model’, International Entrepreneurship and Management Journal, vol. 11, no. 4, pp. 501-18.
Storey, D 1994, Understanding the small business sector, International Thomson Business Press, London.
Suton, J 1997, ‘Gibrat’s legacy’, Journal of Economic Literature, vol. 35, no. 1, pp. 40-59.Ucbasaran, D, Westhead, P & Wright, M 2006, ‘Opportunity identification and pursuit: does an
entrepreneur’s human capital matter?’, 3rd Specialized Research Workshop, Gate2, Growth Academic Network, University of Amsterdam.
Verwaal, E & Donkers, B 2003, ‘Customs-related transaction costs, firm size and international trade intensity’, Small Business Economics, vol. 21, pp. 257-71.
Wasilczuk, J 2000, ‘Advantageous competence of owner/managers to grow the firm in Poland: empirical evidence’, Journal of Small Business Management, vol. 38, no. 2, pp. 88-94.
Westhead, P & Storey, D 1996, ‘Management training and small firm performance: why is the link so weak?’, International Small Business Journal, vol. 14, no. 4, pp. 3-25.
Widdowson, D 2007, ‘The changing role of Customs: evolution or revolution?’, World Customs Journal, vol. 1, no. 1, pp. 31-7.
Wooldridge, J 2005, Introductory econometrics: a modern approach, 3rd edn, Thompson Higher Education, Mason.
World Bank 2005, A better investment climate for everyone: World Development Report 2005, The World Bank and Oxford University Press, New York.
Xheneti, M 2006, ‘SME development in Albania: an empirical investigation of business growth’, paper presented at the RENT XX Conference, Brussels, Belgium, 22-24 November.
Notes1 From June 1999 the territory of Kosovo was administered by the United Nations Mission in Kosovo (UNMIK). On 17 February
2008, in an extraordinary session the parliament of Kosovo unilaterally declared Kosovo’s independence and with the promulgation of the constitution of Kosovo, the institutions of the Republic of Kosovo took over all governance authorities.
2 We did not include firms that were inactive in the period 2005 to 2008.3 http://europa.eu.int/comm/enterprise/enterprise_policy/sme_definition/index_en.htm. 4 The vast majority of Kosovo firms engaged in international trade are solely importing. The country has not yet developed a proper
export sector.

30 Volume 6, Number 1
International Network of Customs Universities
Mario HolznerMario Holzner is staff economist at the Vienna Institute for International Economic Studies. His research focuses on international trade, economic growth, income distribution, and the economies of Southeast Europe. Mario completed a doctorate at the Vienna University of Economics and Business administration (economics). In his recent research, Mario analysed the effects of free trade agreements for Balkan economies with the help of the Global Simulation Model (GSIM).
Florin PeciFlorin Peci has worked for 11 years on organisational development and management reform in Kosovo Customs. He provided advice on issues concerning customs performance on several United Nations and European Community-funded technical assistance projects in Kosovo, and on issues concerning customs competencies, customs legislation, performance measurement in Customs, and questions concerning the design of customs management information systems. Currently, Florin is Head of the Law Enforcement Department in Kosovo Customs and is a PhD candidate at the Economic Faculty, University of Prishtina in Kosovo.

Volume 6, Number 1 31
World Customs Journal
De minimis thresholds in APECStephen Holloway and Jeffrey Rae1
This report, prepared on behalf of the Conference of Asia Pacific Express Carriers (CAPEC), is published with the permission of CAPEC.
Executive summaryA de minimis regime provides streamlined border clearance and exemption from customs duties and other taxes. These features generate economic benefits by refocusing public revenue collection on more efficient revenue sources, reducing the costs borne by importers, and accelerating the delivery of imports.
Most APEC economies have de minimis regimes but thresholds range from under USD1 to more than USD1,000, and eligibility varies. These design features affect the balance of economic benefits and costs that a regime produces.
This study assesses, in some detail, the de minimis regimes of Canada, Indonesia, Japan, Malaysia, the Philippines, and Thailand — the APEC-6 economies for ease of reference. We chose them as being broadly representative of the APEC region in terms of geography and economic development. The study has estimated the net economic benefit of four alternatives — representing de minimis thresholds of USD50, USD100, USD150, and USD200. Tables 1 and 2 have the key results.
The USD200 threshold generated the largest net economic benefit — around USD5.9 billion a year for the APEC-6, equivalent to about USD30.3 billion for all 21 APEC members. In relative terms the latter is around 0.086% of APEC-21 gross domestic product (GDP).
Resource savings in government administration are the largest benefit. Under all scenarios, cuts in government administration accounted for 76% of the benefits, while savings in business compliance were virtually all of the rest. The latter are particularly important for small and medium sized enterprises (SMEs) as they generally face disproportionate burdens in completing customs formalities.
Savings in time in transit have a clear economic benefit. The longer products take to get to market, the more likely they will perish, become outdated, be displaced by superior alternatives, or lose the interest of potential buyers. Previous research has shown that a 10% cut in delivery time will, other things being equal, expand exports of time-sensitive manufactures by over 4%. For low value consignments, however, the transit time savings are generally small compared to the others.
A notable characteristic of the results is the relatively small impact that an increase in threshold has on government revenue. The loss of tariff revenue is less than 1% of the savings under the USD200 scenario and only 0.7% of those under the USD100 scenario. Although the loss of VAT revenue is more difficult to estimate, at worst it is no more than 4% of the savings under the USD200 scenario and less under the rest.
The revenue loss is much lower than many may have expected. The potential revenue base has been substantially eroded by preferential tariff rates under Free Trade Agreements (FTAs) and the existing de minimis exemptions. This is true even for those economies that have relatively high applied Most Favoured Nation (MFN) tariff rates.
The composition of the results is broadly the same for each of the scenarios and reflects the basic economics of this category of imports — relatively large numbers but relatively low aggregate value. Hence the volume-based impacts, such as those on customs and business processing costs loom larger than the value-based ones, such as those involving transit delays and tax collections.
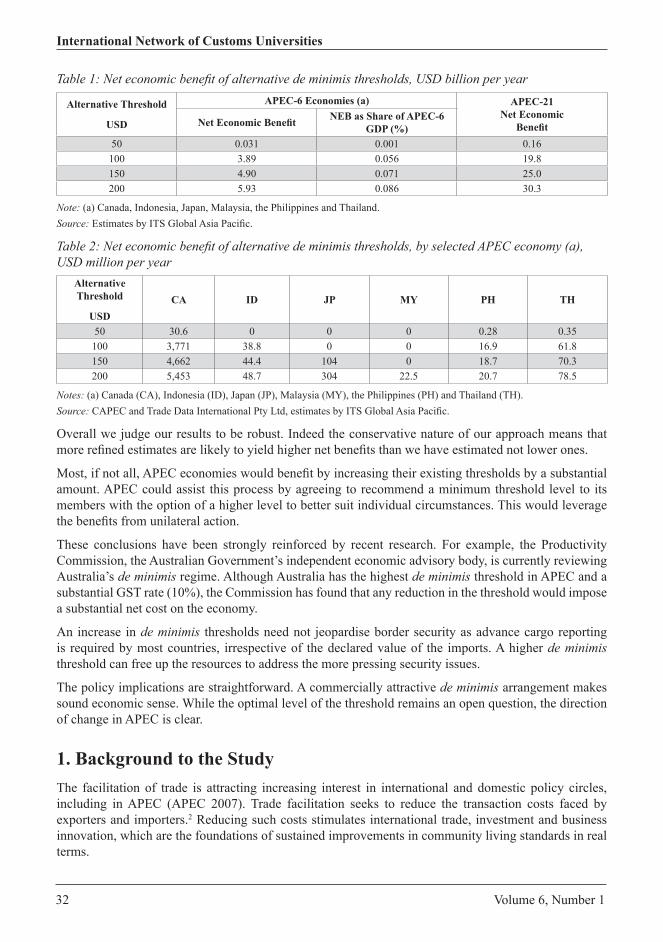
32 Volume 6, Number 1
International Network of Customs Universities
Table 1: Net economic benefit of alternative de minimis thresholds, USD billion per year
Alternative Threshold
USD
APEC-6 Economies (a) APEC-21 Net Economic
Benefit Net Economic Benefit NEB as Share of APEC-6 GDP (%)
50 0.031 0.001 0.16100 3.89 0.056 19.8150 4.90 0.071 25.0200 5.93 0.086 30.3
Note: (a) Canada, Indonesia, Japan, Malaysia, the Philippines and Thailand.Source: Estimates by ITS Global Asia Pacific.
Table 2: Net economic benefit of alternative de minimis thresholds, by selected APEC economy (a), USD million per year
Alternative Threshold
USDCA ID JP MY PH TH
50 30.6 0 0 0 0.28 0.35100 3,771 38.8 0 0 16.9 61.8150 4,662 44.4 104 0 18.7 70.3200 5,453 48.7 304 22.5 20.7 78.5
Notes: (a) Canada (CA), Indonesia (ID), Japan (JP), Malaysia (MY), the Philippines (PH) and Thailand (TH).Source: CAPEC and Trade Data International Pty Ltd, estimates by ITS Global Asia Pacific.
Overall we judge our results to be robust. Indeed the conservative nature of our approach means that more refined estimates are likely to yield higher net benefits than we have estimated not lower ones.
Most, if not all, APEC economies would benefit by increasing their existing thresholds by a substantial amount. APEC could assist this process by agreeing to recommend a minimum threshold level to its members with the option of a higher level to better suit individual circumstances. This would leverage the benefits from unilateral action.
These conclusions have been strongly reinforced by recent research. For example, the Productivity Commission, the Australian Government’s independent economic advisory body, is currently reviewing Australia’s de minimis regime. Although Australia has the highest de minimis threshold in APEC and a substantial GST rate (10%), the Commission has found that any reduction in the threshold would impose a substantial net cost on the economy.
An increase in de minimis thresholds need not jeopardise border security as advance cargo reporting is required by most countries, irrespective of the declared value of the imports. A higher de minimis threshold can free up the resources to address the more pressing security issues.
The policy implications are straightforward. A commercially attractive de minimis arrangement makes sound economic sense. While the optimal level of the threshold remains an open question, the direction of change in APEC is clear.
1. Background to the StudyThe facilitation of trade is attracting increasing interest in international and domestic policy circles, including in APEC (APEC 2007). Trade facilitation seeks to reduce the transaction costs faced by exporters and importers.2 Reducing such costs stimulates international trade, investment and business innovation, which are the foundations of sustained improvements in community living standards in real terms.
Volume 6, Number 1 33
World Customs Journal
A key aim of trade facilitation is the simplification of customs procedures and a key way to simplify customs procedures is to exempt merchandise from indirect taxation — e.g. customs duty, VAT, GST, and sales taxes — below a specified minimum — or de minimis — value. The World Trade Organization (WTO), the Organisation for Economic Co-operation and Development (OECD), the World Customs Organization (WCO), and the International Chamber of Commerce (ICC) have all recommended the adoption of such thresholds.
A de minimis threshold reduces the compliance costs imposed on importers and accelerates delivery of the merchandise. It also allows governments to refocus their revenue collection efforts on those parts of the indirect tax base that yield higher net revenue.
Most APEC economies have de minimis arrangements but they vary considerably which can significantly affect the balance of their economic benefits and costs. Thresholds range from less than USD1 to more than USD1,000 and the products eligible for the exemption also vary.
Asia Pacific Economic Cooperation (APEC) Leaders have committed their governments to the achievement of a 10% improvement in supply chain performance, after taking into account the circumstances of individual economies.
At Big Sky, Montana in the United States on 20 May 2011, the APEC Ministers Responsible for Trade (MRT) agreed that reducing the time, cost, and uncertainty of moving goods and services remains a top priority for APEC and accordingly instructed their officials to continue with the development of the APEC Supply-Chain Connectivity Framework (SCCF) Action Plan. The priorities for the Action Plan include the simplification of customs procedures and the implementation of commercially useful de minimis thresholds.
One proposal that has been put forward would set a baseline de minimis value for all APEC economies, with individual economies encouraged to adopt higher de minimis thresholds as they see fit. All APEC members have agreed to further work on the idea. As a consequence, with the support of the Express Association of America the Peterson Institute for International Economics in Washington, DC undertook an economic study into the benefits and challenges of de minimis regimes (Hufbauer & Wong 2011).
As the study by the Peterson Institute had focused on the experience of the United States, the Conference of Asia Pacific Express Carriers (CAPEC) engaged ITS Global Asia Pacific (ITS) and the Centre for Customs and Excise Studies (CCES) at the University of Canberra to assess the de minimis arrangements that apply in APEC at the present time, the reasons for their adoption, and the economic benefit that would flow from applying higher de minimis thresholds across the APEC region. Based on the results of its assessment, the study was to make policy recommendations, including on the appropriate baseline de minimis arrangements for APEC.
2. De minimis regimes in APECThis Chapter identifies the principal aspects of the de minimis regimes that apply in Canada, Indonesia, Japan, Malaysia, the Philippines and Thailand at the present time and, where possible, the underlying policy rationale for the specified threshold and its supporting arrangements. We have chosen these economies as being broadly representative of the APEC region as a whole, both in terms of geography and economic development.
There is scant public information available in relation to the policy underpinnings for the setting of particular de minimis thresholds. This issue was also recently highlighted in the Australian context by the Productivity Commission (2011, p. 161).
Approaches were made to each of the individual customs administrations in question requesting background information on their de minimis policy arrangements. The majority were either unable
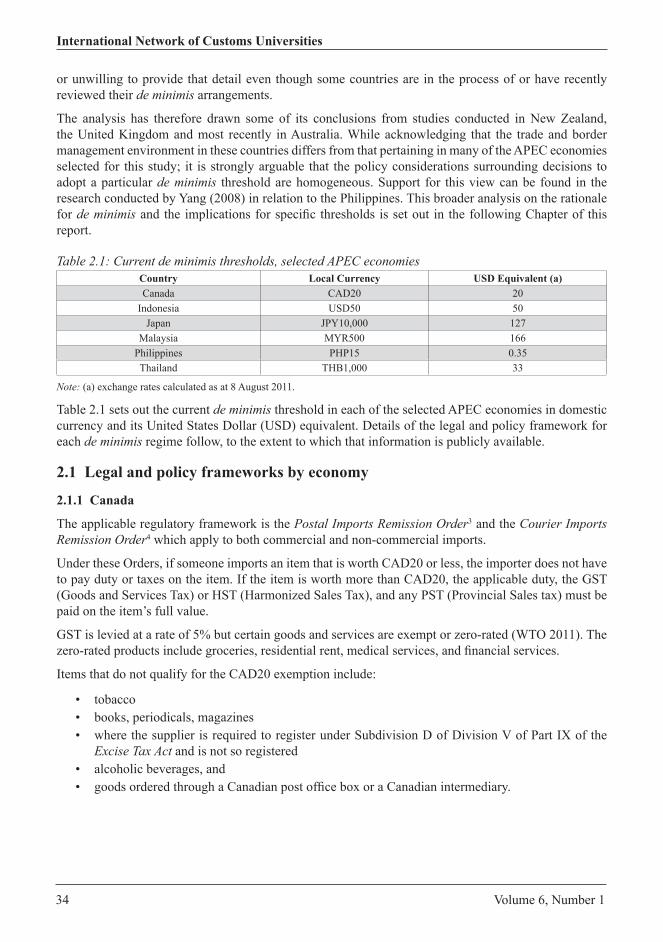
34 Volume 6, Number 1
International Network of Customs Universities
or unwilling to provide that detail even though some countries are in the process of or have recently reviewed their de minimis arrangements.
The analysis has therefore drawn some of its conclusions from studies conducted in New Zealand, the United Kingdom and most recently in Australia. While acknowledging that the trade and border management environment in these countries differs from that pertaining in many of the APEC economies selected for this study; it is strongly arguable that the policy considerations surrounding decisions to adopt a particular de minimis threshold are homogeneous. Support for this view can be found in the research conducted by Yang (2008) in relation to the Philippines. This broader analysis on the rationale for de minimis and the implications for specific thresholds is set out in the following Chapter of this report.
Table 2.1: Current de minimis thresholds, selected APEC economiesCountry Local Currency USD Equivalent (a)Canada CAD20 20
Indonesia USD50 50Japan JPY10,000 127
Malaysia MYR500 166Philippines PHP15 0.35Thailand THB1,000 33
Note: (a) exchange rates calculated as at 8 August 2011.
Table 2.1 sets out the current de minimis threshold in each of the selected APEC economies in domestic currency and its United States Dollar (USD) equivalent. Details of the legal and policy framework for each de minimis regime follow, to the extent to which that information is publicly available.
2.1 Legal and policy frameworks by economy
2.1.1 Canada
The applicable regulatory framework is the Postal Imports Remission Order3 and the Courier Imports Remission Order4 which apply to both commercial and non-commercial imports.
Under these Orders, if someone imports an item that is worth CAD20 or less, the importer does not have to pay duty or taxes on the item. If the item is worth more than CAD20, the applicable duty, the GST (Goods and Services Tax) or HST (Harmonized Sales Tax), and any PST (Provincial Sales tax) must be paid on the item’s full value.
GST is levied at a rate of 5% but certain goods and services are exempt or zero-rated (WTO 2011). The zero-rated products include groceries, residential rent, medical services, and financial services.
Items that do not qualify for the CAD20 exemption include:
• tobacco• books, periodicals, magazines• where the supplier is required to register under Subdivision D of Division V of Part IX of the
Excise Tax Act and is not so registered• alcoholic beverages, and• goods ordered through a Canadian post office box or a Canadian intermediary.

Volume 6, Number 1 35
World Customs Journal
In addition the Courier Low Value Shipment (LVS) Program streamlines the processing of low-value shipments through customs while providing the express courier industry with expedited release. This is done through:
• a single combined cargo report and release document called the ‘cargo/release list’ for goods valued under CAD 1,600
• the courier is required to provide separate cargo/release lists for cargo valued at less than CAD2,020 and for cargo valued between CAD20 and CAD1,600.
Hufbauer and Wong (2011) suggest that Canada mainly has a low de minimis threshold because the Federal Government imposes a tax on value-added (GST), which applies to imports as well as domestic sales, and is concerned about the potential loss of GST revenue. This concern is amplified by the fact that the United States, Canada’s neighbor and largest trading partner, does not impose a VAT-style of indirect tax.
2.1.2 Japan
Goods with a customs value of JPY10,000 or less are exempted from customs duty and consumption tax. This treatment is provided by:
• paragraph 3, Article 14 of the Customs Tariff Law
• Section 21, Article 16 of the Cabinet Order for Enforcement of the Customs Tariff Law
• paragraph 14 of the General Notification of the Customs Tariff Law, and
• No. 1 of paragraph 1, Article 13 of the Law for the Collection of Excise Taxes on Imports.
Consistent with the treatment that is accorded by de minimis regimes elsewhere, imports into Japan are only exempted from the consumption tax and not from other domestic taxes — for example, liquor tax, tobacco tax, etc. The consumption tax is a VAT-style tax and is levied at the rate of 5% (WTO 2011).
Furthermore, the de minimis exemption is not applicable to certain designated articles5 for which tax exemption is considered inappropriate because of their impact on domestic industry or for other reasons, even if their customs value does not exceed JPY10,000.
The criteria for determining whether the customs value is JPY10,000 or less are as follows:
• The customs value of imported goods per declaration should not exceed JPY10,000. When multiple declarations are made for one invoice in order to divide the invoice’s articles into several units, the total customs value of all the articles belonging to the invoice should not exceed JPY10,000.
• For parcel post, the customs value of all articles enclosed in one package should not exceed JPY10,000. If a shipment is divided (to avoid weight limits, etc.) and sent from a given sender to a given receiver at the same time, the total amount of customs value of all the parcels shipped separately from the sender to the recipient should not exceed JPY10,000.
2.1.3 Indonesia
Article 6 of Customs Regulation Number P-05/BC/2006 provides that ‘Courier express shipments with value not more than USD50 are exempted from import duty and taxes’.
Value-added tax (VAT) is applied at a rate of 10% to most goods and services. The exceptions include: certain mining and drilling products; certain minerals; basic necessities; food and drink served in hotels and restaurants; shares, bonds, and other commercial paper; healthcare; orphanage, and funerary;

36 Volume 6, Number 1
International Network of Customs Universities
postal; banking, insurance, and financial; religious; educational; non-commercial art; non-commercial broadcasting; public transport; manpower; and hotel services (WTO 2007a).
The luxury goods tax is applied at various rates:
• 10% on bottled water, soft drinks, cosmetics, radios and tapes, luxury houses, and townhouses
• 20% on carpets, sanitary goods, and luxury home appliances such as air conditioners
• 30% on non-government ships, sports equipment, certain television receivers, and motor vehicles with fewer than ten seats
• 40% on alcoholic beverages, imported leather goods, imported precious metals, private aircraft, and firearms; 60% on two-wheeled motor vehicles, and
• 75% on luxury yachts, and trailers and semi-trailers for camping or home use (WTO 2007a).
There is very little publicly available information on the de minimis threshold in Indonesia.
2.1.4 Malaysia
Express consignments with a de minimis value of MYR500 are exempted from the payment of customs duties. The direct release of non-dutiable express shipments below MYR2,000 without a formal declaration is permitted.
Malaysian Government has stated that the purpose of its de minimis threshold is:
… trade and business facilitation, effective delivery of services and reducing the cost of doing business…to enhance efficiency and effectiveness in the delivery of goods and services, the Government is also promoting the growth of integrated logistics services (WTO 2005a, pp. 1-2).
The WTO has reported that the Malaysian authorities are planning to introduce a broadly-based VAT-type of tax of goods and services (GST) to replace the existing system of sales taxes and taxes on services, which generally involve tax rates of between 5% and 10% (WTO 2005c; 2009). It is not clear whether the Government is going to extend their de minimis arrangements to the GST when it is introduced.
2.1.5 The Philippines
Section 709 of the Tariff and Customs Code provides that:
a Collector [of Customs] shall have discretionary authority to remit the assessment and collection of customs duties, taxes and other charges when the aggregate amount of such duties, taxes and other charges is less than 15 pesos6 and he may dispense with the seizure of articles of less than 15 pesos in value except in cases of prohibited importations or the habitual or intentional violation of the tariff and customs laws.7
The Philippines imposes a value added tax (VAT) at a rate of 10% (proposed to be raised to 12%). The exemptions from VAT include: agricultural and marine food products; agricultural inputs; coal and petroleum products; books, newspapers and magazines; and passenger and/or cargo vessels of more than 5,000 tons (WTO 2005b).
The following import consignments need only complete the informal entry process:
• articles of a commercial nature that are intended for sale, barter or hire, the dutiable value of which does not exceed PHP2000, and
• personal and household effects or articles, not in commercial quantities, that are imported in a passenger’s baggage, mail, or otherwise for personal use.
Volume 6, Number 1 37
World Customs Journal
The following have to complete the formal entry process, regardless of value and whatever purpose and nature of the importation:
• articles of a commercial nature intended for sale, barter, or hire, the dutiable value of which is more than PHP2000, and
• those articles which the Collector of Customs may require, upon the recommendation of the Tariff Commission, for the protection of a local industry.
2.1.6 Thailand
Under the de minimis threshold, postal items or express consignments with an FOB value that does not exceed THB1,000 may be imported free of tax and duty.
In addition to the customs duties, Thailand levies three indirect taxes: excise tax, interior tax (10% of amount of excise tax), and value-added tax (VAT). All three are levied on imports at the same rates as on domestic production (WTO 2007b).
The VAT is applied at a rate 7% to nearly all goods and services. The exemptions are books, education, hospitals, unprocessed agricultural products, fertilisers, animal feeds, pesticides, and certain other social goods and services. The WTO has reported that the Thai authorities have delayed their decision to restore the VAT to 10% (WTO 2007b).
To assist the Royal Thai Customs in determining data requirements and the exact procedure to be applied, imported express consignments that are being presented for immediate release are divided into the following categories:
• Non-Dutiable documents – comprising correspondence and documents having no commercial value and which are not subjected to duties and taxes under Part II of the Customs Tariff Decree B.E. 2530. Any items that are prohibited or restricted are not included;
• Non-dutiable consignments – comprising
(a) consignments not subjected to duties and taxes under Part II of the Customs Tariff Decree B.E.2530 (any items that are prohibited or restricted are not included),
(b) low-value consignments, imported via an airport, of which the value does not exceed THB 1,000 and which are exempted from applicable taxes and duties under Part IV, Heading 12 of the Customs Tariff Decree B.E.2530 (any items that are prohibited or restricted are not included), and
(c) trade samples of no commercial value which are exempted from applicable taxes and duties under Part IV, Heading 14 of the Customs Tariff Decree B.E.2530 (any items that are prohibited or restricted are not included),
• Dutiable consignments of which the FOB value does not exceed THB 40,000 (any items that are prohibited or restricted are not included), and
• Consignments other than those listed under the previous three headings.
To a large extent, the above four categories follow the WCO Guidelines for the Immediate Release of Consignments (WCO 2000).
The Royal Thai Customs provides simplified import procedures for inbound express consignments provided that the FOB value of the shipments is less than THB40,000. Shipments above that threshold have to undergo the formal entry process.
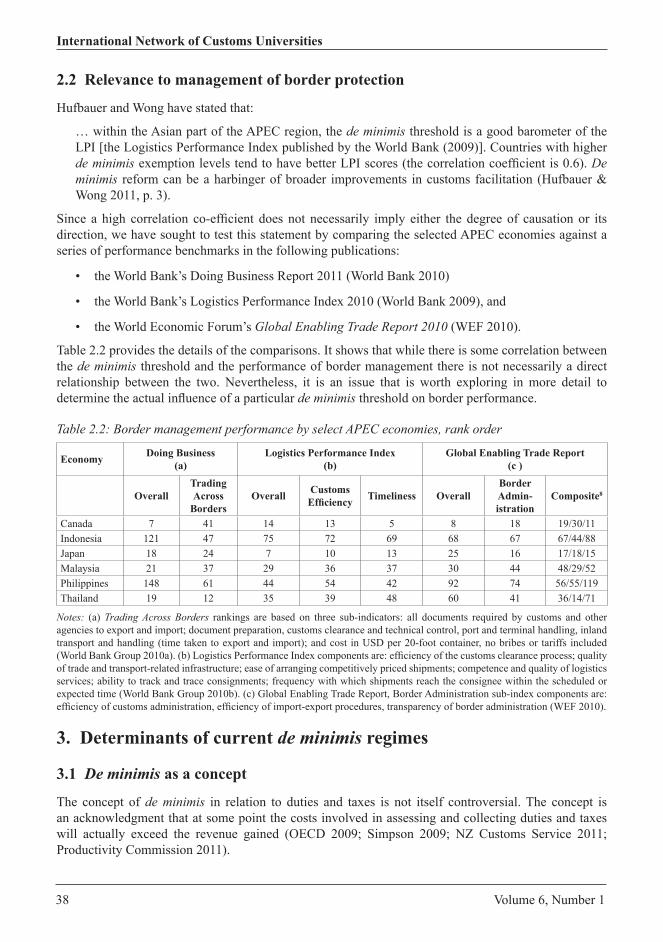
38 Volume 6, Number 1
International Network of Customs Universities
2.2 Relevance to management of border protection
Hufbauer and Wong have stated that:
… within the Asian part of the APEC region, the de minimis threshold is a good barometer of the LPI [the Logistics Performance Index published by the World Bank (2009)]. Countries with higher de minimis exemption levels tend to have better LPI scores (the correlation coefficient is 0.6). De minimis reform can be a harbinger of broader improvements in customs facilitation (Hufbauer & Wong 2011, p. 3).
Since a high correlation co-efficient does not necessarily imply either the degree of causation or its direction, we have sought to test this statement by comparing the selected APEC economies against a series of performance benchmarks in the following publications:
• the World Bank’s Doing Business Report 2011 (World Bank 2010)
• the World Bank’s Logistics Performance Index 2010 (World Bank 2009), and
• the World Economic Forum’s Global Enabling Trade Report 2010 (WEF 2010).
Table 2.2 provides the details of the comparisons. It shows that while there is some correlation between the de minimis threshold and the performance of border management there is not necessarily a direct relationship between the two. Nevertheless, it is an issue that is worth exploring in more detail to determine the actual influence of a particular de minimis threshold on border performance.
Table 2.2: Border management performance by select APEC economies, rank order
Economy Doing Business (a)
Logistics Performance Index (b)
Global Enabling Trade Report (c )
OverallTrading Across
BordersOverall Customs
Efficiency Timeliness OverallBorder Admin-istration
Composite8
Canada 7 41 14 13 5 8 18 19/30/11Indonesia 121 47 75 72 69 68 67 67/44/88Japan 18 24 7 10 13 25 16 17/18/15Malaysia 21 37 29 36 37 30 44 48/29/52Philippines 148 61 44 54 42 92 74 56/55/119Thailand 19 12 35 39 48 60 41 36/14/71
Notes: (a) Trading Across Borders rankings are based on three sub-indicators: all documents required by customs and other agencies to export and import; document preparation, customs clearance and technical control, port and terminal handling, inland transport and handling (time taken to export and import); and cost in USD per 20-foot container, no bribes or tariffs included (World Bank Group 2010a). (b) Logistics Performance Index components are: efficiency of the customs clearance process; quality of trade and transport-related infrastructure; ease of arranging competitively priced shipments; competence and quality of logistics services; ability to track and trace consignments; frequency with which shipments reach the consignee within the scheduled or expected time (World Bank Group 2010b). (c) Global Enabling Trade Report, Border Administration sub-index components are: efficiency of customs administration, efficiency of import-export procedures, transparency of border administration (WEF 2010).
3. Determinants of current de minimis regimes
3.1 De minimis as a concept
The concept of de minimis in relation to duties and taxes is not itself controversial. The concept is an acknowledgment that at some point the costs involved in assessing and collecting duties and taxes will actually exceed the revenue gained (OECD 2009; Simpson 2009; NZ Customs Service 2011; Productivity Commission 2011).

Volume 6, Number 1 39
World Customs Journal
The recently published report on the Economic Structure and Performance of the Australian Retail Industry by the Productivity Commission (2011) draws on the Henry Tax Review to make this point:
On the other hand, the administrative arrangements for taxes recognise that there are circumstances under which it is inefficient to impose administration and compliance costs on the government and the community in an attempt to collect small amounts of revenue. The costs to government, business and consumers entail efficiency losses and are a deadweight loss for the community. Therefore, from the viewpoint of maximising the welfare of all Australians, the question may be whether there are likely to be bigger losses in efficiency from trying to provide equal treatment by collecting taxes on all imports, than from the distortions created by differential tax rates for foreign and domestic retailers (Henry 2009).
As the Henry Tax Review noted:
Related to the issue of complexity are the costs of administering and complying with the tax and transfer system. These costs represent a net loss to the economy, because the resources engaged in these activities could otherwise be put to more highly valued uses. Recent research suggests there is an optimal level of system complexity and operating costs, one that balances administration and compliance costs with improved efficiency and distributional outcomes (Henry 2009, p. 21).
New Zealand Customs describes the issue in this way:
A de minimis represents a trade-off between two aspects of taxation design; that is, integrity, which suggests that the intended rates of taxation are collected without discrimination – all like transactions treated alike for taxation assessment etc. ... and administrative efficiency, which suggests that accounting for, and collection of, every last dollar of taxation revenue due cannot be practically or efficiently achieved as a point will be reached where more is being spent on administrative and collection processes than will be collected in revenue (NZ Customs 2011, p. 8).
This tension between tax revenue and costs of its administration is not just an issue highlighted by national customs and tax administrations. It is an issue that is well established at an international level.
In the Global Enabling Trade Report 2009 published by the World Economic Forum (WEF), Simpson points out that:
There is a significant cost to government and business, in terms of administrative burdens and delays, resulting from subjecting shipments of minimal value to full customs formalities. All WTO Members should adopt the practice of having de minimis exemptions from full formalities for small shipments. It is common in income tax regimes to provide for simplified tax returns for persons having only small incomes. Much of the logic that lies behind this policy is applicable to collection of tax information on goods crossing borders ... Related to but separate from the issue of waiving full customs formalities for small value shipments is the more sensitive issue of waiving collection of small amounts of duties and taxes. Even in a moment such as the present, when public revenues are reduced, governments that do not already have them should establish value limits below which shipments will not be subject to taxation; collecting taxes on such shipments is a procedure that is not cost effective (Simpson 2009, p. 64).
The WCO, the pre-eminent international body on customs matters, has made express provision for de minimis regimes in its Revised Kyoto Convention on the Simplification and Harmonization of Customs Procedures (Revised Kyoto Convention). Among other things, the revised Kyoto Convention states that:
National legislation shall specify a minimum value and/or a minimum amount of duties and taxes below which no duties and taxes will be collected (Transitional Standard 4.13).

40 Volume 6, Number 1
International Network of Customs Universities
Moreover, in relation to Transitional Standard 4.13 of the Revised Kyoto Convention the WCO has subsequently stated that:
... the collection and payment of duties and taxes should not be required for negligible amounts of revenue that incur costly paperwork, both for the Customs administration and the importer/exporter. Customs administrations must establish and specify in national legislation amounts below which duties and taxes need not be collected and paid (WCO Guidelines to the Revised Kyoto Convention).
3.2 De minimis as trade facilitation
In the context of customs clearance the de minimis threshold is used in two ways:
• firstly, as a ‘value’ threshold below which duties and taxes are not collected and no customs declaration is required, and
• secondly, as a ‘reporting’ threshold for goods in respect of which a full customs declaration must be submitted.
In other words many customs administrations adopt two levels of de minimis. Goods whose value falls between the two thresholds are usually the subject of a simplified customs declaration. The significance of these thresholds is the documentation associated with the relevant declaration requirement and the implications this has for clearance times and compliance effort. As acknowledged by New Zealand Customs:
For consignments required to undergo full customs formalities, the importer must submit to a customs administration detailed information on the classification, origin, and valuation of the goods at a consignment level to satisfy valuation elements for the calculation of duty, and statistical data for balance of trade purposes .... (NZ Customs Service 2011, pp. 8-9).
The OECD has also recognised the potential of de minimis procedures as a trade facilitation measure. In examining trade facilitation reform for Sub-Saharan Africa it has noted that:
De minimis procedures could allow consignments valued below a de minimis level (i.e. threshold) to be exempted from formal customs clearance procedures, such as the submission of an import declaration, and be subject only to the submission of a consolidated manifest (such as an airway bill of lading [sic] or a commercial invoice) or simplified documentation. Furthermore, for some of these consignments, the collection of duties and taxes and other regulatory impediments may be waived and immediate release issued, based on information contained in the consolidated manifest detail records ... (OECD 2009, p. 37).
De minimis arrangements are particularly important for small and medium-sized enterprises (SMEs) as they generally face a disproportionate compliance burden with respect to the completion of customs formalities. A 2003 OECD paper reported an EU study of customs procedures as finding that ‘firms with fewer than 250 employees incur trade transaction costs that are 30-45% higher per consignment than those falling on larger firms’ (Walkenhorst & Yasui 2003, p. 12). This was partly because of an inability of such businesses to take advantage of the simplified procedures that the authorities generally made available.
Indeed, additional formalities often end up being more inefficient ‘… since they have created an additional cost burden, added to the time it takes to clear goods and also created further opportunities for solicitation of “facilitation payments”’ (OECD 2009, p. 39).
These costs increase the perception of risk and act as a barrier for SMEs considering entry into new markets. The effect becomes more pronounced in times of economic downturn when SMEs become particularly vulnerable to added cost burdens. As Brooks and Stone have stated:

Volume 6, Number 1 41
World Customs Journal
Flexibility, as well as timeliness, will become more valuable as greater trade implies greater potential vulnerability to external shocks such as financial turmoil…..Factors such as delays in customs clearance, unofficial payments, and poor governance are particularly damaging because they impede flexibility (Brooks & Stone 2010, p. 156).
The quantum of a threshold is in inverse proportion to the compliance burden. There can be little doubt that the lower the de minimis threshold, the higher the administrative burden to traders and, in particular, SMEs (Hummels 2001; Hornok & Koren 2010).
The significance of a lower de minimis threshold in the context of the administrative and compliance burden is its impact on time and administrative costs. In particular, a lower threshold means increased documentation due to the larger volume of consignments requiring a full customs declaration. Increased documentation means increased time for both business and government to prepare and process that documentation and an adverse impact on delivery time (de Souza et al. 2007).
Hornok and Koren point out that document preparation is the most time-consuming of four procedures specified in the Trading across Borders database maintained by the World Bank for its annual Doing Business Report. Document preparation represented about 50% of the total time of delivery for the average country — see Table 3.1 below.
In Hummels’ research on time as a trade barrier he concludes that:
... each day in travel is worth an average of 0.8% of the value of the good per day, equivalent to a 16% tariff for the average length ocean shipment ... Estimates indicate that each additional day in ocean transit reduces the probability that a country will export to the US by 1% (all goods) to 1.5% (manufactured goods) (Hummels 2001, p. 3).
One might expect an even more dramatic effect of time delays on time-sensitive cargo such as that regularly transported by express companies and in fact that is the case. Djankov, Freund and Pham find that ‘... a 10% increase in time reduces exports of time-sensitive manufacturing goods by more than 4%, all else equal’ (Djankov, Freund & Pham 2010, p. 172).
Table 3.1: Time Taken by & Cost of Import Processes (a)
ProcedureDays per TEU (b) Cost (USD) per TEU (b)
Mean As % of total Mean As % of totalDocument preparation 13.7 51.7 306.1 19.0Customs clearance & inspection 3.7 14.0 213.7 13.2Port & terminal handling 4.5 16.8 317.0 19.6Inland transport from seaport to importer’s premises 4.7 17.5 778.0 48.2
ALL 26.6 100 1614.8 100
Notes: (a) The time taken and the fees incurred in importing a shipping container of widely traded non-perishable merchandise (b) twenty-foot equivalent unit, a standardised measure of shipping container volume. Adapted from Hornok and Koren (2010) and World Bank Group (2010a).
In fact traders react to any increase in administrative burden by sending fewer shipments of larger size and use larger-shipment transport modes more often to spread the freight and administrative costs over a larger number of individual items.
In extreme cases it may lead to the cessation of trade with that country altogether (Hornok & Koren 2010; Productivity Commission 2011). The de minimis level therefore has a flow-on effect on choice of transport mode and therefore on the total landed cost of goods. It can mean that what was an economic transaction becomes uneconomic because:
42 Volume 6, Number 1
International Network of Customs Universities
[T]he choice is on the frequency/size of a shipment and the trade-off is timeliness versus smaller per shipment administrative costs. The demand for timeliness requires relatively small and frequent shipments, while the burden of per shipment administrative costs can be mitigated by reducing the frequency, and increasing the size, of shipments (Hornok & Koren 2010, p. 3).
It is generally accepted that entry processes can be an impediment to trade and this adverse potential is behind the inclusion of ‘trade facilitation’ in the current WTO Doha Round of multilateral trade negotiations. Determinations on de minimis can have a negative impact on entry processes as noted previously and therefore have that potential to hinder trade, particularly where low value shipments are an input to business. As the Productivity Commission has recently stated in relation to Australia’s circumstances:
Competition from international retailers can be important in driving efficiency in the Australian retail industry. In addition many businesses currently receive goods which enter Australia under the LVT [low value threshold]. Longer delays or unnecessary charges associated with processing such imports will also hinder those businesses and there will be very limited additional revenue collected ... (Productivity Commission 2011, p. 159).
3.3 Does de minimis increase non-compliance?
An argument that is raised in relation to the setting of a particular threshold is that it encourages non-compliance by traders; that is, traders will engage in ‘under-invoicing’, ‘split shipments’ and other forms of valuation fraud to avoid customs formalities and the payment of duties and taxes.
These concerns have been behind the recent decision of the UK Government in its 2011 budget to reduce the level of the UK threshold from £18 to £15 from November 2011. Previously, the stance of the UK Government was a reluctance to reduce the threshold because of the demands it would place on HM Revenue and Customs but this view has now shifted to favour an industry protection perspective.
The decision to lower the threshold in the UK has been a reaction to government concerns that some UK retailers had been taking advantage of the low value threshold by selling goods over the internet, VAT-free, from subsidiaries based in Jersey and Guernsey. The estimated loss to government revenue from that practice had increased from around £80 million to £130 million over the past five years at the same time as having an adverse effect on UK SMEs who argued that they were unable to compete with large companies operating VAT-free in the Channel Islands and elsewhere.
Research on crime displacement in the context of customs reform in the Philippines raises serious questions about the effectiveness of lowering thresholds on non-compliance — see Box 3.1. In that case the work has concluded that lowering the duty threshold as part of a decision to increase enforcement actually led to a net loss of revenue for the Philippine government (Yang 2008). This phenomenon is worth exploring in more detail, given the propensity for governments to justify low thresholds on the basis of reducing revenue leakage and improving compliance.
In Australia, the Australian Customs and Border Protection Service (ACBPS) undertook an ‘enhanced compliance campaign’ in relation to low value imports over the period from January to March 2011. The campaign was designed to ‘… treat concerns raised by industry about non-compliance with the low value threshold’. Some 33,000 physical examinations were undertaken on international mail articles and 32,000 assessments were undertaken on air and sea cargo declarations to assess compliance with the low value threshold. According to the ACBPS, ‘[T]hese 65,000 interventions resulted in 1,942 instances of undervaluation and bulk orders in breach of the low value import threshold ... revenue underpayments ... totalled $718,000’ (ACBPS 2011, pp. 4-5).

Volume 6, Number 1 43
World Customs Journal
Box 3.1: Case Study – PhilippinesPHILIPPINES – INCREASED INSPECTION OF LOW VALUE SHIPMENTS
In 1990 the Philippine Government progressively lowered the minimum value threshold above which pre-shipment inspection had to occur. The policy rationale for lowering of the threshold was to improve Customs enforcement.
In a review of the Philippine Government’s actions, Yang concluded that ‘the empirical analysis finds that when the Philippine Government increased enforcement by expanding inspections to low-value shipments, imports from treatment countries shifted differentially to an alternative duty-avoidance method: shipping via duty-exempt export processing zones’ (2008, p. 2)
The lowering of the threshold was not economic. As Yang concluded:
‘Conservative estimates of tariff revenue gains and losses (net of PSI fees) suggest that the minimum value threshold reductions were a starkly uneconomic proposition, leading to significant losses in net revenue for the Philippine government...The minimum value threshold reductions led to two types of revenue gains. First, because importers were no longer able to avoid the PSI requirement by valuing shipments between $5000 and $500, import duty collections should have increased on shipments that would not have been inspected before. Second, shipments were not subject to PSI (thus saving inspection fees) if they were shifted to valuation under $500 or to export processing zones. I estimate that total revenue gains from these two sources amounted to roughly $24.6 million...
These revenue gains were considerably overshadowed by two kinds of costs to the Philippine government. First, the cost of additional inspections of shipments valued between $500 and $5000 would have amounted to $28 million. Second, losses in import duties due to shifts to the other methods of duty avoidance would have totalled $33.3 million. These gross revenue losses balanced against gross revenue gains imply that the minimum value threshold reductions led to a net loss of $36.8 million for the Philippine government.’ (2008, p.12)
Source: Yang 2008.
The ACBPS report on this compliance campaign does not provide any detail on the resource and administrative costs that were associated with the campaign so it is not possible to provide a cost-benefit analysis. However, the ratio of non-compliance against interventions is about 3%. This places some question marks over its cost-effectiveness, particularly when combined with the report’s conclusion that estimates of the revenue leakage due to non-compliance with the low-value threshold were 0.66% of total revenue collected in the 2009-2010 financial year (ACBPS 2001, p. 5).
Similarly, an increase in de minimis thresholds does not jeopardise border security since advance cargo reporting is required by most APEC economies, irrespective of the declared value of the goods. As Hufbauer and Wong point out in their research in relation to the United States, de minimis thresholds can actually have the effect of freeing up resources…to deal with more important security and product safety issues’ (Hufbauer & Wong 2011, p. 2).
3.4 What is the appropriate de minimis level?
Determining the appropriate quantum of de minimis threshold is fundamentally an assessment of where the balance lies between revenue gained, on the one hand, and the overall costs to business and government of compliance and customs administration, on the other (NZ Customs 2011; Productivity Commission 2011). This assessment differs from country to country depending on a diverse range of political, trade and socio-economic factors.
Table 3.2 has a comparison between the contrasting conclusions reached by Australia and New Zealand respectively within a similar timeframe that is informative in this respect, given the high degree of commonality that exists between these two economies.

44 Volume 6, Number 1
International Network of Customs Universities
Table 3.2: Contrasting conclusions on de minimis thresholdsAustralia: Productivity Commission 2011 New Zealand: NZ Customs Service 2011
Australia should retain its current low value threshold of $1000. While data are limited, the Commission estimates that with current processes, without the low value threshold, about $578 million of revenue would be collected and over $2 billion of collection costs would be borne by businesses, consumers and government. These costs are a deadweight loss to the community ...
The costs and benefits of implementing a new process should be assessed. The low value threshold should only be lowered to a level which still remains cost-effective.(p. 151)
Source: Productivity Commission 2011.
Customs considers that NZ’s de minimis is at an appropriate level based on its costs of transaction processing ...
A higher de minimis would reduce overall compliance and administration costs and encourage low value importations, but it would also have the effect of undermining the integrity of the taxation system and reduce government revenue. The impacts of setting a de minimis based on a customs value of $650 or $1000 have been examined. The taxation revenue foregone under these options is estimated to be up to $10.4 million and $24 million per annum respectively, which would exceed the combined compliance and administration costs of collecting it, based on current practice and cost structures. An increase in the de minimis therefore does not appear to be justified (p. 2)
Source: NZ Customs 2011.
What is clear is that accurate data is necessary for governments to make an informed decision as to where they should set the de minimis threshold for their economy. As the Productivity Commission has stated:
A number of factors affect the calculation of the amount of revenue foregone and the possible impact of any changes to the threshold. The accuracy of any estimates will be affected by the reliability of data on the:
• Number, value, and distribution of low value consignments entering [Australia] through international mail, air cargo and sea cargo;
• Rate of duty applicable to low value consignments;
• Value of consignments which are GST [VAT] exempt, addressed to businesses registered for GST [VAT], or to non-profit organisations exempt from GST [VAT];
• Level of other costs (such as freight, insurance and customs duty) which may be included in calculations of the value of taxable importation for calculation of GST [VAT]; and
• Extent to which any change in the threshold may affect the behaviour of importers and alter the value of consignments entering [Australia] (Productivity Commission 2011, p. 168).
Again, as a comparison, it is interesting to note that the Common Market for East and Southern Africa (COMESA) and the East African Community have each adopted a threshold of USD500 in support of simplified customs documentation and procedures so as to facilitate trade between their members.9 Box 3.2 has the details.
Box 3.2: Case Study – Common Market for East and Southern AfricaCOMESA – SIMPLIFIED CUSTOMS AND ORIGIN DOCUMENTATION
A simplified trade regime for selected types of commodities is being promoted by COMESA member countries.
Small-scale traders benefit from a simplified customs document and a simplified certificate of origin. Goods that originate from COMESA member states and whose value does not exceed USD 500 per consignment qualify automatically for duty-free entry anywhere in the COMESA market. In the East African Community too, a simplified certificate of origin for cross-border trade of a maximum value of USD500 is in force since the 1st July 2007.
This was agreed by COMESA Trade Ministers at the Business Summit and Exhibition held in Kigali, Rwanda in May 2007. It intended to apply initially to maize, rice, beans and traditional food crops such as cassava, as well as cotton and dairy products.
Source: OECD 2009, p. 39.
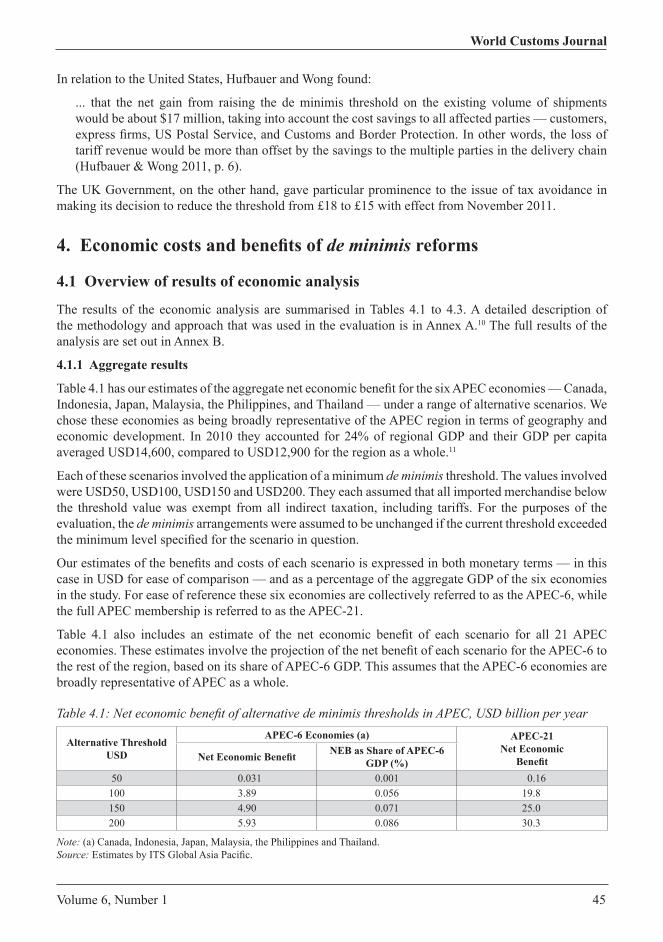
Volume 6, Number 1 45
World Customs Journal
In relation to the United States, Hufbauer and Wong found:
... that the net gain from raising the de minimis threshold on the existing volume of shipments would be about $17 million, taking into account the cost savings to all affected parties — customers, express firms, US Postal Service, and Customs and Border Protection. In other words, the loss of tariff revenue would be more than offset by the savings to the multiple parties in the delivery chain (Hufbauer & Wong 2011, p. 6).
The UK Government, on the other hand, gave particular prominence to the issue of tax avoidance in making its decision to reduce the threshold from £18 to £15 with effect from November 2011.
4. Economic costs and benefits of de minimis reforms
4.1 Overview of results of economic analysis
The results of the economic analysis are summarised in Tables 4.1 to 4.3. A detailed description of the methodology and approach that was used in the evaluation is in Annex A.10 The full results of the analysis are set out in Annex B.
4.1.1 Aggregate results
Table 4.1 has our estimates of the aggregate net economic benefit for the six APEC economies — Canada, Indonesia, Japan, Malaysia, the Philippines, and Thailand — under a range of alternative scenarios. We chose these economies as being broadly representative of the APEC region in terms of geography and economic development. In 2010 they accounted for 24% of regional GDP and their GDP per capita averaged USD14,600, compared to USD12,900 for the region as a whole.11
Each of these scenarios involved the application of a minimum de minimis threshold. The values involved were USD50, USD100, USD150 and USD200. They each assumed that all imported merchandise below the threshold value was exempt from all indirect taxation, including tariffs. For the purposes of the evaluation, the de minimis arrangements were assumed to be unchanged if the current threshold exceeded the minimum level specified for the scenario in question.
Our estimates of the benefits and costs of each scenario is expressed in both monetary terms — in this case in USD for ease of comparison — and as a percentage of the aggregate GDP of the six economies in the study. For ease of reference these six economies are collectively referred to as the APEC-6, while the full APEC membership is referred to as the APEC-21.
Table 4.1 also includes an estimate of the net economic benefit of each scenario for all 21 APEC economies. These estimates involve the projection of the net benefit of each scenario for the APEC-6 to the rest of the region, based on its share of APEC-6 GDP. This assumes that the APEC-6 economies are broadly representative of APEC as a whole.
Table 4.1: Net economic benefit of alternative de minimis thresholds in APEC, USD billion per year
Alternative Threshold USD
APEC-6 Economies (a) APEC-21 Net Economic
Benefit Net Economic Benefit NEB as Share of APEC-6 GDP (%)
50 0.031 0.001 0.16100 3.89 0.056 19.8150 4.90 0.071 25.0200 5.93 0.086 30.3
Note: (a) Canada, Indonesia, Japan, Malaysia, the Philippines and Thailand.Source: Estimates by ITS Global Asia Pacific.

46 Volume 6, Number 1
International Network of Customs Universities
Table 4.2: Net economic benefit of alternative de minimis thresholds, by APEC economy (a), USD million per year
Alternative Threshold
USDCA ID JP MY PH TH
50 30.6 0 0 0 0.28 0.35100 3,771 38.8 0 0 16.9 61.8150 4,662 44.4 104 0 18.7 70.3200 5,453 48.7 304 22.5 20.7 78.5
Notes: (a) Canada (CA), Indonesia (ID), Japan (JP), Malaysia (MY), the Philippines (PH) and Thailand (TH).Source: CAPEC and Trade Data International Pty Ltd, estimates by ITS Global Asia Pacific.
Table 4.3: Composition of net economic benefit of alternative de minimis thresholds, select APEC economies (a), USD million per year
Component of Net Economic BenefitAlternative Threshold
USD 50 USD 100 USD 150 USD 200Saving in merchandise transit time 0.07 16 26 33Saving in government administration 23.92 2,981 3,765 4,548Saving in business compliance 7.38 920 1,157 1,399Less Tax revenue foregone 0.12 29 40 52Net economic benefit 31.26 3,917 4,900 5,928Benefit-cost ratio (b) 270 137 125 115
Notes: (a) Canada, Indonesia, Japan, Malaysia, the Philippines and Thailand (b) The ratio of the total resource savings to the tax revenue foregone. Source: Estimates by ITS Global Asia Pacific.
Table 4.2 breaks down the aggregate net benefit estimate for APEC-6 by individual economy, while Table 4.3 breaks it down by its functional components — the resource savings that would be generated in merchandise transit time, government administration, and business compliance, and the costs in terms of the tax revenue foregone from extending the taxation exemptions.
In summary, we estimate that a minimum de minimis threshold of USD200 would generate an aggregate net benefit for the APEC-6 economies of around USD5.9 billion a year. This is equivalent to about USD30.3 billion for all 21 APEC members or some 0.086% of APEC-21 GDP.
4.1.2 Results for individual economies
All six economies would realise a net benefit from raising their de minimis threshold, no matter how small the increase. Where a scenario would not change an economy’s threshold, of course, there was neither any benefit nor any cost. This was the case for Malaysia under the USD150, USD100 and USD50 scenarios, for Japan under the USD100 and USD50 scenarios, and for Indonesia under the USD50 scenario.12
The size of the net benefit varied substantially across the six economies. Most of the variation reflected a combination of the extent of an economy’s current de minimis threshold and the stage reached in its economic development. The higher an economy’s GDP per capita, the more intensively it tends to use low value imports for business (intermediate inputs) and household use (final consumption). The most obvious manifestation of this characteristic is the increasing tendency to use air freight for the delivery of low value consignments, even though it is significantly more expensive than mail or sea freight. For these reasons, expressing the net economic benefit as a share of GDP can provide a better indication of the results from a comparative perspective.
Volume 6, Number 1 47
World Customs Journal
We expect Canada to experience the highest net benefit under all scenarios, in both absolute and relative terms. For a threshold of USD200, its net benefit amounted to USD5.45 billion a year or 0.35% of its GDP. These outcomes are largely a consequence of the fact that Canada makes, by far, the most intensive use of low value imports13 and has one of the lowest de minimis threshold levels in the region.
We estimated the net benefit for Japan at about USD303 million (USD200 scenario) and USD104 million a year (USD150 scenario). Although it is the second largest economy in APEC, Japan does not rely on low value imports as intensively as any of the other APEC-6 economies. Moreover, Japan has the second highest de minims threshold of the APEC-6, so a much higher proportion of its low value imports already benefit from de minimis entry. As a consequence the net economic benefit of the USD200 scenario was the equivalent of 0.006% of Japanese GDP, the lowest result within the APEC-6, and only slightly ahead of Indonesia’s (0.007%).
While Malaysia has the second most intensive use of low value imports, it has the highest de minimis threshold in the group. Accordingly the net benefit from the USD200 scenario (USD22.6 million a year) is equivalent to 0.017% of GDP but none of the other scenarios would generate any benefit as the existing threshold already exceeds the assumed minima.
The situation for Thailand is the reverse of that for Malaysia. Thailand is a less intensive user of low value imports but currently has a much lower de minimis threshold. Under the USD200 scenario we estimated a net benefit (USD78.5 million a year) that was equivalent of 0.025% of GDP, the second highest among the APEC-6. Thailand’s results under the other scenarios generally maintain this ranking. The exception is the USD50 scenario, which approximates the current threshold.
The Philippines ranks in the middle of the APEC-6 in terms of its intensity of use of low value imports but it has the lowest de minimis threshold in the group. We estimated that the USD200 scenario would generate a net economic benefit of USD20.7 million a year. This was equivalent to 0.011% of GDP, which puts it in a mid-ranking position in the group by that measure. This is unchanged under the other scenarios.
Indonesia ranks second lowest, after Japan, in terms of intensity of use of low value imports and fourth lowest in terms of de minimis threshold. Indonesia’s much larger GDP compared to the other ASEAN members in the group means that its net benefit from the USD200 scenario ranked much higher in monetary terms (USD48.7 million a year) than it did as a share of GDP (0.007%). Its results under the other scenarios generally mirror these outcomes.
4.1.3 Composition of net economic benefit
Savings in the costs of government administration dominate the results for APEC-6 under the all scenarios. Extension of the more streamlined customs and other border clearance procedures, which are generally associated with a de minimis clearance channel, are estimated to account for 76% of the savings that were estimated for the USD200 scenario.
The other critical source of benefits is the savings in the compliance costs incurred by business from extension of more streamlined border clearance procedures. These are estimated to account for 23% of the resource savings generated by the USD200 scenario. The pattern is broadly the same, however, for each of the other scenarios.
A notable characteristic of the results of the economic evaluation is the negligible impact that higher de minimis thresholds have on tax revenue. The revenue loss is equivalent to less than 1.0% of the savings under all of the scenarios. As would be expected this share declined with the level of the minimum de minimis threshold.
In fact the revenue foregone only approximates the smallest of the resource savings under all scenarios — namely, the savings in merchandise transit time. The more streamlined customs procedures allow

48 Volume 6, Number 1
International Network of Customs Universities
delivery times to be cut by up to 60% for eligible consignments; their relatively low aggregate value, however, means that their overall impact is much smaller than the volume-based impacts on government administration and business compliance costs.
Each of the main components of the scenario estimates of net economic benefit is described in more detail below. This discussion includes an explanation of the determinants of the results that were obtained, as well as the sensitivity of those results to the key assumptions that were used in the development of the spreadsheet model used in estimation process.
Before doing so, we will outline the projections of the volumes and values of low value imports by the APEC-6 on which the economic analysis was based and on which the results of all of the analytical scenarios critically depend.
4.2 Nature and extent of low value imports
The most critical input in the economic evaluation are estimates of the value and volume of those import transactions affected by an expansion of the de minimis arrangements in each of the selected economies. As we saw in Table 4.2, by far the more important of these two variables is the volume of import transactions under each of the de minimis scenarios. Indeed the lower the de minimis threshold, the more pronounced is the domination of transaction volumes on the final result.
Unfortunately the information that is publicly available on low value import transactions, is sparse and of uncertain quality. In principle the border agencies collect extensive information on air and sea cargoes, such as the classification of the merchandise under the Harmonized System, their country of origin, and their declared value for customs purposes. In practice, this information can be very costly for customs agencies to collect, check and validate, particularly in developing economies, while the usefulness of the information can vary to a considerable degree.
In the light of this, we have adopted an approach to the estimation of the value and volume of low-value import transactions by each of the APEC-6 economies that is both straightforward and cautious. This was done in the knowledge that the estimates of net economic benefit, which were derived from them, would be highly conservative. We are confident that a more accurate approach to the estimation of low-value import transactions would only increase the absolute size of the net benefit that we have calculated for each of the threshold scenarios.
Our approach draws on the results of recent research on Australia (CIE 2011). This research was undertaken on behalf of CAPEC for an official inquiry that is, among other things, looking into the de minimis arrangements in Australia and their impact on the retail industry in that country.14
The Centre for International Economics (CIE) estimated how the volume and landed value of imports by the different modes varied along the spectrum of consignment values, from the bottom of that range upwards. Its results indicated that mail and sea cargo accounted for 84% of the total value of all imports by Australia with a landed value of less than AUD200, and 87% of those imports with a value under AUD100. In the case of the import volumes, international mail and sea cargo were responsible for 89%of the total number of consignments under the AUD200 scenario and 88% of the total under the AUD100 scenario.
Despite an extensive literature review, we were unable to find any other estimates of the distribution of low-value imports by unit value and by volume, let alone those that were more comprehensive in terms of their coverage of the values and volumes that were involved for this category of imports.
In the light of this, we had no choice but to project the results from our survey of air express transactions to arrive at estimates for all low-value import transactions by all modes in each of the APEC-6 economies.

Volume 6, Number 1 49
World Customs Journal
Our projections were based on the modal shares estimated by the CIE for low value imports by Australia by air, sea and international mail (CIE 2011). In the absence of other relevant information, we have also assumed — most conservatively, we believe — that CAPEC members handled all the air cargo in each of these economies.
The spreadsheet model that we have developed to estimate the net economic benefit under different threshold scenarios, however, allows each of these assumptions to be varied on a case-by-case basis. For each economy, the model calculates the annual equivalent of the value of CAPEC imports under each threshold from our survey of a week’s transactions. Based on this value the model projects the total value of all air cargo imports and the total value of all imports by all modes under the scenario — using the CIE estimate of the market share for each mode that was referred to above.15 The difference between the two is the total value of the mail and sea cargo for the scenario. The formula has been repeated to project the total number of consignments by each mode under the scenario for the economy in question.
Our projections for the imports by each of the APEC-6 economies under each threshold scenario are set out in Table 4.3 (import values) and Table 4.4 (import volumes). The economies in question are indicated by their two-character ISO codes.16 The projections for each of the other scenarios are set out in Annex A.
Table 4.3: Projected value of de minimis imports by air, sea & mail under alternative thresholds, by APEC economy (a), USD million per year
Alternative Threshold
USDCA ID JP MY PH TH
50 15.33 1.05 6.39 1.80 0.76 1.08100 2,165 105 661 199 83 121150 3,030 128 822 305 102 156200 3,720 140 915 353 115 182
Notes: (a) Canada (CA), Indonesia (ID), Japan (JP), Malaysia (MY), the Philippines (PH) and Thailand (TH).Source: CAPEC, CIE 2011, and estimates by ITS Global Asia Pacific.
Table 4.4: Projected volume of de minimis imports by air, sea & mail under alternative thresholds, by APEC economy (a), thousand consignments per year
Alternative Threshold
USDCA ID JP MY PH TH
50 846 84 483 96 56 82100 61,950 5,03 29,332 6,323 3,469 5,078150 76,394 5,630 33,228 7,924 3,930 5,827200 89,206 6,156 36,637 9,061 4,351 6,510
Notes: (a) Canada (CA), Indonesia (ID), Japan (JP), Malaysia (MY), the Philippines (PH) and Thailand (TH).Source: CAPEC and Trade Data International Pty Ltd, estimates by ITS Global Asia Pacific.
The projections in Tables 4.3 and 4.4 have a number of notable features.
The projected volume of consignments of USD200 or less by all modes for Indonesia is consistent with the Indonesian customs data on this category provided by Trade Data International — Annex D has the details. After adjusting for timing differences, the projections in Tables 4.3 and 4.4 are only 10% less than the volumes recorded in the customs data This suggest that the projection methodology and assumptions are broadly reliable, if somewhat conservative.

50 Volume 6, Number 1
International Network of Customs Universities
On the other hand the projected annual value of imports in this category by Indonesia is less than half the aggregate value suggested by the Indonesian customs data using the same threshold — consignments of USD200 or less. The frequency distribution of consignments in the Indonesian customs data is significantly less skewed towards lower consignment values than is the case for the results of either our survey of air express imports by Indonesia or research into low value imports by other APEC economies (CIE 2011; Hufbauer & Wong 2011). This is puzzling and does not admit any easy conclusions.
The intensity of use of low value imports — measured as a share of GDP — varies very considerably across the APEC-6 economies. It is lowest in Japan and highest in Canada; a result that holds for both the volume and the value measures of intensity. Given the projection methodology that we used, both sets of results are, of course, a direct reflection of the results that we obtained from our survey of transactions by CAPEC members in these two economies.
The differences in intensity of use may be a reflection of the basic economic geography of the APEC-6 economies and their regulatory treatment of international freight services.
For example, Canada shares the longest land border in the world with the United States — most Canadian economic activity is physically located closer to the United States than to the rest of Canada. The two also share a common language, a common system of commercial laws, and a common business culture. Not surprisingly these two economies have the most intensive bilateral trading relationship in the world, which one would expect to see reflected, among other things, in the intensity with which low value imports were used in Canada.
In sharp contrast Japan is bound by sea and does not have nearly as much in common with its major trading partners, in terms of institutions that facilitate trade. Again one would expect to see this manifest itself in the intensity with which Japan used low value imports.
4.3 Savings in government administration
An inherent part of any de minimis regime is a customs clearance process that is substantially more streamlined than the one generally used. The general clearance process tends to be relatively costly in terms of government administration. It involves a case-by-case assessment of each transaction based on the collection of extensive documentation, the possibility of physical inspection of the merchandise in question, and the involvement of multiple government agencies responsible for border protection.
As low value imports are characterised by high transaction volumes compared to the aggregate value of what is being imported, savings in the cost of government administration loom large in any question of extending the de minimis threshold or the merchandise that it covers. So much so that the savings in government administration accounted for 72% of the benefits estimated for all of the threshold scenarios.
For the present study we undertook a literature review to identify any published estimates or public sources of the resource costs of customs clearance as well as the cost differences between general and de minimis clearances. The review concentrated on finding the capital and operating costs of clearance costs for each of the entry channels in economies that had customs arrangements and levels of economic development that were similar to those of the APEC-6 but did not find anything particularly useful for the purposes of this evaluation.
We have therefore inferred the unit costs of customs clearance from an examination of the user charges and fees that are levied by customs and border protection agencies.
The Australian Productivity Commission (PC) used this approach to examine the impact of a change in the Australian de minimis threshold on the costs of customs administration in that jurisdiction. The PC used the charges and fees levied by the ACBPS as a proxy for the costs of customs administration in Australia (Productivity Commission 2011). It was also the approach that the CIE had proposed to the Commission for this inquiry (CIE 2011).

Volume 6, Number 1 51
World Customs Journal
Customs clearance charges are unlikely to yield an overestimate of the costs of customs clearance. The General Agreement on Tariffs and Trade (GATT) expressly requires that fees and charges levied for any services rendered in respect of imports — or exports for that matter — are limited to the approximate cost of the services in question and may not represent an indirect protection to domestic goods or taxation of trade for fiscal purposes.17
Due to the difficulties of accurately measuring all of the costs associated with customs clearance, most WTO members do not try to recover all of their import processing costs in clearance fees and charges. For this reason we were conscious that, other things being equal, the highest of the observed levels of fees and charges were likely to be the best proxy for the costs of customs clearance.
Of those that we have examined, the charges levied by the ACBPS were the most promising for the purposes of the economic evaluation. By law the Service is required to set its charges so as to fully recover the costs it incurs in processing imports by each mode, without regard to the value of the goods.18 Given this requirement and the GATT obligation not to over-recover import processing costs, we consider that its charges are the best indicators of the resource cost of conducting a full customs clearance for a low value import consignment by each of the modes in question.
The ACBPS charges AUD40.20 per declaration for the electronic clearance of mail and air cargo and AUD50.00 per declaration for the electronic clearance of sea cargo. Its charges for manual clearance are somewhat higher — AUD48.85 per declaration for international mail and air cargo and AUD65.75 per declaration for sea cargo.
For the purposes of the economic evaluation, we have converted the electronic clearance charges to their USD equivalents at market exchange rates.19
To reflect the different economic situation and circumstances faced by each of the economies under evaluation compared to that in Australia, we have multiplied these USD equivalents by the ratio of GDP per worker in the economy in question to the GDP per worker in Australia in each case. In calculating this ratio, the GDP values, of course, have to be expressed in USD.20 This approach assumes that, if the GDP per worker in USD in one of the APEC-6 economies is half that of Australia, so too will be the relative cost of an equivalent customs clearance in that economy.
The USD values estimated for each of the APEC-6 economies on this basis are set out in Table 4.5. These were used to evaluate the savings in public administration costs under all the threshold scenarios on the basis that the resource cost for a de minimis clearance is negligible. For each of the scenarios, the unit costs in Table 4.5 were multiplied by the change in the number of de minimis clearances that were estimated for the relevant mode and scenario.
In the absence of concrete evidence to the contrary, we also assume that any compliance assurance program would not necessarily have to involve substantially greater costs to cover any enhanced de minimis regime in an effective manner.
Table 4.5: Cost of low value import transactions to customs administration, select APEC economies (a), USD per consignment
Mode of delivery CA ID JP MY PH THAir & mail cargo 38.74 5.06 36.61 14.14 3.37 8.38Sea cargo 48.19 6.29 45.53 17.58 4.19 10.42
Notes: (a) Canada (CA), Indonesia (ID), Japan (JP), Malaysia (MY), the Philippines (PH) and Thailand (TH).Source: CAPEC and Trade Data International Pty Ltd, estimates by ITS Global Asia Pacific.

52 Volume 6, Number 1
International Network of Customs Universities
4.4 Savings in business compliance costs
The more streamlined customs procedures that are applied under a de minimis regime can be expected to reduce the significant compliance costs that a general customs clearance regime imposes on importers either directly or indirectly thorough their agents. Our estimates indicate that savings in business compliance costs under the USD200 threshold scenario would account for over a quarter of the gross savings from such a change.
Competition will ensure that the agents will eventually pass on any such costs savings to their clients in the form of lower fees or higher quality of service, and the importers, in turn, will pass the savings onto their customers in the form of lower product prices.
Our literature review only identified a few published estimates of the potential for savings in business compliance costs from switching low value transactions from a general customs clearance channel to a de minimis one.
Hufbauer and Wong (2011) estimated that increasing the de minimis threshold in the United States from USD200 to USD800 would generate savings in business compliance costs of up to USD33 million a year in respect of inwards international mail and air express cargoes.
This estimate was based on an assumed saving in employee time of 0.15 hours in completing the customs documentation for a low value transaction and a labour cost of USD21 per hour to cover wages and labour on-costs, such as the employer’s health insurance and pension contributions. In addition Hufbauer and Wong (2011) estimate that the statutory storage requirements in respect of completed customs documentation cost air express firms in the United States about USD1 million a year. Their calculations imply that business compliance costs in the United States for full customs clearance of low value imports amount to USD6.60 per consignment.
The CIE (2011) found that switching from the general to the de minimis clearance channel in Australia would generate significant savings in business compliance costs. Customs brokers and air express carriers reported that a formal declaration took about 10 to 15 minutes of a broker’s time and their typical rate for the service was charged out at AUD60 to AUD80 per hour — around USD66 to USD88 per hour at current rates. The CIE quoted the fees charged by online customs brokers in respect of low value consignments as ranging upwards from AUD50 per consignment — equivalent to USD55 per consignment.
Using what it considered was a conservative approach, CIE estimated the saving in business compliance costs from switching from full formal to de minimis compliance in Australia was AUD30 per consignment. This was substantially more than what has been estimated by Hufbauer and Wong (2011) for the United States. Even allowing for the greater economies of scale that would be available to express firms in the United States, there appears to be significant disagreement between the CIE estimate and that of Hufbauer and Wong.
For our purposes we have preferred to take the most conservative approach to each of the components that made up the relevant business compliance costs — the time taken by an importer or their agent to fulfil the customs requirements and the opportunity cost of that time.
We consider that 15 minutes seems to be a reasonable allowance for the minimum amount of time that it takes a knowledgeable person to arrange a low value customs clearance for a private business, while AUD60 per hour is a minimum estimate of the opportunity cost of that time based on the fee rates charged by customs brokers. This gives a minimum business compliance cost of AUD15 per transaction, and we stress that it is a minimum estimate.
To apply this estimate to any of the APEC-6 economies, it needs to be adjusted to take account of the relative differences in GDP per capita, as was the case in estimating the savings in public administration

Volume 6, Number 1 53
World Customs Journal
to reflect the different economic situation and circumstances faced by each of the economies under evaluation compared to Australia or the United States.
The USD unit values that were estimated for each of the APEC-6 economies are in Table 4.6. These values were used to evaluate the savings in public administration costs under all the threshold scenarios on the assumption that the compliance cost for a de minimis clearance was negligible. For each of the threshold scenarios, the unit costs in Table 4.6 were multiplied by the change in the number of de minimis clearances for the relevant mode under that scenario.
Table 4.6: Cost of business compliance for low value imports, select APEC economies (a), USD per consignmentMode of delivery CA ID JP MY PH THAir & mail cargo 14.46 1.89 13.66 5.27 1.26 3.13
Sea cargo 14.46 1.89 13.66 5.27 1.26 3.13
Notes: (a) Canada (CA), Indonesia (ID), Japan (JP), Malaysia (MY), the Philippines (PH) and Thailand (TH).Source: CAPEC and Trade Data International Pty Ltd, estimates by ITS Global Asia Pacific.
4.5 Savings in merchandise transit time
In trade, as in all economic activity, time has an economic cost. The longer a product takes to get from the producer to the final consumer, the more likely the product is to perish, to be out of date, to be displaced by a superior alternative, or to simply lose the interest of consumers. There is also an opportunity cost in having working capital tied up in inventory. Hence saving the time merchandise has to spend in transit has an economic benefit; the extent of which depends on the nature of the product.
This study used the approach previously adopted by the APEC Secretariat for both the interim and final assessments of the Second APEC Trade Facilitation Action Plan (PSU 2010; 2011). APEC has used the economy-wide valuations of time that have been developed Professor David Hummels of Purdue University (Hummels 2001a; 2001b; 2007).
This study used the Hummels’ estimates of the ad valorem tax equivalent of a day’s transit time for products classified on the basis of the UN Standard International Trade Classification (SITC) (Hummels 2001b). We converted these SITC tax equivalents to a HS basis by aligning the two classification systems and estimated a weighted average of the value of a transit day for low value imports at the four-digit level of the HS. For this purpose, we used the HS product composition that we had previously estimated from our analysis of Indonesian import transactions of USD200 or less — Annex D has the details.
Our calculation put the value of a transit day at 1.08% of the value of the consignment. As we had no other comprehensive information of how the product composition of low value consignments might vary across the APEC region, we have used this value for each of the six economies, as well as all the scenarios, in the study.
This value is significantly higher than the estimate of 0.4% calculated by Hufbauer and Wong (2011) for the United States, which was also based on the Hummels’ work referred to above. Their estimate was, however, based on a much wider range of consignment values and a much narrower range of HS classes than were evident from our analysis of Indonesian imports in Annex D.
The latter may also reflect the fact that the Hufbauer and Wong study was focused on imports by the United States with a consignment value between USD200 and USD800.21 This value range is likely to be characterised by considerably greater product specialisation but is well outside the focus of our study.
Given the lack of data on the composition of low value imports by the rest of the APEC-6 economies, we have used an ad valorem tax equivalent of 1.08% to value a transit day to each of them for all low value imports.

54 Volume 6, Number 1
International Network of Customs Universities
For each mode and scenario combination the time saving was the product of:
• the daily ad valorem tax equivalent
• the increase in the aggregate value of de minimis imports by that mode as a consequence of the assumed threshold level, and
• the average time saving for the mode in question as a consequence of the assumed threshold level.
The estimates of the increase in value of de minimis imports were based on the import volume projections previously outlined in Tables 4.3 and 4.4. The savings in air cargo transit time for each economy were taken from the results of our survey of CAPEC members. The results that we obtained are set out in Table 4.7.
In the case of sea cargo, the size of the assumed saving in transit time was based on the results of the most recent Time Release Survey by the Japanese Customs and Tariff Bureau. The Bureau conducts regular surveys of the time between submission of an import declaration and the release of the cargo in question.
The Bureau used its 2009 Time Release Survey to compare customs processing times for sea cargo that had entered Japan under its Approved Economic Operator (AEO) program with the equivalent times for sea cargo that entered through the general customs clearance channel.22 The Bureau found that the clearance times for the AEO cargoes were, on average, 60% faster than those for general cargoes (Igarashi 2010).
Table 4.7: Saving in merchandise transit time with de minimis customs clearance, select APEC economies (a), days per consignment
Mode of delivery CA ID JP MY PH THAir & mail cargo 0.5 1.6 0.5 0.5 1.6 1.3Sea cargo 0.6 2.4 1.2 0.6 1.2 1.2
Notes: (a) Canada (CA), Indonesia (ID), Japan (JP), Malaysia (MY), the Philippines (PH) and Thailand (TH).Source: CAPEC and Trade Data International Pty Ltd, estimates by ITS Global Asia Pacific.
To put these results into an appropriate context, the World Bank’s annual series of Trading across Borders surveys have consistently put Japan well below the APEC average in terms of the time taken by importers in negotiating what the survey terms as ‘Customs clearance and technical control’ (World Bank Group 2010). From this we conclude that the transit saving achieved through the Japanese AEO program should, as a minimum, approximate what could be achieved through the de minimis clearance of sea cargo.
Accordingly we have used a saving of 60% to estimate the transit time saving for sea cargo by all of the APEC-6 economies. It has been applied to the total time taken in 2010 by sea cargoes to complete customs clearance and technical control in each of the APEC-6 economies, as estimated by the World Bank from its annual Trading across Border survey (World Bank Group 2010).
This is a conservative assumption. Greater savings should be possible. Nevertheless, the relatively low value-to-volume ratio that applies to low value imports means that the value of the time savings are small relative to the savings based on transaction volume — such as public administration and private compliance costs.
4.6 Taxation revenue foregone
The tariff revenue foregone from a higher de minimis threshold will vary with the HS classification of the imported merchandise covered by the threshold, the origin of the imports, and the tariff schedule of the importing economy.

Volume 6, Number 1 55
World Customs Journal
For the HS composition of the merchandise, we drew on the results of our analysis in Annex B, which examined the composition of imports by Indonesia with a landed value of USD200 or less. This reflected the clear absence of any real alternatives in this regard. In our view the substantial differences that we have identified previously between air cargo imports and those by all modes argued against the use of the former as the basis for the estimates of the foregone revenue.
We have estimated a weighted average MFN tariff rate for low value products for each of the APEC-6 economies — Table 4.8 has the results. Each weighted average was based on the Tariff Schedule published by the economy in question.
Table 4.8: Weighted average tariff rates on import consignments of USD200 or less, select APEC economies (a), per cent
Tariff Measure CA ID JP MY PH TH
MFN tariff rate 4.70 7.70 1.66 14.68 6.79 10.41Applied tariff rate (b) 0.77 2.45 1.55 7.14 3.59 5.33
Revenue yield (c) 0.77 2.43 0.28 0.97 3.59 5.31
Notes: (a) Canada (CA), Indonesia (ID), Japan (JP), Malaysia (MY), the Philippines (PH) and Thailand (TH) (b) MTN rate less adjustment for preferential tariff rates under existing FTAs (c) Applied rate less deduction for de minimis exemptions. Source: WTO; estimates by ITS Global Asia Pacific.
Our estimate involved weighting the MFN tariff rates in the tariff schedule for each economy in the study by the product shares at the four-digit HS level we previously calculated for imports of USD200 or less per consignment — Annex B has the details of the estimation of the product shares.
Multiplying the average MFN rate by our projection of the increase in value of de minimis imports up to the proposed de minimis threshold level gave an approximation of the potential revenue loss for the threshold scenario in question. It needs to be adjusted, however, for the impacts of preferential tariff rates and the current de minimis revenue exemptions.
Since it established the ASEAN Free Trade Area (AFTA) in the early 1990s, ASEAN has concluded five FTAs with major trading partners, including China (2002), the Republic of Korea (2005), Japan (2008), India (2009) and Australia and New Zealand (2009). ASEAN has also concluded the ASEAN Trade in Goods Agreement (ATIGA) to complete the process of tariff liberalisation within ASEAN by 2010 for the original six member states and by 2018 for the newer ones.
The depth, scope and pace of tariff liberalisation under each agreement varies by ASEAN economy, product and trading partner. In some agreements, such as the ASEAN–India FTA, certain sectors or products are excluded from the liberalisation provisions in the Agreement. In others, such as the AANZFTA, scope of the tariff liberalisation is far more comprehensive.
The time available for the study did not allow for a highly time consuming, product-by-product assessment of each of the four ASEAN economies, let alone of Canada and Japan as well. We have therefore assumed that all low value imports by the five from any of their FTA partners are duty free. We have applied a similar assumption to Canada in respect of its North American Free Trade Agreement (NAFTA) partners and Japan in respect of its FTA partners.
Adjusting for the duty free rates we have assumed are in the process of being applied to imports from FTA partners, gives an estimate of the effective applied tariff rate for each of the APEC-6 economies in the study. They are presented in Table 4.8.
We have also assumed that the tariff revenue lost due to the existing de mininis threshold is the existing threshold level as a percentage of the threshold level specified in the scenario under analysis. This

56 Volume 6, Number 1
International Network of Customs Universities
percentage is multiplied by the applied tariff rate and gives the revenue yield for each economy under the scenario in question. These estimates are also set out in Table 4.9. They may be thought of as the indicators of the long-run impact on revenue after the tariff preferences that have been included in recent FTAs are fully implemented.
In most of the economies in the study the scope for revenue loss is much lower than many may expect. This is due to a combination of relatively low MFN rates in all but two of the economies and extensive departures from MFN rates for much of the trade of all six due to the proliferation of FTAs.
The spreadsheet model developed for the study does not estimate the impact of changes to de minimis thresholds on other indirect tax revenue. This reflects the technical challenges of modelling complex tax regimes with different rates for different products at different stages of production. It is, nevertheless, possible to use the model to test the sensitivity of its results to a range of broad assumptions about the nature of the indirect tax regimes in the APEC-6.
Except for Malaysia, all APEC-6 economies currently impose a VAT style of tax at each stage in the production of most goods and services but Malaysia is planning to replace its sales and services taxes with such a tax. These taxes are currently levied at rates of 5% (Canada and Japan), 7% (Thailand), and 10% (Indonesia and the Philippines). The rate in Malaysia is expected to be no more than 10%.
Applying these headline VAT rates to the projected change in the value of imports, which enter via the de minimis channel, gives an indication of the maximum amount of VAT revenue that could be foregone by lifting the threshold under each scenario. The impact that such a revenue loss would have on the earlier estimates of net economic benefit for the APEC-6 economies, as well as the implications for all APEC members, are summarised in Tables 4.10 and 4.11.
Table 4.10: Net economic benefit of alternative de minimis thresholds in APEC, VAT sensitivity test, USD billion per year
Alternative Threshold USD
APEC-6 Economies (a) APEC-21 Net Economic
Benefit Maximum VAT Revenue
Foregone Net Economic Benefit
50 0.001 0.031 0.16100 0.135 3.754 19.2150 0.189 4.712 24.0200 0.237 5.691 29.0
Notes: (a) Canada, Indonesia, Japan, Malaysia, the Philippines and Thailand.Source: Estimates by ITS Global Asia Pacific.
Table 4.11: Net economic benefit of alternative de minimis thresholds, by APEC economy (a), VAT sensitivity test, USD million per year
Alternative Threshold
USDCA ID JP MY PH TH
50 30.2 0 0 0 0.2 0.3100 3,663 28.48 0 0 8.6 53.4150 4,511 31.7 101 0 8.5 59.5200 5,268 34.9 296 17.7 9.2 65.8
Notes: (a) Canada (CA), Indonesia (ID), Japan (JP), Malaysia (MY), the Philippines (PH) and Thailand (TH).Source: CAPEC and Trade Data International Pty Ltd, estimates by ITS Global Asia Pacific.
The message of the sensitivity test is clear-cut. The loss of VAT revenue does not qualitatively change any of the results that were discussed above.
Volume 6, Number 1 57
World Customs Journal
Our estimates of VAT revenue foregone are certainly excessive. They assume that the headline tax rate applies to all low value imports. In fact each of the APEC-6 economies exempts certain types of merchandise from their VAT liability but no allowance has been made for these exemptions.
Most importantly no allowance has been made for the fact that a high proportion of low value imports are business inputs.
VAT regimes, including those of the APEC-6, tax the value that is added at each stage of production by allowing businesses to claim a tax credit for any VAT that has been paid on their business inputs. If VAT has not been paid on them, for whatever reason, the VAT liability for the product they were used to make is increased by the amount of the unpaid tax. In other words any VAT that is not collected at an earlier stage of production should be collected by the time the final product is sold to the consumer.
This means that the only VAT revenue that is foregone by raising a de minimis threshold relates to the merchandise, which is imported by or on behalf of households. All the available evidence suggests that this is a clear minority of the aggregate value imported as low value consignments.
5. Conclusions and recommendationsA de minimis regime provides more streamlined border clearance procedures than apply to other imports. These reduce the costs borne by importers and accelerate delivery of merchandise, which both benefit the final consumer. Such a regime allows governments to refocus their revenue collection on the higher yielding parts of the tax base.
Most APEC economies have de minimis arrangements but they vary considerably from economy to economy. Thresholds range from under USD1 to more than USD1,000 and the products that are eligible for exemption vary. These differences can significantly affect the balance of the economic benefits and costs that a regime generates.
This report highlights the principal characteristics of the de minimis arrangements that currently apply in Canada, Indonesia, Japan, Malaysia, the Philippines and Thailand together with their underlying rationales. It then evaluates the economic benefits and costs of generally increasing those thresholds, particularly those that are set at the lower levels.
These six economies have been chosen as being broadly representative of the APEC region as a whole, in the expectation that results obtained here will be able to be extended to the other economies of the region.
A major impediment to advancing our understanding of these issues, however, has been the paucity of basic information available to the public. This problem has been well documented by the Australian Productivity Commission, which is in the process of undertaking a public inquiry into the de minimis arrangements in that jurisdiction.
The lack of information has constrained the sophistication that could be applied to the economic analysis. Nevertheless, based on conservative assumptions, we have been able to estimate the order of magnitude of the net economic benefit that would be generated by alternative de minimis arrangements. For this purpose the analysis has assessed a series of minimum thresholds — namely USD50, USD100, USD150 and USD200.
A minimum threshold of USD200 would generate a net benefit of USD5.9 billion a year for the six economies, which is equivalent to around 0.086% of their collective GDP. Extension of this result to the rest of the APEC membership would imply a net benefit of about USD30.3 billion for all 21 economies.
Decreasing the minimum threshold merely reduces the extent of the net benefit and does so more than proportionately. It remains true, nevertheless, that any increase in the threshold in any of the six economies is better than none.

58 Volume 6, Number 1
International Network of Customs Universities
Some 98% of the net benefit from the USD200 threshold is accounted for by savings in the cost of government administration and business compliance, the balance being modest savings in the transit time of imported merchandise. The tariff revenue foregone is a very minor consideration, as it amounts to less than 1% of the benefits. The same broad pattern was evident across all six economies.
The dominance of government administration and business compliance savings on the results is not surprising. It simply reflects the basic economics of this category of imports — relatively large numbers but relatively low aggregate value. Hence the volume-based impacts, such as those on customs and private business processing costs, must loom larger than the value-based impacts, such as those involving transit delays and tariff collections. In the case of the latter, the potential revenue base has already been substantially eroded by preferential tariff rates to FTA partners and the existing de minimis exemptions that are in place, even in those economies with relatively high applied tariff rates.
Although it was not possible to model the impact of de minimis thresholds on VAT revenue, a sensitivity test based on the maximum possible revenue loss did not qualitatively change the above results. The actual impact is likely to be much less than this maximum as there is only a net loss of VAT revenue on imports by or on behalf of households. The vast majority of low value imports are business inputs so any VAT not collected at the border can be expected to be collected on the final product.
Our conclusions have been strongly reinforced by the Productivity Commission, the Australian Government’s independent economic advisory body. The Commission is reviewing the de minimis threshold applied in Australia. Although Australia has the highest threshold in APEC and a 10% GST, the Commission has concluded that any reduction would impose a net cost on the economy, and a substantial one at that.
Notwithstanding the severity of the information constraints on the analysis of the de minimis issue, these orders of magnitude are unlikely to change with the application of more information or better quality data. At this level we judge the results to be robust, at least for the six economies that we have examined in any detail. Indeed the conservative nature of the analytical approach should mean that more refined estimation is likely to yield higher net benefits than what we have estimated.
For a start, the estimates in this report have made no allowance for any behavioural response to raising the thresholds. Competition will ensure that the savings in transit time and business compliance costs generated by higher thresholds will eventually be passed on to domestic producers and consumers in the form of lower prices and higher quality products. These changes will, in turn, stimulate increased output by downstream industries and increased consumption by households. Neither impact has been accounted for here but both would benefit the community as a whole.
The size of these behavioural benefits would be significantly increased by a coordinated approach within APEC to raising de minimis thresholds and broadening their coverage across the region. The leverage that is available is similar to what multilateral liberalisation of trade barriers through the WTO can achieve compared to unilateral liberalisation. After all, a coordinated increase in de minimis thresholds is functionally and economically equivalent to a coordinated cut in trade barriers for intermediate products, which are the fastest growing component of global trade.
The policy implications of our results are therefore quite straightforward. A commercially attractive de minimis arrangement makes sound economic sense for all economies. While the optimal level of the threshold for any economy remains somewhat of an open question, the direction of change is quite clear from a practical perspective.
Most, if not all, APEC economies would benefit by increasing their existing thresholds, and by a substantial amount. APEC could assist this process by agreeing to recommend a minimum threshold level to its members with the option of a higher level to better suit individual circumstances.

Volume 6, Number 1 59
World Customs Journal
References
APEC 2007, APEC’s Second trade facilitation action plan, APEC Secretariat, Singapore, September.Australian Customs and Border Protection Service (ACBPS) 2011, Low value import threshold –
enhanced compliance campaign report, January-March 2011, 14 June, ACBPS, Canberra. Australian Customs Service 2006, Changes to import processing charges, Australian Customs
Notice No. 2006/21, April, viewed 25 July 2011, www.customs.gov.au/webdata/resources/notices/ ACN0621.pdf.
Brooks, Douglas H & Stone, Susan F 2010, ‘Infrastructure and trade facilitation in Asian APEC’, Asian Development Review, Asian Development Bank, Manila, Philippines, vol. 27, no. 1, pp. 135-59.
Centre for International Economics (CIE) 2011, The GST threshold for low value products: economic analysis, report prepared for the Conference of Asia Pacific Express Carriers, Canberra & Sydney, May.
De Souza, R, Goh, M, Gupta, S & Luo, L 2007, An investigation into the measures affecting the integration of ASEAN’s priority sectors (Phase 2): the case of logistics, April, ASEAN Secretariat, Jakarta.
Djankov, S, Freund, C, & Pham, CS 2010, ‘Trading on time’, The Review of Economics and Statistics, vol. 92, no. 1, pp. 166-73.
Hornok, C & Koren, M 2010, ‘Administrative barriers to trade’, mimeo, August. Hufbauer, GC & Wong, Y 2011, Logistics reform for low-value shipments, Policy Brief No. PB 11-7,
June, Peterson Institute for International Economics, Washington, DC.Hummels, D 2001a, Time as a trade barrier, GTAP Working Paper, No. 18, Centre for Global Trade
Analysis, Department of Agricultural Economics, Purdue University, Lafayette, IN. Hummels, D 2001b, Towards a geography of trade costs, GTAP Working Paper, Centre for Global Trade
Analysis, Department of Agricultural Economics, Purdue University, Lafayette, IN. Hummels, D 2007, Calculating tariff equivalents for time in trade, report prepared for the United States
Agency for International Development, Nathan Associates, Washington, DC, March.Igarashi, K 2010, ‘Japan Customs’ experience in conducting Time Release Studies’, Presentation to
CAREC Time Release Study Seminar, Central Asia Regional Economic Cooperation (CAREC) Program of the Asian Development Bank, Asian Development Bank Institute, Tokyo, 8-10 September, www.carecinstitute.org/uploads/events/2010/9th-CCC/Day2-JPN-Customs-TRS-Experience.pdf.
International Monetary Fund (IMF) 2011, World Economic Outlook April 2011 Tensions from the two-speed recovery: unemployment, commodities, and capital flows, IMF, Washington, DC, April, http://www.imf.org/external/pubs/ft/weo/2011/01/index.htm.
New Zealand Customs Service 2011, Issues paper: review of de minimis, February, New Zealand Customs Service, Wellington, NZ.
Lesser, L & Moisé-Leeman, E 2009, ;Informal cross-border trade and trade facilitation reform in Sub-Saharan Africa’, OECD Trade Policy Working Paper No. 86, 18 February Organisation for Economic Co-operation and Development, Paris.
Productivity Commission 2011, Economic structure and performance of the Australian retail industry, Chapter 6: ‘Appropriateness of current indirect tax arrangements’, Draft Report, Productivity Commission, Canberra.
Policy Support Unit (PSU) 2010, Reducing trade transaction costs in APEC economies by 5%: progress with achieving the goals of TFAP II: interim assessment of TFAP II, APEC Secretariat, Singapore.
Policy Support Unit (PSU) 2011 (forthcoming), Final assessment of TFAP II: direct estimation of trade transaction costs, APEC Secretariat, Singapore.
60 Volume 6, Number 1
International Network of Customs Universities
RSM Sawamura & Co. 2008, Japanese consumption tax, Tokyo, Japan.Simpson, J 2009, ‘A tour of the ongoing work of the World Trade Organization on trade facilitation:
the traders’ perspective’ in WEF 2009, The Global Enabling Trade Report, World Economic Forum, Davos, Switzerland.
Walkenhorst, P & Yasui, T 2003, Quantitative assessment of the benefits of trade facilitation, TD/TC/WP(2003)31/Final, 13 November, OECD, Paris.
World Bank Group 2010a, Doing Business 2011: making a difference for entrepreneurs, The World Bank Group, Washington, DC, www.doingbusiness.org/.
World Bank Group 2010b, ‘Connecting to compete: trade logistics in the global economy’, The Logistics Performance Index and its Indicators, The World Bank Group, Washington, DC.
World Customs Organization (WCO) 1999, International Convention on the Simplification and Harmonization of Customs Procedures (as amended) (Revised Kyoto Convention), Chapter 4 (Duties and Taxes); Transitional Standard 4.13, WCO, Brussels.
World Customs Organization (WCO) 2007a, Guidelines for the immediate release of consignments by Customs, July, WCO, Brussels.
World Customs Organization (WCO) 2007b, WCO SAFE Framework of Standards to Secure and Facilitate Global Trade, June, WCO, Brussels.
World Economic Forum (WEF) 2009, The global enabling trade report, WEF, Davos, Switzerland. World Trade Organization (WTO) 2005a, Communication from Malaysia, Negotiating Group on Trade
Facilitation, Document TN/TF/W/50, 14 June, WTO, Geneva, Switzerland.World Trade Organization (WTO) 2005b, Trade policy review: the Philippines, Report by the Secretariat,
Document WT/TPR/S/149, 7 June, WTO, Geneva, Switzerland.World Trade Organization (WTO) 2005c, Trade policy review: Malaysia, Report by the Secretariat,
Document WT/TPR/S/156, 12 December, WTO, Geneva, Switzerland.World Trade Organization (WTO) 2007a, Trade policy review: Indonesia, Report by the Secretariat,
Document WT/TPR/S/246, 4 May, WTO, Geneva, Switzerland. World Trade Organization (WTO) 2007b, Trade policy review: Thailand, Report by the Secretariat,
Document WT/TPR/S/191, 22 October, WTO, Geneva, Switzerland.World Trade Organization (WTO) 2009, Trade policy review: Malaysia, Report by the Secretariat,
Document WT/TPR/S/225, 14 December, WTO, Geneva, Switzerland.World Trade Organization (WTO) 2011a, Trade policy review: Japan, Report by the Secretariat,
Document WT/TPR/S/243, 11 January, WTO, Geneva, Switzerland.World Trade Organization (WTO) 2011b, Trade policy review: Canada, Report by the Secretariat,
Document WT/TPR/S/184, 23 May, WTO, Geneva, Switzerland.Yang, D 2008, ‘Can enforcement backfire? Crime displacement in the context of customs reform in the
Philippines’, The Review of Economics and Statistics, vol. 90, no. 1, pp. 1-14.

Volume 6, Number 1 61
World Customs Journal
Notes1 The views expressed in this report are those of its authors. The consultants, ITS Global Asia Pacific (ITS) and
the Centre for Customs and Excise Studies (CCES), take no liability for commercial decisions taken on the basis of information in this report. The information is accurate to the best of the consultants’ knowledge, however the consultants advise that no decision with commercial implications which depends upon government law or regulation or executive discretion should be taken by any person or entity without that party’s having secured direct advice from the government agency concerned in writing.
2 Transaction costs are the resource costs incurred in searching out, negotiating, and completing an economic exchange. They include the costs that government regulation and taxation imposes on these processes. Transaction costs need to be distinguished from the costs of producing what is exchanged, which are sometimes referred to as ‘transformation costs’ to underline this distinction.
3 Financial Administration Act, section 17, Order-in-Council P.C. 1985-2954, October 3, 1985 (Canada Gazette, Part II, p. 4291) as amended by Order-in-Council P.C. 1986-1400, June 12, 1986 (Canada Gazette), Part II, p. 2616) and Order-in-Council P.C. 1992-1432, June 24, 1992 (Canada Gazette, Part II, p. 3098).
4 Financial Administration Act, section 17, Order-in-Council P.C. 2955 as amended by Order-in-Council P.C. 1986-1401 and Order-in-Council P.C. 1992-1431.
5 The principal articles that have been designated as those to which duty exemption is not applicable are as follows: Leather bags, handbags, gloves, etc., knitted apparel, ski boots, leather shoes and footwear with leather soles.
6 The original legislation specified a threshold of PHP10 but it was amended subsequently. 7 A Bill to increase the threshold to PHP 2,500 has been introduced into the Philippines Senate but it does not seem to
have been passed at this time.8 This composite figure represents the sub-index breakdown as outlined above.9 The Member States of COMESA are Burundi, Comoros, the Democratic Republic of the Congo, Djibouti, Egypt,
Eritrea, Ethiopia, Kenya, Libya, Madagascar, Malawi, Mauritius, Rwanda, the Seychelles, the Sudan, Swaziland, Uganda, Zambia, and Zimbabwe.
10 Annexes A to D are available from the authors. If you wish to view them, please email [email protected].
11 These estimates are based on the April 2011 edition of the World Economic Outlook database (IMF 2011).12 This is because their existing thresholds are equivalent to USD150 (Malaysia), USD129 (Japan) and USD50
(Indonesia).13 This intensity is measured in terms of the total value of imports, valued at USD200 per consignment or less, as a share
of GDP.14 Among other things, the inquiry by the Australian Productivity Commission is examining the de minimis arrangements
that apply in Australia. On 4 August 2011 the Commission has released its Draft Report for public comment (Productivity Commission 2011).
15 The approach may be expressed formally as follows: TV [total value of imports by all modes] = TVa [total value of imports by air cargo] / Sa [air cargo’s share of the total value of all imports by all modes].
16 The ISO 3166 codes are: CA (Canada); ID (Indonesia); JP (Japan); MY (Malaysia); PH (the Philippines); and TH (Thailand).
17 General Agreement on Tariffs and Trade (GATT 1954), Article VII.1.18 The legal authority for this is the Import Processing Charges Act 2001. The charges are widely published by the
Service (Australian Customs Service 2006). As far as we are aware, Australia is the only APEC economy that has mandated the full recovery of customs processing costs.
19 The conversion was at a USD to AUD exchange rate of 1.1000.20 The GDP and employment data in question were sourced from the April 2011 edition of the World Economic Outlook
database (IMF 2011). 21 The current de minimis threshold in the United States is USD200 (PC 2011).22 An Approved Economic Operator (AEO) is a private business involved in the international movement of goods in
whatever function that has been approved by or on behalf of a national Customs administration as complying with World Customs Organization or equivalent supply chain security standards. The requirement for an AEO program is a key component of the WCO Framework of Standards to Secure and Facilitate Global Trade (SAFE) (WCO 2007).

62 Volume 6, Number 1
International Network of Customs Universities
Stephen HollowaySteve Holloway, Dean of Studies (Education/Research) and Principal Director of the Centre for Customs and Excise Studies, and an Adjunct Professor in the Faculty of Business, Government and Law, University of Canberra, has had 25 years’ experience in customs and international trade, including 20 years with the Australian Customs Service. He has worked closely with international organisations, customs and revenue administrations and the private sector on international trade and border management including customs reform and modernisation, international logistics, the international regulation of intellectual property, legislative reform and strategic export controls.
Steve holds a Bachelor of Laws from the Australian National University, a Masters degree in International Customs Law and Administration from the University of Canberra, and is admitted as a Barrister and Solicitor of the Australian Capital Territory Supreme Court and a Barrister of the Federal and High Courts of Australia.
Jeffrey RaeJeffrey Rae is Chief Economist with ITS Global Asia Pacific and has more than three decades of experience in policy analysis and advice involving a wide range of domestic and international issues in the public and private sectors, both in Australia and overseas.
Jeff’s experience has involved research and advice on international trade, including the transaction costs that are imposed on merchandise trade by government regulation and other policy measures along international supply chains. He was responsible for the development of the methodology that has been used for the estimation of trade transaction costs in APEC economies and oversaw the application of that methodology to both the Interim and Final Assessments of the Second APEC Trade Facilitation Action Plan, which his firm conducted for the APEC Secretariat. This program was the precursor to APEC’s Supply Chain Connectivity Framework Action Plan.
Prior to moving into private consultancy, Jeff held senior executive positions in several Australian Government departments, was seconded to the OECD, Paris, and has presided over or participated in a number of public inquiries.

Volume 6, Number 1 63
World Customs Journal
Coordinated border management: the experience of Asia and the Pacific region1
Sandeep Raj Jain2
Abstract
Asia and the Pacific region is becoming the centre of global attention due to its rapid economic growth in the past few decades. The global financial crisis has made it imperative for the countries in the region to take measures to stimulate domestic demand and to increase intra-regional trade to sustain the growth momentum. As the regional arm of the United Nations, the Economic and Social Commission for Asia and the Pacific (ESCAP) has been working with its member countries to address the barriers that impede trade and transport in the region. ESCAP has taken various initiatives to promote the regional connectivity holistically by narrowing the infrastructure gaps as well as minimising the institutional deficiencies. Coordinated border management is an important component of the latter. Border delays constitute a major bottleneck to the smooth movement of goods in the region and countries in the region are taking concerted measures to address these issues. Experience has shown that there are various approaches to coordinated border management and some of the better practices demand detailed and careful planning. In particular, border agencies – specifically Customs – need to redefine their standalone role and more importantly, their role as part of the coordinated border management team.
1. IntroductionThe World Bank, in its inaugural edition of ‘Global Development Horizons’3 states explicitly that the world economy is undergoing a major transformation. As indicated in the report, ‘By 2025, six major emerging economies—Brazil, China, India, Indonesia, South Korea, and Russia—will account for more than half of all global growth, …’ Countries in Asia, in general, are going through an exciting phase of their development. The growth model ‘produce in Asia and sell in the West’ has come under pressure due to weak demand in the developed markets. To sustain the growth, the emphasis is shifting towards increasing intra-regional trade and spurring the domestic demand, and this poses formidable challenges for the countries in the region.
Boosting intra-regional trade and stimulating domestic demand need investment in infrastructure (‘hardware’) as well as measures to address the institutional and legal barriers (‘software’) to trade and transport in the region. Both these areas need persistent and sustained efforts over a long time, and there are no quick solutions. However, the countries in the region are increasingly realising the importance of intra-regional trade as a means to sustain their growth and are taking steps at sub-regional and regional levels to address the issues involved. This paper reviews the state of coordinated border management/joint controls in Asia and the Pacific4 based on the existing literature with the aim of finding lessons to be learned and good practices that can serve as benchmarks for countries intending to introduce these controls as a means of addressing the border delays.
64 Volume 6, Number 1
International Network of Customs Universities
Following this brief introduction, actions taken for regional connectivity under the auspices of the United Nations Economic and Social Commission for Asia and the Pacific (ESCAP) are discussed. This is followed by a description of the non-physical barriers and their potential to impede intra-regional trade and transport. Then, the concept of coordinated border management is introduced and the international efforts to promote it are detailed. Next, the state of play of coordinated border management in three broad subregions of Asia and the Pacific, Central Asia, South East Asia and South Asia is discussed. Lastly, an attempt is made to identify lessons learned and good practices in the region for coordinated border management. Areas for future research for customs academicians are indicated and conclusions summarised.
2. ESCAP initiatives to improve regional connectivity For many years, ESCAP has been a focal point for countries in the region to address the issues that impede intra-regional trade. In 1992, ESCAP resolution 48/115 urged member countries to accede to seven major international conventions to facilitate transport. In 2006, member countries adopted the Busan Declaration6 on Transport Development in Asia and the Pacific that envisions an international, integrated and inter-modal transport and logistics system for the region. The building blocks of this vision are the intergovernmental agreements on the Asian Highway and the Trans-Asian Railway networks, and the proposed agreement on dry ports.
Asian Highway and Tran-Asian Railway Networks
The Intergovernmental Agreement on the Asian Highway Network (AH)7 entered into force in 2005 and currently there are 28 parties to the agreement. The 142,000 kilometre AH spans 32 countries in the region. The Intergovernmental Agreement on the Trans-Asian Railway Network (TAR)8 entered into force in 2009. The 114,000 kilometre TAR goes across 28 countries in the region. Both agreements have laid the institutional framework to attract funds in these capital-intensive projects and will boost investment in transport infrastructure in the region. This will lead to more trade and, in turn, more investment, thereby setting up a cycle of investment and trade in the region. Further, containerisation and inter-modal transport have made door-to-door seamless movement of goods a reality. Taking advantage of this, ESCAP is now working on an intergovernmental agreement on dry ports to promote such inland ports so that isolated and landlocked areas of the region can be brought into the cycle of growth.
Increasing importance of non-physical barriers
Having put in place the institutional framework for attracting investments in physical infrastructure and to take maximum advantage of these ongoing initiatives, the focus of the member countries of ESCAP is now increasingly shifting to the non-physical barriers. ESCAP at its 67th session held in May 2011 observed that the non-physical barriers continue to hinder intra-regional trade and requested the ESCAP secretariat to take tangible measures to address them. It reiterated the importance of eliminating or at least reducing such barriers to transport including waiting times at border crossings by streamlining and simplifying customs formalities.
Some of the significant non-physical barriers that impede the movement of goods are: cumbersome border crossing formalities involving repeated inspections of goods by different agencies, excessive documentation, non-transparent rules and regulations and frequent changes in them without informing the concerned parties, different technical standards for vehicles, restrictive visa procedures for drivers and crew, different procedures for temporary admission of vehicles, non-accession to various international conventions by some countries in the region leading to contiguity problems, numerous and sometimes overlapping transport agreements having the potential for legal conflicts while being implemented.

Volume 6, Number 1 65
World Customs Journal
Development of a regional strategic framework to address issues comprehensively
Countries of the region have been making efforts to address the non-physical barriers and in this regard they have entered into a number of subregional/bilateral agreements to facilitate road transport. Some have acceded to related international conventions. While progress has been made to minimise these barriers, it has been slower than anticipated as some of the facilitation efforts have been taken in relative isolation leading to fragmented results. In addition, conflicts in implementing these agreements have sometimes appeared, and some facilitation measures could not be implemented due to a range of institutional reasons.
Recognising the need for an integrated and comprehensive approach to address non-physical barriers, ESCAP recently undertook a study on these issues. Based on the findings of the study, it proposed a regional strategic framework for facilitation of international road transport. The framework suggests possible solutions to address non-physical barriers in the region and will be considered for adoption by the member countries at the Ministerial Conference on Transport to be held in November 2011. Once adopted, the framework will provide the member countries with a guide post on each of the issues identified and will ensure that the facilitation efforts of the countries converge in the long run.
3. Importance of coordinated border management One of the most important non-physical barriers affecting international land transport is excessive delays at border crossings. These delays can be due to many reasons but in most cases they are aggravated by a lack of coordination and cooperation among border agencies. Each of these agencies has a different mandate with regard to goods and people crossing the borders. More often than not these agencies work independently, without a full understanding of what the other agencies are doing and without regard to the consequences of multiple inspections of the same goods. The results of intervention by different agencies are obvious: long delays at the borders and attendant costs which ultimately raise the cost of the goods, making them uncompetitive. The International Road Transport Union’s (IRU) New Euro-Asian Land Transport Initiative (NELTI)9 project found border waiting times reaching days in some regions across the Euro-Asian landmass and accounting for 40 per cent of time lost during transport. It also found that such a situation encourages corrupt practices that can account for 30 per cent of transport costs.
Two dimensions of coordinated border management
To facilitate movement of goods, while taking into account the mandate of each agency with respect to goods and people crossing the border, it is desirable that border agencies work in a coordinated way by sharing information and avoiding duplication of the process or procedure. The clearances at border crossings can be expedited if the interventions are based on an integrated risk management framework which addresses the concern of all the agencies at the border. This inter-agency coordination among different agencies behind the border is one dimension of coordinated border management. The second dimension of coordinated border management involves cooperation with neighbouring countries and the institution of joint controls at border crossings to eliminate or at least reduce duplication of processes/procedures by sharing information and resources. This coordination between border agencies across borders can be more meaningful, if there is a high degree of inter-agency coordination behind the borders.
International efforts to promote coordinated border management
Because coordinated border management/joint controls can significantly reduce border delays and expedite the movement of goods, they attracted the attention of the international community as far back as 1982, when an International Convention on Harmonization of Frontier Control of Goods (Harmonization Convention) was developed under the auspices of the United Nations Economic Commission for Europe (UNECE).
66 Volume 6, Number 1
International Network of Customs Universities
Relevant articles of the Harmonization Convention
Article 4 on ‘Coordination of controls’ of the convention urges contracting parties, to the extent possible, to organise Customs and other controls in a harmonised manner. Article 5 further enjoins the contracting parties to ensure availability of sufficient personnel, equipment and facilities at such crossings. The emphasis of both articles is on behind the border inter-agency coordination and provision of resources for services. Article 6 of the convention on ‘international cooperation’ calls upon the contracting parties to cooperate with each other and enter into multilateral and bilateral agreements to achieve the objectives of the convention. Further, Article 7 of the convention provides for cooperation between adjacent countries and calls upon them to arrange for joint controls for goods and documents through provision of shared facilities. It also urges adjacent countries to have congruity in timings of operation of the frontier posts, the control services operating and the procedures followed therein. As can be seen, the focus of Articles 6 and 7 is on coordination and cooperation across the border.
Joint controls in the Revised Kyoto Convention
The International Convention on the Simplification and Harmonization of Customs Procedures, commonly referred to as the Revised Kyoto Convention, also provides for joint controls in its General Annex. The transitional standard 3.4 calls upon the contracting parties to operate joint customs controls at border crossings, and standard 3.5 calls upon parties to plan for juxtaposed customs control at new border crossings.
4. State of play of coordinated border management in Asia and the PacificThe Asia-Pacific region is diverse in terms of social and economic indicators. Its geographical scope stretches from Turkey in the west to the Pacific island state of Kiribati in the east and from the Russian Federation in the north to New Zealand in the south. The state of play of coordinated border management in the three broad sub-regions of Asia is discussed below.
Central Asia
Most countries of Central Asia are landlocked leading to high costs of transportation for much of their trade. Having seamless transit regimes is important for landlocked countries to reduce the cost of transportation. Most countries in the subregion are signatories to the Harmonization Convention. To address the special needs of the landlocked countries there has been considerable international effort. The Almaty Programme of Action is one of the significant initiatives. Among many things, it emphasises financial investments in projects to improve the existing border posts and/or to establish new joint border posts. Initiatives and actions by some other organisations to promote coordinated border management in Central Asia are discussed below.
European Commission’s Border Management Programme in Central Asia (BOMCA)
The European Commission’s Border Management Programme in Central Asia (BOMCA) aims to provide secure and stable borders in Central Asia. Its main component is capacity development for Integrated Border Management (IBM) by exposing countries to the best European practices in IBM, leading to enhanced cross-border cooperation to facilitate transit trade. The BOMCA strategy for IBM includes10 speeding up joint cross-border controls to increase customs revenue and to reduce opportunities for informal payments. BOMCA has adopted a transit corridor approach to trade and transport facilitation,
Volume 6, Number 1 67
World Customs Journal
as the traffic flows are greatest on these corridors and results of coordinated border management approaches will be more apparent on them. One of the main aims of BOMCA is to encourage countries to develop their own IBM strategies. Kyrgyzstan, for example, in February 2008 established a National Coordinated Committee for IBM and is in the process of developing a national IBM strategy. The BOMCA study stresses the importance of political will, vital to the institutional reforms at the borders, and finds Kyrgyzstan taking a proactive role in this regard.
Central Asia Regional Economic Cooperation (CAREC) Program
Under the customs cooperation component of the trade facilitation program of the Central Asia Regional Economic Cooperation (CAREC)11 Program, joint customs controls have been identified as the initial step leading to a Single Window approach that requires high levels of inter-agency coordination. The Asian Development Bank (ADB) is implementing a border crossing point improvement and single window development project in the subregion with the aim of supporting National Single Windows (NSWs) and developing a regional platform for networking NSWs through the participation of the private sector.
Further, many CAREC countries have initiated a regional dialogue on joint customs control and many countries now have functional joint controls. Currently, Kazakhstan has joint controls at borders with the Russian Federation, China and Kyrgyzstan. One of the initiatives countries in the region have taken for implementing joint customs controls is to promote the use of a unified cargo manifest. It is being used at the China (Dulata)/Kazakhstan (Kalzhat), Kazakstan/Krygystan and Mongolia/China borders. Adoption of a unified cargo manifest coupled with simplified procedures has reduced customs clearance time12 by 35 per cent. The use of a unified cargo manifest is conducive to consistency and coordination of customs control and leads to efficient customs clearance. The carrier has to submit the manifest only once, avoiding duplication. The document also serves as the basis for revenue collection, anti-smuggling operations and accurate data collection. Other steps being taken by the countries in the subregion to promote inter-agency coordination are issuance of joint instructions, preparation of annual joint action plans, and cross designation of responsibility among agencies.
Turkey’s initiative using the BOT model to modernise border crossings
Turkey has initiated major steps to modernise its border gates13 with various countries since 2001. It has successfully involved the private sector using a Build-Operate-Transfer (BOT) model in renovating its border gates. Turkish Customs was designated as the lead agency to oversee the modernisation project. A concession agreement was signed for each of the 18 border gates that included the cost of the project, period of concession and rights and obligations of each side. This has led to expeditious customs clearances, an increase in tax revenues, effective control over smuggling and less congestion due to segregation of truck and passenger platforms. It has also facilitated the use of information technology such as single window and electronic TIR carnet at the border gates. Due to the BOT model, all these benefits have come without any strain on public finances. The Turkish model can potentially be replicated in other countries of the region to modernise border gates so that delays due to infrastructural constraints plaguing many border crossings in the region can be minimised.
South East Asia
South East Asia is a fairly developed and integrated subregion and has numerous world class seaports leading to low transportation costs. Coordinated border management has been promoted mainly by means of subregional cross border transport agreements. Two such agreements are the Association of Southeast Asian Nations (ASEAN) Framework Agreement on Facilitation of Goods in Transit and the Greater Mekong Subregion Cross Border Transport Agreement (GMS CBTA).

68 Volume 6, Number 1
International Network of Customs Universities
ASEAN Framework Agreement on the Facilitation of Goods in Transit
The objective of the ASEAN Framework Agreement on the Facilitation of Goods in Transit is to facilitate transit trade. Article 7 of this ASEAN agreement urges contracting parties to set up frontier posts adjacent to one another to avoid repeated loading and unloading of goods and to explore the possibility of joint examination of goods. It also enjoins the parties to coordinate working hours of the adjacent border posts. The Article calls upon the contracting parities to be guided in their efforts to harmonise frontier facilities, wherever possible by the International Convention on the Harmonization of Frontier Control of Goods (1982).
GMS Cross-Border Transport Agreement
Article 4 of the GMS CBTA on Facilitation of Border Crossing Formalities calls upon the contracting parties to progressively adopt measures to simplify and expedite border formalities by having a single window inspection to carry out joint and simultaneous inspection of goods and people by respective competent authorities of agencies such as customs, immigration, trade, agriculture, and health. It further provides for single-stop inspection and urges the national authorities of adjacent countries to carry out joint and simultaneous inspections. In the case that control posts are not located adjacent to each other, the control officials of one country shall be allowed to perform these inspections in other countries. Further, the article provides for coordination of working hours of the frontier posts and advance exchange of information on goods and people to facilitate their clearance.
Detail MOUs for each border crossing
At physical border crossings many countries in the subregion have taken tangible steps to promote coordinated border management. Taking the GMS CBTA referred to above as the basis, Cambodia and Thailand entered into a Memorandum of Understanding (MOU)14 in July 2005 for a specific border crossing at Poipet (Cambodia) and Aranyaprathet (Thailand) making time-bound commitments in phases to implement single window and single stop inspections. The MOU details each and every aspect of border crossing formalities and lays down detailed procedures to be followed by officials on both sides of the border to implement various control measures. The MOU laid down the targeted combined border clearance time for commercial vehicles to be reduced from the current 240-300 minutes to 120 minutes in the first step and to 30 minutes in the second step, leading to reduction in border crossing times by approximately 10 times.
Single window as a means to promote coordinated border management
Single window arrangements have made much headway in South East Asia. ASEAN countries, in particular, have been proactive in this regard and in 2005 signed an agreement to establish and implement the ASEAN single window that involves developing single windows in each of the member countries and integrating them at the subregional level. This has led to a flurry of activity in each of the countries to simplify, standardise and harmonise processes and procedures related to international trade.
The single window platform provides an integrated IT system to facilitate exchange of information and operation of integrated procedures for supporting border agency cooperation and coordination.15 Many countries are at an advanced stage of implementation of a single window platform in the subregion. ESCAP and ASEAN have been playing an important role in laying down the guidelines and providing countries with a platform for coordinating and sharing best practices. A network of experts known as the United Nations Network of Experts for Paperless Trade in Asia and the Pacific (UNNExT) has been formed to support national, subregional single window and paperless trade initiatives. ESCAP has provided secretariat support for UNNExT in cooperation with UNECE. The focus of UNNExT is on

Volume 6, Number 1 69
World Customs Journal
training, knowledge sharing and application of international standards that are developed by the World Customs Organization (WCO) and the United Nations Centre for Trade Facilitation and Electronic Business (UNCEFACT).
South Asia
Intra-subregional trade in South Asia is only two per cent as compared to 26 per cent in South East Asia. Despite the long land border between India and Pakistan, there are only a few border crossings and the cross-border movement of goods is severely restricted. On the Indo-Nepal border there are numerous Land Customs Stations (LCSs) but traffic is high only at two of them. There are also no institutional arrangements for coordinated border management or joint controls to facilitate cross-border movement of goods. Nepal is a landlocked country and the transit trade of Nepal is governed by an Indo-Nepal trade and transit treaty that is renewable every five years. Most of the countries in the subregion have not acceded to the Harmonization Convention.
Inefficient border crossings are a major deterrent to growth of intra-subregional trade in South Asia. A study16 conducted in 2008 regarding transit regimes and border crossings in the eastern part of South Asia found that out of the nine border crossings in India, Nepal, Bangladesh, and Bhutan, only one was relatively efficient while the rest were relatively inefficient in both physical and non-physical parameters. Among the non-physical barriers, the study found that customs authorities in the subregion still require excessive documentation for imports. It further found that implementation of e-governance at the border, including e-Customs was a significant determinant of intra-subregional trade. Another finding of the study was that a 10 per cent reduction in the border transaction cost can lead to a three per cent increase in the exports of the country.
The study concluded that to realise full benefits of trade liberalisation, the countries in the subregion should give top priority to improving the efficiency at border crossings and bring adjacent border crossings up to similar levels of efficiency to remove asymmetries and to expedite the movement of goods. Despite this state of affairs in general, some scattered efforts are being made in the subregion to facilitate cross-border trade. In May 201117 India and Bangladesh Customs agreed upon a Standard Operating Procedure (SOP) to be followed at the four border crossings to expedite customs clearances.
India’s approach to coordinated border management
India has a long coastline that is dotted with numerous ports that carry much of its international trade; therefore development of land routes as an alternative did not get much attention in the past. But things are beginning to change as the increase in intra-regional trade has made the development of land routes a necessity. India has taken a major step in this direction by setting up the Land Port Authority of India (LPAI)18 that is overseeing the establishment of 13 Integrated Check Posts (ICPs) along international borders with Pakistan, Nepal, Myanmar and Bangladesh. The authority has been set up under the Department of Border Management, Ministry of Home Affairs, Government of India. Plans are afoot to equip these border crossings with all modern facilities to encourage cross-border trade. The facilities will include immigration points, cargo inspection sheds, scanners, quarantine laboratories, customs clearances, banks, currency exchange warehouses/cold storage, parking facilities, and hotels/restaurants.
One of the functions of the LPAI is to provide an institutional mechanism for coordination and facilitation among various agencies to undertake a range of activities at the ICPs. The first ICP at the Indo-Pakistan border became operational in late 2011. The experience of how these ICPs work, the institutional mechanism for inter-agency coordination at these ICPs and their cooperation with their counterparts in neighbouring countries needs to be monitored and if successful, replicated elsewhere.

70 Volume 6, Number 1
International Network of Customs Universities
5. Lessons learned The advantages of coordinated border management are conceptually easy to understand, but experience suggests that it is not easy to execute. The real challenge lies in its implementation, whether it is behind the border or across the border. The following are some of the lessons that can be learned, based on the experience of coordinated border management in Asia and the Pacific.
Political commitment is vital
As coordinated border management/joint controls normally lead to redistribution or even apparent loss of power of agencies over goods and people, certain vested interests may try to sabotage these efforts. To deal with such elements within the agencies and outside, a clear message about the need for and implementation of such controls is needed. Change will not happen without clear and sustained government support. Political will is manifested by such actions as accession to related international conventions, entering into subregional and bilateral agreements, and the nomination of a lead agency to undertake such reforms. An example of political will is the case of Kyrgyzstan where the government is developing an integrated border management strategy. The lack of political will appears to be the primary reason for the virtual absence of coordinated border management arrangements in South Asia, while the opposite appears to be true for South East Asia.
Nominate a lead agency at the border
Before instituting joint controls across the border, it is essential that there is substantial inter-agency coordination behind the border. In this regard, it is advisable to nominate a lead agency at the borders to take responsibility for coordination on behalf of other agencies. This role can be most appropriately adopted by the customs authorities. In fact, that is the case in many countries. However, the necessary legislative and procedural changes should be made in the customs code and other legislation to enable the lead agency to perform its duties without any legal conflicts. Without a lead agency, coordinated border management can become a turf war among the agencies.
Start with joint customs controls
As has been seen from the experience of countries in Central Asia, it is more meaningful to start with joint customs controls, followed by comprehensive joint controls encompassing all agencies. With respect to joint customs controls certain guiding principles have emerged that can lead to such controls being effective. Customs declarations are filed in the country of exit and information is shared with the country of entry, which is taken as the basis for further action. The unified cargo manifest being used in some countries in the region can be useful in this respect. Customs inspections are made only in the country of entry, unless the customs authorities of the country of exit have some specific intelligence that calls for intervention. Some countries have developed standard operating procedures between customs authorities at the borders. Before the arrival of goods, and to expedite the clearance process, advance notice to customs authorities should be encouraged so that risky cargo can be identified based on the risk management system in place. Successful experiment with customs controls can lay the foundation for joint controls involving all agencies.
Develop a model MOU for coordinated border management
International conventions provide broad guidelines for coordinated border management. They provide for simplification, standardisation and harmonisation of the procedures. By acceding to these conventions, countries can ensure their efforts in this regard converge over the long term. They can also be assured of the support of the international community/donors and international financial institutions to implement such measures as joint controls. In fact, the prevalence of joint controls in Central Asian countries

Volume 6, Number 1 71
World Customs Journal
as compared to their virtual non-existence in South Asian countries can be partially attributed to the accession of the Harmonization Convention by the former. Therefore, accession to this and other related conventions, for the countries that have not done so, is recommended. In this regard, capacity building support from international organisations such as the WCO can be harnessed.
Subregional agreements treat various aspects of coordinated border management in a more elaborate and specific manner, as is evident in the case of GMS CBTA and other similar agreements entered into by countries in the region. But the actual implementation of coordinated border management needs detailed and careful planning. Therefore, a bilateral agreement/MOU for a specific border crossing is required to address the operational issues comprehensively. Among the significant issues that should be addressed in these MOUs are the measures for extraterritorial intervention and joint performance of duties by Customs and other officers, treatment of detained goods and vehicles, development of an integrated risk indicator system, and performance benchmarks for the border clearance times. These MOUs need to be promoted extensively for each border crossing for joint controls to be effective. A model MOU can be prepared and depending on the specific aspects and special requirement of each border crossing, it can be tailored to suit the particular requirement of that border crossing.
Standardise and replicate existing good practices
To ensure inter-agency coordination, certain good practices found in Central Asian countries need to be encouraged. Some of these are the issuing of joint instructions that define the procedure of implementation of border, Customs and control by other agencies on vehicles and goods crossing the border. Another practice is the formation of annual joint action plans that serve as the basis for inter-agency cooperation at the border. All the main national agencies take part in the formation of annual plans at the beginning of each year where past year actions are reviewed and necessary changes made for the current year, keeping in mind the mandate of each agency at the border. Another illustration of good practice is the development of a national IBM strategy and an action plan to implement it, as has been done in the case of Kyrgyzstan. Cross designation of responsibilities is another way of inter-agency cooperation which is being used in Tajikistan where border guards have the right to perform responsibilities on behalf of other agencies in case of absence of permanent representation at the border.
Involve the private sector to support coordinated border management
The border delays affect the trading community directly and, therefore, they have a deep interest in the processes, procedures and development of infrastructure at border crossings. The involvement of the private sector depends upon its capacity and capability in the country. But in general, their participation should be encouraged to get maximum benefits out of border reform initiatives, including coordinated border management. As discussed above, Turkey has successfully involved the private sector in the modernisation of its border gates that has addressed the infrastructural constraints and institutional deficit without straining government resources. In contrast, India’s border modernisation initiative is solely funded through the government budget due to security concerns.
Initiate coordinated border management at inland locations
To ease pressure at physical border crossings, and wherever possible, customs and other controls should be initiated at inland locations. Containerisation has made secure door-to-door movement of goods a reality. Examination of goods, stuffing and sealing of the container for export can be done at the Inland Container Depots (ICDs) under the presence of Customs and other border agencies. At the physical borders, no customs controls are normally required, other than checking the integrity of the seal, thus allowing the focus to shift to transport and related controls. Similarly, import clearance should be encouraged at inland locations where customs and other controls can be applied. However, for controls at inland locations, the goods have to be moved from the physical border to inland locations or vice
72 Volume 6, Number 1
International Network of Customs Universities
versa under a national transit system. Such movement is normally permitted by Authorised Economic Operators (AEOs)19 and is prevalent in a few countries in the region, and needs to be encouraged. For example, Kyrgyzstan has a ‘fair business entity’ scheme, Malaysian Customs use a ‘Golden Client Scheme’ and Thai Customs uses a ‘Golden Card’ System to give preferential treatment to AEOs. In this regard, mutual recognition of AEOs by countries can significantly reduce border delays.
6. Suggestion for future research by Customs academiciansDue to the efforts of the WCO over the last few decades, customs procedures in all countries are converging. The Revised Kyoto Convention is a blueprint for customs modernisation; it contains best and modern practices and has now been acceded to by 7720 countries. The principles of risk management, pre-arrival advice, and post audit clearances are increasingly being adopted by customs administrations around the world. Despite these advances in customs clearance processes, the overall clearance times for goods remain high, as indicated by the World Bank’s Logistic Performance Index study. Further, a study conducted on behalf of the World Bank (Arvis et al. 2007) found that customs processes account for one-third of the total clearance time, implying that clearances cannot be expedited unless Customs collaborate with other border agencies. Customs, after all, is one link in the clearance chain and the chain is as strong as its weakest link. If other border agencies continue to use outdated procedures, the impact of customs modernisation to simplify and expedite customs clearances will be nullified.
Therefore, an important challenge before the customs community is how to work in concert with other border agencies and find ways to collaborate to optimise control and facilitation. Optimisation of control and facilitation is going to become extremely challenging due to the rapid increase in trade on the one hand and the emergence of organised crime on the other. In this regard, there will be a need for extensive collaboration and information sharing with other agencies, something which agencies are not used to doing in many countries. The WCO has already developed three versions of a Data Model for this purpose. Various other models and approaches for sharing information among agencies behind and across the border need to be researched, developed, implemented and updated, keeping in mind the requirements for interoperability, data confidentiality and the dynamic nature of international trade.
The development of customs tools, procedures, and standards can no longer be done in isolation. They may have to be developed keeping in mind the requirements of other agencies, and ways have to be found to suitably incorporate the concerns of other agencies in the development of these new instruments. For example, it may be desirable to develop an integrated risk management framework that takes into consideration risk indicators of other border agencies rather than of Customs alone. Efforts in these directions are already being made but could be strengthened if backed by relevant and targeted research.
7. Conclusions Better coordinated border management is one of the ten building blocks21 of the ‘Customs in the 21st Century’ vision adopted by the WCO Council in 2008 for enhancing customs operations globally. There is already a call to include coordinated border management as the third pillar of the WCO’s SAFE Framework of Standards, in addition to the two pillars of the Customs-to-Customs network and Customs-to-Business partnership to further fortify the global supply chains. As can be seen in this paper, countries in Asia and the Pacific region have realised the importance of addressing border delays through coordinated border management and are taking tangible steps in this direction. Further, it is evident that different models and approaches are prevalent in the region. The aim of the paper was to distil some of the best practices in coordinated border management based on the experience of those Asian and Pacific region countries that may be useful to other countries contemplating such measures, and reinforcing them in those countries already implementing such practices.
Volume 6, Number 1 73
World Customs Journal
Regional connectivity in Asia and the Pacific region has become a necessity in order to stimulate domestic and intra-regional demand. In this regard, ESCAP working with member countries has adopted a two-pronged approach: one to provide an institutional framework for attracting investment in infrastructure through the intergovernmental agreements on the Asian Highway, Trans-Asian Railway and the proposed agreement on dry ports, and the second to address the non-physical barriers, holistically. Coordinated border management is a vital component of the latter. Together, these efforts will have a synergistic effect on growth in Asia and the Pacific region. They will lead to the seamless flow of goods and people, leading to more trade, more jobs and more prosperity and eventually, wiping out poverty from the region – in the near future.
ReferencesArvis, J-F, Mustra, MA, Panzer, J, Ojala, L & Naula, T 2007, ‘Connecting to compete: trade logistics in
the global economy’, The World Bank, Washington, DC. De, P, Khan, AR & Chaturvedi, S 2008, ‘Transit and trade barriers in Eastern South Asia: a review of
transit regime and performance of strategic border crossings’, Asia-Pacific Research and Training Network on Trade, Working Paper Series, No. 56, June, ESCAP, Bangkok, www.artnetontrade.org.
Global Facilitation Partnership for Transportation and Trade 2005, Explanatory Note on Integrated Border Management, June.
Kieck, E, 2009, ‘Coordinated border management: unlocking trade opportunities through one-stop border posts’, World Customs Journal, vol. 4, no. 1, pp. 3-13.
United Nations Conference on Trade and Development (UNCTAD) 2008, Technical Note No. 14, Border Agency Coordination/Cooperation.
United Nations Development Programme (UNDP) 2007, Integrated Border Management Handbook for Central Asia.
United Nations Economic Commission for Europe (UNECE) 1982, International Convention on Harmonization of frontier control of goods, Inland Transport Committee, UNECE, Geneva, http://ec.europa.eu/world/agreements/prepareCreateTreatiesWorkspace/treatiesGeneralData.do?step=0&redirect=true&treatyId=509.
United Nations Economic and Social Commission for Asia and the Pacific (ESCAP) 2010, ‘Improving border management to facilitate trade in SPECA: challenges and prospects’, UNESCAP, Bangkok, Thailand.
World Bank 2005, Customs modernization handbook, World Bank, Washington, DC.World Bank 2011, Border management modernization, World Bank, Washington, DC.World Bank 2011, Global development horizons, multi-polarity: the new global economy, World Bank,
Washington, DC.World Customs Organization (WCO) 1999, International Convention on the Simplification and
Harmonization of Customs Procedures (as amended), (Revised Kyoto Convention), General Annex, WCO, Brussels, Belgium.
World Customs Organization (WCO) 2005, WCO SAFE Framework of standards to secure and facilitate global trade (SAFE Framework), www.wcoomd.org/files/1.%20Public%20files/PDFandDocuments/SAFE%20Framework_EN_2007_for_publication.pdf.
World Customs Organization (WCO) 2009a, Summary Report on ‘Inter Agency Forum on Coordinated Border Management’, 29-30 June 2009, WCO, Brussels, Belgium.
World Customs Organization (WCO) 2009b, Coordinated border management: a concept paper, prepared as background paper for interagency forum on Coordinated Border Management, June, WCO, Brussels, Belgium.

74 Volume 6, Number 1
International Network of Customs Universities
Notes1 This paper was presented at the 6th WCO PICARD Conference, ‘Promote research-based knowledge to support Customs
decision-making’, held at the United Nations Economic Commission for Europe (UNECE), Geneva, Switzerland, 14-16 September 2011.
2 The views expressed in this paper are those of the author and do not necessarily reflect the views of the United Nations.3 Global Development Horizons 2011, available at: http://web.worldbank.org/WBSITE/EXTERNAL/EXTDEC/
EXTDECPROSPECTS/EXTGDH/0,,menuPK:7933477~pagePK:64167702~piPK:64167676~theSitePK:7933464,00.html.4 The United Nations Economic and Social Commission for Asia and the Pacific (ESCAP) consists of 62 member and associate
member countries from both Asia and Pacific island states. For the purpose of this paper and because they are more relevant, the state of play of Coordinated border management in various subregions of Asia has been discussed.
5 The resolution can be accessed at: www.unescap.org/ttdw/Publications/TIS_pubs/pub_2182/tarns_annex1.pdf.6 The Busan Declaration on Transport Development in Asia and the Pacific can be accessed at the ESCAP website: www.
unescap.org/ttdw/common/TIS/TAR/text/busan_declaration_11nov06.pdf.7 Details of the agreement are available at: www.unescap.org/ttdw/common/tis/ah/IGA_intro.asp.8 Details of the agreement are available at: www.unescap.org/ttdw/common/TIS/TAR/tar_home.asp.9 The professional drivers collect the data about the conditions of international road transport during commercial deliveries and
data is analysed using the time-cost methodology of ESCAP. Detailed information is available at: www.iru-nelti.org/index/en_index.
10 The European Union’s BOMCA, Phase 7, Description of Action, p. 12, Programme Strategy for IBM: ‘Intra-agency and inter-agency and international cooperation to provide for effective and efficient processing of people and goods and increased security throughout Central Asia; Adequately equipped international border crossing point at strategic locations, where responsibilities of staff of Border crossing, Customs and other agencies involved in the border management are clearly defined and understood and executed professionally and efficiently and where the above conditions apply, joint cross border control procedures will be speeded up and Customs revenue increased; Legal trade and transit will be facilitated and transit times reduced; Illegal trafficking will be made more difficult and interdiction of contraband increased; Staffing level and associated costs will be reduced; Opportunities for corruption will be reduced through joint border control’.
11 CAREC is a partnership of 10 countries of Central Asia and six multilateral institutions. It promotes development in the region through regional economic cooperation. It focuses on energy, transport, trade facilitation, and trade policy. The trade facilitation program has two major components of work: customs cooperation and integrated trade facilitation.
12 CAREC Transport and trade facilitation progress and work plan 2010-2011, p. 4, para. 25, www.carecinstitute.org/uploads/events/2010/SOM-Oct/Progress-Report-Transport-and-Trade-Facilitation.pdf.
13 Based on the presentation made Mr Hasan Boze, Ministry of Transport, Turkey at the ‘Regional Meeting on Cooperation for Facilitation of International Road Transport’ held in Beijing, 30 May to 1 June 2011, www.unescap.org/ttdw/common/Meetings/TFS/2011Regional-Road-Tx/Countries/Turkey.pdf.
14 The MOU is available at: www.adb.org/Documents/Others/GMS-Agreement/MOU-Poipet-Aranyaprathet.pdf.15 United Nations Conference on Trade and Development 2008, Technical Note No. 14, Border Agency Coordination/Cooperation,
p. 2.16 De, Khan & Chaturvedi 2008.17 The details are available in Facility No. 02/2011 issued by Shillong Customs, http://shillongCustoms.nic.in/facility_2_2011.
pdf.18 The brief on integrated check posts is available at the Ministry of Home Affairs, http://mha.nic.in/pdfs/BM-DQR-280611.pdf.19 An Authorised Economic Operator (AEO) is a stakeholder in international trade whose activities have been approved by
national customs administrations as complying with the World Customs Organization’s (WCO) SAFE Framework of Standards to Secure and Facilitate Global Trade (SAFE Framework). More information is available at: www.wcoomd.org/files/1.%20Public%20files/PDFandDocuments/Procedures%20and%20Facilitation/safe_package/safe_package_I.pdf.
20 The Islamic Republic of Iran acceded to the convention on 20 July 2011, taking the total number of contracting parties to the Revised Kyoto Convention to 77. For more information, see www.wcoomd.org/press/default.aspx?lid=1&id=267.
21 The details of ten building blocks are available at: www.wcoomd.org/files/1.%20Public%20files/PDFandDocuments/Speeches_Reports/2008/CLECAT%203%20Dec%202008.pdf.

Volume 6, Number 1 75
World Customs Journal
Sandeep Raj JainSandeep Raj Jain is Economic Affairs Officer, Transport Facilitation and Logistics Section, Transport Division, United Nations Economic and Social Commission for Asia and the Pacific (ESCAP), Bangkok. Prior to joining ESCAP, Sandeep worked for more than a decade with Indian Customs where he was involved in the implementation of various customs modernisation initiatives including developing a database of imported goods to implement the World Trade Organization’s agreement on Customs Valuation. Sandeep is a mechanical engineer and holds an MBA from India. In 2009, he graduated, with fellowship, in International Affairs from the School of International and Public Affairs, Columbia University, New York.

76 Volume 6, Number 1
International Network of Customs Universities

Section 2
Practitioner Contributions
78 Volume 6, Number 1
International Network of Customs Universities
Volume 6, Number 1 79
World Customs Journal
The Time Release Study as a performance measurement tool for a supply chain and an
international corridorShingo Matsuda
Abstract
This paper provides an introduction to the Time Release Study (TRS) Guide Version 21 developed by the World Customs Organization (WCO) in 2011. It includes an overview and new aspects of the WCO TRS Guide and examples of TRS results. The paper also covers the main focus of the TRS and explores ways of using the TRS methodology in an international environment to measure the performance of a supply chain and an international corridor which are key to further strengthening regional cooperation and integration.
1. IntroductionGlobalisation has brought about a dramatic increase in cross-border trading. As a result there has been an equally important focus on trade and regulatory processes conducted at the border to ensure they are optimised and that the time required for trade-related procedures is reduced, where appropriate. Just-in-time delivery of goods has grown in importance for businesses and brings significant benefits to all parties involved in the supply chain. Customs administrations have endeavoured to harmonise and simplify their procedures through international standards such as the World Customs Organization’s (WCO) Revised Kyoto Convention,2 the WCO Data Model version 3.0,3 and widespread use of information and communications technology (ICT). More recently, heightened dialogue has been established between the trading community and Customs. Indeed, the trading community is increasingly working in partnership with Customs to deliver common solutions in response to these critically important trade facilitation objectives.
Customs administrations have also been making efforts to streamline interagency procedures at borders. In order to ensure that facilitation measures are being applied effectively, a Time Release Study (TRS) has been used to improve the performance of the function being measured. A TRS is a unique tool and method for measuring the actual performance of border activities, and customs procedures in particular, as they directly relate to trade facilitation at the border. In 2011 the WCO revised its ‘Guide to Measure the Time Required for the Release of Goods’ (TRS Guide) in order to keep pace with current developments in international trade transactions.
2. BackgroundA TRS is a systematic and standard method to measure the average time taken to release cargoes and for each step or intervention in a border procedure.4 A TRS thereby measures relevant aspects of the effectiveness of operational procedures that are carried out by Customs and other regulatory actors in the standard processing of imports, exports and in transit movements. It seeks to measure these elements of trade flows with accuracy so that related decisions aimed at improving such performance can be properly conceived and implemented.

80 Volume 6, Number 1
International Network of Customs Universities
The WCO developed the original TRS Guide in 2001 in order to advise its Member customs administrations wishing to undertake a TRS. Increasingly, a TRS is considered as a useful tool for identifying opportunities to improve border-related procedures so as to achieve further efficiency and effectiveness.5 It has become one of the key performance indicators (KPIs) for measuring the effectiveness of border management.6 It is also considered as one of the methods of measuring performance in a customs context contributing to successful modernisation.7
Reference has also been made to the WCO TRS in the current Trade Facilitation Negotiations taking place within the World Trade Organization (WTO) as part of the Doha Development Round. Some WTO Members have suggested including the provision on ‘Release Time of Goods’8 in a future Trade Facilitation Agreement. The WTO’s current Draft Consolidated Negotiating Text on Trade Facilitation includes a provision on ‘Establishment and Publication of Average Release Time’ in which specific reference is made to the WCO TRS as a tool for that purpose.9
Nevertheless, in March 2010 WCO Members shared the view that there was scope for updating the original TRS Guide and decided to commence work to that effect, in response to the procedures and practices currently in place in many countries. As a result, the TRS Guide was updated and re-launched in October 2011 as the WCO TRS Guide Version 2.10
3. Recent developments in terms of the implementation of the WCO TRSThe WCO TRS has also been acknowledged as a useful performance measurement tool in the trade facilitation domain by international institutions and donors such as the World Bank, the Asian Development Bank (ADB), the United States Agency for International Development (USAID), the Swedish International Development Cooperation Agency (SIDA) and Japan International Cooperation Agency (JICA).
According to the World Bank:
A component of the Customs and Trade Facilitation Project is the Time Release Study. The purpose of the study is to measure the time between the arrival and release of goods ... and examine the procedures and agencies involved. ... The baseline data from the study will then be used to determine the efficiency of customs clearance and streamline the process. The expected outcomes include: a reduction in the duplication of forms, reduced time (for goods to clear Customs) and improved system of information sharing amongst agencies.11
USAID pointed out that:
A TRS is an effective diagnostic tool for identifying inefficiencies in the customs clearance process and determining necessary infrastructure, policy and process improvements as it assesses the time elapsed at each stop in the cargo release process.12
While the ADB stated that:
The TRS is not a solution but a useful tool for (1) diagnostics on validating issues to inform interventions and (2) monitoring on setting baseline and measurable performance improvements.13
Based on this acknowledgment, international institutions and donors have been helping recipients to conduct a TRS. For example, the World Bank has been supporting many countries including those in the Middle East and in Africa, while the ABD has been supporting numerous Asian countries including those in Central Asia. SIDA has been supporting East and Southern African countries, while JICA has been providing ASEAN countries with support.14
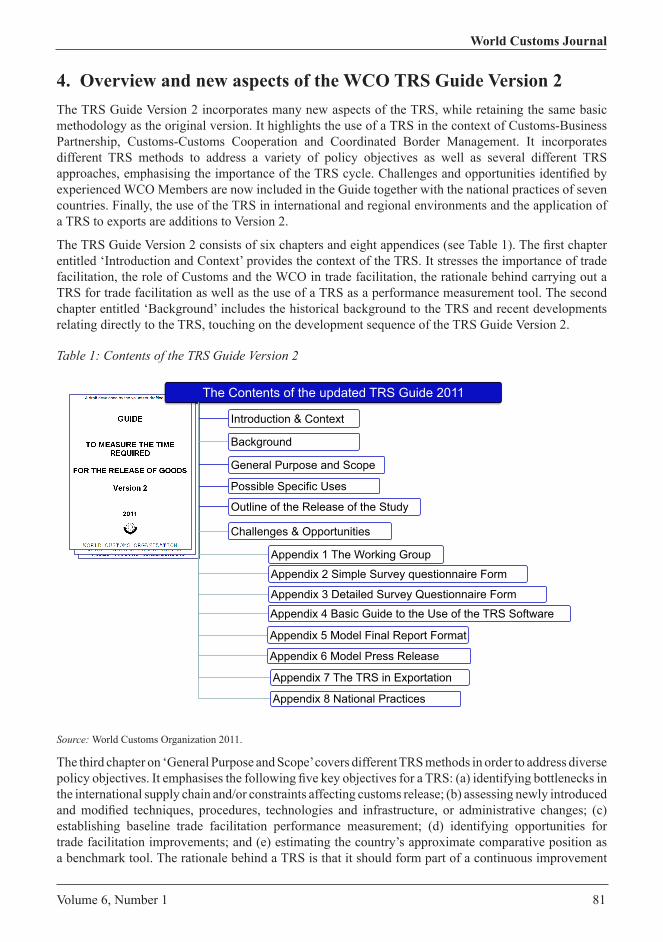
Volume 6, Number 1 81
World Customs Journal
4. Overview and new aspects of the WCO TRS Guide Version 2The TRS Guide Version 2 incorporates many new aspects of the TRS, while retaining the same basic methodology as the original version. It highlights the use of a TRS in the context of Customs-Business Partnership, Customs-Customs Cooperation and Coordinated Border Management. It incorporates different TRS methods to address a variety of policy objectives as well as several different TRS approaches, emphasising the importance of the TRS cycle. Challenges and opportunities identified by experienced WCO Members are now included in the Guide together with the national practices of seven countries. Finally, the use of the TRS in international and regional environments and the application of a TRS to exports are additions to Version 2.
The TRS Guide Version 2 consists of six chapters and eight appendices (see Table 1). The first chapter entitled ‘Introduction and Context’ provides the context of the TRS. It stresses the importance of trade facilitation, the role of Customs and the WCO in trade facilitation, the rationale behind carrying out a TRS for trade facilitation as well as the use of a TRS as a performance measurement tool. The second chapter entitled ‘Background’ includes the historical background to the TRS and recent developments relating directly to the TRS, touching on the development sequence of the TRS Guide Version 2.
Table 1: Contents of the TRS Guide Version 2
Source: World Customs Organization 2011.
The third chapter on ‘General Purpose and Scope’ covers different TRS methods in order to address diverse policy objectives. It emphasises the following five key objectives for a TRS: (a) identifying bottlenecks in the international supply chain and/or constraints affecting customs release; (b) assessing newly introduced and modified techniques, procedures, technologies and infrastructure, or administrative changes; (c) establishing baseline trade facilitation performance measurement; (d) identifying opportunities for trade facilitation improvements; and (e) estimating the country’s approximate comparative position as a benchmark tool. The rationale behind a TRS is that it should form part of a continuous improvement
The Contents of the updated TRS Guide 2011
Introduction & Context
Background
General Purpose and Scope
Possible Specific Uses
Outline of the Release of the Study
Challenges & Opportunities
Appendix 1 The Working Group
Appendix 2 Simple Survey questionnaire Form
Appendix 3 Detailed Survey Questionnaire Form
Appendix 4 Basic Guide to the Use of the TRS Software
Appendix 5 Model Final Report Format
Appendix 6 Model Press Release
Appendix 7 The TRS in Exportation
Appendix 8 National Practices

82 Volume 6, Number 1
International Network of Customs Universities
cycle. It is never a standalone exercise.15 The chapter also stresses that a TRS should not be undertaken as a one-off activity, but should rather form part of a continual exercise.
Chapter 4 on ‘Possible Specific Uses for the Study Results’ illustrates several specific uses of a TRS. It highlights the possible utilisation of the TRS results for a number of useful purposes such as (1) structural reform measures within an administration; (2) simplification and harmonisation of customs procedures; (3) automation and modernisation of Customs; (4) diagnosis of the efficiency of specific customs and border procedures such as the Authorised Economic Operator (AEO) Program, AEO Mutual Recognition, Risk Management Technique and/or Single Window; (5) reallocation of resources for optimal utilisation; (6) improving customs transparency; and (7) modernisation programs, capacity building activities and/or Coordinated Border Management programs.
Chapter 5 entitled ‘Outline of the TRS’ addresses a phased approach to undertaking a TRS. It describes the standard application of the WCO TRS methodology and provides guidance to WCO Members so that they can carry it out in a systematic manner. The first phase, known as the preparation phase, covers the decision-making process for implementation of the TRS. The importance of establishing a working group is highlighted in order to determine the scope and design of the study with accuracy. It also covers the planning methodology, including the sampling method, and detailed TRS arrangements such as time and duration, geographical scope, choice of traffic and scope of the goods. The second phase, namely data collection and recording, includes guidance for the working group in order to take account of several key factors including data capture methods, parties engaged and the customs information system. The last phase encompasses data analysis and conclusions. The Guide covers the process of verification and analysis of data and the drafting of a final report, press release and proposals for improvement.
Chapter 6, entitled ‘Challenges and Opportunities’, is the last chapter and is new. It provides examples of challenges and opportunities encountered by WCO Members while carrying out their TRS. It
Examples of the results of a TRS (1)
The Australian Customs and Border Protection Service has conducted an annual TRS since 2007. The data required for a TRS is obtained from customs systems that capture timestamps for key events in the movement of cargoes and in the clearance process. Customs also obtains supplementary data from businesses. Table 2 contains the results of a TRS on sea cargoes carried out in 2007. It shows the average time for each intervention and the average clearance time by type of good.
Table 2: Australian TRS 2007
Source: Time Release Study 2007, Australian Customs Service and the WCO TRS Guide Version 2.
The objective of the TRS was to measure and monitor clearance performance with a view to identifying opportunities for further improvement. It admitted that TRS results and follow-up analysis have helped identify opportunities by providing a more complete view of the operating environment.16
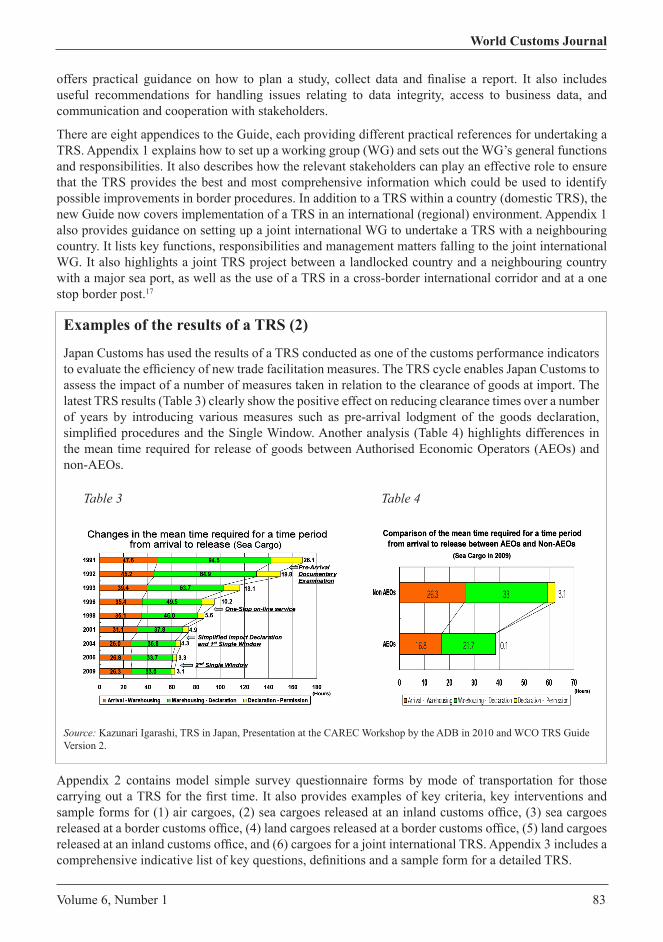
Volume 6, Number 1 83
World Customs Journal
offers practical guidance on how to plan a study, collect data and finalise a report. It also includes useful recommendations for handling issues relating to data integrity, access to business data, and communication and cooperation with stakeholders.
There are eight appendices to the Guide, each providing different practical references for undertaking a TRS. Appendix 1 explains how to set up a working group (WG) and sets out the WG’s general functions and responsibilities. It also describes how the relevant stakeholders can play an effective role to ensure that the TRS provides the best and most comprehensive information which could be used to identify possible improvements in border procedures. In addition to a TRS within a country (domestic TRS), the new Guide now covers implementation of a TRS in an international (regional) environment. Appendix 1 also provides guidance on setting up a joint international WG to undertake a TRS with a neighbouring country. It lists key functions, responsibilities and management matters falling to the joint international WG. It also highlights a joint TRS project between a landlocked country and a neighbouring country with a major sea port, as well as the use of a TRS in a cross-border international corridor and at a one stop border post.17
Appendix 2 contains model simple survey questionnaire forms by mode of transportation for those carrying out a TRS for the first time. It also provides examples of key criteria, key interventions and sample forms for (1) air cargoes, (2) sea cargoes released at an inland customs office, (3) sea cargoes released at a border customs office, (4) land cargoes released at a border customs office, (5) land cargoes released at an inland customs office, and (6) cargoes for a joint international TRS. Appendix 3 includes a comprehensive indicative list of key questions, definitions and a sample form for a detailed TRS.
Examples of the results of a TRS (2)
Japan Customs has used the results of a TRS conducted as one of the customs performance indicators to evaluate the efficiency of new trade facilitation measures. The TRS cycle enables Japan Customs to assess the impact of a number of measures taken in relation to the clearance of goods at import. The latest TRS results (Table 3) clearly show the positive effect on reducing clearance times over a number of years by introducing various measures such as pre-arrival lodgment of the goods declaration, simplified procedures and the Single Window. Another analysis (Table 4) highlights differences in the mean time required for release of goods between Authorised Economic Operators (AEOs) and non-AEOs.
Table 3 Table 4
Source: Kazunari Igarashi, TRS in Japan, Presentation at the CAREC Workshop by the ADB in 2010 and WCO TRS Guide Version 2.

84 Volume 6, Number 1
International Network of Customs Universities
Appendix 4 has been added to provide basic guidance on the use of the WCO TRS Online Software,18 while Appendices 5 and 6 contain, respectively, a model final report format and a model press release format.
Appendix 7 describes the application of the WCO TRS to exports. It is stressed that consideration should be given to a TRS in relation to exports in order to respond to the interests and concerns of business stakeholders, especially as the majority of studies undertaken in the past applied only to imports. The export performance in a given international region such as an international corridor could be measured by a TRS relating to exports in combination with a TRS relating to transit.
Finally, Appendix 8 includes a list of recent TRS case stories. Experiences in Australia, Cameroon, Japan, Korea, New Zealand, Serbia and Uganda have been compiled as a national practice catalogue of WCO Members.
Examples of the results of a TRS (3)
The Uganda Revenue Authority (URA) launched a TRS project in order to ascertain where problems existed in the clearance process, and to identify the types of problems, the reasons for the problems and possible solutions to them. With the support of the WCO, the URA completed the project and compiled a TRS report in 2008 which includes various recommendations to enhance the efficiency of Uganda’s border procedures. The study was conducted at selected customs stations and data was collected over a period of seven (7) days using a questionnaire developed for the purpose. Table 5 shows one of the results of the final report, highlighting the difference in average release times at the border customs office and at the inland customs office.
Table 5
Source: OECD, Aid for Trade Case Story19 and the WCO TRS Guide Version 2.
Although the URA had put some initiatives in place to improve the system, time measurement had not been carried out to assess the impact of the initiatives implemented, though some estimated times were always reported. It was pointed out that the TRS results showed a completely different processing time from the estimated one. The URA stressed the importance of scientifically derived results.

Volume 6, Number 1 85
World Customs Journal
5. Focus of the new WCO TRS GuideSeveral approaches have been developed by different organisations to measure the performance of trade facilitation. These include the Doing Business Survey,20 the Logistics Performance Indicator (LPI)21 and the Trade and Transport Facilitation in Southeast Europe Program (TTFSE)22.
The KPIs included in such performance measurement tools essentially consist of (a) time, (b) cost and/or (c) procedure.
The time component (a) may cover (1) the total time necessary for the entire trade transaction, (2) the time required for processes related to documentation, (3) the clearance time at the border, and (4) the time taken for intervention, such as physical intervention by border agencies including Customs.
The cost component (b) may address (1) the total trade cost for business, (2) the total cost for import, export and/or transit, (3) the total cost of charges in a port, terminal, airport or at a land border crossing, and (4) the total cost of duties and taxes.
Finally, the procedure component (c) may include (1) the total number of documents (steps) to establish or maintain trade business, (2) the total number of documents required for each trade transaction, (3) the total number of documents necessary for each clearance at the border, and (4) the total number of border agencies with which one has to deal (total number of interventions required) for specific transactions.23
The main focus of the WCO TRS is the clearance time at the border [(a)(3)], although it is also applicable to the time required for processes related to documentation [(a)(2)] and to the time taken for intervention [(a)(4)] depending on the scope and design of the TRS. The WCO TRS methodology is simple and usually applied to the time from arrival of the means of transportation at the border (airport, seaport or land border crossing) to the time of release of goods to stakeholders, such as a clearing agent or importer.
Another means of sharpening the focus of a TRS is to use a supply chain reference model such as the one developed by UN/CEFACT.24 Generally speaking, an international trade transaction can be divided into five (5) key basic steps:
(1) Commercial procedure: establishment of a sales contract, issuance of a purchase order/delivery order, issuance of a delivery note and generation of a payment note/invoice.
(2) Regulatory procedure for export in the country of origin: a process to obtain an export licence or permission, lodgment of the export declaration to Customs and obtaining release status.
(3) Transport procedure: establishment of the transport contract, domestic transport of goods, loading of goods, issuance of an airway bill and/or bill of lading, port departure process, international transport and port arrival process.
(4) Regulatory procedure for import in the county of destination: lodgment of cargo declaration (advanced cargo information), procedure to obtain an import licence or permission, lodgment of the import declaration to Customs and obtaining release status.
(5) Financial procedure: debit and credit controls, an insurance-related process, payment of duties and taxes, payment of charges and work relating to the financial statement.
These steps are often interlinked but may also be separate. The sequence of the steps can also be altered depending on the business relationship and on special procedures such as the lodgment of a cargo declaration to a destination country prior to the loading of the goods in the country of origin, the lodgment of a customs declaration at import prior to the arrival of the goods and deferred payment.
The TRS methodology is primarily designed to measure the time required for release of goods. Although the principles of the Guide can be applied to other purposes covered by the above five steps, the WCO TRS guide mainly focuses on the regulatory procedures for import, export and transit in the countries of origin and destination.

86 Volume 6, Number 1
International Network of Customs Universities
The regulatory procedure generally comprises four components: (1) port (airport or land border) procedure, (2) customs procedure, (3) procedure governed by border agencies, and (4) business procedures. The trade involves not only Customs but also many other stakeholders such as the port (airport) authority, security authority, quarantine authority, veterinary authority, health agency, standards board as well as concerns including clearing agents, brokers, forwarders, integrators, carriers and financial institutions. The WCO TRS consequently places the spotlight on all four procedures.
During these procedures, the targeted time for a study can be further subdivided into four components: (1) preparation time, (2) waiting time, (3) transmission time, and (4) processing time. Preparation time (1) is the time required to generate or obtain information such as the particulars of a transaction for the customs declaration or import/export certificate and to produce documentation for border procedures. The time taken for standard operations to preserve and maintain the quality of goods for import and export is also included in this time component. The waiting time (2) is the time spent waiting for border procedures or the next stage of procedures to commence as a result of a long queue or transport congestion. Transmission time (3) refers to the time taken to send information or documents to border agencies. The application of ICT to border procedures, such as the use of a Single Window, contributes to facilitating this part of the process. The processing time (4) is the time used by Customs and other border agencies to process goods and includes the time required for the physical inspection of goods, checking the goods against documents and examination of documents.
Business practices may also cause delays. For example, the owner of the goods may decide to keep them at a port facility within a customs controlled area after they have been released because their contact with the port operator enables them to store the goods free of charge for a certain period. An importer may seek out a customer to whom they can sell an imported good after its arrival in order to pay the duties. Goods released by border agencies may also remain in a customs controlled area as a result of the time required to arrange domestic transportation for domestic cargo.25
The WCO TRS Guide addresses the four time components mentioned above as well as the time component for business operations related to border procedures, while focusing in greater depth on procedural aspects described in the processing time (4), given that it was initially developed as a customs tool encompassing procedures by border agencies as well as business practices.
6. New trend in using the WCO TRS in an international environment
6.1 Application of the TRS in order to assess supply chain performance
Although a number of TRS projects have been undertaken throughout the world, the use of the TRS in an international environment is a relatively new concept. One example is the Trans-Tasman TRS26 carried out in 2010 as a joint effort by the Australian and New Zealand Customs Services in order to identify opportunities for streamlining trade between the two countries under bilateral arrangements for closer economic relations. Customs officers in both Services worked together to establish the scope of the TRS, including common definitions of subject cargoes and key clearance events, and to analyse the results. Other border agencies were also engaged to verify their clearance times. Supplementary data was also obtained from business.
The study scope encompassed four border procedures covering trade in both directions: (1) Australian export clearance for cargoes to New Zealand, (2) New Zealand import clearance for cargo from Australia, (3) New Zealand export clearance for cargoes to Australia, and (4) Australian import clearance for cargoes from New Zealand.

Volume 6, Number 1 87
World Customs Journal
Table 6: Sea cargo timelines – (1) Australia to New Zealand
Source: Trans-Tasman Time Release Study, Australian Customs and Border Protection Service and New Zealand Customs Service 2010, Table 16, p. 20.
Table 7: Sea cargo timelines – (2) New Zealand to Australia
Note: The negative number indicates that cargo has, on average, been released or cleared before it is physically received into customs control based on advanced information provided by traders.Source: Trans-Tasman Time Release Study, Australian Customs and Border Protection Service and New Zealand Customs Service 2010, Table 17, p. 21.
The TRS produced a wealth of valuable results which were analysed in the final report. One outcome, namely the specific nature of the joint international TRS for sea cargoes, is clearly highlighted in Tables 6 and 7. The Trans-Tasman TRS process began when the cargo was delivered for customs control at export in the country of origin and ended when the goods were available for delivery for domestic use (release) in the country of destination. The final report pointed out that the requisite time periods for the physical movement of cargoes between Australia and New Zealand were very similar in both directions, with the average delivery time for sea cargo from the place of export in the country of origin to the place of unloading in the port of the country of destination being less than nine days. It was also observed
20 Trans-Tasman Time Release Study
End-to-end timelines
The following diagrams show average end-to-end processing and movement times for trans-Tasman cargo. Times for document reporting and customs clearance status are overlaid on the physical transport process.
For this study, the time taken to trade across the Tasman starts when cargo is delivered into customs
control for export and ends when the goods are cleared and available for delivery into home consumption in the country of importation. Transit time, although outside customs domain, has been included to complete the end-to-end views.
A timeline is provided for each direction of trade and mode of transport.
Sea cargo timelines
Table 16: Australia to New Zealand – sea cargo
Release -2.3 days
Clearance -0.9 days
Australia to New Zealand – Sea cargo
Cargo Delivery
AU Departure NZ Arrival NZ Delivery AU Port Receipt
Gate Out 2.9 days
Lodgement -2.4 daysLodgement -6.1 days
Departure 3.9 days Availability 0.4 days
Transit 3.5 daysExport Declaration
Transport Cargo TerminalCargo TerminalCargo Consigned
Clearance 0.0 days
10 111 2 3 4 5 6 7 8 9
Days
NZ Import Declaration
Trans-Tasman Time Release Study 21
Table 17: New Zealand to Australia – sea cargo
Lodgement -3.1 days
New Zealand to Australia – Sea cargo
NZ Departure AU Arrival AU DeliveryNZ Port Receipt
Departure 4.4 days Availability 0.6 days
Transit 3.8 daysExport Declaration
Release -0.5 days
10 111 2 3 4 5 6 7 8 9
Days
Clearance -0.1 daysClearance 0.8 days
Gate Out 3.2 days
AU Import Declaration
Cargo DeliveryTransport Cargo TerminalCargo TerminalCargo Consigned
Lodgement 0.8 days
Sea cargo observationsExport reporting – it should be noted that differences in legislative requirements between the two jurisdictions drive differing reporting practices and sequences. Details of the respective processes including prescribed timings for reporting are available at Appendix C. Cargo exported from Australia must be declared to customs before receipt at the place of export. Consequently it is declared earlier than cargo exported from New Zealand which may be delivered to a place of export before formal declarations to customs are made.
Export clearance – the interval between receipt at the port of loading and departure time includes any examinations by customs. The time taken for examinations rarely impedes cargo movement. The proportion of export cargo selected for examination is less than two per cent on both sides of the Tasman. Virtually all cargo out of Australia is cleared immediately once it is received for export. Cargo exported from New Zealand is cleared later because it is declared later, however there is no evidence that this leads to delays in the physical movement and loading of cargo.
Export dwell time – the differences in the timing of export declarations don’t appear to impact the timing of physical export. In both countries, on average trans-Tasman sea cargo is placed into customs control around four days prior to vessel departure. This is considerably less than the export dwell time for trade with other economies, indicating a degree of ‘just-in-time’ activity by trans-Tasman traders and shows their expectation that the transport and border clearance processes will be completed in a timely manner.
Import reporting – in both countries, the majority of cargo is reported and declared in advance of arrival enabling customs to complete their risk assessments and processing early. While the rate of early declaration is slightly higher in Australia, more cargo is impeded at the time of arrival than in New Zealand. This reflects the impact on cargo which is reported late in Australia of a fixed period applied for the completion of risk assessment.

88 Volume 6, Number 1
International Network of Customs Universities
that, on average, import cargo remained in the cargo terminal (customs controlled area) for more than two days after completion of border procedures for the delivery of goods for domestic use prior to being physically removed from the cargo terminal.
The report concluded that the results of the study had helped identify factors contributing to performance levels and the reasons for differences in performance between the two countries. It identified a number of opportunities to further streamline border procedures. Advance cargo reporting, information for small and medium-sized traders, regulatory harmonisation, data harmonisation and risk management were all highlighted as potential areas for improvement.
This study effectively explains how the TRS can be used for assessment of performance in terms of supply chain efficiencies and the integration of border procedures between two countries. It provides Customs, other border agencies, businesses and policymakers with baseline data relating to the supply chain and integration of border procedures. It will also serve as a performance measurement tool for these two purposes if undertaken on a regular basis.
6.2 Application of the TRS for assessing the performance of an international corridor
Another example of the application of the WCO TRS in an international environment is a pilot TRS to be carried out in a northern corridor of the East African Community (EAC). It is based on a regional need to measure the performance of an international corridor. In 2011, EAC Members agreed to undertake a pilot TRS in part of a northern corridor from Mombasa sea port in Kenya to an inland customs office in Kampala, Uganda with technical support from the WCO, based on the WCO TRS Guide Version 2. Given that cooperation in trade liberalisation and development is one of the fundamental pillars of the EAC,27 the study of an international corridor for further trade facilitation is fully in keeping with its priorities. The pilot will cover both inward cargoes from non-EAC Countries to Kampala through Mombasa sea port and outward cargoes from Kampala in Uganda to non-EAC countries through Mombasa sea port. The objective of the pilot project is to identify bottlenecks in the flow of cargoes by measuring the average time of each intervention from/to Mombasa to/from Kampala. The geographical scope and key interventions in terms of the inward flow of cargoes are illustrated in Table 8 below.
After a regional TRS workshop as a kick-off event, the EAC undertook a field study visit to each place of intervention in Mombasa, Malaba and Kampala as well as to weighbridges in the northern corridor. The study team drove from Mombasa to Kampala in order to identify the detailed procedures at each point and, based on the findings of the field visit, they began designing a survey questionnaire which is essential for conducting a pilot TRS. The EAC agreed to start data collection in early 2012 and to finalise the pilot TRS. The outcome of the pilot will include not only findings, but also several policy recommendations for trade facilitation in the northern corridor to be presented to high-level government officials for their consideration. Once the pilot has been successfully completed, the EAC will roll out the same TRS methodology to all corridors in the EAC.

Volume 6, Number 1 89
World Customs Journal
Table 8: Map of the pilot EAC TRS project and the process flow on inward cargoes from Mombasa to Kampala
7. ConclusionsTime release data represents a powerful performance assessment tool making it possible to measure the effectiveness of customs services and to monitor progress. It leads to the development of a detailed diagnostic of the time required and to the identification of potential corrective actions. Measurement of time release is a worthwhile exercise as it can establish a pre-reform benchmark and thus help in assessing progress made by modernisation initiatives.28 Beyond the traditional acknowledgment of the use of a TRS within a national environment, it can also be applied to an international environment. The new WCO TRS Guide Version 2 offers clear guidance on how to use it to assess the performance of the international supply chain and international corridors with a view to enhancing regional cooperation, collaboration and integration.
Source: Google maps (satellite image), Mombasa, Coast, Kenya to Kampala, Central Region, Uganda, http://maps.google.com/
Source: Report of the ‘Regional Pilot Time Release Study Pre-Survey Tour Mombasa-Kampala (EAC/TF/167/2011)’, September 2011, Directorate of Customs & Trade, EAC Secretariat.

90 Volume 6, Number 1
International Network of Customs Universities
Notes1 The WCO TRS Guide Version 2 is available at: www.wcoomd.org/files/1.%20Public%20files/PDFandDocuments/
Procedures%20and%20Facilitation_2/instruments/Final%20TRS%20Guide%20Version%20II%20EN.pdf.2 International Convention on the Simplification and Harmonization of Customs Procedures (as revised), www.wcoomd.org/
Kyoto_New/Content/content.html.3 The WCO Data Model is a set of carefully combined data requirements that are mutually supportive and which will be updated
on a regular basis to meet the procedural and legal needs of cross-border regulatory agencies, such as Customs, controlling export, import and transit transactions, www.wcoomd.org/home_pfoverviewboxes_tools_and_instruments_pftoolsdatamodel.htm.
4 Shujie Zhang 2009, ‘TRS as a measurement of trade facilitation: Customs’ experience in the Asia-Pacific Region’, World Customs Journal, vol. 3, no. 2, pp. 125-34, www.worldcustomsjournal.org/media/wcj/-2009/2/WCJ_V3N2_Zhang.pdf.
5 As far as the WCO is aware, the following countries have undertaken a TRS: Australia, Brunei, Cameroon, China, Indonesia, Jamaica, Japan, Jordan, Kenya, Korea (Republic of), Lao People’s Democratic Republic, Lesotho, Malawi, Malaysia, Mozambique, New Zealand, Philippines, Rwanda, Serbia, Swaziland, Tanzania, Thailand, Uganda, Vietnam, Zambia.
6 Stephen Holloway 2010, ‘Measuring the effectiveness of border management: designing KPIs for outcomes’, World Customs Journal, vol. 4, no. 2, pp. 37-54, www.worldcustomsjournal.org/media/wcj/-2010/2/Holloway.pdf.
7 Robert Ireland, Thomas Cantens and Tadashi Yasui 2011, ‘An overview of performance measurement in customs administrations’, WCO Research Paper No. 13, www.wcoomd.org/files/1.%20Public%20files/PDFandDocuments/research/13_Performance_Measurement_2011.pdf.
8 World Trade Organization (WTO) 2006, Communication from the European Communities, Japan, Korea, Mongolia, and the Separate Customs Territory of Taiwan, Penghu, Kinmen and Matsu, TN/TF/W/101, http://docsonline.wto.org/GEN_viewerwindow.asp?http://docsonline.wto.org:80/DDFDocuments/t/tn/TF/W101.doc.
9 WTO 2011, Draft Consolidated Negotiating Text, WTO Negotiating Group on Trade Facilitation, TN/TF/W/165/Rev.11, http://docsonline.wto.org/GEN_viewerwindow.asp?http://docsonline.wto.org:80/DDFDocuments/t/tn/TF/W165R11.doc.
10 World Customs Organization (WCO) 2011, Guide to measure the time required for the release of goods: Version 2, WCO, Brussels.
11 The World Bank 2009, In Laos, Issue 12, July-August, http://siteresources.worldbank.org/INTLAOPRD/Resources/ 293582-1202380919879/Newsletter_Issue12_English.pdf.
12 USAID, Success Story, www.satradehub.net/index.php?option=com_rsfiles&view=files&layout=view&tmpl=component&path=Archive%2FSuccess+Stories%2F2007%2FSuccess+Story+TRS.pdf.
13 Nguyen Ba Hung, Regional Cooperation Specialist of the ADB, ‘Using Time Release Studies in Trade Facilitation’, Presentation at the CAREC TRS Workshop by ADB, 2011, www.carecinstitute.org/uploads/events/2011/CAREC-Time-Release-Study-Workshop/BIMP-EAGA-Experience-Time-Release-Studies.pdf.
14 Those are not exhaustive and based on internal research by the WCO Secretariat.15 See Note 4.16 Michael Carmody, CEO Australian Customs and Border Protection Service 2011, ‘Customs in the 21st century: effective
border controls and trade facilitation’, Shipping Australia, Autumn, pp. 94-7.17 One Stop Border Post : A border post at which all traffic utilising the border post stops only once in each direction of travel and
both exit and entry procedures are undertaken from within the same control zone, The East African Community Proposed One Stop Border Posts Bill, 2010.
18 The WCO TRS Online Software: An internet-based application for creating a database for the WCO TRS. The application has been developed to provide Members with software to create the questionnaires that are used in conjunction with the study and to produce reports indicating the average times and standard deviation for each step in the process of releasing goods, http://members.wcoomd.org/trs/index.asp.
19 OECD 2011, Aid for Trade Case Stories: Global Review, www.oecd.org/dataoecd/6/53/47799918.pdf.20 Doing Business: World Bank is a report analysing regulations that apply to an economy’s businesses during their life cycle,
including start-up and operations, trading across borders, paying taxes, and resolving insolvency. Although the ‘Doing Business’ analysis is comprehensive, it does not cover all aspects of the business environment such as security, macroeconomic stability, corruption, the level of skills, or the strength of financial systems. For more details, see www.doingbusiness.org/.
21 The World Bank’s Logistics Performance Indicator (LPI) is an interactive benchmarking tool created to help countries identify the challenges and opportunities they face in their trade logistics performance and what they can do to improve their performance. The LPI is based on a worldwide survey of operators on the ground, providing feedback on the logistics ‘friendliness’ of the countries in which they operate and those with which they trade. For more details, see http://web.worldbank.org/WBSITE/EXTERNAL/TOPICS/EXTTRANSPORT/EXTTLF/0,,contentMDK:21514122~menuPK:3875957~pagePK:210058~piPK:210062~theSitePK:515434,00.html.

Volume 6, Number 1 91
World Customs Journal
22 TTFSE is a project supported by the United States and the European Union (EU). The World Bank has been implementing a project to help countries in the Balkan region improve their border crossing infrastructure and procedures. TTFSE’s aim is to reduce the costs and time of commercial transport of goods among the countries of Southeast Europe and, in so doing, to improve the environment for cross-border trade among TTFSE countries. For more details, see www.act.edu/index.jsp?CMCCode=2051&extLang=LG.
23 See Note 6.24 UN/CEFACT Trade Facilitation Implementation Guide Version III.25 Tadatsugu (Toni) Matsudaira, International Trade Department, World Bank, on Time Release Study Guide Review; for the
WCO Permanent Technical Committee, October 2011.26 Trans-Tasman Time Release Study, a joint project of Australian Customs and Border Protection Service and New Zealand Customs
Service, October 2010, www.customs.govt.nz/news/resources/corporate/Documents/transtasmantimereleasestudy2010.pdf.27 EAC Treaty, Article 74.28 Luc De Wulf & José B Sokol (eds) 2005, Customs modernization handbook, World Bank, Washington, DC.
Shingo MatsudaShingo Matsuda has been working as a Technical Officer in the WCO Compliance and Facilitation Directorate since 2009. He has been responsible for developing the WCO Time Release Study (TRS) Guide Version 2 and has been involved in many TRS projects worldwide, including regional (international) TRS with regional organisations. Prior to joining the WCO, Shingo spent 17 years with Japan Customs, working on a range of customs matters such as tariff policy and customs procedures as well as international affairs including customs mutual administrative assistance and Authorised Economic Operator (AEO) mutual recognition. He holds a Bachelor of Science from Tokyo University of Marine Science and Technology.

92 Volume 6, Number 1
International Network of Customs Universities

Volume 6, Number 1 93
World Customs Journal
The standardisation of customs services in the European Union
Ewa Gwardzińska
Abstract
Nowadays, customs services in international trade make an important contribution to the competitiveness of global companies, and the quality of the customs services provided can have a very real effect on companies’ performance. Accordingly, in this age of the information society and virtual economy, it is essential to ensure that customs services are provided on time and to a high standard.
1. e-Customs initiativeThe concept of an electronic environment for customs (e-Customs) was announced in 20041 and represented the culmination of a number of initiatives relating to the information society during the 1990s. These included ‘eEurope – An Information Society for All’ and ‘e-Government’,2 which resulted from a report published in 1994 titled ‘Europe and the Global Information Society’3 (the ‘Bangemann report’, Brussels, 1999).
This report presented the vision of e-commerce, which promised considerable benefits for both economic operators and citizens. The report outlined the following strategic factors: the release of ‘closed supply’, ‘effect of repetition’ and significant reduction in the costs of conducting business activities in a modern economy. A comparison of paper-based operations with their electronic equivalents encouraged economic operators to look at ways of overhauling costly and inefficient business operations and provided an indication of where the impending changes were heading. For example, the report claimed that an electronic order service would cost one-tenth of the paper-based equivalent, whereas using electronic services for business transactions would increase efficiency by reducing for example, fax costs by up to 95%.4 The findings in the report were quickly confirmed in practice.
In a Communication from the Commission (COM [2003] 567) dated 26 September 2003, Member States undertook to implement the concept of e-Europe—and e-Government in particular.5 This Communication was approved by a resolution of the Commission on 5 December and was referred to in the document ‘A Simple and Paperless Environment for Customs and Trade’.6 This formed part of a series of activities directed towards the simplification and rationalisation of regulations and customs procedures and application of effective working methods such as information technologies, risk analysis and advanced controls within the existing customs union.
As set out in the e-Customs Project,7 the main aims of e-Customs are as follows:
• limitation of customs charges• combating fraud, organised crime and terrorism • enhancement of goods and trade safety• elimination of paper documents• standardisation of functioning customs offices • protection of intellectual property rights and national cultural heritage • seamless flow of data between nations of exporter and importer.
94 Volume 6, Number 1
International Network of Customs Universities
The most important documents for the e-Customs initiative are the Multi-Annual Strategic Plan for Electronic Customs (MASP),8 and a Decision of the European Parliament and Council No. 70/2008/EC of 15 January 20089 on a paperless environment for Customs and trade (e-Decision). Governments of certain Member States are obliged to implement particular systems and customs union services according to specific requirements and an agreed schedule, and to ensure their seamless operation and development.
The MASP is a quasi-strategy for the customs union which specifies particular undertakings, a schedule of legislation as well as the implementation of organisational and IT works. This provides the e-Customs concept with solid technical, legal and organisational foundations. Apart from that, the document provides unified rules for 27 customs administrations operating as one entity within the customs union. It also creates favourable conditions for entrepreneurs by for example, offering the possibility of electronic data exchange (customs documents) between customs offices and applicants as well as between customs offices of different countries of the European Union (EU) with regard to centralised customs clearance, electronic supervision over transit under customs control within the EU, the Authorised Economic Operator (AEO) and unified criteria for risk analysis.
The Modernised Customs Code (MCC)10 contains new regulations which implement a number of simplifications and trade facilitation measures for both economic operators and customs administrations. However, the most important aspect regarding computer systems (that is, export and import control, the AEO joint database, risk management, integrated service and control of excised goods, system of securities and permits, tax and customs clearance, financial and accountancy aspects), is their interoperability between all customs offices in the EU as well as between customs offices and other entities involved in international trade (for example, regarding veterinary services, sanitary, phytosanitary matters, etc.).
The new regulations in the MCC are being introduced gradually; however, it is already common knowledge that the final effective date for completing the implementation of the MCC (originally planned for 24 June 2013) will not be met. In other words, it will not be possible to deliver all customs services electronically before the deadline. This also includes the ‘Single Window’ concept (that is, a single access point for Customs as a final initiative of e-Customs), which will be implemented in cooperation with other administrative entities.
As far as the MCC is concerned, there are two possible outcomes: either it will be introduced in an operable form without computerised systems and a further reform of customs law, or it will be amended and the grace period for the implementation extended for an additional two years taking into account the changes to comitology11 and correction of regulations. The second outcome appears most likely, although this cannot be stated with certainty.12
As matters stand, the majority of customs services are now provided electronically: the electronic environment has become the new standard, with paper-based services being the exception.
2. Improving the quality of customs services Since the beginning of the 21st century, customs services have undergone rapid transition, with traditional paper-based procedures being eliminated in favour of electronic forms of delivery which are also capable of incorporating security elements and trade facilitation measures for trustworthy economic operators. Such standards can be seen in the AEO status for which there exist three types of certificate:13 AEO/C (Customs Simplifications), AEO/S (Security and Safety) and AEO/F (‘Full’: Customs Simplifications/Security and Safety).
Linking customs authorities and the AEO system represents a milestone in the harmonisation of customs services. Unifying the verification criteria of customs authorities by issuing certificates recognised throughout the EU has established a simple legal basis for the provision of customs services for the
Volume 6, Number 1 95
World Customs Journal
whole European market. The EU has also extended these unified criteria to Sweden, Norway and Japan by entering into agreements concerning the mutual recognition of AEO certificates. It is currently negotiating agreements with China, the USA and South Africa,14 which has created a new quality standard for the services provided by customs authorities at the international level. In a new development, AEO systems are being linked to conditions for simplified procedures, thereby unifying the standards for customs services provided at national and international levels.
The Act of 18 March 2011 on Amendments to the Goods and Services Tax Act and the Law on Measures Act15 has significantly broadened the range of services by allowing tax representatives to act as customs agents in relation to imported goods and the resulting intra-community supply. In this case, tax representatives will be permitted to act as customs agents to represent taxpayers in relation to the documentation and registration of goods and services tax and in the preparation of taxpayers’ declarations and summary information (that is, some of the activities, which have so far been performed by tax advisers and authorised accountants).
Regardless of their class or category, customs services have always been both the subject and result of customs activities. They are directly related to the customs clearance of goods (and cargo). The MCC recognised for the first time the leading role which customs services play in the supply chain considering their contribution to the monitoring and management of international trade. Customs services are instrumental to national competitiveness and they not only reflect new economic conditions but also create new tasks for both customs authorities and customs officers. Such tasks are directed towards safeguarding the incomes and financial interests of particular Member States and the EU as a whole, as well as clients’ rights. They are based on effective cooperation between customs authorities.
Improving the quality of customs services and the competitiveness between customs agents at both national and community levels must comply with free and fair trade rules which are based on quality as opposed to price. These standards are reiterated in detail by the code of conduct for customs agents.16 It stipulates a number of standard qualifications for customs agents relating to honesty and self-discipline, the guarantee, maintenance and improvement of the quality of customs services as well as the methodology to adopt when providing the services offered. They also oblige the persons authorised to provide customs services to undergo continuous vocational training.
The Quality Charter also establishes standards for improving the quality of customs services.17 It consists of guidelines for service providers and rules for offering and providing customs services appropriately.
2.1 The range of e-Customs services
The rapid development of electronic customs services has changed the delivery of those services from a paper-based to electronic method. However, the main goal of customs services providers (customs agents) is to protect their clients’ interests to prevent fraud, corruption and other abuses as well as the infringement of customs and tax laws.
Using IT systems located on the websites of customs authorities, e-Customs services are approved and managed centrally by the Polish Customs Service.18 Despite the fact that Polish Customs is highly computerised, it was initially the case that only 10% of all import customs declarations were filed in an electronic form. Within six months of the introduction of that technology, this figure increased to 35%. Although this appears a rapid growth, it still lags behind Europe as a whole where 60% of economic operators apply automated customs services.19
In Poland, the following computer systems are available to providers of e-Customs services:20
• CELINA – Customs Declaration Processing System• EBTI – European Binding Tariff Information System

96 Volume 6, Number 1
International Network of Customs Universities
• ECS/AES – Export Control System/ Authorised Export System AES (envisaged date of implementation 2012-13)
• e-Customs – final component of the e-Customs initiative. This service is particularly visible at the external borders of the EU (that is, a ‘Single Window’ concept which is planned for completion in 2012-13)
• EORI – Economic Operators’ Registration and Identification• EMCS – Excise Movement and Control System• ICS/AIS – Import Control System/Automated Import System (implementation planned in 2012-13)• ISZTAR-TARIC – Integrated Customs Tariff System• NCTS – New Computerised Transit System• SEED – System for Exchange of Excise Data• TQS – Tariff Quota Management and Surveillance Sub-system• ZEFIR – Financial Accounting and Tax/Duty Clearing System• ZEFIR-OSOZ – The Polish Maintenance System of Securities and Permits. This is a central sub-
system of ZEFIR and uses the XML standard to communicate with economic entities and customs IT systems (for example, NCTS, CELINA)
• ZEFIR-INFOP – a new function of ZEFIR enabling the transmission of information to contractors via email about methods of payment and liability
• Integrated Human Resources Management System (HERMES2 – implementation planned for 2012)• The European Customs Information Portal and Single Access Point ECIP/SEAP PL (Association of
Public Administration Education 2013).
2.2 The provision of e-Customs services
The promulgation of the MCC’s provisions21 covering centralised customs clearance22 is planned for 2015 at the earliest.23 These provisions will completely eliminate the use of paper in customs operations. As a result, Customs will operate within a completely electronic environment and provide its services accordingly. In fact, the majority of customs services are already performed electronically, starting with the customs declaration, and electronic delivery is fast becoming the norm. Nevertheless, it is still possible to use paper-based procedures if necessary.
The IT system CELINA is used to put customs declarations into electronic form both in standard and simplified procedures and to forward electronic documents to CELINA, ECS, ICS or the INTRASTAT system.
The provision of e-Customs services requires an identification code (login) which is registered in the Reference Data Sub-system (Podsystem Danych Referencyjnych [PDR])24 as well as a key for secure data transmission25 issued by the Centre of Secure Data Transmission (Centrum Bezpiecznej Transmisji Danych [CBTD]) of the Customs Chamber in Cracow. According to the Act on Electronic Signature, this key is to be regarded as a means of identification rather than an authorisation26 and generates a code pursuant to Article 199 (2) RWKC.27
In the case of INTRASTAT customs declarations, the Director of the Customs Chamber in Szczecin is responsible for assigning an identification code (login) and registering it in the Reference Data Sub-system (PDR).28
Since 1 July 2010, all Member States have been required to use an EORI number (Economic Operators’ Registration and Identification) in customs declarations for the CELINA, ECS, ICS and NCTS systems.29
The creation of a pan-European system for identifying economic operators ensures the availability of up-to-date information on those operators participating in customs initiatives administered by the

Volume 6, Number 1 97
World Customs Journal
customs authorities of Member States. For economic operators, it provides access to specific data on other operators which has been published subject to their prior agreement. It is worth stressing that those operators have been required to register in the EORI system.
The next step was the implementation of the Export Control System30 in 2011. This saw the automation of export procedures in all EU countries and implementation of the Excise Movement and Control System (EMCS),31 which increased its functionality.
The Import Control System32 should also not be forgotten. This is used to process documents and information relating to the summary import declaration (Przywozowej Deklaracji Skróconej [PDS]), as well as prior notification of arrival (Powiadomienie Wyprzedzające o Towarze [PTW]).
Most customs authorities have been using electronic procedures for a long time now. One example of a long-standing electronic service is the European Binding Tariff Information system (EBTI) and its Polish version EBTI-PL; the Integrated Tariff System ISZTAR (a reference system fully compatible with TARIC), which provides up-to-date tariff data for CELINA, the Customs Application Processing System; the ZEFIR Financial Accounting and Tax/Duty Clearing System, which is an IT system dealing with financial and accounting issues of the Polish Customs Service and the TQS (Tariff Quota Management and Surveillance) sub-system, which processes customs declarations applying for the application of preferential rates of duty. These declarations are processed in the order they are received.
The creation and implementation of IT systems is still work-in-progress (that is, an integrated, secure system, which is valid throughout the EU; a common system of risk analysis as well as a unified procedure for issuing customs decisions). This is also true of the creation of unified (appropriate) sanctions for customs law infringement. The creation of the necessary technical infrastructure is to be performed within a legal framework and supported by financial resources, thereby ensuring implementation of the relevant plans and tasks.
ConclusionsIt has not taken long for the EU to move towards a fully automated customs environment (e-Customs). However, the most optimistic date for fully implementing this vision is 2015 and although a lot of progress has been made in implementing the customs program (that is, a ‘paperless’ environment for customs administration and trade in the EU), there is still work to do on some initiatives. What is already clear is that the introduction of an electronic customs environment will change the conditions for international trade considerably.
Notes1 www.sluzbacelna/projekt-programu-e-customs//, [the customs services/e-customs project] of 9 July 2011.2 According to the definition of the European Commission – e-Customs is an application of IT technologies in public
administration. It is connected with the organisational changes and new abilities of public services, which aim to improve quality of provided services by the government.
3 European Council 1999, ‘Europe and the global information society, Bangemann report recommendations to the European Council’, Brussels, 26 May 1999, www.epractice.eu/files/media/media_694.pdf.
4 Bangemann report 1999, pp. 7-10.5 See also, Communication from the Commission to the Council, the European Parliament and the European Economic and
Social Committee: ‘Role of e-government for the European future’, COM (2003) 567 final, of 26 September 2003.6 Communication from the Commission to the Council, the European Parliament and the European Economic and Social
Committee of 24 April 2003, ‘A simple and paperless environment for Customs and trade’, COM (2003) 452 final, OJ C 96 of 21 April 2004, http://eur-lex.europa.eu/LexUriServ/LexUriServ.do?uri=CELEX:52003PC0452:EN:HTML.
7 www.sluzbacelna/projekt-programu-e-customs//, [the customs services/e-customs project] of 9 July 2011.

98 Volume 6, Number 1
International Network of Customs Universities
8 Document TAXUD/477/2004 rev. 9 of 8 May 2008 with enclosures, which presents the vision, aims, and strategic actions for creating an ‘e-Customs’ environment by 2013.
9 http://eur-lex.europa.eu/LexUriServ/LexUriServ.do?uri=OJ:L:2008:023:0021:0026:en:PDF.10 Regulation No. 450/2008 of the European Council and the European Parliament establishing the Community Customs Code
(CC) (The Modernised Customs Code), J L EU L 145 of 4 June 2008.11 Art. 291 TFUE.12 ‘Reform of Customs Law in the European Union: The Modernised Customs Code and Law Enforcement Provisions’,
conference material provided by Polish Customs Service at a conference on trade facilitation for business, held on 10 May 2011 in Warsaw (materials on file with author).
13 Implemented by the Modernised Customs Code, Regulation No. 450/2008 of the European Council and the European Parliament establishing the Community Customs Code (The Modernised Customs Code), J L EU L 145 of 4 June 2008.
14 Vito Totorizzo, IFCBA delegate for ANASPED Italy.15 Act of 18 March 2011 Amending the Act on Goods and Tax Service and Law on Measure Act, (J L dated 28 March 2011, No.
64, item 332), referring to the Regulation of the Finance Minister of 28 March 2011 on tax representatives (J L No. 68, item 359). According to the regulation, importers will be able to appoint the customs agency as its tax representative in relation to imported goods and subsequent intra-community supply.
16 European Customs Brokers Code of Conduct, Confiad PanEuropean Network.17 European Customs Representatives Quality Charter, Confiad PanEuropean Network.18 See, www.sluzbacelna/systemyinformatyczne/celina (the customs service/IT system/celina), 10 July 2011. 19 Communication to users of the CELINA system and entities undergoing registration in the Reference Data Sub-system (PDR),
Ministry of Finance, Department of Customs Policy, 16 June 2011.20 The IT systems are available on the homepage of Polish Customs: www.sluzbacelna/systemyinformatyczne, 10 July 2011.21 Art. 5 MCC (at sentence 1). All exchange of data of additional documents, decisions and notifications between customs
authorities and between economic subjects and customs authorities as well as the storage of such data (as required by customs law) is performed using data processing.
22 Art. 106 MCC.23 In the author’s opinion, the most unfavourable option would be 2018.24 The applicant is bound by territorial jurisdiction. The authorised body is the Director of the Customs Chamber. 25 Instruction for assigning identification code (login), obtaining a key for secure data transmission and registering individual
persons and economic operators in the Reference Data Sub-system (PDR) in order to forward electronic applications and other documents to customs systems (CELINA, ECS, ICS and INTRASTAT). Version 1.1, dated 4 October 2010, Ministry of Finance, Department of Customs Policy, pp. 4-9.
26 Act on Electronic Signature of 18 September 2001 (J L of 2001, No. 130, item 1450, as amended).27 The Regulation of the European Commission (EEC) No. 2454/93 of 2 July 1993 establishing provisions for the implementation
of Council Regulation (EEC) No. 2913/92 establishing the Community Customs Code (J L EC L 253 of 11 October 1993, pp. 1-766, as amended; J L EU, Polish edn, ch. 2, vol. 6, p. 3 as amended).
28 Regulation of the Finance Minister of 3 November 2010 on INTRASTAT declarations (J L No. 216, item 1422) and supplementary information for instruction on registration in the Reference Data Sub-system PDR – changes within INTRASTAT system, 13 January 2011, p. 2.
29 The legal basis for introducing the obligation to register economic operators in EORI system is found in: 1. Provisions of the Community Customs Code on the EORI system, resulting from the Regulation of the Commission (CE) No. TAXUD 1435/2007; Regulation of the Commission (EC) No. 312/2009 of 16 April 2009 amending Regulation (EEC) No. 2454/93 setting provisions in order to enforce Regulation of the European Council (EEC) No. 2913/92 establishing the Community Customs Code. 2. National regulations: Regulation of the Finance Minister of 5 June 2009 amending the regulation on territorial jurisdiction of the customs authorities. Regulation of the Finance Minister of 23 October 2009 amending the regulation on the system of forms used in customs procedures.
30 More information can be found on the homepage of Polish Customs, www.sluzbacelna/systemyinformatyczne.31 The EMCS (Excise Movement and Control System) is to be applied for the movement of excise goods (energy, alcohol and
tobacco goods) in the suspensive procedure for the collection of excise tax in intra-community trade between Member States of the EU and movement of the aforementioned goods within the European Community in relation to import and export. This system is to replace the paper-based system of supplementing the administrative document accompanying the shipment of excise goods in relation to the suspensive procedure for the collection of excise duty.
32 Detailed information concerning implementation of the ICS System and rules of governing its application, covering instructions for economic operators is available at: www.mf.gov.pl/index.php?const=2&dzial=1922&wysw=2&sub=sub17, 7 July 2011.
Volume 6, Number 1 99
World Customs Journal
Ewa GwardzińskaDr Ewa Gwardzińska, is a Professor’s Assistant in the Business Law Department, Warsaw School of Economics, Poland. Ewa specialises in interpreting legislation and regulations as they relate to the services provided by customs agencies in the implementation of customs procedures.

100 Volume 6, Number 1
International Network of Customs Universities

Volume 6, Number 1 101
World Customs Journal
Warehousekeepers: bridges connecting Customs and small and medium-sized enterprises (SMEs)
Dafang Liu
Abstract
Warehousekeepers are professionals who cooperate with Customs on the one hand and importers and exporters on the other. As far as small and medium-sized enterprises (SMEs) are concerned, the assistance and support that warehousekeepers provide are crucial to their trade. This includes a wide range of commodity classification and nomenclature, customs valuation, trade control measures, customs security, logistical support and knowledge of foreign customs procedures. As far as customs administrations are concerned, warehousekeepers can objectively explain customs’ intention and opinion to SMEs and, at the same time, reflect the wishes and demands of SMEs to Customs. In effect, therefore, warehousekeepers are bridges connecting Customs and SMEs, thereby facilitating trade.
1. SMEs play active roles in both national and global economiesIt is widely accepted that small and medium-sized enterprises (SMEs) are essential to national economies. Although they do not account for as vast a volume of international trade as large transnational companies, SMEs are the major employers and play a leading role in technological innovation and social responsibility, both of which are crucial to sustainable development at the national and global levels.
Taking China as an example, by the end of September 2010 the number of registered SMEs was more than 10 million, which represented more than 99% of the total number of enterprises operating in China. SMEs employ over 80% of all labour in China and hold over 65% of all patents for inventions.1 SMEs are persuasively active in other developing countries of East Asia too, especially in helping economies recover from the financial crisis of the late 1990s.2 SMEs are also very important to developed countries: the SMEs established in Silicon Valley, for example, are leading the way in developing advanced technology.
However, there have not been any in-depth studies into the role SMEs play in international trade. As a result, customs procedures cannot reflect their special needs and this, together with other negative factors, has a progressively detrimental effect on international trade conducted by SMEs.
2. SMEs need help in carrying out customs proceduresAt first glance, SMEs do not appear to play an important role in international trade. However, in reality, they are integral to that trade by supplying key technologies and spare parts to the business giants and have significant potential to promote trade. Therefore, they should be encouraged in their attempts to develop new markets in other countries because this often leads to SMEs growing into large, successful enterprises with significant jobs opportunities. Given the size of SMEs, what they need is assistance and support from both customs authorities and professional enterprises engaged in customs procedures

102 Volume 6, Number 1
International Network of Customs Universities
(EEICPs). Most SMEs lack knowledge of customs procedures (especially those in foreign countries), and most cannot afford to employ experts who deal solely with those procedures.
Worse still, customs rules and procedures do not yet take the needs of SMEs sufficiently into account because not all governments are prepared to grant foreign SMEs access to their domestic market. Furthermore, not all customs authorities possess sufficient resources to control the imports and exports of SMEs owing to the great increases in the volume of international trade. It makes more sense to concentrate their resources in large companies considering that they are the major importers, exporters and contributors of customs revenues. Therefore, the only choice open to SMEs is to seek professional assistance and support from EEICPs.
There are several reasons why EEICPs represent an important resource which can help SMEs participate in international trade. First, EEICPs are located in different countries and are therefore familiar with their customs procedures. Their knowledge of the regulatory and information requirements enables them to advise their clients effectively. This, in turn, enables their clients to avoid making mistakes or submitting excessive or irrelevant information (which is inefficient for both Customs and SMEs). Some skilful and experienced EEICPs can even advise SMEs on how to lodge customs declarations effectively, thereby saving both time and money.
Second, EEICPs know and understand the demands of SMEs because they themselves are private enterprises. Accordingly, they are in a position to understand the needs of SMEs and communicate with them easily. Furthermore, they are located in the same markets the SMEs wish to enter and so they may be able to anticipate any problems the SMEs may encounter.
Third, greater assistance from EEICPs means more workplaces. Since SMEs far outnumber large multinational companies, EEICPs need more people to communicate with them. Moreover, considering that some SMEs are foreign companies, the employees of EEICPs need the skills to communicate with them effectively and accurately. In the author’s view, recognition of this fact will increase the demand for skilled and experienced practitioners and may lead to the creation of other businesses such as training institutions. Of course, there is every reason to promote such development.
Fourth, greater assistance from EEICPs will generate trade in services. Of interest to SMEs are services relating to foreign law and practice provided by foreign or local EEICPs. However, local EEICPs will still have to obtain the information SMEs need from their foreign counterparts. In reality, therefore, services in trade can match or even exceed progress in negotiations concerning trade in services between and amongst countries.
In summary, SMEs need the advice and help in international trade that EEICPs can provide. Cooperation between SMEs and EEICPs should therefore be encouraged and the prospects of this happening are promising.
3. Enterprises managing customs warehouses can provide assistance to both Customs and SMEsThere are different types of EEICPs including customs brokers, trading companies focusing on inter-national trade, and freight forwarders. Enterprises managing customs warehouses (warehousekeepers) are one type of EEICP. It is not easy to define warehousekeepers because other types of EEICPs can also manage customs warehouses. According to the Guidelines to Specific Annex D of the Revised Kyoto Convention, ‘customs warehousing procedure’ means the customs procedure under which imported goods are stored under customs control in a designated place (a customs warehouse) without payment of import duties and taxes.3 Customs warehouses open to any person having the right to dispose of
Volume 6, Number 1 103
World Customs Journal
their goods4 are called public customs warehouses—in contrast to private customs warehouses, which only store goods for the keepers themselves. We can deduce from this that a customs warehouse is a warehouse under customs control, regardless of whether it is run by Customs or not. Actually, in China, customs warehouses are run by enterprises, many of which are private enterprises. Anyone can use public customs warehouses for legal purposes. The enterprises running customs warehouses not only manage various types of businesses concurrently as trading companies but also specialise in running customs warehouses as well. This paper uses the term ‘customs warehouse’ synonymously with ‘public customs warehouse’. Accordingly, when reference is made to enterprises managing customs warehouses (that is, warehousekeepers), the author is referring to those which are focused on or at least mainly engaged in running public customs warehouses.
A closer examination of warehousekeepers and customs warehouses may reveal the reasons for and benefits of promoting the ability of SMEs to trade and facilitate a working relationship between Customs and the private sector.
3.1 Customs warehousekeepers are different from other types of EEICPs
Although warehousekeepers are inextricably linked to other types of EEICPs, they also have their own distinctive features. First, they differ from customs brokers who are parties essentially concerned with presenting and processing customs documentation on behalf of importers or exporters.5 While customs brokers are mainly responsible for customs declarations, warehousekeepers are more concerned with storing goods. SMEs can utilise storage to extend their supply chain to the door of their clients. In this way, warehousekeepers can expand their services beyond the confines of their warehouses.
Second, warehousekeepers are also distinct from those companies which run their own trading operations. Although some traders have their own customs warehouses, they run them for their own purposes. Generally speaking, SMEs are reluctant to store their goods in a warehouse run by a trading company because they are concerned to protect trade secrets. They tend only to store their goods at companies which they also represent. Warehousekeepers are independent third parties which boast professional skills in warehouse management and obviously have trade secrets to protect. Warehousekeepers are also more trustworthy and reliable as far as stock-keeping and accounting are concerned.
Third, warehousekeepers are distinguished from freight forwarders, who may also run customs warehouses. Compared with the customs warehouses run by warehousekeepers, theirs are more suitable for very short terms of storage which enable brokers to prepare for the impending customs declaration and inspection. If their customs warehouses are suitable for stock-keeping then they can even take the place of warehousekeepers. However, not every forwarder has the capacity and professional knowledge to run a customs warehouse—either for its own business operations or those of others.
Fourth, the successful operation of customs warehouses in times of economic crisis has underscored the importance of warehousekeepers. For example, in China, the volume of trade managed by customs warehouses fell just a little compared with the sharp decline in the volume of trade and in the world economy in 2008. This shows that customs warehouses can cushion the effect of sharp fluctuations in international trade. This is crucial for SMEs which are vulnerable when exposed to risks in international trade and the global economy.

104 Volume 6, Number 1
International Network of Customs Universities
The three graphs below show this cushioning function performed by customs warehouses in Chinese foreign trade.
Data source: The General Customs Administration of the People’s Republic of China, www.customs.gov.cn/publish/portal0/.
100
50
0
2000
1500
1000
500
0
100.00
50.00
0.00
-50.00
Total import and export volume in the same year
Trade volume through bonded warehouses
Comparison of increase rate
Increase rate of import through bonded warehouses
Increase rate of export through bonded warehouses
Increase rate of total import
Increase rate of total export
Perc
enta
geBi
llion
USD
Billi
on U
SD
2005 2006 2007 2008 2009 2010
20.06import 32.02 41.72 57.28 54.39 61.1
7.96export
Total import volume
Total export volume
13.07 18.62 28.4 26.79 35.37
2005 2006 2007 2008 2009 2010
2005 2006 2007 2008 2009 2010

Volume 6, Number 1 105
World Customs Journal
The graphs illustrate that supporting and developing warehousekeepers is a way of not only promoting partnership between Customs and the private sector but also increasing workplaces. Therefore, developing warehousekeepers to promote international trade and create more job opportunities is feasible and indisputable.
3.2 Investors in customs warehouse operation can be diverse
The Revised Kyoto Convention provides that public customs warehouse may be managed by Customs and other authorities as well as by natural or legal persons.6 In the author’s opinion, regardless of who runs a customs warehouse, it should be independent from both Customs and traders. This prerequisite represents a fundamental principle of the management of customs warehouses. ‘Independent from Customs’ does not mean any challenge to Customs: on the one hand, a customs warehouse is consistently under customs control and, on the other, some goods can be authorised by Customs to be stored or detained if necessary. Rather, ‘independent from Customs’ reflects the fact that running a customs warehouse is a business; the managers and operators are not customs officials, nor agents of Customs. Accordingly, their decision on whose goods they wish to store is not dictated by Customs but by business considerations. They should remember that a customs warehouse represents a component of the supply chain and that an enterprise-managed bonded warehouse (EMBW) is a private legal entity which sometimes represents its client. Accordingly, warehousekeepers are independent from Customs. Similarly, the managers and operators should also be independent from their client insofar as they are bound to refuse a client’s request if it is illegal. Furthermore, they should treat all clients equally and not favour some clients over others.
To maintain independence, the author believes that investors from the private sector are to be preferred.
Investors can also be from foreign countries if this is permitted by domestic law. Foreign investors may present an opportunity to cooperate with warehousekeepers or EEICPs in other countries, ultimately benefitting SMEs both at home and abroad. As far as foreign investors are concerned, they are pioneers developing services in trade. In this respect, the author believes that, unlike the strict limitation on investment in forwarding and customs broker industries, (local) government can safely encourage investment in customs warehouses because it will do little harm to domestic industry. On the contrary, it will benefit numerous SMEs. For example, in China, an EMBW called Jiangsu Xinning Modern Logistics Co. Ltd (located in Jiangsu Province), was established in 1997 and listed in 2009. One of its investors is from Singapore,7 despite the fact that the free trade agreement between China and Singapore was not concluded until 2008. Without government permission and encouragement, few would have risked investment in 1997, the year the Southeast Asian financial crisis broke out.
Abolishing restrictions relating to investors’ background lowers the threshold of market access, and ensures that encouraging the development of warehousekeepers offers a more practical way of helping SMEs.
3.3 Warehousekeepers can provide support throughout customs procedures
Goods stored in customs warehouses are intended for various uses: they may be transported to other countries, re-exported or just imported once a client has been found. Accordingly, the goods under customs control may be assigned to different customs procedures. Due to the fact that they deal with such procedures every day, warehousekeepers can provide SMEs with professional advice, some logistics support and knowledge of foreign customs procedures.
3.3.1 Professional advice
Warehousekeepers are familiar with customs rules and procedures; moreover, they also possess knowledge of goods and customs affairs. Their opinions and explanations are easily accepted by both

106 Volume 6, Number 1
International Network of Customs Universities
SMEs and Customs. On the one hand, SMEs view them as third parties and so communicating with them is not confrontational as it can be with Customs; on the other hand, Customs does not view warehousekeepers as importers or exporters, so they can be objective when determining what Customs wants and can explain, impartially, to Customs the wishes and demands of the importers and exporters. They can provide advice on commodity classification and nomenclature, customs valuation, and other trade control measures.
A skilful EMBW knows the nature of the goods stored and gives precise advice on commodity classification and nomenclature (thereby preventing errors in customs declarations), which enables SMEs to save both time and money. For example, declaring a wooden screen as wood would entail import duty; however, by declaring the product as a handicraft article, the importer may avoid duties altogether.
Customs valuation is another field where warehousekeepers can give professional advice. It is well known that some factors should be included or excluded from transaction prices. However, because they are not trained to recognise such factors, SMEs tend either to declare a higher transaction value than is really the case or fail to include something in the declared value. An experienced EMBW, on the other hand, knows the right price to declare to Customs and can advise SMEs on how to present the individual components of transaction prices in a way that avoids extra duties (for example, separating the actual price from buying commissions in order to avoid paying duties on these commissions). SMEs cannot be expected to have such knowledge and experience nor can they acquire it within a short period of time.
Only those dealing with trade measures on a daily basis can clearly and precisely identify the controls that a commodity is subject to. SMEs are often confused by the measures because they are always changing, which often causes dissatisfaction among importers and exporters. From an SME’s point of view, it costs too much to appoint one person to deal exclusively with these measures and there is also the risk that a change is not noticed in time (for example, compliance with extra security inspections that may have been unnecessary only a few days ago).
3.3.2 Logistics support
Besides advice, warehousekeepers can provide SMEs with logistical support. Inventory hub service and customs security are two typical types of such support.
Inward processing is encouraged in almost every country (whether developed or developing) by means of preferential customs procedures. In China, imported raw materials, parts and components (IRPCs) for inward processing are in bond and under customs control. During the course of processing, IRPCs are transported from one manufacturer to another. When all the IRPCs and semi-products that consist of IRPCs are gathered in front of an assembly factory, customs warehouses which can act as inventory hubs are needed.
On one hand, many IRPCs are manufactured by SMEs. From their point of view, it makes economic sense to sell their products to large assembly factories. Given the fact that their raw materials, parts and components are imported, both assembly factories and SMEs are willing to keep IRPCs in bond by Customs. On the other hand, the assembly factories prefer to let the suppliers of IRPCs not only hold the inventory but also supply IRPCs on a just-in-time basis (that is, supply the assembly factories around the clock). A customs warehouse built near the assembly factories is well located to meet the requirements of both parties. To realise the full potential of customs warehouses, Chinese Customs even allows warehousekeepers to supply the assembly factories at any time and make an aggregate declaration to Customs every 10 or 15 days.8
In the case where extra customs procedures are applied to products made from IRPCs which are returned owing to defects, a customs warehouse can offer additional inspection and other services to IRPCs during storage. This saves time in comparison to carrying out inspections in assembly factories. With the permission and support of Customs, maintenance work on equipment can be carried out in a customs

Volume 6, Number 1 107
World Customs Journal
warehouse or samples presented. Customs appears to support the future development of maintenance services.9
During its development, an SME may have more than one client and must therefore supply its products to different clients simultaneously. If its clients are in the same region or same foreign country and require the same products, it would be better for the SME to send the goods in one shipment to a customs warehouse in that region or foreign country. By storing products in a customs warehouse, the SME can reduce its transportation costs and ensure the flexibility of its distribution system if production is limited and it has to meet client orders simultaneously. Due to the fact that the SME owns the products stored in the customs warehouse, Customs will register them as the SME’s IRPCs. Accordingly, the SME can produce the distribution plan based on the quantity of its products stored in the customs warehouse. This can avoid the problem of oversupplying one client and undersupplying another.
Customs also needs customs warehouses because some customs procedures apply during the transportation of IRPCs in order that they remain under customs control. Establishing a customs warehouse is more viable than establishing a free trade zone because the local customs authorities in China have the authority to approve an application for establishing a customs warehouse, no matter whether it is large or small.
Chinese Customs encourages enterprises equipped with computerised systems to manage their own production and provide it with the necessary data which permits an effective control of IRPCs. However, not all SMEs operate systems which satisfy the standards stipulated by Customs. Indeed, some of them even lack employees who are qualified to operate such systems. In these cases, customs warehouses act as bridges between Customs and SMEs: the warehousekeepers can directly interface their IT systems (which meet the necessary standards) with those of Customs.
As a result, the need for customs warehouses is one shared by SMEs, assembly factories and Customs. In addition, these warehouses perform a crucial role in processing.
Another important service that warehousekeepers can provide is helping SMEs meet the standards of security demanded by various customs administrations. It is self-evident that keeping up with the frequently changing security standards and applying for certification as an Authorised Economic Operator (AEO) consumes a great deal of time and energy. In particular, an SME cannot afford to hire people to deal with such issues. One alternative may be to have their goods inspected and packed into cargo units at a customs warehouse. A professional warehousekeeper will be familiar with the latest security requirements and possess the necessary expertise to correctly inspect and examine imports and exports. The warehousekeeper can guarantee to Customs that the goods inspected and packed in the warehouse are secure. This will enable SMEs to save both time and money. By applying simplified procedures to those goods inspected and packed in customs warehouses, Customs can facilitate import and export by SMEs. Some SMEs may also find it difficult to pay a security fee because they do not always have property which can be used as collateral. Warehousekeepers, on the other hand, can often submit guarantees which can help SMEs overcome such problems.
Chinese customs law states that a guarantor may provide security by Chinese Yuan (Renminbi) and other convertible currencies, banker’s draft, cashier’s cheque, cheque, bond and certificate of deposit, letter of guarantee issued by the bank or other financial institutions, other property and rights ratified by Customs according to law. Most Chinese SMEs do not have sufficient cash; property and rights ratified by Customs are rare; and banks or other financial institutions are often reluctant to provide them with a letter of guarantee and even if they do, the cost will be prohibitively high.
A warehousekeeper, on the other hand, can provide the SME with the necessary assets to obtain a letter from banks or other financial institutions. Alternatively, it can submit its own letter of guarantee to Customs, or simply submit its own draft, cashier’s cheque, cheque, bond and certificate of deposit to Customs as a security for an SME. Of course, the SME will use its goods stored in customs warehouse as counter security.
108 Volume 6, Number 1
International Network of Customs Universities
To summarise, such support from warehousekeepers reduces the burden on SMEs and also enables Customs to facilitate trading by accommodating the procedures of customs warehouses. Efforts from all sides serve to promote the partnership between Customs, warehousekeepers and SMEs.
3.3.3 Knowledge of foreign customs procedures
Through communication and cooperation with foreign warehousekeepers, a local warehousekeeper can pass on knowledge about foreign customs procedures to its domestic clients. This will assist local SMEs to explore overseas markets. Since the warehousekeepers (whether operating at home or abroad) are professionals, they can easily understand each other. This will reduce the need for local SMEs to learn the relevant regulations and procedures of foreign customs authorities. When a local SME has trouble understanding foreign customs regulations, it can simply request a warehousekeeper in the same country to explain them. The warehousekeeper will then consult with its foreign counterpart in order to provide reliable information.
Such communication and cooperation are bilateral in nature. When foreign SMEs intend to enter the domestic market, domestic warehousekeepers can explain local customs regulations to their foreign counterparts. Obtaining information about domestic customs will allow foreign SMEs to reduce their expenses and thereby avoid the risks of violating foreign customs regulations. For example, in Shanghai, a local warehousekeeper called Shanghai Sky Trans Logistic Co. Ltd established a relationship with its counterparts in the United States, Japan and Chinese Taipei to help SMEs both at home and abroad obtain knowledge and information about customs procedures. On occasion, they have even jointly issued advice and plans on how to deal with the whole supply chain which spans several countries.
Such communication and cooperation can also relay the needs of foreign SMEs and successful practice of foreign customs to the domestic customs authority which, in turn, promotes cooperation between Customs and the private sector. If such communication and cooperation results in alliances of warehousekeepers across countries, domestic warehousekeepers can help their clients prepare the customs declaration documents both at home and abroad, greatly improving efficiency in customs clearance and storage.
3.4 Warehousekeepers can be authorised by Customs to assist in customs controls
Nowadays, the enormous increase in international trade means that ports are filling up with ever more freight, thereby challenging the capacity of Customs to control imports. The customs authority in China has adjusted its mode of control to match this great change. It has improved the efficiency of customs clearance by introducing a pre-arrival declaration procedure and examining goods outside ports.
Customs warehouses are appropriate sites for performing examination outside ports. Customs officials can examine freight in customs warehouses. Since customs warehouses are located near the final receivers of inward freight and consignors of outward freight, customs officials can examine freight in customs warehouses as it is being loaded or unloaded. Given the fact that monitors and other equipment are already installed in warehouses in the interests of customs control and security, it will not cost too much to install extra monitors and equipment. Once connected to customs IT systems, they can ‘relay’ the loading and unloading of freight.10 Customs officials can then watch or examine freight in different customs warehouses, simultaneously. Moreover, by recording loading and unloading for subsequent examination, customs officials can examine freight at any time. With the permission of Customs, warehousekeepers can load and unload inward and outward freight around the clock, thereby extending the opening times of customs offices. This saves the time and expense of waiting for the declaration and examination at ports and is therefore important for all importers and exporters, especially SMEs.

Volume 6, Number 1 109
World Customs Journal
4. Proposed support for customs warehouse operationCustoms warehouses can assist both Customs and SMEs. However, warehousekeepers themselves need help insofar as they frequently experience the following problems.
4.1 Restriction on establishment
It seems that in some regions, the number of customs warehouses is limited despite warehousekeepers’ strong desire to establish more warehouses. This is arguably the fault of Customs which has to give its approval before a customs warehouse can be established. The possibility for warehousekeepers to open branches of customs warehouses on the premises of SMEs is also restricted and they need comparatively high registered capital to do so.
According to the rules issued by China’s General Customs Administration regulating customs warehouses, the minimum registered capital for a warehousekeeper is 3 million Renminbi Yuan, while the minimum registered capital provided by China’s Company Law is only 30 thousand Renminbi Yuan. The minimum area for storage is 2,000 square metres11 and warehousekeepers are prohibited from opening branches of customs warehouses.12 In this regard, only big enterprises are qualified to manage customs warehouses. It is not possible for newly established warehousekeepers to open a smaller customs warehouse. It is also illegal for a warehousekeeper to establish a branch in an SME’s factory.
These restrictive rules may be explained by Customs’ fear of possible disorder resulting from a large number of competing warehousekeepers, which would jeopardise their control over IRPCs. However, in the author’s view, although raising thresholds for establishing a customs warehouse may reduce risks, it also limits the opportunities for providing warehousing services to SMEs, and prevents SMEs from managing their own customs warehouses. Considering that a large number of factories involved in inward processing are firmly under customs control, it is unlikely that IRPCs and products will veer out of control and in any case, this is unheard of in practice. Therefore, the author proposes relaxing these restrictions.
4.2 Restriction on maintenance for home-use products
Customs warehouses perform a vital role in facilitating international trade, but this could also be true in relation to domestic trade, for example, by providing support to maintain products intended for domestic use. At present, however, such business is prohibited in China. The Customs Rules of the People’s Republic of China on Customs Warehouses and Goods Storage expressly provide that only foreign products can be stored in customs warehouses.13
This results in the problem that when a manufacturer is located in a free trade zone or export processing zone, their products are not allowed to return to such zones for repair, despite the obvious need for this. One way of solving the problem would be to repair these products in customs warehouses which are physically separated from manufacturers. The duties on the spare parts would be collected in customs warehouses so that new spare parts and replacement parts would not mix with the spare parts being manufactured. Of course, the rule should be amended.
5. ConclusionsTrade facilitation is an important aim that the customs authorities of many countries are working hard to achieve. Warehousekeepers and their warehouses play a vital role in promoting the relationship between Customs and SMEs, and are the most suitable intermediaries between Customs and SMEs. By supporting the development of warehousekeepers, Customs can make a substantial contribution to facilitation and effectively enforce customs law. In this respect, customs warehouses are capable of

110 Volume 6, Number 1
International Network of Customs Universities
performing many different functions which deserve further exploration in the future. Warehousekeepers can help private sector stakeholders, such as SMEs, deal efficiently with customs procedures. Regardless of competition with other customs brokers, the future of warehousekeepers and customs warehouses looks very promising.
References
Chen, Xu-dong 2010, Based on the practice of Shang Customs: research of relations of Customs and trade facilitation, Review of Customs Law 2010, Law Press, China.
Harvie, Charles 2003, ‘The contribution of micro-enterprises to economic recovery and poverty alleviation in East Asia’, Department of Economics, Faculty of Commerce, University of Wollongong, http://ro.uow.edu.au/cgi/viewcontent.cgi?article=1074&context=commwkpapers.
Lukács, Edit 2005, ‘The economic role of SMEs in world economy, especially in Europe’, European Integration Studies, Miskolc (Hungary), vol. 4, no. 1, pp. 3-12.
World Customs Organization (WCO) 1999, International Convention on the Simplification and Harmonization of Customs Procedures (as amended), (Revised Kyoto Convention), Guidelines to General and Specific Annexes, WCO, Brussels.
World Customs Organization (WCO) 2005, Customs Capacity Building Diagnostic Framework, WCO, Brussels.
Notes1 See the announcement by Mr Li Zibing, Chairman, China Association of Small and Medium Enterprises, http://news.
xinhuanet.com/fortune/2010-05/14/c_12102294.htm. See also the announcement by Mr Zhu Hongren, General Engineer, State Department of Industry and Information, http://finance.people.com.cn/GB/12824562.html.
2 See the study by Charles Harvie in 2003.3 Article 3 of Chapter 1 of Guidelines to Specific Annex D, Revised Kyoto Convention.4 Article 4.2 of Chapter 1 of Guidelines to Specific Annex D, Revised Kyoto Convention.5 See Article 1 of Chapter 8, Revised Kyoto Convention, concerning the relationship between Customs and third parties. 6 Article 4.2, paragraph 5 of Chapter 1 of Guidelines to Specific Annex D, Revised Kyoto Convention.7 The information was originally published on the company’s website, just a few days before this article was completed; the
information is now missing. The author can only cite the information from other reliable sources. See http://app.finance.ifeng.com/data/stock/gsjj.php?symbol=300013.
8 According to reports from China’s General Customs Administration, when an EMBW starts its VMI service, the inward and outward volume increases 50 times as compared with the same month the year before, www.customs.gov.cn/tabid/39267/ctl/InfoDetail/InfoID/51196/mid/93164/Default.aspx?ContainerSrc=[G]Containers/_default/No+Container.
9 According to reports from China’s General Customs Administration, it has permitted the establishment of customs warehouses specifically designed for maintenance (www.customs.gov.cn/tabid/39267/ctl/InfoDetail/InfoID/184046/mid/93164/Default.aspx?ContainerSrc=[G]Containers/_default/No+Container). Also according to reports from China’s General Customs Administration, a customs warehouse was established in Yiwu city, a small city in Zhejiang province of China, for display. It facilitates the buyers and sellers to buy IRPCs and sell products (www.customs.gov.cn/tabid/39267/ctl/InfoDetail/InfoID/188270/mid/93164/Default.aspx?ContainerSrc=[G]Containers/_default/No+Container).
10 According to the reports from China’s General Customs Administration, such monitoring systems are installed in some customs warehouses, www.customs.gov.cn/tabid/39267/ctl/InfoDetail/InfoID/65575/mid/93164/Default.aspx?ContainerSrc=%5bG%5dContainers%2f_default%2fNo+Container.
11 Articles 8 and 9, Customs Rules of the People’s Republic of China on Customs Warehouses and Goods Stored.12 Article 14, Customs Rules of the People’s Republic of China on Customs Warehouses and Goods Stored.13 Article 5, Customs Rules of the People’s Republic of China on Customs Warehouses and Goods Stored.

Volume 6, Number 1 111
World Customs Journal
Dafang LiuDafang Liu, an Associate Professor at Shanghai Maritime University and PhD candidate, is currently studying Customs Law in China. Having been a customs official at China’s Customs Department in Shanghai for eight years and a teacher at Shanghai Customs College for four years, Dafang has a rich experience in customs research and practice. In 2009 he published the second edition of his textbook, Customs Law of China. His research is now focusing on introducing measures which facilitate trade between and among small and medium-sized enterprises as well as the application of processes for customs guarantees and the establishment of customs warehouses.

112 Volume 6, Number 1
International Network of Customs Universities

Section 3
Special Report

114 Volume 6, Number 1
International Network of Customs Universities

Volume 6, Number 1 115
World Customs Journal
Lines and Flows: The Beginning and End of Borders
Alan D Bersin*
Originally presented at the Ira M Belfer Lecture, Brooklyn Law School, 6 October 2011; published in Brooklyn Journal of International Law 2012, vol. 37, no. 2, May, pp. 389-406. Permission to publish this paper has been given by the author and by the publishers of the Brooklyn Journal of International Law.
Border LinesThe purpose and function of borders in world history has been and remains to delineate and demarcate—that is, to differentiate—one sovereignty from another. They are the juridical lines on a map, indicating the geographical place where imperial and/or national dominion begins and ends. These shift over time as a result of political and military developments, usually followed by legal recognition or acknowledgment expressed in one form or another. History tells the tale of these developments and shifts. Like laws, borders embody and reflect history’s results with the narrative left out.
The spaces of borders, corresponding to their map lines, are marked by ports of entry and exit. It is here where cross-border transactions of people and goods are processed through the exercise of immigration and customs authorities. Typically, the scope of these border inspection authorities is most broad regardless of the legal system under which they operate. Sovereignty asserts itself aggressively at the border threshold to determine who and what has the right or privilege of entrance (inbound) and exit (outbound). The levying of customs fees and duties has generated critical revenue streams for governments since biblical times. It was no accident that one of the earliest acts of the First Congress during the Washington Administration was to establish the U.S. Customs Service in 1789.1
Borders define a homeland. They are the primary reference points for national defense strategy and homeland security policy. Throughout history, borders have been the site of fortification, intended variously to shut in or keep out people or things. China’s Great Wall in the second century BCE, France’s Maginot Line pre-World War II, the Soviets’ Berlin Wall in the twentieth century, and America’s Southwest border fence in the twenty-first century all serve to illustrate the point. It was made more poetic and timeless by Robert Frost in “Mending Wall” where he wrote: “Good fences make good neighbors.”2
So, we see, borders are lines with real result and consequence. When we walk to the riverfront in El Paso and wade into the Rio Grande, at midstream it becomes the Rio Bravo and Juarez, Mexico begins. Without more, one crosses the line (la línea) from one of the safest cities in the Western Hemisphere (five homicides in 2010) to its most dangerous (3,400 homicides in 2010).3 Border lines matter but rarely account by themselves for the changes they embody.
Borders as FlowsMore than a generation ago, in The Structure of Scientific Revolutions, Thomas Kuhn introduced the notion of “paradigm” to refer to a distinctive manner of viewing the world, a characteristic sense, that is shaped by the larger forces at work in an era.4 This way of seeing organizes all of the data that is around us—all surrounding sensations—into patterns that we can interpret and understand and then act on to effect. Epochal shifts in paradigm catalyze enormous alterations in how we conduct operations and do business at a particular point in time.5 The balance of this lecture addresses the massive paradigm change

116 Volume 6, Number 1
International Network of Customs Universities
that has taken place since 9/11 in our perception of borders not only as lines, but also as movements—flows of people and goods on a global scale both legally and illegally.
Global flows are not new. These have occurred since ancient times and are chronicled in the ages of discovery and exploration as seafaring matters, and much earlier in the movement of goods and people along the Silk and Tea Horse Roads into China and the caravan paths across Arabia.6
Nor is the contemporary scale of the flows itself a distinguishing factor. These have increased exponentially century after century, spurred by colonial empires and trading companies, activities multiplied throughout by the growing logic of comparative advantage. The intensity, volume and speed of commercial and migratory flows accelerated mightily with the Industrial Revolution,7 and then massively again more recently by the invention of the jet engine and the Internet. The cumulative effect of these trends is what we refer to as globalization—extraordinary cross-border flows of capital, goods, people, ideas, and images occurring routinely on a daily basis, facilitated by a digitalization of data that has created the reality of instantaneous communication and transaction.
Security as the Organizing Principle: The Searing Impact of 9/11The vast volumes and growing speed in the movement of people and goods toward and across U.S. border lines from a globalized world is staggering. Each and every day in 2010, an average of 965,167 passengers and pedestrians, 47,293 truck, rail, and sea containers,8 and 257,990 privately owned vehicles entered the United States.9 Roughly $2 trillion in imports and $1.8 trillion in exports crossed our borders that same year.10
The trauma of 9/11 inflicted by al Qaida on the world through the United States assured that we would never view cross-border movements in quite the same way. Transnational terrorism exploited the relative openness of our borders and laxness of our border regulatory regimes to invade the continental United States for the first time since the British burned government buildings in Washington during the War of 1812.11 In one fell vicious swoop that was actual and deadly, and unlike the potential threat we had grown accustomed to during the Cold War, the events of 9/11 altered America’s view of security forever.
The resulting sense of insecurity stemmed from the fact that our borders had been violated. The reflexive response was to hunker down behind traditional concepts of borders as lines of defense. All planes were grounded and our maritime and aviation borders were closed in the immediate aftermath of 9/11. Similarly, our land borders virtually shut down as each entering vehicle from Mexico and Canada was inspected thoroughly. In other less visible ways, America closed its borders through restrictions on the issuance of visas and other immigration benefits. As Edward Alden has documented, many of these restrictions—pertaining particularly to the grant of visas—persist today.12
But all the emergency measures taken immediately after 9/11 collided head-on with the realities of global travel and commerce through transit zones and supply chains. They also directly challenged our self-image as an open, free, and welcoming society. The unacceptable economic and political consequences of shutting down the border, coupled with the new security imperative, forced a fundamental shift in our perspective. We began to understand that our borders begin not where our ports of entry are located, but rather, where passengers board air carriers and freight is loaded on maritime vessels bound for those ports of entry. In order to forge practical arrangements to take both travel and trade security into account, borders needed to be viewed and managed as flows of people and goods as much as lines in the sand, on the water. or through the air.
In the ten years since 9/11, three terrorist plots targeting the United States involved cross border movements of people or goods.13 Each event makes the case powerfully for the new border paradigm that links jurisdictional lines to flows toward them.
Volume 6, Number 1 117
World Customs Journal
The first involved the so-called underwear bomber, Nigerian citizen Umar Farouk Abdulmutallab, who boarded a plane in the Netherlands intending to ignite PETN explosive material and blow up a Northwest Airlines flight over Detroit.14 Based on its targeting capabilities, Customs and Border Protection (“CBP”) identified Abdulmutallab as a person of interest after the flight departed.15 When the plane arrived in the United States and he presented himself for admission, officers would have referred him to secondary inspection for significant interrogation. This obviously would have been too late, because had he succeeded, he would have blown up the plane before it landed. Border security in this context requires that Abdulmutallab be prevented from boarding the plane in the first place. For these purposes, the border became Schipol Airport in Amsterdam, and the goal changed to the identification and preemption of high risk individuals in the flow of passengers at their last point of departure toward the United States.
The second case was Faisal Shahzad, the Times Square Bomber, a naturalized U.S. citizen born in Pakistan, who went abroad to receive training from the Taliban in the tribal borderlands between Afghanistan and Pakistan.16 Shahzad received support and resources in the New York metropolitan area from abroad to construct an explosive device he intended to detonate in Times Square. Foiled by an alert guard, Shahzad attempted to flee the country on board an Emirates Airlines plane. Advance passenger manifest information received by CBP regarding the outbound flight, coupled with significant travel history data available concerning Shahzad, facilitated his identification and apprehension on the tarmac at JFK seconds before takeoff.
The third terrorist plot was the shipment of parcel bombs by al Qaida operatives in the Arabian Peninsula via UPS and Federal Express.17 Sent from Yemen, addressed to locations in Chicago, the improvised explosive devices passed through airports in London and Dubai, after having been concealed in printer cartridges and timed to detonate over the United States. As a result of intelligence-sharing by Saudi authorities, we were able to deploy public- and private-sector resources to locate the packages before they reached their intended destinations. As in the other cases, the key lay in the collection, analysis, and sharing of data regarding the transnational origin, route, and flow, in this instance, of express carrier packages.
We understand our mission at CBP, within the Department of Homeland Security (“DHS”), from this perspective: keeping dangerous people and dangerous things away from the American homeland. We strive to accomplish this mission by exercising our authorities and utilizing our resources in a way that enlists both time and space as allies. The earlier that we can identify, intercept, and neutralize threats to the homeland, the safer our people will be. The further away geographically from the physical line that we can achieve these ends, the safer our country will be. The job for DHS, in short, is to secure flows of people and goods moving toward, and intending to enter, the United States. This altered paradigm regarding our mission has fundamental implications for DHS’ strategic and tactical approach to organization and function, as well as to relationships with other agencies within and outside the government.
Joint Border ManagementThe terrorist invasion of 9/11 gave rise to a preoccupation with the safety of the American homeland. The concept of homeland itself was novel, even uncomfortable for many in the U.S. context. It differed strikingly from our earlier emphasis on new frontiers in Frederick Jackson Turner’s thesis,18 or the “manifest destiny” that drove an aggressive expansion of both northern and southern borders in the United States during the nineteenth century.19
This new focus generated creation of DHS, a merger by legislative fiat in 2003, of twenty-two agencies spread previously across the landscape of American government.20 CBP itself was formed through the merger of four separate organizations from three separate cabinet departments into one new agency—

118 Volume 6, Number 1
International Network of Customs Universities
the U.S. Border Patrol and Immigration and Naturalization Service from the Department of Justice, dealing with people seeking to enter the country legally and illegally; the U.S. Customs Service from the Treasury Department, dealing with cargo and goods; and the Agriculture Inspection Service from the Department of Agriculture, dealing with agricultural pests and potential infestation of our crop lands.21
Our previous scheme of divided border management, in place since the nineteenth century, was not efficient to say the least. But it was responsive to history. As John Barth, borrowing a bit from Oliver Wendell Holmes, noted in The End of the Road, “There’s no reason in the long run why Italy shouldn’t be shaped like a sausage instead of a boot, but that doesn’t happen to be the case. The world is everything that is the case, and what the case is is not a matter of logic.”22 I learned this first hand in the 1990s as the U.S. Attorney for the Southern District of California. Appointed the so-called Border Czar in the Clinton Administration, and tasked to “coordinate” federal law enforcement from southern California to South Texas, success in the position was limited by the existing structure of separate stove pipes zealously maintained by bureaucratic rivalry and an unending competition for resources.
These tensions were swept aside in the crucible of 9/11 and unified border management was created for the first time in American history; and, it happens, for the first time across the globe in the world’s history. Immigration, customs, and agricultural inspection authorities23 exercised by the same officer working for a single agency defined by an overarching security mission, invented the institution of joint border management and the science and art of modern border protection. It sounds so sensible, and in practice it has turned out to be so. But it would not have come to pass in the absence of crisis, and we remain virtually alone in implementing it comprehensively.24 I venture to project that over the next generation most nations will turn to joint border management and wonder in retrospect, as we do, how they could have functioned otherwise. As Arthur Schopenhauer, the philosopher, aptly noted: “Every truth passes through three stages . . . [F]irst, it is ridiculed[;]. . . [S]econd, it is [violently] opposed [;] . . . [and] [T]hird, it is regarded as self-evident.”25
Toward An Integrated National and Homeland Security EnterpriseThe Homeland Security Act of 2002,26 establishing DHS, involved the largest reorganization of executive branch operations since formation of the National Military Establishment in 1947, subsequently renamed as the Department of Defense (“DOD”) in 1949.27 Composed of 240,000 employees,28 DHS is the third largest cabinet agency after DOD and the Department of Veterans Affairs.29 Although the corporate mergers within DHS and CBP are complete, the development and realization of an integrated mission—in terms of both homeland security and border protection—remain very much a work in process. The experience of DOD is instructive.
Established after World War II, the DOD was formed by breaking the Army/Air Force into separate components, then combining them with the Navy and Marines,30 and affiliating the Coast Guard, at that time in the Treasury Department.31 While the Office of the Secretary of Defense worked from the outset toward new mechanisms of coordination, the proud legacies of the individual branches were retained—even fiercely maintained—and the process was slow-going. The lack of a genuinely integrated mission with corresponding joint operations was conspicuous by its absence. When the centrifugal forces at work became tragically apparent in the abortive Iranian hostage rescue mission in 1980 (and the fractured and uneven operation in Grenada to protect U.S. citizens a few years later), Congress stepped in and enacted the Goldwater-Nichols Act,32 requiring purposeful integration and “jointness” in operational planning and execution.33 DOD has been working toward successful integration ever since, resulting in impressive military results. The latest evidence to convince remaining doubters, not few and far between among some admirals and generals, was the flawless, U.S. casualty-free, operation in Abbottabad, Pakistan, to eliminate Osama bin Laden.34

Volume 6, Number 1 119
World Customs Journal
We remain at a very early stage of institutional evolution within DHS and CBP to this end of integrated operations. It likely will take a generation or more to achieve, as was the case with DOD. Hopefully, history will spare us many devastating, precipitating, and accelerating events.
There remains a second compelling requirement for mission integration within the realm of border protection and homeland security. I refer to the larger relationship between the military and law enforcement. The intellectual—largely legal—engineering necessary to create a revised theory that properly aligns these functions and clearly delineates homeland security as a species of national security remains in its infancy. The consequences show up in a variety of places. We struggle to determine whether to try terrorists as criminals in federal court or as enemy combatants before military tribunals.35 We cling to posse comitatus as a constitutional bulwark, yet at the same time many fear it may be an anachronism in an environment of transnational crime and terror.36
In short, the old dichotomies, and our historic American reconciliation of them, no longer serve unquestionably as certain stars by which we can reliably navigate. The current military activities in Afghanistan seem less connected with obtaining classical geopolitical advantage than with assuring that country, or any other country, will not provide a base from which dangerous people and dangerous things can be launched against the United States. Although means and methods differ, this focus is identical to our border protection mission of securing flows of people and goods toward the homeland. There are distinctions here with a real difference to be sure. However, I submit, they need to be re-examined and re-analyzed carefully in a borderless world marked by continuums and flows rather than bright lines alone.
Making Data Into Useable InformationIf borders are flows of people and goods, then those charged with securing and regulating those flows must confront the reality that ninety-seven to ninety-eight percent of the traffic is composed of lawful and compliant trade and travel.37 The goal to identify and interdict dangerous passengers and cargo from among this otherwise legitimate mass generates a requirement to distinguish between high-risk and low-risk subjects.
Risk assessment thereby emerges as the keystone of border management. Information, in turn, becomes central to the evaluation of risk while data are the building blocks of timely and actionable information.
To fulfill its mission CBP has developed the U.S. government’s largest collection, storage, and dissemination functions with respect to unclassified data. On a typical day, CBP exchanges 1.35 billion electronic messages with other government agencies, transportation carriers, customs brokers, and the plethora of additional participants in global travel networks and supply chains. These analytical communications are managed by CBP’s National Targeting Centers for Passengers and Cargo, located in Virginia. They permit access, respectively, to records of each traveler and every cargo shipment—land, sea, and air—that have crossed a U.S. border through a port of entry during the past eight years, legally or illegally. Sophisticated rule searches, utilizing complex algorithms, scan this data for both known and unknown threats based on potential risks identified by DHS and the intelligence community. Targeting in this fashion enhances our capacity to find the dangerous people and dangerous things for which we are on the lookout at the border. Each border-related transaction is scrutinized in this way.
The logic in this environment of information data sharing and access is highlighted. In the modern age, what we learned as children remains true as ever: information is power. However, the traditional moral of the story has been upended entirely. Those who hoard information today, expecting their power to grow by forcing others to ask for it, soon find themselves isolated and over time ignored. The abundance of data and the proliferation online of alternative sources of information place a premium on sharing; one’s information becomes more valuable, i.e., useful and actionable, by leveraging it off of other information and data embodying and reflecting additional reference points that facilitate a connecting of dots.
120 Volume 6, Number 1
International Network of Customs Universities
The implications for bureaucracy are significant as are the tensions with conventional “silo” or “stove-piped” organizational arrangements. As Lawrence Wright makes clear in The Looming Tower, the CIA and the FBI discovered in the immediate aftermath of 9/11 that information unshared in their separate files contained much of what, had it been combined, would have revealed the al Qaida conspiracy.38 To the credit of these agencies, the data and information sharing between them, while not perfect, has increased exponentially during the past decade. This shared counter-terrorist intelligence and information, together with foreign travel-related data supplied by CBP, has proven its worth to homeland security time and time again.39
The obstacles to this happening quickly outside of the counter-terrorist context should not be underestimated. On the international front, border-related data sharing, even among the closest of allies, remains in a primitive stage. Old-fashioned limited views of national interest and reflexive notions of privacy and civil liberties restrict willingness to share and reinforce parochial and myopic concerns of long duration.
Similar influences operate in the domestic sphere where deep-seated bureaucratic divisions persist. This is particularly true when different perspectives on mission are brought to a crime scene. For investigators, guided by the criminal justice model, information is maintained on close hold in case files and evaluated for its potential as “admissible evidence” in a prosecution. For the cop on the beat, this same information may be crucial intelligence key to crime prevention activity at the moment. Failure to act on the information in deference to its subsequent use in the courtroom is the current rule rather than the exception. Over time, this cultural habit of mind will give way to the logic and compelling benefits of intelligence and information sharing. Hopefully, again, catastrophic consequence need not be the mid-wife of inevitable change.
Expediting Legitimate Trade and Travel as a Security RegimeThe long-held view posits that security and trade are independent variables competing in a zero sum game. According to conventional wisdom, trade facilitation, the expedited movement of commerce, and security, ensuring the safety of that commerce must be balanced to an optimal equilibrium. The concept of “so much security” in exchange for “so much delay” in the processing of trade has governed port of entry operations for generations. Risk management, however, comprehensively applied, leaves this notion not only theoretically false but also practically counter-productive and self-defeating.
Short of examining every piece of straw separately, there are only two ways one can find the proverbial needle in a haystack. The first is to have very specific intelligence about where the needle is so that you can reach into the middle of the haystack and pluck it out. Every once in a while, but with increasing frequency, we have access to that kind of granulated intelligence. That is what occurred in the case of the UPS and FedEx parcels from Yemen. We received very concrete information and were able to reach into the global flow of millions of packages then in transit and ferret out the precise two packages laden with explosives.
But we cannot always count on that kind of actionable intelligence. So the only other way to find the needle in the haystack is to make the haystack smaller. And the way to make the stack smaller is to differentiate routinely between high- and low-risk subjects, and expedite movement of the latter through the global system.
In fact, segmenting traffic flows according to risk is a necessary condition of heightening border security at any level of resource allocation. We expedite lawful trade and travel through border controls so that we may focus our scarce regulatory and inspectional resources on that traffic about which we have derogatory information, or about which we lack sufficient information to make a sound judgment regarding its legitimacy. Moving ordinary travelers and regular cargo quickly through ports of entry,

Volume 6, Number 1 121
World Customs Journal
therefore, is not only good for the economy, but given the volumes we confront, it is essential to the security function itself.
Expediting trade and heightened security, accordingly, are neither antithetical to one another nor are they mutually exclusive matters requiring balance. To the contrary they are part and parcel of a single process. This approach to managing flows has become the cornerstone of our system of border management in the United States.
CBP is re-engineering its internal trade functions and field inspection protocols to embody this regulatory model. Trusted Traveler and Trusted Shipper initiatives are central elements key to the strategy.40 Global Entry is a security program that extends expedited clearance to pre-approved low-risk air travelers entering the Unites States.41 The NEXUS and SENTRI programs operate similarly to expedite passage through our land border crossings with Canada and Mexico respectively.42 Comparable benefits in the cargo context are conferred on members of the Customs/Trade Partnership Against Terrorism (“C-TPAT”) program.43
These trusted partner programs offer the same “grand bargain”: in exchange for sharing information with the government that permits it to vet the security status and background of participating persons and entities, the government commits itself to two reciprocal obligations.44 First, it will maintain the information received in confidence and utilize it solely for the purpose it was given. Second, the traveler, importer, or shipper, once vetted and deemed trusted, will receive the benefit of expedited movement into the country.
The dynamic here highlights the crucial importance of genuine partnerships with the public and private sectors as well as with other countries. What is required here is not only the intensification of partnership but a change in the quality and nature of the interaction. Yesterday’s prevailing mode—government mandate and private sector compliance—must give way to the model of a co-created regulatory regime that embodies the “grand bargain” from the outset in reacting to evolving terrorist/transnational crime threats. The joint public-private response in the aftermath of the Yemen cargo plots, Air Cargo Advance Screening (“ACAS”),45 captures the requirement and best illustrates the optimal way forward. Through advance information and early decision-making by all participants in the air cargo supply chain, to include CBP, the Transportation Security Administration, air carriers, freight forwarders, and international postal administrations, we are able to co-create a process to reduce the “haystack” and take action on the “needles” as early in the process as possible. Ultimately, the goal is to establish global requirements for advance information and ensure that high risk cargo identified by ACAS is physically screened under the appropriate regulatory framework and protocols.46
Absent authentic collaboration of this kind we cannot surmount the challenge of scaling up these programs of trust and confidence such that they will yield at once satisfactory material effect on both our security profile and our economic competitiveness.47 Less is not more here; and Malcolm Gladwell’s “tipping point” is the goal.48
United States, Mexico, and Canada: An Intermestic North AmericaThe new border paradigm has special implications—and holds out special promise—for our land border neighbors to the north and south.
The situation is unique, first because of the physical proximity of our geography. We share 1,900 border miles with Mexico and 5,400 miles of border with Canada (including those between Alaska and the Yukon). A second dimension of uniqueness stems from history. Following armed conflicts with each of our neighbors in the nineteenth century, treaties and subsequent peaceful territorial adjustments have blessed us with the longest demilitarized land borders in the world.49
122 Volume 6, Number 1
International Network of Customs Universities
These developments in space and over time have created a relationship between the United States and each of Mexico and Canada that is equally unique. It is a relationship that is neither international in the classical sense nor is it domestic—of course, given the existence of separate sovereignties. Instead, to use a phrase coined by Bayless Manning in the 1970s, the relationship is “intermestic.”50
Notwithstanding all of this, the fact remains that our borders with Mexico and Canada have been and remain largely inefficient from the standpoint of managing flows of people and cargo. The reason for this is the asymmetry between us and our neighbors.51 Only at the border line are we equal as a matter of juridical power as nowhere else in the bilateral relationship. At the border, our neighbors have jealously guarded the prerogatives of sovereignty to reinforce their national pride and identity and to avoid political, economic, and cultural domination by the “colossus” on their threshold. Porfirio Díaz, Mexico’s ruler between 1877 and 1880 and again between 1884 and 1911, summarized the sentiment: “Poor Mexico, so far from God and so near to the United States.”52 Particularly pronounced in Mexico, the same sense has existed among Canadians, albeit expressed on different issues and in different ways.53 Reimagining and then reinventing our borders with Mexico and Canada in the context of trade flows and the flows of people has become crucial on both security and economic grounds.
Regarding commerce, the emergence of global trading blocs highlights the imperative of viewing U.S. economic prosperity increasingly from the perspective of enhancing North American competitiveness. To compete successfully over the next half century with East Asia, the Indian subcontinent, and Brazil, we must take the North American Free Trade Agreement (“NAFTA”) to the next level.54 The critical path to this end is increasing significantly the efficiency of our borders in order to reduce current cross-border transactional costs by ten to twenty percent or more on the “NAFTA Highway.”
With respect to security, the focus must shift from an exclusive one on land border lines, north and south, to one concerned with the necessity for “continental perimeter security.”55 This approach would have Canada, the United States, and Mexico jointly identifying and intercepting dangerous people and things as they move in global flows toward the North American continent. The length of our land borders, coupled with the economic need to avoid “thickening” them (in the Canadian phrase), commends this course. The model here is the North American Air Defense (“NORAD”) command that enables Canada and the United States to jointly track and defend the northern continental airspace from aviation threats to it.56
Under President Obama’s leadership, there is considerable progress to report on both the economic and security fronts with both Mexico and Canada. In May 2010, the President, together with Mexican President Felipe Calderon, issued the Twenty-First Century Border Management declaration.57 Substantially recasting the strategic relationship, the declaration decisively moved the bilateral relationship away from the accusatory conversations of the past over migration and narcotics. Acknowledging the U.S. national security stake in Mexico’s historic struggle against organized crime, the two presidents adopted a doctrine of “co-responsibility” for both legal and illegal flows across the border. Viewing drugs and alien smuggling coming north and guns and bulk cash going south as a single vicious cycle of criminality has created the conditions for bi-national law enforcement cooperation that was unthinkable even five years ago.
The Beyond the Border: A Shared Vision of Perimeter Security and Economic Competitiveness declaration (“Beyond the Border declaration”), created in February 2011 by President Obama and Canadian Prime Minister Stephen Harper, represents an equally stunning departure in the context of United States-Canadian relations.58 Building upon a longer standing and deeper foundation of trust, the Beyond the Border declaration has generated a staggeringly ambitious action plan that encompasses the entire breadth of the United States-Canada security and economic competitiveness agendas. It forthrightly addresses matters that had been deferred politely in the past, ranging from information sharing to the pre-inspection of cargo and the reciprocal carrying of weapons by law enforcement personnel stationed in each other’s country.

Volume 6, Number 1 123
World Customs Journal
These course corrections and strides in U.S. policy have been navigated in parallel process with our neighbors, respecting sensitivities of sovereignty on both ends, as well as the differences and the difficulties inherent in the negotiations. Nonetheless, the stage has been set for an increasingly trilateral discussion over the next generation that holds out enormous promise for the three countries and the North America they share.
ConclusionThe French poet Paul Valéry has observed: “The [challenge of] our times is that the future is not what it used to be.”59 The themes explored here will remain the subjects of security and economic developments over the next decades as we experience their domestic, international, and intermestic effects. Through the lens of lines and flows, we see both an old end and the new beginning of borders.
Notes* Assistant Secretary of International Affairs and Chief Diplomatic Officer (Former Commissioner of U.S. Customs and Border
Protection, 2010-2011), Department of Homeland Security, Washington, DC.1 The U.S. Customs Service was established by the Fifth Act of the First Congress on July 31, 1789. About 1600-1799, U.S.
Dep’t of treaS., http://www.treasury.gov/about/history/Pages/1600-1799.aspx (last updated Nov. 13, 2010).2 Robert Frost, Mending Wall, in the poetry of robert froSt: the ColleCteD poemS, Complete anD UnabriDgeD 33 (Edward
Connery Lathem ed., 1969).3 Monica Ortiz Uribe, El Paso, San Diego Among Safest Cities, KpbS.org (Nov. 22, 2010), http://www.kpbs.org/news/2010/
nov/22/el-paso-san-diego-among-safest-cities/.4 thomaS S. KUhn, the StrUCtUre of SCientifiC revolUtionS 10–13 (2d ed. 1962).5 In Kuhn’s context these shifts marked the transition from a Ptolemaic or pretentious way of seeing —the earth anchors the
universe— to the materially more modest Copernican one —the sun centers the solar system— and so on through a mechanical Newtonian model to the uncertainties inherent in the relativist paradigm captured by Einstein. Id. at 66–91.
6 See Mark Jenkins, Tea Horse Road: The Forgotten Road, nat’l geographiC mag. (May 2010), http://ngm.nationalgeographic.com/2010/05/tea-horse-road/jenkins-text.
7 Charles Hirschman & Elizabeth Mogford, Immigration and the American Industrial Revolution from 1880 to 1920, 38 SoC. SCi. reS. 897 (2009).
8 On a Typical Day in Fiscal Year 2010, CPB…, Cbp.gov (Feb. 25, 2011), http://www.cbp.gov/xp/cgov/about/accomplish/previous_year/fy10_stats/typical_day_fy2010.xml.
9 U.S. CUStomS & borDer prot., import traDe trenDS: fiSCal year 2010 year-enD report 18 (2010) [hereinafter import traDe 2010 report], available at http://www.cbp.gov/linkhandler/cgov/trade/trade_programs/trade_trends/itt.ctt/itt.pdf.
10 Securing America’s Borders: CBP Fiscal Year 2010 in Review Fact Sheet, Cbp.gov (Mar. 15, 2011), http://www.cbp.gov/xp/cgov/newsroom/fact_sheets/cbp_overview/fy2010_factsheet.xml [hereinafter CBP 2010 in Review Fact Sheet].
11 American territory, of course, was again invaded in 1941 by Japan’s sneak attack at Pearl Harbor.12 Edward Alden, Companies Take Action as Visa Curbs Hurt Trade, fin. timeS, Jan. 29, 2003 at 7; See generally eDwarD alDen,
the CloSing of the ameriCan borDer (Harper Collins Publishers 2008). 13 In addition, we have been subject to “home-grown” terrorist events such as that carried out at Fort Hood by Maj. Nidal
Hasan, the attack on the New York subway system planned by Najibullah Zazi and the murder of a military recruiter in Arkansas. Robert D. McFadden, Army Doctor Held in Ft. Hood Rampage, n.y. timeS (Nov. 6, 2009), http://www.nytimes.com/2009/11/06/us/06forthood.html?ref=nidalmalikhasan.
14 Kenneth Chang, Explosive on Flight 253 is Among Most Powerful, N.y. timeS (Dec. 7, 2009), http://www.nytimes.com/2009/12/28/us/28explosives.html.
15 Ten Years after 9/11: Can Terrorists Still Exploit Our Visa System?: Hearing Before the H. Comm. on Homeland Sec. Subcomm. on Border & Mar. Sec., 112th Cong. 2 (2011) (statement of Edward J. Ramotowski, Acting Assistant Sec’y for Visa Services, Dep’t of State), available at http://homeland.house.gov/sites/homeland.house.gov/files/Testimony%20Ramotowski.pdf.
16 Mark Mazzetti & Scott Shane, Evidence Mounts for Taliban Role in Bomb Plot, N.Y. timeS (May 5, 2010), http://www.nytimes.com/2010/05/06/nyregion/06bomb.html.
17 Erika Solomon & Phil Stewart, Al Qaeda Yemen Wing Claims Parcel Plot, UPS Crash, reUterS (Nov. 5, 2010), http://www.reuters.com/article/2010/11/05/us-usa-yemen-bomb-idUSTRE6A44PU20101105.
124 Volume 6, Number 1
International Network of Customs Universities
18 Frederick Jackson Turner, The Significance of the Frontier in American History, in freDeriCK JaCKSon tUrner: wiSConSin’S hiStorian of the frontier 26-47 (Martin Ridge ed., 1986).
19 See generally albert Katz weinberg, manifeSt DeStiny: a StUDy of nationaliSt expanSioniSm in ameriCan hiStory (Quadrangle Books 1963)(1935).
20 History: Who Became Part of the Department?, Dep’t of homelanD SeC., http://www.dhs.gov/xabout/history/editorial_0133.shtm (last visited Feb. 26, 2012).
21 See The Future is Now, U.S. CUStomS toDay (Feb. 2003), http://www.cbp.gov/xp/CustomsToday/2003/February/future.xml.22 John barth, the enD of the roaD 76 (rev. ed. 1967) (emphasis omitted).23 CBP also serves as the single executive agent for forty other federal agencies charged with administrative or regulatory
duties regarding incoming and outgoing people and things. These include, notably, the Food and Drug Administration, the Environmental Protection Agency, the Consumer Products Safety Commission, and the Department of Transportation.
24 Canada, the United Kingdom, and Australia are among a handful of countries which have taken steps, large and small, toward unification. Each, however, has stopped short of a full merger of responsibilities. The Canadian Border Services Agency (“CBSA”), for example, regulates the ports of entry while the Royal Canadian Mounted Police (“RCMP”), separately governed, acts between the ports of entry and elsewhere through the interior of the country. The Australian Customs and Border Protection Services (“ACBP”) shares border-related responsibilities with the Department of Immigration and Citizenship (“DIAC”). The United Kingdom Border Agency (“UKBA”), authorized to enforce immigration laws and collect customs duties, is not charged with counter-terrorist responsibilities.
25 the harper booK of QUotationS 451 (Robert I. Fitzhenry ed., 3d ed. 1993) (quoting Arthur Schopenhauer) [hereinafter harper booK of QUotationS].
26 Homeland Security Act of 2002, Pub. L. No. 107-296, 116 Stat. 2135.27 About the Department of Defense (DOD), U.S. Dep’t of Def., http://www.defense.gov/about/ (last visited Feb. 26, 2012)
[hereinafter About the DOD].28 About, Dep’t of homelanD SeC., http://www.dhs.gov/xabout/ (last updated Feb. 13, 2012).29 The Executive Branch, white hoUSe, http://www.whitehouse.gov/our-government/executive-branch (last visited Feb. 26,
2012).30 About the DOD, supra note.31 The Coast Guard became part of the Department of Homeland Security in 2003. Coast Guard History: When Was the Coast
Guard Established?, U.S. CoaSt gUarD, http://www.uscg.mil/history/faqs/when.asp (last modified Jan. 31, 2012). 32 Goldwater-Nichols Department of Defense Reorganization Act of 1986, Pub. L. No. 99-433, 100 Stat. 992 (codified at 10
U.S.C. § 101 et seq. (2006)).33 Bruce Berkowitz, Intelligence Reform: Less Is More, hoover DigeSt (Apr. 30, 2004), http://www.hoover.org/publications/
hoover-digest/article/6809.34 Peter Baker, Helene Cooper & Mark Mazzetti, Bin Laden is Dead, Obama Says, n.y. timeS (May 1, 2011), http://www.
nytimes.com/2011/05/02/world/asia/osama-bin-laden-is-killed.html?_r=1&hp.35 See Civilian, Military Trials Prosecute Terrorism Suspects Differently, USA TODAY (Nov. 22, 2009, 11:58 PM), http://www.
usatoday.com/news/washington/2009-11-22-civilian-vs-military-trials_N.htm.36 See Nathan Canestaro, Homeland Defense: Another Nail in the Coffin for Posse Comitatus, 12 waSh. U. J.l. & pol’y 99,
99–144 (2003).37 import traDe 2010 report, supra note 9, at 18.38 See lawrenCe wright, the looming tower: al-QaeDa anD the roaD to 9/11 (2006). 39 Two notable cases involve the arrest and conviction of U.S. lawful permanent resident Najibullah Zazi and U.S. born citizen
David Coleman Headley, formerly known as Daood Sayed Gilani. See United States v. Zazi, No. 09-CR-663, 2010 WL 2710605 (E.D.N.Y. June 30, 2010); United States v. Kashmiri, No. 09 CR 830-4, 2011 WL 1326373, at *1–5 (N.D. Ill. Apr. 1, 2011). Zazi was recruited by al Qaida to conduct suicide attacks using explosives against the New York City subway system. See Zazi, 2010 WL 2710605, at *1. Headley helped plan the November 2008 attacks in Mumbai in concert with al Qaida and Pakistan-based terrorist organization Lashkar-e-Taiba. See Kashmiri, 2011 WL 1326373, at *1–2; Sebastian Rotella The American Behind India’s 9/11—And How U.S. Botched Chances to Stop Him, pro pUbliCa (November 22, 2011, 10:52 AM), http://www.propublica.org/article/david-headley-homegrown-terrorist.
40 Budget Hearing Before the H. Appropriations Comm., Subcomm. on Homeland Sec., 112th Cong. 181–87 (2011) (testimony of Comm’r Alan Bersin, U.S. Customs & Border Prot.), available at http://www.dhs.gov/ynews/testimony/testimony_1300738129469.shtm.
41 Id.42 See Trusted Traveler Programs, U.S. CUStomS & borDer prot., http://www.cbp.gov/xp/cgov/travel/trusted_traveler/ (last
visited Feb. 26, 2012).

Volume 6, Number 1 125
World Customs Journal
43 See C-TPAT: Overview, Cbp.gov, http://www.cbp.gov/xp/cgov/trade/cargo_security/ctpat/what_ctpat/ctpat_overview.xml (last visited Feb. 26, 2012).
44 import traDe 2010 report, supra note 9, at 1–18.45 Cargo Security: Advance Electronic Information & Screening, IATA (Oct. 2011), http://www.iata.org/whatwedo/cargo/tracker/
october-2011/pages/security.aspx.46 An analogous approach to the regulation of passengers in the context of international partnerships exists in the Visa Waiver
Program (VWP). VWP travelers must use secure, machine readable travel documents and must obtain pre-travel authorization from the Electronic System for Travel Authorization (ESTA) before embarking for the United States. Countries participating in the program, currently thirty-six in number, must meet heightened security standards that are periodically verified and offer visa free travel to U.S. citizens and nationals. See 8 USC 1187 (2006); 8 USC 1732(c) (2006).
47 Commencing in December 2010, CBP has integrated its trusted traveler programs by extending Global Entry benefits to NEXUS and SENTRI members and vice-versa. Global Entry Expansion Federal Notice Published, CBP.gov (Dec. 29, 2010), http://www.cbp.gov/xp/cgov/travel/travel_news/global_published.xml. Nearly one million persons presently participate. CBP 2010 in Review Fact Sheet, supra note 10. More than ten-thousand companies are validated in the C-TPAT Cargo security program. C-TPAT Reaches 10,000 Members, 4 frontline mag., no. 1 Winter 2011, at 5, available at http://nemo.cbp.gov/opa/frontline/winter_frontline2011.pdf. On the international front, CBP has developed and continues to strengthen supply chain security through “mutual recognition agreements” with trusted partners in cargo to include Canada, the European Union, Japan, Jordan, Korea, and New Zealand. CBP has non-binding trusted traveler agreements with Brazil, Canada, Germany, Korea, Mexico, the Netherlands, Qatar and the United Kingdom. See Susan Holliday, Global Entry Takes Off: Private-Sector Support Fuels Boost in Frequent Flier Program, 4 frontline mag., no. 1, Winter 2011, at 11, available at http://nemo.cbp.gov/opa/frontline/winter_frontline2011.pdf.
48 malColm glaDwell, the tipping point (2000).49 The Rush-Bagot Treaty in 1817 with Canada (through Britain following the War of 1812) and the Treaty of Guadalupe Hidalgo
in 1848, concluding the U.S.-Mexico War, established lasting peace. Additional boundary agreements were reached amicably: with Canada (British North America) through the Webster-Ashburton Treaty (1842) and the Oregon Treaty (1846), and with Mexico through the Gadsden Purchase (1853). See Milestones, off. of the hiStorian, http://history.state.gov/milestones (follow “1801-1829” or “1830-1860” hyperlink; then select border agreement name) (last visited Feb. 26, 2012).
50 Bayless Manning, The Congress, The Executive and Intermestic Affairs: Three Proposals, 55 foreign aff. 306, 309 (1977).51 The populations of the United States, Canada, and Mexico are 313 million, 34 million and 113 million, respectively. Country
Comparison: Population, in Central intelligenCe agenCy, the worlD faCtbooK (July 2011)[hereinafter worlD faCtbooK], available at https://www.cia.gov/library/publications/the-world-factbook/rankorder/2119rank.html. Economically, their gross domestic products are $15.04 trillion (U.S.), $1.39 trillion (Canada), and $1.657 trillion. Field Listing: GDP (Purchasing Power Parity), in worlD faCtbooK, supra, available at https://www.cia.gov/library/publications/the-world-factbook/fields/2001.html.
52 harper booK of QUotationS, supra note 25, at 31; Chronology of Leading Historical Events in Mexico, in ranDolph wellforD Smith, benighteD mexiCo 383 (1916).
53 See, e.g., Meg Bortin, Global Poll Shows Wide Distrust of United States, n.y. timeS (June 27, 2007), http://www.nytimes.com/2007/06/27/news/27iht-pew.4.6365578.html?pagewanted=all.
54 Known as Tratado de Libre Comercio (“TLC”) in Mexico, NAFTA dramatically expanded annual U.S. trade flows (imports and exports) with Canada ($525.3 billion in 2010) and Mexico ($393 billion in 2010), making them our first and third largest commercial partners. Top Trading Partners, foreign traDe StatiStiCS, http://www.census.gov/foreign-trade/statistics/highlights/top/top1012yr.html (last updated July 12, 2011). The second, fourth and fifth rankings belong respectively, to China ($456.8 billion in 2010), Japan ($180.9 billion in 2010) and Germany ($130.9 billion in 2010). Id.
55 See, e.g., John Noble, Fortress America or Fortress North America, 11 L. & bUS. rev. am. 461 (2005).56 Canadian and U.S. military forces rotate NORAD command responsibilities. On 9/11, for example, General Ralph Eberhart of
the USAF was the military officer in charge of leading NORAD’s response to the terrorist attack and his Deputy Commander was Lieutenant-General Kenneth Pennie of the Canadian Forces Air Command. See Adam J. Hebert, The Return of NORAD, 85 air forCe mag., no. 2., Feb. 2002, at 50 available at http://www.airforce-magazine.com/MagazineArchive/Documents/2002/February%202002/0202norad.pdf.
57 Twenty-First Century Border Management, U.S.-Mex., May 19, 2010 (declaration of U.S. Pres. Obama & Mex. Pres. Calderon), available at http://www.whitehouse.gov/the-press-office/declaration-government-united-states-america-and-government-united-mexican-states-c.
58 Beyond the Border: A Shared Vision for Perimeter Security and Economic Competitiveness, U.S.-Can., Feb. 4, 2011 (declaration of U.S. Pres. Obama. & Can. Prime Minister Harper), available at http://www.dhs.gov/xlibrary/assets/wh/us-canada-btb-action-plan.pdf.
59 See the greateSt QUotationS of all time 264 (Anthony St. Peter ed., 2010)

126 Volume 6, Number 1
International Network of Customs Universities
Alan D BersinAssistant Secretary for International Affairs and Chief Diplomatic Officer Department of Homeland Security
Alan Bersin serves as Assistant Secretary for International Affairs and Chief Diplomatic Officer for the Department of Homeland Security where he oversees the Department’s international engagement. Previously, he served as Commissioner of U.S. Customs and Border Protection. From April 2009 to March 2010 Mr Bersin served as Assistant Secretary for International Affairs and Special Representative for Border Affairs in the Department of Homeland Security.
Alan Bersin’s other public service included Chairman of the San Diego County Regional Airport Authority (December 2006 to March 2009), California’s Secretary of Education (July 2005 to December 2006) and Superintendent of Public Education in San Diego from 1998 to 2005. Mr Bersin also served as a member and then Chairman of the California Commission on Teacher Credentialing. From 1993 to 1998, he served as the United States Attorney for the Southern District of California and as the Attorney General’s Southwest Border Representative responsible for coordinating federal law enforcement on the border from South Texas to Southern California. Mr Bersin previously was a senior partner in the Los Angeles law firm of Munger, Tolles & Olson.
In 1968, Mr Bersin received his A.B. in Government from Harvard University (magna cum laude). From 1969 to 1971, he attended Balliol College at Oxford University as a Rhodes Scholar. In 1974, he received his J.D. degree from the Yale Law School.
Section 4
Reference Material

128 Volume 6, Number 1
International Network of Customs Universities

World Customs Journal
Volume 6, Number 1 129
Guidelines for contributorsThe World Customs Journal invites authors to submit papers that relate to all aspects of customs activity, for example, law, policy, economics, administration, information and communications technologies. The Journal has a multi-dimensional focus on customs issues and the following broad categories should be used as a guide.
Research and theory The suggested length for articles about research and theory is approximately 5,000 words per article. Longer items will be accepted, however, publication of items of 10,000 or more words may be spread over more than one issue of the Journal.
Original research and theoretical papers submitted will be reviewed using a ‘double blind’ or ‘masked’ process, that is, the identity of author/s and reviewer/s will not be made known to each other. This process may result in delays in publication, especially where modifications to papers are suggested to the author/s by the reviewer/s. Authors submitting original items that relate to research and theory are asked to include the following details separately from the body of the article:
• title of the paper• names, positions, organisations, and contact details of each author• bionotes (no more than 100 words for each author) together with a recent, high resolution, colour photograph for
possible publication in the Journal• an abstract of no more than 100 words for papers up to 5,000 words, or for longer papers, a summary of up to
600 words depending on the length and complexity of the paper.
Please note that previously refereed papers will not be refereed by the World Customs Journal.
Practical applications, including case studies, issues and solutions These items are generally between 2,000 and 5,000 words per article. Authors of these items are asked to include bionotes (no more than 100 words for each author) together with a recent, high resolution, colour photograph for possible publication in the Journal. The Editorial Board will review articles that relate to practical applications.
Reviews of books, publications, systems and practices The suggested length is between 350 and 800 words per review. The Editorial Board will review these items submitted for publication.
Papers published elsewhereAuthors of papers previously published should provide full citations of the publication/s in which their paper/s appeared. Where appropriate, authors are asked to obtain permission from the previous publishers to re-publish these items in the World Customs Journal, which will acknowledge the source/s. Copies of permissions obtained should accompany the article submitted for publication in the World Customs Journal.
Authors intending to offer their papers for publication elsewhere—in English and/or another language—are asked to advise the Editor-in-Chief of the names of those publications.
Where necessary and appropriate, and to ensure consistency in style, the editors will make any necessary changes in items submitted and accepted for publication, except where those items have been refereed and published elsewhere. Guidance on the editors’ approach to style and referencing is available on the Journal’s website.
Letters to the EditorWe invite Letters to the Editor that address items previously published in the Journal as well as topics related to all aspects of customs activity. Authors of letters are asked to include their name and address (or a pseudonym) for publication in the Journal. As well, authors are asked to provide full contact details so that, should the need arise, the Editor-in-Chief can contact them.
All items should be submitted in Microsoft Word or RTF, as email attachments, to the Editor-in-Chief: [email protected]

130 Volume 6, Number 1
International Network of Customs Universities
EDITORIAL BOARDProfessor David Widdowson
University of Canberra, Australia Editor-in-Chief
Professor David Widdowson is Chief Executive Officer of the Centre for Customs & Excise Studies at the University of Canberra. He is President of the International Network of Customs Universities; a member of the WCO’s PICARD Advisory Group, and a founding director of the Trusted Trade Alliance. David holds a PhD in Customs Management, and has over 30 years experience in his field of expertise, including 21 years with the Australian Customs Service. His research areas include trade facilitation, regulatory compliance management, risk management and supply chain security.
Professor Hans-Michael WolffgangUniversity of Münster, Germany
Professor Dr Hans-Michael Wolffgang is Professor of International Trade and Tax Law and Head of the Department of Customs and Excise which forms part of the Institute of Tax Law at the University of Münster, Germany. He is director of the Münster Master studies in Customs Administration, Law and Policy and has written extensively on international trade law, customs law and export controls in Europe.
Dr Andrew GraingerThe University of Nottingham, UK
Dr Andrew Grainger is an experienced trade facilitation practitioner and academic. He is currently based at Nottingham University Business School and is regularly consulted by governments, companies and international organisations. In previous roles, Andrew worked as Deputy Director at SITPRO, the former UK trade facilitation agency, and Secretary for EUROPRO, the umbrella body for European trade facilitation organisations. His PhD thesis on Supply Chain Management and Trade Facilitation was awarded the Palgrave Macmillan Prize in Maritime Economics and Logistics 2005-2008 for best PhD thesis.
Dr Juha HintsaCross-border Research Association and Hautes Etudes Commerciales (HEC), University of Lausanne, Switzerland
Dr Juha Hintsa is a Senior Researcher in global supply chain security management. He is one of the founding partners of the Global Customs Research Network, and the founder of the Cross-border Research Association (CBRA) in Lausanne, where he undertakes research into various aspects of supply chain security management in close collaboration with several multinational corporations. Juha’s PhD thesis was on ‘Post-2001 supply chain security: impacts on the private sector’.

World Customs Journal
Volume 6, Number 1 131
Sub-editors
Elaine EcclestonUniversity of Canberra, Australia
Elaine Eccleston, BA, MA, developed the Information and Knowledge Management subjects taught at the University of Canberra. She was Manager, Information and Knowledge Management at the Australian Trade Commission, and has worked in these fields for the Australian Taxation Office, the Department of Foreign Affairs & Trade, and as Manager, Information & Records Management, BP Oil UK. She is Editor, at the Centre for Customs & Excise Studies, University of Canberra.
Dr Christopher DallimoreDr Christopher Dallimore studied Law and German at the University of Wales, Cardiff and obtained a Magister Legum at Trier University, Germany. His doctoral thesis was on the legal implications of supply chain security. For a number of years, Chris was Course Co-ordinator of the Master of Customs Administration postgraduate program at Münster University, Germany, and currently works for the Trusted Trade Alliance Europe GmbH. He is a lecturer at Münster University and translator of a number of legal texts.

132 Volume 6, Number 1
International Network of Customs Universities