world-class technology for the newest waste-to-energy
TRANSCRIPT

1
World-Class Technology for the Newest Waste-to-Energy Plant in the United States — Palm Beach Renewable Energy Facility No. 2
Presented to: Renewable Energy World International BR-1935
Orlando, Florida, U.S.A.
December 13-15, 2016
J.B. Kitto, Jr., M.D. Fick, and L.A. Hiner
The Babcock & Wilcox Company, Barberton, Ohio, U.S.A.
W.J. Arvan
Palm Beach Resource Recovery Corporation, West Palm Beach, Florida, U.S.A.
R.H. Schauer
Solid Waste Authority of Palm Beach County, West Palm Beach, Florida, U.S.A.
Abstract
On July 18, 2015, Palm Beach Renewable Energy Facility No. 2 (PBREF No. 2) began commercial
operation following successful completion of the plant acceptance tests. The plant is owned by the Solid Waste
Authority (SWA) of Palm Beach County and is the first greenfield waste-to-energy (WTE) facility to come online in
North America in 20 years. Combining the best of U.S. and European WTE emissions control and metals recovery
technologies, PBREF No. 2 is the cleanest, most efficient plant of its kind in the world today. Advanced
technologies provide better than zero water discharge, emissions at or below the best natural gas turbines, better than
net-zero greenhouse gas (carbon equivalent) footprint, and a Leadership in Energy and Environmental Design
(LEED®) Platinum-level Education Center. This presentation begins with background on municipal solid waste
(MSW) and then provides an overview of the project and plant, summary of the WTE and emissions control
technologies and finally, acceptance test results and economics. PBREF No. 2 is at the forefront of renewed interest
in WTE plants in North America as reliable, economical generators of renewable energy and material recycling.
WTE is a key part of a comprehensive solid waste management strategy to minimize/eliminate landfilling as
demonstrated in Europe and is a critical part of integrated greenhouse gas (carbon equivalent) footprint control and
minimization.
Introduction and MSW Background
Municipal solid waste (MSW) or more simply, trash or garbage, is part of everyday life. How MSW is
handled, processed and disposed of involves both a need to protect the environment and an opportunity to take
advantage of the resource it represents to benefit society. Waste-to-energy (WTE) plants such as Palm Beach
Renewable Energy Facility No. 2 (PBREF No. 2) are part of a broader comprehensive solid waste management
strategy which minimizes waste, recycles resources, recovers renewable energy and ultimately minimizes or
eliminates disposal of any residuals in landfills. The goal is to manage MSW in the most productive and sustainable
way possible.
The PBREF No. 2 is the first greenfield plant addition to the U.S. WTE fleet in 20 years, and is the cleanest
most advanced plant of its kind in the world as of this writing. The plant design builds upon U.S. technology and
experience while incorporating dramatic technology advancements over the past 20 years from Europe where
hundreds of new WTE plants have been (and continue to be) placed into operation as part of Europe’s aggressive
program to eliminate long-term landfill needs.
According to the U.S. Environmental Protection Agency (EPA)1-4
, every person in the United States (U.S.)
generated an average of 4.4 lb (2 kg) of MSW each day in 2013. In typical metropolitan areas with a population of
1.5 million people, this would result in the need to manage 3300 tons per day (TPD [3000 tm/d]) or 1,200,000 tons
(1.1 Mtm) per year. By common convention, MSW is household and commercial waste but excludes construction
and demolition debris. As shown in Fig. 1, U.S. MSW contains high percentages of paper and plastics resulting in a
higher heating value and lower moisture content than other MSW found around the world.
Fig. 2 illustrates an integrated strategic approach to managing MSW in a way which maximizes the benefit
of the material and renewable energy recovery with minimum environmental impact. Clearly, the first stage is self-

2
evident: minimizing generation of the waste materials to start with and reusing the materials. The level of reduction
here is a matter of economics (saving money), technology (product design and material recovery) and in some cases
regulations which may mandate recovery. Recycling and composting are the next steps in the strategy with curbside
recycling programs and home composting combined with post-collection material separation in large-scale Material
Recovery and Recycling Facilities (MRRFs) and large-scale compositing facilities. The balance between individual
and community programs depends upon location, cost and willingness to participate. After recycling and compost
diversion, the balance of the material is largely paper and biomass/organics that contain significant quantities of
usable energy. This can be used as a fuel for modern WTE plants to generate electricity and, depending upon
location, steam for industrial processes and heating purposes. WTE plants also offer the capability to recover more
metals and plastics depending upon the WTE technology used, thereby increasing the overall recycle rate. Finally,
the inert residue from the WTE plant can be used for a variety of applications depending upon local regulations
(such as aggregate for concrete, road fill and ground cover) or disposed of in a landfill.
Fig. 1 U.S. MSW generation by material, 2013 (References 2 and 4). Based upon 254.1 million tons (231 million
tm) before recycling and composting.
Fig. 2 Integrated waste management strategy. (Reference 5)
In the U.S., the balance between recycle/compost, landfill and WTE varies widely by region and state.5,6
In
2013, the U.S. recycled/composted 34.3% of its MSW while 52.8% was disposed of directly in landfills.3 The

3
balance of 12.9% was combusted in 77 WTE plants with a capacity to generate 2.5 GWe of electricity.5 At the same
time, Europe has made much greater progress in reducing MSW sent to landfills. In aggregate during 2013, the
European Community (EC) recycled/composted 43% of its MSW and landfilled just 31% with the balance of 26%
processed in 459 WTE plants (90 million tons per year).7 In some of the most advanced countries such as Denmark,
45% of the MSW is recycled/composted and 53% is processed in 27 WTE plants, leaving just 2% of the material
going to landfills. (See Fig. 3.)
Fig. 3 Comparison of U.S. and Denmark MSW disposition (2013).
As discussed in Reference 8, there are two basic WTE plant technologies with the decision of which to use
depending upon location specific parameters and economics. The first technology is mass burn where the MSW is
fed directly to the boiler system without any significant processing. The post-combustion residual is then processed
to recover and recycle remaining metals while the balance is used in a beneficial application (example road-fill) or
landfilled. The second technology is refuse derived fuel (RDF) where the MSW is processed first to remove metals
and low-Btu residue (glass, grit, foodstuffs, etc.) before being processed into a reasonably uniform-sized fuel for
combustion. With the extensive curb-side recycling programs already in place as well as limited long-term landfill
capacity, PBREF No. 2 was designed using mass burn technology with state-of-the-art post-combustion metals
recovery.
Project Overview
In December of 2008, the Solid Waste Authority (SWA) of Palm Beach County, Florida, began the process
of selecting a team to design, build and operate a new greenfield 3000 TPD (2700 tm/d) WTE plant based upon mass
burn technology with the issuance of the PBREF No. 2 comprehensive bid package and specifications. A key
element in the evaluation process was a 20-year net present value analysis including capital costs, operation and
maintenance costs, and beneficial revenue streams including electricity production. On April 13, 2011, SWA
awarded the Design/Build contract to the Babcock & Wilcox (B&W)-led team. SWA is the owner of the facility
with Arcadis serving as owner’s engineer. The B&W team consisted of B&W supplying the major equipment
including boilers, combustion grate systems, emissions control systems, metals recovery/processing equipment,
emissions monitoring systems, and ash handling equipment, and KBR with its subcontractor CDM Smith handling
the balance-of-plant material and construction. B&W also received a parallel contract for the 20-year operation and
maintenance (O&M) of the new facility. PBREF No. 2 achieved commercial operation and start of the O&M
contract in July of 2015 with completion of the acceptance tests.
This new plant is located adjacent to the existing SWA-owned RDF-fired WTE plant (PBREF No. 1) which
B&W has operated since commercial operations began in November of 1989 (current capacity 2650 TPD [2400

4
tm/d]). These facilities are the cornerstone of the SWA’s Integrated Solid Waste Management System serving the 1.4
million residents of Palm Beach County and handling 100% of the MSW after the extensive curbside recycling
programs.
Plant Overview
Fig. 4 provides an overview of PBREF No. 2 from June 2015 looking from the northeast to the southwest.
PBREF No. 2 is located on a 24-acre site. The major operating segments of the plant are identified and include: the
tipping floor, refuse pit (360 x 100 ft [110 x 30 m]), boilers, emissions control (spray dryer absorbers, fabric filters,
carbon injection and SCR reactors), air-cooled steam condenser and turbine generator set. The ash management
building houses the metals recovery systems as well as the ash processing equipment which mixes and conditions
the material prior to shipment to the landfill.
The Education Center is an important element of the plant design. The SWA conducts extensive tours and
educational sessions for the school children and citizens of the county describing the overall MSW management
process as well as the WTE plant operation. To facilitate the educational experience, the Education Center
incorporates some of the latest interactive educational displays and tools available. As shown in Fig. 4 an elevated
walkway connects the Education Center to the WTE complex and enables the visitors to experience all phases of the
WTE operation during the walking tour. Finally, the 2-million gallon rainwater retention tank is part of the water
management system discussed below.
Jog Road provides site access and serves as the eastern facility boundary. At the top right is the 23 square-
mile Grassy Waters Everglades Preserve, a wildlife sanctuary which also serves as the western boundary of the
facility as well as the water supply for West Palm Beach and surrounding communities. At the top left of the figure,
the PBREF No. 1 serves as the southern boundary.
Fig. 4 PBREF No. 2 plant overview (from June 2015 looking from northeast to southwest).
Fig. 5 provides a sectional side-view of the plant looking west and approximately to scale. There are three
independent parallel boiler/grate/emissions control lines rated at 1000 TPD (907 tm/d) each, with one line shown in
the figure. The MSW is received on the tipping floor with the majority delivered by a fleet of SWA-owned tractors
with walking-floor trailers which service one of six transfer stations located across the county. MSW is also
delivered by local collection trucks not serviced by a transfer station, private industry vehicles and other SWA-
directed sources including PBREF No. 1 process residue and out-of-county waste. The MSW is dumped into the
refuse pit where it is mixed and managed by three Konecranes semi-automated refuse cranes though no more than
Grassy Waters Everglades Preserve
Tipping Floor
Spray Dryer Absorbers
SCRs and Pulse Jet Fabric Filters
Air-cooled Condenser
Education Center
Warehouse & Maintenance
Refuse Pit
Ash Management
Jog Road
Boilers
Turbine Generator (behind Boiler)
Rainwater Storage Tank

5
two cranes are required at any time. The refuse cranes also deliver the MSW to a charging hopper at the inlet to the
boiler. From the hopper, the MSW is fed to the grate where the combustion process begins. The combustion is
completed as the flue gas passes upward through the boiler where heat is recovered to generate steam for power
generation. The cooled flue gas then passes through the emissions control equipment consisting of powder activated
carbon (PAC) injection, spray dryer absorber (SDA), pulse jet fabric filter (PJFF), gas-to-gas heat exchanger, and
selective catalytic reduction (SCR) reactor. Finally, induced draft fans exhaust the cleaned gas to the stack. Steam
generated in the three boilers powers a single General Electric steam turbine generator set nominally rated at 95
megawatts (MWe), with the power, net of parasitic load, being supplied to Florida Power & Light under a power
purchase agreement. Steam is exhausted from the turbine to an SPX air-cooled steam condenser and the condensate
returned to the power cycle. Not shown in Fig. 5 is the metals recovery system for the boiler bottom ash. Ferrous
material (iron) is collected using a rotating drum electro-magnetic separator and other non-ferrous metals
(predominately aluminum) are then collected using an eddy current separator.
Fig. 5 Side view of PBREF No. 2 looking west showing one of three process lines. (Not shown: turbine generator
behind and metals recovery/ash management in the foreground)
Sustainability and Energy Efficiency
Superior sustainability and energy efficiency are important to SWA. A number of major plant features
focus on these areas:
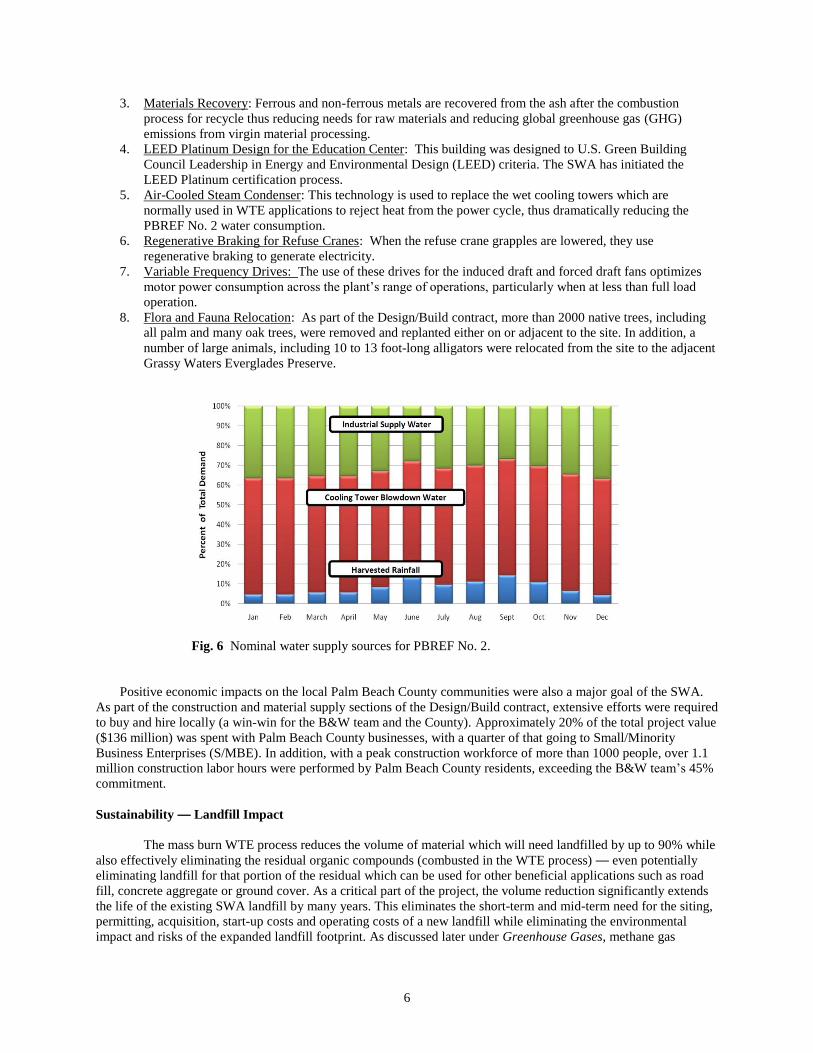
1. Water Conservation: PBREF No. 2 has been designed around a better than net zero discharge philosophy
and minimum water usage. As shown in Fig. 6, the water supply for the plant includes:
a. Harvested rainwater from the major PBREF No. 2 building roofs and the PBREF No. 1 tipping
floor roof which is stored in a 2-million gallon (7.6 million liter) storage tank shown in Fig. 4.
Depending upon the time of year, this source will typically supply 5 to 15% of the plant water
needs.
b. Cooling tower blowdown from PBREF No. 1 which has historically been deep well injected. This
source supplies about 60% of the plant water needs — reducing the deep well injection from the
total PBREF site below the PBREF No. 1 rate, thus providing better than net zero discharge for
the PBREF No. 2 addition.
c. Off-site industrial water. This source provides the balance of the water needs, seasonally ranging
from 25-35% of the total plant water requirements.
d. Neither de-chlorinated water nor potable water is required for normal plant operations.
2. Energy Recovery: PBREF No. 2 was designed to optimize the recovery of energy from the MSW to
maximize recycle of the energy from the raw and manufactured materials back into the economic system
— helping to better close the energy loop while reducing greenhouse gas emissions.
DynaGrate®
PAC
6
3. Materials Recovery: Ferrous and non-ferrous metals are recovered from the ash after the combustion
process for recycle thus reducing needs for raw materials and reducing global greenhouse gas (GHG)
emissions from virgin material processing.
4. LEED Platinum Design for the Education Center: This building was designed to U.S. Green Building
Council Leadership in Energy and Environmental Design (LEED) criteria. The SWA has initiated the
LEED Platinum certification process.
5. Air-Cooled Steam Condenser: This technology is used to replace the wet cooling towers which are
normally used in WTE applications to reject heat from the power cycle, thus dramatically reducing the
PBREF No. 2 water consumption.
6. Regenerative Braking for Refuse Cranes: When the refuse crane grapples are lowered, they use
regenerative braking to generate electricity.
7. Variable Frequency Drives: The use of these drives for the induced draft and forced draft fans optimizes
motor power consumption across the plant’s range of operations, particularly when at less than full load
operation.
8. Flora and Fauna Relocation: As part of the Design/Build contract, more than 2000 native trees, including
all palm and many oak trees, were removed and replanted either on or adjacent to the site. In addition, a
number of large animals, including 10 to 13 foot-long alligators were relocated from the site to the adjacent
Grassy Waters Everglades Preserve.
Fig. 6 Nominal water supply sources for PBREF No. 2.
Positive economic impacts on the local Palm Beach County communities were also a major goal of the SWA.
As part of the construction and material supply sections of the Design/Build contract, extensive efforts were required
to buy and hire locally (a win-win for the B&W team and the County). Approximately 20% of the total project value
($136 million) was spent with Palm Beach County businesses, with a quarter of that going to Small/Minority
Business Enterprises (S/MBE). In addition, with a peak construction workforce of more than 1000 people, over 1.1
million construction labor hours were performed by Palm Beach County residents, exceeding the B&W team’s 45%
commitment.
Sustainability — Landfill Impact
The mass burn WTE process reduces the volume of material which will need landfilled by up to 90% while
also effectively eliminating the residual organic compounds (combusted in the WTE process) — even potentially
eliminating landfill for that portion of the residual which can be used for other beneficial applications such as road
fill, concrete aggregate or ground cover. As a critical part of the project, the volume reduction significantly extends
the life of the existing SWA landfill by many years. This eliminates the short-term and mid-term need for the siting,
permitting, acquisition, start-up costs and operating costs of a new landfill while eliminating the environmental
impact and risks of the expanded landfill footprint. As discussed later under Greenhouse Gases, methane gas

7
emissions from the new landfilled MSW are eliminated and energy recovered. Odors from new landfilled MSW
materials are eliminated with the destruction of the source organic compounds. Finally, the WTE process effectively
eliminates new MSW landfill gaseous emissions of a variety of hazardous volatile organic and chlorinated
hydrocarbons including ammonia, mercaptains/sulfides, toluenes, dichloromethane, and acetone among others.
Boiler, Grate and Combustion Technologies
Three independent parallel 1000 TPD (907 tm/d) mass burn lines process the MSW in three B&W Stirling®
power single-pass mass burn boilers shown in Fig. 7. While several boiler design options are available from B&W
for mass burn applications as discussed in Reference 8, the single-pass design offered the best value proposition for
PBREF No. 2. Referring to Fig. 7, MSW from the refuse storage pits is transferred to the refuse feed hopper by the
refuse cranes and is then fed into the boiler/grate system by hydraulic ram actuators. The refuse combustion is begun
on the B&W Volund DynaGrate® pivoting combustion grate. The combustion products or flue gases then pass
vertically up through the furnace where the combustion is completed by the addition of more air through the B&W
Precision Jet® overfire-air system. The furnace design in modern WTE systems is critical. Proper design permits at
least two (2) seconds of residence time above 1800F (982C) to destroy dioxins (polychlorinated dibenzo-para-
dioxins [PCDD]) and furans (polychlorinated dibenzofurans [PCDF]) which can be formed during the combustion
of plastics in the MSW. The overfire-air system also minimizes the formation of nitrogen oxides (NOx) and carbon
monoxide (CO). Further emissions reductions are achieved in the post-combustion emissions control equipment.
Fig. 7 B&W Stirling® mass burn power boiler schematic.
The flue gas is then cooled to recover heat as it passes through the remaining boiler furnace and heat
transfer surfaces before flowing to the emissions control equipment. Each boiler provides 284,400 lb/hr (35.8 kg/s)
of steam at 900 psi (6.2 MPa) and 830F (443C) to the turbine for power generation at maximum continuous rating
(MCR). The boilers incorporate the best in modern U.S. and European design practice including: total Inconel® weld
overlayed furnaces to provide protection from the corrosive flue gases, minimal use of refractory to reduce
maintenance expense, water-cooled wear zone to minimize slagging, erosion and corrosion near the grate, and
superheater heat transfer surfaces with access for easy replacement. A key advantage of B&W’s combustion
Superheater
Overfire Air System
Refuse Feed Hopper
Steam Drum
Generating Bank
Economizer
DynaGrate® Combustion Grate
Ash Extractor
Water-cooled Wear Zone
Flue Gas Exit

8
technology, unlike other designs, is that flue gas recirculation (combustion products recirculated to the combustion
zone) is not required to minimize NOx formation. Such flue gas recirculation systems result in added capital and
O&M costs and reduced boiler availability.
The B&W Volund DynaGrate combustion grate shown in Fig. 8 is modular in design with two modules
wide and four modules in the direction of fuel flow in each boiler. The grate consists of an alternating series of
horizontal and vertical bars across each module which rotate slowly back and forth 60-degrees to create a mixing-
tumbling motion. This action continuously mixes the fuel exposing fresh surface for combustion and moves the
refuse continuously down the inclined grate surface from the ram charger inlet to the ash discharge. Primary
combustion air is admitted from below through well-defined air gaps between the rotating grate bars. This patented
rotating bar design provides very uniform air flow across the grate surface and avoids pluggage of air holes used
with other grate systems. The grate speed of each module is independently controlled as is the air flow to each
module permitting the integrated control system to optimize the combustion over each of the eight grate module
surfaces. The overall result is a combustion system that consistently yields very low unburned carbon in the ash and
very low CO concentrations in the flue gas (maximizing combustion efficiency while minimizing emissions). Lack
of contact between the bars and between the bars and sidewalls minimizes wear and associated maintenance. All
mechanical linkages and equipment rotating the bars are external to the grate module and boiler providing superior
maintenance access.
Fig. 8 B&W Volund DynaGrate® pivoting combustion grate.
Extensive computer modeling was used (Fig. 9) to design the overfire air system and to ensure maximum
combustion efficiency and minimum formation of CO, NOx and other pollutants. As shown in Fig. 9, two levels of
secondary air injection nozzles are provided in the PrecisionJet system. The large low-pressure nozzles are staggered
and interlaced between the front and rear walls of the boiler furnace to maximize coverage and mixing. As shown,
an additional set of air nozzles is provided above the inlet to the grate for enhanced fuel drying control.

9
Fig. 9 Combustion modeling for PrecisionJet
® air system.
Automated Refuse Crane Technology
Three Konecranes refuse cranes (see Fig. 10) with grapples are part of PBREF No. 2 fuel feed system with
no more than two cranes required for routine operations at any one time. A spare crane is provided to allow for out-
of-service maintenance work. The cranes provide fuel management and mixing in the refuse pit as well as transfer
refuse from the pit to the boiler charging hoppers. Each crane is capable of lifting 16 t (14.5 tm) each. Fuel
management with the cranes can be executed using manual, semi-automatic or fully automatic operation. The cranes
can be operated in a fully automated mode without a dedicated operator, such as at night when there are no MSW
deliveries. The cranes can travel at 300 ft/min (1.5 m/s) and include anti-sway and anti-collision automation. The
cranes also use regenerative braking to recover energy as the grapples are lowered to the refuse pit, reducing
electricity usage.
Fig 10 Automated refuse crane technology.

10
Post-Combustion Emissions Control Technology
The PBREF No. 2 post-combustion emissions control system, in combination with the combustion system,
provides for the control of primary and secondary pollutants below permit levels. Post-combustion NOx control is
achieved by selective catalytic reduction (SCR). Acid gases (predominantly sulfur dioxide [SO2] and hydrogen
chloride [HCl]) are removed using the spray dryer absorber (SDA) in combination with the pulse jet fabric filter
(PJFF). Particulate including metals and lead are controlled by the PJFF. CO, volatile organic carbons (VOCs) and
dioxins/furans are primarily controlled through the combustion process, but powdered activated carbon (PAC)
injection in combination with the PJFF provides additional dioxin/furan control. Finally, mercury (Hg) is controlled
by the PAC injection in combination with the fabric filter.
The post-combustion emissions control system for the three MSW lines is shown in Fig. 11. Flue gas from
the boilers enters on the left. PAC is injected into the flue gas before entering the vertical SDA for acid gas control
and mixing of the flue gas with the PAC. The flue gas exits the SDA at the desired relative humidity, which for
PBREF No. 2 typically corresponds to an SDA outlet temperature range of 280 to 290F (138 to 143C) and passes
through the PJFF for particulate removal, including fly ash, unreacted lime reagent from the SDA, and reaction
products from the SDA and PAC injection. Flue gas leaving the fabric filter then passes through a reheat heat
transfer system to increase the flue gas temperature to ~450F (232C) before passing vertically downward through
the SCR reactor to further reduce NOx emissions. Following the SCR, the flue gas passes back through the heat
exchanger system to recover energy back into the power cycle before passing through the induced draft fans and
ultimately the stack. The system shown is designed for a minimum footprint for reduced capital costs and for
maximum energy recovery to keep plant efficiency high.
Fig. 11 Post-combustion emissions control technology.
While all of the post-combustion technologies are discussed in detail in References 8 and 9, the following
material touches on some of the key elements with reference to PBREF No. 2. The PAC system provides for fine
powdered carbon injection into the flue gas upstream of the SDA for control of mercury and residual dioxins and
furans. The PAC is stored outside of the building in vertical silos and is pneumatically conveyed to the injection
point. The SDA provides mixing to maximize contact with the flue gas. The spent and unreacted PAC is then
collected in the PJFF.
Flue Gas from Boiler
Activated Carbon Injection
Spray Dryer Absorber
Cold-side SCR
Heat Recovery Heat Exchanger
Pulse Jet Fabric Filter

11
Lime slurry is injected into the SDA for acid gas removal (SO2, HCl, HF and H2SO4). The lime slurry is
injected downward through a mechanical atomizer and mixed with the flue gas introduced into the SDA though a
gas disperser assembly. Pebble lime is stored outside of the building in a vertical silo and then mixed/slaked with
water to create the lime slurry for injection. For rapid load response, additional water is injected separately into the
SDA to provide control of the flue gas humidity (a key performance parameter for acid gas removal and lime
utilization) which is monitored at the SDA exit. The reaction products and the unreacted lime are collected in the
PJFF. Additional acid gas absorption takes place as the flue gas passes through the particulate filter cake and
unreacted lime on the upstream side of the filter bags.
The PJFF collects particulate on the outside of vertically hung tubular filter bags within the fabric filter
enclosure as the flue gas passes vertically upward outside and then through the PTFE (polytetrafluoroethylene)
membrane-coated bag material. A filter cake consisting of ash, reaction products, unreacted lime and PAC collect on
the outside of the bags. The filter cake is periodically removed from the bag by periodic bursts of high pressure air
directed down the bags and collected in the bottom hoppers for transfer to the ash management building. The filter
cake also removes additional pollutants as the flue gas passes through the unreacted reagents.
The SCR NOx reduction system is the first such system installed on a WTE application in North America.
This is a low dust (after PJFF) and low temperature system. Vaporized aqueous ammonia is injected through a
manifold and injection grid system into the flue gas upstream of the catalyst reactor. The flue gas then passes
vertically downward through the Ceram ceramic catalyst blocks where NOx is converted to nitrogen (N2) and water
vapor (H2O) through reaction with the ammonia (NH3) in the presence of the catalyst. The catalyst consists
primarily of titanium oxide with small amounts of other material to enhance low temperature performance and resist
degradation. The 19% aqueous ammonia solution is stored outside of the building in a contained storage tank. The
reactor is designed to accept a number of different catalysts when the catalyst is ultimately removed because of
deactivation. The reactor is also positioned within the emissions control building to permit rapid catalyst
replacement. The SCR system also has the added benefit of further reducing the emissions of any remaining dioxins
and furans in the presence of the catalyst.
Finally, the SCR flue gas reheat/heat recovery system provides the critical flue gas temperature necessary
for optimal catalyst operation without firing natural gas or penalizing the power plant efficiency as shown in Fig. 12.
After the flue gas leaves the PJFF it passes first though a gas-to-gas heat exchanger which heats the flue gas close to
the required temperature by using the waste heat in the flue gas leaving the SCR reactor. The flue gas then passes
through a steam coil gas heater which uses steam extracted from the boiler drum to achieve the target ~450F
(~232C) flue gas temperature. After the SCR reactor, the flue gas then passes back through the gas-to-gas heat
exchanger to recover part of the energy in the flue gas. It then passes through a finishing heat exchanger which
utilizes low temperature boiler feedwater to extract the last of the energy and reduce the gas temperature to the
desired stack temperature (~295F [146C]). Thus the reheat/heat recovery system is fully integrated into the power
cycle to maximize plant thermal efficiency.
Fig. 12 SCR reheat and heat recovery system.

12
Power, Metals Recovery and Emissions Acceptance Test Results
MSW throughput, thermal performance, metals recovery, noise, plant reliability and emissions tests were
conducted in the summer of 2015 as part of the formal PBREF No. 2 acceptance. Acceptance tests were conducted
over a 30-day period where continuous operation was required and a number of individual heat rate (thermal
efficiency) and emissions tests were conducted. PBREF No. 2 exceeded all MSW throughput requirements.
During the continuous operation test period, three 8-hour thermal efficiency performance tests were
conducted in accordance with ASME PTC-34 Performance Test Code.10
The B&W team guaranteed an electrical
generation rate of 625 kWh per ton of reference MSW with 5000 Btu/lb heat content. This is equivalent to a more
conventional power plant heat rate of 16,000 Btu/kWh which is at the lower end (higher efficiency) of state-of the
art WTE facilities. During the performance tests, the three measured heat rates (as corrected by PTC-34) ranged
from 666 to 677 kWh/reference ton or 6 to 8% higher than the guarantee value making PBREF No. 2 one of the best
in class for modern mass burn units of its kind.
Tests were also conducted to verify the guarantees for ferrous and non-ferrous metal recovery from the
bottom ash of the three units. The ferrous recovery rate guarantee was 90%. Over the test period, the ferrous
recovery system recovered 97.2% of ferrous metals. The non-ferrous recovery rate guarantee was 85%. Over the test
period, the non-ferrous recovery system recovered 88.6% of the non-ferrous metals.
Three 4-hour emissions tests were also conducted on each of the three units by an independent contractor
over the continuous operation acceptance test period providing nine total sets of emissions results. The results for
the primary pollutants are summarized in Table 1. This table also provides the PBREF No. 2 permit emissions limits
as well as the emissions from natural gas turbines for comparison purposes. Key results include:
1. PBREF No. 2 achieved all of its permit emissions guarantees in every case with values significantly below
the permitted levels.
2. The PBREF No. 2 emissions results are at the low end of or below the emissions of natural gas-fired
turbines.
Table 1
PBREF No. 2 Emissions – As Good as or Better Than a Gas Turbine
Pollutant Natural Gas Turbine Exhaust
Note 1
PBREF No. 2 Emissions Permit
PBREF No. 2 Actual Emissions Test
Notes 2, 3
Nitric Oxide 20 – 220 ppm < 50 ppm 30 – 31 ppm
Nitrogen Dioxide 2 – 20 ppm Included above Included above
Carbon Monoxide 5 – 330 ppm < 100 ppm 15 – 24 ppm
Sulfur Dioxide Trace – 100 ppm < 24 ppm 10 – 21 ppm
Sulfur Trioxide Trace – 4 ppm Not required Not detectable/Trace
Unburned Hydrocarbons 5 – 300 ppm < 7 ppm 0.2 – 2.7 ppm
Particulate Matter Trace – 25 ppm 12 mg/dscm 0.6 – 2.5 mg/dscm - All data shown for typical concentration (parts per million volume) except where noted
Note 1: Natural gas data source: Gas Turbine Emissions and Control, GE Power Systems white paper
Note 2: PBREF No. 2, data source: Babcock & Wilcox
Note 3: Actual emissions test conducted during compliance test, three 4 hr. test per unit – 9 total tests with
range showing high and low measurement under stable full load testing
Table 2 provides the results for emissions that are of particular concern for WTE facilities. The PBREF No.
2 permit emissions limits are provided for comparison.
1. PBREF No. 2 achieved results below all of its permit emission limits.
2. Many of the PBREF No. 2 results are an order of magnitude below the emissions limits making it the best
in class of WTE facility in the U. S. and the world.

13
Table 2
Emissions of WTE-Sensitive Pollutants – Best of Class for WTE Systems
Pollutant PBREF No. 2 Emissions Permit
PBREF No. 2 Actual Emissions Test
Notes 2, 3
Dioxin/Furan < 10 ng/dscm 0.23 – 0.36 ng/dscm
Trace Metals (Hg) < 25 µg/dscm 0.55 – 0.62 µg/dscm
Trace Metals (Cd) < 10 µg/dscm 0.26 – 2.54 µg/dscm
Trace Metals (Pb) < 125 µg/dscm 0.51 – 8.05 µg/dscm
HCl < 20 ppmdv 1.5 – 2.1 ppmdv
HF No limit set Note 1
(<10 ng/dscm)
<0.1 ng/dscm; not detectable
Note 1: Predicted value < 10 ng/dscm, testing only to verify
Note 2: PBREF No. 2, data source: Babcock & Wilcox
Note 3: Actual emissions test conducted during compliance test, three 4 hr. test per unit – 9 total tests with
range showing high and low measurement under stable full load testing
To put these results into perspective and to understand the major advancements of today’s modern WTE
facilities as compared to the original emissions results of WTE plants constructed thirty years ago, it is worthwhile
to consider the emissions of dioxins/furans. During the 1980s before the importance of WTE facility dioxin/furan
emissions were fully understood, WTE facilities had dioxin/furan emissions equivalent to over 10,000 ng/DSCM.
The cause was primarily due to small hot combustion furnaces (for low initial capital cost) without the volume or
flue gas residence time at elevated temperatures (1800F [982C] or higher) to control pollutant formation and
destruction, as well as the lack of post-combustion controls. In contrast, PBREF No. 2 dioxin/furan emission results
of 0.36 ng/dscm are more than four orders of magnitude below the results in the 1980s for a reduction of more than
99.996%. The EPA has indicated that WTE industry retrofits and compliance measures to meet current emissions
regulations have reduced annual emissions from all U.S. WTE plants in aggregate from an estimated 18 lb (8.2 kg)
of dioxin toxic equivalents in 1987 to an aggregate total of less than 0.5 oz (14 g) per year today.11,12
PBREF No. 2
measured emissions (Table 2) are more than an order of magnitude less than today’s stringent emissions limits. The
EPA has also recognized dramatic emissions reductions in other WTE plants as indicated in Table 3.
Table 3
Emissions Reductions from Large and Small WTE Units from 1990 to 2005 As Reported by the U.S. EPA
(Reference 11)
Pollutant 1990 Emissions (t/yr)
2005 Emissions (t/yr)
Percent Reductions
CDD/CDF, TEQ basis Note 1
4400 15 99+%
Mercury 57 2.3 96%
Cadmium 9.6 0.4 96%
Lead 170 5.5 97%
Particulate Matter 18,600 780 96%
HCl 57,400 3200 94%
SO2 38,300 4600 88% Note 1: Toxic equivalent (sum of substance amounts multiplied by toxicity equivalency factors)
Finally, even when MSW is buried directly in a state-of-the-art sanitary landfill, landfill gas (in addition to
methane and CO2 discussed below) contains a variety of VOCs and chlorinated hydrocarbons.13
These include
ammonia, mercaptains/sulfides, toluenes, dichloromethane, and acetone among others, in significant concentrations
which adversely impact the environment. 3000 TPD (2700 tm/d) MSW disposed of in a landfill, instead of
employing WTE, would produce 58 to 93 t/yr (53 to 84 tm/yr) of these compounds based upon the rates discussed by
Reference 13.
Greenhouse Gas (GHG) Emission Avoidance though WTE

14
WTE facilities significantly reduce the global greenhouse gas emissions footprint. In general terms, this
includes three major elements:
1. Renewable Component Impact on Net CO2 Emissions: Approximately two-thirds of MSW falls under
categories considered by the U.S. EPA as renewable fuel assuming that rubber, leather and textiles
categories are approximately evenly split between natural and manmade products (see References 3 and 4).
The bulk of the renewables is paper/board products, wood, food waste and yard trimmings. Recent EPA
analyses of municipal solid waste combustion indicate that WTE facilities produce lower net GHG
emissions than fossil fuel sources as shown in Fig. 13.12
This figure clearly shows the impact of the
renewable component in MSW on the net GHG emissions (1016 pounds of CO2/MWh) compared to coal,
oil and natural gas fossil fuels. Calculations from the PBREF No. 2 performance tests are consistent with
this. The MSW renewable portion at PBREF No. 2 is relatively high because of the higher proportion of
yard and other biomass waste present.
Fig. 13 Waste-to-energy produces lower CO2 emissions than fossil fuel sources. (Reference 12)
2. Recovered/Recycled Metals: Post-combustion recovery of metals from PBREF No. 2 also reduces the
GHG footprint by avoiding the net energy difference between recycling metals and producing metals from
virgin ore. For ferrous metals recovered, 56% of the energy for virgin ore production is avoided.14
The
typical 2000 t/month (1814 tm/month) of ferrous metal recovered from PBREF No. 2 avoids the use of
16,800 t (15,241 tm) of coal and 14,400 t (13,063 tm) of limestone on an annual basis. For the non-ferrous
metals recovered (assuming aluminum), 90% of the energy to produce aluminum ingots from virgin ore
production is avoided.14
The typical 100 t/month (90.7 tm/month) of non-ferrous metal recovered from
PBREF No. 2 avoids the equivalent use of 1.5 million gallons (5.7 million liters) of gasoline per year.
Combining ferrous and non-ferrous results, post-combustion metals recovery at PBREF No. 2 further
reduces the GHG footprint by 170 pounds of CO2/MWh.
3. Methane (CH4) Offset: When MSW is landfilled, anaerobic biodegradation of the organic components in
MSW generates CO2 and CH4 in approximately equal proportions15,16
, with methane produced at a rate
between 0.03 and 0.04 ton CH4 per ton of MSW on a dry basis.15
This is equivalent to 0.02 and 0.03 on a
wet basis using typical as-delivered moisture content of 31%.8 These landfill emission rates result in 61 to
83 t (55 to 75 tm) of landfill methane emissions per day being avoided by using a 3000 TPD (2700 tm/d)
WTE facility such as PBREF No. 2. Methane in the atmosphere is relatively short-lived compared to CO2,
and therefore the exact global warming potential (GWP, conversion to CO2 equivalent on a mass basis)
declines over time with the value highly variable depending upon the analysis assumptions and the life-
cycle time. The U.S. EPA indicates that for 100 years, the GWP for methane is 28 to 36 and for 20 years, it
is 84 to 87.17
To provide some level of consistency from year-to-year and to reflect the relatively short-term

15
nature of GHG emissions targets being considered, many GHG analyses (example in Reference 18) use the
20-year United Nations Intergovernmental Panel on Climate Change Assessment Report No. 4 global
warming potential of 72 for methane.19
Using this global warming potential, the 61 to 83 t/d (55 to 75 tm/d)
of methane avoided is equivalent to avoiding 4000 to 6000 pounds of CO2 emissions per MWh of WTE
generated power.
From this simplified analysis, the renewable fuel portion of MSW, the emissions impact of the post-
combustion metals recycle, and the avoidance of landfill methane emissions provides a significant net
reduction in GHG emissions with WTE technology, and thus, a negative GHG footprint.
More comprehensive integrated life-cycle analyses of GHG emissions from MSW have been conducted
under a broad range of scenarios using the U.S. EPA’s municipal solid waste decision support tool (MSW-DST) by
Thorneloe et al.20
This analysis was based upon a 481,700 t/yr (437,000 tm/yr) MSW stream or 1320 TPD (1200
tm/d) with an average U.S. MSW composition. A 75% gas collection efficiency is assumed for cases based upon
landfill gas collection. The annual GHG results for five important cases are shown in Fig. 14. The general
conclusion is that WTE with recycling provides a net GHG reduction compared to the net positive GHG
emissions for just landfill with recycle. Again referencing the U.S. EPA, approximately one ton of net GHG
emissions are reduced for each ton of MSW combusted in a WTE plant.12
Fig. 14 Net impact of WTE plant on greenhouse gases. (Reference 20)
Economics
Clearly, capital cost and levelized cost per ton of WTE play important roles in wider acceptance and
utilization in the U.S. Economic benefits of WTE plants include:
Revenue from energy recovery
o Electricity sales

16
o Steam sales (combined heat and power applications)
o Localized energy recovery credits as a renewable portfolio contributor
Revenue from metal recovery
Reduced landfill costs
o Mass burn technology reduces volume to the landfill by up to 90%
o Further cost reduction when the remaining ash is utilized as concrete aggregate, road fill or cover
material
Reduced costs for future landfills
o Reduced need by extending the current landfill life
o Elimination of future landfill permitting costs
Community employment
o Temporary construction jobs and job training
o Permanent plant operations, maintenance and administrative careers
Local community services impact
o Hotels, restaurants, etc.
o Local goods and services suppliers
The SWA has reported that the total amended cost of the PBREF No. 2 was $674,000,000.21
Based upon
the 3000 TPD (2700 tm/d) facility capacity, the unit price is $224,700 per TPD capacity. This value is less than the
inflation-adjusted WTE plants built 20 years ago, demonstrating the impact of current state-of-the-art technology
and major efforts to modularize many plant components to reduce construction cost and time. However, more
important than capital cost in the long run is the tipping fee (amount paid to dispose of a ton of MSW) and how it
compares to landfilling alone. Clearly, landfill costs vary widely by region. For Palm Beach County Florida, current
SWA analysis concludes that the PBREF No. 2 WTE plant has about the same cost as the direct landfilling at
approximately $25/ton. This analysis excludes the problems and costs of landfilling in the future and should only
improve as depressed commodity prices stabilize and renewable energy credits become available.
Conclusion
After groundbreaking in April of 2012, the Palm Beach Renewable Energy Facility No. 2 has transitioned
to commercial operation following successful completion of formal acceptance testing in July of 2015. (See Fig. 15.)
The facility incorporates the latest advanced technologies from the U.S. and Europe to provide the cleanest and most
advanced efficient WTE facility of its kind in the world today — generating renewable energy and reducing net
greenhouse emissions.
Fig. 15 PBREF No. 2 at twilight.

17
References
1. U.S. EPA,
http://www.epa.gov/sites/production/files/201512/msw_historical_tables_on_a_year_by_year_basis_back_to_19
60.xls , retrieved January 10, 2016.
2. U.S. EPA, Municipal Solid Waste, http://www3.epa.gov/epawaste/nonhaz/municipal/, retrieved January 10,
2016.
3. U.S. EPA, http://www.epa.gov/sites/production/files/2015-12/table_30_summary_table_2013_0.xls, retrieved
January 10, 2016.
4. U.S. EPA, http://www.epa.gov/sites/production/files/2015-12/tables_1_2_3_summary_tables_2013.xls, retrieved
January 10, 2016.
5. Michaels, T., and Shiang, I., The 2016 ERC Directory of Waste-to-Energy Facilities, Energy Recovery Council,
Washington, D.C., May 2016, available at:
http://energyrecoverycouncil.org/wp-content/uploads/2016/05/ERC-2016-directory.pdf. 6. EEC National Survey 2013: Shin, D., “Generation and Disposal of Municipal Solid Waste (MSW) in the United
States – National Survey,” Earth Engineering Center, Columbia University, New York, January 3, 2014,
available at http://www.seas.columbia.edu/earth/wtert/sofos/Dolly_Shin_Thesis.pdf.
7. Confederation of Waste-to-Energy Plants (CEWEP), http://www.cewep.eu/information/data/graphs/m_1415, and
http://www.cewep.eu/information/data/studies/m_1459, retrieved January 10, 2016.
8. Tomei, G., ed., Steam/its generation and use, The Babcock & Wilcox Company, Charlotte, North Carolina, 2015,
Chapter 29, “Waste-to-Energy Installations.”
9. Tomei, G., ed., Steam/its generation and use, The Babcock & Wilcox Company, Charlotte, North Carolina, 2015,
Chapter 32 “Particulate Control,” Chapter 33 “Nitrogen Oxides Control,” Chapter 34 “Sulfur Oxides Control,”
and Chapter 35 Mercury, Hazardous Air Pollutants and other Multi-Pollutant Control.”
10. PTC 34, “Waste Combustors with Energy Recovery,” American Society of Mechanical Engineers, New York.
11. Stevenson, W., “Emissions from Large and Small MWC Units at MACT Compliance,” U.S. EPA Memo to
Large MWC Docket (EPA-HQ-OAR-2005-0117), Research Triangle Park, North Carolina, August 10, 2007.
12. U.S. EPA, “Air Emissions from MSW Combustion Facilities,”
http://www3.epa.gov/epawaste/nonhaz/municipal/wte/airem.htm, retrieved January 31, 2016.
13. Psomopoulos, C. S., Bourka, A., and Themelis, N. J., “Waste-to-Energy: A Review of Status and Benefits in
USA,” Waste Management, Vol. 29, pp 1718-1724, 2007.
14. U.S. EPA, “Documentation for Greenhouse Gas Emissions and Energy Factors Used in the Waste Reduction
Model (WARM),” Washington, D.C., March 2015, available at
http://www3.epa.gov/warm/pdfs/WARM_Documentation.pdf, retrieved January 26, 2016.
15. Mathews, E., and Themelis, N. J., “Potential for Reducing Global Methane Emissions from Landfills, 2000-
2030,” 11th Int’l Waste Management and Landfill Symposium, Cagliari, Italy, October 2007.
16. Themelis, N. J., “Waste-to-Energy: Renewable Energy Instead of Greenhouse Gas Emissions,” Earth
Engineering Center (EEC), Columbia University, New York, also available at
http://www.seas.columbia.edu/earth/wtert/sofos/themelis_AD_paper_Nov19.pdf, retrieved January 10, 2016.
17. U.S. EPA, http://www3.epa.gov/climatechange/ghgemissions/gwps.html, retrieved January 10, 2016.
18. “Short-Lived Climate Pollutants: Why are they Important,” Environmental and Energy Studies Institute,
Washington, D.C., February, 2013.
19. U.N. Intergovernmental Panel on Climate Change Fourth Assessment, Direct Global Warming Potentials, 2.10.2,
Paris, France, 2007, also available at http://www.ipcc.ch/publications_and_data/ar4/wg1/en/ch252-10-2.html, retrieved January 26, 2016.
20. Thorneloe, S. A., Weitz, W., and Jambeck, J., “Application of US Decision Support Tool for Materials for Waste
Management,” Waste Management, Vol. 27, pp 1006-1020, 2007. (US EPA).
21. Carroll, P., “First Fire on the Horizon,” SWANA Florida Chapter Summer Conference, Weston, Florida, July 27-
29, 2014.

18
Trademarks used herein are the property of their respective owners.
Copyright © 2015 The Babcock & Wilcox Company, Palm Beach Resource Recovery Corporation and Solid Waste
Authority of Palm Beach County. All rights reserved.
No part of this work may be published, translated or reproduced in any form or by any means, or incorporated into
any information retrieval system, without the written permission of the copyright holder. Permission requests should
be addressed to Marketing Communications by contacting us from our website at www.babcock.com.
Disclaimer Although the information presented in this work is believed to be reliable, this work is published with the
understanding that The Babcock & Wilcox Company (B&W) and the authors and contributors to this work are
supplying general information and are not attempting to render or provide engineering or professional services.
Neither B&W nor any of its employees make any warranty, guarantee or representation, whether expressed or
implied, with respect to the accuracy, completeness or usefulness of any information, product, process, method or
apparatus discussed in this work, including warranties of merchantability and fitness for a particular or intended
purpose. Neither B&W nor any of its officers, directors or employees shall be liable for any losses or damages with
respect to or resulting from the use of, or the inability to use, any information, product, process, method or apparatus
discussed in this work.