world bank office, beijingsiteresources.worldbank.org/chinaextn/resources/... · of the higher food...
TRANSCRIPT
www.worldbank.org/china www.worldbank.org.cn
Quarterly Update
June 2008
The World Bank quarterly update provides an update on recent economic and social developments and policies in China, and present findings from ongoing World Bank work on China. The update is produced by a team from the Beijing Office with support from the China country team. Questions and feedback can be addressed to Li Li ([email protected]).
World Bank Office, Beijing

China Quarterly Update — June 2008
1
OVERVIEW China’s economic growth has moderated to a more sustainable pace. In line with slower global growth, activity decelerated so far in 2008. Adjusted for price rises, growth of real exports and imports has decelerated but remains robust. Sharply higher import prices are inflating import values, bringing down China’s trade surplus, even as the contribution of net trade to growth remains positive. The growth moderation in part reflects less buoyant investment, but China’s domestic economy is holding up well. Headline inflation is receding even as non-food price pressures emerge. The food price increases are starting to fade out of the consumer price data. Some spill over is taking place of the higher food prices into wages and some other prices, while new impact from recent industrial commodity and oil price hikes is in the pipeline. Nonetheless, generalized spill-over to consumer prices has remained limited and headline consumer price inflation should recede gradually. These price development take place as record balance of payment surpluses complicate monetary policy, but growth of monetary aggregates remains under control. Amidst weaker and uncertain global prospects, China’s growth will be supported by strong international competitiveness and a robust domestic economy. Global growth is on course to slow further and commodity price driven inflation has become a complicating factor everywhere. These developments imply considerably more international uncertainty and risks. Nonetheless, China’s exports will continue to be supported by China’s strong international competitiveness. Domestically, while the human tragedy caused by the earth quake has been tremendous, the macroeconomic impact is likely to be modest. We expect China’s GDP growth to moderate to a solid 9.8 percent in 2008 (the upward revision to our forecast largely reflects revised GDP data showing stronger service sector growth). On current growth forecasts, there is no need to ease the overall macroeconomic stance, although global uncertainty calls for vigilance and flexibility. In the case of a more serious slowdown than currently envisaged a fiscal easing would be well suited, but macroeconomic management demands good coordination between fiscal and monetary policy. Containing the spill over of raw material price pressures and inflation expectations requires relatively tight monetary policy. China’s current macroeconomic situation calls for continuing with strengthening the (trade weighted) effective exchange rate. Bringing prices of fuel closer to levels that reflect the scarcity of energy is important for rebalancing and to reduce distortions. Reducing China’s very large external surpluses remains a key policy challenge. The current account surplus is still responsible for the majority of the external surplus. Reducing it requires a set of structural policies to rebalance the overall pattern of growth, a key government objective on which progress seems to be limited so far. Speculative inflows seem to have increased recently. If policymakers consider such inflows to be a large problem they can be discouraged by tightening controls on capital inflows and policies that effectively change exchange rate expectations.
China Quarterly Update — June 2008
2
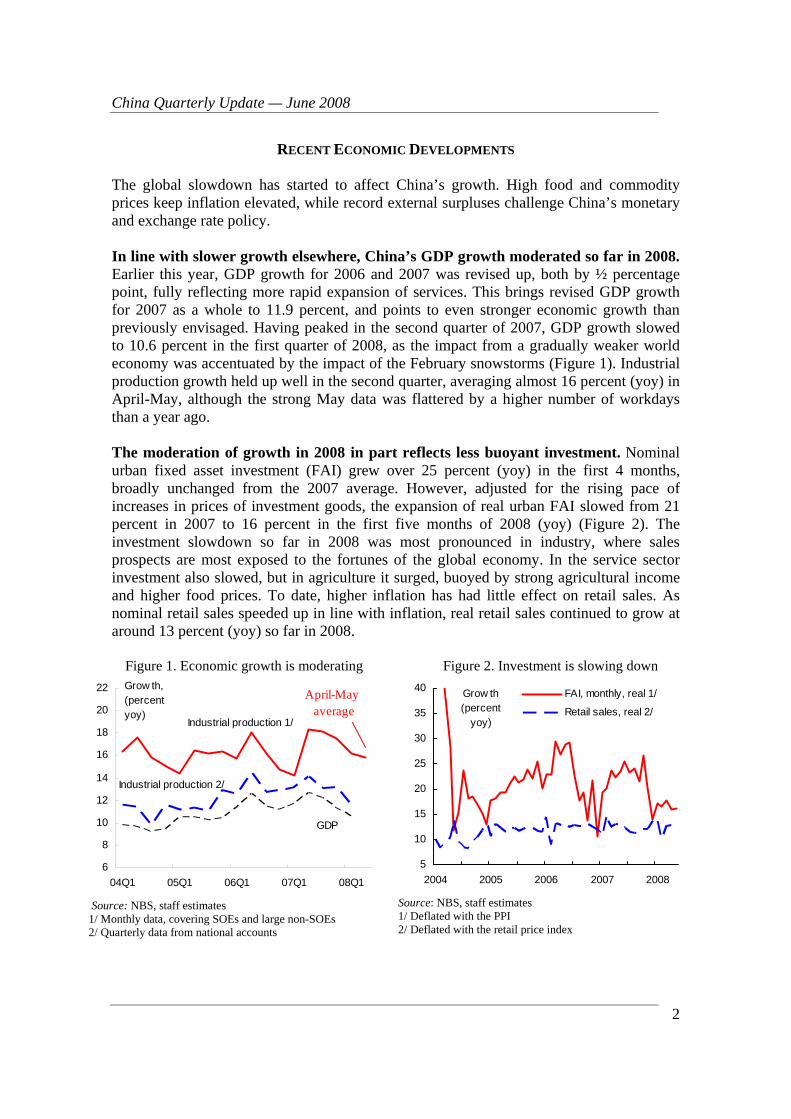
RECENT ECONOMIC DEVELOPMENTS The global slowdown has started to affect China’s growth. High food and commodity prices keep inflation elevated, while record external surpluses challenge China’s monetary and exchange rate policy. In line with slower growth elsewhere, China’s GDP growth moderated so far in 2008. Earlier this year, GDP growth for 2006 and 2007 was revised up, both by ½ percentage point, fully reflecting more rapid expansion of services. This brings revised GDP growth for 2007 as a whole to 11.9 percent, and points to even stronger economic growth than previously envisaged. Having peaked in the second quarter of 2007, GDP growth slowed to 10.6 percent in the first quarter of 2008, as the impact from a gradually weaker world economy was accentuated by the impact of the February snowstorms (Figure 1). Industrial production growth held up well in the second quarter, averaging almost 16 percent (yoy) in April-May, although the strong May data was flattered by a higher number of workdays than a year ago. The moderation of growth in 2008 in part reflects less buoyant investment. Nominal urban fixed asset investment (FAI) grew over 25 percent (yoy) in the first 4 months, broadly unchanged from the 2007 average. However, adjusted for the rising pace of increases in prices of investment goods, the expansion of real urban FAI slowed from 21 percent in 2007 to 16 percent in the first five months of 2008 (yoy) (Figure 2). The investment slowdown so far in 2008 was most pronounced in industry, where sales prospects are most exposed to the fortunes of the global economy. In the service sector investment also slowed, but in agriculture it surged, buoyed by strong agricultural income and higher food prices. To date, higher inflation has had little effect on retail sales. As nominal retail sales speeded up in line with inflation, real retail sales continued to grow at around 13 percent (yoy) so far in 2008.
Figure 1. Economic growth is moderating
6
8
10
12
14
16
18
20
22
04Q1 05Q1 06Q1 07Q1 08Q1
Industrial production 1/
Industrial production 2/
GDP
Grow th, (percent yoy)
April-May average
Source: NBS, staff estimates 1/ Monthly data, covering SOEs and large non-SOEs 2/ Quarterly data from national accounts
Figure 2. Investment is slowing down
5
10
15
20
25
30
35
40
2004 2005 2006 2007 2008
Grow th(percent
yoy)
FAI, monthly, real 1/
Retail sales, real 2/
Source: NBS, staff estimates 1/ Deflated with the PPI 2/ Deflated with the retail price index

China Quarterly Update — June 2008
3
External trade volumes have decelerated, but sharp increases in import prices are inflating import values. Export growth held up well so far in 2008 in US$ terms. However, adjusted for rising export price increases export growth declined from an average of 18 percent in 2007 to an estimated 12 percent in the first 5 months of 2008 (yoy) as global growth is slowing. (Figure 3). Import prices accelerated even more—they rose by 18 percent in US$ terms and 8 percent in RMB terms (yoy) in the first four months, boosted by surging raw material and energy prices. In fact, although import growth in US$ terms accelerated since the fall of 2007, real import growth softened. The large decline in the terms of trade reduced China’s trade surplus from a year ago in the first five months. In constant prices, the contribution of trade to growth was 1.5 percentage points in the first quarter of 2008 and even somewhat higher in April-May—much lower than for most of 2006 and 2007 but still positive (Figure 4).1
Figure 3. External trade volumes have decelerated
-10
0
10
20
30
40
50
2005 2006 2007 2008
Exports, realimports, real
Grow th (percent
Source: CEIC, staff estimates
Figure 4. The contribution of net trade to growth has been small but still positive in 2008
0
2
4
6
8
10
12
14
16
06Q1 06Q3 07Q1 07Q3 08Q1
Contribution to GDP grow th (expenditure-side), ppt
Domestic demand
External trade
Source: NBS, staff estimates
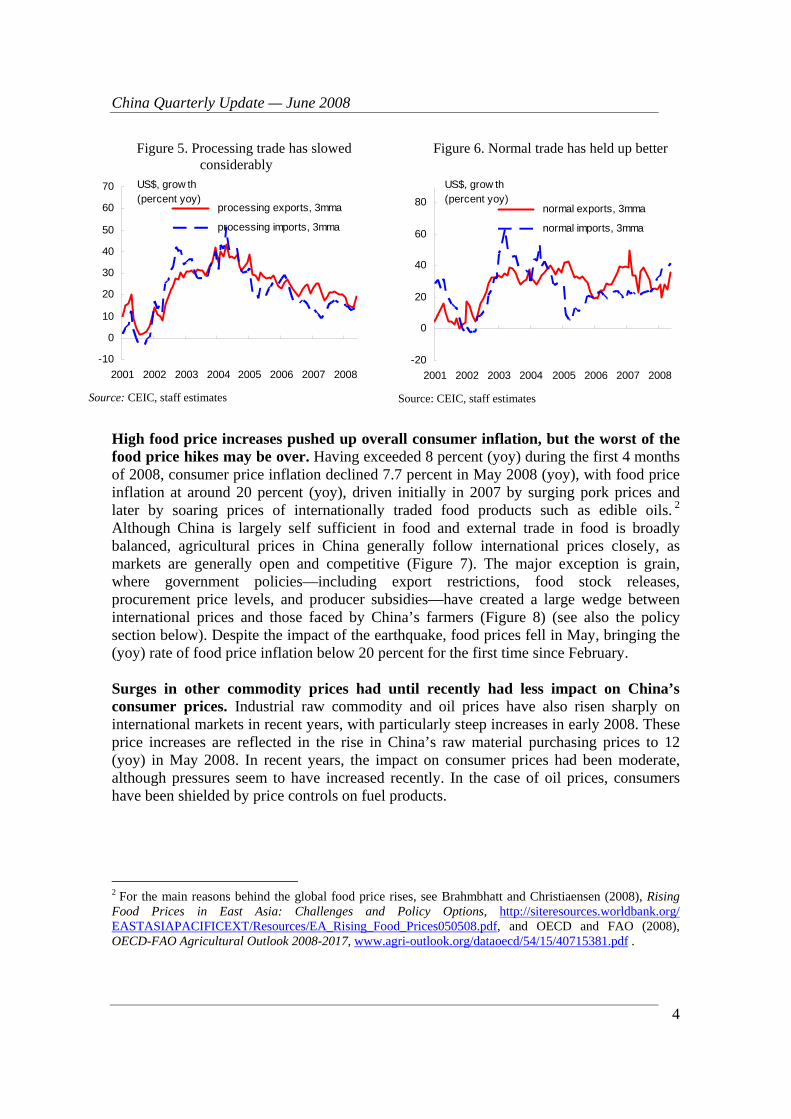
More detailed external trade data seems consistent with a slowing global economy and a still robust domestic economy. The slowdown in trade is significantly more pronounced in processing trade than in “normal” trade (Figures 5 and 6). Processing trade tends to track international economic and trade cycle more than “normal” (non processing) trade does, and tends to be less sensitive to price and exchange rate changes. Processing trade decelerates as the global economy slows down—world trade growth is declining from 7.5 percent in 2007 to a projected 4.5 percent in 2008, in real terms (Table 1 below). Processing imports usually track processing exports instead of domestic demand. Normal imports, which tend to be more closely linked to domestic demand, have grown considerably faster than processing imports in the first 5 months of 2008. After adjusting for rising price increases, real normal import growth is estimated to have softened so far in 2008 to a still robust pace, consistent with still solid expansion of domestic demand.
1 In previous Quarterly Updates we typically showed contributions to growth assuming unchanged terms of trade. However, because of large change in China’s terms of trade, we now present these contributions in constant prices, using the trade deflators from the customs administration.
China Quarterly Update — June 2008
4
Figure 5. Processing trade has slowed considerably
-10
0
10
20
30
40
50
60
70
2001 2002 2003 2004 2005 2006 2007 2008
processing exports, 3mma
processing imports, 3mma
US$, grow th (percent yoy)
Source: CEIC, staff estimates
Figure 6. Normal trade has held up better
-20
0
20
40
60
80
2001 2002 2003 2004 2005 2006 2007 2008
normal exports, 3mma
normal imports, 3mma
US$, grow th (percent yoy)
Source: CEIC, staff estimates
High food price increases pushed up overall consumer inflation, but the worst of the food price hikes may be over. Having exceeded 8 percent (yoy) during the first 4 months of 2008, consumer price inflation declined 7.7 percent in May 2008 (yoy), with food price inflation at around 20 percent (yoy), driven initially in 2007 by surging pork prices and later by soaring prices of internationally traded food products such as edible oils. 2 Although China is largely self sufficient in food and external trade in food is broadly balanced, agricultural prices in China generally follow international prices closely, as markets are generally open and competitive (Figure 7). The major exception is grain, where government policies—including export restrictions, food stock releases, procurement price levels, and producer subsidies—have created a large wedge between international prices and those faced by China’s farmers (Figure 8) (see also the policy section below). Despite the impact of the earthquake, food prices fell in May, bringing the (yoy) rate of food price inflation below 20 percent for the first time since February. Surges in other commodity prices had until recently had less impact on China’s consumer prices. Industrial raw commodity and oil prices have also risen sharply on international markets in recent years, with particularly steep increases in early 2008. These price increases are reflected in the rise in China’s raw material purchasing prices to 12 (yoy) in May 2008. In recent years, the impact on consumer prices had been moderate, although pressures seem to have increased recently. In the case of oil prices, consumers have been shielded by price controls on fuel products.
2 For the main reasons behind the global food price rises, see Brahmbhatt and Christiaensen (2008), Rising Food Prices in East Asia: Challenges and Policy Options, http://siteresources.worldbank.org/ EASTASIAPACIFICEXT/Resources/EA_Rising_Food_Prices050508.pdf, and OECD and FAO (2008), OECD-FAO Agricultural Outlook 2008-2017, www.agri-outlook.org/dataoecd/54/15/40715381.pdf .

China Quarterly Update — June 2008
5
Figure 7. Food price increases may have peaked
-20
-10
0
10
20
30
40
50
2001 2002 2003 2004 2005 2006 2007 2008
Change (percent,
yoy)
China's domestic food price
China specif ic internationalfood price, in RMB (3mma) 1/
Source: NBS, World Bank, and staff estimates. 1/ Weighted using weights in China’s food imports.
Figure 8. But there is a large gap in grain prices
-20
0
20
40
60
80
100
2001 2002 2003 2004 2005 2006 2007 2008
Grain price, China
International grainprice, RMB
Change(percent, yoy)
Source: NBS, World Bank, and staff estimates.
Higher prices of food, oil, and industrial raw commodities have started to spill over into some other prices, although spill-over to core consumer prices has remained limited. While the initial food price increases are starting to fade out of the consumer price data, some spill over into other prices and wages of previous increases is taking place. In addition, new impact from recent industrial commodity and oil price hikes is in the pipeline. Although China’s official wage data is difficult to interpret—average wage growth is lower (Box 3)—wage growth appears to have picked up since early 2007 and increases in unit labor costs in manufacturing have become more significant recently (Figure 9). In addition, there are indications that the higher raw material and energy prices have started to impact other factory gate prices. Our estimate of core PPI inflation (excluding mining, raw materials, and food) has increased from 1 percent in December 2007 to 2.5 percent in May 2008 (yoy). Measures of core CPI and non-food inflation suggest this has not yet fed through significantly into consumer prices (Figure 10). However, some of the pressures at the PPI level will likely feed through to the consumer level in the coming months.
Figure 9. Is wage growth picking up?
-10
-5
0
5
10
15
20
25
30
2001 2002 2003 2004 2005 2006 2007 2008
Unit labor costsWage, nominal (off icial)
Change(percent, yoy)
Source: NBS, staff estimates
Figure 10. Some spill-over in the pipeline
-3
-2
-1
0
1
2
3
2001 2002 2003 2004 2005 2006 2007 2008
Change,(percent
yoy)
CPI non-foodPPI core
Source: NBS, staff estimates
China Quarterly Update — June 2008
6
Foreign reserves accumulation breaks new records. In addition to a very large current account surplus (US$ 372 billion, or 11.3 percent of GDP in 2007), China also has a sizable capital account surplus (US$ 90 billion, or 2.7 percent of GDP). Capital inflows such as incoming FDI are attracted by China’s growth prospects and investment climate. Financial flows of a shorter term nature (called “hot money” in China) are attracted by the expectation of an appreciation of the RMB—fed by the large current account surplus—and interest rates that are higher than international rates. Combined, these surpluses increased China’s official foreign reserves by US$ 462 billion in 2007, which does not include a reportedly sizable amount of foreign reserves that were transferred to the China Investment Corporation and commercial banks and did thus not show up as official foreign reserves. A record US$ 227 billion increase in official foreign reserves in the first four months to US$ 1.76 trillion suggests particularly large financial inflows, triggering discussions on how to discourage speculative inflows that are the result of one-way bets that the RMB will appreciate. However, the amount of speculative inflows is difficult to estimate because of uncertainty about the amount of reserves transferred to other institutions and whether and how the reserves reflect valuation changes, and a blurry delineation between speculative inflows and other transactions, with some FDI reported to be disguised speculative inflows. The balance of payment surpluses complicate monetary policy, but money growth remains under control. With China’s interest rates currently higher than international rates, sterilization of foreign inflows has become costly for the PBC. Nonetheless, the PBC has not faced difficulties sterilizing as much as it wants by issuing central bank bills and raising reserve requirement rates.3 This has kept base money growth under control most of the time. However, the PBC at times decided not to sterilize all foreign inflows required to 3 These rates will be 17.5 percent by June 25.
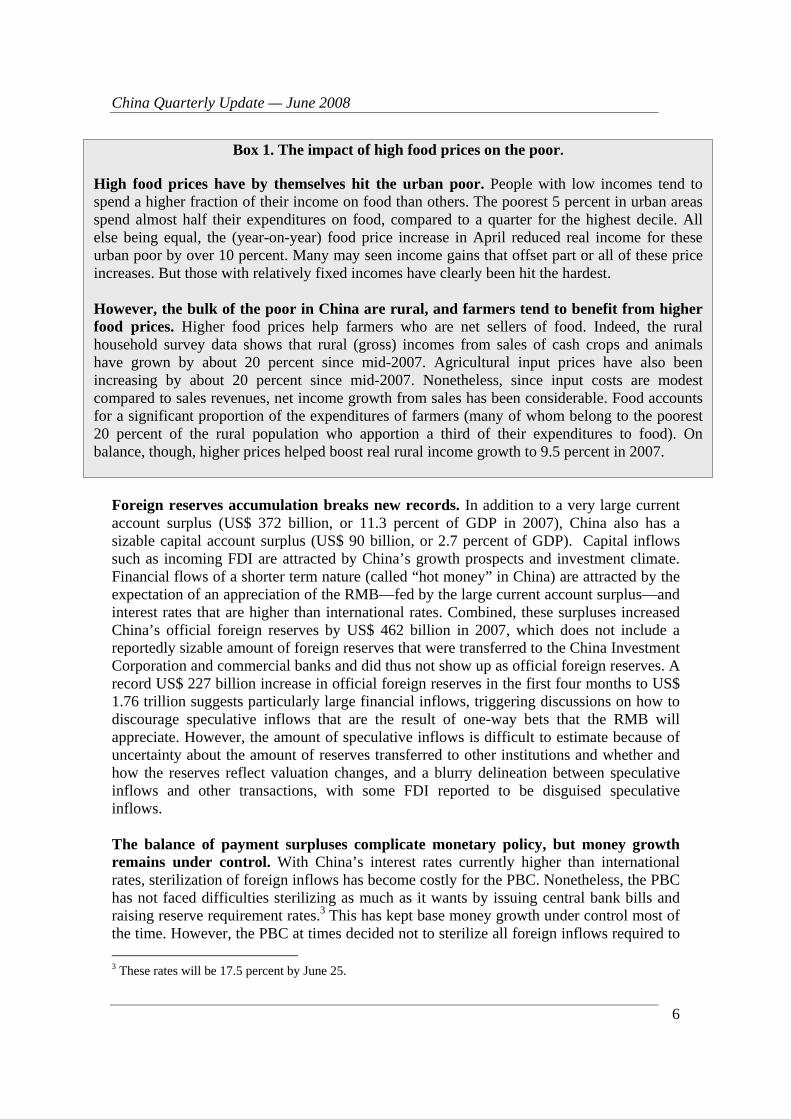
Box 1. The impact of high food prices on the poor. High food prices have by themselves hit the urban poor. People with low incomes tend to spend a higher fraction of their income on food than others. The poorest 5 percent in urban areas spend almost half their expenditures on food, compared to a quarter for the highest decile. All else being equal, the (year-on-year) food price increase in April reduced real income for these urban poor by over 10 percent. Many may seen income gains that offset part or all of these price increases. But those with relatively fixed incomes have clearly been hit the hardest. However, the bulk of the poor in China are rural, and farmers tend to benefit from higher food prices. Higher food prices help farmers who are net sellers of food. Indeed, the rural household survey data shows that rural (gross) incomes from sales of cash crops and animals have grown by about 20 percent since mid-2007. Agricultural input prices have also been increasing by about 20 percent since mid-2007. Nonetheless, since input costs are modest compared to sales revenues, net income growth from sales has been considerable. Food accounts for a significant proportion of the expenditures of farmers (many of whom belong to the poorest 20 percent of the rural population who apportion a third of their expenditures to food). On balance, though, higher prices helped boost real rural income growth to 9.5 percent in 2007.

China Quarterly Update — June 2008
7
contain base money expansion, in part because it may be difficult to know the required amounts. In any case, the external surpluses affect domestic liquidity by keeping interest rates lower than they would otherwise be. China’s monetary policymakers consider “hot money” a serious problem. They feel constrained to increase interest rates for fear of attracting more capital inflows. In these circumstances, the tightening of monetary policy since the fall of 2007 relied considerably on credit rationing. This credit rationing creates some distortions. Nonetheless, M2 and credit growth have in recent years not grown significantly faster than nominal GDP growth—they grew by 18 and 16 percent (yoy) in May—suggesting that inflation is unlikely caused by excessively loose monetary policy. Motivated by the need to rebalance the economy and to dampen price pressures, China’s RMB has continued its gradual exchange rate appreciation. Much of the discussion on the RMB tends to be about the pace of appreciation against the US$. The appreciation was rapid in the first months of 2008, slowed in April, and picked up again in May (Figure 11). However, as noted by senior PBC officials, for macroeconomic purposes, what happens to the trade weighted effective exchange rate is more important. Between mid-July 2005 (just before the removal of the peg) and early June 2008, the nominal effective exchange rate (NEER) strengthened gradually by a total of 9.3 percent, equivalent to over 3 percent per year, about half the pace of the appreciation against the US$ (Figure 12). China’s CPI-based real effective exchange rate (REER) strengthened 12 percent between mid-July 2005 and March 2008, or 4.3 percent per year. As the RMB appreciated in recent years, the “equilibrium” exchange rate also strengthened, because productivity growth in China’s manufacturing sector is faster than in most other countries. Various macroeconomic techniques exist that could be used to analyze whether the appreciation has brought the RMB closer to its equilibrium rate in recent years. Figure 11. The RMB has strengthened against
the US dollar
70
80
90
100
110
120
130
140
2001 2002 2003 2004 2005 2006 2007 2008
Index (July 2005 = 100) 1/
RMBEuroJPY
Source: CEIC, World Bank staff estimates. 1/ Increases of indices indicate appreciation against USD.
Figure 12. The nominal effective strengthening was smaller
80
85
90
95
100
105
110
115
120
125
2001 2002 2003 2004 2005 2006 2007 2008
Index (July 2005
=100) 1/ RMB
Source: IMF, World Bank, staff estimates. 1/ Increases of index indicate appreciation.

China Quarterly Update — June 2008
8
ECONOMIC PROSPECTS AND POLICIES Prospects Growth in high income countries is slowing, but growth forecasts for 2008 have bottomed out for now. After a period of turmoil and strong volatility, global financial markets have found some calm, but the fall out of the turmoil will have an impact on global growth for some time to come. Indeed, economic growth in high income countries is slowing markedly, led by the US. The US managed to avoid an outright contraction in the first quarter, but recent labor market developments point to further economic weakness. The euro area has held up well to date, but leading indicators and sentiment indicators point to a slowdown ahead. Nonetheless, after more than 9 months of steadily worsening growth prospects, the consensus forecast for 2008 GDP growth in the US and the euro zone has bottomed out for now, although the consensus forecasts for growth in 2009 have continued to decline through June.4 While developing countries and emerging markets are also likely to slow down, they should continue to outperform high income countries. So far most developing countries and emerging markets have been resilient to the financial turmoil and slowdown in high income countries. Less directly exposed to the financial turmoil, which was centered around sophisticated instruments and markets, most developing countries and emerging markets have, like China, felt most of the impact via the real economy and seen a modest, orderly slowdown to a more sustainable pace. As these countries have become increasingly important for the world economy, their resilience has been an important cushion for the global economy. 5 At the same time, developing countries and emerging markets have over time become more integrated with high income countries via trade and capital flows. These links tend to accentuate the transmission of cyclical fluctuations, making decoupling of cycles unlikely, even though trend growth in developing countries and emerging markets should continue to be significantly higher than in high income countries. 6 In all, the
4 The June Consensus Forecasts for 2008 and 2009 GDP growth in the US were 1.5 and 1.7 percent, and for the euro zone they were 1.7 percent and 1.4 percent. 5 While their total imports are still only 2/3rds of OECD imports, because they grow more rapidly, their contribution to world import growth was 60 percent higher than that of the OECD. 6 See the June 2008 Global Development Finance.
Table 1. The global environment
(percent change, unless otherwise indicated)
2006 2007 2008 2009
World GDP 1/ 4.0 3.7 2.7 3.0World GDP 2/ 5.4 5.4 4.3 4.5World trade (volume) 9.7 7.5 4.5 7.2Oil price ($/bbl) 64 71 108 106Non-oil commodity prices 29 17 24 -8
Source: World Bank DEC Prospects Group (June 2008).1/ Market exchange rates.2/ PPP exchange rates.
China Quarterly Update — June 2008
9
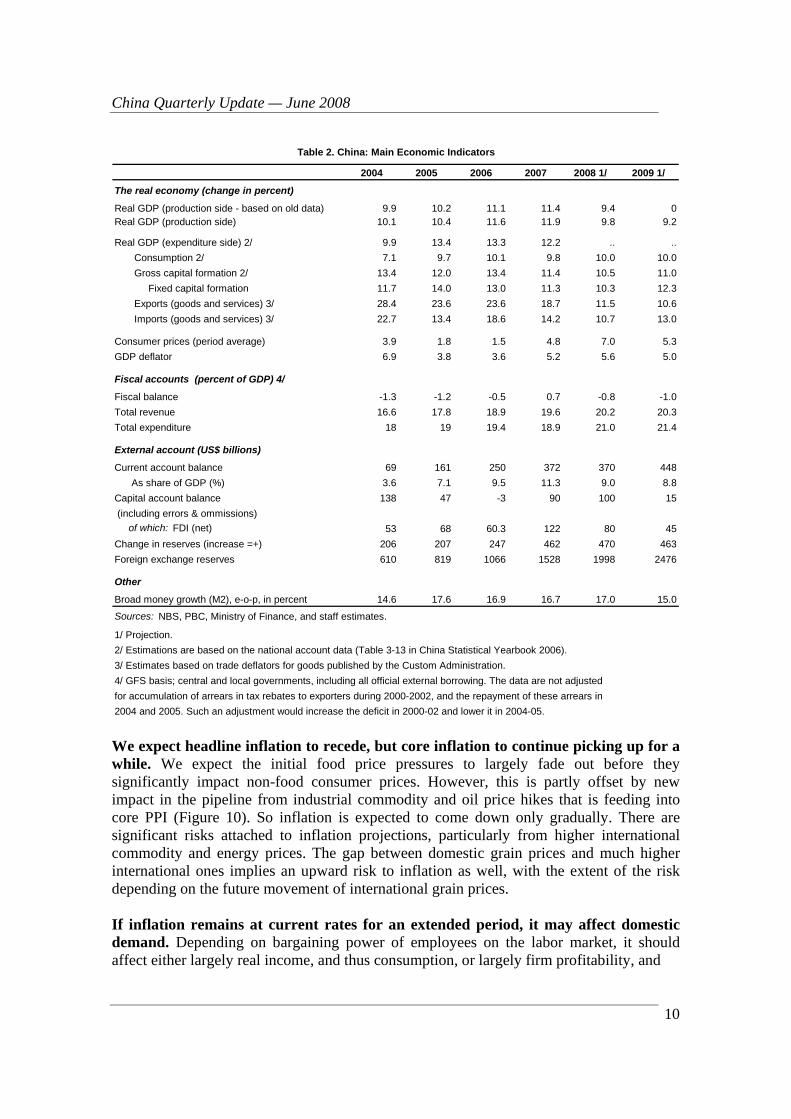
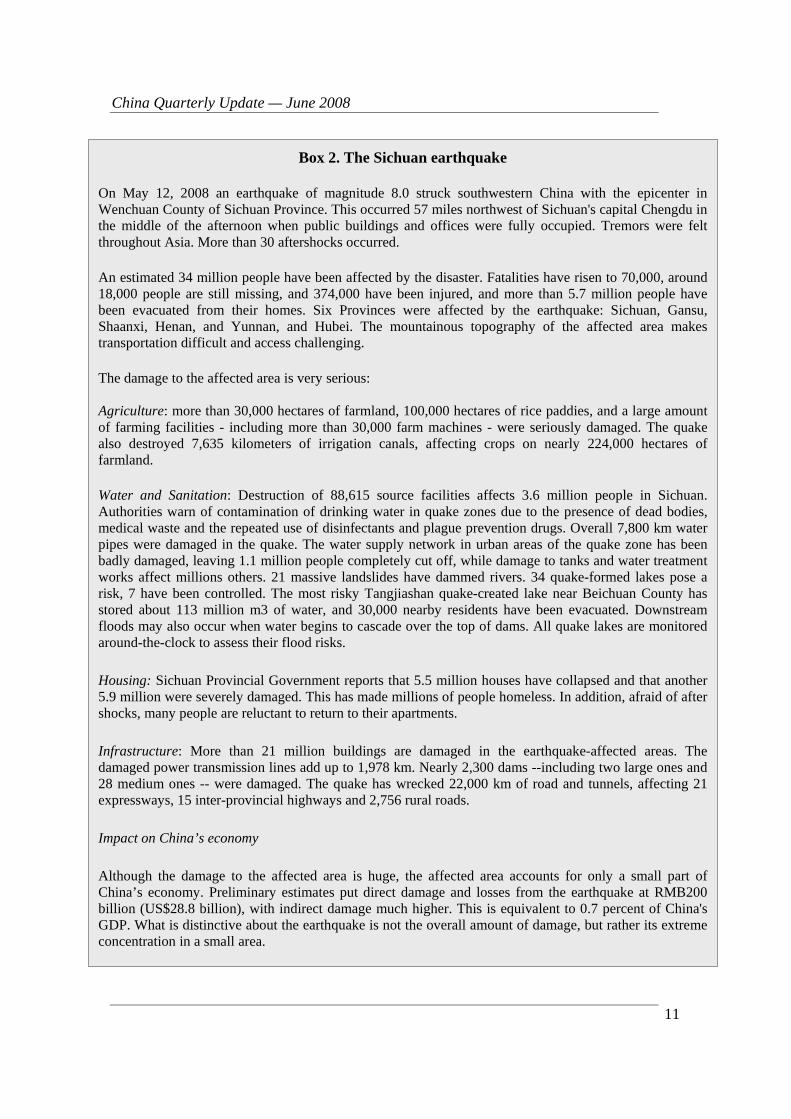
WB expects world economic growth to slow from 3.7 percent in 2007 to 2.7 percent in 2008, before picking up to 3 percent in 2009 (in market exchange rates) (Table 1). Commodity price driven inflation has become a complicating factor everywhere. Driven by soaring commodity prices, notably of food and energy, inflation has increased in high income countries, preventing (further) interest cuts in the US and the euro zone. Inflation is even more problematic for developing countries and emerging markets. With food accounting for a much higher share of consumer spending, the food price rises have generally led to higher increases in overall inflation there than in high income countries. The global food and energy price surge coincides with a slowdown in the world economy that makes it more difficult to take tightening measures that may be necessary to contain spill-over and contain inflationary expectations. These developments imply considerably more international uncertainty and risks. This includes more uncertainty about policies in high income countries. The deterioration in global economic and financial conditions could be more severe and prolonged. Commodity and oil prices could rise further, even with a weaker world economy. Nonetheless, China’s exports will continue to be supported by solid international competitiveness. This is evidenced by data on export growth and market share, prices in foreign markets, and profits in manufacturing (Box 3). Domestically, while the human tragedy caused by the earth quake has been tremendous, the macroeconomic impact is likely to be modest (Box 2). The earth quake caused massive damage, largely damage to assets. The affected areas, and economic activity there, make up modest shares of China’s total. Moreover, production in the affected areas has largely come on stream again and, although the quake has affected GDP growth in the second quarter, reconstruction activity may actually boost GDP growth in the second half of the year. While the impact on overall inflation should be modest, reconstruction related demand may add to pressure on prices of building materials.7 China’s growth is likely to moderate further, but should remain solid. Both activity and investment in the export sector are likely to cool further in the rest of 2008. However, the drivers of investment in the domestically-oriented sector remain robust. Liquidity in China’s banking system remains high and, while commodity prices and wage pressures exist, profitability has so far remained sound in most sectors. Consumption growth should continue to receive support from solid wage growth. In all, we project GDP growth of 9.8 percent for 2008 (Table 2).8 A downward risk to this forecast is the possibility of a sharper than expected weakening of domestic demand. Higher import prices limit our projected current account surplus to US$ 377 billion, or 9 percent of GDP this year.
7 Sichuan is a major agricultural producer, but the affected areas are estimated to contribute less than one-half percent of China’s agricultural output. 8 Our views on underlying growth prospects have not changed since early April. However, revised national accounts data released in April that includes better coverage of service sector activity (particularly the financial sector) revealed a more strongly growing economy in 2006 and 2007 (see table 2). Our current projection of 9.8 percent GDP growth is consistent with this revised data.
China Quarterly Update — June 2008
10
2004 2005 2006 2007 2008 1/ 2009 1/
The real economy (change in percent)
Real GDP (production side - based on old data) 9.9 10.2 11.1 11.4 9.4 0Real GDP (production side) 10.1 10.4 11.6 11.9 9.8 9.2
Real GDP (expenditure side) 2/ 9.9 13.4 13.3 12.2 .. .. Consumption 2/ 7.1 9.7 10.1 9.8 10.0 10.0 Gross capital formation 2/ 13.4 12.0 13.4 11.4 10.5 11.0 Fixed capital formation 11.7 14.0 13.0 11.3 10.3 12.3 Exports (goods and services) 3/ 28.4 23.6 23.6 18.7 11.5 10.6 Imports (goods and services) 3/ 22.7 13.4 18.6 14.2 10.7 13.0
Consumer prices (period average) 3.9 1.8 1.5 4.8 7.0 5.3GDP deflator 6.9 3.8 3.6 5.2 5.6 5.0
Fiscal accounts (percent of GDP) 4/
Fiscal balance -1.3 -1.2 -0.5 0.7 -0.8 -1.0Total revenue 16.6 17.8 18.9 19.6 20.2 20.3Total expenditure 18 19 19.4 18.9 21.0 21.4
External account (US$ billions)
Current account balance 69 161 250 372 370 448 As share of GDP (%) 3.6 7.1 9.5 11.3 9.0 8.8Capital account balance 138 47 -3 90 100 15 (including errors & ommissions) of which: FDI (net) 53 68 60.3 122 80 45Change in reserves (increase =+) 206 207 247 462 470 463Foreign exchange reserves 610 819 1066 1528 1998 2476
Other
Broad money growth (M2), e-o-p, in percent 14.6 17.6 16.9 16.7 17.0 15.0
Sources: NBS, PBC, Ministry of Finance, and staff estimates.
1/ Projection.2/ Estimations are based on the national account data (Table 3-13 in China Statistical Yearbook 2006).3/ Estimates based on trade deflators for goods published by the Custom Administration.4/ GFS basis; central and local governments, including all official external borrowing. The data are not adjustedfor accumulation of arrears in tax rebates to exporters during 2000-2002, and the repayment of these arrears in2004 and 2005. Such an adjustment would increase the deficit in 2000-02 and lower it in 2004-05.
Table 2. China: Main Economic Indicators
We expect headline inflation to recede, but core inflation to continue picking up for a while. We expect the initial food price pressures to largely fade out before they significantly impact non-food consumer prices. However, this is partly offset by new impact in the pipeline from industrial commodity and oil price hikes that is feeding into core PPI (Figure 10). So inflation is expected to come down only gradually. There are significant risks attached to inflation projections, particularly from higher international commodity and energy prices. The gap between domestic grain prices and much higher international ones implies an upward risk to inflation as well, with the extent of the risk depending on the future movement of international grain prices. If inflation remains at current rates for an extended period, it may affect domestic demand. Depending on bargaining power of employees on the labor market, it should affect either largely real income, and thus consumption, or largely firm profitability, and
China Quarterly Update — June 2008
11
Box 2. The Sichuan earthquake On May 12, 2008 an earthquake of magnitude 8.0 struck southwestern China with the epicenter in Wenchuan County of Sichuan Province. This occurred 57 miles northwest of Sichuan's capital Chengdu in the middle of the afternoon when public buildings and offices were fully occupied. Tremors were felt throughout Asia. More than 30 aftershocks occurred. An estimated 34 million people have been affected by the disaster. Fatalities have risen to 70,000, around 18,000 people are still missing, and 374,000 have been injured, and more than 5.7 million people have been evacuated from their homes. Six Provinces were affected by the earthquake: Sichuan, Gansu, Shaanxi, Henan, and Yunnan, and Hubei. The mountainous topography of the affected area makes transportation difficult and access challenging. The damage to the affected area is very serious: Agriculture: more than 30,000 hectares of farmland, 100,000 hectares of rice paddies, and a large amount of farming facilities - including more than 30,000 farm machines - were seriously damaged. The quake also destroyed 7,635 kilometers of irrigation canals, affecting crops on nearly 224,000 hectares of farmland. Water and Sanitation: Destruction of 88,615 source facilities affects 3.6 million people in Sichuan. Authorities warn of contamination of drinking water in quake zones due to the presence of dead bodies, medical waste and the repeated use of disinfectants and plague prevention drugs. Overall 7,800 km water pipes were damaged in the quake. The water supply network in urban areas of the quake zone has been badly damaged, leaving 1.1 million people completely cut off, while damage to tanks and water treatment works affect millions others. 21 massive landslides have dammed rivers. 34 quake-formed lakes pose a risk, 7 have been controlled. The most risky Tangjiashan quake-created lake near Beichuan County has stored about 113 million m3 of water, and 30,000 nearby residents have been evacuated. Downstream floods may also occur when water begins to cascade over the top of dams. All quake lakes are monitored around-the-clock to assess their flood risks. Housing: Sichuan Provincial Government reports that 5.5 million houses have collapsed and that another 5.9 million were severely damaged. This has made millions of people homeless. In addition, afraid of after shocks, many people are reluctant to return to their apartments. Infrastructure: More than 21 million buildings are damaged in the earthquake-affected areas. The damaged power transmission lines add up to 1,978 km. Nearly 2,300 dams --including two large ones and 28 medium ones -- were damaged. The quake has wrecked 22,000 km of road and tunnels, affecting 21 expressways, 15 inter-provincial highways and 2,756 rural roads. Impact on China’s economy Although the damage to the affected area is huge, the affected area accounts for only a small part of China’s economy. Preliminary estimates put direct damage and losses from the earthquake at RMB200 billion (US$28.8 billion), with indirect damage much higher. This is equivalent to 0.7 percent of China's GDP. What is distinctive about the earthquake is not the overall amount of damage, but rather its extreme concentration in a small area.
China Quarterly Update — June 2008
12
thus investment.9 Thus, especially if employees have little bargaining power, inflation is a set back for the rebalancing to domestic demand and consumption. Economic policies China’s 3 main macroeconomic policy challenges are:
• How, if at all, to respond to the prospective slowdown? So far, China’s economy seems on track to slow down in 2008 to a pace just below potential output growth, after two years of above-potential growth. Given that growth in 2008 is on course to exceed the official target of 8 percent and the need to contain inflationary expectations, there is no case for easing the overall macroeconomic stance. However, uncertainty about the global outlook is currently larger than usual and future developments may call for a reassessment of the policy implications. Thus, vigilance and flexibility are key. In the case of a more serious slowdown than currently envisaged, China’s strong fundamentals and fiscal position allow for an easing of policy. A fiscal easing would be better suited than a monetary loosening,
9 China’s net trade in food products is very low. That means that higher food prices lead to a redistribution of income within the country, but not to a terms of trade effect that diminishes national income.
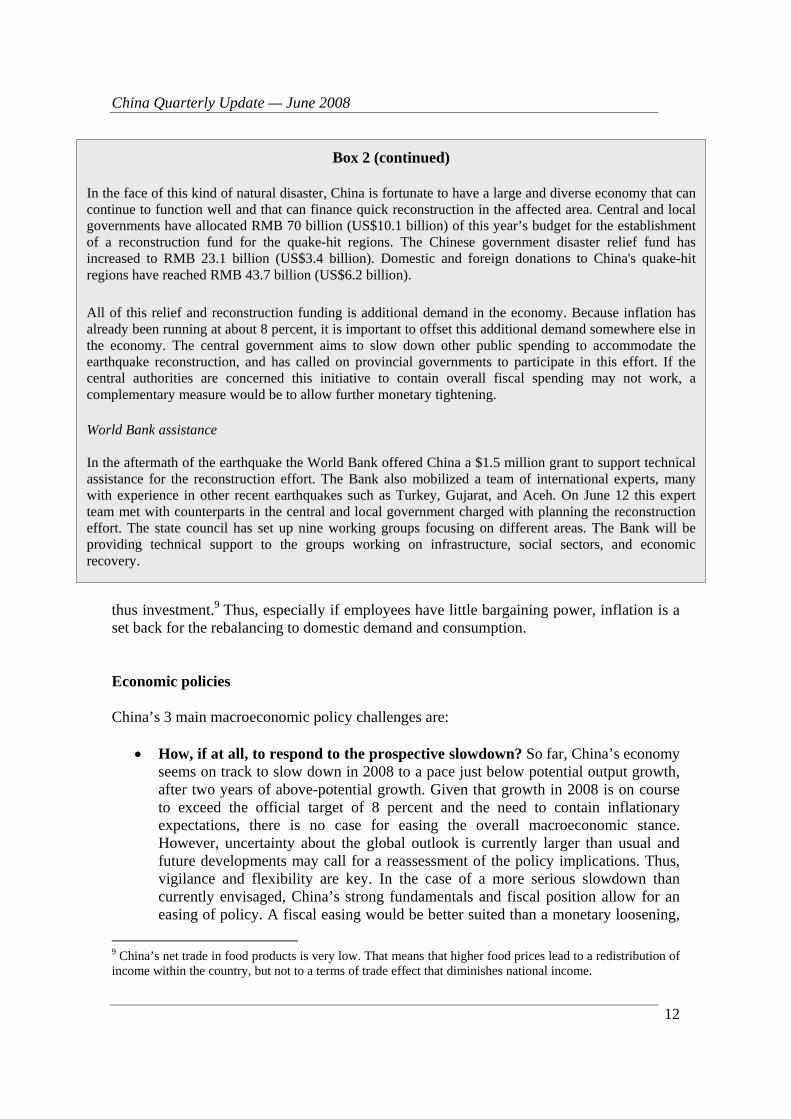
Box 2 (continued) In the face of this kind of natural disaster, China is fortunate to have a large and diverse economy that can continue to function well and that can finance quick reconstruction in the affected area. Central and local governments have allocated RMB 70 billion (US$10.1 billion) of this year’s budget for the establishment of a reconstruction fund for the quake-hit regions. The Chinese government disaster relief fund has increased to RMB 23.1 billion (US$3.4 billion). Domestic and foreign donations to China's quake-hit regions have reached RMB 43.7 billion (US$6.2 billion). All of this relief and reconstruction funding is additional demand in the economy. Because inflation has already been running at about 8 percent, it is important to offset this additional demand somewhere else in the economy. The central government aims to slow down other public spending to accommodate the earthquake reconstruction, and has called on provincial governments to participate in this effort. If the central authorities are concerned this initiative to contain overall fiscal spending may not work, a complementary measure would be to allow further monetary tightening. World Bank assistance In the aftermath of the earthquake the World Bank offered China a $1.5 million grant to support technical assistance for the reconstruction effort. The Bank also mobilized a team of international experts, many with experience in other recent earthquakes such as Turkey, Gujarat, and Aceh. On June 12 this expert team met with counterparts in the central and local government charged with planning the reconstruction effort. The state council has set up nine working groups focusing on different areas. The Bank will be providing technical support to the groups working on infrastructure, social sectors, and economic recovery.

China Quarterly Update — June 2008
13
given the need to contain inflationary expectations, rebalance the growth pattern, and lower the current account surplus. By the same token, a weaker exchange rate, or slowing down of the pace of appreciation against the dollar, would not be obvious.
• How to contain spill over and inflation expectations? Inflation in China has so
far been driven by surging food and other raw commodity prices instead of excessively loose monetary policy. Nonetheless, containing spill over and inflation expectations requires relatively tight monetary policy and effective communication. Meanwhile, a stronger exchange rate helps dampening inflation pressures. Coordination of fiscal and monetary policy is important. Thus, other things equal, looser fiscal policy would imply a need for tighter monetary policy.
• How to reduce and deal with continued large balance of payment surpluses,
including speculative inflows? The current account surplus remains responsible for the majority of the external surplus, while speculative inflows appear to have increased recently. Reducing the current account surplus calls for a set of structural policies to rebalance the pattern of growth towards more services and consumption and less industry and investment. This set of policies includes a stronger exchange rate; a shift in government spending towards health, education and social security; more financial reform; dividend payments for SOEs and stronger corporate governance; better pricing of resources, energy, and land; loosening remaining restrictions on the mobility of labor and capital; and stronger incentives for local governments to rebalance growth.10 Speculative inflows could be discouraged by tightening controls on capital inflows and policies that effectively change exchange rate expectations.
Monetary and exchange rate policy A relatively tight monetary policy stance is needed to contain spill over of price pressures and inflationary expectations. With inflation still higher than lending rates and interbank rates low, underlying monetary conditions need to be further tightened. Monetary policy has succeeded in bringing down the expansion of monetary aggregates and so far M2 and credit growth seem to be under control. This policy has relied considerably on increases in reserve requirement rates to sterilize inflows and credit controls to slow credit expansion. However, these instruments are not conducive to fostering a more commercially oriented banking system. Macroeconomic management would benefit substantially from greater room to increase interest rates. China’s current macroeconomic situation calls for continuation with strengthening the exchange rate. The current account surplus remains high, the rebalancing of the growth pattern is not yet entrenched, and inflation remains a concern. Although China’s exports are likely to slow down as global demand slows, the competitiveness of China’s 10 For a more comprehensive discussion, see previous Quarterly Updates and He and Kuijs (2007), Rebalancing China’s growth—Modeling a Policy Package, World Bank China Research Paper No. 7: http://www.worldbank.org.cn/enlish/contents/working_paper7.pdf

China Quarterly Update — June 2008
14
export sector still seems sound and it is not clear that a weaker exchange rate will help significantly in offsetting a demand slowdown. Moreover, exchange rate policy should be set on the basis of what is best for the overall economy. If stimulating growth and employment is called for, China’s economy is likely to be better served by an easing of fiscal policy than by a weaker exchange rate. Discussions take place on whether speculative inflows are a large problem and what the implications are for exchange rate policy. China’s traditional approach to the exchange rate, gradualism with regard to both a stronger exchange rate and more flexibility, has served the real economy well by providing stability and clarity for trade and transactions. At the same time, China’s strategy of reform and opening up, including of the financial sector, envisages a move towards more exchange rate flexibility and monetary independence. In turn, more exchange rate flexibility will trigger financial market development and deepening, including of hedging instruments that will allow firms in the real economy to hedge exchange rate risk. Faced with apparently increasing speculative inflows, discussions take place currently on the appropriate policy response. If speculative inflows are considered a major problem, tightening and stricter enforcing existing controls on capital inflows would be an obvious response. Policymakers also need to weigh the beneficial impact of more rapid introduction of exchange rate flexibility on containing speculative inflows and monetary independence against the potentially detrimental impact on the real economy. One school of thought considers speculative inflows a potentially large problem and calls for a change in exchange rate policy to affect exchange rate expectations.. Assumed by many to be interest rate sensitive, speculative inflows have been a constraint on higher interest rates that are appropriate in view of domestic considerations. Speculative inflows could also fuel asset price increases and leave the economy vulnerable to swings in sentiment that could trigger abrupt outflows. This school finds that, in the face of persistent upward pressure on the currency because of macro fundamentals such as China’s large current account surplus, a gradual appreciation leads to “one-way” bets on further appreciation. In line with mainstream economic thinking, this school concludes that expectations of appreciation can be removed by more exchange rate flexibility or an upfront appreciation. Introducing more exchange rate flexibility now would discourage speculative inflows by removing the expectation of further appreciation. An upfront appreciation would help by increasing uncertainty about the future movement of the exchange rate. A second school of thought also considers speculative inflows a large problem but draws a very difficult policy implication. This school judges that gradual or no appreciation is the most appropriate policy to remove expectations of appreciation. However, given China’s macro fundamentals, including its large current account surplus, it is hard to see how this approach could remove expectations of appreciation. A third school of thought thinks speculative inflows are currently not a large problem and that there is no need for significant adjustment of exchange rate policy. So far the flows do not appear to have been overwhelming in size and they have been largely

China Quarterly Update — June 2008
15
sterilized. The current gradual approach to the exchange rate delivers important benefits to the real economy in terms of predictability and stability. This school of thought feels these benefits outweigh the downsides of attracting speculative inflows and the ability to increase interest rates as needed. It is important to clarify the size of speculative inflows and whether a change in the exchange rate regime could help address them. Whether to speed up the move to more exchange rate flexibility and/or allow for a one-off appreciation depends in considerable part on policymakers’ judgment as to the size and detrimental impact of speculative inflows, compared to the possible detrimental impact of larger currency moves on the real economy. In any case, given current exchange rate expectations and interest rate differentials, the incentives for speculative capital flows clearly exist. Tightening and enforcing stricter the existing controls on capital inflows would be a less difficult decision to make. Fiscal and other policies In 2007, fiscal policy was appropriately prudent. The consolidated government balance for the central and local governments moved into a surplus of 0.7 percent of GDP in 2007. Including the social security fund, which saw a substantial rise in its surplus, and extra budgetary funds, the fiscal surplus was even larger. Given the particularly rapid (above potential) pace of economic growth in 2007, the increase in the fiscal balance was appropriate because it withdrew some stimulus. The 2008 budget conservatively foresees a small deficit. The budget reflects the increasing government attention to and spending on health, education, and social security, with total expenditures set to grow 22 percent. The budget projects revenue growth of 14 percent, based on assumptions of 8 percent GDP growth and CPI inflation of 4.8 percent, resulting in a consolidated government deficit for the central and local governments of 0.8 percent of GDP in 2008. This would imply a loosening of fiscal policy, not consistent with the policy guideline of “prudent fiscal policy”. Both government revenues and spending are likely to be higher than budgeted. In previous years, revenues have risen substantially faster than budgeted. We expect that to be the case this year as well. In the first quarter, tax revenue grew more than 30 percent (yoy), although it slowed in April and May. However, government spending may also be higher than budgeted. Following on unplanned spending in response to the snowstorms that affected large parts of Southern China in February, the government has committed to significant spending on earthquake reconstruction. The central government has called on all levels of the government to rein in spending in other areas, in order to keep overall demand pressures in check. However, it will be challenging to coordinate this policy. Additional unbudgeted spending is likely to take place on subsidies to the oil companies. It is too early to tell what the net impact of these developments on the government balance will be.
China Quarterly Update — June 2008
16
Box 3. Cost increases in China’s manufacturing and competitiveness Concerns have been raised about cost pressures damaging the competitiveness position of China’s manufacturing. Reports about increasing losses and closing down of export firms in Guangdong have received a lot of attention. What does the overall data suggest and what are the prospects? Cost pressures stemming from rising wages and rapidly rising raw material costs are not new. Since 2003, the weighted input costs of China’s manufacturing sector rose about 3-4 percentage points faster than weighted output prices (ex factory PPI). However, far rapid productivity and efficiency improvements offset this, allowing profitability to continue its gradual increase. Raw material prices have continued to increases strongly recently. This affects manufacturers around the world, including in China. As a result, PPI (factory gate) inflation rising around the world. However, such shared cost rises do typically not affect China’s competitiveness. China’s manufacturing sector faces wage pressures. Wage growth is indeed continuing strongly. It is less clear whether there has been a pick up in wage growth recently. Specifically, the impact of the new labor contract law, which took effect in January 2008 is not obvious. Official wage growth in manufacturing in the first quarter of 2008, while high at 19 percent, was around the same as during 2007).1/ The exchange rate has appreciated. As shown in the text, on a trade weighted basis the strengthening of China’s exchange rate has been around 3 percent per year since mid 2005. This is significant although not very large. Moreover, tightening of environmental and other standards may increase costs. Several outcome indicators suggest that profitability and competitiveness have so far remained health. Profit growth and profitability of core manufacturing continued to be good through February (the latest month for which data is available), with profit growth in industry excluding mining and petroleum processing—where prices have been volatile—still over 30 percent (yoy). With exports continuing to grow significantly faster than world trade, China continues to gain global market share. Prices of China’s exports on foreign markets do not suggest obvious price competitiveness problems. US import prices for imports from China were up 1.4 percent in April (yoy), compared to significantly higher increases in prices of manufacturing imports from other countries generally (data on import prices in Europe is more difficult to interpret, because it is available only for specific countries). In light of these findings, how should we interpret the reports about Guangdong’s export firms? In part, there may be a difference in performance between small firms in labor intensive, modest value added industries—strongly represented in Guangdong—that find it difficult to offset cost pressures and machinery and equipment industry, where typically larger firms tend to reap economies of scale. In addition, a look at the data suggests that even in Guangdong exports and activity continue to grow considerable, although not as rapidly as before. In the first 4 months of 2008, exports rose by 16 percent (yoy), FDI by 21 percent (both in US$ terms), and employment by 4.4 percent (all yoy).
Rising costs are affecting the profitability and cost competitiveness of some low-end manufacturers. However, there are to date no strong indications that the competitiveness of China’s manufacturers more generally is threatened. This is not surprising. Firms based in China are benefiting from a good investment climate and infrastructure; increasingly broad supply chains; a rapid expansion of industry, with many firms reaping economies of scale; and a deep labor pool. These factors should underpin competitiveness, even with further appreciation of the RMB. 1/ This official wage growth is biased upwards, because capital intensive SOEs with a larger than average share of high paid workers are overrepresented in the survey on which it is based. A CLSA survey of listed manufacturers found that 79 percent of firms reported total staff cost per head rising by up to 10 percent (yoy) in the first quarter of 2008.
China Quarterly Update — June 2008
17
In the current challenging environment, macroeconomic management needs good coordination between fiscal and monetary policy. Based on our current economic projections, there is no need for a loosening of fiscal policy. Uncertainty is high currently, and if growth prospects worsen significantly beyond current forecasts, there may be a case for a fiscal easing. However, since the fiscal stance has implications for inflationary pressures, it is important to coordinate fiscal and monetary policy. The government has recently introduced several measures to contain food prices. During 2007, the government introduced several administrative measures to contain food prices (see our February Quarterly Update, page 13). In 2008, these were complemented by others. A number of measures were taken to discourage or restrict exports and stimulate imports, including introducing a quota system for the exports of grain and fertilizers (since January 2008), removing the VAT rebate for exports of edible oils (in May 2008), and reducing the import tariff on some medicine and food items (including frozen pork meat and baby food) (May 2008, until end 2008). In addition, to dampen the domestic price of fertilizer, the export tariff for phosphorous products was increased from 20 to 100 percent (in May 2008, until end 2008), while imports of sulfur have been exempted from import taxation. Moreover, with an eye to the environment, as of June sales of domestically produced organic fertilizers will be exempt from VAT. Direct subsidies to farmers are set to increase 75 percent in 2008 to RMB 63 billion and the government set a minimum procurement price for wheat. The government could usefully consider shifting more to direct subsidies to consumers. That is because keeping food and other basic items affordable in the face of high food prices may be just as important or more important than keeping prices low. To minimize costs and keep subsidies justifiable, direct subsidies are, if practically possible, best targeted at the most needy groups. Examples to consider would be providing direct subsidies to the poor, raising the basic living allowance line of low income groups, and expanding the coverage of the social security net. Pricing The large increases in international prices recently put pressure on pricing policies. The large majority of prices in China are market determined, and many of China’s food and commodity prices largely follow international prices. However, 2 key markets where this is not the case are grain and fuel products. The government uses a range of policies to prevent high international grain prices from affecting domestic grain prices. As a result, China’s grain price is now significantly lower than international prices (Figure 8). With China’s economy more interlinked with the global economy than in the past, such price gaps will be more difficult to maintain over time. For instance, while there is a large gap between domestic and international grain prices, China’s soy bean prices have followed international ones. As a result, farmers in

China Quarterly Update — June 2008
18
China are now shifting from growing grain to growing soy beans.11 This puts downward pressure on supply and may eventually lead to higher grain prices. The high international oil price challenges China’s petroleum product pricing system. The government’s mechanism to let domestic fuel prices respond to international prices was suspended in 2003. Since then, a few ad hoc adjustments were made. During 2007, as concerns about inflation increased, the government issued a ban on upward adjustment of any administrative prices. However, as fuel shortages started to spread, the government increased gasoline and diesel prices by 10 percent in November. Our estimates suggest that with these prices the break-even oil price of refiners is around RMB 540, or around US$ 78 per barrel.12 As international oil prices have risen to much higher levels, the gap with domestic fuel prices widened, leading to an increasing loss on the sale of fuels refined from crude oil bought at market prices. Given these disincentives to sell fuel products, localized fuel shortage occur from time to time. The losses also led to negotiations on subsidies for China Petroleum and Chemical Corporation (SinoPec). SinoPec is a large net buyer of crude oil, unlike China National Petroleum Company (CNOC), which relies largely on domestically produced oil. SinoPec received RMB 4.9 billion subsidy for 2007 and RMB 7.4 billion for the first quarter of 2008. The government also started to refund the import tax levied on refined oil. The financial consequences of this arrangement are significant, although not as large as in some other countries. According to our estimates, with an average oil price of US$ 108 per barrel in 2008 (the World Bank’s most recent forecast), the total cost of the implied subsidy to fuel consumers on refining imported oil in 2008 would be around RMB 218 billion, or 0.8 percent of GDP, with the cost shared between the oil companies and the government.13 In several other Asian countries, including Indonesia, Malaysia, and India, high subsidy costs have been a major reason behind recent increases in retail prices of fuel products. One reason why in China the costs are not as high as in some other countries is that China produces around one-half of its oil consumption. With average production costs of around US$ 20 per barrel, profits of the sale of fuel produced with this crude oil can in part compensate, even though this does not apply to all individual companies. However, even if the financial consequences of the price controls are sustainable, there are strong reasons to adjust prices. In China, as in several other countries, fuel prices are kept low to keep fuel and other basic necessities affordable for low and middle income people. However, the low prices benefit everyone, including rich people that can afford high prices. Moreover, keeping prices low distorts demand behavior. While energy
11 For example, last year, thus before the more recent price hikes, the maize cultivation area in Jilin increased 0.2 percent while the soybean area grew 17.1 percent. 12 Although such estimates are difficult to do, our estimates of the resulting refining loss are very close to the profits/losses reported by the petroleum refiners to the NBS, increasing our confidence in the estimate. 13 If oil prices were to stay at current levels during the rest of 2008, this subsidy would be RMB 333 billion or 1.2 percent of GDP.

China Quarterly Update — June 2008
19
is globally a scarce commodity, and thus highly priced, the low fuel prices in several countries prevent demand to respond to price incentives. As with food price policies, a more efficient way to protect people’s purchasing power would be to let prices increase and introduce direct subsidies for consumers. Such a shift would be in line with the government’s strategy to price resources in line with scarcity and costs, including to improve energy efficiency and environmental quality. Direct subsidies would best be targeted. However, even broad subsidy schemes would be preferable over price controls, because such subsidies do not distort demand. The government of South Korea had these considerations in mind when, instead of reducing the fuel tax, on June 10 it announced a fuel subsidy package including direct subsidies for low and middle income households that reach three-fourth of households.14
14 The South Korean government indicated it would consider reducing the fuel tax if oil prices rise above US$ 170 per barrel.
China Quarterly Update — June 2008
20
Recently released World Bank studies on China: World Development Report 2008: Agriculture for Development By Derek Byerlee, Alain De Janvry, Elisabeth Sadoulet, Robert Townsend, and Irina Klytchnikova The report, as the 30th in the series, conveys an overall message that agriculture is a vital development tool for achieving the Millennium Development Goal that calls for halving by 2015 the share of people suffering from extreme poverty and hunger. Full text available at http://www-wds.worldbank.org/external/default/WDSContentServer/WDSP/IB/2007/11/13/000020953_20071113102401/Rendered/PDF/414560ENGLISH018082137297501PUBLIC1.pdf East Asia & Pacific Update - Testing Times Ahead As the global economy is once again facing a testing time, East Asia is becoming more of a growth pole in the world economy, proving to be a force for stability at a time when the industrial economies are slowing. Full text available at http://www-wds.worldbank.org/external/default/WDSContentServer/WDSP/IB/2008/05/05/000333037_20080505020146/Rendered/PDF/434320WP0EAP0U1Box0327268B01PUBLIC1.pdf Are there lasting impacts of aid to poor areas? Evidence from rural China (WPS No. 4084) By Chen Shaohua, Mu Ren, and Martin Ravallion. The paper revisits the site of a large, World Bank-financed, rural development program in China 10 years after it began and four years after disbursements ended. The program emphasized community participation in multi-sectoral interventions (including farming, animal husbandry, infrastructure and social services). Full text available at http://www-wds.worldbank.org/external/default/WDSContentServer/WDSP/IB/2008/03/03/000158349_20080303131839/Rendered/PDF/wps4084.pdf China is poorer than we thought, but no less successful in the fight against poverty (WPS No. 4621) By Chen Shaohua and Martin Ravallion This paper examines the implications of the new Purchasing Power Parity (PPP) rate (derived by the ICP) for China's poverty rate (by international standards) and how it has changed over time. Using an international poverty line of USD1.25 at 2005 PPP, the authors find a substantially higher poverty rate for China than past estimates. Full text available at http://www-wds.worldbank.org/external/default/WDSContentServer/WDSP/IB/2008/05/19/000158349_20080519094812/Rendered/PDF/wps4621.pdf Health reform, population policy and child nutritional status in China (WPS No. 4587) By Caryn Bredenkamp This paper examines the determinants of child nutritional status in seven provinces of China in the 1990s, focusing specifically on the role of two areas of public policy of health system reforms and the one child policy. Full text available at http://www-wds.worldbank.org/external/default/WDSContentServer/WDSP/IB/2008/04/14/000158349_20080414095939/Rendered/PDF/wps4587.pdf Lessons from China to Africa (WPS No. 4531) By David Dollar Other developing countries struggling to grow and reduce poverty are naturally interested in what has been the source of this impressive growth and what, if any, lessons they can take from China given its success in this modern era of globalization. This paper focuses on four features of modern China that have changed significantly between the pre-reform period and today. Full text available at http://www-wds.worldbank.org/external/default/WDSContentServer/WDSP/IB/2008/02/25/000158349_20080225161200/Rendered/PDF/wps4531.pdf
China Quarterly Update — June 2008
21
Migrant labor markets and the welfare of rural households in the developing world: evidence from China (WPS No. 4585) By Alan de Brauw, John Giles This paper examines the impact of reductions in barriers to migration on the consumption of rural households in China. The authors find that increased migration from rural villages leads to significant increases in consumption per capita, and that this effect is stronger for poorer households within villages. Full text available at http://www-wds.worldbank.org/external/default/WDSContentServer/WDSP/IB/2008/04/02/000158349_20080402082450/Rendered/PDF/wps4585.pdf Migrant opportunity and the educational attainment of youth in rural China (WPS No. 4526) By Alan de Brauw, John Giles This paper investigates how reductions of barriers to migration affect the decision of middle school graduates to attend high school in rural China. The findings show a robust negative relationship between migrant opportunity and high school enrollment. Full text available at http://www-wds.worldbank.org/external/default/WDSContentServer/WDSP/IB/2008/02/21/000158349_20080221100315/Rendered/PDF/wps4526.pdf The anatomy of China’s export growth (WPS No. 4628) By Mary Amiti, Caroline Freund Decomposing China's real export growth, of over 500 percent since 1992, reveals a number of interesting findings including the changed export structure, the unchanged skill content, increasing specialization and the intensive margin, consistency with the world supply of existing varieties, and falling export prices to the United States. Full text available at http://www-wds.worldbank.org/external/default/main?pagePK=64193027&piPK=64187937&theSitePK=523679&menuPK=64187510&searchMenuPK=64187283&theSitePK=523679&entityID=000158349_20080527092730&searchMenuPK=64187283&theSitePK=523679 The impact of remittances on rural poverty and inequality in China (WPS No. 4637) By Zhu Nong, Luo Xubei This paper examines the impact of rural-to-urban migration on rural poverty and inequality in the case of Hubei province using the data of a 2002 household survey. The results show that, by providing alternatives to households with lower marginal labor productivity in agriculture, migration leads to an increase in rural income. Full text available at http://www-wds.worldbank.org/external/default/WDSContentServer/WDSP/IB/2008/05/28/000158349_20080528140510/Rendered/PDF/wps4637.pdf Trade remedies and non-market economies: economic implications of the first US countervailing duty case on China (WPS No. 4560) By Zhao Longyue, Wang Yan This study focuses on the first countervailing duty case on imported coated free sheet paper from China and analyzes the implications of this test case for United States-China bilateral trade, and industrial policies in transitioning market economies. The paper also provides a brief review of the economics of subsidies, World Trade Organization rules on subsides and countervailing measures and United States countervailing duty laws applied to non-market economies. Full text available at http://www-wds.worldbank.org/external/default/WDSContentServer/WDSP/IB/2008/03/17/000158349_20080317170532/Rendered/PDF/wps4560.pdf

China Quarterly Update — June 2008
22