world bank documentdocuments.worldbank.org/curated/en/942581468776956168/pdf/multi0... ·...
TRANSCRIPT

22538
Middle C-East LA+MrcA Capital
anid acnd Cv7owtLNio "tk Af"icci
Tke 1ecove-"cc RCole-
Wopkhng Pcoeip Of CdLxcACtioVICd SySte-/S
Seu*i e-s
N o 22
April 2001
~S cIAstikm DessL4S
Tke WolcI Ban~'k
ProcI>cd by theOffice of t+e :
Chkief Ccovnorisf
SLuA'wMCWies ivn,Arabic cacld F--e-cFILE COPY
Pub
lic D
iscl
osur
e A
utho
rized
Pub
lic D
iscl
osur
e A
utho
rized
Pub
lic D
iscl
osur
e A
utho
rized
Pub
lic D
iscl
osur
e A
utho
rized


Human Capital and Growth: TheRecovered Role of Educational Systems
by
Sebastien Dessus*Social and Economic Development Group
Middle East and North Africa Region
April 2001
* The author is grateful to J.-C. Berth6lemy, J. Keller, K. Michaelova, K. Neymarc, L. Soderling and ananonymous referee for their comments and suggestions. Views expressed here do not necessarilyreflect those of the World Bank, its executive directors, or the countries they represent.


Table of Contents
Summary
Human Capital and Growth: the Recovered Role ofEducational Systems . ...................................................................... 1
I. Introduction ....................................................................... 1
II. The Analytical Framework of Conditional Convergence: Theory andEmpirical Evidence ................................. ...................................... 2
m. Testing the Augmented Solow Model: the Crucial Issue of Heterogeneity ...... 6
IV. Seeking the Source of Heterogeneity: the Significance of EducationalSystems ....................................................................... 8
V. Conclusion ....................................................................... 14
Tables
Table 1: Estimation of the augmented Solow model with different methods(1960-90) ....................................................................... 4
Table 2: Estimation of the Solow Model with quality indexes in education (1960-90) ..6Table 3: Estimation of the Solow Model with heterogeneous slopes for the human
capital ....................................................................... 8Table 4: Correlation matrix of different characteristics of the educational system ..... 11Table 5: Educational Systems and the marginal productivity of human capital) ........ 12
References ....................................................................... 15
Appendix ....................................................................... 17


zjlritill 4i; o Y YI Mas.~ l v zvi L.Lll o:LJ,S1 (X3i>.
L 51 J ill &I 6A. &A .,; A l 9=" o1 Uj13 1 oI~L. s : l5
e51D *3Jiil A l jw, -p-9Yz3)t;s'-l u \ u ;
ZL.LL;S a,jUu2 jwi gJ ;, >a- 1 )}F


Resume
Des etudes empiriques recentes s'interrogent sur la justesse del'importance de 1'education pour la croissance. Cet etat de choses provienten partie du fait que les differences internationales dans la qualite dusysteme educatif definies par leur capacite de produire une unite marginalede capital humain productif ne sont pas prises en compte. Nous retenonsles modeles de croissance neoclassique sur des donnees de panel danslesquelles l'lasticite du capital humain depend de maniere stochastique desdifferents caracteristiques du systeme educatif. Plusieurs de cescaracteristiques expliquent les differences de qualite telles que lesinfrastructures educatives, la dotation de capital humain et la capacite dedistribuer de facon egale les services educatifs dans la population.
Mots cles: monde, croissance, capital humain, systemes educatifs,donnees de panel, methode de parametre variable.

Summary
Recent empirical studies question the conventional wisdom on theimportance of education for growth. This result comes partly from the factthat international differences in the quality of the educational system -
defined by its capacity to produce one marginal unit of productive humancapital -are not taken into account. We estimate neo-classical growthmodels on panel data in which the elasticity of human capital dependsstochastically on different characteristics of the educational system. Severalof these characteristics explain the quality differences, such as theeducational infrastructures, the initial endowment of human capital and theability to distribute equally educational services within the population.
Keywords: world, growth, human capital, educational systems, paneldata, varying-parameter method.


Human Capital and Growth: the Recovered Role ofEducational Systems
I. Introduction
Recent empirical studies based on international comparisons questionthe conventional development wisdom on the importance of education forgrowth. Using panel data to correct inherent shortcomings of cross-countryestimates of neo-classical growth models, Caselli, Esquivel and Lefort (1996)do not find robust evidence to support the view that investing in humancapital necessarily produces growth, as suggested earlier by Mankiw, Romerand Weil (1992). Casual comparative observations in a number of developingeconomies confirm this statement: improvements in the educationalattainment of the labor force do not always have a positive impact on therate of growth of output per worker (Pritchett, 1996). The author evenwonders "where has all the education gone?", or in other words, what is theutility of schooling expenditures?
A plausible explanation may come from the fact that the quality ofeducational systems evolves at different pace from one country to another.Indeed, analysis from Hanushek and Kim (1995) shows the significance oflabor force quality as an explanatory of international differences in percapita growth rates. Since it has also been shown by Lee and Barro (1996)that labor force quality was correlated with educational infrastructures, onemight think that simply introducing the latter into the neo-classical growthmodel would reconcile cross-country and panel data estimates.Unfortunately, multiplying the measure of human capital with an indicatorof quality to account for differences in the quality of educational systemsdoes not significantly change the picture.
Nevertheless, this result is not sufficient to reject the hypothesis thathuman capital accumulation has a positive impact on economic growth. Inthis paper, we propose an alternative specification of the impact ofeducational systems on growth. We assume that the differences in thequality of educational systems lie in their respective capacity to produce onemarginal unit of productive human capital, where a unit is defined asproductive if it permits an increase in GDP. It directly follows thatinternational differences need to be taken into account in average factorproductivity, as well as the elasticity of GDP with respect to human capital.The estimation bias originating from ignoring these differences may thenwell explain why a negative role is conferred to human capital in growthmodels estimated using panel data. -
We test this assumption on a panel of 83 countries for the period1960-1990. After having reproduced results similar to those reported byCaselli et aL (1996) and Islam (1995), we observe the presence of asignificant bias of estimation originating from the lack of consideringdifferences in educational systems. By correcting the bias, a positive impactof human capital accumulation on growth reappears. Then, we try to

2
identify statistically the source of heterogeneity using a varying parametermethod. Our results suggest that differences in educational infrastructuresexplain significantly differences in human capital marginal productivityacross countries. Moreover, the capacity of a school system to distributeeducational services equally within the population enhances thecontribution of human capital accumulation to growth. Finally, the initialendowment in human capital has a significant impact on the quality ofeducation. Even though this last result is difficult to interpret because itmay capture many theoretical channels through which the availability ofhuman capital influences the quality of educational services, it is fullyconsistent with the existence of poverty traps observed by Azariadis andDrazen (1990) and Cohen (1996).
II. The Analytical Framework of Conditional Convergence: Theory andEmpirical Evidence
The conditional convergence model developed by Mankiw et al. (1992)is directly derived from the textbook Solow model (1956), augmented with anargument of human capital in the neo-classical production function. It iswritten as the reduced form of a constant returns to scale productionfunction and a capital law of motion, such that:
Yt =k ahb a-nd {k=sky-(n+g+8)k (1)t t *=sh -(n+g+,3)h
with y, k and h being respectively the income, the physical capital stock andthe human capital stock per unit of efficient labor; sh and sk the investmentrates in physical and human capital stocks; n the population growth rate, 5the physical capital depreciation rate, and g the growth rate of exogenoustechnical progress. The transitional phase of growth of an economy towardsits steady state can be written as:
Iny,y-lny,- = +(l -e) a (In sk - ln(n + g +))1-a-b
b+ (1-eA _ (In sh - ln(n + g + ) (2)1-a-b
- (I - e-2 ) In yt-I
with A = (1-a-b)(n+g+ 5)
First designed to test the assumption of per capita incomeconvergence across countries, this specification has rapidly been adopted asa means of identification of long-run growth determinants. The initialestimations of conditional convergence equations on cross-sectional datawere then criticized on two fronts. On the one hand, Caselli et al., (1996)show that ignoring country-specific individual effects is a major source ofbias and justifies the use of panel data. On the other hand, (Islam, 1995)questions the choice of using school enrolment measures to capture theinvestment in human capital, on the basis that the law of motion of human

3
capital formation remains largely unknown. Islam then suggests directlyusing the stock of human capital in conditional convergence equations, thelatter taking the form:
lnyi, - Iny,,, = -,B Inyi,l + a lnski,, (ni, + 5 + g) + A Inhi, +, + 77i + ei, (3)
where t denotes the period and i the country. The capita income growth ratedepends on the initial position of the economy (the convergence effect), aswell as on the variables defining the steady state towards which theeconomy is converging. The investment rate, sk, is one of those variable,once deflated by the sum of the population growth rate, the physical capitaldepreciation rate, and the growth rate of exogenous technical progress.' Thesteady state is equally defined by a country-specific fixed effect, qi,2 and aperiod-specific fixed effect, ,Ut, in order to capture temporal shocks commonto all countries. Finally, steady state per capita income is defined byintroducing the human capital stock, h, which is justified if the latter isstatistically exogenous to the growth process. The estimated coefficient X is amultiplicative factor of the elasticity of GDP with respect to human capital. 3
This model is estimated by using different econometric methods totest the validity of the results obtained by Islam (1995) and Caselli et al.(1996), who observe that human capital accumulation contributes negativelyto growth. In conformity with these studies, data are taken from Barro andLee (1994). The sample is balanced, with six five-year periods from 1960-65to 1985-90 and 83 countries. Per capita incomes are expressed atpurchasing power parities, in international dollars for the year 1985. Theinvestment rate is coherent with the measure of income, and the humancapital stock represents the average schooling years in the total populationover age 25 (see Appendix).
Table 1 reports the econometric estimation of Equation (1) using fourdifferent econometric methods to address the problem of inconsistency indynamic equations with individual effects first publicized by Nickell (1981).Nickell shows that estimating dynamic equations with individual effects(random or deterministic) using ordinary least squares producesasymptotically biased estimators, as long as the number of periods is finite.This bias originates in the asymptotic correlation between residuals and thelagged endogenous variable. The Hausman test of specification4, and theexhaustive nature of the sample justify the deterministic (rather than
The sum 8 + g is conventionally fixed to five percent (Mankiw et al., 1992). Sensitivity analysis shows thatthis arbitrary choice does not significantly modify the estimates of the structural parameters of the productionfunction.2 Fisher tests for a common intercept across countries reject this null hypothesis, in conformity with Caselli etal. (1996).3 The elasticity of GDP with respect to physical capital is theoretically equal to a 1(,1 + a). The estimated
coefficient of human capital must also be divided by (,B + a) to obtain the elasticity of GDP with respect tohuman capital.4 This test rejects at the one percent level the null hypothesis of random individual effects.
4
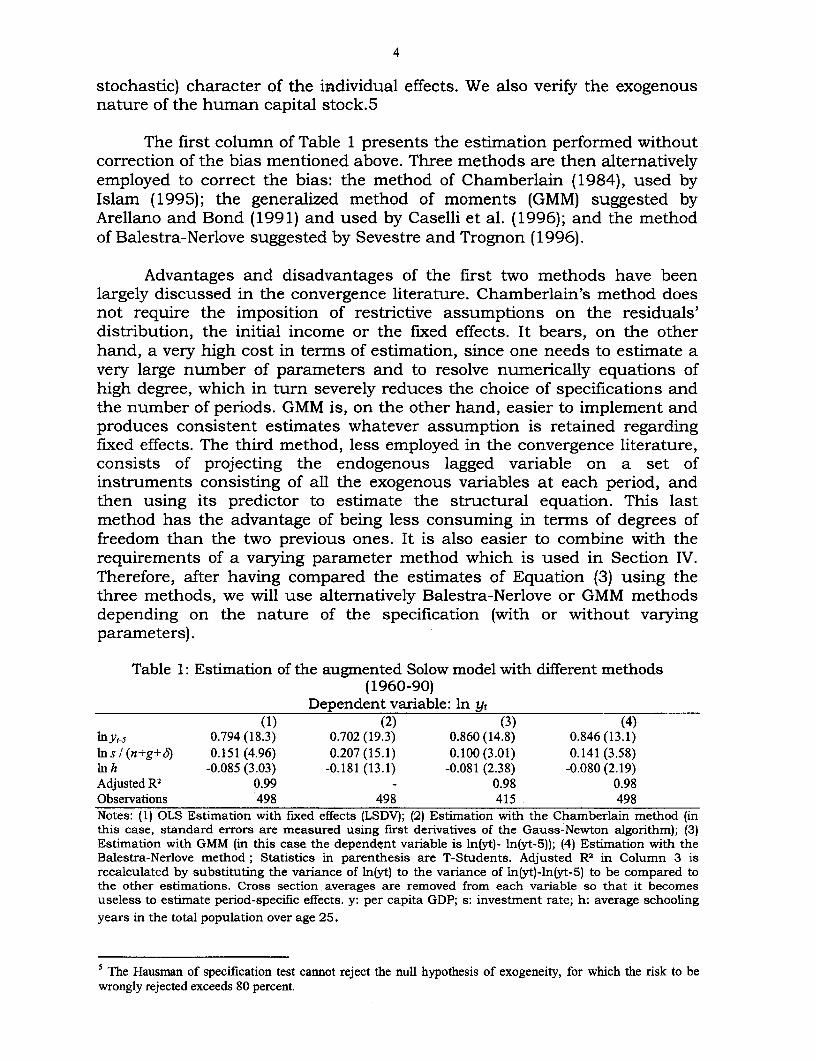
stochastic) character of the individual effects. We also verify the exogenousnature of the human capital stock.5
The first column of Table 1 presents the estimation performed withoutcorrection of the bias mentioned above. Three methods are then alternativelyemployed to correct the bias: the method of Chamberlain (1984), used byIslam (1995); the generalized method of moments (GMM) suggested byArellano and Bond (1991) and used by Caselli et al. (1996); and the methodof Balestra-Nerlove suggested by Sevestre and Trognon (1996).
Advantages and disadvantages of the first two methods have beenlargely discussed in the convergence literature. Chamberlain's method doesnot require the imposition of restrictive assumptions on the residuals'distribution, the initial income or the fixed effects. It bears, on the otherhand, a very high cost in terms of estimation, since one needs to estimate avery large number of parameters and to resolve numerically equations ofhigh degree, which in turn severely reduces the choice of specifications andthe number of periods. GMM is, on the other hand, easier to implement andproduces consistent estimates whatever assumption is retained regardingfixed effects. The third method, less employed in the convergence literature,consists of projecting the endogenous lagged variable on a set ofinstruments consisting of all the exogenous variables at each period, andthen using its predictor to estimate the structural equation. This lastmethod has the advantage of being less consuming in terms of degrees offreedom than the two previous ones. It is also easier to combine with therequirements of a varying parameter method which is used in Section IV.Therefore, after having compared the estimates of Equation (3) using thethree methods, we will use alternatively Balestra-Nerlove or GMM methodsdepending on the nature of the specification (with or without varyingparameters).
Table 1: Estimation of the augmented Solow model with different methods(1960-90)
Dependent variable: In yt(1) (2) (3) (4)
lnY1 5 0.794 (18.3) 0.702 (19.3) 0.860 (14.8) 0.846 (13.1)lns/(n+g+b) 0.151 (4.96) 0.207 (15.1) 0.100(3.01) 0.141 (3.58)Inh -0.085 (3.03) -0.181 (13.1) -0.081 (2.38) -0.080 (2.19)Adjusted RP 0.99 - 0.98 0.98Observations 498 498 415 498Notes: (1) OLS Estimation with fixed effects (LSDV); (2) Estimation with the Chamberlain method (inthis case, standard errors are measured using first derivatives of the Gauss-Newton algorithm); (3)Estimation with GMM (in this case. the dependent variable is ln(yt)- ln(yt-5)); (4) Estimation with theBalestra-Nerlove method; Statistics in parenthesis are T-Students. Adjusted R2 in Column 3 isrecalculated by substituting the variance of ln(yt) to the variance of ln(yt)-ln(yt-5) to be compared tothe other estimations. Cross section. averages are removed from each variable so that it becomesuseless to estimate period-specific effects. y: per capita GDP; s: investment rate; h: average schoolingyears in the total population over age 25.
5 The Hausrnan of specification test cannot reject the null hypothesis of exogeneity, for which the risk to bewrongly rejected exceeds 80 percent.

5
We can observe in Table 1 that human capital accumulation - as it isspecified in the Solow model - exerts a negative role on growth whicheverestimation method is retained. These results confirm previous ones from theauthors cited above, and motivate us to explore other hypotheses for abetter understanding of the nature of the relationship between humancapital accumulation and growth.
A first attempt consists of correcting human capital with an index ofquality. For Islam (1995), this "anomalous" result could indeed be theconsequence of a measurement error. The author suggests that the averageyears of schooling is a poor measure for what it is attempts to capture, sincethe quality of schooling is not included. Therefore, the statisticalrelationship between human capital and growth may be imperfectlymeasured in countries where the quality of education has evolved rapidly. Inorder to test this assumption, we estimate a conditional convergenceequation in which the actual human capital Q may be written for the periodt as:
at =h taItv (4)
where It is a quality index. The conditional convergence equation thusbecomes:
lnyi, -lnyi, l = -flnyil +alnsi,/(ni, +5+g)+Aolnhi, + vIi, + + i + (5)
The quality index must contain temporal information, otherwise thequality effect cannot be distinguished from the country fixed effect. Thiscondition seriously limits the available number of variables able to capturethe international differences in the quality of schooling. We retain twoindicators for this purpose, (i) the pupil-teacher ratio in primary school (PTl)and (ii) the share of schooling expenditures in GDP (EY). These twoindicators may be interpreted as measures of the efforts made by countriesto improve the quality of their educational systems.
One may notice that the elasticity of GDP with respect to humancapital is no longer identifiable in Equation (5). This specification enablesus, however, to observe if the introduction of quality indexes modifies theestimated relationship between human capital accumulation and growth.Results are reported in Table 2.
6
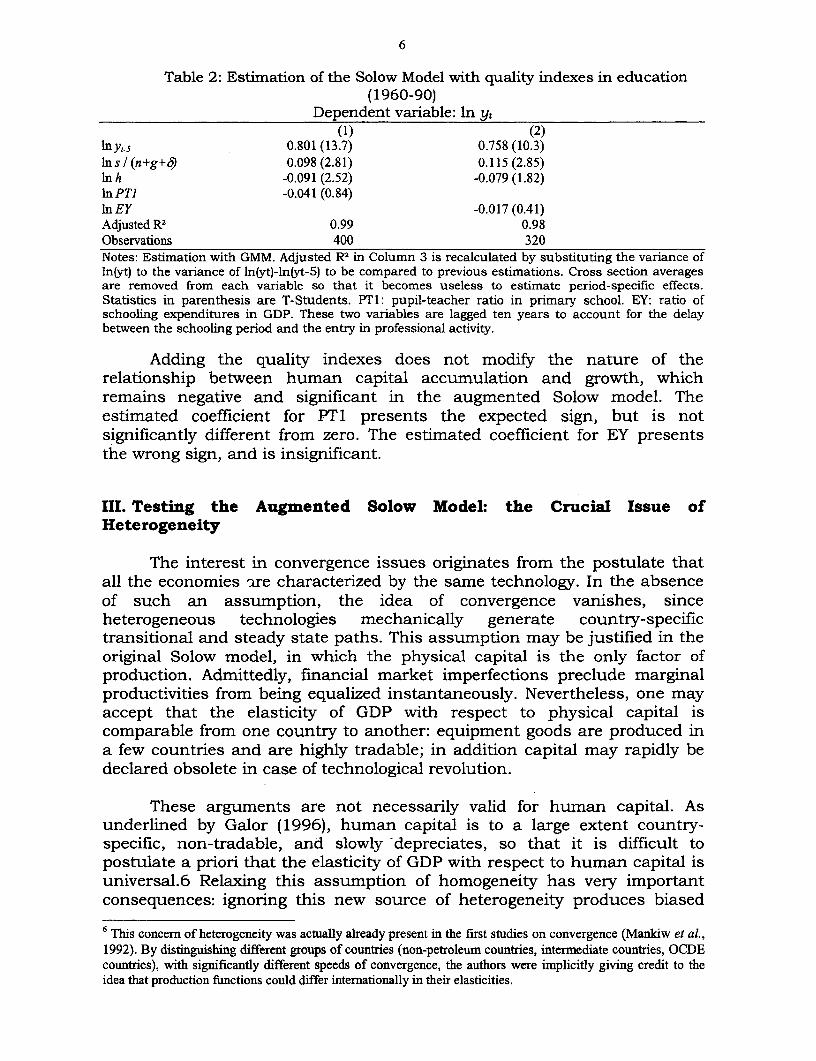
Table 2: Estimation of the Solow Model with quality indexes in education(1960-90)
Dependent variable: ln yt(1) (2)
lnyt-5 0.801(13.7) 0.758 (10.3)Ins / (n+g+S) 0.098 (2.81) 0.115 (2.85)In h -0.091 (2.52) -0.079 (1.82)InPTI -0.041 (0.84)In EY -0.017(0.41)Adjusted R2 0.99 0.98Observations 400 320Notes: Estimation with GMM. Adjusted R2 in Column 3 is recalculated by substituting the variance ofIn(yt) to the variance of In(yt)-ln(yt-5) to be compared to previous estimations. Cross section averagesare removed from each variable so that it becomes useless to estimate period-specific effects.Statistics in parenthesis are T-Students. PTI: pupil-teacher ratio in primary school. EY: ratio ofschooling expenditures in GDP. These two variables are lagged ten years to account for the delaybetween the schooling period and the entry in professional activity.
Adding the quality indexes does not modify the nature of the
relationship between human capital accumulation and growth, whichremains negative and significant in the augmented Solow model. The
estimated coefficient for PT1 presents the expected sign, but is not
significantly different from zero. The estimated coefficient for EY presents
the wrong sign, and is insignificant.
III. Testing the Augmented Solow Model: the Crucial Issue ofHeterogeneity
The interest in convergence issues originates from the postulate that
all the economies are characterized by the same technology. In the absence
of such an assumption, the idea of convergence vanishes, sinceheterogeneous technologies mechanically generate country-specifictransitional and steady state paths. This assumption may be justified in the
original Solow model, in which the physical capital is the only factor of
production. Admittedly, financial market imperfections preclude marginalproductivities from being equalized instantaneously. Nevertheless, one may
accept that the elasticity of GDP with respect to physical capital iscomparable from one country to another: equipment goods are produced in
a few countries and are highly tradable; in addition capital may rapidly be
declared obsolete in case of technological revolution.
These arguments are not necessarily valid for human capital. As
underlined by Galor (1996), human capital is to a large extent country-
specific, non-tradable, and slowly -depreciates, so that it is difficult topostulate a priori that the elasticity of GDP with respect to human capital is
universal.6 Relaxing this assumption of homogeneity has very important
consequences: ignoring this new source of heterogeneity produces biased
6 This concern of heterogeneity was actually already present in the first studies on convergence (Mankiw et al.,1992). By distinguishing different groups of countries (non-petroleum countries, intermediate countries, OCDEcountries), with significantly different speeds of convergence, the authors were imnplicitly giving credit to theidea that production functions could differ internationally in their elasticities.

7
coefficients in the estimation of conditional convergence equations. As amatter of fact, arguing that slope heterogeneity - under classical conditionsof random distribution and exogeneity - is not a problem as long as we areonly interested in the estimation of the average slope is not valid withdynamic specifications (Pesaran and Smith, 1995). In this case, imposing acommon slope will bias the estimators. We illustrate the origin of the bias inthe following paragraphs. Assume a random variable defined by:
Yit = VYi.- + Yi Xit + Ei, (6)
where x is strictly exogenous and E a random variable with classicalproperties of distribution and independence. Imposing the slopehomogeneity will generate implicitly the following model:Yit= ( Oy-l + Y Xit + Vit and vi,t = (ri - ±)Xi,t + i,t)
In this case, estimating Equation (7) with the methods presented inthe previous paragraphs will produce biased coefficients if the exogenousvariable follows an auto-regressive process. The covariance between thelagged variable and the residual is indeed different from zero:
E(y 1,,-, vit) = 4 + E(p(xi ,-,, (yi - y)xit) • 0 for E(x1 t-l, xit) • 0 (8)
This example illustrates that the heterogeneity bias is due to thesimultaneous presence in the right-hand side of the equation of a laggedendogenous variable and an exogenous variable following an auto-regressiveprocess. This is typically the case of conditional convergence equations, inwhich the lagged endogenous variable is associated with the human capitalstock which follows by definition an auto-regressive process since it is theresult of cumulative investments.
We test the presence of such a bias in the previous estimations. Inorder to do so, we compare the estimate of the average slope in case of slopeheterogeneity to the constrained estimate, using Wald and Hausman tests.First, we estimate the following conditional convergence equation:
Inyit, - Inyit, = -, Iyif-, + alnsj',1(nj', + g +,) +yiIn hiJ +'Ut + 1i + Ei't (9)
The average slope of human capital is then defined by:N N N
N=N Pi and V()=v-2 N E(i^?j) (10)i . i j .
This last estimator of the average slope is consistent, but less efficientthan the one estimated imposing common slopes. Comparing the two withHausman test of specification thus enables us to test the presence of aheterogeneity bias. The Wald test allows measuring whether relaxing of theconstraint of common slopes improves significantly the goodness of fit of themodel. Table 3 reports the two estimations, with and without constraint.

8
Table 3: Estimation of the Solow Model with heterogeneous slopes for the humancapital
Dependent variable: ln yt(1) (2)
InYt5 0.846 (13.1) 0.443 (5.43)Ins! (n+g+5) 0.141 (3.58) 0.215 (4.63)Inh -0.080 (2.19) 0.086 (0.89)Adjusted R2 0.98 0.99Observations 498 498Notes: Estimation with the Balestra-Nerlove method. (1) Estimation imposing common slopes forhuman capital. (2) Estimation with different slopes for human capital (see text). Cross sectionaverages are removed from each variable so that it becomes useless to estimate period-specific effects.Statistics in parenthesis are T-Students.
Wald and Hausman tests both reject at the one percent level the nullhypothesis of slope homogeneity. Relaxing this assumption has severalconsequences. Even though the implicit elasticity of GDP with respect tophysical capital remains comparable to the previous estimates (about 0.3),the estimated elasticity of GDP with respect to human capital is significantlymodified. From being negative and significantly different from zero, itbecomes positive and not significantly different from zero. We thus recover apositive impact of human capital accumulation on growth after correction ofthe heterogeneity bias. This effect is not significantly different from zero,probably as a result of the great variance of the parameter.
IV. Seeking the Source of Heterogeneity: the Significance ofEducational Systems
The preceding section has underlined that results reported in theliterature about the negative relationship between human capital andgrowth come from the heterogeneity of production functions. The question isnow whether the source of the heterogeneity may be identified, in a view toprovide operational recommendations.
For this purpose, we propose an alternative view of the impact ofeducational systems on growth. We assume that the differences in thequality of educational systems lie in their respective capacity to produce onemarginal unit of productive human capital. This unit is defined asproductive if it permits an increase in GDP. Therefore, the quality ofeducational systems is no longer defined with respect to the averageproductivity of available human capital, but with respect to its marginalproductivity. We thus conceive an alternative specification to the one usedpreviously when we corrected the human capital with a quality index. Itconsists in writing the productive human capital Q as an exponentialfunction of a quality index Z, as follows:
Q=hz or -= Zhz-l hat at
(1 1)
9
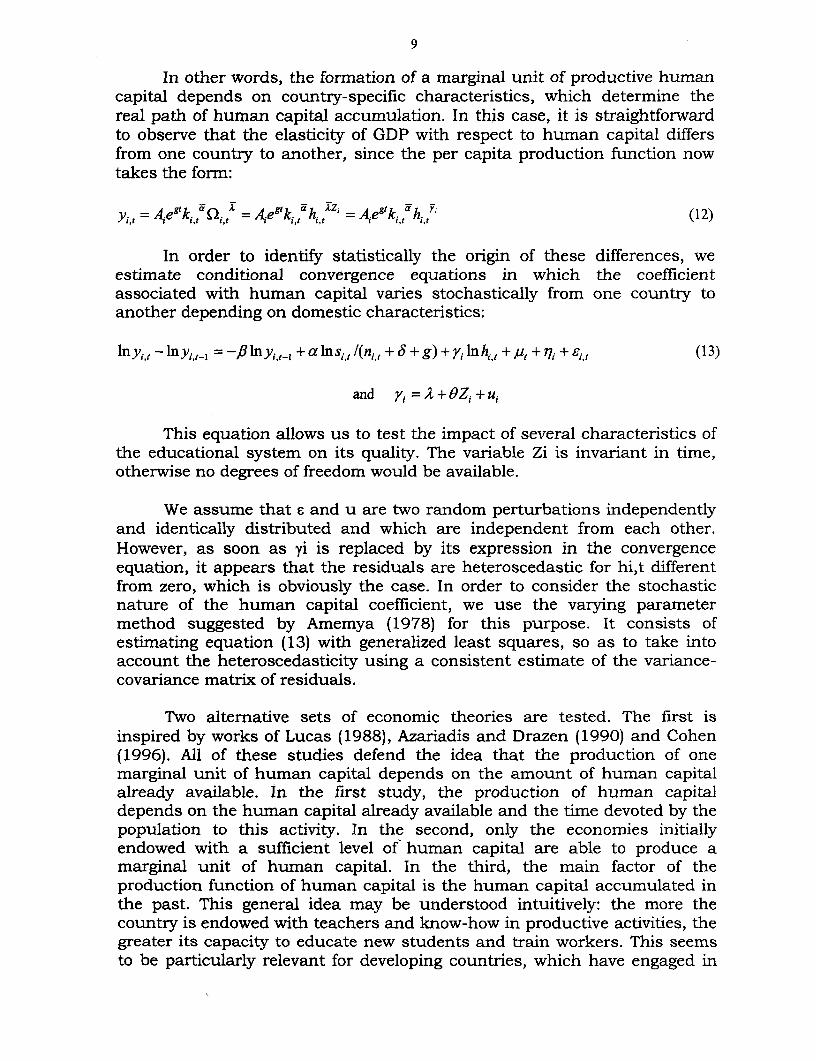
In other words, the formation of a marginal unit of productive humancapital depends on country-specific characteristics, which determine thereal path of human capital accumulation. In this case, it is straightforwardto observe that the elasticity of GDP with respect to human capital differsfrom one country to another, since the per capita production function nowtakes the form:
Yi- = Ae9tk.,Qit =A,egtk1tah1jt zi = Aiegtkttah,tY (12)
In order to identify statistically the origin of these differences, weestimate conditional convergence equations in which the coefficientassociated with human capital varies stochastically from one country toanother depending on domestic characteristics:
Inyi, -lny 1,, = -,fl1nyj,, +alns,,1(nj 1 +8S+g)+yilnhi, +,u, + 7i +ei, (13)
and Yi=2+9Zi+ui
This equation allows us to test the impact of several characteristics ofthe educational system on its quality. The variable Zi is invariant in time,otherwise no degrees of freedom would be available.
We assume that s and u are two random perturbations independentlyand identically distributed and which are independent from each other.However, as soon as yi is replaced by its expression in the convergenceequation, it appears that the residuals are heteroscedastic for hi,t differentfrom zero, which is obviously the case. In order to consider the stochasticnature of the human capital coefficient, we use the varying parametermethod suggested by Amemya (1978) for this purpose. It consists ofestimating equation (13) with generalized least squares, so as to take intoaccount the heteroscedasticity using a consistent estimate of the variance-covariance matrix of residuals.
Two alternative sets of economic theories are tested. The first isinspired by works of Lucas (1988), Azariadis and Drazen (1990) and Cohen(1996). All of these studies defend the idea that the production of onemarginal unit of human capital depends on the amount of human capitalalready available. In the first study, the production of human capitaldepends on the human capital already available and the time devoted by thepopulation to this activity. In the second, only the economies initiallyendowed with a sufficient level of human capital are able to produce amarginal unit of human capital. In the third, the main factor of theproduction function of human capital is the human capital accumulated inthe past. This general idea may be understood intuitively: the more thecountry is endowed with teachers and know-how in productive activities, thegreater its capacity to educate new students and train workers. This seemsto be particularly relevant for developing countries, which have engaged in

10
massive education plans to respond to demographic pressures withouthaving a sufficient initial level of human capital. In these cases, the rapidincrease in the years of schooling may actually mask the stagnation of theproductive human capital.
To some extent, the second set of theory leaves off from the analyticalframework used until now, since it necessitates disaggregating the humancapital. Aggregated human capital is now defined as the sum of individuals'human capital, and the marginal impact of the aggregated human capitalequals the sum of the marginal impacts of the individual's human capital.Therefore, it is assumed that the social return of education equals theprivate return of education. Works from Psacharopoulos (1994) suggest thatthe latter is generally decreasing with the number of years of schooling.Under these conditions, the social return of educational investment is higherwhen it is aimed at increasing the human capital of the less skilled, aproposition also emphasized recently by Shultz (1999). Moreover, the socialmarginal cost of education increases with the number of years of schooling:financing one year of university education is more expensive for society thanone year of primnary school. It is then relevant to test whether thedistribution of education within the population affects the marginalproductivity of aggregated human capital. The same average number ofyears of schooling may indeed mask very different distribution patterns ofqualifications across countries. We thus test the assumption that themarginal productivity of human capital depends on the distribution ofqualifications, for a given average number of years of schooling.
In order to test these theories, we use several indicators of the qualityof the educational system and of the distribution of qualifications. None ofthem is a perfect indicator of what we want to describe. Moreover, as we willsee below, it is difficult to say that any of the indicators describes exclusivelyone of the two theories mentioned in the previous paragraphs that themarginal production of human capital depends upon the human capitalalready in existence; and/or that the marginal productivity of human capitaldepends upon the distribution of qualifications. However, we believe therepeated observation of significant correlations will be a positive indicationof the robustness and relevance of the theoretical relationships we aretesting.
The two first indicators, the pupil-teacher ratio and the share ofeducational expenditures in GDP have already been discussed, but thedifference with their use in section II is that we now use the averagemeasure over the studied period for each country, denoted with the suffix A.We also test the impact of the number of students per teacher in secondaryschool, PT2A, for which the average is available for the period 1950-80.These three variables describe to what extent the country devotes financialand human resources to the activity of education. They are probablycorrelated among themselves, since a large share of educationalexpenditures is used to remunerate teachers. They are also probably

11
correlated with the initial human capital stock, if we assume that thenumber of teachers is ceteris paribus a positive function of the availablehuman capital stock. By also testing the impact of the latter (hO, the humancapital stock in 1960) on the marginal productivity of human capitalbetween 1960 and 1990, we therefore test directly the theory suggested byAzariadis and Drazen (1990) and Cohen (1996).
The measure of dispersion of qualifications is more delicate to build.Ideally the good measure would be a Gini index of education, for which theyears of education of each individual would replace the traditional measureof income. To our best knowledge, this measure is unfortunately unavailablefor international comparisons. We use instead a simpler measure ofdistribution of education, which is the share of the population who hasnever been to school (NSCOLA).
These different measures are not independent from each other, as wecan observe in Table 4 where the correlation matrix is reported. A fewremarks arise from this table. First, the average share of educationalexpenditures in GDP is not significantly correlated with the number ofstudents per teacher in primary and secondary school. This suggests thatthese variables are of very different nature. In particular, the system ofremuneration for teachers may differ largely across countries (Pritchett,1996), and so the differences in the share of educational expenditures inGDP may not actually reflect the efforts engaged by each country to promoteeducation. Second, one may observe that the pupil-teacher ratio insecondary school is only correlated with its counterpart in the primaryschool, but not correlated with the other indicators. Third, the initialendowment in human capital, hO, is highly correlated with the otherindicators (with the exception of PT2A), and particularly with the variabledescribing the effort of the nation to integrate the largest part of itspopulation in the educational system, NSCOLA. Fourth, variables supposedto describe the quality of the educational system are equally highlycorrelated with the variable NSCOLA. Therefore, it will be difficult toattribute to any variable the ability to validate exclusively one single theoryamong the two tested.
Table 4: Correlation matrix of different characteristics of the educational systemhO PTIA PT2A NSCOLA EYA
hO 1.00PTIA -0.63 1.00PT2A -0.13 0.38 1.00NSCOLA -0.88 0.62 0.08 1.00EYA 0.55 -0.29 0.08 -0.43 1.00
Notes: The correlation coefficients are calculated using the largest sample for each couple of variables(a maximum of 80 countries and a minimum of 62 countries). In bold are reported the correlationcoefficients significantly different from zero at the 1 percent level. hO: average schooling years in thetotal population over age 25 in 1960 ; PT1A: Average pupil teacher ratio in primary school over theperiod 1950-80; PT2A: Average pupil teacher ratio in secondary school over the period 1950-80;NSCOLA: average share of the population who has never been to school over the period 1960-90; EYA:average share of schooling expenditures in GDP over the period 1950-80.

12
Table 5 reports the estimations of the impact of differentcharacteristics of the educational system on the marginal productivity ofhuman capital, using the varying parameter method. Our results indicatethat the indicators retained for the quality of educational systems explainsignificantly the differences across countries in the contribution of humancapital accumulation to growth. The variables PT1A, NSCOLA and EYA aresignificantly different from zero at the 10 percent level and present expectedsigns. One standard deviation in the pupil teacher ratio translates in a 0.15-0.20 variation in the elasticity of GDP with respect to human capital. Onestandard deviation in the two other variables translates in a 0.10-0.15variation of the same elasticity. These results suggest that investing ineducational infrastructures is rewarded, and that the quality of educationreceived affects positively the skills of each individual.
The coefficient for the pupil-teacher ratio in secondary school isneither significantly different from zero nor of expected sign. It probablyillustrate the fact that in most of the sample's countries, the average years ofschooling is less than six, which is generally the number of years necessaryto complete primary school. Besides, the absence of a correlation with theother variables (cf. Table 4) could reflect the fact that in some countries theimprovement of schooling conditions in secondary school has been achievedto the detriment of the primary school.
The initial endowment in human capital, hO, is the most significantamong the variables tested in this study. The more the country wasendowed with human capital in 1960, the more the increase in educationalattainment between 1960 and 1990 has been productive. One standarddeviation in the initial endowment translates in a 0.2 variation in theelasticity of GDP with respect to human capital.
Table 5: Educational Systems and the marginal productivity of human capitalDependent variable: ln yt
(1) (2) (3) (4) (5)Iny,-s 0.444 (5.45) 0.439 (5.26) 0.427 (5.31) 0.457 (5.60) 0.459 (5.53)ins!(n+g+6) 0.214 (4.62) 0.209 (4.43) 0.211 (3.84) 0.214(4.31) 0.220 (4.49)varying parameter: In hIntercept -0.175 (1.57) 0.714 (3.05) -0.133 (0.45) 0.214 (1.84) -0.351 (0.05)hO 0.080 (2.96)PT1A -0.018 (2.76)PT2A 0.013 (0.86)NSCOLA -0.005 (1.85)EYA 0.111 (2.08)Observations 498 480 420 450 444Notes: Estimation method: varying parameter method (see text). Statistics in parenthesis are T-Students. R2 are not reported because the model includes two random perturbations.
This result tends to confirm the conclusions of Azariadis and Drazen(1990) and Cohen (1996). In addition, it is not subject to the criticism putforward by Pritchett (1996) on the basis of three points. The first point madeby Pritchett is to notice that if the initial level of human capital influencesthe growth rate of GDP, then the growth rate of human capital should also

13
influence the growth rate of GDP, a result for which the author cannot findrobust empirical evidence. Our approach reconciles the two stylized facts,since we observe that the initial endowment of human capital determines towhat extent the growth rate of GDP is influenced by the growth rate ofhuman capital. The second point made by Pritchett is to observe that thefact that human capital affects growth only through externality effects(Azariadis and Drazen, 1990) is in contradiction with the empirical evidencewhich concludes that human capital positively affects individualremuneration (Psacharopoulos, 1994). Our specification only indicates thatthe scale of individual remuneration depends on the quality of theeducational system, without any need to resort to externality effects. Finally,Pritchett (1996) questions the assumption of thresholds retained byAzariadis and Drazen (1990), which seems to contradict the empiricalobservation of a continuous concave relationship between the private returnand the level of human capital (Psacharopoulos, 1994). Again, thisobservation is not questioned by our specification, which postulates adecreasing marginal productivity of human capital.
Obviously, one cannot attribute to this last result the ability tocapture only the influence of educational systems on growth. There areother theoretical models that predict such an interactive effect withoutresorting to the educational system - for instance models with networkexternalities in the production function (Benhabib and Spiegel, 1994), ormodels in which the education level of the parents has a positive effect onstudent performance (Lee and Barro, 1998). However, it remains in practicedifficult to distinguish the different theoretical channels, given the highdegree of correlation between the initial endowment in human capital andthe indicators of educational infrastructures (cf. Table 4). Without feigningexclusivity, our results suggest that the difference in educationalinfrastructures may be one plausible explanation for the heterogeneity ofproduction functions.
The analytical framework developed here does not however allow us toexplain the paradox emphasized by Pritchett (1996): the observed poorimpact of educational investment on growth in some countries seems tocontradict the micro evidence, for which a huge literature indicates thatmore educated individuals receive higher wages, even in countries where thecontribution of human capital accumulation to growth is close to zero. Assuggested by Pritchett (1996), a potential explanation may be found bylooking at differences in institutional frameworks across countries. Humancapital can have only limited impact on economic growth if it is employed insocially unproductive activities, but nevertheless remunerative at the micro-level. Such misallocation may occur when distortions in the institutionalframework make rent seeking activities more profitable than productiveones, thus providing incentives for skilled workers to turn to the former.Testing formally this assumption goes much beyond the scope of this paper,which tries to identify the impact of educational systems on social returns tohuman capital. But, if one admit that private and social returns may differ,

14
a straightforward recommendation would be to implement a tax/ subsidyscheme to fill the gap between social and private returns.
Finally, the fact that the elasticity of GDP with respect to humancapital depends positively on the level of human capital is an obvious sourceof self-sustained growth. The more human capital is accumulated, thehigher is its marginal productivity. There is no equilibrium since in the longrun the marginal productivity of human capital becomes increasing and thesystem explodes. This effect of endogenous growth is, however, highlyunrealistic: there is presumably a limit in the number of years of schoolingthat individuals may accumulate. This result - if one does not attribute toomuch credit to its predictive capacity (after all, it is obtained on the basis ofonly thirty years of observations) - is interesting, for it suggests a plausibleexplanation for the phenomenon of conditional divergence (a simultaneousconvergence of inputs and divergence of incomes) observed by Cohen (1996).
V. Conclusion
The result reported by Pritchett (1996) and Caselli et al. (1996), thathuman capital accumulation would exert a negative influence on growth,suffers from a specification bias. This bias originates from ignoring theinternational differences in the quality of schooling systems, which isdefined in this paper as the capacity to produce one marginal unit ofproductive human capital. Using a varying parameter method, we identifyseveral characteristics that may explain these differences: the educationalinfrastructures, the initial endowment in human capital and the ability ofthe system to distribute equally educational services within the population.
These results explain to a large extent why investments in educationin developing countries have not been rewarded by higher growth. Massiveenrolments have been detrimental to the quality of education supplied; theunequal distribution of educational services has hampered the efficiency ofpublic expenditures. These two effects have in turn most likely reduced thepace of schooling enrollment for two reasons: firstly, because the low privatereturn of education has limited the demand for education; and secondly,because the unequal distribution of education has reduced the financingcapacities of the public sector. Birdsall, Ross and Sabot (1995) observe inthis respect that it is in the most egalitarian societies that the largestconsensus to support public schooling for all is found. It would beinteresting to go further in this direction of research, as well as in findingmore precise indicators of the quality of educational systems.
Poverty traps resulting from these vicious circles are not inevitable. Apriority given to primary education and access to all should produce, for thesame fiscal burden, more positive effects in terms of growth than prioritizingsecondary education for a few. Nevertheless, restricting the field of publicactions solely to the educational system is most likely insufficient. Parallelactions could also be envisaged to promote institutional frameworks that

15
would motivate skilled workers to devote their time to growth-promotingactivities. Along the same lines, efforts to favor the inflow of foreigntechnologies in developing countries should be encouraged (Pissarides,1993), in order to maximize the social return of public investment ineducation.


16
ReferencesAmemya, T. , 'A Note on a Random Coefficient Model", International Economic
Review, Vol. 19 (3), 1978, pp. 793-796.Arellano, M. and S. Bond, "Some Tests of Specification for Panel Data: Monte Carlo
Evidence and an Application to Employment Equations", Review of EconomicsStudies, Vol. 58 (2), 1991, pp. 277-297.
Azariadis, C. and A. Drazen, "Threshold Externalities in Economic Development",The Quarterly Journal of Economics,. Vol. 105(4), 1990, pp. 501-526.
Barro, R.J. and J. -W. Lee, "International Comparisons of Educational Attainment",NBER Working Paper, No.4349, 1993, Cambridge.
Barro, R.J. and J.-W. Lee, Data Set for a Panel of 138 Countries, revised version,www.worlbank.org, 1994, Washington DC.
Benhabib, J. and M. Spiegel, 'The Role of Human Capital in EconomicDevelopment: Evidence for Aggregate Cross-Country Data", Journal of MonetaryEconomics, Vol. 34 (2), 1994, pp. 143-173.
Birdsall, N., D. Ross and R. Sabot , 'Inequality and Growth Reconsidered: Lessonsfrom East Asia", The World Bank Economic Review, Vol. 9 (3), 1995, pp. 477-508.
Caselli, F.; G. Esquivel and F. Lefort, "Reopening the Convergence Debate: A NewLook at Cross-Country Growth Empirics", Journal of Economic Growth, Vol. 1,1996, pp. 363-389.
Cohen, D., 'Tests of the Convergence Hypothesis: Some Further Results", Journalof Economic Growth, Vol. 1, 1996, pp. 351-361.
Chamberlain, G., "Panel Data", in, Z. Grilliches and M. Intrilligator (eds.),Handbook of Econometrics, Vol. 2, 1984, pp. 1247-1313, Elesvier, Amsterdam.
Galor, O., "Convergence? Inference from Theoretical Models", The EconomicJournal, Vol. 106 (437), 1996, pp. 1056-1069.
Hanushek, E. A. and D. Kim, "Schooling, Labor Force Quality, and EconomicGrowth', NBER Working Paper, No. 5399, 1995, December, Cambridge.
Islam, N., 'Growth Empirics: A Panel Data Approach", The Ouarterly Journal ofEconomics, Vol. 110 (4), 1995, pp. 1127-1170.
Lucas, R., "On the Mechanisms of Economic Development", Journal of MonetarvEconomics, Vol. 22 (1),1988, pp. 3-42.
Lee, J.-W. and R.J. Barro, "Schooling Quality in a Cross Section of Countries",Development Discussion Paper, No. 659, 1998, October, Harvard Institute forInternational Development, Harvard.
Mankiw, G, D. Romer and D. Weil, "A Contribution to the Empirics of EconomicGrowth", The Quarterly Journal of Economics, Vol. 107 (2), 1992, pp. 407-437.
Nickell, S., "Biases in Dynamic Models with Fixed Effects", Econometrica, Vol. 49(6), 1981, pp. 1417-1426.
Pesaran, H. and R. Smith, "Estimating Long-Run Relationships from DynamicHeterogeneous Panels", Journal of Econometrics, Vol. 68, 1995, pp. 79-113.
Pissarides, C., "Learning by Trading and the Returns to Human Capital inDeveloping Countries", The World Bank Economic Review, Vol. 11 (1), 1997, pp.17-32.
Pritchett, L., "Where has all the Education Gone?", Policy Research Working Paper,No. 1581, 1996, World Bank, Washington.
Psacharopoulos, "Returns to Investment in Education: A Global Update", WorldDevelopment Vol. 22 (9), 1994, pp. 1325-1343.
Sevestre, P. and A. Trognon, "Dynamic Linear Models", in L. Matyas and P. Sevestre(eds.), The Econometrics of Panel Data, 1996, pp. 120-144, Kluwer AcademicPublishers, London.

17
Schultz, T.P., "Health and Schooling Investments in Africa", Journal of EconomicPerspectives, Vol. 13 (3), 1999, pp. 67-88.
Solow, R., "A Contribution to the Theory of Economic Growth", The QuarterlyJournal of Economics, Vol. 70, 1956, pp. 65-94.
Summers, R. and A. Heston, "The Penn World Table (Mark 5): An Expanded Set ofInternational Comparisons, 1950-1988", The Ouarterly Journal of Econornics,Vol. 106 (2), 1991, pp. 327-368.
UNESCO, statistical yearbooks, various issues, Paris.World Bank, World Tables, various issues, Washington D.C.
18
Appendix Data.
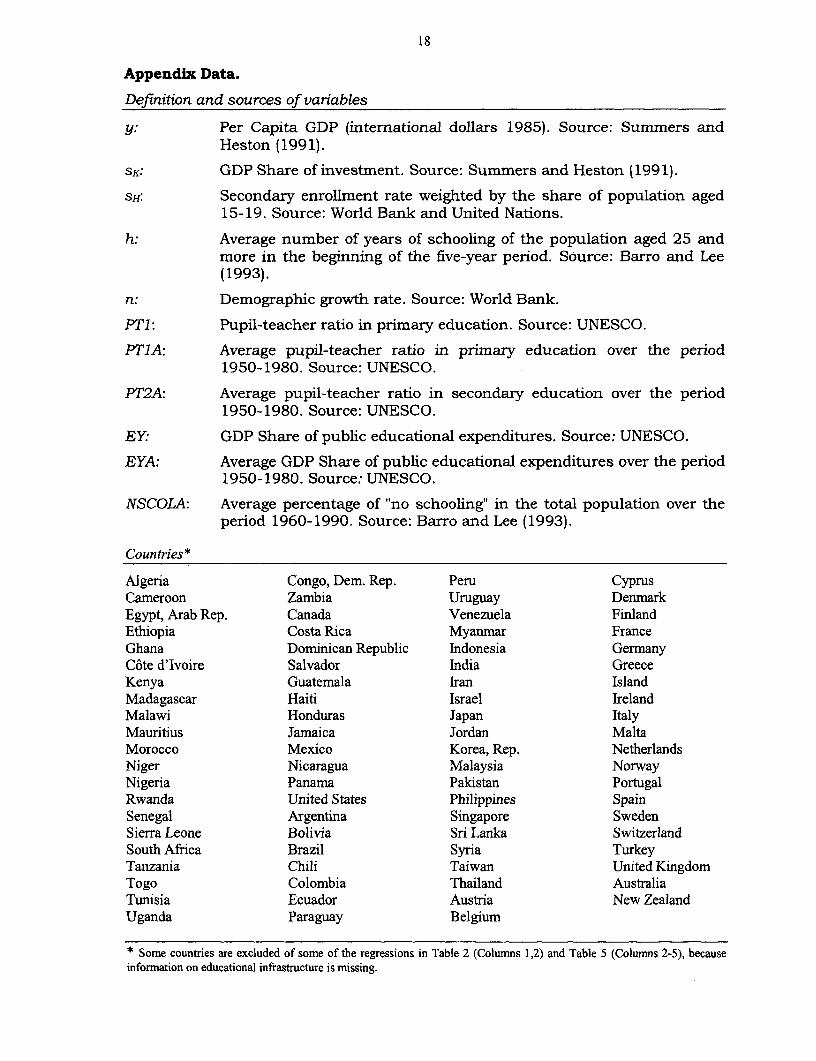
Definition and sources of variables
y: Per Capita GDP (international dollars 1985). Source: Summers andHeston (1991).
SK: GDP Share of investment. Source: Summers and Heston (1991).
sH: Secondary enrollment rate weighted by the share of population aged15-19. Source: World Bank and United Nations.
h: Average number of years of schooling of the population aged 25 andmore in the beginning of the five-year period. Source: Barro and Lee(1993).
n: Demographic growth rate. Source: World Bank.
PT1: Pupil-teacher ratio in primary education. Source: UNESCO.
PT1A: Average pupil-teacher ratio in primary education over the period1950-1980. Source: UNESCO.
PT2A: Average pupil-teacher ratio in secondary education over the period1950-1980. Source: UNESCO.
EY. GDP Share of public educational expenditures. Source: UNESCO.
EYA: Average GDP Share of public educational expenditures over the period1950-1980. Source: UNESCO.
NSCOLA: Average percentage of "no schooling" in the total population over theperiod 1960-1990. Source: Barro and Lee (1993).
Countries*
Algeria Congo, Dem. Rep. Peru CyprusCameroon Zambia Uruguay DenrnarkEgypt, Arab Rep. Canada Venezuela FinlandEthiopia Costa Rica Myanmar FranceGhana Domninican Republic Indonesia GermanyC6te d'Ivoire Salvador India GreeceKenya Guatemala Iran IslandMadagascar Haiti Israel IrelandMalawi Honduras Japan ItalyMauritius Jamaica Jordan MaltaMorocco Mexico Korea, Rep. NetherlandsNiger Nicaragua Malaysia NorwayNigeria Panama Pakistan PortugalRwanda United States Philippines SpainSenegal Argentina Singapore SwedenSierra Leone Bolivia Sri Lanka SwitzerlandSouth Africa Brazil Syria TurkeyTanzania Chili Taiwan United KingdomTogo Colombia Thailand AustraliaTunisia Ecuador Austria New ZealandUganda Paraguay Belgium
* Some countries are excluded of some of the regressions in Table 2 (Columns 1,2) and Table 5 (Columns 2-5), becauseinformation on educational infrastructure is missing.


MENA Working Paper Series
No. 1 Has Labor Migration Promoted Economic Integration in the Middle East?June 1992. Nemat Shafik, The World Bank and Georgetown University.
No. 2 The Welfare Effects of Oil Booms in a Prototypical Small Gulf State.September 1992. Ahmed Al-Mutuwa, United Arab Emirates University andJohn T. Cuddington, Georgetown University.
No. 3 Economic and Social Development in the Middle East and North Africa.October 1992. Ishac Diwan and Lyn Squire, The World Bank.
No. 4 The Link Between Trade Liberalization and Multi-Factor Productivity:The Case of Morocco. February 1993. Mona Haddad, The World Bank.
No. 5 Labor Markets in the Middle East and North Africa. February 1993.Christopher A. Pissarides, The London School of Economics and PoliticalScience.
No. 6 International Competitiveness of the Private Industry and the Constraintsto its Development: The Case of Morocco. June 1993. Hamid Alavi,The World Bank.
No. 7 An Extended RMSM-X Model for Egypt: Quantifications of Market-OrientedReforms. September 1993. Karsten Nimb Pedersen, The World Bank.
No. 8 A Report on the Egyptian Tax System. October 1993.Mark Gersovitz, Roger H. Gordon and Joel Slemrod, The World Bank.
No. 9 Economic Development and Cooperation in the Middle East and NorthAfrica. November 1993. Ishac Diwan and Lyn Squire, The World Bank.
No. 10 External Finance in the Middle East: Trends and Prospects. December 1993.Ishac Diwan, John Underwood and Lyn Squire, The World Bank.
No. 11 Tax Incidence on Agriculture in Morocco (1985-1989). April 1994.Jean-Paul Azam, CERDI, University of Auvergne, Clermont-Ferrand (France),et CSAE, Oxford (U.K.).
No. 12 The Demographic Dimensions of Poverty in Jordan. August 1994.Chantal Worzala, The World Bank.
No. 13 Fertility and Family Planning in Iran. November 1994. Rodolfo A. Bulatao andGail Richardson, The World Bank.
No. 14 Investment Efficiency, Human Capital & Migration A Productivity Analysisof the Jordanian Economy. May 1995. Gaston Gelos, Yale University,Department of Economics.

No. 15 Tax Effects on Investment in Morocco. August 1995.David Sewell, Thomas Tsiopoulos and Jack Mintz, The World Bank.
No. 16 Reconstruction in Lebanon: Challenges for Macroeconomic Management.April 1999. Daniela Gressani and John Page, The World Bank.
No. 17 Towards a Virtuous Circle: A Nutrition Review of the Middle East andNorth Africa. August 1999. Regional HNP Knowledge Management, The WorldBank.
No. 18 Has Education Had a Growth Payoff in the MENA Region? December 1999.Lant Pritchett, The World Bank.
No. 19 Rationalizing Public Sector Employment in the MENA Region.December 2000. Elizabeth Ruppert Bulmer, The World Bank.
No. 20 Achieving Faster Economic Growth in Tunisia. March 2001.Auguste T Kouame. The World Bank.
No. 21 Trade Options for the Palestinian Economy: Some Orders of Magnitude. March 2001.Claus Astrup and Sebastien Dessus. The World Bank.
, opies,of,MENA,Working,Papers,may,be,obta,ned,from Ms Gena Gorosp, MNA,VP, Ph:, (202) 4732623. A
! Coiesof ENA orkng aper ma beobtanedromMs. Gena Gorospe, MNA VP, Ph: (202) 473-2623.i_ _ ,^,^,0^,w,_~~~~~~~~~~~~~~~~~~~~~~~~~~