world bank - investment funds in mena - dec 2010 - menaflagshipmutualfund2_28_11.pdf
DESCRIPTION
World Bank - Investment Funds in MENA - Dec 2010TRANSCRIPT

1
FINANCIAL FLAGSHIP
INVESTMENT FUNDS IN MENA
WILLIAM MAKO AND DIEGO SOURROUILLE*
DECEMBER 2010
* The authors are grateful to Zsofia Arvai for her suggestions and contributions to the text. The authors are also
grateful to Roberto Rocha, Yisr Barnieh, and Fadi Khalaf for useful comments and suggestions to earlier drafts.
The World Bank

2
Abstract
Privately-managed funds that invest in a wide variety of asset classes are beginning to develop in MENA
countries. In terms of assets under management/GDP, however, investment funds in MENA countries are
still small relative to those in countries with similar economic and demographic characteristics. Well-run
investment funds can offer individual investors (especially small ones) an efficient means of
diversification. They may contribute to market liquidity, price discovery, and better corporate governance.
MENA governments can do more to promote investment fund development – by raising investor
protections to IOSCO standards; allowing funds to invest in additional asset classes (e.g., real estate
securities); development local bond markets; selling down residual government shareholdings in state-
owned enterprises; further liberalizing capital flows as well as investment – both portfolio and directly in
fund management operations – by foreign fund managers; selectively encouraging development of non-
bank securities firms; and encouraging acquisition of smaller non-competitive funds and fund managers
by larger peers.

3
Table of Contents
1. Introduction ............................................................................................................................. 4
2. Development of Investment Funds in MENA ......................................................................... 5
3. Addressing the lack of development of investment funds in MENA .................................... 17
3.1. Investor Protection .......................................................................................................... 18
3.2. Product Development ............................................................................................................... 24
3.3.Sector Development ........................................................................................................ 26
References ..................................................................................................................................... 30
Tables
Table 1. Overview of MENA Investment Funds, 2009 .................................................................. 5
Table 2. Numbers of Funds, By Type, 2009 ................................................................................... 6
Table 3. Assets Under Management, By Type of Fund, 2009 ........................................................ 8
Table 4. National Market Share, By Fund Type, 2009 ................................................................... 9
Table 5. Sharia vs. Conventional Assets Under Management, 2009 ............................................ 10
Table 6. Average Size of Funds, 2009 .......................................................................................... 11
Table 7. Largest MENA Investment Fund Families, 2009 ........................................................... 12
Table 8. Geographic Focus of MENA Investment Funds, by Assets, 2009 ................................. 13
Table 9. IOSCO Principles for Collective Investment Schemes (CIS) ........................................ 18
Table 10. Frequency of NAV Reporting, by Number of Funds, 2009 ......................................... 21
Table 11. Frequency of NAV Reporting, by Assets, 2009 ........................................................... 21
Table 12. Qualified Investors vs. General Public: Key Differences in REIFs ............................ 25
Table 13. Permitted Mutual Fund Distribution Channels: Selected Emerging Markets .............. 26
Table 14. Ownership of Mutual Fund Asset Managers ................................................................ 27
Table 15. Options for Local Operations by Foreign Asset Managers: ......................................... 28
Figures
Figure 1. Investment Fund Assets/GDP against Per Capita Income, Selected Countries ............ 14
Figure 2. Investment Fund Assets, actual and predicted values ................................................... 15
Figure 3. Mutual Fund Assets as a Percentage of Equity Market Capitalization (2009) .............. 15
Figure 4. Ratio of Mutual Fund Assets to Market Capitalization (%) (2009) ............................. 16

4
1. Introduction
Investment funds (also sometimes called mutual funds) are a type of collective investment
vehicle. Collective investment vehicles invest the pooled resources of individuals and firms into
a wide range of equity, debt, or other promises (e.g., to pay dividends or interest). These
underlying promises are transformed into an equity promise by the vehicle so that the risk
inherent in the underlying investment vehicle is borne by each shareholder in the vehicle.1
An investor in an investment fund owns a pro rata share of the assets in the fund’s investment
portfolio. Investment funds can be either open-end or closed-end. Open-end funds issue new
shares to investors and use the proceeds to make individual investments. Open-end funds
typically stand ready to buy back their funds shares at the shares net asset value (NAV).
Therefore, asset valuation and NAV pricing are major issues for open-end funds. Closed-end
funds issue a fixed number of shares only. Shareholders in a closed-end fund access the value of
their investments by selling their shares in the market, often at a discount or premium to NAV.
Investment funds perform important functions such as divisibility, store of value, liquidity, price
discovery, and enterprise monitoring.
Well-run investment funds offer individual investors (especially small ones) an efficient means
of diversification. By adding liquidity to their holdings, through either the buy-back of open-end
fund shares or a stock market listing of closed-end shares, investment funds offer investors much
greater flexibility in managing their investments. This represents an expansion in the range of
investment opportunities that could potentially contribute to larger savings. Investment funds
and other institutional investors can also contribute to market turnover and liquidity, more
effective price discovery, and lower cost of capital, potentially improving the level and quality of
capital formation. Furthermore, institutional investors can also have a positive impact on
corporate governance, either by directly voicing shareholders’ interests to corporate management
or through direct monitoring and possible exit.2
Privately-managed funds that invest in a wide variety of asset classes are beginning to develop in
MENA countries. In terms of assets under management/GDP, however, investment funds in
MENA countries are still small relative to those in countries with similar economic and
demographic characteristics (Section II). MENA governments can do more to promote
investment fund development – by raising investor protections to IOSCO standards; allowing
funds to invest in additional asset classes (e.g., real estate securities); developing local bond
markets; selling down residual government shareholdings in state-owned enterprises; further
1 J. Carmichael and M. Pomerleano (2002). 2 See, e.g., M. Aitken, N. Almeida, F.H. de Harris and T.H. McInish (2007), M. Catalan, G. Impavido and A.
Musalem (2000), M. Cornett, A.J. Marcus, A. Saunders and H. Tehranian (2007), X. Chen, J. Harford and L. Kai
(2007), Gompers and A. Metrick (2001), Aggarwal, L. Klapper and P. Wysocki (2005).

5
liberalizing capital flows as well as investment – both portfolio and directly in fund management
operations – by foreign fund managers; selectively encouraging development of non-bank
securities firms; and encouraging acquisition of sub-par funds and fund managers by larger peers
(Section III).
2. Development of Investment Funds in MENA
At end-2009, MENA countries hosted over 854 privately-managed investment funds with a
cumulative $67 billion of assets under management (AUM), including 397 funds with $33 billion
AUM domiciled in the GCC (Table 1).3 Funds domiciled in Saudi Arabia and Morocco each
account for about 32 percent of MENA investment fund AUM, with another 13 percent in Egypt
and 8 percent in Kuwait. On average, Egyptian and Saudi funds are the largest, averaging $140
– 150 million of assets under management (AUM). Kuwaiti and Moroccan funds come next in
terms of average size, at $70 – 85 million AUM. In the other MENA countries, investments
funds tend to be small – averaging less than $22 million.
Table 1. Overview of MENA Investment Funds, 2009
Average
Number Assets under management size
($ millions) % total
% of
GDP ($ millions)
Algeria 0 0 0.0 0 0
Bahrain* 134 5,580 8.3 25.5 41.6
Bahrain** 2,747 9,630
44.0 3.5
Egypt 59 8,735 13.0 4.6 148.1
Iraq 0 0 0.0 0 0
Jordan 3 17 0.0 0.1 5.7
Kuwait 65 5,514 8.2 5.7 84.8
Lebanon 13 352 0.5 1 27.1
Libya 0 0 0.0 0 0
Morocco 294 21,552 32.1 23.4 73.3
Oman 9 191 0.3 0.4 21.2
Qatar 9 122 0.2 0.1 12.3
Saudi
Arabia 153 21,464 31.9 5.7 140.3
Syria 0 0 0.0 0 0
Tunisia 88 2,889 4.3 7.2 32.8
UAE 27 785 1.2 0.3 29.1
3 The tables and analysis of the number, assets under management and composition of investment funds are based on
data available from Zawya’s database and do not cover the entire universe of investment funds in MENA.
Nevertheless, even if incomplete, the data give good indication of the major characteristics and trends of the
investment fund industry in the region. Morocco data is from the Bank Al-Maghrib and Tunisia from the Tunis
Stock Exchange.
6
WBG 0 0 0.0 0 0
Yemen 0 0 0.0 0 0
Total 854 67,201 100.0 4.4 78.7
* Local funds only. Figures are for 9/2010. Source: Central Bank of
Bahrain.
** Authorized funds. Figures are for 9/2010. Source: Central Bank of
Bahrain.
Source: Zawya, Local stocks exchanges and regulators
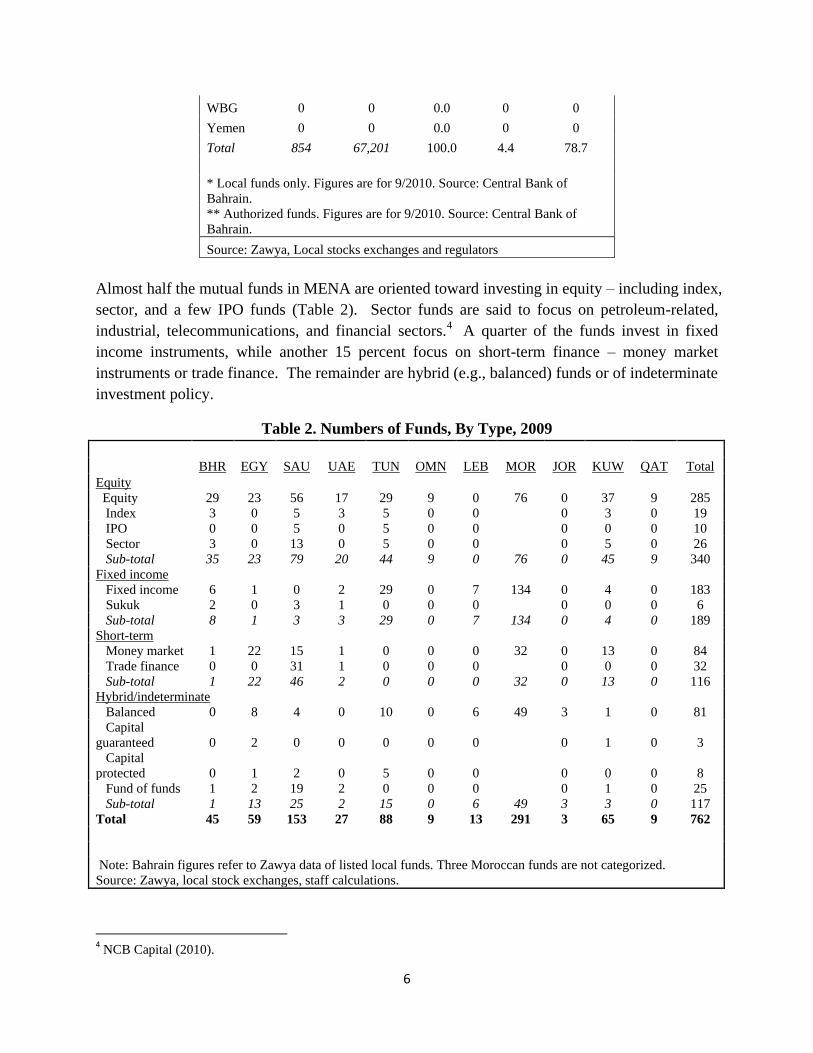
Almost half the mutual funds in MENA are oriented toward investing in equity – including index,
sector, and a few IPO funds (Table 2). Sector funds are said to focus on petroleum-related,
industrial, telecommunications, and financial sectors.4 A quarter of the funds invest in fixed
income instruments, while another 15 percent focus on short-term finance – money market
instruments or trade finance. The remainder are hybrid (e.g., balanced) funds or of indeterminate
investment policy.
Table 2. Numbers of Funds, By Type, 2009
BHR EGY SAU UAE TUN OMN LEB MOR JOR KUW QAT Total
Equity
Equity 29 23 56 17 29 9 0 76 0 37 9 285
Index 3 0 5 3 5 0 0
0 3 0 19
IPO 0 0 5 0 5 0 0
0 0 0 10
Sector 3 0 13 0 5 0 0
0 5 0 26
Sub-total 35 23 79 20 44 9 0 76 0 45 9 340
Fixed income
Fixed income 6 1 0 2 29 0 7 134 0 4 0 183
Sukuk 2 0 3 1 0 0 0
0 0 0 6
Sub-total 8 1 3 3 29 0 7 134 0 4 0 189
Short-term
Money market 1 22 15 1 0 0 0 32 0 13 0 84
Trade finance 0 0 31 1 0 0 0
0 0 0 32
Sub-total 1 22 46 2 0 0 0 32 0 13 0 116
Hybrid/indeterminate
Balanced 0 8 4 0 10 0 6 49 3 1 0 81
Capital
guaranteed 0 2 0 0 0 0 0
0 1 0 3
Capital
protected 0 1 2 0 5 0 0
0 0 0 8
Fund of funds 1 2 19 2 0 0 0
0 1 0 25
Sub-total 1 13 25 2 15 0 6 49 3 3 0 117
Total 45 59 153 27 88 9 13 291 3 65 9 762
Note: Bahrain figures refer to Zawya data of listed local funds. Three Moroccan funds are not categorized.
Source: Zawya, local stock exchanges, staff calculations.
4 NCB Capital (2010).

7
From available cross-country information, it is impossible to tell whether (or the extent to which)
any of these 762 funds invest in real estate. At present, GCC investors are able to access real
estate investments only with difficulty and considerable risk.5 The authorities in some countries,
such as Egypt, are attempting to develop an appropriate regulatory framework for real estate
investment funds (REIFs).6
A large portion of assets under management (about 50 percent) are with funds that invest in
short-term instruments – e.g., money-markets or trade finance (Table 3). Much of this is
concentrated in Saudi Arabia, Egypt and Morocco. In Saudi Arabia, trade finance funds account
for 64 percent of Saudi mutual fund assets; this likely reflects local preferences for Sharia-
compliant instruments. Trade finance funds resemble money market funds and invest mostly in
murabaha, used for short-term trade financing. ―Money market funds received a particular boost
in the arm as many investors exited from equity funds during the market downturn. In spite of
continued inflationary pressures in Saudi Arabia, short-term funds remain a popular investment
vehicle but their popularity also highlights the pressing needs for greater product diversity at a
time of heightened risk aversion.‖7 In Egypt, money market funds account for 90 percent of
mutual fund assets. In Morocco, some short-term investment funds were created to provide an
investment vehicle for the other institutional investors (pension funds, insurance companies),
while avoiding taxation on investment income. Only one third of mutual funds are open in the
usual sense. A large share of these open funds are money market funds used by corporates to do
their short-term liquidity management. The share of individuals investing directly in mutual
funds is small (about 10% of AUM).
5 Ibid. 6 An appropriate regulatory framework for REIFs should distinguish between REIFs appropriate only for
sophisticated investors versus REIFs suitable for the general public. Rules on appropriate investments,
diversification, and distribution should be stricter for the latter. 7 NCB Capital (2010).

8
Table 3. Assets Under Management, By Type of Fund, 2009
(USD millions)
BHR EGY SAU UAE TUN OMN LEB MOR JOR KUW QAT Total
Equity
Equity 810 492 4,955 670 231 191 - 2,267 - 3,525 122 13,262
Index 4 - 40 59 1 - - - - 315 - 419
IPO - - 50 - 1 - - - - - - 52
Sector 70 - 234 - 1 - - - - 303 - 609
Sub-
total 885 492 5,278 729 235 191 0 2,267 0 4,143 122 14,342
Fixed income
Fixed
income 312 31 - 19 2,555 - 240 11,705 - 512 - 15,373
Sukuk 5 - 47 23 - - - - - - - 75
Sub-
total 318 31 47 42 2,555 0 240 11,705 0 512 0 15,448
Short-term
Money
market 0 7,869 1,989 7 - - - 6,685 - 824 - 17,373
Trade
finance - - 13,732 2 - - - - - - - 13,735
Sub-
total 0 7,869 15,721 9 0 0 0 6,685 0 824 0 31,108
Hybrid
Balanced - 227 54 - 34 - 112 842 17 11 - 1,297
Capital
guaranteed - 65 - - - - - - - 14 - 79
Capital
protected - 26 - - 65 - - - - - - 91
Fund of
funds 5 26 364 5 - - - - - 10 - 410
Sub-
total 5 343 418 5 99 0 112 842 17 35 0 1,876
Total 1,208 8,735 21,464 785 2,889 191 352 21,500 17 5,514 122 62,775
Source: Zawya, local stock exchanges, staff calculations. See Table 2 note.
Equity funds account for 23 percent of MENA wide mutual fund assets. Notably, MENA has
developed some sector, index, and IPO funds – but these remain small. Comparing the total of
$14 billion of MENA mutual fund equity assets with end-2009 market capitalization of about
$800 billion, it appears that only a trivial portion (perhaps 2 percent) of the equity in listed firms
is held by privately-managed mutual funds. By contrast, investment funds hold over 30 percent
of market capitalization in the US,France and Australia,; 10 – 15 percent in Japan, UK, Canada,
Italy and Germany; and about 5 percent in Brazil, South Africa, and China.8 In MENA, the
remaining 98 percent is held by state shareholders, family offices, and small retail investors
8 A GCC-only analysis finds that GCC-domiciled investment funds that invest in the GCC account for just 1.7
percent of GCC total stock market capitalization (NBC Capital (2009)).

9
whose trading activity may be sporadic or spontaneous and based on little or no research. This
suggests that MENA authorities could improve market price discovery and corporate governance
by promoting more participation in mutual funds.
Table 4. National Market Share, By Fund Type, 2009
BHR EGY SAU UAE TUN OMN LEB MOR JOR KUW QAT Total
Equity 73.2 5.6 24.6 92.9 8.1 100.0 0.0 10.5 0.0 75.1 100.0 22.8
Fixed-
income 26.3 0.4 0.2 5.3 88.4 0.0 68.1 54.4 0.0 9.3 0.0 24.6
Short-term 0.0 90.1 73.2 1.2 0.0 0.0 0.0 31.1 0.0 14.9 0.0 49.6
Hybrid 0.4 3.9 1.9 0.6 3.4 0.0 31.9 3.9 100.0 0.6 0.0 3.0
Total 100 100 100 100 100 100 100 100 100 100 100 100
Source: Zawya, local stock exchanges; staff calculations. See Table 2 note.
Holdings of fixed-income instruments – about $15 billion – account for 25 percent of MENA
investment fund AUM. But the fixed-income holdings of investment funds in Morocco, which
has a well-developed insurance sector, account for 76 percent of MENA fixed-income AUM;
investment fund fixed-income holdings elsewhere in MENA are trivial. This reflects to a large
extent the under-development of debt instruments and debt markets in MENA. Given worldwide
issuances of around $100 billion in sukuk, it is clear that many of these instruments are held by
banks, family offices and institutions other than investment funds.
Holdings of Shariah-compliant assets – which can include shares and trade finance instruments
as well as sukuk – are unevenly distributed throughout MENA. Among mutual funds in GCC
countries, Shariah-compliant instruments account for about 64 percent of AUM (Table 5). There
is also wide variance within the GCC. Shariah-compliant investments account for 80 percent of
the Saudi mutual fund AUM, but only 15 – 25 percent in the other GCC countries.9 The share on
non GCC countries is even smaller. While Shariah-compliance broadens the appeal of collective
investment schemes, it also creates challenges where the availability of underlying Shariah-
compliant assets is limited.
9 100 percent of Oman mutual funds’ holdings are in equities. As equities are risk-sharing instruments, a high
proportion of these could perhaps be categorized as Shariah-compliant.

10
Table 5. Sharia vs. Conventional Assets Under Management, 2009
(amounts in USD millions)
Total Shariah-compliant Conventional
Bahrain 1,208 193 16.0% 1,015 84.0%
Kuwait 5,514 1,250 22.7% 4,264 77.3%
Oman 191 0 0.0% 191 100.0%
Qatar 122 18 14.6% 104 85.2%
Saudi Arabia 21,464 17,210 80.2% 4,254 19.8%
UAE 785 170 21.6% 616 78.5%
GCC subtotal 29,283 18,841 64.3% 10,443 35.7%
Egypt 8,735 209 2.4% 8,526 97.6%
Jordan 17 0 0.0% 17 100.0%
Lebanon 352 0 0.0% 352 100.0%
Morocco 21,552 0 0.0% 21,552 100.0%
Tunisia 2,889 0 0.0% 2,889 100.0%
Non-GCC subtotal 33,544 209 0.6% 33,335 99.4%
Total 62,827 19,050 30.3% 43,778 69.7%
Note: Bahrain figures refer to Zawya data of listed local funds.
Source: Zawya, local Stock Exchanges; staff calculations.
As a result of small holdings (relative to GDP) and a comparatively large number of mutual
funds across MENA, average fund sizes are small. Equity funds average about $90 – 100
million in Saudi Arabia and Kuwait, but elsewhere typically range in size from $5 million to $40
million (Table 6). Especially at the lower end of this scale, management fees would be
insufficient to support serious efforts at fundamental equity research and corporate governance
oversight. With a few exceptions – fixed income funds in Kuwait and Morocco, trade finance
funds in Saudi Arabia, and money market funds in Egypt, Morocco, and Saudi Arabia – fixed
income (especially sukuk) and hybrid funds tend to be even smaller.

11
Table 6. Average Size of Funds, 2009
(USD Millions)
BHR EGY SAU UAE TUN OMN LEB MOR JOR KUW QAT
Equity
Equity 28 21 88 39 8 21 - 30 - 95 14
Index 1 - 8 20 0 - - - - 105 -
IPO - - 10 - 0 - - - - - -
Sector 23 - 18 - 0 - - - - 61 -
Fixed income
Fixed income 52 31 - 10 88 - 34 87 - 128 -
Sukuk 3 - 16 23 - - - - - - -
Short-term
Money market 0 358 133 7 - - - 209 - 63 -
Trade finance - - 443 2 - - - - - - -
Hybrid
Balanced
28 13 - 3 - 19 17 6 11 -
Capital guaranteed 33 - - - - - - - 14 -
Capital protected 26 - - 13 - - - - - -
Fund of funds 5 13 19 2 - - - - - 10 -
Source: Zawya, local stock exchanges, staff calculations. See Table 2 note.
Of course, a single fund manager may manage multiple funds, and the picture improves
somewhat looking at fund managers. In MENA10
, 10 firms have more than $1 billion of AUM.
These firms manage 105 funds with cumulative assets of $27 billion (Table 7). Thus, less than
30 percent of the funds account for 70 percent of AUM. For these funds, AUMs average $256
million for each individual fund and $2.7 billion per fund management firm. These include some
big-bank affiliates. In other cases, securities firms not affiliated with banks may run bank-
sponsored funds. In such situations, the fund management firm may be reluctant to sacrifice
management of bank-sponsored funds (e.g., money market) to focus whole-heartedly on
development of equity and fixed-income funds.
Another 91 firms manage 278 mutual funds with cumulative assets of $11.6 billion. These 73
percent of MENA mutual funds account for just 30 percent of AUM. For these small, AUM
average about $42 million for each individual fund and about $125 million per fund management
firm. Fund managers at the smaller end of this spectrum may find that competitive management
fees on small AUMs are insufficient to support much (or any) diligence in active management
and corporate oversight. Note, however, that some of these funds may be private equity type
funds tailored to the preferences of a small group of investors.
10 This analisys is based on Zawya data thus excluding Morocco and Tunisia

12
Table 7. Largest MENA Investment Fund Families, 2009
NCB Capital 13 9,557
EFG Hermes 20 2,527
Riyadh Capital 13 2,474
Beltone Asset Management 9 2,474
HSBC Saudi Arabia Limited 16 2,378
Al-Rajhi Capital 12 1,938
El-Ahly Fund Management 5 1,569
CI Asset Management 4 1,382
Samba Capital 5 1,281
Caam Saudi Fransi 8 1,257
Subtotal 105 26,835
27% 70%
Others 278 11,551
73% 30%
Total 383 38,387
Source: Zawya; staff calculations. Figures do not include Morocco and Tunisia.
MENA investment funds invest almost exclusively in the country in which each fund is
domiciled. Of $63 billion in AUM, $59 billion (94 percent) is with funds oriented toward home-
country investments (Table 8). GCC-focused and MENA-wide funds account for, respectively,
another 4 percent and 1 percent of AUM. Other country funds, which account for 0.4 percent of
AUM, are a rarity.
Bahrain has emerged as a modest center for regional investment funds. Funds focused on
external investment account for 98 percent of total AUM for Bahrain-domiciled investment
funds. Externally-focused funds account for $1.7 billion (but only 8 percent of AUM) for Saudi
funds, $285 million (5 percent of AUM) for Kuwaiti funds, $174 million (22 percent) for UAE
funds, and $89 million (47 percent) for Omani funds.
The most attractive destinations for outbound mutual fund investments are other GCC countries;
assets under management for GCC-oriented mutual funds total $2.764 billion. While another
$488 million are with MENA-wide mutual funds, it is reasonable to assume that these also are
mainly focused on GCC. Funds that externally target a single country account for $249 million.
Of this amount, the Maghreb/Mashreq accounts for just $191 million. Allowing for investments
in Lebanon debt instruments, just about $65 million is dedicated to equity investments in specific

13
Maghreb/Mashreq countries. Clearly there is more scope to encourage and grow cross-border
portfolio investment (especially in equities) by mutual funds.
Table 8. Geographic Focus of MENA Investment Funds, by Assets, 2009
(USD millions)
Fund Geographic focus Total
domicile Home Other GCC MENA
country MENA
country
Bahrain 21 205 706 276 1,208
Egypt 8,735 - - - 8,735
Saudi Arabia 19,733 13 1,647 71 21,464
UAE 611 - 82 92 785
Tunisia 2,889 - - - 2,889
Oman 101 - 89 - 190
Lebanon 321 31 - - 352
Morocco 21,552 - - - 21,552
Jordan 12 - - 4 16
Kuwait 5,229 - 240 45 5,514
Qatar 122 - - - 122
Total 59,326 249 2,764 488 62,827
Note: Bahrain figures refer to Zawya data of listed local funds.
Source: Zawya; local stock exchanges; staff calculations.
The existence of mutual fund investments in other countries is a potential indicator of capital
account liberalization – both outbound and inbound. A recent survey of emerging markets finds
that there are some constraints on cross-border capital investments for the four MENA countries
surveyed.11
Whether or not to allow offshore investments by investment funds and other institutional
investors is indeed an issue for some countries. For governments overseeing relatively small
economies, any desire to provide a broader range of investment choice may be trumped by
macroeconomic concerns. ―Although there can be little argument with the proposition that
extending the range of investment opportunities is in the interests of the investing public, where
the exchange rate is fixed, foreign investment by contractual savings institutions can place heavy
demands on scarce foreign exchange reserves.‖ Such concerns may be mitigated by allowing
foreign capital to access the domestic capital market. ―The key judgment involved is not so
11 The survey of 30 emerging markets includes four Arab countries: Jordan, Morocco, Oman, and Tunisia. All four
allow foreign capital to invest in the domestic market, although Morocco does require application toward the foreign
exchange quota. Jordan and Oman place no curbs on outbound capital investment. Morocco requires applications
towards a FX quota. Tunisia does not allow domestic capital investment in foreign markets. IOSCO (2009).

14
much whether, but rather when and under what conditions, to open domestic markets to foreign
investment and to allow domestic funds to invest abroad.‖12
Despite all this activity, MENA’s investment funds sector remains miniscule by international
comparison. As shown in Figure 1, mutual fund assets in MENA are generally well below the
levels predicted by their levels of per capita income. Bahrain and Tunisia are slightly above the
regression line and Morocco is the only outperformer. This result does not change much
controlling for other variables such as population, population density, inflation, and
demographics. As shown in Figure 2, Morocco, Bahrain,Tunisia and Egypt exceed the predicted
values, Saudi Arabia and Kuwait are about as-expected but investment fund assets/GDP fall well
below predicted levels in the other MENA countries.13
The slow development of the industry in
MENA can also be appreciated by regressing mutual fund assets against equity market
capitalization. As shown in Figure 3, the ratio of mutual fund assets to GDP is generally well
below the levels predicted by market capitalization, with the exception of Tunisia, Morocco and
Bahrain, revealing the thin institutional investor base in the region. Figure 4 portrays a similar
picture by ranking countries by the ratio of mutual fund assets to market capitalization.
Figure 1. Investment Fund Assets/GDP against Per Capita Income, Selected Countries
12 Carmichael and Pomerleano (2002). 13 It has to be noted, however, that in the case of Morocco mutual fund assets reflect largely investments by other
institutional investors such as pension funds and insurance companies, not individual holdings. Also, the relatively
low investment funds assets in the GCC could be partly explained by the fact that national savings are partly held in
large sovereign funds in the GCC,
Algeria
Bahrain
EgyptJordan
KuwaitLebanonLibya
Morocco
Oman QatarSaudi Arabia
Syria
Tunisia
UAEYemen0
20
40
60
80
0 10,000 20,000 30,000 40,000 50,000 60,000
Mu
tual
Fu
nd
s as
% o
f G
DP
GDP per CapitaAlgeria
Egypt
JordanLebanon
LibyaSyria
Tunisia
Yemen0
5
10
0 5,000 10,000

15
Figure 2. Investment Fund Assets, actual and predicted values14
(predicted values from panel regression model)
Figure 3. Mutual Fund Assets as a Percentage of Equity Market Capitalization (2009)
14 The dependent variable is the logarithm of investment funds assets as a percentage of GDP. The independent
variables the logarithms of GDP per capita, total population, population density, age dependency ratio,inflation and
a dummy variable for Oil exporting countries. The sample consists of annual data for the period 2000-09 from the
NBFI database and the World Development Indicators.
Bahrain
EgyptJordan
KuwaitLebanon
Morocco
OmanQatar
Saudi Arabia
UAE
Tunisia
0
10
20
30
40
50
60
70
80
90
0 50 100 150 200 250
Mu
tual
Fu
nd
s as
% o
f G
DP
Market Capitalization as % of GDP

16
Figure 4. Ratio of Mutual Fund Assets to Market Capitalization (%) (2009)
Investment funds in the GCC
Growing prosperity and large savings have not yet translated into a large and diversified
institutional investment sector in the GCC, and the profile of institutional investors remain
different from the rest of the world.15
The GCC investor base is dominated by sovereign wealth
funds, public pension funds and family offices, while collective investment schemes account for
a minority of assets under management. Nevertheless, mutual funds are the leading (private)
institutional investors in the region with equity funds being the most dominant type of funds.
Short-term money market and trade finance funds are relatively large in Saudi Arabia, while
fixed income funds are small everywhere in the GCC reflecting the nascent nature of
conventional bond and sukuk markets.
Despite the current underdevelopment of collective investment schemes, the GCC states offer the
greatest potential for growth in investment fund assets. Indeed, the GCC mutual funds industry
has been growing rapidly in recent years. Bahrain has developed into a center of the investment
funds industry since the 1990s. Primarily as a result of streamlined registration, the number of
registered investment funds exceeded 2,700 in mid-2010, out of which 137 are Bahrain-
domiciled funds and 53 are Islamic funds. Most of the registered funds are small though, and are
closer to private equity funds than to mutual funds.
Assets under management in GCC-domiciled funds are the largest in Saudi Arabia, Bahrain and
Kuwait. The mutual fund industry in Saudi Arabia experienced robust growth in this decade
despite the equity market correction in 2005. The number of funds almost doubled between 2000
15 See NCB Capital (2010), for an excellent discussion on institutional investors in the GCC.
0102030405060708090
100A
ust
ria
Ge
rman
yFr
ance
Slo
vaki
aC
ost
a R
ica
De
nm
ark
Ital
yEs
ton
iaU
nit
ed
Sta
tes
Fin
lan
dB
razi
lH
un
gary
Be
lgiu
mTh
aila
nd
Swe
de
nM
OR
OC
CO
Can
ada
Un
ite
d K
ingd
om
TUN
ISIA
Ko
rea,
Re
p.
No
rway
BA
HR
AIN
Po
lan
dP
ort
uga
lSl
ove
nia
Ne
w Z
eal
and
Gre
ece
Mal
aysi
aM
exi
coA
ust
ralia
Spai
nJa
pan
Ne
the
rlan
ds
Latv
iaSo
uth
Afr
ica
Cze
ch R
ep
ub
licEc
uad
or
Ind
iaC
roat
iaEG
YPT
Ch
ileA
rge
nti
na
Turk
ey
Ch
ina
SAU
DI A
RA
BIA
KU
WA
ITR
om
ania
Bu
lgar
iaLE
BA
NO
NP
hili
pp
ine
sO
MA
NU
AE
Ru
ssia
QA
TAR
JOR
DA
N
289
17
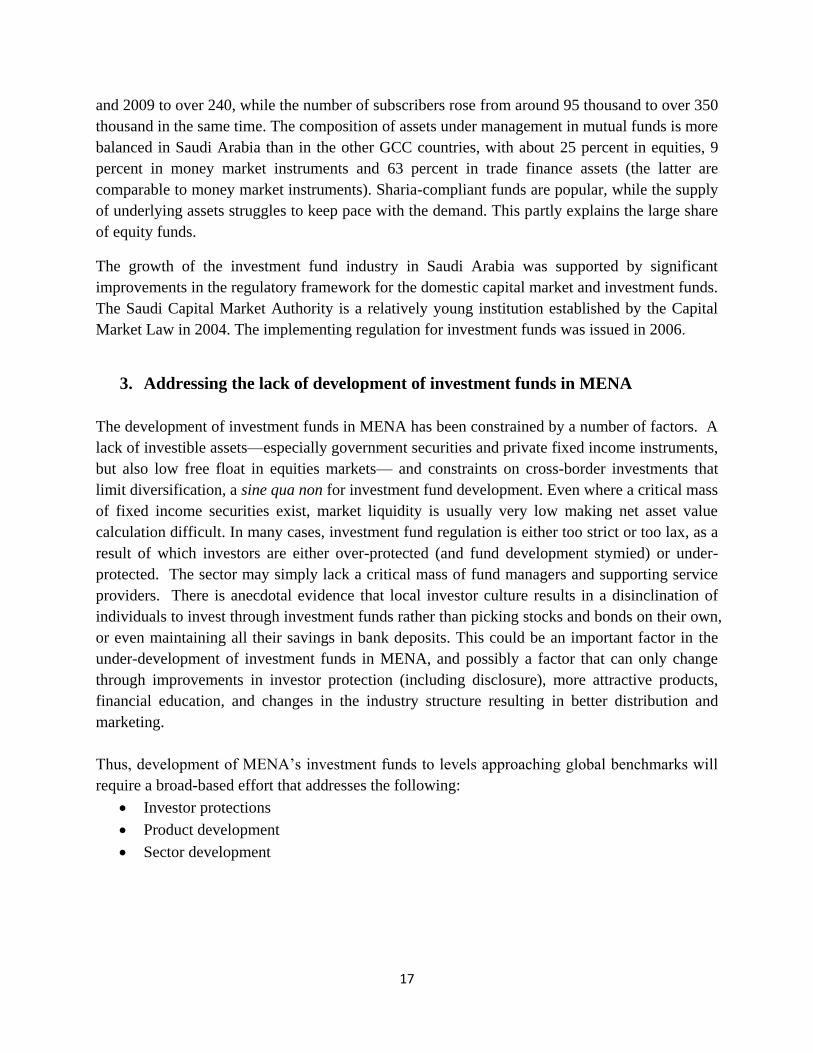
and 2009 to over 240, while the number of subscribers rose from around 95 thousand to over 350
thousand in the same time. The composition of assets under management in mutual funds is more
balanced in Saudi Arabia than in the other GCC countries, with about 25 percent in equities, 9
percent in money market instruments and 63 percent in trade finance assets (the latter are
comparable to money market instruments). Sharia-compliant funds are popular, while the supply
of underlying assets struggles to keep pace with the demand. This partly explains the large share
of equity funds.
The growth of the investment fund industry in Saudi Arabia was supported by significant
improvements in the regulatory framework for the domestic capital market and investment funds.
The Saudi Capital Market Authority is a relatively young institution established by the Capital
Market Law in 2004. The implementing regulation for investment funds was issued in 2006.
3. Addressing the lack of development of investment funds in MENA
The development of investment funds in MENA has been constrained by a number of factors. A
lack of investible assets—especially government securities and private fixed income instruments,
but also low free float in equities markets— and constraints on cross-border investments that
limit diversification, a sine qua non for investment fund development. Even where a critical mass
of fixed income securities exist, market liquidity is usually very low making net asset value
calculation difficult. In many cases, investment fund regulation is either too strict or too lax, as a
result of which investors are either over-protected (and fund development stymied) or under-
protected. The sector may simply lack a critical mass of fund managers and supporting service
providers. There is anecdotal evidence that local investor culture results in a disinclination of
individuals to invest through investment funds rather than picking stocks and bonds on their own,
or even maintaining all their savings in bank deposits. This could be an important factor in the
under-development of investment funds in MENA, and possibly a factor that can only change
through improvements in investor protection (including disclosure), more attractive products,
financial education, and changes in the industry structure resulting in better distribution and
marketing.
Thus, development of MENA’s investment funds to levels approaching global benchmarks will
require a broad-based effort that addresses the following:
Investor protections
Product development
Sector development

18
3.1. Investor Protection
The marketing, operation, regulation, and supervision of investment funds should reflect international
best practices in such areas as eligibility, avoidance of conflicts of interest, supervision, pricing, investor
rights, disclosure and marketing, as codified by IOSCO (Table 9)16
.
Table 9. IOSCO Principles for Collective Investment Schemes (CIS)
Principle Highlights
Legal form and structure CIS legal form and structure should provide certainty to investors in
assessing their interest in a CIS and enable the pool of investors’ funds to
be distinguished from the assets of other entities. This may be achieved
through, for example, use of a corporate form or trust arrangement.
Custodian, depository or trustee The regulatory regime must seek to protect the physical and legal
integrity of CIS assets by separation of CIS assets from the assets of
management, its related entities, and other schemes as well as from the
assets of the custodian itself.
Eligibility to act as an operator A CIS operator should observe high standards of integrity and fair
dealing while acting in the best interest of a CIS. An operator should
have sufficient human and technical resources. An operator should
maintain adequate financial resources to meet its investment business
commitments and withstand expected business risks. An operator should
act with due skill, care, and diligence. An operator should act to achieve
CIS objectives, but not exceed the CIS’s constituting documents.
Operators must meet regulatory standards, both for initial approval and
ongoing operations.
Delegation These principles apply to any 3rd party to which the CIS operator may
outsource certain functions.
Supervision A CIS must be registered with or authorized by the regulator before
marketing its units. The regulator should have the means to investigate
CIS conduct, including the power to conduct on-site inspections. The
regulator should have adequate powers to protect investors, including but
not limited to revoking an operator’s license, freezing CIS assets or the
operator’s assets, taking action to withdraw the CIS’s authorization or
stop use of a prospectus, instituting administrative or criminal
proceedings, and recommending criminal prosecution where appropriate.
Conflicts of interest The regulatory regime should ensure that fund management acts with full
regard to the best interests of public shareholders, either through a
general concept of ―fiduciary responsibility‖ or detailed regulations to
monitor potential conflicts.
Asset valuations and pricing The regulatory regime must provide a system for valuation of CIS assets,
pricing of interests, and procedures for entry to/exit from a CIS that are
16 IOSCO (1995).
19
fair to existing investors as well as to investors seeking to purchase or
redeem CIS interests (e.g., certificates). The price of interests in a CIS
must be calculated according to net asset value (NAV) of the CIS, which
must be determined on a regular and consistent basis.
Investment & borrowing limitations Investment restrictions, portfolio diversification, and borrowing
limitations should address the investment goals, risk profile and liquidity
needed for a CIS to meet redemptions in all market conditions.
Investor rights A fundamental right of a CIS investor is to withdraw funds within a
reasonable period. The regulatory regime should also enable investors to
participate in significant decisions affecting the CIS and for the regulator
or another 3rd party to act in the interests of investors.
Marketing and disclosure There must be a prospectus, which should include all material
information that investors would reasonably need and expect to make an
informed decision. Reports on CIS activities must be regularly filed with
the regulator and made freely available to investors. Advertising must
not contain false or misleading information.
Source: IOSCO
MENA jurisdictions present a mixed picture in terms of regulatory coverage, requirements for
fund managers; requirements for fund management staff; pricing and valuation; reporting,
promotion and advertising; and other investor protection.
Regulatory coverage. Enabling laws for the supervision of investment funds typically covers
key topics: qualified investments, distribution channels, custody arrangements, pricing and
valuation, and disclosure. A recent survey of 30 emerging markets includes 4 MENA countries
(Jordan, Morocco, Oman, and Tunisia). The enabling laws in Oman and Tunisia authorize the
capital markets supervisor to supervise all of the above-mentioned topics. Morocco’s law is
silent on distribution channels. More importantly, Jordan’s law is silent on all-important rules
for custody and for NAV valuation and pricing.17
In Egypt, the capital markets authority has
wide-ranging authority to supervise investment funds. Indeed, Egypt’s capital markets authority
moved in July 2007 to bring local investment fund regulations closer to IOSCO standards, for
instance, through more stringent rules on custodian independence; operator obligations, capital
adequacy, and internal controls; conflicts of interest; independent forward-pricing of
redemptions; investment and borrowing; requirements for fund investors to approve changes in
investment policy, borrowing, and increases in fees; and disclosure and advertising.
Fund managers. In a recent survey of investment fund regulation, 14 of the 30 emerging
markets surveyed regulate the ownership of fund managers. This usually means that the
17 IOSCO( 2009).
20
regulator must carry out some check on each prospective fund manager – e.g., whether the fund
manager is a financial institution, whether fund manager shareholders and management meet ―fit
and proper‖ criteria. Such regulatory requirements exist in Jordan – but not in Morocco, Oman,
or Tunisia.18
Regulations in Egypt on investment managers have, for some time, largely or fully
met IOSCO principles relating to honesty, fairness, capability and experience, diligence,
effectiveness, and compliance.
In addition, 21 of these 30 jurisdictions require that some minimum sum (usually less than USD
1 million) be invested in the capital of the fund manager. While Jordan has no such requirement,
the survey reports minimum capital requirements for fund managers in other MENA countries as
follows: Morocco, equivalent of USD 128,000; Oman, equivalent of $5 million; Tunisia,
equivalent of USD 81,000.19
In Egypt, the minimum capital requirement for an investment
manager was raised in July 2007 from the equivalent of about USD 175,000 to about $875,000.
Such paid-in capital requirements are similar to the earnest money deposit that assures a fund’s
ability to operate, but would provide no special protection to certificate holders in a melt-down.
Only 4 of the 30 emerging market jurisdictions also require some minimum net asset ratio for the
fund manager shareholder. Jordan, Morocco, Oman, and Tunisia have no such requirement.
Egypt has had a minimum net assets requirement for fund managers. In July 2007, to make it
easier for investment funds to grow, the Egyptian authorities reduced minimum cash investment
capital of investment funds from 5 percent to 2 percent of assets. Sponsor capital signals
seriousness of purpose, but does not necessarily address capital adequacy of funds. Instead of set
rules, risk-based requirements seem preferable for meeting IOSCO’s CIS capital adequacy
principle that an operator should maintain adequate financial resources to meet its investment
business commitments and withstand the risks (including unexpected redemptions) to which its
business is subject. Lastly, it is worth noting that some emerging market jurisdictions have
mandated insurance or contributions to an investor protection fund to provide some financial
cushion to protect investors.
Fund management staff. Most of the emerging market jurisdictions in the IOSCO survey set
some minimum standards for investment management professionals, and about half mandate a
minimum number of practitioners and minimum required experience. Jordan, Oman, and
Tunisia set licensing requirements for fund manager practitioners, while Morocco does not.20
Egypt has long-standing rules on investment manager capability, diligence, and effectiveness.
Three of the MENA jurisdictions surveyed mandate minimum staffing for fund managers, as
follows: Jordan, 2 staff; Tunisia, 4 staff; and Morocco, 7 staff – including 1 general manager, 2
front officers, 1 middle office, 1 back office, 1 internal controller, and 1 administrative affairs
18 Ibid. 19 Ibid. 20 IOSCO (2009).

21
officer. Oman has no such rules. Tunisia requires 5 years of experience for senior staff at a fund
manager, while Jordan, Morocco, and Oman have no such requirement.
Some balance between ease of entry and professionalism is important. To achieve minimal
competence among fund officers and staff responsible for investment decisions, it can be useful
to require fund staff with less than five years’ experience to complete a broad-based accreditation
program. The fund manager should be accountable for such training, with oversight from the
securities regulator.
Valuation and pricing. Best practices would be for investment funds to provide daily updates
on their net asset value (NAV). Most investment funds in MENA fall short of this ideal. Less
than a third (31 percent) of MENA investment funds provide daily NAV updates (Table 10).
The good news is that these funds represent 62 percent of AUM (Table 11). This implies that the
smaller (and probably less-efficient) funds tend to provide worse service in terms of frequency of
NAV reporting. Almost one-fifth of these funds update NAV less frequently than once a week.
Table 10. Frequency of NAV Reporting, by Number of Funds, 2009
Domicile
NAV
Frequency Bahrain Egypt Jordan Kuwait Lebanon Morocco Oman Qatar
Saudi
Arabia Tunisia UAE Total
Daily 6 24 0 3 12 7 8 0 59 11 6 136
Semi-
weekly 0 0 0 0 0 0 0 0 75 0 0 75
Weekly 19 35 0 31 1 18 1 0 11 13 17 146
Bi-weekly 2 0 2 0 0 0 0 0 0 0 0 4
Monthly 18 0 1 30 0 0 0 9 6 0 3 67
Quarterly 0 0 0 1 0 0 0 0 2 0 0 3
Infrequently 0 0 0 0 0 0 0 0 0 0 1 1
Total 45 59 3 65 13 25 9 9 153 24 27 432
Note: monthly figure includes a few funds that report tri-weekly. Bahrain, Tunisia and Morocco figures refer to Zawya data of
funds
Source: Zawya; staff calculations

22
Table 11. Frequency of NAV Reporting, by Assets, 2009
(USD millions)
Domicile
NAV
Frequency Bahrain Egypt Jordan Kuwait Lebanon Morocco Oman Qatar
Saudi
Arabia Tunisia UAE Total
Daily 53 7,663 0 208 317 977 168 0 15,567 534 190 25,676
Semi-
Weekly 0 0 0 0 0 0 0 0 4,816 0 0 4,816
Weekly 672 1,072 0 2,824 35 1,229 23 0 858 69 547 7,330
Bi-weekly 14 0 15 0 0 0 0 0 0 0 0 29
Monthly 469 0 2 2,343 0 0 0 122 224 0 31 3,191
Quarterly 0 0 0 139 0 0 0 0 0 0 0 139
Infrequently 0 0 0 0 0 0 0 0 0 0 18 18
Total 1,208 8,735 17 5,514 352 2,206 191 122 21,464 603 785 41,197
Note: monthly figure includes a few funds that report tri-weekly. Bahrain, Tunisia and Morocco figures refer to Zawya data of
funds.
Source: Zawya; staff calculations.
MENA leaders in terms of daily frequency of investment fund reporting are Lebanon (for 90
percent of AUM); Egypt, Tunisia, and Oman (88 percent); and Saudi Arabia (73 percent).
Standouts in terms of infrequency of NAV reporting are Bahrain, Kuwait, and Qatar – with
investment funds representing 40 percent or more of sector-wide AUM providing only monthly
updates of AUM.21
Pricing of investment fund certificates can be an issue. In some jurisdictions, investment funds
have engaged in ―backward pricing‖ of fund certificates – i.e., where the price was determined
on the last working day of the week prior to redemption. This, however, violated the IOSCO
requirement that pricing be ―fair to existing investors as well as to investors seeking to purchase
or redeem interests.‖22
Often criticized as analogous to betting on yesterday’s race after reading
today’s paper, backward pricing is disadvantageous to existing certificate holders in a rising
market because it dilutes their holdings. In a very important reform, the Egyptian authorities
decreed in July 2007 that open-end investment funds should use forward-pricing. Under
forward-pricing, certificates are purchased or redeemed at the price in effect at the close of
business. Applications and redemptions are submitted ahead of the price-fixing, so that neither a
buyer nor a seller knows in advance what the price will be.
Disclosure. Disclosure is the basis for mutual fund regulation. Investment in mutual funds
should be by public prospectus, and requirements for disclosure of investment strategy, NAV
21 This may reflect a higher proportion of closed-end investment funds. 22 IOSCO principle 7.

23
pricing policy, qualifications, and all fees should be extremely high and enforceable by law –
with onerous penalties for misleading information. Given the cost and complexity of printing
and distributing prospectuses and the reality that more information is not always digested by
investors, regulators should consider the option to requiring a full prospectus to be available to
the regulator and to investors on request, but insisting only on the distribution of a short-form
prospectus with investment applications. The short-form prospectus should summarize all
essential features of an investment in the investment fund in a readily digestible form.23
Some periodic disclosure of investment fund financial statements is required in 90 percent of
emerging market jurisdictions in a recent survey. Six require only annual reports. The
remaining two-thirds require 2-3 financial information disclosures each year. Among the MENA
countries covered in this survey, Morocco, Oman, and Tunisia each require 2-3 filings per year.
Jordan has no requirement for investment funds to disclose financial statements.24
In Egypt, the
investment fund manager must provide the securities regulator with semi-annual reports on the
manager’s activities, financial status of the fund, and procedures to manage risk.
Promotion and advertising. Promotion of any investment fund should center on an updated
prospectus that provides potential investors with relevant information (e.g., fund investment
strategy, historical performance, risk/reward summary, fees and expenses) to aid investment
decisions. In 19 of 30 emerging market jurisdictions, the securities regulator must provide prior
approval of such promotional material. Such approvals are required in Morocco, Oman, and
Tunisia, but not in Jordan.25
In Egypt, an annually-updated prospectus must highlight risks and
receive securities regulator approval before announcement of a fund or subscription for fund
certificates.
In general, there seems ample scope in MENA to tighten up restrictions on advertising. It
appears that about half of emerging market jurisdictions prohibit investment funds from making
performance predictions. Morocco and Tunisia have such a prohibition, but Jordan and Oman do
not. Following July 2007 reforms, Egypt’s investment funds’ ads must include basic information
on the fund, while excluding performance forecasts and exaggerated/misleading data or
information. No ads are permitted before the capital market supervisor has licensed the fund and
approved its prospectus. As in many MENA countries, greater clarity on definitions (e.g., of
―advertisement‖ and ―misleading advertisement‖) and implementing rules would be useful.
Other investor protection. Conflicts of interest are an important potential threat to members of
the public who hold certificates in investment funds. Conflicts of interest may arise in many
forms. Examples may include transactions between an investment fund and its affiliates
23 Carmichael and Pomerleano (2002). 24 IOSCO (2009). 25 Ibid.
24
(including affiliates of the sponsor or custodian); transactions where an investment fund and its
affiliates jointly participate; soft commissions; lending or borrowing to/from affiliates; purchase
of an affiliate’s securities; purchase of securities underwritten by affiliates; use of affiliated
brokers; and fund manager transactions on their own account.
Different functionaries – either external or external to an investment fund – can help safeguard
investors. For instance, in a 2007 regulatory change, Egypt introduced several new players with
specific roles in investor protection: administrative service companies; certificate holders groups;
investment manager internal control officers; and fund independent directors.
Administrative service companies perform two basic functions: (i) collect, record, and
maintain information (often competitively-sensitive) about the certificate holders of
open-end funds; and (ii) calculate the net asset value (NAV) of the fund, which
determines what buying/selling investors pay/receive as well as the fund’s performance.
Modeled after independent bondholders’ groups, certificate holders’ groups should focus
on protecting the interests of certificate holders. Especially if represented by an
independent professional (e.g., accounting firm, lawyer, bank trustee) and with adequate
access to information, a certificate holders’ group can provide independent oversight of
fund operations and management.
Focusing strictly on internal control, internal control officers can play an important role
in resolving certificate holders’ complaints, observing and reporting fund compliance
with its own stated investment policies and diversification requirements, reviewing any
transactions involving related-party securities, and administering any advertising
guidelines and ethics code.
Fund independent directors have a special responsibility to protect public investors
against self-dealing by a fund manager.
In most cases, it would be useful to establish a code of ethics for investment managers. Such an
ethics code could, among other things, limit related party transactions and require maintenance
of complete, accurate, and current records of securities transactions of officers, directors, and
employees of the investment manager, its associated groups, and the members and dependents of
each of them to avoid actual or perceived conflicts of interest.
3.2. Product Development
While greater investor protections could raise confidence and public interest in investment funds,
MENA fund development also seems constrained by an insufficient quantity of tradable
securities. Areas for consideration include further development of debt instruments,
development of real estate-based securities and funds, and more share sales (or public
distributions) by state-owned shareholding and pension funds.

25
Debt instruments. A number of experts have commented on the under-development of debt
instruments, markets, and holdings throughout MENA, including the GCC.26
This under-
development likely reflects a combination of factors – including some cultural ambivalence
toward debt and debt instruments, budget surpluses among GCC governments, and incentives for
local banks to buy-and-hold government bonds at the time of issue. Further efforts to develop
infrastructure-linked and Shariah-compliant debt instruments and improve the functioning of
primary and secondary debt markets should encourage increases in the stock of debt securities
that MENA investment funds can access.
Real estate. Some efforts are underway to encourage the development of real estate investment
funds (REIFs). Egypt’s July 2007 reforms introduced closed-end REIFs. As initially conceived,
however, these are suitable only for highly-sophisticated ―qualified‖ investors. Additional
measures would be needed to establish REIFs suitable for investment by the general public
(Table 12). In some jurisdictions, it may be necessary to address tax issues (i.e., make REIFs
tax-free pass-throughs) and improve the reliability of land registry before real estate securities
and REIFs can really develop.
Table 12. Qualified Investors vs. General Public: Key Differences in REIFs
Item For qualified investors For general public
Appropriate investment – acceptance
of construction risk
May include real estate development Marketable securities only; focus on
income-producing property
Diversification requirements None necessary Limit investment(s) subject to same
investment risks, geographic
concentration, types of activities,
etc. – e.g., to 20% of NAV
Offering mechanism Private placement memorandum Public prospectus, for securities
regulator approval
Leverage May be permitted Prohibited or limited
Valuation risk Not controlled Requirements for independent
parties to provide real estate &
securities valuations; avoidance of
conflicts of interest; rotation of
appraisers
Reporting Not controlled Regular (e.g., semi-annual) financial
reports
Government shareholdings. Lastly, additional sales of shares in state-owned enterprises (SOEs)
or government-linked corporations (GLCs) by state-owned shareholding and pension funds
26 NCB Capital (2010).

26
would provide more tradable equity that MENA investment funds may be able to take under
management. As noted in the Equity Market Chapter, the main argument in favor of such share
sales (or public distributions) is not necessarily to improve the performance or corporate
governance of SOEs or GLCs. A more compelling rationale may be to increase the supply of
tradable and dividend-yielding instruments that citizens may hold, either directly or through
investment funds. Government shareholdings are substantial, in the case of at least some
countries. For instance, while AUM of investment funds in Saudi Arabia fall $50 – 60 billion
short of the benchmark for countries with comparable GDP per capita, the state shareholding and
pension funds held equities with about $90 billion of market capitalization at end-2009. In this
case, a halving of state shareholdings (through share sales or free public distributions) could
provide the tradable wherewithal for a more active and vibrant investment funds sector.
3.3. Sector Development
It appears that investment fund development in at least some MENA countries suffers from
regulatory and/or market constraints – including regulatory limits on distribution channels, banks’
dominance, limits on foreign investment (both direct and portfolio), sector fragmentation, and
lack of supporting services.
Distribution channels. In emerging markets, banks and securities firms remain the most
common channels for distributing mutual funds. In a survey of thirty emerging markets, 90
percent of the jurisdictions permit banks to distribute mutual funds (Table 13); Macedonia, South
Korea, and Vietnam do not. Opportunities for entry into fund distribution are somewhat less for
securities firms, insurance companies, direct distribution by foreign fund managers, and others.
Morocco is the most open, allowing all these distribution channels. Other MENA respondents
restrict distribution by insurance companies (Jordan, Oman), foreign fund managers (Jordan,
Tunisia), or independent financial advisors (Jordan, Oman, Tunisia).
Table 13. Permitted Mutual Fund Distribution Channels:
30 Selected Emerging Markets
Distribution channel % of countries
Banks 90
Securities firms 77
Insurance companies 43
Foreign fund managers 43
Independent financial advisors 43
Other 57
Source: IOSCO, December 2009. Note: percentage for securities firms should likely
be higher, due to some mis-categorizations as ―other.‖
Some of the MENA countries surveyed regulate mutual fund management fees (Oman and
Morocco, the latter of which caps management fees at 2 percent of NAV), while Jordan and

27
Tunisia do not. Actual management fees seem roughly comparable in these jurisdictions,
typically ranging from 0.1 percent to highs of 1.5 to 2 percent.27
In a competitive market where
there is adequate choice, it is difficult to justify restricting the level of management fees.
―Provided there is adequate disclosure of fees on a comparable basis across funds, investors
should be able to make informed choices and to take responsibility for their own investment
decisions. 28
Banks’ dominance. Banks have remained much more dominant in fund management in MENA
than in other emerging markets. In Jordan, Morocco, Oman, and Tunisia, for instance, banks
have continued to own more than 60 percent of mutual fund asset managers – versus about 33
percent bank ownership in other emerging market jurisdictions (Table 14).
Table 14. Ownership of Mutual Fund Asset Managers
(Percent)
2005 2006 2007
Banks Non-banks Banks Non-banks Banks Non-banks
MENA countries (4) 69 31 66 34 62 38
Other emerging markets (26) 37 63 33 67 33 67
Source: IOSCO, December 2009
Egypt’s investment fund industry has been built up – and remains dominated – by banks and a
handful of investment managers. Of 20 investment fund sponsors at end-2009, 17 were banks, 1
an insurance company, and 2 a joint stock company. While many bank-sponsored funds use
independent investment managers, a practice that places investment managers more at arm’s-
length than in other countries where managers organize funds, bank dominance has almost
certainly retarded development of Egypt’s investment fund industry in several ways:
Because investment funds compete with bank deposits for savings, banks have a
disincentive to support development of a vibrant investment fund industry.
Investment managers of bank-sponsored funds may be conflicted and disinclined to
undertake vigorous promotion of investment funds.
Bank dominance of the funds industry may discourage securities firms and disincline
them to invest in marketing efforts to grow non-bank funds.
Individual investment managers, attempting to maintain any perceived competitive
advantage, may be reluctant to cooperate in building a more active and cohesive
investment managers association capable of sustaining a coordinated program to
develop the funds industry.
27 Ibid. 28 Carmichael and Pomerleano (2002).

28
While it is unrealistic to expect that any MENA jurisdictions will move now to exclude banks
from sponsoring or distributing investment funds, governments could take selective measures to
promote development of non-bank fund sponsors and managers. These could include the
following:
Liberalization of entry into fund sponsorship and management – subject to appropriate
―fit and proper‖ tests; and
More conscious efforts by governments to cultivate development of leading securities
firms – e.g., through additional mandates to manage government debt or stock offerings.
Foreign management. Among the four MENA countries that participated in the recent IOSCO
emerging market survey, options for foreign asset managers to establish and invest local
operations are relatively liberal in Jordan, Morocco, and Tunisia. In Oman, it appears that
foreign asset managers are limited to investing in a joint venture subsidiary with a local partner
(Table 15).
Table 15. Options for Local Operations by Foreign Asset Managers: Selected MENA
Markets
Options for foreign asset managers to
establish:
Options for foreign asset managers to invest
capital:
Rep office Branch Subsidiary Wholly-owned Joint venture
Jordan Y Y Y Y N
Morocco Y Y Y Y N
Oman N N Y N Y
Tunisia Y Y Y Y N Source: IOSCO, December 2009.
To the extent that MENA jurisdictions retain limits on local operations/investment by foreign
asset managers and capital inflows/outflows for direct or portfolio investment, elimination of
such restrictions would tend to support rationalization and development of the region’s
investment fund industry. Liberalization of entry (and exit) is also important for consolidating
funds and fund managers that are too small to compete.
Consolidation. Investment fund management already tends to be concentrated in emerging
markets. In twenty-two emerging markets for which information are available, the top ten fund
managers typically account for 70 – 95 percent of the market. Comparable figures are 81 percent
for Tunisia and 100 percent for Morocco.29
29 IOSCO (2009).

29
That said, additional consolidation in some MENA countries seems warranted. Smaller
funds/fund managers will likely lack the critical mass to support desirable or necessary
investments in internal controls, fundamental equity research, or corporate monitoring. In
addition, smaller funds will be more likely to engage in misleading or fraudulent practices that
can harm public trust in the near-term and investment industry development in the longer-term.
Securities regulators will want to carefully monitor the risks posed by too-small funds; apply
appropriate prudential standards, including for capital adequacy; and encourage timely
acquisitions by larger investment funds. Subject to prudential norms, wide-ranging liberalization
of cross-border capital flows and direct investment in fund management (including through
M&A) is needed to support MENA-wide development of a substantially larger and more-robust
investment fund industry.
Supporting services. Regional experts note that many economies in MENA lack supporting
services (e.g., fund administrators, asset custodians) that are needed to support an investment
fund industry. This lack of service capacity is perhaps more a symptom of the overall
underdevelopment of investment funds and an associated fund management industry. In cases
where key services are lacking, it might be useful for national governments and/or international
financial institutions to provide training programs (e.g., for fund administrators ) and temporary
equity investments in joint ventures to establish key service providers (e.g., custodian service
companies, administrative service companies).

30
REFERENCES
Aggarwal R, Klapper L and Wysocki P (2005), ―Portfolio Preferences of Foreign Institutional
Investors‖, Journal of Banking and Finance, 29, pp. 2919-2946.
Aitken M, Almeida N, de Harris FH and McInish TH (2007), ―Liquidity Supply in Electronic
Markets‖, Journal of Financial Markets, 10, pp. 144-168.
Carmichael J and Pomerleano M (2002), The Development and Regulation of Non-Bank
Financial Institutions, World Bank.
Catalan M, Impavido G and Musalem A (2000), ―Contractual Savings or Stock Market
Development: Which Lead?‖, Journal of Applied Social Studies, 120:3.
Chen X, Harford J and Kai L (2007), ―Monitoring: Which Institutions Matter?‖, Journal of
Financial Economics, 86, pp. 279-305.
Cornett M, Marcus AJ, Saunders A and Tehranian H (2007), ―The Impact of Institutional
Ownership on Corporate Operating Performance‖, Journal of Banking and Finance, 31, pp.
1771-1794.
Gompers P and Metrick A (2001), ―Institutional Investors and Equity Prices‖, Quarterly Journal
of Economics, 116, pp. 229-259.
IOSCO, ―Report on Investment Management‖, July 1995.
IOSCO, ―The Development of the Collective Investment Schemes Industry in Emerging Markets,
2005 to 2007‖, December 2009.
NCB Capital, ―The Rise of Institutional Investors‖, (2010) Saudi Arabia