world bank documentdocuments.worldbank.org/curated/en/589591468760240369/pdf/multi…fourth power...
TRANSCRIPT

Document of
The World Bank
Report No: 22318-UG
PROJECT APPRAISAL DOCUMENT
ONA
PROPOSED INTERNATIONAL DEVELOPMENT ASSOCIATION CREDIT
IN THE AMOUNT OF SDR 48MILLION (US$62MILLION EQUIVALENT)
TO THE REPUBLIC OF UGANDA
FOR THE UGANDA
FOURTH POWER PROJECT
June 8, 2001
Africa Energy TeamAfrica Regional Office
Pub
lic D
iscl
osur
e A
utho
rized
Pub
lic D
iscl
osur
e A
utho
rized
Pub
lic D
iscl
osur
e A
utho
rized
Pub
lic D
iscl
osur
e A
utho
rized
Pub
lic D
iscl
osur
e A
utho
rized
Pub
lic D
iscl
osur
e A
utho
rized
Pub
lic D
iscl
osur
e A
utho
rized
Pub
lic D
iscl
osur
e A
utho
rized

CURRENCY EQUVALENTS
(Exchange Rate Effective Aue B 2001)
Currency Unit - Ugah Shalinp (Usth)Ush 1750 - US$S
USSI - I7S0 Ush
FISCAL YEARJuly I - to mne 30
ABBREVIATIONS AND ACRONYMS
AfDB African Development BankBOOT Build4)wn-Opsrate-TransferCAS Country Assistance StrategyDFID Department for Intematonal Develphmt (UK)DPP Derailed Procuremnee PlanDRIC Divestiture and RefoTrm Irmplementation CommittieEA Environmentat AnalysisEdF Electricite de FranceEIRR Economic Internal Rate of ReturuEMP Environtnental Management PlanERA Electricity Regulatory AuthorityFIRRI Fisheries Resource Reearclh InstituteFM¢I Financial Manalgement InitiativeGDP Gross Domestic ProductGENCO Uganda Generation Company Lrd.GOU Gosrernmcnt of UgandaGPN General Procurement NoticeHIPC Heavily Indebted Poor CountryIDA International Development AssociationIFC International Finance CorporationIPP independent Power ProducersMEMOD Mlinistry of Energy and Minerat DevelopmentIFPED Mlinistry of Finartca and Econonic Planning
NDF Nordic Developmnent FundNEMIA National Environment Management AgencyNORAD Norwegian Agency for Development CorporationOECF Overseas Economic Corporation fundOPP Overall Procurement PlanPAD Project Appraisal DocumentPEAP Poverty Eradication Action PlanPERD Public Enterprise Reform and DivestiturePIP Procurement Implkmcntation PlanPIU Project Implementation UnitPNR Project 'Management Reports
PPF Project Preparation facilityRCC Roller Compacted ConcreteSCADA Suppavisory Control and Data AcquisitionSDR Special Drawing RightsSIDA Swedish International Developmett AgencySIL Specific Investnent LoanSOE Statement of ExpenditureTRANSCO Uganda Electricity Transn-ission Company Lid.UEB Uanda Elecricity BoardUNDB United Nations Devloptnent BausinesUNDP Untited Nations Developmtent ProgramUTL Uganda Telecomtnticationa Ltd.WRD Water Resources Depaament
WEIGHTS AND MEASURES
I kilometer 0.621 milesI square kilometer (krnt2 ? 0.386 square milesI kilovolt (kV) = 1,000 voltsI mepawatt (MW) - 1,000 kilowattsI megavolt ampere (MVA) = 1,000 kilovolt amperesI gigawatt hour (GOh) = I million kilowatt hoursI ton of oil equivalent (to,) 1 t0500000 kilcatories
Vice Prmident: Callisto E. ,adahvoCountry tatager/Director: Iamte W. Adams
Sector MaragerDirector: M. AnrandaCovintdassantv__Task Team LeaderTaskr staner: Paisi Kotioren

UGANDAFOURTH POWER PROJECT
CONTENTS
A. Project Development Objective Page
1. Project development objective 22. Key performance indicators 2
B. Strategic Context
1. Sector-related Country Assistance Strategy (CAS) goal supported by the project 22. Main sector issues and Governnent strategy 43. Sector issues to be addressed by the project and strategic choices 11
C. Project Description Summary
1. Project components 142. Key policy and institutional reforms supported by the project 153. Benefits and target population 164. Institutional and implementation arrangements 16
D. Project Rationale
i. Project alternatives considered and reasons for rejection 182. Major related projects financed by the Bank and other development agencies 223. Lessons learned and reflected in the project design 234. Indications of borrower commitment and ownership 245. Value added of Bank support in this project 25
E. Summary Project Analysis
1. Economic 252. Financial 293. Technical 334. Institutional 335. Environmental 376. Social 397. Safeguard Policies 40
F. Sustainability and Risks
1. Sustainability 412. Critical risks 413. Possible controversial aspects 43

G. Main Conditions
1. Effectiveness Condition 432. Other 44
H. Readiness for Implementation 46
I. Compliance with Bank Policies 46
Annexes
Annex 1: Project Design Summary 47Annex 2: Detailed Project Description 5 1Annex 3: Estimated Project Costs 55Annex 4: Cost Benefit Analysis Summary, or Cost-Effectiveness Analysis Summary 56Annex 5: Financial Summary for Revenue-Earning Project Entities, or Financial Summary 66Annex 6: Procurement and Disbursement Arrangements 84Annex 7: Project Processing Schedule 93Annex 8: Documents in the Project File 94Annex 9: Statement of Loans and Credits 96Annex 10: Country at a Glance 98Annex 1 1: Letter of Power Sector Policy 100
MAP(S)Uganda Fourth Power Project - IBRD 31399

UGANDA
FOURTH POWER PROJECT
Project Appraisal Document
Africa Regional OfficeAFTEG
Date: June 8, 2001 Team Leader: Paivi KoljonenCountry Manager/Director: James W. Adams Sector Manager/Director: M. Ananda CovindassamyProject ID: P002984 Sector(s): GG - Oil & Gas Adjustment, PP - Electric
Power & Other Energy Adjustment, VY - OtherEnvironment
Lending Instrument: Specific Investment Loan (SIL) Theme(s): EnergyPoverty Targeted Intervention: N
Program Financing Data[ ] Loan [X] Credit [ ] Grant [ ] Guarantee [ ] Other:
For LoanslCredits/Others:Amount (US$m): 62.00
Proposed Terms (IDA): Standard CreditGrace period (years): 10Financing Plan (US$m): Source Local Foreign TotalBORROWER 3.34 0.00 3.34IDA 2.86 59.14 62.00BORROWING AGENCY 1.14 4.86 6.00NORDIC DEVELOPMENT FUND 0.70 10.60 11.30NORWEGIAN AGENCY FOR DEV. COOP. (NORAD) 1.30 5.40 6.70
Total: 9.34 80.00 89.34
Borrower: THE REPUBLIC OF UGANDAResponsible agency: GENCO AND THE MINISTRY OF ENERGY AND MINERAL DEVELOPMENTThe Uganda Electricity Generation Company Ltd. (GENCO)Address: P.O. Box 1101 Jinja, Kampala, UgandaContact Person: Mr. John Mugyenzi, Acting Managing DirectorTel: 256 43 121416 Fax: 256 43 130154 Email: [email protected]
Other Agency(ies):Ministry of Energy and Mineral Development (MEMD)Address: Amber House, Kampala Road, P.O. Box 7270, Kampala, UgandaContact Person: Mr. Fred Kabagambe-Kaliisa, Permanent SecretaryTel: 256 41 234733 Fax: 25641 234732 Email: psmemd@[email protected] disbursements (Bank FY/US$m):
FY 2001 2002 2003 2004 2005 2006Annual 0.00 14.84 20.28 22.76 4.12
Cumulative 0.00 14.84 35.12 57.88 62.00
Project implementation period: 10/31/2001-06/30/2004Expected effectiveness date: 10/31/2001 Expected closing date: 12/31/2004
-OPD Re- Ma,d~ .

A. Project Development Objective
1. Project development objective: (see Annex l)
The objectives of the project are to: (a) improve power supply to meet demand by supporting criticallyneeded investments in the sub-sector; and (b) strengthen Borrower capacity to manage reform,privatization, and development in the power and the petroleum sub-sectors. The project would bridge theelectricity supply deficit during the period 2003-2005. After that time, the Government plans for theprivate sector to take over financing of system expansion. The project complements three other Bankoperations now in progress. These operations are all supporting the Government's reform and privatizationprogram for the power sub-sector.
2. Key performance indicators: (see Annex 1)
Output Indicators
* An increase of between 80 and 120 MW in the capacity of the Kiira hydro power plant by early2004;
* Rehabilitation of critical aspects of power system transmission and generation by early 2004;T raining of a rninimum of 15 staff at MEMD and that of the recently established power sectorregulator, Electricity Regulatory Authority (ERA) by end-2003;
* Establishment of petroleum sector monitoring guidelines by mid-2003;* Procurement of equipment to test the quality of petroleum supply, by end-2002; ando Establishment of the operating regime for Lake Victoria by end 2003.
Outcome Indicators
R Reduction of load shedding by early 2004;I Increase in the number of new residential connections to 15,000 annually by end-2004;R Reduction of system losses from 30 percent in 2000 to 24 percent by end-2004;
* Reduction in undelivered energy due to outages in the transmission system by 30 percent at theend-2003;
* Implementation of transparent legal, regulatory, and monitoring arrangements for the power andpetroleum sub-sectors by end-2002; and
* Improvement in the Government's fiscal sustainability.
B. Strategic Context1. Sector-related Country Assistance Strategy (CAS) goal supported by the project: (see Annex I)Document number: IDAIR2000-187 [IFC/R2000-202] Date of latest CAS discussion: 11/30/00
Economic and Sector Background
Uganda's economic performance during the past decade has been impressive. The average real rate of GDPgrowth has been about 6.7 percent per annum since 1990/91. During the period 1992-2000, this growthrate brought about an annual 3.6 percent increase in real GDP per capita and over a 20 percent decline inpoverty. Also, on an average annual basis, consumer price inflation fell from 38 percent in 1990/91 to -0.2percent in 1998/99. Since President Museveni came to power in 1986, the reform program has focused onestablishing fiscal discipline and opening up the economy by promoting greater reliance on market forces.This program has been successful both in establishing fiscal discipline and in restructuring public
-2 -

expenditure. The Government also has made progress in trade liberalization, privatization, civil service,and financial sector reforms. At the same time, there is an impressive ongoing decentralization effort,which should improve public service delivery by, among other things, promoting better matching of publicservices with local needs. Furthermore, the country's high stock of debt, a significant constraint toeconomic development in the past, has become a smaller obstacle due to Uganda's participation in theinitiative for Heavily Indebted Poor Country (HIPC) initiative.
Despite notable past economic achievements, the Government is concerned that the lack of adequate energysupply in recent years will be a serious obstacle to equitable, sustainable growth of the economy. Themodem segment of Uganda's energy sector - electricity and petroleum - is small. Despite Uganda's vasthydropower resources, concentrated on the White Nile River, only 5 percent of the population has access toelectricity. In fact, a mere 12 percent of the domestic population concentrated in the Kampala metropolitanarea, and in the nearby towns of Entebbe and Jinja -- consumes about 72 percent of total electricity that thepublic electricity system produces.
Recent surveys indicate that private sector managers perceive the quality and adequacy of power supply tobe the most serious constraints to private investment. A shortage of electricity has arisen because theexpansion of Uganda's generating capacity has not kept pace with its rapid economic growth in recentyears. The commissioning of the Kiira hydro power station in August 2000 increased installed capacity to260 MW and has helped to alleviate supply constraints. However, the power utility still has to curtailpower supply during the daily peak periods. With continued strong economic growth and concurrent highelectricity demand growth -- projected at about 8 percent per year -- Uganda needs to better utilize itsdomestic energy resources, mainly hydropower.
Regarding petroleum fuels, the Government liberalized both the importation and pricing in 1994. However,the regulatory framework governing the sector is still inadequate and the capacity to monitor the sector isweak. Because Uganda is land-locked, the cost of delivering petroleum products to markets is significantlyhigher than in many other sub-Saharan African countries. This higher cost mainly results from the hightransit cost of importing products through Kenya and Tanzania. The cost of oil imports was about USS122 million in 1999, amounting to the equivalent of 27 percent of the country's export revenue. As theeconomy continues to grow and modernize, petroleum demand is likely to rise rapidly, from the currentlevel of some 500 million liters per year, absorbing even more of the country's export earnings. Therefore,the provision of incentives for greater efficiency in petroleum supply is critical to improve the country'sbalance of payments as well as the energy balance.
Development Goal Supported by the Project
In November 2000, the Bank presented a new Country Assistance Strategy (CAS) for Uganda to theBoard. This strategy emerged from consultations with the Government, private sector, civil society, andother donors. It seeks to build on the 1997-2000 CAS by continuing to focus on poverty reduction throughsustained growth. The overriding objective is to support Uganda's economic transfonnation and povertyreduction strategy in line with the Government's Poverty Eradication Action Plan (a progress report,IDA/SEC M2001-0219, was discussed by the Board on April 17, 2001). An important component of thisplan is the creation of an enabling environment for economic growth and structural transfornation.Consequently, the Government has identified improving access to and quality of power. transport, andtelecommunications as priorities for the country's development.
The proposed project is included in the CAS and it is an integral part of the CAS emphasis oninfrastructure improvement. More specifically, for the power sector, the CAS plans to improve
- 3 -

infrastructure delivery through the least-cost development of the power system, sector reform, andprivatization. The expansion and rehabilitation of the power system is required to encourage privateindustry investment in Uganda by alleviating concern about the lack of adequate power. In parallel, powersector reform and privatization is necessary for commercial operation of the sector and to reduce theburden of the sector on public finances. The proposed project will continue supporting the sector reformprocess that the Government initiated under the Third Power Project, including the unbundling andprivatization of the Uganda Electricity Board (UEB). The Government is now in the process of privatizingUEB by granting private operators concessions for its distribution and generation businesses.
In addition to the proposed project, there are three energy-related projects that help promote the CAS in thepower sector: the Bujagali Private Hydropower Project; the Energy for Rural Transfornation Project; andthe Privatization and Utility Sector Reform Project.
1. The proposed Bujagali Hydropower Project includes the construction of: (a) a 200/250 MWrun-of-the-river power plant on a Build-Own-Operate-Transfer basis, at Bujagali Falls locatedabout 8 kilometers downstream of the Nalubaale and Kiira Hydropower Plants; and (b) about 100km of 220 kV and 132 kV transmission lines and associated substations. The project sponsor isAES Corporation (AES), Arlington, VA, and AES Sirocco, Limited, a wholly owned subsidiary ofAES. The privately owned and operated project company (Nile Independent Power) will sellelectricity to UEB (or its successors) under a 30-year Power Purchase Agreement. According tocurrent plans, this US$530 million project should be completed in 2005/2006. In addition toprivate equity, the International Finance Corporation (IFC) would partly fund the project, with thesupport of an International Development Association (IDA) Partial Risk Guarantee.
2. The Energy for Rural Transformation Project, has two objectives. The first is to improve the ruralquality of life and facilitate significant rural non-farm income by accelerating rural electrificationfrom the present 1 percent to about 10 percent in ten years. The second is to develop Uganda'sindigenous, renewable energy resources on a cost-effective basis. The financing of the total projectcost of US$375 million would come from the following sources: IDA (US$75 million APL, witha first phase of US$30 million) GEF (US$30 million total), the private sector, the Government andbilateral donors ($195 million).
3. The objective of the ongoing Privatization and Utility Sector Reform Project is to improve thequality, coverage, and economic efficiency of commercial and utility services through privatization,private participation in infrastructure, and an improved regulatory framework. The project willachieve this objective in part by promoting a higher level of private investment along with betterquality of telecommunications, water, electricity and transport services and expanded access of thepopulation to them. The financing for the US$95 million project is coming from IDA (US$48million) and the Government of Uganda (US$47 million).
2. Main sector issues and Government strategy:
Uganda faces several challenges in the power and petroleum sectors:
Power Sector
Background: The Government established the Uganda Electricity Board (UEB) in 1948 as aquasi-independent, vertically-integrated monopoly to generate, transmit, distribute and supply electricitywithin Uganda and to other countries in the region. The enactment of the Electricity Act of 1999 removed
- 4 -

the legal monopoly the UEB had in the power sector. However, the UEB continued to operate generation,transmission and distribution facilities until March 31, 2001. After that date the Government divided theUEB into three independent corporate entities - one each for generation, transmission, and distribution.These government-owned entities now operate the country's power system. This system includes the 180MW Nalubaale power station (formerly Owen Falls), the Kiira power station with 80 MW installedcapacity, and about 10 MW in diesel and mini-hydro capacity. It also consists of: an interconnected 132kV and 66 kV transmission network; a 33 kV sub-transmission network; a distribution network at voltages11 kV and below; and isolated diesel generators and distribution systems. Total generation was about1,520 GWh in 2000 and the system peak was 242 MW in August 2000. Consumer demand at peak timesexceeds available grid connected generating capacity by about 20 MW currently. Supplementary power tofill the deficit comes from privately-owned generators that are mainly diesel-driven.
Issue # 1: Poor Performance. The power sector has for a long time suffered from a number offundamental problems that have led the Government to develop plans for its reform. These problemsinclude:
* Poor supply reliability characterized by extensive load shedding and reductions in voltage
* Inadequate investment in all parts of the sector and an inability to finance future requiredinvestments, particularly in distribution,
* Poor commercial performance characterized by collections being received from less than 50percent of the electricity sent out from the power stations
H High technical and non-technical losses, which are about 35 percent of electricity generated.
3 High accounts receivable, which are currently equivalent to almost seven months of billings.
* Low productivity despite the retrenchment, in 1998, of about 30 percent of UEB's employees.Currently, UEB's successor companies combined have about 1,800 employees serving fewer than170,000 customers.
These inefficiencies have left UEB and its successor companies in a weak position. Now they are, bynormal standards, close to insolvency. UEB has not been able to generate an adequate cash flow from itsaverage retail tariff of about US 5.6 cents/kWh. To reduce non-technical (i.e. commercial) losses, UEBhas established campaigns to reduce electricity theft and engaged private debt collectors to improvecollection performance. However, these losses and non-payment of utility bills remain serious problemsand ongoing programs in these areas need reinforcement. Various factors such as an inadequate billingsystem, metering inaccuracies, and the existence of un-metered supply have exacerbated the problem. Thepublic sector, which consumes roughly 10 percent of the electricity, is a major defaulter on its paymentobligations to the power utility. In order to reduce the technical losses to economic levels, heavyinvestments in the network, especially for distribution, will be necessary over the coming years.
The major cause of the poor state of the power sector has been UEB's lack of management and financialautonomy from the Government. This situation has hindered the development of a commercial businessorientation, accountability and modem utility management practices. Government influence intariff-setting, investment decisions, personnel deployment, and other areas have made it difficult to developthe performance incentives necessary to improve service.
- 5 -

Strategy: Realizing the potential deleterious impact of a weak power sector on economic growth, theGovernment has begun the implementation of a comprehensive reform and privatization program(Govemment's Power Sector Policy statement is attached in Annex 11). The Government approved apower sector restructuring and privatization policy in June 1999. The 1999 Electricity Act and the PublicEnterprise Reform and Divestiture Statute provide the legal basis for this policy and provide for the verticalunbundling of UEB and its conversion from a Statutory Corporation to a public company limited by shares.The Electricity Act also provided for the establishment of an independent power sector regulator. Thisentity has been in place since April 2000. As a prelude to the privatization, in April 1999, the Governmentappointed a new management team with private sector experience to manage UEB. The new management'scommercial approach has made improvements in UEB's performance (see Section E.2 for details). Thepreparatory work for restructuring and privatizing UEB began in April 2000 with the hiring ofPrivatization Advisers.
In March 2001, the Governnent divided UEB into three independent corporate entities, one each forgeneration, transmission, and distribution. The division of UEB into these entities also affected theallocation of the former UEB's assets. The Government has re-allocated these assets according to therequirements of the 1999 Electricity Act. As a result, the Distribution Company now owns all powersupply assets operating at 33 kV and below, along with assets associated with the retailing of electricity.The Transmission Company owns all assets operating above 33 kV. The Uganda Electricity GenerationCompany owns the Nalubaale and Kiira hydro power stations. During a transitional period, the UEBStatutory Corporation will retain some liabilities that the Government could not delegate to the successorcompanies without the prior permission of counter-parts to the contract (for example some multilateral andbilateral long-term debt). Upon settlement of these liabilities, or their delegation to one of the successorcompanies with permission of the counter parts, UEB will cease to exist, according to the 1999 ElectricityAct. The diagram below illustrates the current sector structure, which will be in place until the generationand distribution businesses are concessioned out to the private sector.
Current Power Sector Structure
Shareholders:Minister Responsible
for Finance andMinister Responsible
for Privatization
|Uganda Electricity | ganda Electricity ||Uganda Electricity lDistribution company Transmission Generation Company
Ltd. Company Ltd . L td.
In addition to the unbundling of UEB into separate generation, transmission, and distribution companies,the restructuring policy requires the privatization of the generation and distribution businesses through theestablishment of long-tern concessions. Under concession arrangements the existing assets will remain inpublic ownership but the private companies will have the right to operate and expand them.
Upon establishment of the concessions, the power sector will have the following structure:
One distribution company that a private company will operate as a concession;
- 6 -
* One generation company that a private company will operate as a consession, including theexisting Nalubaale and Kiira hydro stations;
* Two separate Government-owned holding companies for the existing generation anddistribution assets; and
* A separate Government-owned transmission company acting as a single buyer that will holdexisting power purchase agreements (i.e. Bujagali and the future generation concessioncompany). The Government's medium term objective is, however, for the private sector tooperate the transmission company as a concession and also to allow for direct contractingbetween the generation and distribution companies.
In addition, the Electricity Act allows Independent Power Producers (e.g. Bujagali) and rural energy supplycompanies to apply for operating licences.
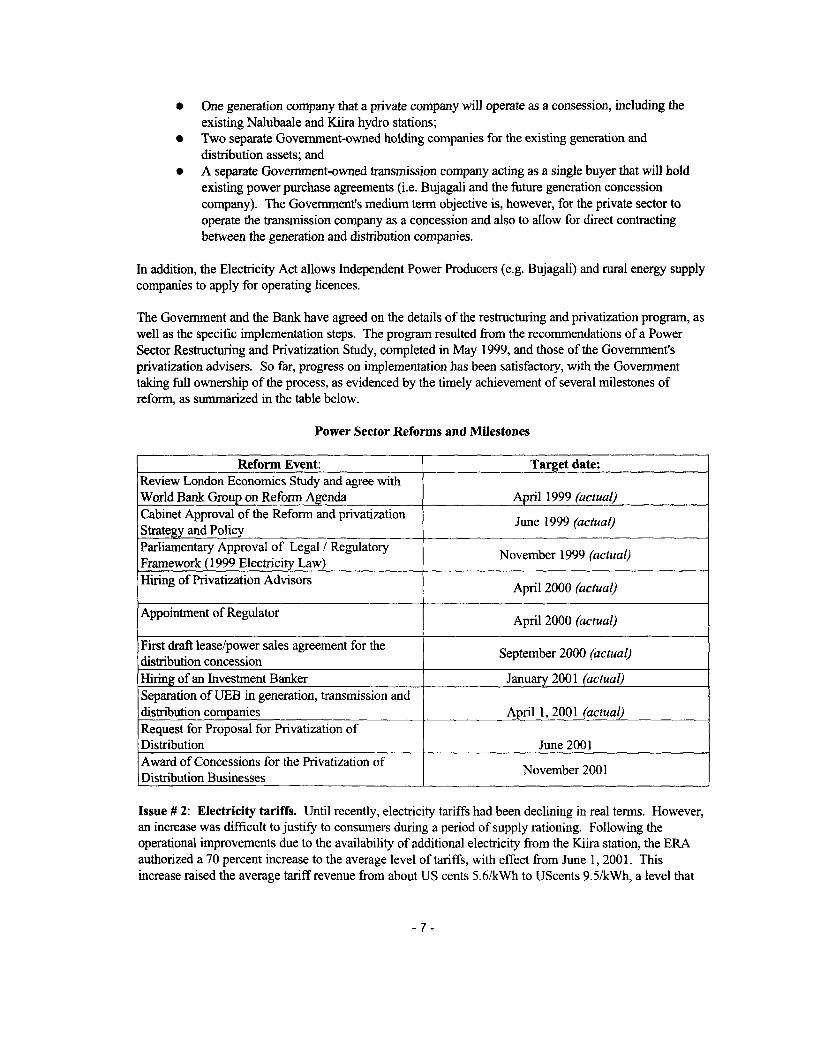
The Government and the Bank have agreed on the details of the restructuring and privatization program, aswell as the specific implementation steps. The program resulted from the recommendations of a PowerSector Restructuring and Privatization Study, completed in May 1999, and those of the Government'sprivatization advisers. So far, progress on implementation has been satisfactory, with the Governmenttaking full ownership of the process, as evidenced by the timely achievement of several milestones ofreform, as summarized in the table below.
Power Sector Reforms and Milestones
Reform Event: Target date:Review London Economics Study and agree withWorld Bank Group on Reform Agenda April 1999 (actual)Cabinet Approval of the Reform and privatization June 1999 (actual)Strategy and PolicyParliamentary Approval of Legal / Regulatory November 1999 (actual)Framework (1999 Electricity Law)Hiring of Privatization Advisors April 2000 (actual)
Appointment of Regulator April 2000 (actual)
First draft lease/power sales agreement for the September 2000 (actual)distribution concessionHiring of an Investment Banker January 2001 (actual)Separation of UEB in generation, transmission anddistribution companies April 1, 2001 (actual)Request for Proposal for Privatization ofDistribution June 2001Award of Concessions for the Privatization of November 2001Distribution Businesses
Issue # 2: Electricity tariffs. Until recently, electricity tariffs had been declining in real terms. However,an increase was difficult to justify to consumers during a period of supply rationing. Following theoperational improvements due to the availability of additional electricity from the Kiira station, the ERAauthorized a 70 percent increase to the average level of tariffs, with effect from June 1, 2001. Thisincrease raised the average tariff revenue from about US cents 5.6/kWh to UScents 9.5/kWh, a level that
- 7 -

would be adequate to ensure the financial viability of the project. This increase was necessary to improvethe power sector's financial position and to ensure that sufficient revenue would be generated by the sectorentities to finance investment in rehabilitation and expansion of the system. At the same time, the ERAalso approved improvements to the structure of the tariffs, through the removal of cross subsidies betweenthe different consumer groups. Most notably, it removed the subsidy from industrial to residentialconsumers. This new tariff structure should provide better incentives for suppliers to extend electricityservice to rural areas. The ERA also approved an automatic tariff adjustment mechanism to prevent theerosion of the tariff due to fluctuations in foreign exchange rates and domestic inflation. Under thismechanism, the Distribution Company can adjust the retail tariffs quarterly on the basis of an ERAendorsed formula.
Issue # 3: Inadequate and Unreliable Electricity Supply. As noted earlier, inadequate, unreliableelectricity supply is stifling economic growth. Although the supply situation has improved since thecommissioning of 80 MW at Kiira in August 2000, the utility is still forced to curtail about 20 MW during2-3 peak hours daily. There is no adequate reserve margin, which in turn prevents the utility fromadequately maintaining its generating assets. Furthermore, a number of the generation and transmissionsubstations are old and in poor condition due to lack of adequate maintenance. System interruptionstherefore occur frequently.
Because of economic expansion, Uganda's electricity demand is expected to increase rapidly. In February2001, Electricite de France (EdF) updated Uganda's electricity demand forecast. The base case forecastestimates energy demand to grow at an annual average rate of 10 percent during the period 2001 to 2010.After taking account of decreasing losses, the forecast indicates that the system's energy requirement willincrease by about 8 percent per year. This rate appears reasonable given expected annual GDP growth rateof around 7 percent, continued strong industrial production, and the current peak load shedding. Anotherindication of the market's growth potential is the recent survey of private industries. This survey indicatedthat industries have installed up to 100 MW of back-up capacity in response to the poor quality of UEB'ssupply and the continued load shedding. With improved service from the grid system provider, theseindustries are likely to rely less and less on their own generators and instead, gradually increase puchasesfrom the grid system. The high and low annual demand growth scenarios are 9 percent and 11 percentrespectively (assumptions are in Annex 4). A comparison of the forecast with the available generationindicates that the existing system will not be able to balance demand and supply.
Strategy: The Government's long-term strategy is to develop Uganda's large hydro power resourcesthrough Independent Power Producers (IPPs). Based on current plans, the first IPP plant (Bujagali) shouldbe operational around the year 2005/2006. To meet the growing demand in the meantime, a newhydroelectric generation plant -- the Kiira power station (formerly the Owen Falls Extension) -- is underconstruction. It is constructed adjacent to, but not connected to the existing Nalubaale plant. The plant isdesigned for 5 x 40 MW generating units (please refer to illustration of the plant at the end of Annex 2).The Third Power project financed the construction of a new dam, a power house, a diversion canal, aspillway, civil works for generating units 11 through 15, and the installation of 80 MW (Units 11 & 12) ofgenerating capacity. The Swedish International Development Agency (SIDA) and Norwegian Agency forDevelopment Corporation (NORAD) are financing the installation of Unit 13. The addition of this unit bythe end of 2002, will increase the installed system capacity to 300 MW.
The Government plans to install the remaining two units to complete the Kiira plant. Since the civil workstructures are already in place, these two units can begin operation with a short lead time. The units willprovide 80 MW of additional capacity. The additional power will reduce the need for electricity rationingbefore the first IPP comes on-line. However, even this extra power is only a partial solution; the forecast
- 8 -

indicates that demand will outstrip supply until Bujagali comes on strearm. To fuirther reduce the supplydeficit, the Energy for Rural Transformation Project will explore the possibility of generation from smallrenewable energy sources, such as sugar mills, that are close or already connected to the main grid. Energyefficiency measures will supplement this increase in generation capacity. These measures include ongoingprograms for reducing non-technical losses and improving billing and collections. One of the ongoingprograms is the distribution strengthening and technical loss reduction project, with fimancing from theAfrican Development Bank (AfDB). To reduce interruptions in the transmission system, the Governmentplans to rehabilitate a number of critical transmission substations, the old substations at the Nalubaalehydropower plant, and extend the Supervisory Control and Data Acquisition (SCADA) system to cover thewhole transmission system.
The table below shows the energy and capacity balance for Uganda over the period 2000-2007.
Energy and capacity balance for Uganda over the period 2000-2007
Year: 2000 2001 2002 2003 2004 2005 2006 2007
Energy Demand (GWh)Domestic 909 1005 1110 1232 1370 1520 1672 1836
Kenya 210 175 99 99 99 99 99 99
Tanzania 21 21 21 21 21 21 21 21
Rwanda 1 1 1 1 1 1 1 1
Total Demand 1141 1202 1231 1353 1491 1641 1793 1957Required Generation 1554 1627 1665 1801 1953 2117 2277 2369Demand at Peak (MW)
Domestic 242 262 283 303 324 344 377 410
Kenya 10 10 10 10 10 10 10 10
Tanzania 5 5 5 5 5 5 5 5Rwanda 1 1 1 1 1 1 1 1Total 258 278 299 319 340 360 393 426
Installed Capacity (MW)
Hydro Total 260 260 300 380 380 380 580 580
Existing Cogen 7 7 7 7 7 7 7 7Kakira (available to the grid) 0 0 0 12 12 15 19 19
Total from the Grid 267 267 307 399 399 402 606 606Energy Produced (GWh)
Hydro Total 1527 1527 1527 1654 1539 1704 2846 3108Existing cogen 15 17 17 17 17 17 17 17
Kakira 0 0 0 80 80 105 140 140Works Units -4 -4 -5 -6 -6 -7 -9 -9Total from the Grid 1538 1539 1539 1744 1629 1819 2994 3256Losses (%) 31 29 28 26 25 24 22 18
Reserve Margin (less LU)(%) (12) (18) (11) 13 6 1 44 33Surplus/(Deficit) (GWh) (16) (88) (126) (57) (324) (298) 717 886
Notes:1. Energy and peak demand according to EdF's "base" forecast.2. Hydro production is based on "average" water flow.3. The installation of Units 14 and 15 by end-2003.4. The availability of power from Bujagali by 2006.5. Export sales at their current levels.
-9-

6. LU=Largest generating unit.
The table above shows that the system will continue to operate on a negative reserve margin until the Kiirapower plant has been completed at the end of 2003. After that time, the system will have adequate capacityreserves but it will not be able to meet energy demand fully until the commissioning of Bujagali. However,as discussed later in Section D, the Government has indicated that, at this stage, it is not willing to installlarge scale oil thermal plant, because of the high cost of fuel and problems transporting large amounts offuel through Kenya and Tanzania. Furthermore, investment in such a plant would, in effect, duplicateinvestments in back-up diesel generators, which industries already have made.
Issue # 4: Low Access to Electricity-Particularly in Rural Areas. Uganda currently has one of thelowest levels of per capita electricity consumption (44 kWh/year) in the world. This ievel reflects the factthat only an estimated 4-5 percent of population has access to public electricity supply. Currently there areonly about 170,000 customers connected to electricity lines. Most of these customers live in urban areas.In the recent past, UEB connected fewer than 10,000 customers per year. Even under the best ofcircumstances, restructuring of the power sector alone is unlikely to improve the rural access pictureperceptibly. For example, an optimistic assumption for growth in the number of rural householdsconnected to the main grid during the period 2001 to 2010 is an average annual rate of 15 percent. At thisrate, the total number of rural households connected to the main grid would increase from about 30,000 in2001 to about 125,000 in 2010. Under this assumption, rural access would increase from 1 percent to 3percent.
Strategy: The Government, in consultation with the Bank, has adopted a commercially-oriented approach-- with the Government playing the role of a market enabler to increase rural electrification. The mainelements of this strategy are: (i) level playing field for private sector participants; (ii) a regulatoryframework that supports private sector development; (iii) cost recovery and cost-based tariffs; and (iv) atransparent subsidy transfer and financing mechanism. In line with this approach, the Government hasinitiated discussions with the Bank for financial support for rural electrification. The Banks analyses sofar have concluded that Uganda offers good prospects for a commercially oriented rural electrificationprogram with the private sector taking the leading role. However, the first step is to establish a supportiveinstitutional and regulatory framework. The Bank and the Government plan to support such a developmentunder the Energy for Rural Transformation Project. The Bank appraised the proposed project in May2001, at which time the Government began the implementation of its recently completed RuralElectrification Strategy.
Issue # 5: Hydrology. Uganda's existing hydro power plants are located along the Nile river, which flowsout of lake Victoria. The long-term level of Lake Victoria naturally varies over a range of about twometers. Despite Uganda's ability to regulate outflows from the lake using the Nalubaale Dam, thisregulation capability is generally not used because of a bilateral agreement between Uganda and one of theriparian countries. This agreement regulates the quantity of flow discharged from the lake (through thepowerhouse or dam spillway) according to an "agreed curve". The purpose of this curve, which relates thewater outflow to lake levels, is to reproduce the natural outflow which would have occurred prior to theconstruction of the Nalubaale power plant and spillway in 1954. While Uganda has some flexibility toregulate flows on a weekly basis to match power demands, it cannot utilize Nalubaale's very largecapability to regulate flows on a seasonal or yearly basis to optimize the use of Lake Victoria outflows forpower generation.
There have been proposals for regulating the outflow from Lake Victoria but as yet no detailed studies havebeen carried out. The objective of such regulation would be to enhance hydropower production at
- 10-

Nalubaale, Kiira and any subsequent plants downstream. There may also be potential benefits todownstream riparian countries through increased dry year flows and flood attenuation. From Uganda'sviewpoint the main benefit of such a regulation policy is the ability to firm up energy production of theNalubaale, Kiira, and Bujagali power plants. This would allow delaying the construction of subsequentnew plants until system demand exceeded "average energy" rather than "firm energy". It could be possibleto further increase these benefits by short term variations in operating policy. For example, there could bean increase in the outflow for two or three years prior to installing new power plants (drawing fromstorage), thus allowing the postponement of new investment in generation capacity. Then, during theperiod immediately after installation of the new plants, there could be a reduction in outflows to allowrecovery of lake level (replenishing storage). Outflows would then be gradually increased to average levelsin line with system demand increases. Under the proposed project, the Government has requested financingfor a study that would evaluate the impact of this regulation policy on the power investment program andon the downstream riparian countries.
Petroleum Sector
Issue # 6: Lack of Monitoring of Petroleum Operations. In 1994, the Government liberalized thedownstream petroleum sector but the legal and regulatory framework governing the sector is stillinadequate and the capacity to monitor the sector is weak. Some six years after the liberalization, Ugandastill has no law or mechanism to enforce anti-competitive behavior. The only law in effect at the momentwhich relates to the downstream sub-sector is the Petroleum Act of 1957. It appears that only the oilcompanies have benefited from the liberalized market since 1994. It has not resulted in much increasedcompetition, lower consumer prices, or improved quality at the pump. In 1999, the Government preparedan analysis that indicated an increase in the oil companies' margins from about US$0.24/literpre-liberalization to in excess of US$0.30/liter after liberalization. Consumer prices per liter have rangedbetween $0.7 and $0.9 for petrol; $0.5 and $0.7 for kesosene; and $0.6 and $0.8 for diesel during theperiod January 2000 to date. Regarding the quality of the products, there is a problem of product alterationespecially for kerosene and diesel. A procedure called bio-coding, which the Government recentlyintroduced to control petroleum smuggling, has established that products imported through the properchannels are sometimes mixed with smuggled ones. A major deficiency in the management of the sector isthe Government's lack of capacity to adequately control the quality of petroleum products entering thecountry.
Strategy: The Government is committed to improving the operation of the petroleum sector by enhancingcompetition through a number of measures: (i) actively monitoring and disseminating market information tothe public; (ii) establishing a legal and regulatory framework; and (iii) attracting new entrants to themarket. To this end, Government has initiated the drafting of a new Petroleum Supply Law with theassistance of GTZ. It has requested IDA assistance in implementing the law including the establishment ofa body to monitor petroleum operations. This assistance will include technical assistance for: Preparingand setting up the new regulatory framework and monitoring; building institutional capacity; and acquiringequipment.
3. Sector issues to be addressed by the project and strategic choices:
The project will address the following issues: promoting further power sector reform and development;increasing and improving supply of electricity, including the optimization of Lake Victoria's outflows; andpromoting further petroleum sector reform and development.
Promoting Further Power Sector Reform and Development. The Government has demonstrated
- 11 -

ownership of sector reform and its progress in implementing agreed reform measures has been steady. Theproposed project will facilitate the Government's privatization program by financing critically neededgeneration capacity and transmission rehabilitation. This financing will ensure availability of generation tosupport the private sector distribution company's efforts to increase coverage. Also, the project willfinance training and advisory services for increasing the Government's capacity to deal with the complexissues related to power sector reform and utility privatization. The Privatization and Utility Reform projectis providing complementary assistance. Furthermore, to ensure sustainability of the proposed project, forwhich a reformed power sector is essential, several key decisions on the project will depend on theGovernment maintaining its comnmitment.
The project would also, together with the NORAD-financed Regulatory Support Project, support thesetting-up of the legal and regulatory framework -- in particular, technical assistance and training to therecently established Electricity Regulatory Authority. The Bank and the Borrower will identify specificactivities to be financed during the course of implementation.
Increasing and Improving Supply of Electricity to Meet Demand: The project will install Units 14 and15 at the existing Kiira power station. These units will provide up to 80 MW in additional installedcapacity by the end of 2003. The project also will facilitate the speedy commissioning of Unit 13 byfinancing the civil works that SIDA and NORAD could not finance due to unavailability of funds. Thecredit for the proposed project would allocate about US$ 2.5 million (3.2% of the total) to the retroactivefinancing of the initial portion of the required civil works. Such advanced procurement is necessary tocomplete installation of Unit 13 on time to meet growing demand.
Finally, the proposed project will finance the rehabilitation of critically needed transmission systemimprovements to reduce losses and blackouts. Analysis indicates that the existing transmission networkcapacity combined with current investments in new capacity should provide the main load centers withsufficient power. However, the appraisal mission established that although some rehabilitation of theelectromechanical equipment at Nalubaale power station was carried out under the Second Power Project,some of the original (1954) equipment remains un-refurbished. Hence, the proposed project will financethe rehabilitation of the necessary critical circuit breakers and spare units for the transformers. It also willrehabilitate and extend several other grid substations for effective distribution of the increased supply.Finally it will upgrade and extend the SCADA system to reduce the time required to identify a fault andrestore supply after fault rectification.
Optimizing Lake Victoria Outflows: The project will finance the required studies to provide theGovernment with information on the merits of the short-and long-term regulation of Lake Victoria outflowsto Uganda and the downstream riparian countries. The study would contribute to a strategy to manage thehydrology in an environmentally satisfactory way for Uganda and all riparian countries.
Furthering Petroleum Sector Reform and Development: The project will provide technical assistance tothe Government for the overall reform and development of the subsector, including the establishment andimplementation of a monitoring and regulatory function. The project will also finance the procurement ofpetroleum quality monitoring equipment. This assistance will complement that of the GTZ, which isfinancing the drafting of a new Petroleum Supply Bill. The Government will submit the Bill to Parliamentprior to the implementation of this component.
Strategic Choices
Public vs. Private Sector Project: Given the cost of power shortages to the economy, the proposed
- 12 -

project will finance a public sector investment because it is the fastest way to increase generation capacity.The project team considered the installation of the two generating units by the private sector. However, theteam rejected this alternative because it would require more lead time than a public sector project. Since itis expected that the operation of the Kiira power station would be offered to a private sector concessionairethrough tendering by the end of 2001, procurement of the units by the private concessionaire could onlystart during 2002, meaning at least a one year delay in installation. This would lead to intensified powerrationing. The Government therefore decided not to delay the installation until the generationconcessionaire has been selected.
Sector Reform: The dialogue between the Bank and the Government of Uganda on power sector refornshas been going on for several years. The Government recognizes that it can justify additional investment inthe sector only with major reform of the sector. In view of this, the proposed assistance strategy includesthree elements. First, release of funds by IDA for the installation of the generating units will take placeonly after Government has approved a satisfactory list of pre-qualified firms for the distributionconcession. It should be noted that confidence of generation availability is a crucial aspect in investorreadiness to be involved in a distribution business. Hence, the second element is that the project will assistthe reform program by improving the availability of power in the short to medium term, before privatesector financing becomes available. Third, the proposed project will provide technical assistance for theimplementation of the reform program in coordination with the Privatization and Utility Sector ReformProject, the proposed Bujagali IPP Project, and other donor assistance programs.
Project Size: A third strategic choice in the design of the project is the phasing of the financing forinvestment in new generating units. During project preparation an analysis indicated that under "base case"assumptions -- for the capital cost of the unit; the commissioning date of Bujagali; and the inflows to thelake prior to the planned commissioning dates of the new units -- only one of the two would beeconomically justified at present. The Bank and the Government agreed, however, to include the two unitsin the project but make the disbursement for the second unit conditional on demonstration of its viability ata later stage, likely to be towards the end of 2001. At that time, the Bank and the Government will reviewthree key factors: the capital cost of the additional unit based on bids received; the most probable on-linedate for Bujagali; and the latest lake level (and hence implications for short-term outflow). The appraisalteam's analysis shows that the viability of the second unit is mostly sensitive to when Bujagali comes onstream. However, the short-term outflows from lake Victoria, will also have an impact. In addition, ifUganda were to negotiate a change to the agreement with the riparian countries on flows, making largeroutflows from the lake to the river possible, the energy generation capability of the second unit wouldincrease markedly thereby improving its economics.
- 13 -

C. Project Description Summary
1. Project components (see Annex 2 for a detailed description and Annex 3 for a detailed costbreakdown):
Indicative Bank- % oflomponent 0 Sector Costs % of financing Bank-
l_____________________________ : 0r(US$M) Total (US$M) financingA. POWER SYSTEM EXPANSION PH - Hydro 83.87 93.9 56.82 91.6AND REHABILITATION
Al. Investment:a. Installation of Units 14 and 15 Kiirab. Upgrade of SCADA andTelecormmunications Systemc. Transmission Rehabilitationd. Civil Works for Unit 13e. Hydromechanical for Unit 13
A2. Institutional Supporta. Project Design and Supervisionb. Study on Unit 15
B. ENVIRONMENTAL Natural 0.21 0.2 0.00 0.0MONITORING Resources
Managementa. Environmental Officerb. Environmental Monitoring
C. POWER SECTOR Institutional 2.35 2.6 2.34 3.8DEVELOPMENT AND REFORM Development
C1. Equipment and Training
C2. Consultanciesa. Water Management Studyb. Consultancies and Workshopsc. Studies
C3. ERA Assistance
- 14 -

D. PETROLEUM SECTOR Oil & Gas 0.97 1.1 0.90 1.5DEVELOPMENT AND REFORM Adjustment
D. 1. Quality monitoring equipment,training, and information
D2. Consultancy Services for designand implementation of legal andregulatory system.
E. PROJECT PREPARATION Electric Power & 1.94 2.2 1.94 3.1FACILITY (PPF) Other Energy
Adjustment
Total Project Costs 89.34 100.0 62.00 100.0Interest during construction 0.00 0.0 0.00 0.0
Front-end fee 0.00 0.0 0.00 0.0Total Financing Required 89.34 100.0 62.00 100.0
2. Key policy and institutional reforms supported by the project:
The project will support the ongoing reforms in the power and petroleum sub-sectors in particular, theprivatization through long-term concessions of the power distribution and generation businesses and theimplementation of a modem legal and regulatory framework for the petroleum sub-sector. Most of theassistance will be in the form of capacity-building and training, both in-house and outside Uganda.
In the power sector, the Government has made several legal and institutional changes up-front, including:(i) amendment of the Public Enterprise Reform and Divestiture (PERD) Statute to improve theprivatization process; (ii) enactment of legislation to create a separate electricity regulatory agency; (iii)adoption of procedures for competitive and transparent divestitures; and (iv) adoption of transparentguidelines for the use of divestiture proceeds; (v) filled management positions at UEB with a qualifiedmanagement team to manage the utility on a commercial basis in the interim period before privatization;and (vi) separated UEB into three corporate entities. In addition, GOU has decided to adopt evolvingapproaches towards the regulation of utilities framework. In the short term, it will create sector-specificregulatory agencies to ensure autonomous arrangements for each sector. In the longer-term, theGovernment is looking into a broader concept of multi-sector agencies in an effort to increase the efficiencyof regulation. In the petroleum sector, the Govermment is in the process of modemizing its PetroleumSupply Law and creating effective market monitoring arrangements.
Finally, the project will help build the institutional capacity for project implementation and management bysupporting: (i) the Project Implementation Unit (PIU), which is in charge of the implementation of thegeneration and transmission components of the project; and (ii) the MEMD's project implementation team.The project will also promote Uganda to make better use of regional energy trade opportunities.
- 15-
3. Benefits and target population:
The primary beneficiaries will be electricity consurners in Uganda, who will receive more electricity and abetter quality of service. In particular, private industry will benefit from increased grid supply and reducedload shedding. All taxpayers who subsidize UEB, will benefit from power sector reform and improvedfinancial management of the power industry. In particular:
* Increased power supply with improved reliability will facilitate higher economic growth;* Power sector reform and privatization will improve the sector's performance thereby reducing the
power sector's drain on public expenditures, and thus freeing-up resources for the implementationof the Government's poverty eradication program; and
* Fewer blackouts and brownouts will reduce the need to operate expensive back-up generators.Thus, industry will benefit from reduced cost of electricity. Also, increased power supply willallow for increasing the access to electricity.
4. Institutional and implementation arrangements:
Implementation Agencies by Project Component:
Part A. Power System Expansion and Rehabilitation
A.1. Expansion of the Kiira power plant through: (a) the acquisition and installation of two 40 MWpower generation units (Units 14 and 15), (b) completion of the installation of Unit 13, including theacquisition of related equipment and civil works (IDA financed).
3 The Uganda Electricity Generation Company Ltd.
A.2. Upgrading of the Uganda Electricity Transmission Company's supervisory control and dataacquisition and telecommunications systems through: (a) the acquisition and installation of hardwareand software; (b) installation of remote and terminal units and data collecting equipment; and (c)extension of telecommnunications systems (NDF financed).
3 The Uganda Electricity Transmission Company Ltd.
A.3 (a). Rehabilitation of substations at Nalubaale (NDF financed).
* The Uganda Electricity Generation Company Ltd.
A.3 (b) Rehabilitation of the Nkenda, Nkonge, and Opuyo substations (NORAD financed).
* The Transmission Company Ltd.
A.4. Design and supervision of activities of the Project. (IDA financed)
* The Uganda Electricity Generation Company Ltd.
A.5 Strengthening the management of the Project through the technical advisory services, and (b) thecarrying out of a technical and economic evaluation to deternine the viability of Unit 15 (IDAfinanced).
- 16 -

* The Uganda Electricity Generation Company Ltd.
Part B. Environmental Monitoring
* The Uganda Electricity Generation Company Ltd.
Part C. Power Sector Development and Reform
* MEMD
Part D. Petroleum Sector Development and Reform
* MEMD
Project Management Arrangements
The existing Project Implementation Unit (PIU), located at the UEB Statutory Corporation, will provideimplementation support to the Generation and Transmission companies (for Parts A and B). The unitrecently received strengthening under the ongoing Third Power project. A dedicated individual withinternational experience has been hired as Project Manager to head the Unit. The Unit also includes aproject accountant, and staff with procurement expertise. An environmental officer started work on June 1,2001. The Implementation Unit has proven experience in implementing similar projects as it providessupport to the implementation of all the ongoing power sector projects.
MEMD has assigned the Assistant Commissioner for Energy Efficiency as a full time Project Coordinatorresponsible for the implementation of its components. Other members of MEM'Ys project implementationteam include a deputy project coordinator (the Assistant Commissioner for Petroleum) and an accountant.In issues relating to power sector privatization, MEMD will consult with the Minister of State for Finance(privatization) responsible for privatization. In implementing the Water Management Study, MEMD willco-ordinate with the Ministry of Water, Lands, and Environment. MEMD has experience inimplementing similar projects through participation in previous IDA and donor financed projects.
Accounting, Financial Reporting, and Auditing Arrangements
* An independent auditor, acceptable to the Bank, will audit project accounts, including special accountsand all disbursements under Statements of Expenditure annually. The auditor will apply auditingstandards acceptable to IDA; and
* The implementing agencies will submit the annual audit report to IDA within six months of the end ofeach fiscal year.
Monitoring and Evaluation Arrangements
* The implementing agencies will prepare quarterly project management reports and semi-annualprogress reports on the basis of the agreed project implementation plan;
* The Bank's supervision missions will take place twice a year and there will be a mid-term review of theproject in 2003. The project's co-financiers (NDF and NORAD) have agreed to participate in thesemissions to the extent possible;
* Implementation progress and achievement of objectives will be monitored on the basis of agreed
- 17-

indicators and targets; and* The Government will transmit to IDA a completion report, within six months of credit closing.
D. Project Rationale
1. Project alternatives considered and reasons for rejection:
Previous studies have established that the generation system in Uganda should be based on hydro power.This is a function of two factors. The first is the abundant power potential available for development onthe Victoria Nile. The second is the relatively high cost of alternative thermal generation - a consequenceof Uganda's landlocked location. The development of a generation system in Uganda was studied in detailin 1997 by Kennedy and Donkin, as part of the IDA-financed Third Power project. The study provided along-term approach to defining the evolution of the generation system. It concluded that developing thehydropower resources on the Nile is the least-cost option for Uganda. It consequently outlined a long-termdevelopment plan for the power system and recommended the development of Bujagali in 2003 as the nextpower generation project. The plan included Kiira Units 14 and 15 in all the expansion sequences itanalyzed. The least-cost plan recommended the installation of Unit 14 before Bujagali and Unit 15 after it.
However, substantial power shortages have resulted from a combination of: High load growth; delays incompleting the first phase of the Kiira power plant (3x4OMW Units 11-13); and a delay in the dateBujagali will come on stream. The power shortages will continue until the commissioning of Bujagali nowexpected in 2005/2006. The Government is considering an immediate further extension at Kiira (2x40MWUnits 14 & 15) as a partial stop-gap solution. Since the required civil works (for example, thepowerhouse) already are complete, the two units could be operational before the end of 2003.
The viability of this extension is, however, not clear cut because energy production of the additional units isstrongly influenced by the amount of flow available from the Lake Victoria over the short term. This, inturn, is a function of the uncertain hydrological regime (an analysis of the hydrology by Mr. DennisCreamer, Water Resources Specialist, is available in project files). Moreover, the Government hasemphasized that the installation of new stop-gap generation should not detract from the economic viabilityof Bujagali for which the decision to proceed in principle has been taken. Therefore after commissioning ofBujagali, the operating regime of the generating plants should reflect that power from Bujagali would bedispatched first to meet the domestic load and export commitments; other plants would provide peak andsurplus energy. However, there is a general agreement that additional firm energy arising from the newKiira units could affect the next hydropower addition after Bujagali, by delaying it slightly or reducing itscapacity.
Four alternatives were studied to compare the costs of reducing the energy shortfall before Bujagali:
* A) Installation of no additional generation prior to Bujagali. Instead, shortages are dealt with,as has been the case in the past, by relying on industrial, commercial and high-incomeresidential consumers to continue running their own existing back-up generation for essentialservices. A few new consumers would also install small- to-medium sized diesel plants to meetessential services. This plan would inevitably lead to some loss of economic activity as someloads would not be served either by the grid or by private back-up generators. It should benoted that under this scenario GENCO would not have adequate capacity to serve peak loads,and would also have insufficient hydroelectric energy to meet the system demand. It would,however, have some flexibility to schedule outages to times of day when effect on economicproductivity would be less.
- 18 -

* B) Installation of a 40 MW distillate fired gas turbine power plant to meet the projected loadgrowth prior to Bujagali under most hydrological scenarios, such that no new back-upgeneration by consumers would need to be installed. After Bujagali comes on line, the fullcapacity of this gas turbine would not be needed in the grid system in the short to mediumterm.
* C) Installation of Kiira Unit 14. Considerable back-up energy generation by consumers wouldstill be required under lower flow hydrological scenarios. Also, some additional back-upgeneration capacity would need to be installed by new consumers, though less than inalternative A). The additional capacity of Unit 14 would give the GENCO improvedcapability to schedule outages at times of day when effect on economic productivity is less. Itcould also consider an energy exchange program with Kenya such that Uganda exportedenergy in peak load periods in return for a greater quantity of imported energy during off-peakperiods. After Bujagali comes on stream, the additional energy generation of Unit 14 wouldneed to be considered as surplus, available for export until the domestic demand had grownsufficiently to absorb it. By that time, the firm energy component of this additional energywould allow some delay or reduced size in the next hydropower plant after Bujagali.
* D) Installation of both Kiira Units 14 and 15. Since Unit 15 does not provide additionalenergy except for above average hydrological scenarios, the amount of additional back-upgeneration capacity installed by consumers would probably not decline in comparison withalternative C) above. However, in higher flow scenarios, the additional energy from Unit 15would save fuel in back-up plant before Bujagali, and increase surpluses available for exportafter Bujagali. It would also allow for an additional small delay in the next plant after Bujagalior alternatively a small reduction in its size.
Table 1: Present Value of Total System CostsAlternative A Alternative B Alternative C Alternative D
No Expansion of Gas Turbine Unit 14 Units 14&15Generation
US$ million US$ million USS million US$ millionInvestmnent, O&M & Fuel $0 $92 $25 $45Hydro Investment $579 $579 $570 $568(Bujagali & next)Surplus Energy Revenue ($187) ($184) ($194) ($202)Reduced Exports $40 $26 $38 $38Existing Back-up Diesel $42 $5 $38 $37(fuel cost)New Back-up Diesel $26 so $11 $4Value of Unserved Energy $18 $0 $8 $3PV of Total System Cost $519 $519 $496 $494(discounted at 12%)Note:1. Assumptions are detailed in Annex 4.2. Hydro investment includes Bujagali and the next hydro plant after it.3. The investment cost of each alternative are included in "Investment, 0 & M & Fuel."
- 19 -
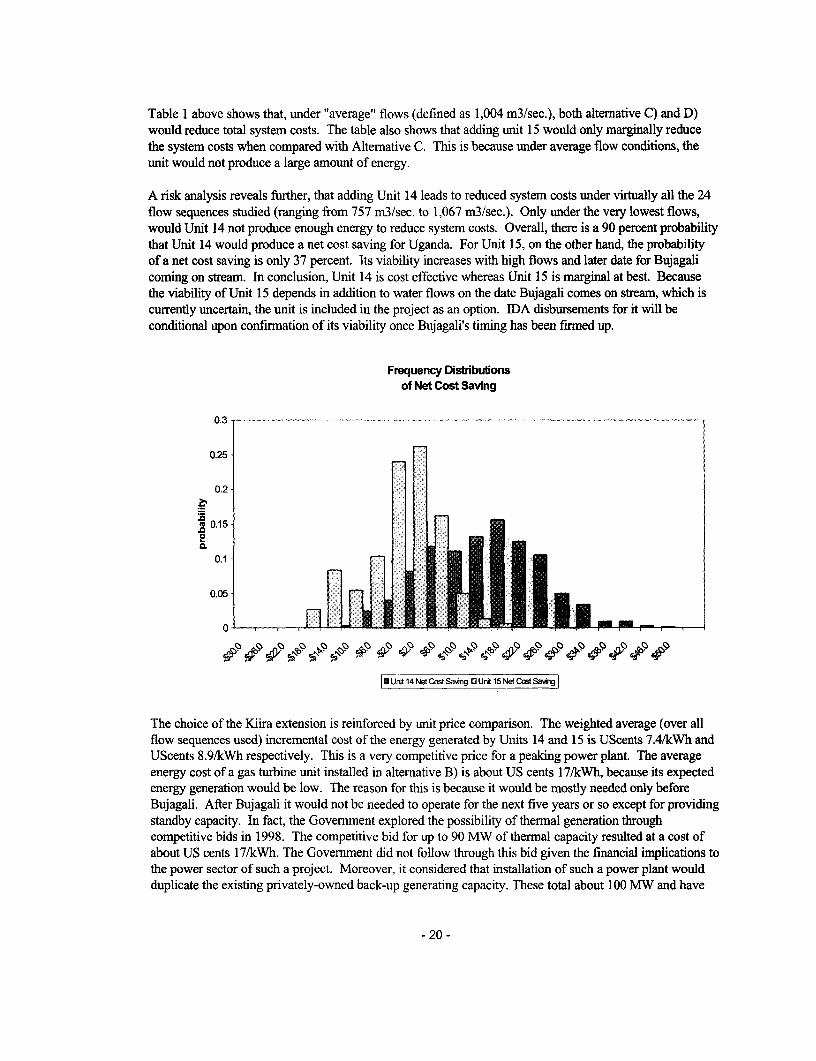
Table I above shows that, under "average" flows (defined as 1,004 m3/sec.), both alternative C) and D)would reduce total system costs. The table also shows that adding unit 15 would only marginally reducethe system costs when compared with Alternative C. This is because under average flow conditions, theunit would not produce a large amount of energy.
A risk analysis reveals further, that adding Unit 14 leads to reduced system costs under virtually all the 24flow sequences studied (ranging from 757 m3/sec. to 1,067 m3/sec.). Only under the very lowest flows,would Unit 14 not produce enough energy to reduce system costs. Overall, there is a 90 percent probabilitythat Unit 14 would produce a net cost saving for Uganda. For Unit 15, on the other hand, the probabilityof a net cost saving is only 37 percent. Its viability increases with high flows and later date for Bujagalicoming on stream. In conclusion, Unit 14 is cost effective whereas Unit 15 is marginal at best. Becausethe viability of Unit 15 depends in addition to water flows on the date Bujagali comes on stream, which iscurrently uncertain, the unit is included in the project as an option. IDA disbursements for it will beconditional upon confirmation of its viability once Bujagali's timing has been firmed up.
Frequency Distributonsof Net Cost Saving
0.3 - .. . - --. --- .
0.25
0.2
U 0.15..l.r0.1
0.1
0.05
0 4-- ~ ~0
a Unt 14 Net Cost Saving 13 Unk 15 Net Cost Sawig
The choice of the Kiira extension is reinforced by unit price comparison. The weighted average (over allflow sequences used) incremental cost of the energy generated by Units 14 and 15 is UScents 7.4/kWh andUScents 8.9/kWh respectively. This is a very competitive price for a peaking power plant. The averageenergy cost of a gas turbine unit installed in alternative B) is about US cents 17/kWh, because its expectedenergy generation would be low. The reason for this is because it would be mostly needed only beforeBujagali. After Bujagali it would not be needed to operate for the next five years or so except for providingstandby capacity. In fact, the Government explored the possibility of thermal generation throughcompetitive bids in 1998. The competitive bid for up to 90 MW of thermal capacity resulted at a cost ofabout US cents 17/kWh. The Government did not follow through this bid given the financial implications tothe power sector of such a project. Moreover, it considered that installation of such a power plant wouldduplicate the existing privately-owned back-up generating capacity. These total about 100 MW and have
- 20 -
been the source of supply for about 77 percent of the larger businesses during the shortage of grid-basedsupply.
The above analysis assumes that energy losses will decline from the high level of about 35 percent in 2000to about 25 percent by 2005, as forecast by EdF. Reduction in the level of losses is critical for the viabilityof the project. Therefore, the project includes the rehabilitation of the most critical elements of thetransmission network and the installation of a SCADA to improve the management of transmission outageswith a view of reducing their impact on the economy. In the distribution network, major loss reductionwork is best left for the future private sector concessionaire. It is expected that by the time this project isoperational in late 2003, the private concessionaire will have initiated loss reduction programs mainlythrough reduction of theft, but also some rehabilitation and extension of the network. In the meantime, theUganda Electricity Distribution Company is implementing an AfDB-fmanced loss reduction program inKampala which is expected to be completed ahead of this project in 2003.
- 21 -

2. Major related projects financed by the Bank andlor other development agencies (completed,ongoing and planned).
Latest SupervisionSector Issue Project (PSR) Ratings
____________________ ___________ ______ ________(Bank-financed projects only)Implementation Development
Bank-financed Progress (IP) Objective (DO)
Increase power generation capacity Third Power project - Credit S S2268-UG)Third Power project S SSupplemental- Credit 2268-1.(approved in January 2000)
Divestiture and reform of public Privatization and Utility Sector N/A N/Autilities Reform project (approved in
September 2000)Increase access to modem energy Rural Transfornation project
(proposed)Increase power generating capacity Bujagali Power projectthrough a private IPP (proposed)
Technical assistance for privatization Enterprise Development Project S Sand private sector development - Credit 231 5-UG
(closed in June 2000)
Other development agenciesNorway, Sweden, OECF, DFID, AfDF Cofinancing of Third Power
projectAfrican Development Fund Distribution rehabilitation &
loss reductionDFID Technical Assistance to UEB
Norway Technical assistance for powersector legal reform and to UEBand ERA, and cofinancing ofFourth Power project
Netherlands Mini-hydro
GEF/UNDP Solar PV & microfinance
Finland Feasibility study on peat powerplant
Norway and Sweden Generator and turbine for KiiraUnit 13
CDC Mini-hydro
- 22 -

NDF Cofinancing of Power II, PowerIII and the Fourth Powerproject
Japan Rural Electrification
PPIAF Rural Electrification Strategyand the Country FrameworkReport
Germany (GTZ) Legal reform of the petroleumsector
Sweden Rural electrificationIFC Rural electrificationDANIDA Transmission linesGEF/USDA KiiraAIB Transmission StudiesAFD Study on Rural ElectricityEIB Petroleum StudyIP/DO Ratings: HS (Highly Satisfactory), S (Satisfactory), U (Unsatisfactory), HU (Highly Unsatisfactory)
3. Lessons learned and reflected in the project design:
Key lessons learned in the Project Completion Report (PCR) for the Second Power project:
Lesson 1: Bank's over optimism about UEB's implementation capacity led to an unrealistictimetable for project implementation.
* Reflected in design: The project will finance assistance for project implementation, includingprocurement. Bidding documents for the project's main component and the pre-qualification of thecontractor were finalized before Board presentation.
Lesson 2: Measures to improve institutional and financial performance have to be initiatedup-front and they should be comprehensive. Weaknesses in power sector management, includinglack of autonomy and commercial orientation of UEB's operations, should have been addressed.
* Reflected in design: The Government already has initiated a comprehensive reform andprivatization program. In line with the agreed implementation plan for the privatization of thepower sector, the Government restructured and unbundled UEB before Board presentation. Amajor tariff increase was approved before the project began implementation.
Lesson 3: The Bank should have been more decisive in enforcing compliance with financialcovenants, especially the covenant requiring UEB to maintain an agreed relationship betweenaccounts receivable and its annual operating revenues.
* Reflected in design: The proposed project requires that the Government take key actionsregarding sector reform and tariffs before implementation begins. Furthermore, the commercialorientation of the power sector entities should improve with the ongoing privatization. As thepublic sector will implement the proposed project, prior to turning the operation of the system toprivate concessions, the project will focus on ensuring that an adequate public sector management,with accountability, is in place.
- 23 -

Global lessons
Three main lessons emerge from the Bank's power sector operations:
Lesson 1: Increasing private participation relieves Government budgets, improves service qualityand expands access.
* Reflected in design: The Government has successfully initiated the reform and privatization of thepower distribution and generation businesses. The proposed project will aid this privatizationthrough improving supply capacity.
Lesson 2: Implementing reform requires political commitment.
* Reflected in design: The Government has demonstrated its commitment to reform by starting theimplementation of a satisfactory Power Sector Reform and Privatization Program, including theenactment of a new Electricity Law and the unbundling of UEB.
Lesson 3: Expanding access to modern energy requires specific focus on reform design andimplementation.
e Reflected in design: The government has adopted a satisfactory commercially-oriented approachtowards rural electrification -- with the government playing the role of a market enabler. The mainelements of this strategy are: (i) level playing field for private sector participants; (ii) enablingregulatory framework; (iii) cost recovery and cost-based tariffs; and (iv) transparent subsidytransfer and financing mechanism.
4. Indications of borrower commitment and ownership:
The Government has clearly demonstrated its commitment to a coherent power sector reform strategy andto the proposed project. Uganda's very good track record for implementing the macroeconomic reformprogram, is now being followed by similar performance in utility sector reforms. The expression ofGovernment commitment at the highest level (the President) in favor of ambitious privatization, has madepossible the achievements to date. The private sector and Parliamentarians have also endorsed theprivatization process, on the condition that their concem about transparency will be addressed. The recentprivatization of Uganda Telecommunications Ltd. (UTL), with bids awarded in February 2000, gavefurther testimony of GOU's commitment to address these concems.
In the power sector, the Government has recently completed recruitment of an investment bank formarketing and closing the transactions of the generation and distribution privatization. Preparatory workfor UEB restructuring and privatization began in April 2000. Since that time the Government hascompleted the following activities:
* Inventory and valuation of UEB assets and liabilities;* Analysis of the investment needs of the power sector;* Legal and environmental due diligence work;* Preparation of pro-forma financial statement;* Creation of financial and tariff models for the successor companies and future concessions;* Drafted concession contracts, licenses, power purchase agreements and regulations required to
affect the privatization and handed-over these to the Electricity Regulatory Agency (ERA);
- 24 -

* Made recommendations on tariff adjustment and restructuring to the ERA;* Completed unbundling of UEB into three separate corporate entities;* ERA has approved a 70 percent tariff increase and improved the structure of tariffs by eliminating
cross-subsidies from industries to households.
As an indication of its commitment to the project, the Government has accelerated project preparation overthe past months. Following the appointment of UEB's new management team in the middle of 1999, thepreparation of the project's power system components picked up speed. Procurement is now well advanced.Consultants for the design and supervision of the project are in place. Contractors for the installation ofUnits 14 and 15 have been pre-qualified and bidding documents are being issued. Bids for the transmissionrehabilitation components have been received. A project manager and an environment officer have beenappointed. Finally, UEB, from its own resources, has financed a preliminary assessment of the powersector's financial position. Both implementing agencies prepared their respective draft projectimplementation plans ahead of negotiations. Similarly, MEMD has accelerated its preparation. Acompetent project coordinator is in place. MEMD is in the process of engaging a consultant to preparebidding documents for the petroleum monitoring equipment; it has drafted a training plan for the first year;prepared draft TORs for the studies included in the project; and improved its procurement filingarrangements as agreed with IDA. MEMD has also facilitated quick turn-around time on decisionsrequiring co-ordination with other Government agencies.
5. Value added of Bank support in this project:
The key value added arises from the Bank's experience in sector refonn and privatization. Bankparticipation has helped to accelerate reform. Several donors (NORAD, DflD, GTZ, SIDA, JICA, AfDB,NDF, DANIDA) have assisted the Government and the UEB in financing needed investments and providingtechnical assistance to sector reform. However, the Government needs the financial and coordinatingresources of the Bank to implement a broad based sector reform, such as the privatization of UEB. TheBank has also facilitated the adoption of an optimal power sector expansion sequence to meet demand.This is particularly important as the project is located in an international waterway. Bank involvement hasalso served as a catalyst for securing other donor financing to the project. Finally, Bank participation willincrease transparency in procurement.
E. Summary Project Analysis (Detailed assessments are in the project file, see Annex 8)
1. Economic (see Annex 4):* Cost benefit NPV=US$32 million; ERR = 20 % (see Annex 4)o Cost effectivenessO Other (specify)
A. Economic Analysis of Generating Units 14 and 15
The economic analysis for the project includes: (i) a cost-effectiveness analysis for the expansion of thepower system to bridge the electricity supply deficit in an interim period before the next major hydropowerplant is commissioned: and (ii) a cost benefits analysis to calculate the economic intemal rate of return tothe project's proposed investments.
Cost-Effectiveness Analysis
The cost-effectiveness analysis in Section D showed that the installation of Unit 14 at Kiira is the least cost
- 25 -

means of meeting demand in the interim period before the next major hydropower plant comes on stream.However, the analysis also showed that viability of Unit 15 will depend on water flows and has a 60percent probability of not being the least-cost solution. As a result, its installation should proceed only ifwater flows continue at high levels or if there is a postponement of the next major hydropower addition.Thus, the project has included this unit as an option only. The unit's actual inclusion in the project will besubject to the confirmation of the unit's economic viability towards the end of the year 200 1.
Economic Internal Rate of Return
The basis for the evaluation of the Economic Internal Rate of Return (EIRR) on the proposed generationinvestment is a comparison of the incremental economic benefits of the project with its economic costs.
Economic benefits. The analysis has valued the economic benefits in terms of incremental electricity salesthat the project will make possible relative to the lower level of sales that that would result with no newcapacity addition to the system. These incremental sales are equal to the output from the project afteradjusting it for transmission and distribution losses. Depending on water flow levels, the project canproduce up to 100 GWh per year. The value of this incremental electricity varies among different groupsof electricity users. To account for these variations, the analysis divided consumers into two groups --residential and non-residential. These two groups correspond to the categories in the electricity tariffschedule and EdF's load forecast. Currently, about 44 percent of electricity sales go to the residential usersand 56 percent to non-residential. However, EdF's load forecast estimates that the composition of sales by2010 will change to 42 percent residential and 58 percent non-residential. The economic analysis has takenthis new configuration into account. In addition to meeting domestic demand during the period before thecommissioning of the Bujagali IPP, the project would also make available surplus energy that could beexported after Bujagali begins meeting Ugandan demand. The economic analysis has added the eamings ofthese exports to the project's benefits.
Value to residential consumers. The analysis estimates the value of the incremental electricity to theresidential consumers as the area under their demand curve for electricity. Since the shape of the truedemand curve is not observable, the analysis assumed a semi-log demand function of the form: Q = A + BIn P, that passes through two points. The first point at the "upper" end of this demand curve is theprice-quantity pair of altemative energy sources. This point represents consumers willingness to pay forhigher valued uses of electricity (such as lighting). For residential consumers, this alternative energy iskerosene. The second point at the "lower" end of the demand curve is defined as the price-quantity pairdenoting the quantity of electricity that households use at UEB's marginal tariff rates. This area under thedemand curve provides an estimate of a consumer's annual economic benefit in US$. On the basis of thesebenefits and the incremental electricity demand as forecast by EdF, the analysis estimated the averagebenefit per incremental kWh served at about US$0.1 8/kWh.
Value to non-residential consumers. The value of the benefits to non-residential consumers derives from thecost that these users would incur if they had to meet their electricity needs by operating existing back-updiesel generators in their own premises. This avoided user cost is an estimate of the operating costs of themix of different sizes of diesel generators installed in Ugandan industries. The analysis estimated this costat US$0.23 per kWh.
Economic costs. The incremental costs are the difference between the power system costs with theproposed pToject investments and the system costs without these investments. The economic costs of theproposed project include: (i) investment cost in Units 14 and 15; and (ii) incremental operation andmaintenance costs. The investments in capacity that will become available before the project, as well as the
- 26 -

investment and operating cost of the Bujagali IPP are the same in both cases. The analysis expresses allcosts in end-year 2000 prices, net of taxes and duties.
EIRR. The analysis calculated the EIRR at 22 percent for unit 14 and 18 percent for unit 15. Theestimation of net present values (at 12 percent discount rate) are $16.8 million and $8.7 millionrespectively.
Sensitivity Analysis
This sensitivity analysis indicates how the EIRR would change relative to modifications in the planningassumptions and key variables. The results show that the EIRR remains robust relative to the changes inproject capital cost, export revenue, a delay in the commissioning of the project, and a 25 percent reductionin the economic value of incremental electricity consumption. In sum, all reasonable changes in keyvariables produce an acceptable EIRR for Unit 14, exceeding the 12 percent opportunity cost of capitalnecessary to justify the project for financing. However, the results also show that Unit 15 is very sensitiveto changes in the available water flow - which affects its output - and estimated benefit values.
Risk Analysis
The project is subject to a number of risks and uncertainties, which are mostly external and outside thecontrol of project design. The major risks concern: (i) hydrology; (ii) project cost estimates; (iii) exportsales; and (iv) scheduling. In addition, the timing of Bujagali would have a major impact on the project'sviability -- postponement of Bujagali increasing the EIRR. The risk analysis also considered the impact ofthe proposed Kakiira bagasse plant, which the Energy for Rural Transformation project is planning tofinance. The graph below shows the probability distribution of the expected EIRR for Units 14 and 15.
Frequency Distributionsof EIRR%
0.35
0.3
0.25
0.2 -
20.15
0.1
0.05
0% 3% 6% 9% 12% 15% 18% 21% 24% 27% 30% 33% 36% 39% 42% 45% 48% 51% 54% 57% 60%
*E Unt 14 EIRR% U UnIt 15 EIRR%)
The above probability distribution of the expected EIRR shows that the range of EIRRs for both units israther broad ranging from I percent to 32 percent for Unit 14. This broad range reflects the impact of theavailable water flow. However, the analysis indicates that the chance of the EIRR falling below 12 percentis an acceptable 5 percent for Unit 14, while it is 13 percent for Unit 15. The expected EIRRs for both
- 27 -

units are slightly higher than the EIRRs from a deterministic evaluation because the probabilitydistributions are positively skewed. The probabilities assigned to the risk variables are discussed in Annex4.
B. Economic Analysis of Transmission Rehabilitation and SCADA components
A separate cost-benefit analysis calculated the economic viability of the project's transmission rehabilitationand SCADA components. The basis for this analysis is the findings of UEB's consultants (NORPLAN),who studied the rehabilitation requirements of the transmission system. The project includes thoseinvestments that the consultants and UEB identified to be the most critical for improving the system'sreliability and reducing losses.
Rehabilitation of Grid Substations
The major benefits of the rehabilitation of the transmission substations are: reduction of serviceinterruptions (system outages) to improve the reliability and stability of the power system; and theincreased capacity of the substations to meet increasing demand.
Installation of SCADA
The main benefits of extending the SCADA system are: the reduction in energy lost during outage as aresult of faster fault identification and restoration of supply; and the reduction of the cost of operating thepower system as a result from a shift from manual to automatic operation. Over the longer term, theSCADA system could incorporate an Energy Management System (EMS) that would further enhanceperformance and facilitate the monitoring of spot prices in a deregulated power market. The design of thesystem that the project will install, will enable such future extension.
Rehabilitation of the Nalubaale Switchyard
The work at Nalubaale will consist of replacement of old circuit breakers and transformers. All thisequipment is about 46 years old and past its expected average economic life of 25 years. The poorcondition of the transformers, which use an inefficient water cooling system, is exacerbated by the fact thatthey have been overloaded since the Nalubaale generators were upgraded from 15 MW to 18 MW in themiddle of the 1 990s. The main benefit of the rehabilitation is the avoidance of loss of supply due to afaulty transformer or a circuit breaker.
The worst case scenario would be that of a circuit breaker failing to open on a fault and resulting incascaded tripping of other generators and subsequent black-out. Whereas the length of time it would taketo restore supply after a black-out is known, it is difficult to determine a reasonable probability of for theblack-out. The analysis, therefore, considers a scenario where two of the 10 old transformers fail over aperiod of 5 years within the next 10 years. This is an optimistic scenario, considering the age of the unitsand the poor condition they are in, and it would not be unreasonable to expect more of them to fail. Shoulda transformer develop an winding fault, it would take at least 6 months to get a replacement.
The estimated EIRRs for the three components are:
Component: EIRR
Rehabilitation of grid substations: 15%
- 28 -

Extension of SCADA: 15%
Rehabilitation of Nalubaale switchyard: 13%
2. Financial (see Annex 4 and Annex 5):NPV=US$ -11 million; FRR = 8 % (see Annex 4)
The NPV is calculated at 12 percent discount.
Financial Aspects of Power Sector
Past Financial Performance (1996-2000). The UEB has had difficulty raising enough funds to: Cover itsoperation and maintenance costs; meet its debt service requirements; and make a reasonable contribution toits investment program. As a result, the company has deferred the maintenance of its investment capitaland system losses have remained high. UJEB also suffered from revenue shortfalls due to poor collectionrates and inefficient operations.
The Government took decisive action when it recruited a new management team with private sectorexperience and a more commercially-oriented focus. It replaced five key management positions at UEBwith external experienced staff, including the Managing Director who was appointed in April 1999. Thisteam has made significant improvements to UEB's operational and financial perfornance. Itsachievements during the past eighteen months include:
* Increased domestic cash collection by about 40 percent from USh 61.7 billion in 1998 to USh 86.7billion in 2000;
* Increased billing for domestic consumption of about 33 percent, from Ush 73 billion in 1998 toUsh 97 billion in 2000. Average domestic revenue per kWh in US dollar terms, however, declinedbetween 1998 and June 2001 by 23 percent, to 5.2USc/kWh at present due to the depreciation ofthe Uganda Shilling vis-a -vis the US Dollar. The average revenue increased to about 9.5Usc/kWh, the June 1, 2001 tariff increase;
- Reduced network losses from 35% to about 33%, as a result of meter audits and installation of animproved billing system;
* Reduced administration and overhead expenses;* Retrenched 1,100 staff; and* Increased debt service payments to the Government from UShl.5 billion in 1999 to USh7.4 billion
in 2000.
The above improvements are commendable. Yet, UEB receives no compensation for approximately 40percent of the energy it sends out to the domestic market, due to system losses, uncollectible bills, illegalconnections, etc.. Thus, Power sector management still faces considerable challenges, such as: (i)reducing high total system losses; (ii) meeting the significant investment for the network, especially fordistribution facilities to expand access to new consumers; (iii) further improving cash collection for energyconsumption to reach an optimum target of about 98 percent; and (iv) reducing accounts receivable to amore economic level of 45 days of annual billing (which is 145 days at present). Table 4.1 belowillustrates the power sector's performance from 1998 to 2000.
- 29 -

Table 4.1 Historical Power Sector Performance
Key Operational Data 1998 1999 2000(provisional)
Total units sent out (GWh) 1,241 1354 1,570Units sent out to Uganda (GWh) 1,072 1.169 1,338Export sales (GWh) 159 174 218
Energy billed in Uganda (GWh) 706 702 877
System losses (% of sent out) 30% 35% 30%Billed as % of units sent out to Uganda 66% 60% 66%Cash collected as % of Uganda billing 85% 86% 89%
Total Electricity Revenue (USh bn) 76.0 84.6 109.4Domestic Electricity Revenue (USh bn) 62.3 65.5 83.3Ave. domestic revenue (USh/kWh) 88.3 93.3 95.0Ave. domestic revenue (USc/kWh) 6.8 6.4 5.7
No of billed customers 155,612 164,225 177,000No of employees 2,028 2,025 1,837Customers per employee 77 81 96Return on revalued fixed assets -4.0% 6.3% 5.6%
Power Sector Reform and Financial Policies. In accordance with the Government's power sector reformstrategy, in April 2001, the Government divided UEB into three autonomous operating companies -generation, transmission and distribution. While the Government plans to own and operate thetransmission company, it will turn over the distribution and generation businesses to private sectoroperators who will operate them as concessions and also take responsibility for making new systeminvestments. The Government will call for bids to establish distribution and generation concessions in June2001. The selection of the winning bidders should take place by November 2001, with the takeoverstargeted for early 2002.
The proposed project will begin implementation before the completion of the concession arrangements.Until that time, UEB's successor companies will continue to operate on a consolidated basis. Thus, thisfinancial analysis and projections for the power sector serve mainly as a proxy for the sector's expectedoverall financial performance. It takes into account the proposed restructuring of UEB's debt, which theGovernment has allocated the three successor companies. The analysis also accounts for: anticipatedefficiency improvements from private sector operation of the distribution business; an expected increase incustomer connection rates; planned tariff increases; and the introduction of dividends and price-indexedvaluation of fixed assets resulting from the concessioning of distribution and generation.
In accordance with its power sector restructuring program and as a basis for proceeding with the proposedproject, the Borrower made commitments with regard to the following three issues: increasing tariff levels;adopting an automatic tariff adjustment mechanism to account for inflation and exchange rate movements;and setting up a satisfactory mechanism to ensure that Government agencies and parastatals remain currentin their bills for electricity consumption. Progress to date has been adequate and the Borrower has
- 30 -

delivered the following:
* ERA has approved a 70 percent increase in the average level of the retail tariff;* ERA has approved the establishment of an automatic tariff adjustment mechanism to ensure that
the retail electricity tariff will not erode due to the effects of inflation and exchange ratemovements;
* One of UEB's largest debtors, the National Water and Sewerage Corporation, has settled itselectricity arrears and is now current in its payments; and
* The Government has made progress in settling the electficity arrears of Government entities:
-The Treasury has improved the performance of releases against budget estimates in thepresent financial year. In past years, the value of funds the Treasury released to Governmentdepartments often fell short of their budgets for electricity consumption. As of end March2001, the Treasury had released 75 percent of the budget estimates of electricity supply for theyear. Government is therefore on track to achieve a 100 percent performance of releasesagainst budget estimate for electricity supply for fiscal year 2000/2001;-Since June 1999 the Government has operated a 'commnitment control system', meaning thatGovernnent departments are not permitted to reallocate funds budgeted for electricity supplyto other expenditures. The improved performance in releases and the commitment controlsystem together are significant progress towards ensuring that new arrears do not accrue infiscal year 2000/2001.-The Government has agreed to settle all outstanding arrears for the fiscal year 1999/2000before the end of June 2001, and prepare an action plan to ensure that Government agenciesstay current in their electricity payments even beyond fiscal year 2000/2001.
Future Prospects. The financial analysis indicates that a 40 percent increase in the average retail tariff bymid-2001 is the minimum necessary to ensure the financial sustainability of the sector (this assumes somerestructuring of UEB's debt). Tariffs, however, will need to increase further over the next couple of yearsto ensure that sector entities are in a position to: (i) meet their increasing debt service obligations; (ii) payfor the power purchase costs of the proposed Bujagali hydropower project and other IPPs; (iii) financefrom their own resources a reasonable proportion of investment needs; and (iv) provide adequate returns toshareholders. On June 1, 2001, ERA approved a 70 percent increase to tariffs. This increase assumed norestructuring at the power sector's debt.
In order to ensure the financial viability of the power sector for the sustainability of the project, thefinancial analysis used the following financial targets to determine the sector's revenue requirements:
* Debt service coverage of 1.0 times in 2001 and 1.3 times from 2002 onwards of net operatingrevenue before depreciation; and
* A current ratio of 1.0 times in 2001 and 1.2 times from 2002 onwards.
The table below summarizes the resulting projections for the years 2001-06.
Table 4.2 Projected Financial Indicators (in nominal terms)
Key Operational and Financial 2001 2002 2003 2004 2005 2006IndicatorsTotal units sent out (GWh) 1,591 1,679 1,831 1,926 2,127 2,989
- 31 -

Units sent out to Uganda (GWh) 1,463 1,553 1,705 1,800 1,939 2,308Export sales (GWh) 121 121 121 121 180 653Energy billed in Uganda (GWh) 1,005 1,091 1,226 1,324 1,444 1,672
System losses (% of sent out) 29.2% 27.8% 26.4% 25.0% 23.6% 22.2%
Total Elec. Revenue (US$ mn) 70.4 86.9 99.0 120.8 143.8 220.5Domestic Elec. Revenue (US$ nf) 62.9 79.4 91.4 113.3 132.9 175.8Ave. domestic revenue (USc/kWh) 6.3 7.3 7.5 8.6 9.2 10.5
No. of billed customers (000) 189 204 219 234 249 264No. of employees 1,777 1,792 1,807 1,822 1,837 1,852Customers per employee 106 114 121 128 136 143Days' receivable - domestic 80 60 45 45 45 45Return on revalued fixed assets 4.5% 5.8% 6.8% 8.8% 9.7% 7.7%Current ratio 1.7 1.3 1.2 1.2 1.2 1.3Debt/equity ratio 48% 49% 48% 45% 41% 38%
These financial projections indicate the likely financial performance of the sector overall, and the requiredminimum retail tariff levels under a set of specific assumptions (Annex 5). ERA is determining the bulktariffs for generation and transmission, based on the allocation of UEB's assets and liabilities amongst itssuccessor companies. The ongoing financial restructuring of the power sector's existing debt portfolio willplay a key role in determining the revenue requirements of the new generation, transmission, anddistribution companies and thus, the required bulk tariffs for generation and transmission and retail tariffsfor distribution. Following the transfer of UEB's assets and liabilities and the conclusion of the concessionarrangements for the distribution and generation facilities, the Govermment, ERA, and IDA will review andrevise the above financial viability targets, as appropriate. The focus will be on ensuring that these targetsconform with: the sector structure; the contractual agreements entered into with generation and distributionconcessionaires; and with the efficiency and other financial targets that the Government will establish forthem.
On-lending of the IDA Credit
The Government will on-lend US $49 million of the proposed IDA Credit to the Uganda ElectricityGeneration Company Ltd. (GENCO) The on-lent loan will be at 7.1 percent interest for a period of 15years including 3 years grace. GENCO will bear the foreign exchange risk.
Fiscal Impact:
The fiscal impact of the project is positive. The Government would receive increased revenue mainly from:
* The VAT on additional electricity sales revenue earned by the power entities during the lifetime ofthe project;
* Additional interest revenue and earlier repayments to the Government by the Generation andTransmission Companies of loans from IDA, NDF, and NORAD for the Fourti Power Project;and
* Additional Corporate taxes.
- 32 -

The Net Present Value (at 12 percent discount rate) of the increased fiscal intake resulting from the projectis about $36 million.
Fiscal Impact of Fourth Power project
Revenue Accruing to GovemmentUSS million (in 2001 prices) Calendar years
Additional Tax Revenue Accruing to Govt. 2001 2002 2003 2004 2005 2006 2007 2008 2011 2030 2052
VAT on Additional Revenue 0.0 0.0 0.2 1.1 1.2 0.0 0.0 0.0 1.2 1.2 1.2
VAT on O&M Costs 0.0 0.0 -0.2 -0.4 -0.4 -0.4 -0.4 -0.4 -0.4 -0.4 -0.4
Import Duties on Units 14 & 15 0.0 0.0 0.0 0.0 0.0 0.0 0.0 0.0 0.0 0.0 0.0
Corporate Tax 0.0 0.0 0.0 0.0 0.0 0.0 0.0 0.0 0.0 1.2 1.2
Total Taxes due to Govt. 0.0 0.0 0.0 0.8 0.8 -0.4 -0.4 -0.4 0.9 2.1 2.1
Debt Service - Net Additional Revenue
Commitment Fee payable by Govt -0.3 -0.1 0.0 0.0 0.0 0.0 0.0 0.0 0.0 0.0 0.0
Service Charge payable by Govt 0.0 -0.2 -0.3 -0.5 -0.5 -0.5 -0.5 -0.5 -0.5 -0.2 -0.2
Interest payable by Govt 0.0 0.0 0.0 0.0 0.0 0.0 0.0 0.0 0.0 0.0 0.0Interest payable by Utility 0.0 0.0 0.0 4.2 4.1 3.9 3.5 3.1 2.1 0.0 0.0
Capital Repayment by Govt (starting 2011) 0.0 0.0 0.0 0.0 0.0 0.0 0.0 0.0 -2.0 -2.0 -2.0
Capital Repayment by Utility (starting 2004) 0.0 0.0 0.0 5.1 5.1 5.1 5.1 5.1 5.1 0.0 0.0
Net Debt Service Revenue to Govt. -0.3 -0.3 -0.4 8.8 8.7 8.5 8.1 7.7 4.6 -2.2 -2.2
Total Net Revenue Accruing to Govt. -0.3 -0.3 -0.4 9.6 9.5 8.1 7.7 7.4 5.5 -0.1 -0.1
Discount Rate 12%
Net Present Value (NPV) of Cash Flows $ 35.8
3. Technical:
The proposed investments under the project are technically sound and their implementation will pose nounusual demands on the staff or contractors of the power entities. The components do not involve anyunusual or unproven technologies. The project consists of extensions and improvements to existing, similarsystems, which UEB and its contractors have installed. The equipment that the project will procure and therelated installation are up to international standards. The specifications for procurement reflect thesestandards. UEB and MEWD prepared the proposed project, in consultation with external consultants withfinancing under the proposed project's PPF and the Third Power project. Bank staff have reviewed thecomponents and are satisfied that they will contribute to the achievement of the project's objectives.
4. Institutional:
Major institutional issues concern: (i) the overall project management capability of the power sectorentities, given recent unbundling of the sector into three separate comt.mies and the forthcorningconcessioning of the generation and distribution facilities; (ii) the project management capability of MEMDin light of its shifting role in the reform process and its involvement in the implementation of several
- 33 -
projects; (iii) the effectiveness of the ERA; and (iv) the Government's management of the reform andprivatization process.
* UEB has satisfactory project management and financial management and accounting practices inplace. The detailed project implementation arrangements are set out in the project's implementationplan. In addition, the GENCO and TRANSCO will enter into a contract with UEB for projectmanagement that will specify the implementation arrangements, including staffing. The Bank andthe Borrower do not expect the concession arrangement to affect the physical implementation of theproject;
* Following the ongoing implementation of the regulatory framework, which the Electricity Act of1999 stipulates, MEMD's focus is shifting towards the purely policy making functions. Thistransition, combined with work on sector reform and the preparation of several investment projectscould possibly divert the Ministry's attention away from project implementation. As a safeguard,the Bank and the Borrower have agreed on detailed arrangements for the Ministry's participation inthe project. These arrangements are available in the MEMD's project implementation plan. Also,a dedicated project manager will oversee its execution;
* The Electricity Act of 1999 also provided for the establishment of an autonomous power sectorregulator -- the ERA. The Government established the ERA in April 2000; the next step is tomake it fully functional. This will include: Providing it with the required financial support andautonomy; enabling it to staff itself appropriately; and providing it with expert advice fordeveloping its conduct of business regulations, tariff and revenue methodologies, licensingarrangements, and other elements of regulation. The project will provide support to theseobjectives through technical assistance and training; and
v A main challenge is of course the Government's management for the reform and privatization of thepower sector. The key issue is whether the process proceeds without major delays or set-backs.To keep the process well-organized and coordinated, the amendment to the PERD Statute sets fortha clear institutional framework and implementation arrangements for privatization. It clarifies theinstitutional responsibility for privatization among the Minister of State responsible forPrivatization, line Ministers, such as the MEMD, and DRIC. Accordingly, the Minister of Stateresponsible for Privatization, under the MFPED, will assume full responsibility and accountabilityfor the privatization and utility sector reform program. The Government has streamlined the role ofDRIC to that of advising the MFPED and approving policies for the reform and privatization ofthe public enterprise sector.
4.1 Executing agencies:
The executing agencies for the proposed project will be the two power entities that own and operate thepower system of Uganda, GENCO and TRANSCO. The UEB Statutory Corporation will assist in theimplementation ofGENCO and TRANSCO components. In addition, MEMD and the new power sector regulatory agency(ERA) would receive technical assistance under the project.
Uganda Electricity Generation Company Ltd. (GENCO): Became a corporation with limited liabilityunder the Uganda Companies Act on March 26, 2001. The Government has full ownership of thecompany. A Board of Directors supervises the company and the Government appoints the Board'smembers. The Chairman of the Board of Directors is an Associate Dean at the Makerere University.
The GENCO has three departments: Technical Services, Operations and Maintenance, and Finance andAdministration. The heads of these departments report to the General Manager, who in turn reports to theBoard of Directors. The Operation and Maintenance Department operates Uganda's two existing
- 34 -
hydropower plants (Nalubaale and Kiira on the Nile river). The GENCO has a total staff of 201.
Uganda Transmission Company Ltd. (TRANSCO): This company incorporated with limited liabilityunder the Uganda Companies Act on March 26, 2001, as one of the successor companies to UEB. TheGovernment has full ownership of the company and selects the members of the company's Board ofDirectors. The Chairman of the Management Board is from the private sector. The Company has fivedepartments: Finance and Administration, Secretariat, Operation and Maintenance, Transmission Systems,and Audit. The heads of these departments report to the General Manager, who in turn reports to the Boardof Directors. The Company operates the national grid at voltage 33 kV and above, including the SCADAsystem. It has a total staff of 253.
IJEB Statutory Corporation: A Board of Directors consisting of Government-appointed memberssupervises UEB. The Chairman of the Board is from the private sector. UEB has 55 employees. TheCompany owns isolated diesel generation and distribution systems and manages the implementation ofpublic power projects, including the proposed project. UEB will act as Project Manager for the project onbehalf of GENCO and TRANSCO. By retaining UEB as the sole manager of public power projects, theGovernnent wants to ensure that the Government's interests in these projects are looked after in aconsistent manner. This arrangement also results in resource savings.
Ministry of Energy and Mineral Development (MEMD): MEMD is responsible for the promotion,development, strategic management, and the safeguarding of rational and sustainable utilization of energyand mineral resources for the social and economic development of the country.
The Ministry has one Directorate consisting of the departments of Energy Resources, PetroleumExploration and Production, and Geological Surveys and Mines. Kilembe Mines, Uganda ElectricityGeneration Company Ltd, Uganda Electricity Transmission Company Ltd., Uganda Electricity DistributionCompany Ltd., and Uganda Electricity Statutory Company, all operate under the auspices of the Ministry.
The Electricity Regulatory Authority (ERA) is an autonomous and independent body. Its administrativehead is a Chairman. In addition to the Chairman, it has a Board of four members. The Ministerresponsible for Energy selects the Board members among the nominations made by Cabinet Ministers. TheElectricity Act 1999 stipulates the professional qualifications of the members.
4.2 Project management:
UEB will manage the project's power system expansion and rehabilitation components. The PIU located inUEB has been in charge of the ongoing Third Power project for six years. This Unit has receivedinstitutional support from the Fourth Power project and now includes a Project Manager, ProcurementExpert/Project Coordinator, Accountant, and an Environmental Officer. The Bank and the Governmenthave agreed on the terms of reference for the implementation team for the proposed project. The recentlyrecruited Project Manager has solid international experience making him well-placed to lead the Unit. Theproject will finance the Project Manager, the Environmental Officer and assistance in constructionsupervision. In light of the implementation experience of the Third Power Project these arrangements areadequate for the proposed project.
To ensure effective implementation of the environmental monitoring plan, UEB has hired an EnvironmentOfficer, who reported on duty on June 1, 2001. This officer will be located at the project site and be amember of the PIU with the responsibility for the implementation of the monitoring plan, including thepreparation of quarterly reports of the monitoring activities. The Officer will cooperate with NEMA,FIRRI, DWD, and local authorities. The Officer will monitor the implementation of the decommissioning
- 35 -

plan as well as the mitigation measures originally planned under the Third Power project. This officer alsowill be responsible for disseminating relevant information on HIV/AIDS and raise the awareness of theseissues among the workers employed by the project.
In addition, the main contractor will take over the Health Clinic that the Third Power project is providing.The contractor will employ appropriate personnel to staff it and provide HIV-AIDS prevention informationand facilities, as well as disseminate relevant information on all sexually transmitted diseases (STDs).
UEB: Project Implementation Unit
Managing Director ]
Project Manager Project CoordinatorFourth Power POther rojects
I Env nronnsentalOfcer | ProjectAccountant … - - - -------
Accounts Clerk
FitingwAdministcation
MEMD's project implementation capacity is limited, although it has experience implementing IDA'sSecond and Third Power Projects. For the proposed project, MEMD has assigned the AssistantConmnissioner for Energy Efficiency to head the Ministry's Project Implementation Team. He will reportdirectly to the Permanent Secretary for Energy through the Commissioner of Energy and receive supportfrom an assistant coordinator with the Petroleum Division. The MEMD is in the process of appointing aproject accountant. The Bank and Borrower have agreed that appointment of the accountant would be acondition of Credit Effectiveness. The Bank and the Borrower agreed on the TORs for the ImplementationTeam at negotiations. During preparation, MEMD's ownership of the project has been high andpreparation progress satisfactory. These institutional arrangements are considered satisfactory, especiallygiven that MEMD will be executing only a small part of the proposed project (3.6 %). The implementationof the Water Management Study will take place in close collaboration with the Ministry of Water andNatural Resources.
- 36 -

ME MD Project Im p lem entation Team
(A4c3PoutrItig
o~~~~~~~~~~~~~~m: 0Ii r .tII
ProjectCo ordinator
PetroleumWae tPocC n poned SPnior Acnolntant Mh asgement freod-epig upotent oordy p
c~~~oordinator soo atrapasladwrisudratostuadectdflInsytmfrhepoct
Accountanti
4.3 Procurement issues:
In accordance with IDA procedures, a fortnal assessment of the procurement capacity and systems of theUEB and the MEMD took place during the pre-appraisal mission for the proposed project. The assessmentconcluded that UEB has the organizational and staff capacity to handle procurement following World Bankguidelines and procedures. However, UEB's main weakness has been the lack of a good record keepingsystem, both at the project site (where the Project Manager will be based) and at the Head Offace (wherethe Project Coordinator and Project Accountant will be based). The assessment found MEMD's capacityto be weaker; consequently the Bank and the Borrower agreed on measures to strengthen its capacitythough: the training of staff, both locally and within the region at ESAMI in Tanzania; improvement ofrecord-keeping; and appointment of a dedicated project coordinator. The Borrower appointed thisdoordinator soon after compani Howeverway to set up a dedicated filing system for the project.Both organizations have previous experience with procurement under IDA-financed projects. In addition,both UEB and MEMD will receive assistance from consultants in the major procurement matters.
ahis assessment still stands after the unbundling of UEB, because UEB's existing Project Implementationnit will execute the procurement for the power investment components.
4.4 Financial management issues:
5he financial management arrangements currently in place for projects managed by UEB and MEMD aresufficient to comply with minimum IDA requirements. However, they are not yet adequate to provide, withreasonable assurance, accurate and timely information on the status of the proposed project as required bythe IDA for PMR-based disbursements. The appraisal mission for the proposed project's prepared a planof actions necessary for compliance. The Bank and the Borrower agreed on this plan during negotiationsand its implemnentation is progressing satisfactorily. Annex 5 provides details of the Financial ManagementAssessment. This assessment was carried out on the Uganda Electricity Board, which has recently beendivided into three different companies. However, since the implementing agencies for the project (GENCOand TRANSCO) will contract UEB to manage the project, including its financial management aspects, theabove assessment is still valid.
5. Environmental: Environmental Category: B (Partial Assessment)5.1 Summarize the steps undertaken for environmental assessment and EMP preparafion (includingconsultation and disclosure) and the significant issues and their treatment emerging from this analysis.
The Government completed an Enviromnmental Analysis (EA) for the project in April/May 1999 in
- 37 -

consultation with stakeholders. In June 2000, a Bank pre-appraisal mission visited the project area. Themission met with Govermment officials and environmental groups to discuss the content of the EA and anEnvironmental Monitoring Plan. The findings of this pre-appraisal mission have been incorporated into thefinal EA report dated August 31, 2000.
The pre-appraisal mission confirmed the main finding of the EA -- that the project would not have anymajor environmental impacts because it did not involve the construction of new structures. The proposedproject would install two generating units in an existing power house. There were some initialenvironmental concems related to the proposed Project. These included: (i) mosquito breeding; and (ii)uncontrolled future growth of the water hyacinth, which could impair water discharges. However, theBank mission concluded that these potential threats would not materialize for several reasons. First, theproposed project will install the generating units in two existing bays, which are currently covered by steelplates. Thus, there will be no open construction pits that could lead to mosquito breeding. Second, at thetime of the pre-appraisal mission, UEB had almost eliminated the water hyacinth in the project area,through mechanical removal, and had put in place adequate safeguards to prevent its future growth. Thesesafeguards include: (i) water hyacinth harvesting equipment at the power station; (ii) construction of aconcrete-surfaced road at Rippon Falls (upstream of the Kiira power station) for safe removal of the wetwater hyacinth by truck; (iii) installation of a water hyacinth boom in Rippon Falls; (iv) a safety boom atthe entrance of the power canal; and (v) a floating boom before the Kiira power station intake structures.
The project will not involve resettlement or cultural heritage issues.
The only environmental mitigation measure required under the project is a decommissioning plan for theproject (including restoration of the project area) based on an environmental audit. The preparation andimplementation of the decommissioning will take place at the end of the project. Such a plan is arequirement under Ugandan law. It will involve the removal of temporary infrastructure such as sewagelines, electricity lines, buildings, construction materials, used oils etc.. The scope of the decommissioningplan will depend on the amount of temporary infrastructure from the Third Power Project to the proposedFourth Power Project. The scope of the deconmmissioning will become clearer towards the end of the ThirdPower Project. Transferring the use of facilities from the Third Power to the Fourth Power Project willeliminate any negative environmental impacts due to the demobilization and remobilization of constructioncontractors to the site, and minimize the risks associated with construction and rehabilitation services.
5.2 What are the main features of the EMP and are they adequate?
An Environmental Management Plan (EMP) is not required for the project, since the EA report hasindicated that the installation of the two generating units would not have negative environmental impacts.However, the project will include an Environmental Monitoring Plan as well as related capacity-building.The EnvironmentalMonitoring Plan will focus on water quantity and quality, the biology and ecology of fish populations, siltaccumulation and its removal, and shoreline stability. The plan will thus address the issue of vulnerabilityof Lake Victoria to fish processing factories along its shorelines, the number of which may increase as aresult of the improved power supply from the project. The plan will also monitor the implementation of thedecommissioning plan. To the extent necessary, the Environmental Monitoring Plan will include mitigationmeasures related to the Third Power Project (landscaping downstream of the old dam, and buttressing ofthe old dam upstream). This plan is adequate to ensure effective implementation and build enviromnentalmonitoring capacity under the proposed project.
5.3 For Category A and B projects, timeline and status of EA:Date of receipt of final draft: September 2000
- 38 -

5.4 How have stakeholders been consulted at the stage of (a) environmental screening and (b) draft EAreport on the environmental impacts and proposed environment management plan? Describe mechanismsof consultation that were used and which groups were consulted?
The Government conducted the EA in consultation with the officers of UEB and relevant authorities in thepublic and private sector such as the Ministry of Water, Lands and Environment, Kampala; the FisheriesResources Research Institute (FIRRI in Jinja), Enviro & Industrial Consult (U) Ltd., Makerere University,the Assistant Commissioner, Survey and Mapping Division in Entebbe, and the National EnvironmentManagement Agency (NEMA).
The pre-appraisal mission met with representatives of UEB, NEMA, FIRRI and the Water ResourcesDepartment (WRD). In the development of the Environmental Monitoring Plan there was cooperation withNEMA based on the discussions with the stakeholders.
5.5 What mechanisms have been established to monitor and evaluate the impact of the project on theenvironment? Do the indicators reflect the objectives and results of the EMP?
UEB will be responsible for implementing the Environmental Monitoring Plan. To do this effectively, it hashired an Environmental Officer to be responsible for this activity. NEMA will exercise oversight of theimplementation as required by Ugandan law. The Environmental Management Plan, attached to the EAReport, gives detailed parameters for the monitoring of water quantity and quality, fish populations etc..These indicators, discussed with NEMA, reflect the objectives and desired outcomes of the plan, namelysafe and reliable power production at Kiira.
6. Social:6.1 Summarize key social issues relevant to the project objectives, and specify the project's socialdevelopment outcomes.
* Improving the quality of electricity supply and expanding the access to a greater number of peoplein Uganda;
a Restraining the rapid expansion of small, expensive and inefficient diesel generator use byindustries and businesses; and
3 Contributing to the reduction of poverty by removing one of the most significant obstacles toprivate sector development -- limited and unreliable electricity supply.
6.2 Participatory Approach: How are key stakeholders participating in the project?
Government: UEB and MEMD prepared the proposed project. Also, from the outset, there have beenconsultations among UEB, the Ministry of Energy and Mineral Development, the Ministry of Finance andPlanning and the Ministry of Water, Lands and Environment during the preparatory work in order toensure effective participation.
Private Sector: The proposed Project's preparation included a survey of 243 randomly selected privateenterprises in 1998. The sample is representative for 5 major economic sectors: Commercial agriculture,agro-processing, manufacturing, tourism, and construction. The survey identified inadequateinfrastructure, particularly the shortage of power, as the leading constraint to the expansion of privatesector investment in the economy. The survey's results led to the acceleration of the proposed project. TheUganda Chamber of Commerce and the Uganda Manufacturers' Association have been consulted on theproject.
- 39 -

Various public and private stakeholders reviewed the new Electricity Act. The Government has taken theircomments into consideration in finalizing the Act. There have been other consultations with a variety ofgroups, including potential private investors. The first investor conference took place in Kampala in June2000 and a second one in London in October 2000.
Parliament and Civil Society: In April 1998, the Government organized a seminar on privatization formembers of Parliament as well as journalists and civil society to heighten their awareness of the process.The design of the privatization process has taken account of this seminar's proceedings. In late 1998,following concerns about the integrity, transparency and efficiency of the privatization program, theParliament launched comprehensive investigations. The findings of these investigations led to substantialinstitutional reforms. The Parliament's collaboration was also essential to pass the relevant legislation.
Environmental Agencies: The Fisheries Resources Research Institute, the Enviro & Industrial Consult(U) Ltd., Makerere University, the Assistant Commissioner, Survey and Mapping Division in Entebbe, theWater Resources Department and the National Environment Management Authority (NEMA) have beenconsulted on the project. Their proposals have been included in the design.
Labor Unions: The Government has briefed the representatives of the labor unions and a Member ofParliament for Workers on the sector reform and UEB's privatization. It has consulted with them on thepotential impact of the process on workers. Two key recommendations emerged: (i) the need to informworkers of individual Public Enterprises early in the divestiture process and to keep them informedthroughout; and (ii) the need for fair and prompt payment of retrenchment benefits and severance to thoseworkers whose positions become "redundant" as a result of the process. The Utility Reform andPrivatization Project will address these concerns through its comprehensive communications program andthrough the policy, guidelines and financing of retrenchment benefits.
Other Donors: During the preparation of the proposed project, the Bank and the Borrower have consultedwith donors supporting Uganda's power sector programs. NORAD and NDF are co-financing the project.NORAD has already approved a credit for the project and NDF has scheduled the Board presentation ofits credit to July 12, 2001.
6.3 How does the project involve consultations or collaboration with NGOs or other civil societyorganizations?
The MEMD will carry out surveys of electricity consumers to follow-up on the project's developmentimpact (the project provides financing for these surveys). IDA and MEMD will consult with stakeholderorganizations during supervision missions. The co-financiers have agreed to participate in joint supervisionmissions with IDA, as often as practical.
6.4 What institutional arrangements have been provided to ensure the project achieves its socialdevelopment outcomes?
N/A.
6.5 How will the project monitor performance in terms of social development outcomes?
It will carry out surveys of electricity consumers.
7. Safeguard Policies:7.1 Do any of the following safeguard policies apply to the project?
Policy Applicability
- 40 -

Environmental Assessment (OP 4.01, BP 4.01, GP 4.01) 0 Yes 0 NoNatural habitats (OP 4.04, BP 4.04, GP 4.04) 0 Yes 0 NoForestry (OP 436, GP 4.36) 0 Yes * NoPest Management (OP 4.09) 0 Yes 0 No
Cultural Property (OPN 11.03) 0 Yes * NoIndigenous Peoples (OD 4.20) 0 Yes * NoInvoluntary Resettlement (OD 4.30) 0 Yes * NoSafety of Dams (OP 4.37, BP 4.37) * Yes 0 NoProjects in International Waters (OP 7.50, BP 7.50, GP 7.50) * Yes 0 NoProjects in Disputed Areas (OP 7.60, BP 7.60, GP 7.60) 0 Yes * No
7.2 Describe provisions made by the project to ensure compliance with applicable safeguard policies.
Environmental Assessment: The Governnent has completed the EA and has developed an environmentalmonitoring plan to be financed under the proposed project.
Safety of Dams. Strengthening of the old Nalubaale dam (formerly Owen Falls) is in progress under theongoing Third Power Project. The Government awarded a contract to remedy the possible problems withthe 1954 dam in April 2000. Work is on schedule for completion of the work in July 2001. The workconsists of: (i) constructing a Roller Compacted Concrete (RCC) prop on the downstream side of the dam,to counteract uplift forces; (ii) sealing the upstream section of the dam to reduce water sippage; and (iii)drilling drainage holes. In addition, GENCO has an emergency preparedness plan in place for theNalubaale and Kiira dams. Finally, a consultant employed by GENCO monitors the condition of civilworks of the Nalubaale power plant, in particular the dam and powerhouse.
Projects in International Waters. In line with the cooperative spirit of the Nile Basin Initiative, theGovermment, through the Bank, notified the Executive Directors representing the riparian countries of theproject on August 14, 2000. The Initiative, launched in February 1999, includes 10 Nile riparian countries(Burundi, Democratic Republic of Congo, Egypt, Eritrea, Ethiopia, Kenya, Rwanda, Sudan, Tanzania, andUganda). None of the above parties has objected to the proposed project.
F. Sustainability and Risks
1. Sustainability:
The proposed investments will only be sustainable if the performance of the power sector improves. Thisimproved performance requires sector reformn to ensure that the power sector entities operate according tosound business principles. The proposed project is part of the Government's overall power sector reformstrategy. The Bank's CAS aims to help the Government implement the reforms and promote privateinvestment that will ensure a sound financial basis for the power sector. In line with this strategy, theprocess of privatizing UEB's distribution business and generation has started.
2. Critical Risks (reflecting the failure of critical assumptions found in the fourth column of Annex 1):
Risk Risk Ratina Risk Mitigation MeasureFrom Outputs to Objective
41 -

Delays in the implementation of sector M Strengthen Government commitment to sectorreform strategy and privatization reform. The three energy projects in the CAS
will support the Government in itsimplementation of the reform program. Inaddition, this project will link the release of theIDA funds to implementation of reform actions,notably the approval of the short list ofpre-qualified firms for the distributionconcession. Government implemented a tariffincrease before the project was presented toIDA's Board.
Limited private sector interest in N Continued dialogue to refine reforn program.distribution and generation concessionsUnfavorable hydrology conditions S Hydrology is a substantial risk for Unit 15. A
study to confirm hydrological conditions willtake place in connection with the review of theviability of Unit 15. Given the probability oflow hydrology, the project may abandon theconstruction of Unit 15. Hydrology is a lowerrisk for Unit 14.
T,he Electricity Regulatory Authority does M A long-term institutional strengthening programnot develop adequate capacity to regulate is essential; while resources are available botheffectively within the Fourth Power and the Privatization
and Utility Reform projects, and the NORADassistance is in place, these resources will bewasted unless GOU is comnrnitted to budgetsupport of the ERA at a level sufficient for theagency to hire and train enough staff.
The Uganda Electricity Transmission M Through the sector reform dialogue and theCompany fimctions inefficiently. proposed Bujagali project, GOU will clarify its
plans for the privatization of the TransmissionCompany. In the meantime, the ongoingPrivatization and Utility Reform Project, and theProposed Project may assist the Governmentwith institutional strengthening needs.
Demand growth is lower than forecast. N A joint Bank/IFC team has reviewed the loadforecast and found it to be reasonable.However, if demand turns out to be lower thatexpected, the project may abandon theconstruction of Unit 15. The risk analysisconfirmed that the load forecast is a low risk forUnit 14.
Network losses are higher than forecast M Under the project, NDF and NORAD willfinance transmission strengthening. The privateconcessionaire will strengthen distribution,billing and collection operations.
From Components to Outputs
- 42 -
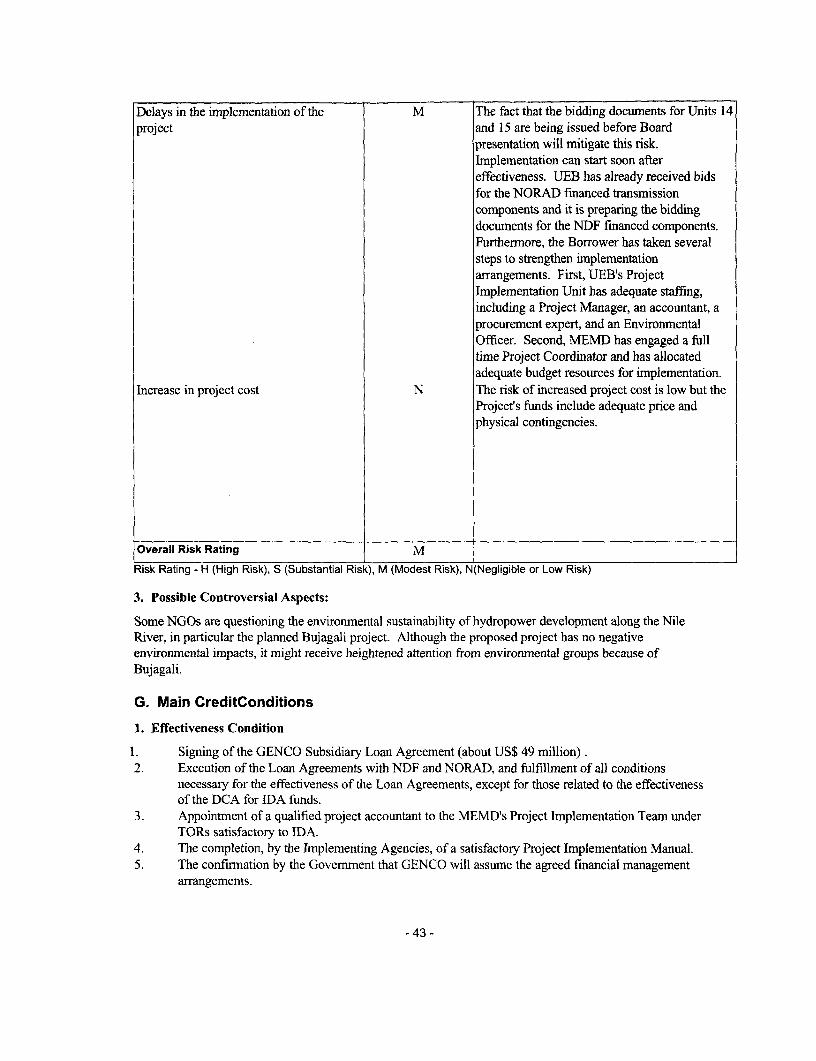
Delays in the implementation of the M The fact that the bidding documents for Units 14project and 15 are being issued before Board
presentation will mitigate this risk.Implementation can start soon aftereffectiveness. UEB has already received bidsfor the NORAD financed transmissioncomponents and it is preparing the biddingdocuments for the NDF financed components.Furthermore, the Borrower has taken severalsteps to strengthen implementationarrangements. First, UEB's ProjectImplementation Unit has adequate staffing,including a Project Manager, an accountant, aprocurement expert, and an EnvironmentalOfficer. Second, MEMD has engaged a fulltime Project Coordinator and has allocatedadequate budget resources for implementation.
Increase in project cost N The risk of increased project cost is low but theProject's funds include adequate price andphysical contingencies.
Overall Risk Rating M
Risk Rating - H (High Risk), S (Substantial Risk), M (Modest Risk), N(Negligible or Low Risk)
3. Possible Controversial Aspects:
Some NGOs are questioning the environmental sustainability of hydropower development along the NileRiver, in particular the planned Bujagali project. Although the proposed project has no negativeenvironmental impacts, it might receive heightened attention from environmental groups because ofBujagali.
G. Main CreditConditions
1. Effectiveness Condition
1. Signing of the GENCO Subsidiary Loan Agreement (about US$ 49 million).2. Execution of the Loan Agreements with NDF and NORAD, and fulfillment of all conditions
necessary for the effectiveness of the Loan Agreements, except for those related to the effectivenessof the DCA for IDA funds.
3. Appointment of a qualified project accountant to the MEMD's Project Implementation Team underTORs satisfactory to IDA.
4. The completion, by the Implementing Agencies, of a satisfactory Project Implementation Manual.5. The confirmation by the Govemment that GENCO will assume the agreed financial management
arrangements.
- 43 -

7. Confirmation that GENCO and UEB have entered into a contractual arrangement, satisfactory toIDA, for the execution of the relevant components of the project.
8. Confimation that Government has settled its verified overdue arrears to the Uganda ElectricityDistribution Company Ltd. and prepared an action plan to ensure that Government agencies remaincurrent in their electricity payments.
2. Other [classify according to covenant types used in the Legal Agreements.]
Conditions of Board - The conditions have been met:
1. Implementation of an agreed increase in electricity tariffs and establishment of an automatic tariffadjustment formula.
2. Implementation, by the Government, of power sectors' privatization in line with a plan previouslyagreed with IDA.
3. Issuance of a Financial Management (LACI) certificate.4. Adoption by GENCO and the Ministry of Energy Mineral Development of implementation plans,
satisfactory to IDA, for the implementation of their respective components under the proposedProject.
Conditions of Disbursements:
1. Release of funds by IDA for the installation of units 14 and 15 at Kiira (about US$ 43 million) willbe linked to Government approval of a list of pre-qualified firms for the distribution concessionselected in accordance to a process satisfactory to IDA.
2. Release of funds by IDA for the installation of Unit 15 at Kiira will additionally be linked to thesatisfactory evidence of the units' economic viability.
3. Release of funds by IDA for the project's petroleum component (about US$ 0.9 million) will belinked to the submission to Parliament of a satisfactory Petroleum Supply Bill.
Financial Performance:
I. Debt service shall be at least 1.3 times the estimated maximum debt service requirements ofGENCO for any succeeding fiscal year on all debt, including the debt to be incurred.
2. The Borrower and the Association shall, from time to time, at the request of either party, exchangeviews with regard to the Government's electricity and petroleum pricing policies and its plans inrespect of the overall development of the power and petroleum sub-sectors.
Accounts/Audit:
1. Accounts audited by an extemal auditor acceptable to IDA.2. Audits submitted within 6 months of end of fiscal year.
Management Aspects:
1. The implementing agencies will retain professional management and staffing, including adequateimplementation and financial management capacity.
2. The implementing agencies will retain, during project implementation, the services of a qualifiedproject manager, environmental officer, and financial management staff.
-44 -

3. The Government shall take all such measures as may be necessazy or required, satisfactory to theAssociation, for the purpose of ensuring that the entities operating in the power sub-sector achievetechnical standards and financial targets of efficiently run power sector entities.
Implementation:
1. The implementing agencies will implement the project according to the agreed ImplementationPlan.
2. During the implementation of the project, GENCO shall continue to retain the services of dulyqualified experts, with qualifications and terms of reference satisfactory to IDA, for monitoring thesoundness of the Nalubaale Dam at least on an annual basis.
3. Throughout the implementation of the project, GENCO shall take all measures necessary to ensurethat (i) a health clinic will be operational and (ii) infornation on HIV/AIDS will be available toconstruction workers.
4. The implementing agencies will carry out a mid-term review under TORs acceptable to IDA.5. When the Government proceeds to privatize the power generation and distribution functions in
accordance with its Letter of Policy, the Borrower shall: keep the Association fully informed ofsuch developments, and thereafter take all measures necessary to ensure that all arrangements forsuch privatization are satisfactory to the Association.
6. The Borrower shall ensure that the Power Transmission Entity shall have adequate capacity,satisfactory to the Association to; (i) carry on its operations and conduct its affairs in accordancewith sound administrative, financial, electric utility and engineering practices under the supervisionof qualified and experienced management assisted by competent staff in adequate numbers; and (ii)carry out the implementation of the transmission rehabilitation and SCADA components of theproject.
Monitoring and Reporting:
1. The implementing agencies will prepare quarterly Project Management Reports and semi-annualprogress reports and review them with IDA.
-45 -

H. Readiness for Implementation
1 1. a) The engineering design documents for the first year's activities are complete and ready for the startof project implementation.
0 1. b) Not applicable.
12 2. The procurement documents for the first year's activities are complete and ready for the start ofproject implementation.
O 3. The Project Implementation Plan has been appraised and found to be realistic and of satisfactoryquality.
0 4. The following items are lacking and are discussed under loan conditions (Section G):
The Implementing Agencies will finalize their respective Project Implementation Plans before effectiveness.
1. Compliance with Bank Policies
! 1. This project complies with all applicable Bank policies.Q 2. The following exceptions to Bank policies are recommended for approval. The project complies with
all other applicable Bank policies.
Paivi Koljonen (fi fandaCovindassamy PJaes W. AdamsTeam Leader c Bctor Manager/Director Country Manager/Director
-46 -

Annex 1: Project Design SummaryUGANDA: FOURTH POWER PROJECT
Key PerformanceHierarchy of Objectives Indicators Monitoring & Evaluation Critical Assumptions
Sector-related CAS Goal: Sector Indicators: Sector/ country reports: (from Goal to Bank Mission)1) Maintenance of high a) Power supply no longer a a) Customer complaints, level a) Increased budgetarygrowth rates based on private main factor retarding effective of private investment, resources directed to povertyinvestment, export industrial development and macroeconomic statistics. alleviation measures.diversification and rural private investment by 2004.development.
b) The real cost of power to b) ERA, Govemment, and b) Macro-economicindustries reduced by early industry statistical reports. performance sustained.2004.
Project Development Outcome I Impact Project reports: (from Objective to Goal)Objective: Indicators:I) Improve power supply to a) Load shedding substantially a) Utility load dispatch a) Unit 13 operational bymeet demand of economic reduced by early 2004. reports. 2003.sectors.
b) Existing Nalubaale and.- I Kiira generators operational.
-47 -

2) Government capacity to b) Annual generation output a) Government reports. a) Power sector reformmanage reform, privatization, increased by 50 GWIh for unit program implemented inand development in the power 14 and 40 GWh for unit 15 by b) ERA's annual industry parallel and UEB'ssub-sector strengthened. early 2004. statistics. distribution and generation
businesses concessioned toc) Undelivered energy due to private sector by end-2001.outages in the transmissionsystem reduced by 300/o b) Transmission companybetween 2000 and end-2003. operates efficiency.
d) Network losses reducedfrom 31 % in 2000 to 24 % in2004.
e) Annual number of newurban residential connectionsincreased to 15,000 p.a. by2004.
f) Project site restored andconstruction infrastructuredecommissioned by end-2004,including removal oftemporary sewage lines,electricity lines, buildings,construction materials, usedoils, etc.
g) Possible environmentalissues arising frommonitoring activities (waterquantity and quality, thebiology and ecology of fishpopulations, siltation, andshoreline stability) addressedin a timely manner.
a) ERA office staffed and c) ERA annual report & c) Under reform program,adequately equipped by supervision reports. billing and collection ratiosend-2002. for electricity consumption in
line with internationalb) Government's reform standards.program on track.
3) Government capacity to a) Petroleum industry a) Annual report of sector a) Under reform program,manage reform and monitoring unit staffed and perfornance by MEMD. distribution concessionairesdevelopment in the petroleum trained. adequately urged forsub-sector strengthened. incentives to strengthen
distribution network so as toreduce network losses whenunits 14 and 15commissioned.
-48 -

b) Guidelines established for b) Other Government policiespetroleum industry are conducive to economicmonitoring. growth.c) Monitoring of petroleumquality performed at leasttwice a year using newequipment by end-2004.
Output from each Output Indicators: Project reports: (from Outputs to Objective)Component:1) Power system expanded a) Contract for supply and a) Load dispatch reports. a) Project implemented onand rehabilitated. installation signed by time and budget.
end-2001.b) 1.2 1 or 2 40 MW unitscommissioned by end-2003
2) UEB provided with a) Contract for SCADA a) Project progress and a) Load forecast reflectsinstitutional support. installation signed by supervision reports. demand development
mid-2002. correctly.b) SCADA andtelecommunications installedby end-2003.
3) Environmental monitoring a) Four transmission a) Site visits. a) Adequate hydrologicalplan implemented. substations rehabilitated by conditions.
end-2004.4) Government provided with a) Consultants' reports.support to develop and reformthe power sector.5) Capacity to monitor a) Consultant to assist UEB a) ERA reports.petroleum industry improved. with implementation hired by
mid-2001b) Study on Unit 15 viabilitycompleted by end-2001.c) Environmental officer hiredby mid-2001.d) Contract for supply ofenvironmental monitoringequipment signed byend-2001.e) Consultants preparedHydrology report.f) Office equipment procuredfor MEMD and ERAg) Training provided for atleast 15 MEMD and ERAstaff by 2004.h) Consultants procured forstudies.a) Contract for monitoringequipment awarded bymid-2002.b) Training provided for atleast 3 staff.
-49 -

Project Components / Inputs: (budget for each Project reports: (from Components toSub-components: component) Outputs)1. Power System Expansion US$83.91 Million Project reports and audited Equipment is procuredand Rehabilitation accounts. without delay.2. Environmental Monitoring US$0.21 Quality consultants hired in a
timely manner.3. Power Sector Development US$2.34 Million Contractor performance isand Reform satisfactory.4. Petroleum Sector US$.94 MillionDevelopment and Reform5. Project Preparation Facility US$1.94 Million(PPF)
- 50 -

Annex 2: Detailed Project DescriptionUGANDA: FOURTH POWER PROJECT
By Component:
Project Component I - US$83.91 millionPower System Expansion and Rehabilitation (Part A)
Installation of Units 14 and 15 at Kiira. The Kiira (Owen Falls Extension) power plant was designed for5 x 40 MW units comprising propeller turbines and synchronous generators (please refer to illustration ofKiira at the end of this annex). Two of these units (11 and 12) were installed under the Third PowerProject (commissioned August, 2000) and work to install the third unit, Unit 13, is underway. The canal,dam, spillway, power house and transmission system extensions to cater for all 5 units were completedunder the Third Power Project.
The project will finance the supply and installation of the remaining two 40 MW units and associatedequipment at Kiira Power Station. The supply and installation contract will consist of:
* Two propeller turbines and govemors.Two synchronous generators and exciters.Hydromechanical equipment (gates, gate guides, hoist and trashracks).
3 Concrete embedment and grouting works for the two turbines.3 Unit transformers and switchyard extension equipment.
The equipment and minor civil works required will be included in one supply and installation contract.
Completion of the Installation of Unit 13 at Kiira
* Civil Works, comprising embedment and grouting works for the two turbines. The project willprovide retroactive financing for the works, which will be undertaken by the civil works contractorfor Units 11 and 12, whose contract has been extended.
v Hydromechanical Equipment, comprising gates, gate guides, hoist and trashracks. As for thecivil works, the work will be undertaken by the hydromechanical contractor for Units 11 and 12,whose contract has been extended.
Upgrade of SCADA and Telecommunications System. Under the Second Power Project, NORAD andNDF funded a Supervisory Control and Data Acquisition (SCADA) system in 1994. Since then, UEBconstructed several other substations, but they are not yet connected to the SCADA system. The projectwill therefore include the supply and installation of SCADA, and corresponding telecommunicationsextensions for these substations, supply of spare parts, and training of UEB personnel.
The work will cover 132 kV and 33 kV substations between Kampala and Jinja, Soroti in the East, Lira inthe North and Mbarara, Masindi and Nkenda in the West, and will comprise the following:
* Modifications at the System Control Center to upgrade the software and hardware and incorporatethe extensions.
* Installation of remote terminal units and data collecting equipment at each of the new substations.
- 51 -
* Extension of the telecommunication systems (power line carrier and microwave) to cover theextended area of coverage.
System Rehabilitation, comprising critically needed improvements to ensure operational safety andreliability, and efficient evacuation of the increased output from the power stations. Of particular concernare the generator circuit breakers and transformers at the Nalubaale switchyard. First, the fault rating ofsix out of the ten 132 kV circuit breakers could be exceeded when Bujagali is commissioned. Second, thereare no reliable spare units for the 46 year old generator transformers and spare paits for the circuitbreakers are not readily available. Failure of either could compromise the continuity of supply from thewhole system. The project would finance, in particular:
* Replacement of six of the ten 132 kV circuit breakers at Nalubaale Substation, before additionalgeneration capacity is connected to the network, with circuit breakers of adequate fault rating.
* Provision of three spare 20 MVA transformers for the generators and interbus - lxI 1/33kV,lxl 1/132 kV and lx33/132kV - at Nalubaale Substation.
* Installation of one 20 MVA transformer and eleven 33kV circuit breakers , and the constructionthree 132 kV bays, at Nkenda Substation.
* Replacement of two circuit breakers (132kV and 33kV) at Nkonge Substation.. Replacement of three 132kV bays and seven 33kV circuit breakers at Opuyo Substation.* Extension of Nkenda Substation -- four 132 kV bays and eleven 33 kV circuit breakers, one 20
MVA 132/33kV transformer and a diesel genset for auxiliary supplies.* Extension of Nkonge Substation - two circuit breakers (132 kV and 33 kV).
Institutional Support. This will comprise studies, advisory services and logistical support to UEB in theimplementation of the project. The components include:
* Project Design and Supervision: (a) consultants to assist UEB with design, procurement andsupervision of the project, including Units 14 and 15 transmission rehabilitation and SCADA; (b) aproject manager; and (c) a project accountant who will form part of UEB's project managementteam for the duration of the project, similar to the arrangement for the Third Power Project (Units11 and 12).
* Technical and Economic Evaluation of Unit 15: to review the viability of the Unit 15 closer toproject implementation, based on latest information on the lake level, river flow and theimplementation schedule of Bujagali.
Project Component 2 - US$0.21 millionEnvironmental Monitoring (Part B)
In accordance with the Bank's safeguard policy OP/BP/GP 4.01 on Environmental Assessment, theGovenmment has prepared a monitoring plan to ensure compliance with, enforcement, and monitoring of theBank's safeguard policies and Uganda's national environmental requirements in an effort to control anymeasures that may impact on project quality.
The project will finance procurement of required equipment for the implementation of the environmentalmonitoring plan and the recruitment of an environmental officer to oversee it.
Description of monitoring measures to be carried out under the project
- 52 -

* Monitoring of the quantity of surface water at points downstream of the Kiira dam anddownstream at the outlet of Lake Kyoga.
* Monitoring of the biology and ecology of the fish population upstream and downstream as well asin the Kiira canal.
* Monitoring of the stability of the shoreline inmmediately downstream of the Kiira dam at the tailrace area on the Eastern Bank.
* Silt removal from storm water drains by installing silt interceptors in drains and through regularcleaning.
* Monitoring of water quality.
* Limnological sampling of: (a) micro-flora; (b) aquatic weeds and benthic organisms; and (c)vegetation changes in the upper watershed.
* Removal of temporary construction infrastructure at the end of the project (Decommissioning).
Project Component 3 - US$ 2.34 millionPower Sector Development and Reform (Part C)
Building capacity for reform and development of the power sub-sector at MEMD and ERA through:
a) A Study on Water Management at Lake Victoria will be in two parts: (i) a study on long-termregulation of Lake Victoria, to ensure optimal utilization of the lake for power generation and otheruses by Uganda and other riparian countries, in view of the long term variation in the lake level; (ii)a study to optimize operation of the hydropower plants, including the proposed Bujagali scheme;
b) Development of an energy end-use efficiency program including infornation dissemination toselected large consumers based on analysis of energy audits previously carried out;
c) Annual consumer satisfaction surveys to track consumer's perceptions of the quality ofelectricity supply over time and, thus, contribute to the improvement of the service;
d) Sector studies and preparation of future projects would include energy sector and feasibilitystudies, and preparatory activities for future projects under the Government's energy sectordevelopment and reform program;
e) Training of the staffs of ERA and MEMD in power sector regulation, licensing, tariff setting,energy policy, energy efficiency and procurement;
f) Equipment including computers, a vehicle, and other office equipment for ERA and MEMD; and
g) Consultants' Services to assist MEMD and ERA in: (i) overall project implementation; (ii)sector reform, policy, and energy pricing.
Project Component 4 - US$0.94 millionPetroleum Sector Development and Reform (Part D)
- 53 -

Building capacity for the implementation of a new petroleum policy at MEMD through:
a) Acquisition of petroleum product quality monitoring equipment comprising: (i) one mobilequality testing laboratory; and (ii) testing equipment for a stationery laboratory.
b) Specialized advisory services to MEMD in: (i) preparing specifications and tender document forthe quality monitoring equipment; and (ii) in setting up a petroleum monitoring cell;
c) Training of MEMD staff in the monitoring of petroleum industry activities, product qualitytesting, and safety;
d) Acquisition of computers, other office equipment, and two vehicles for monitoring field work;and
e) Studies on supply options to enhance competition; improving products quality; and loweringconsumer prices.
Kiira Power Plant in 2000
- 54 -

Annex 3: Estimated Project CostsUGANDA: FOURTH POWER PROJECT
Local Foreign TotalProject Cost By Component US $million US $miilion US $million
Power System Expansion and Rehabilitation 6.80 65.90 72.70Power Sector and Development 0.10 2.20 2.30Environmental Monitoring 0.00 0.20 0.20Petroleum Sector Development 0.50 0.60 1.10Project Preparation Facility 0.00 1.94 1.94
Total Baseline Cost 7.40 70.84 78.24Physical Contingencies 0.60 5.40 6.00Price Contingencies 0.10 5.00 5.10
Total Project Costs 8.10 81.24 89.34Interest during construction 0.00 0.00
Total Financing Required 8.10 81.24 89.34
Local Foreign TotalProiect Cost By Category US $million US $rnillion US $million
Supply and Installation 6.86 67.55 74.41Civil Works 0.64 2.55 3.19Goods 0.50 1.70 2.20Consultants 0.10 7.00 7.10Training 0.00 - 0.50 0.50PPF 0.00 1.94 1.94
Total Project Costs 8.10 81.24 89.34Interest during construction 0.00 0.00Total Financing Required 8.10 81.24 89.34
Identifiable taxes and duties are 0 (US$m) and the total project cost, net of taxes, is 89.34 (US$m). Therefore, the project cost sharing ratio is 69.4% oftotal project cost net of taxes.
- 55 -

Annex 4: Cost Benefit Analysis SummaryUGANDA: FOURTH POWER PROJECT
[For projects with benefits that are measured in monetary terms]
Present Value of Flows Fiscal ImpactEconomic Financial AnalysisAnalysis Taxes Subsidies
Benefits: 76.9 33.9USS million
Costs: 44.9 44.9US$ millionNet Benefits: 32 -11 36USS million 20IRR: 20 8
The above present value flows are for Units 14 and 15 combined. If only one unit is installed, theeconomic and financial IRRs are 22 percent and 10 percent respectively. The present values of flows havebeen discounted at 12 percent discount rate.
The present value of financial benefits is lower than that of economic benefits, because the electricity tariffrevenue is the basis for the financial benefits while the economic value of electricity consumption, includingconsumer surplus, is the basis for estimating the economic benefits. The financial analysis was based onthe actual average tariff revenue as of June 1, 2001 of US cents 9.5 per kWh (excluding VAT). Theeconomic and financial costs are the same because there are no taxes or duties on the project's inputs.Also, because all project inputs are imported, local costs are minimal - making shadow price adjustmentsmarginal.
The fiscal impact is calculated on the whole project, including the transmission rehabilitation and SCADAcomponents. The fiscal revenue includes VAT on electricity sales, corporate taxes, and the revenue theGovermment will receive from the interest rate differential between the IDA credit terms and the comrnercialon-lending terms that apply to the power companies.
If the difference between the present value of financial and economic flows is large and cannot be explained bytaxes and subsidies, a brief explanation of the difference is warranted, e.g. "The value of financial benefits is lessthan that of economic benefits because of controls on electricity tariffs."
Summary of Benefits and Costs:
Units 14 and 15
Table 1. Economic Rate of Return for Units 14 and 15
- 56 -

Unit 14 Unit 15 Units 14 & 15
Incremental Value of Value of Net Incremental Value of Value of Net NetCosts Incremental Incremental Benefits Costs Incremental Incremental Benefits Benefits
consumption Exports consumption ExportsYear US$ '000 US$ '000 US$ '000 US$ '000 US$ '000 US$ '000 US$ '000 US$ '000 US$ '000
2002 0 0 0 0 0 0 0 0 02003 25.9 2.1 0 -23.8 20.7 0.7 0 -20 -43.9
2004 0.3 8.3 0 8.0 0.2 5.0 0 4.7 12.8
2005 0.3 0 2.3 2.1 0.2 0 2 1.8 3.9
2006 0.3 0 2.3 2.0 0.2 0 2.3 2.1 4.1
2007 0.3 0 2.3 2.1 0.2 0 1.3 1.1 3.2
2008 0.3 0 2.1 1.8 0.2 0 0.5 0.3 2.1
2009 0.3 8.0 0 7.7 0.2 2.9 0 2.7 10.5
2010 0.3 8.3 0 8.0 0.2 4.1 0 3.9 11.9
2011 0.3 8.2 0 8.0 0.2 7.0 0 6.8 14.7
2012 0.3 8.2 0 7.9 0.2 7.5 0 7.3 15.2
2013 0.3 8.2 0 7.9 0.2 7.7 0 7.5 15.5
2014 0.3 8.2 0 7.9 0.2 8.2 0 8.0 15.9
2015 0.3 8.2 0 7.9 0.2 7.5 0 7.3 15.3
2016 0.3 7.9 0 7.7 0.2 2.8 0 2.6 10.3
2017 0.3 8.3 0 8.0 0.2 5.2 0 5.0 13.0
2018 0.3 8.2 0 7.9 0.2 7.9 0 7.7 15.7
2019 0.3 8.2 0 8.0 0.2 6.5 0 6.3 14.3
2020 0.3 8.1 0 7.9 0.2 3.3 0 3.1 11.0
2031 0.3 8.2 0 7.9 0.2 7.5 0 7.3 15.2
2032 0.3 7.9 0 7.7 0.2 2.8 0 2.6 10.2
EIRR: 22% 18% 20%
NPV R. 12% discount rate: $21.1 $10.9 $32.1
Note: Installation costs are compounded to commissioning date at 12%.
- 57 -

Transmission and SCADA
Table 2. Economic Rate of Return for the Project's Transmission and SCADA Components
Year Costs Benefits
SCADA Grid Sub Nalubaale Sub Total SCADA Grid Substations Nalubaale Net
Capital O&M Capital O&M Capital O&M USE USE Addit. SuoDlv USE USE Benefit
(MUSS) (MUSS) (MUSS) (MUSS) (MUS$) (MUSS) (MUS5) (GW h/y) (MUS$) (GQWh/y) 'MUSS) (GW h/y) (MUS$) SGW h/y(MUSS) (MUSS)
2000 0.0 0.0 0.0 0.0 0.0 0.0 0.0 0.0 0.0 0.0 0.0 0.0 0.0 0.0 0.0 0.0
2001 3.0 0.0 4.2 0.0 3.1 0.0 10.4 0.0 0.0 0.0 0.0 0.0 0.0 0.0 0.0 -10.4
2002 3.0 0.0 4.2 0.1 3.1 0.0 10.5 2.3 0.7 0.0 0.0 0.0 0.0 14.4 4.3 -5.5
2003 0.0 0.0 0.0 0.1 0.0 0.0 0.2 2.5 0.7 1.5 0.2 2.9 0.9 0.0 0.0 1.7
2004 0.0 0.0 0.0 0.1 0.0 0.0 0.2 2.5 0.7 2.0 0.3 1.6 0.5 0.0 0.0 1.4
2005 0.0 0.0 0.0 0.1 0.0 0.0 0.2 2.7 0.8 2.9 0.5 1.6 0.5 0.0 0.0 1.6
2006 0.0 0.0 0.0 0.1 0.0 0.0 0.2 2.8 0.9 3.8 0.6 1.6 0.5 0.0 0.0 1.8
2007 0.0 0.0 0.0 0.1 0.0 0.0 0.2 3.0 0.9 4.9 0.8 1.6 0.5 14.4 4.3 6.4
2008 0.0 0.0 0.0 0.1 0.0 0.0 0.2 3.2 1.0 6.0 1.0 1.6 0.5 0.0 0.0 2.3
2009 0.0 0.0 0.0 0.1 0.0 0.0 0.2 3.5 1.0 7.2 1.2 1.6 0.5 0.0 0.0 2.6
2010 .0.0 0.0 0.0 0.1 0.0 0.0 0.2 3.7 1.1 8.6 1.4 1.6 0.5 0.0 0.0 2.9
2011 0.0 0.0 0.0 0.1 0.0 0.0 0.2 3.9 1.2 9.5 1.6 1.6 0.5 0.0 0.0 3.1
2012 0.0 0.0 0.0 0.1 0.0 0.0 0.2 4.2 1.3 10.4 1.7 1.6 0.5 0.0 0.0 3.3
2013 3.0 0.0 0.0 0.1 0.0 0.0 3.2 4.5 1.3 10.6 1.8 1.6 0.5 0.0 0.0 0.5
2014 3.0 0.0 0.0 0.1 0.0 0.0 3.2 4.8 1.4 10.9 1.8 1.6 0.5 0.0 0.0 0.6
2015->25 0.0 0.0 0.0 0.1 0.0 0.0 0.2 5.1 1.5 11.2 1.9 1.6 0.5 0.0 0.0 3.7
2026 0.0 0.0 0.0 0.1 0.0 0.0 0.2 10.6 3.2 11.2 1.9 1.6 0.5 0.0 0.0 5.4
NPV (at 12 %) 3.34IEIRR 1 %
Main Assumptions:
1. Load Forecast Assumptions:
The EDF's forecast, the basis of the economic analysis of the project, made the following assumptions.
* GDP will growth at an average annual rate of 6.3 percent from the year 2000 to 2020. Thisreflects the actual growth rate Uganda achieved over the period 1990 to 1999.
* Industrial product will grow at an average annual rate of 12.5 percent until 2005, and thengradually decline to 7 percent after the year 2015. The justification of this growth path is that,usually, the industrial growth is high in the early years of industrialization. However, itsubsequently declines following the development of the early growth opportunities that have themajor impact on increasing the size of the industrial base.
* The household (residential) forecast assumes that with the easing of the generation constraint in
- 58 -

2000, new urban connections will increase from an actual level of about 9,000 per year in 1999, to15,000 per year in 2000, and further to 30,000 per year by 2010. In addition, the Government'srural electrification program would connect an additional 20,000 rural consumers per year. Thisrate of connections will increase the electricity access rate from the current 4-5 percent of thepopulation to about 10 percent in 2010. The forecast also incorporated an estimated price effectby constraining consurner's consumption to 6,5 percent of their disposable incomes. The use ofthis method was necessary because there is no reliable data on the price elasticity of Ugandanhouseholds. The "mature" consumption levels of residential consumers are: High income urban:9,281 kWh/year; middle income urban: 2,966 kWh/year; and low income urban: 590 kWh/year.
* The basis of the industrial and commercial forecast is the estimated income GDP elasticity ofdemand -- ranging from 1.1 to 1.3 for industries and from 1.2 to 1.8 for the commercial sector.These elasticities are broadly characteristic of economies at Uganda's stage of development. Theestimated price elasticity for these consumers' is about -0.2.
* Non-technical losses are currently estimated at 12 percent of generation. The forecast assumesthat these will reduce to 4.5 percent by 2008 and remain constant thereafter.
* Technical losses in the transmission and distribution network are currently above 20 percent. Theforecast assumes that these will reduce to 10 percent by 2010 and remain at that level thereafter.
3 The forecast included a 50 percent and 73 percent nominal tariff increase for the residential andnon-residential consumers respectively.
* The forecasts predicts total energy demand to grow by 10 percent per year during the period2000-2010 and by 8 percent thereafter.
2. Assumptions in the Cost-Effectiveness Analysis and the Cost Benefit Analysis of Units 14 and 15
Economic Costs
All costs are in end-year 2000 border prices. The incremental costs of the project include: (i) capitalexpenditures on the installation of the two Kiira turbines and generators, and ancillaries such as unittransformers and switchyard extension equipment (US$ 23.7 million for unit 14 and US$ 19.2 million forUnit 15); and (ii) operation and maintenance costs, estimated as 1.5 percent of cumulativeinvestments/year. Since the project involves only the installation of two generating units in an existingpowerhouse which does not require additional civil works, local cost components are negligible and thus theanalysis makes no shadow price adjustments to local costs.
Economic Benefits
The project's benefits are the incremental sales that the proposed investments make possible. The economicvalue of these benefits varies among different groups of electricity users. This economic analysis hasestimated the value of the benefits for two groups of users: residential and non-residential users. Inaddition, the economic analysis includes in the project's benefits earnings from the exports of the project'ssurplus electricity.
- 59 -

Benefits to Residential Users. The analysis estimates the value of the incremental electricity to theresidential consumers as the area under their demand curve for electricity. Since the shape of the truedemand curve is not observable, the analysis assumed a semi-log demand function of the form: Q = A + BIn P, that passes through two points. The first point at the "upper" end of this demand curve is theprice-quantity pair of alternative energy sources. This point represents consumers willingness to pay forhigher valued uses of electricity (such as lighting). For residential consumers, this altemative energy iskerosene. Based on studies by ESMAP households generally use an average of two kerosene lamps for 5hours per day. Assuming that one kerosene lamp is equivalent to a 40 W light bulb, this usage isequivalent to 144 kWh per year. The average cost to the consumer of this kerosene lighting is about US$0.42/kWh at a crude oil price of US$ 20/bbl. However, this level of kerosene use would not be affordablefor the lowest income groups, and hence, for these, the usage is assumed to be half or 72 kWh per year.
The second point at the "lower" end of the demand curve is defined as the price-quantity pair denoting thequantity of electricity that households use at UEB's marginal tariff rates. The analysis used the same tariffrates as the demand forecast. These included a 50 percent increase to UEB's year 2000 tariffs. The ratesare:
Monthly consumption less than 30 kWh: USS0.017/kWhMonthly consumption between 30 and 200 kWh: US$0.058/kWhMonthly consumption above 200 kWh: US$0.083/kWhMonthly service charge: US$0.55/month
The analysis further disaggregated the projected sales to residential consumers among the three incomegroups and four levels of consumption that EdF used in its load forecast. The analysis calculated thebenefits for a representative consurner in each income class and consumption level. These representativeconsumer groups included users that are already connected to the grid but who will be increasing theirconsumption and users that will be first connected when the project comes on line. The results show thatthere is a difference between the economic value of electricity sales to consumers in different consumptionlevels and income groups. For a high-income urban residential user who has reached a "mature"consumption level (as defined in the EdF load forecast), the benefits are about US$1,600 per year,representing about 13 percent of this consumer's annual income. In comparison, the benefits are aboutUS$402 and US$111 per year for middle and low-income users respectively. The benefit for the lowincome consumer represents about 24 percent of the consumer's annual income. The annual economicbenefits of additional electricity that resulted from the above analysis were converted into average benefitper incremental kWh served to allow the modeling of the project under different hydrological conditions andscheduling scenarios etc.. The value of this average incremental benefit is US$0.1 8/kWh. Detailedcalculations are available in Project Files.
Benefits to Non-Residential Consumers. The basis for valuing the benefits to residential consumers is thecost that these users would incur if they had to meet their electricity needs by operating existing back-updiesel generators on their own premises. This avoided user cost is estimated on the assumption that a mixof different sizes of diesel generators would be used for user-owned supply. The assumed capacities aretaken form Uganda import data for the period 1993-1997. The imported capacity was roughly equallyproportioned between units less than 75 kVA; between 75 kVA and 375 kVA; and units larger than 375kVA. According to an industry survey in 1999, the average and median sizes of a back-up generators were270 kVA and 140 kVA respectively.
Benefits from Surplus Exports. US cents 4.5 per kWh.
- 60 -

Fuelprices
The analysis assumed a base case crude oil price of US$20 per bbl. The risk analysis included US$15 andUS$25 (latter is OPEC target price). The Bank's crude oil price forecast predicts prices to fall from aboutUS$20.5 per bbl in 2001 to around $16 per bbl by 2005 (in 2000 prices). However, the confidence interval(70/o) for the 2005 price is from US$10 per bbl to US$22.5 per bbl. Due to uncertainties and majorimportance of short term prices on the analysis, a crude oil price of US$20 per bbl was used as a base case.After adjusting the crude oil price for product differentials, transportation costs and taxes, the cost of dieselfuel to industrial consumers is estimated at $0.62/A, which translates to about US$0.21 per kWh.
Oil transportation costs
* Pipeline from Mombasa to Eldoret: US$ 90.30 per tonne* Road (350 km) from Eldoret to Kampala: US$24.5 per tonne
Cost of back-up diesels
* Estimated installed investment costs in Uganda vary from $300 per kW for very large units to$900 per kW for residential sized units. A weighted average of $500 per kW is used.
3 Taking into account the effects of running at less than rated capacity, reduced efficiency with wearand use of lubricants, the analysis assumes an average fuel consumption of 0.34 I/kWh.
3 Variable Costs (border prices) per kWh: Fuel: US$0.14; O&M: US$0.02; Total US$0.16
* The financial operating cost (consumer's cost) per kWh is estimated at US$0.23 per kWh. Thisincludes fuel, taxes, and operation and maintenance. This compares favorably with the 1999survey of Ugandan industry managers, which suggested that the operating costs were about threetimes the electricity tariff i.e. in the order of US$0.21 to 0.26 per kWh.
Cost of gas turbine power plant
* $600 per kW of sent-out capacity is used after factoring in plant auxiliaries costs and de-rating foraltitude and temperature.
* Fuel consumption (30 % efficiency based on size, altitude, humidity): 12.36 MJ/kWh = 0.01236GJ/kWh
* Variable costs (border prices) per kWh: Fuel: $0.115; O&M: $0.01; Total $0.125
Outputfrom Units 14 and 15
* At flows below 620 m3/s the project will not produce any additional energy since virtually all ofthe flow can be passed through the existing hydro plants;
* At flows up to 820 m3/sec Unit 14 can provide up to 50 GWh/year;* At flows above 1,020 m3/sec Units 14 and 15 together can produce up to 100 GWh per year.* The "average" flow referred to in this report is defined as 1,004 m3/sec.
- 61 -

Commissioning dates
* Unit 14: October 2003* Unit 15: December 2003* First unit of Bujagali: July 2005* Kakiira: June 2004
Network losses
* Transmission and distribution losses retained at 25 percent of generation over the evaluationperiod. This is the forecast level of losses in 2004, the first full year of the project's operation.
Economic life of assets:
* Units 14 and 15: 35 years
The Hydrology Issue:
* The viability of Units 14 and 15 is complicated by the uncertainty on future available flow fromLake Victoria. Beyond the inherent variability of the natural weather cycle, this is a matter indispute among some of the consultants who have studied the problem - the Hydrology Issue. Themain point of contention is the validity of the historical flow record and its application to develop ascenario, or scenarios for future flows. In brief, one view is that only the record since 1960 isrelevant - outflows from Lake Victoria to the Blue Nile since 1960 have averaged over 1,100m3/sec., with a low annual flow of about 900 m3/sec. The contrary view is that the recorded flowsprior to 1960 are also relevant and thus, the average flow is only about 600 m3/sec. with an annuallow of around 500 m3/sec.. However, in the short-term, the lake outflow is controlled not only bythe natural inflow to the lake (the hydrological regime) but it is also strongly influenced by theinitial level of the lake. As of January 2000 the lake level was 12.20 m. The equivalent outflow is1,130 m3/sec and even with an immediate onset of low inflows, the lake outflow would remain atmore than 900 m3/sec. for at least the next two years. In May 2001, the lake level had droppedslightly to about 11.9 m with an equivalent outflow of 1,050 m3/sec.
- To assess the merits of the additional units under these uncertain hydrological flows, independentconsultants carried out a Study during project preparation. The Study compared alternativeexpansion plans for the Ugandan generation system under different hydrological conditions. Thekey data required for the Study was the future lake outflow, i.e. the flow available for generation atboth Kiira and Bujagali. For Units 14 and 15, the flow available in the short-term (in particularduring 2003-5 (before Bujagali) is the most critical. For reasons discussed above, the Study didnot utilize the controversial historical outflow records but derived a total of 20 outflow sequencesby starting from the January 2001 lake level and applying to it the selected historical inflowsequences. The analysis emphasized the more reliable inflow records of 1965-98 - neglecting theextremely high 1961-64 inflows. Finally, the analysis applied the "Agreed Curve" to controloutflows.
3. Assumptions in the Economic Analysis of Transmission and SCADA Components
Economic life of assets:
- 62 -

* SCADA: 12 years* Substations and transformers: 25 years
Operation and maintenance cost
* Substations: 1.5 percent of investment cost annually* SCADA: I percent of investment cost annually
Value of economic benefits
* Residential users: US$ 0.18/kWh; non-residential users: US$ 0.23/kWh (the average benefit,valued at transmission level is US$0.17/kWh)
* Cost of unserved energy due to un-announced outages: US$ 0.30/kWh
Sensitivity analysis / Switching values of critical items:
1. Unit 14 and 15
The results from the sensitivity analysis show that the EIRR is robust to the changes in project capital cost,export revenue, delay in commissioning, and 25 percent reduction in the economic value of incrementalelectricity consumption. However, the results also show that Unit 15 is very sensitive to the availablewater flow - it will not produce any benefits if the water flow is below 750 m3/sec. (at the end of May,2001, the actual flow was about 1,050 m3/sec.). For Unit 14, all reasonable changes in the key variablesproduce an acceptable EIRR, exceeding the 12 percent opportunity cost of capital that is used for projectjustification. The demand forecast has only a marginal impact on the EIRR, because the project's output islimited by the available water flows. The table below shows the detailed results of the sensitivity analysis.
EIRR
Unit # 14 Unit # 15 Both Units
Base Case 22% 18% 20%
Project delayed by one year: 17% 15% 16%
Benefit value 25% lower: 18% 15% 16%
20% increase in capital cost 19% 15% 17%
Zero revenue from exports: 19% 16% 17%
Zero revenue from exports +Benefit value 25% lower 14% 12% 13%
Average Flow 750 m3/sec. 12% -- 7%
First Bujagali unit on-line January 2006: 26% 21% 24%
- 63 -

2. Transmission Rehabilitation and SCADA Components
The transmission rehabilitation and SCADA components are robust to changes in key variables. Theswitching values, i.e., values of key variables that produce a negative NPV (at 12 percent discount rate)and reduce the EIRR to below 12 percent are: more than 20 percent increase in the capital cost; a reductionin the estimated cost of unserved energy from UScents 30 to US cents 25 per kWh; and a 50 percentreduction in the value to consumers of the benefit of additional energy.
However, the EIRR for the rehabilitation of the Nalubaale switchyard is very sensitive to the investmentcost and the value of benefits. A 20 percent increase in the investment cost would reduce its EIRR to 5percent. Similarly, if the cost of unserved energy is only US cents 25 per kWh, the EIRR drops to 5percent. However, the cost of this rehabilitation should be seen as an insurance because it is difficult toestimate the probability of a total system failure that could result from the failure of the switchyard.Should the switchyard fail, the whole country could loose supply with devastating impact on the economy.After such a failure, it would take several hours to restore supply, and at least six months to fully restorethe supply.
Risk Analysis
The quantitative risk analysis of Units 14 and 15 assessed the impact on the project's economic returns ofuncertainty in underlying assumptions and predictions. To deal with this uncertainty, the analysis assignedprobabilities to the values of the key variables. The key risk variables and the probabilities of the valuesthese variables will assume in the future, emerged from the Bank's and the Government's estimates. Eachof the risk variables was matched with a probability distribution of its future values. The analysis assumedthis distribution to be triangular, i.e., it assigned a minimum, most likely, and maximum values to each ofthe risk variables. The stochastic nature of the project's implementation was then modeled using acommercially available risk analysis program. The model determined the expected EIRR and NPV withtheir probability distributions through a "Monte Carlo" simulation process. The list of the risk variablesand the probabilities assigned to them is below:
Hydrological flows:
? 16 average to high flow scenarios (varying from 930 m3/sec to 1188 m3/sec. These represent flowlevels observed since 1965 but excluding the all time highs): 5% each;
* 8 low flow scenarios (varying from 605 m3/sec to 757 m3/sec. These represent flow levelsobserved during 1925 to 1965): 2.5 % each.
Higher probability is given to the more recent higher flows because: the starting level of the lake, which isinput to all flow sequences is fixed at its current rather high level; and from a hydrological viewpoint it ismore likely that the higher post 1965 inflow pattem will continue as opposed to a reversion to the olderlower flows. The actual flow in end-May, 2001 was about 1,050 m3/sec.
Project capital Cost:Base: 60%+10% 10%-10% 30%
The base cost is derived from the cost of Units II through 13, which were not competitively bid. Since
- 64 -

Units 14 and 15 will be procured through ICB, the probability of lower price is assumed higher than theprobability of higher cost.
Export revenue:US$0.03/kWh: 25%US$O.045: 60%US$0.06: 15%
Project commissioning:2003: 80%2004: 20%
Bujagali commissioning (first unit):2005: 15%2006: 75%2007: 10%
Load forecast:Base: 60%Low: 20%High: 20%
Kakiira bagasse generating plant (20 MW) installed in 2004:25%
Oil price:Crude oil price =20$/bbl: 60%Crude oil price=15$/bbl: 20%Crude oil price=25$/bbl: 20%
Value of Economic benefits:The value of the economic benefits vary with crude oil price and have the same probabilities as above.The estimated average value of the incremental kWh served to residential consuners vary from aboutUScents 16/kWh to UScents 19/ kWh. The estimated value of electricity to non-residential consumers varyfrom about UScents 2 1/kWh to UScents 25/kWh.
- 65 -

Annex 5: Financial SummaryUGANDA: FOURTH POWER PROJECT
Executing Agencies and Accounting Responsibility:
The project has three implementing agencies: the Uganda Electricity Generation Company (GENCO), theUganda Electricity Transmission Company (TRANSCO), and the Ministry of Energy and MineralDevelopment (MEMD). GENCO will be responsible for the implementation of the power generationexpansion and environmental monitoring components, TRANSCO for the transmission rehabilitation andSCADA components, while the MEMD will be responsible for the components covering the power sectordevelopment and reform and petroleum sector development and reform. GENCO will contract with theUEB for the day to day implementation of the project, including for procurement and financialmanagement.
Institutional arrangements for GENCO, TRANSCO, and UEB: Both UEB as well as GENCO andTRANSCO (the latter two were part of UEB until the April 1, 2001 restructuring), have experience inmanaging World Bank financed projects, having implemented a component of the Third Power project.UEB already has a well functioning Project Implementation Unit (PIU) for the implementation of the ThirdPower project, headed by a project manager. The accounting section of the PIU is headed by a ProjectAccountant. The Project Manager reports to the Managing Director. Initially, the project's financialmanagement arrangements will be based on those for the Third Power project.
The project accounting function forms an intrinsic part of the UEB Corporate Finance Department. ThisDepartment is headed by the General Manager, Finance and Information Systems. Reporting to him, theManager, Finance, is responsible for the supervision of the Department's project accounting function. Thisfunction includes the Project Accounting Unit, which is headed by the Project Accountant who isresponsible for day to day project accounting matters, including the recording of transactions, maintenanceof proper books of accounts and the preparation of periodic reports for management, Government, andDonors. The Unit also includes an Assistant Project Accountant, three Accounts Clerks, and a filing clerk.
The Manager, Information Systems has the responsibility for the overall information needs of UEB,including the project. Responsibility for the Chart of Accounts, including that for project accounts, belongsto the Corporate Accountant who reports to the Manager, Accounts. UEB also has an Intemal Auditdepartment whose function includes the inspection of project transactions. UEB is undertaking variousreforms including the recruitment of a Finance Manager who will supervise the project accounting functionand a review of the direct accounting responsibilities for project transactions.
Institutional arrangements for MEMD: MEMD's components will be implemented by the Department ofEnergy. The Department of Energy is headed by a Commissioner. The Permanent Secretary, MEMD, isthe "Accounting Officer" for the project. This means that he has the overall responsibility for accountingfor the project funds for the MEMD's components. MEMD has appointed the Assistant Commissioner forEnergy Efficiency to be responsible for the implementation of the components of the Fourth Power project.He will report to the Commissioner and the Permanent Secretary, MEMD. In issues relating to powersector privatization, MEMD will consult with the Ministry of Finance and Economic Developmentresponsible for privatization.
MEMD is also the implementing agency for the IDA financed Third Power Project in addition to otherdonor financed projects, and it is expected that initially the Fourth Power project will use the same financial
- 66 -

management arrangements that the Third Power project uses.
The accounting unit in the MEMD is headed by a Senior Accountant. Under the Third Power project,responsibility for day to day project accounting matters lies with an accounts clerk who reports to theProject Coordinator under the supervision of the Senior Accountant. However, this arrangement is notsuitable for the Fourth Power project because it has stronger accounting and staffing requirements than theexisting Third Power project. The reasons for these stronger requirements are the transactions resultingfrom the management of a dollar denominated Special Account and the new disbursement arrangements.Government has therefore agreed that it will appoint a suitable person with appropriate qualifications andexperience to take responsibility for the day to day accounting function for the Fourth Power project,preferably at a grade higher than accounts assistant. MEMD has agreed to clearly demarcate anddocument the accountant's duties within the Energy Department, including reporting lines, and supervisoryresponsibilities.
Major accounting policies: MEMD prepares its financial statements on the basis of generally acceptedaccounting principles. It accounts for transactions on an accruals basis.
Overall policy guidance for UEB: For the UEB, overall policy guidance for financial managementpolicies is handled at two levels: there is the Board of Directors, and a Management Board. TheGovernment appoints the Board of Directors, and they consider financial matters relating to UEB in themeetings that they periodically hold.
Overall policy guidance for MEMD: A Financial Management Committee provides overall policyguidance to MEMD. The Minister of State for Energy is its chairman and the company's seniormanagement team are its members. Suitable Terms of Reference for the Committee in relation to theFourth Power project will be drawn up as part of the agreed Financial Management Plan.
Books of Accounts: Both implementing agencies have accounting units responsible for the maintenance ofthe books of accounts for their projects. These books are separate from those used for recording otherassets and transactions of the agencies and include:
a) Cash Book;b) Ledgers;c) Journal Vouchers; andd) Fixed Asset Register.
Internal Controls: The MEMD uses the Government Treasury Instructions as documentation of itsfinancial management procedures. These are generic in nature and do not address specific procedures usedfor project transactions. They do not also contain clear guidelines for the review of financial informationthat is generated from the accounting system, and reporting lines for financial management are not defined.MEMD has agreed to prepare a Financial Management Manual for the project. This Manual willdocument the internal controls and accounting procedures to be employed in the financial management ofthe projects.
For UEB, the audit report for the Third Power project for the year ended 31 December 1999, prepared by afirm of auditors, notes that the company did not have significant weaknesses in its internal controls for theproject. The audit opinions on the Project accounts and the Special Account Statements were unqualified.The UEB is currently updating the documentation of its accounting and internal control systems (in the
- 67 -

form of an accounting manual) to take into account the various reforms that it is currently undertaking inits Finance Department and for the Fourth Power project.
Accounting system software: MEMD's current accounting system is a manual system. It recordstransactions manually into books of accounts and reports, and produces analyses on computerspreadsheets. Given the small size of the MEMD's project components, this system is sufficient for theproject.
UEB has installed the SunSystems software and a separate Project Module is also being installed whichwill maintain project accounts. This module will have the flexibility to automatically produce projectmanagement Reports (PMRs).
Books of accounts and list of accounting codes: Both GENCO and MEMD will maintain similar booksof accounts to those for the Third Power project. The books of accounts for the Fourth Power projectinclude:
a) Cash Book;b) Ledgers;c) Journal Vouchers; andd) Contracts register
Both implementing agencies will also draw up a Chart of Accounts that will match the classification ofexpenditures and sources and application of funds in the Development Credit Agreement.
Financial Reporting: UEB and MEMD currently regularly prepare quarterly reports on all projects theyimplement and circulate them to funding agencies and management. The implementing agencies haveagreed to adopt a more structured approach and formats for this quarterly reporting for the Fourth Powerproject. These reporting arrangements will form a suitable basis for the preparation of PMR's for theproject.
GENCO and IDA will sign a separate Project Agreement, in addition to the Development CreditAgreement. As such, the Project Agreement will reflect the requirement of annual submission of financialstatements for the GENCO entity, in addition to the project accounts.
Audit Arrangements: MEMD and GENCO will have their accounts audited by a private firm of auditors,that the Auditor General appoints. The final audit report is signed by the Auditor General and is based onthe private auditing firm's conclusions. With some exceptions in the meeting of agreed deadlines, bothimplementing agencies have in the past submitted project accounts to the IDA as required by the terms ofthe credit agreement. The implementing agencies will develop the terms of reference for the annual auditand include them in their Financial Management Manuals.
Bank accounts: GENCO will open two bank accounts and a Special Account denominated in US dollarsfor its project components. It will provide counterpart funds for project expenditures on the basis ofbudgeted sums in its Operational Accounts. Its Financial Management Manual for the project willdocument the required control procedures over all bank transactions.
MEMD does not currently manage a US Dollar Special Account under the Third Power project. For theThird Power project MEMD operated a bank account denominated in local currency. It used this bankaccount for payments in local currency below a certain level. It also made periodic transfers to it from
- 68 -

UEB's Special Account to cover payments of MEMD's project components.
Under the Fourth Power project, MEMD will open two bank accounts as follows:
* Special Account: Denominated in US dollars, disbursements from the IDA credit will be depositedon this account.
* Project Account: For counterpart funds.
Project Documentation: GENCO and MEMD are currently finalizing their respective ProjectImplementation Plans, which will address the following issues:
* Arrangements for recording inputs and outputs of financial information required to track projectimplementation.
* Arrangements for recording inputs and outputs of physical information so that it will match thefinancial information required.
* Arrangements for recording project impacts, outcomes, outputs, and inputs that are required toassess project progress toward project objectives.
The Project Management Reports (PMR): GENCO and MEMD will develop formats of the ProjectManagement Reports (PMR) required by the Bank under the Financial Management Initiative (FMI) inaccordance with IDA requirements.
Conclusion: Although UEB's and MEMD's current financial management arrangements for projects theymanage are sufficient to comply with minimum IDA requirements, they are not yet adequate to provide,with reasonable assurance, accurate and timely information on the status of the Project as required by theIDA for PMR-based disbursements. Both agencies agreed to a plan of actions to achieve this complianceduring negotiations. The implementation of this action plan so far is satisfactory. UEB has implementedthe majority of the agreed actions, including the completion of a draft accounting manual for the project,opening of books of accounts and completion of Chart of Accounts, agreeing with IDA on financialreporting formats, and opening of bank accounts. MEMD, on the other hand, is behind schedule. It is,however, in the process of recruiting a project accountant and it has opened the required bank accounts. Inaddition, as a condition of credit effectiveness, the Government has agreed to provide IDA with assurancesthat UEB's successor companies will follow the agreed financial management arrangements for the project.Furthermore, these arrangements should form part of the understanding reached between the Governmentand the successor companies at the time of the privatization of the successor companies.
The Bank carried out the assessment of UEB's financial management capability before UEB wasrestructured into three separate companies and it based its conclusions on the plans of the UEB tostrengthen its financial management system at that time. Since UEB will remain the key implementor andguardian of the financial management arrangements for the project (under a contract with GENCO) evenafter the restructuring, the Bank is satisfied that the financial management arrangements are adequate forthe project. However, the terms of the project management services contract between GENCO and UEBneed to state explicitly that UEB has the responsibility for the project's financial management, includingensuring adequate staffing of its accounting department and computerization of the accounting function asper the originally agreed financial management arrangements.
- 69 -

Financial Summary for Revenue Earning Project EntitiesTable A: Power Sector Financial Projections
Years Ending December 31: 1999 through 2006(In Billions of Current Uganda Shillings)
Income Statement Items = Unit Sales (GWh) 876.0 1095.0 1126.0 1212.0 1347.0 2325.0Revenues 85.9 111.7 134.6 169.7 197.7 467.7Operating Income 27.8 33.8 39.9 61.9 85.8 126.9Net Income 4.1 13.1 21.4 26.8 42.9 73.1
Funds Statement ItemsIntemal Sources 51.6 63.6 81.8 112.7 141.3 194.5Borrowings 50.0 85.6 104.2 89.8 78.2 28.0Equity Contributions - - 4.7 3.8 8.1
Total Sources 101.6 149.2 186.0 207.2 223.3 230.6Capital Expenditures 67.7 124.8 149.9 140.7 123.3 75.9Working Capital Increase 23.1 19.0 (37.7) (12.0) 14.2 6.4(Decrease)Dividends - - - 1.4 4.1 19.1Debt Service 10.8 5.4 73.8 77.1 81.7 129.2
Total Applications 101.6 149.2 186.0 207.2 223.3 230.6Balance Sheet Items __-__ _
Current Assets 97.7 109.8 73.4 68.7 76.0 120.7Less Current Liabilities 76.9 41.3 43.5 55.0 64.2 95.2
Net Fixed Assets 678.2 952.4 1132.3 1297.9 1449.3 1847.3Total Assets 699.0 1020.9 1162.2 1311.6 1461.1 1872.8
Debt 380.0 463.4 555.4 639.7 704.7 703.4Equity 319.0 557.5 606.8 671.9 756.4 1169.4
Total Liabililies and Equity 699.0 1020.9 1162.2 1311.6 1461.1 1872.8Financial RatiosOperating Income as a % of 32.3 30.3 29.7 36.5 43.4 27.1RevenueNet Income as a 4.7 11.7 15.9 15.8 21.7 15.6
% of RevenueReturn on Average Invested 4.3 3.9 3.7 5.0 6.2 7.0CapitalDebt Service Coverage 1.8 3.5 1.0 1.3 1.6 1.4Percent of Total CapitalExpenditures financed by 15 26 11 22 40 34Intemal Sources _ _
CurrentRatio 1.3 2.7 1.7 1.2 1.2 1.3Debt as % of TotalCapitalization 54% 45% 48% 490/o 48% 38%
1) When feasible, comparative data on other enterprises in the same industry should be shown.2) Guidance on financial ratios for financial intermediaries is given in OD8.30 Annex A and in an FSD note onperformance indicators ("The Use of Sectoral and Project Performance Indicators in Bank-Financed Sector Operations,"March 1995).
- 70 -

Tables B-E below are on following pages of report:
Table B: Key Operational Financial IndicatorsTable C: Income Statements*Table D: Balance Sheets*Table E: Sources Application of Funds*
*(in Million Uganda Shillings, Current Prices)
- 71 -

Uganda Electricity Board (UEB) Financial Projections Annex 5Key Operational Financial Indicators Table B
Actual Actual Forecast - o1t98 1099 2000 2001 2002 2003 2004 2005 2006
Average Exchange Rate during Year (UShI US$) 1,301 1,460 1,657 1,873 1,918 1,965 2,013 2,062 2,102
Electricity Sent Out (GWh) For Domestic Consumption 1,072 1,169 1,338 1,463 1,553 1,705 1,800 1,939 2,308For Exports 169 18S 232 128 126 126 126 188 681Total 1,241 1,354 1,570 1,591 1,679 1,831 1,926 2,127 2,989of Which: Own Generation 1,234 1,342 1,554 1,573 1,682 1,734 1,829 1,829 1,433
IPP's and Imports 8 13 16 18 18 97 97 297 1,556T & D Lossea (Including Non-Technical) 30.3% 35.3% 30.3% 29.2% 27.8% 26.4% 25.0% 23.6% 22.2%
Electricity Sales (GWh) Domestic 706 702 877 1,005 1,091 1,226 1,324 1,444 1,672Exports 159 174 218 121 121 121 121 180 653Total 865 876 1,095 1,126 1,212 1,347 1,445 1,625 2,325
Growth in Electricity Sales Domestic -0.5% 24.9% 14.6% 8.5% 12.4% 7.9% 9.1% 15.8%Exports 9.5% 25.3% -44.4% 0.0% 0.0% 0.0% 48.8% 262.3%Total 1.3% 25.0% 2.9% 7.6% 11.2% 7.2% 12.5% 43.1%
Number of Customers 155,612 164,225 177,000 189,000 204,000 219,000 234,000 249,000 264,000Number of Employees 2,028 2,025 1,837 1,777 1,792 1,807 1,822 1,837 1,852Customers per Employee 77 81 96 106 114 121 128 136 143Sales (MWh) per Employee 426 433 596 634 677 746 793 884 1256
AvTariff(incl VAT) Domestic USh/kWh 103.3 109.1 111.2 137.1 163.3 171.4 201.5 222.1 258.6Domestic USc/kWh 7.9 7.5 6.7 7.3 8.5 8.7 10.0 10.8 12.3
Av Revenue (excl VAT) Domestic USh/kWh 88.3 93.3 95.0 117.2 139.6 146.5 172.2 189.8 221.0Domestic USclkWh 6.8 6.4 5.7 6.3 7.3 7.5 8.6 9.2 10.5Exports UScVkWh 6.6 7.5 7.2 6.2 6.2 6.2 6.2 6.0 6.8
Change in Av Revenue Domestic In USh terms 5.6% 1.8% 23.3% 19.1% 5.0% 17.6% 10.2% 16.4%Domestic InUScterms -5.9% -10.2% 9.1% 16.3% 2.5% 14.8% 7.6% 14.2%
Av Electricity Revenue Domestic & Exports USchWh 6.76 6.62 6.03 6.25 7.17 7.34 8.36 8.85 9.48Av Operting Expenses Power Purchase & Imports USc/kWh 0.04 0.17 0.18 0.20 0.19 0.18 0.17 0.90 4.28
Fuel (excluding IPP Fuel) UScdkWh 0.07 0.07 0.04 0.03 0-03 0.02 0.02 0.02 0.01Payroll USc/kWh 1.47 1.15 1.14 0.99 0.92 0.85 0.82 0.75 0.53Repairs & Maint for Operations USclkWh 0.93 0.40 0.59 0.67 0.71 0.73 0.74 0.74 0.62Transport&Travelling UScdkWh 0.42 0.27 0.21 0.21 0.20 0.18 0.17 0.16 0.11Administration & Overheads UScdkWh 0.63 0.52 0.35 0.30 0.27 0.24 0.23 0.21 0.15Concessionaires' Fees USr/kWh 0.00 0.00 0.00 0.00 0.21 0.19 0.17 0.15 0.11Depreciation USc/kWh 1.70 1.62 1.22 1.55 1.64 1.60 1.63 1.49 1.06Bad Debts & Obsolete Stock UScdkWh 2.88 0.35 0.56 0.54 0.47 0.24 0.19 0.10 0.09Total Operating Expenses USctkWh 8.14 4.55 4.30 4.49 4.64 4.23 4.15 4.51 6.97
Average Operating Income before Exceptional Items USclkWh -1.37 2.17 1.86 1.89 2.66 3.24 4.33 4.45 2.60
Working Ratio Cash Op ExpensestOp Revenue 0.53 0.38 0.41 0.38 0.32 0.29 0.25 0.31 0.60Operating Ratio Op Expenses/Op Revenue 1.20 0.68 0.70 0.70 0.64 0.57 0.49 0.50 0.73Debt Service Ratio Inlemal Cash Generation/Debt Service Due 0.5 1.8 3.5 1.0 1.3 1.6 1.6 1.6 1.4Self Financing Ratio Funds from Intemal Sources/Av 3 Yrs'Capex 5% 15% 26% 11% 22% 40% 50% 66% 32%Retum on Fixed Assets Op Income/Av Net Revalued Fixed Assels 4.0% 6.3% 5.6% 4.5% 5.8% 6.8% 8.8% 9.7% 7.7%Retum on Equity Net Income/Av Equity 2.6% 3.7% 4.2% 6.0% 10.3% 10.9% 6.6%Dividends as % of Equity Dividens/Av Equity 0.0% 0.0% 0.2% 0.6% 0.8% 1.3% 1.7%Days' Receivable Receivable/Annual Billing Domestic 166 186 150 80 60 45 45 45 45
Exports 109 143 60 60 45 30 30 30 30Current Ratio Current assets/Current Liabilities 1.0 1.3 2.7 1.7 1.2 1.2 1.2 1.2 1.3Debt/Equity Ratio LT Liabilities/invested Capital 48% 54% 45% 48% 49% 48% 45% 41% 38%Net Cash(Overdraft) US$ millions 10 17 18 3 -4 2 3 3 1Capital Investments (inci IDC) USS mitions 63 66 89 92 81 69 51 56 38
-'72 -
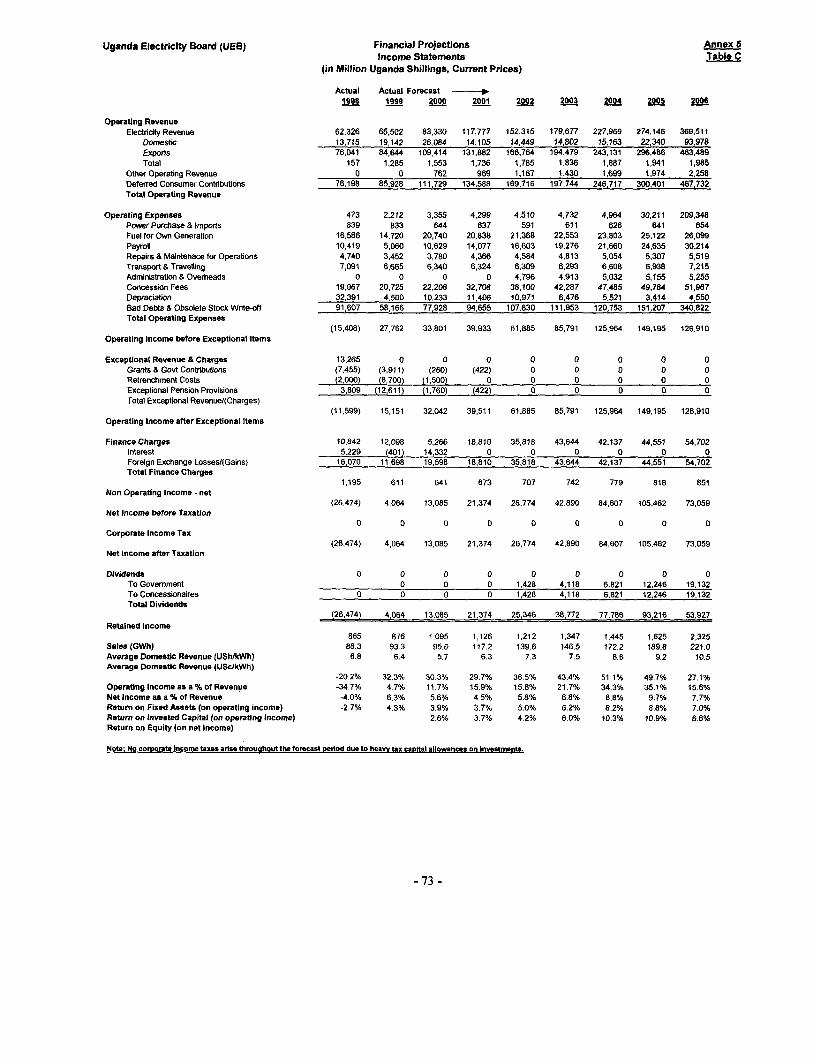
Uganda Electricity Board (UEB) Financial Projections Annex 6Income Statements Table C
(in Million Uganda Shillings, Current Prices)
Actual Actual Forecast Fc1998 1999 2000 2001 2002 2003 2004 2005 200t
Operating RevenueElectridty Revenue 62,326 65,502 83,330 117,777 152,315 179,677 227,969 274,146 369,511
Domestic 13,715 19,142 26,084 14,105 14,449 14,802 15,163 22,340 93,978Exports 76,041 84,644 109,414 131,882 166,764 194,479 243,131 296,486 463,489Total 157 1,285 1.553 1,736 1,785 1,836 1,887 1,941 1,985
Other Operating Revenue 0 0 762 969 1,167 1,430 1,699 1,974 2,258Deferred Consumer Contributons 76,198 85,92B 111,729 134,588 169,716 197,744 246,717 300,401 467,732Total Operating Revenue
Operating Expenses 473 2,212 3,355 4,299 4,510 4,732 4,964 30,211 209,348Power Purchase & Imports 839 833 644 637 591 611 626 641 654Fuel for Own Generabon 16,586 14,720 20,740 20,838 21,368 22,553 23.803 25,122 26,099Payroll 10,419 5,060 10,629 14,077 16,603 19,276 21,660 24,635 30,214Repairs & Maintenace for Operations 4,740 3,452 3,780 4,366 4,584 4,813 5,054 5,307 5,519Transport & Travelting 7,091 6,665 6,340 6,324 6,309 6,293 6,608 6,938 7,215Administration & Overheads 0 0 0 0 4,796 4,913 5,032 5,155 5,255Concession Fees 19,067 20,725 22,206 32,708 38,100 42,287 47,485 49,784 51,967Depreciation 32.391 4,500 10,233 11,406 10,971 6,476 5,521 3,414 4,550Bad Debts & Obsolete Stock Write-off 91,607 58,166 77,928 94,655 107,830 111,953 120,753 151,207 340,822Total Operating Expenses
(15.408) 27,762 33,801 39,933 61,885 85,791 125,964 149,195 126.910Operating Income before Exceptional Items
Exceptionat Revenue & Charges 13,265 0 0 0 0 0 0 0 0Grants & Govt Contributions (7,455) (3,911) (260) (422) 0 0 0 0 0Retrenchment Costs (2,000) (8,700) (1,500) 0 0 0 0 0 0Exceptional Pension Provisions 3,809 (12,611) (1,760) (422) 0 0 0 0 0Total Exceptional Revenuel(Charges)
(11,599) 15,151 32,042 39,511 61,885 85,791 125,964 149,195 126,910Operating Income after Exceptional Items
Finance Charges 10,842 12,098 5,266 18,810 35,818 43,644 42,137 44,551 54,702Interest 5,229 (401) 14,332 0 0 0 0 0 0Foreign Exchange Lossesl(Gains) 16,070 11,698 19,598 18,810 35,818 43,644 42,137 44,551 54,702Total Finance Charges
1,195 611 641 673 707 742 779 818 851Non Operating Income - net
(26,474) 4,064 13,085 21,374 26,774 42,890 84,607 105,462 73,059Net Income before Taxation
0 0 0 0 0 0 0 0 0Corporate Income Tax
(26,474) 4,064 13,085 21,374 26,774 42,890 84,607 105,462 73.059Net income after Taxation
Dividends 0 0 0 0 0 0 0 0 0To Government _ 0 0 0 1,428 4,118 6,821 12,246 19,132To Concessionaires 0 0 0 0 1,428 4,118 6,821 12,246 19,132Total Dividends
(26,474) 4,064 13,085 21,374 25,346 38,772 77,786 93,216 53,927Retained Income
865 876 1,095 1,126 1,212 1,347 1,445 1,625 2,325Sales (GWh) 88.3 93.3 95.0 117.2 139.6 146.5 172.2 189.8 221.0Average Domestic Revenue (USh/kWh) 6.8 6.4 5.7 6.3 7.3 7.5 8.6 9.2 10.5Average Domestic Revenue (USc/kWh)
-20.2% 32.3% 30.3% 29.7% 36.5% 43.4% 51.1% 49.7% 27.1%OperatingIncomeasa%of Revenue -34.7% 4.7% 11.7% 15.9% 15.8% 21.7% 34.3% 35.1% 15.6%Net Income as a % of Revenue -4.0% 6.3% 5.6% 4.5% 5.8% 6.8% 8.8% 9.7% 7.7%Return on Fixed Assets (on operating income) -2.7% 4.3% 3.9% 3.7% 5.0% 6.2% 8.2% 8.8% 7.0%Return on Inveated Capital (on operating income) 2 6% 3.7% 4.2% 6.0% 10.3% 10.9% 6.6%Return on Equity Ion net income)
Note: No cororat. income taxes arise throuahout the forecast Period due to heavy tax capital allowances on investments.
-73 -

Uganda Electricity Board (UEB) Financial Projections Annex 5Balance Sheets Table D
(in Million Uganda Shillings, Current Prices)
Actual Actual Forecast -
1998 1999 2000 2001 2002 2003 2004 2005 2006AssetsFixed Assets
Fixed Assets in Service 1,013,076 1,016,900 804,787 1,018,000 1,237,673 1,501,205 1,659,528 1,833,881 2,017,876Less: Accumulated Depreciation 565,457 585,040 7,016 40,075 80,178 126,473 180,282 239,080 300,611Net Book Value 447,618 431,860 797,771 977,925 1,157,495 1,374,732 1,479,246 1,594,801 1,717,265Work in Progress 147,289 239,421 147,377 147,073 133,005 67,119 85,520 110,640 80,011Project Funds & Bujagali Security Deposit 1,815 2,454 2,775 2,843 2,912 2,983 23,428 44,868 45,525Net Fixed Assets 596,723 673,734 947,923 1,127,841 1,293,412 1,444,834 1,588,194 1,750,309 1,842,800
Investments 4,485 4,485 4,485 4,485 4,485 4,485 4,485 4,485 4,485
Current AssetsCash & Bank 13,487 25,853 32,396 6,088 0 4,790 5,874 6,775 2,442Accounts Receivable 37,238 46,480 44,355 32,521 31,076 27,134 34,130 41,381 61,025Other Debtors 19,658 12,042 8,930 9,376 9,845 10,337 10,854 11,397 11,853Stock 10,306 13,373 24,144 25,450 27,848 33,777 37,339 41,262 45,402Total Current Assets 80,689 97,749 109,825 73,435 68,768 76,038 88,198 100,815 120,722
Current LiabilitiesBank Overdraft 0 0 0 0 7,099 0 0 0 0Trade&OtherCreditors 18,736 13,004 6,410 7,794 8,064 8,221 8,964 11,811 25,284Corporate Tax 785 410 0 0 0 0 0 0 0Overdue Debt Service 45,014 59,293 0 0 0 0 0 0 0Current Portion of Long-Term Loans 12,955 4,214 34,860 35,684 39,873 55,975 64,451 69,934 69,934Total Current Liabilities 77,490 76,922 41,269 43,478 55,036 64,196 73,415 81,745 95,218
Net CurrentAssets/(Liabilities) 3,199 20,827 68,555 29,957 13,732 11,842 14,782 19,069 25,504
Total Assets 604,407 699,046 1,020,963 1,162,283 1,311,629 1,461,162 1,607,462 1,773,863 1,872,790
Financed BY:Equity 314,908 318,971 557,509 606,863 671,894 756,406 890,600 1,053,369 1,169,377
Long-Term LiabilitiesLoans 277,348 344,430 449,704 533,564 610,003 678,661 685,893 680,959 649,039Less: Current Portion 12,955 4,214 34,860 35,684 39,873 55,975 64,451 69,934 69,934Long-Term Portion 264,392 340,216 414,844 497,880 570,130 622,666 621,442 611,025 579,105Pension & Retrenchment Provisions 4,014 12,714 13,214 13,875 14,568 15,297 16,062 16,865 17,539Consumer Deposits 2,953 4,293 6,316 8,660 12,151 15,816 20,123 24,870 30,398Deferred Consumer Contributions 18,140 22,852 29,080 35,005 42,866 50,957 59,235 67,735 76,370Total Long-Term Liabilities 289,499 380,075 463,454 555,420 639,736 704,756 718,861 720,494 703,413
Total Invested Capital 604,407 699,046 1,020,963 1,162,283 1,311,629 1,461,162 1,607,462 1,773,863 1,872,790
Days' Receivable (Domestic) 166 186 150 80 60 45 45 45 45Days' Receivable (Exports) 109 143 60 60 45 30 30 30 30Current Ratio 1.0 1.3 2.7 1.7 1.2 1 1.2 1.2 1.3Debt asa % of Total Capitalization 48% 54% 45% 48% 49% 48% 45% 41% 38%
Note: Fised assets were Professionallv revalued In 2000 end orice Indexed from thereon.
- 74 -

Uganda Electricity Board (UEB) Financial Projections Annex 5Sources Application of Funds Table E
(in Million Uganda Shillings, Current Prices)
Actual Actual Forecast -* Total1998 1999 2000 2001 2002 2003 2004 2005 2006 2001-06
SourcesFunds From Operations
Operating Income afterExceptional Items (11,599) 15,151 32,042 39,511 61,885 85,791 125,964 149,195 126,910 589,256Non Operating Income - net 1,195 611 641 673 707 742 779 81B 851 4,571Realized Exchange Losses (5,229) 401 0 0 0 0 0 0 0 0Corporate Income Tax 0 0 0 0 0 0 0 0 0 0Adjustments for Non-Cash Items:
Depreciation 19,067 20,725 22,206 32,708 38,100 42,287 47,485 49,784 51,987 262,331Pension & Retrenchment Provisions (net of payments) 2,000 8,700 500 661 694 728 765 803 675 4,325Deferred Consumer Contnibutions Released to Income 0 0 (762) (969) (1,167) (1,430) (1,699) (1,974) (2,258) (9,497)
Internal Cash Generation 5,435 45,587 54,627 72,583 100,218 128,119 173,295 198,626 178,145 850,986(Increase)/Decrease in Working Capital (excd Cash) 5,499 (10,800) (12,537) 11,466 (1,151) (2,323) (10,332) (8,869) (10,767) (21,977)Consumer Deposits 1,236 1.340 2,023 2,344 3,491 3,664 4,308 4,747 5,528 24,082Consumer Contribution from New Connections 3,816 4,713 6,990 6,894 9,048 9,501 9,976 10,475 10,894 56,787
FundsfromOperations 15,985 40,839 51,103 93,287 111,607 138,960 177,247 204,978 183,799 909,878
Other Sources of FundsEquity Contribution - Govemmen1 0 0 0 0 0 0 0 0 0 0Equity Contribution - Concessionaires 0 0 0 4,707 4,261 5,185 13,685 10,976 38,814Borrowing 61,702 50,643 85,991 104,215 89,771 78,333 40,808 43,693 28,747 385,566Project Funds (329) (639) (321) (88) (89) (71) (20,445) (21,440) (6571 (42,750)
Total Sources of Funds 77,358 90,843 136,773 197,434 206,016 221,483 202,795 240,915 222,866 1,291,509
ApolicationsDebt Service
Interest to Operations 10,842 12,098 5,266 18,810 35,818 43,644 42,137 44,551 54,702 239,661]DC 20,968 29,395 22,518 22,727 14,011 12,454 17,347 15,678 4,098 86,315Repayment Of Loan Capital 0 12,955 4,639 35,285 36,119 40,359 56,657 65,237 70,446 304,104TotalDebtServiceDue 31,810 54,448 32,423 76,822 85,948 96,457 116,141 125,467 129,245 630,080Less: Interest Financed (20,375) (29,395) (26,390) (3,022) (8,868) (14,772) (6,499) 0 0 (33,160)Less: Unpaid Debt Service - (lncrease)/Decrease 4,719 (14,279) (662) 0 0 0 0 0 0 0Debt Service Paid 16,154 10,775 5,371 73,800 77,080 81,685 109,642 125,467 129,245 596,920
Capital Expenditure (excluding lOC) 60,951 67,703 124,859 149,943 140,694 123,309 84,316 100,818 75,913 674,993Repayment of Concessionaires Equity Capital 0 0 0 0 0 482 930 1,484 2,908 5,805Dividends 0 0 0 0 1,428 4,118 6,821 12,246 19,132 43,744
TotalApplicationsof Funds 77,105 78,477 130,230 223,743 219,202 209,595 201,710 240,015 227,198 1,321,463
lncreasellDecrease) in Cash Balances 253 12,366 6,544 (26,309) (13,187) 11,888 1,085 901 (4,332) (29,954)
Net Cash Balance at Year End 13,487 25,853 32,396 6,088 (7,099) 4,790 5,874 6,775 2,442 2,442
Debt Service Ratio 0.5 1 B 3-5 1.0 1-3 1.6 1-6 1.6 1.4 1.4Self-financing Ratio 5% 15% 26% 11% 22% 40% 50% 66% 32% 34%
- 75 -

Main Assumptions
Principal Assumptions for Financial Projections (2000 to 2006)
General
The financial projections (2000 to 2006) are based on the latest available data and information obtainedfrom UEB and other appropriate sources. The base data for 1999 and 2000 was obtained from UEB'saudited financial statements for 1999 and its approved budget for 2000 and latest quarterly managementaccounts to August 2000.
The Govemment has began the restructuring of the power sector. As a first step it divided UEB into threecorporate entities in late March 2001, one each for generation, transmission, and distribution. In a secondstep, it will concession out to the private sector the operation and management of the generation anddistribution facilities. The three entities will continue to operate on a consolidated basis until theconcessioning has been completed. Since the proposed project will be under implementation prior to thecompletion of the concessioning, the financial analyses for the project has been based on the unbundledpower sector for which data is available. The financial projections have considered appropriate financialrestructuring, efficiency improvements, dividends and price-indexed valuation of fixed assets.
Tables B through E above provide the "Base Case" financial projections. In addition to the "Base Case",the analysis considered two alternative debt restructuring options which are provided in Table F at the endof this section.
Macroeconomic Assumptions
The financial projections are prepared in current Uganda Shillings, using the following inflation andexchange rate forecasts:
2000 2001 2002 2003 2004 2005 2006
Domestic inflation 5.0% 5.0% 5.0% 5.0% 5.0% 5.0% 5.0%
Foreign inflation 2.5% 2.5% 2.5% 2.5% 2.5% 2.5% 2.5%
Ave ex rate (USh/IUS$) 1657 1873 1918 1965 2013 2062 2102
Ex rate at Dec 31 (USh/IlUS$) 1850 1895 1941 1989 2037 2087 2117
Source: World BankExchange rates (USh to US$) have been estimated on the basis of inflation differential.
Energy and Sales
Forecast of energy requirements is based on the "base" case load forecast, as reviewed by Electricite deFrance (EdF) in January 2001. The financial analysis restricts energy demand to available energy supplydue to hydrological constraints. Units 13, 14 and 15 at Kiira are assumed to be commissioned on January1, 2003, October 1, 2003 and December 1, 2003 respectively. The first unit (50MW) of Bujagali IPP isforecast to come on line on July 1, 2005 and the remaining units (150MW) are expected to be operational
- 76 -

on January 1, 2006. In addition, supply from the proposed Kakira sugar plant is assumed to go ahead andcome on line in 2003. The analysis further assumes that the level of losses will be reduced over the yearsfollowing investments in rehabilitation and reinforcement of the network and because of measures theutilities will take to cut non-technical losses. Exports to Kenya are estimated at the existing contractedsupply of 1OMW (for 12 hours during peak and daytime) and 30MW (for 6 hours during off-peaknighttime) up to June 30, 2005. Thereafter, exports to Kenya are assumed at the rate of 80MW firm supplyfor 24 hours a day, based on 200MW supply from Bujagali. Exports to Tanzania (5MW) and Rwanda(lMW) are assumed at current levels throughout the forecast period. For the years up to 2005, the analysisassumes that the domestic market will take up the balance of available energy supply. The following tableprovides a summary of forecast energy sent out, energy sales, sales growth and losses.
2000 2001 2002 2003 2004 2005 2006
Energy sent out (GWh) 1570 1591 1679 1831 1926 2127 2989
Energy sales: domestic (GWh) 877 1005 1091 1226 1324 1444 1672
Energy sales: exports (GWh) 218 121 121 121 121 180 653
Energy sales: total (GWh) 1095 1126 1212 1347 1445 1625 2325
Sales growth: domestic 24.9% 14.6% 8.5% 12.4% 7.9% 9.1% 15.8%
T&D Losses 30.3% 29.2% 27.8% 26.4% 25% 23.6% 22.2%
Domestic Electricity Tariffs
The analysis assumed that the FY2001 weighted average domestic (i.e. excluding exports) tariff is95USh/kWh (after this financial analysis was finalized, electricity tariffs were increased to 172 USh/kWhon June 1, 2001). From 2002 onwards, the analysis assumes that domestic electricity tariffs are adjustedannually for the effects of forecast inflation and exchange rate movements. For this purpose, the powersectors' revenue requirements each year are split between foreign and local cost components, these average67/33 for the first three years and 81/19 in 2005/06. The weighting of foreign cost component increasessignificantly in 2005/06 due to the impact of the Bujagali hydropower project capacity payments.
In addition, the analysis rises domestic electricity tariffs in real terms to meet the following minimumfinancial criteria over six years from 2001 to 2006:
* Debt service cover of 1.0 times in 2001 and 1.3 times from 2002 onwards of net operatingrevenue before depreciation,
* A current ratio of 1.0 times in 2001 and 1.2 times from 2002 onwards.
Table F summarizes the required tariff levels and tariff increases over the next six years to 2006 underthree different financial restructuring options.
Export Tariffs
The following table shows the projected export tariffs used in the analysis:
-77 -
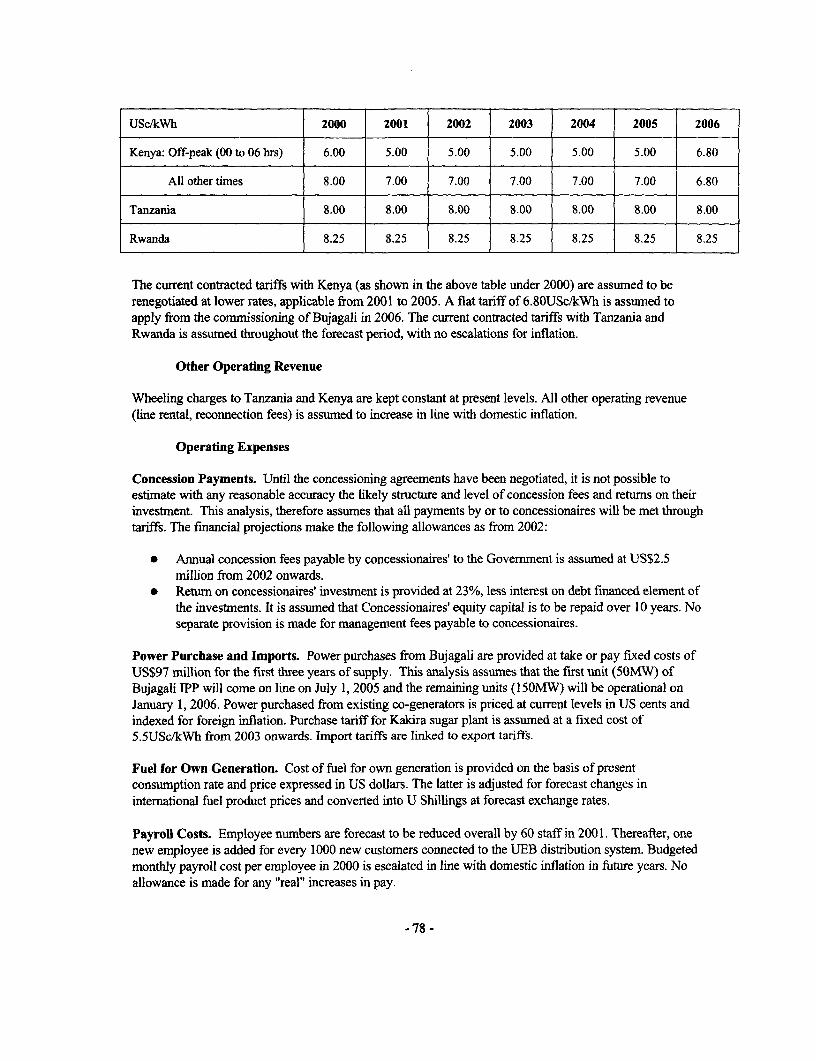
USc/kWh 2000 2001 2002 2003 2004 2005 2006
Kenya: Off-peak (00 to 06 hrs) 6.00 5.00 5.00 5.00 5.00 5.00 6.80
All other times 8.00 7.00 7.00 7.00 7.00 7.00 6.80
Tanzania 8.00 8.00 8.00 8.00 8.00 8.00 8.00
Rwanda 8.25 8.25 8.25 8.25 8.25 8.25 8.25
The current contracted tariffs with Kenya (as shown in the above table under 2000) are assumed to berenegotiated at lower rates, applicable from 2001 to 2005. A flat tariff of 6.8OUSc/kWh is assumed toapply from the commissioning of Bujagali in 2006. The current contracted tariffs with Tanzania andRwanda is assumed throughout the forecast period, with no escalations for inflation.
Other Operating Revenue
Wheeling charges to Tanzania and Kenya are kept constant at present levels. All other operating revenue(line rental, reconnection fees) is assumed to increase in line with domestic inflation.
Operating Expenses
Concession Payments. Until the concessioning agreements have been negotiated, it is not possible toestimate with any reasonable accuracy the likely structure and level of concession fees and returns on theirinvestment. This analysis, therefore assumes that all payments by or to concessionaires will be met throughtariffs. The financial projections make the following allowances as from 2002:
3 Annual concession fees payable by concessionaires' to the Government is assumed at US$2.5million from 2002 onwards.
* Return on concessionaires' investment is provided at 23%, less interest on debt financed element ofthe investments. It is assumed that Concessionaires' equity capital is to be repaid over 10 years. Noseparate provision is made for management fees payable to concessionaires.
Power Purchase and Imports. Power purchases from Bujagali are provided at take or pay fixed costs ofUS$97 million for the first three years of supply. This analysis assumes that the first unit (50MW) ofBujagali IPP will come on line on July 1, 2005 and the remaining units (150MW) will be operational onJanuary 1, 2006. Power purchased from existing co-generators is priced at current levels in US cents andindexed for foreign inflation. Purchase tariff for Kakira sugar plant is assumed at a fixed cost of5.5USc/kWh from 2003 onwards. Import tariffs are linked to export tariffs.
Fuel for Own Generation. Cost of fuel for own generation is provided on the basis of presentconsumption rate and price expressed in US dollars. The latter is adjusted for forecast changes ininternational fuel product prices and converted into U Shillings at forecast exchange rates.
Payroll Costs. Employee numbers are forecast to be reduced overall by 60 staff in 2001. Thereafter, onenew employee is added for every 1000 new customers connected to the UEB distribution system. Budgetedmonthly payroll cost per employee in 2000 is escalated in line with domestic inflation in future years. Noallowance is made for any "real" increases in pay.
-78 -

Repairs and Maintenance for Operations. Repairs and maintenance costs for generation, transmissionand distribution are provided in terms of units of energy produced, sent out and sold in the domesticmarket. Budgeted unit prices in 2000 are expressed in USc/kWh. In recognition of past inadequatemaintenance of the network, costs are assumed to increase in real terns by 5% annually from 2001 and2002. Thereafter, costs are escalated in line with international inflation. The derived US dollar costs aretranslated into U Shillings at forecast exchange rates.
Transport and Traveling. Budgeted 2000 costs are increased in real terrns by 10% in 2001. Thereafter,costs are increased line with domestic inflation.
Administration and overheads. Budgeted 2000 costs are assumed to decrease in real terrns by 5%annually from 2001 to 2003. Thereafter, costs are assumed to increase in line with domestic inflation.
Depreciation. Depreciation is provided on opening net revalued fixed assets at the following rates:
Existing at 12/31/99 Additions post 1999
Generation assets:
Civil works 1.25%
Plant & machinery 2.85% 2.50%
Transmission assets 5.20% 2.50%
Distribution assets 5.58% 3.33%
All other assets 16.81% 20.0%
Bad Debts and Obsolete Stock Write-off. Bad debts and obsolete stocks are assuned at the followingrates:
2000 2001 2002 2003 2004 2095 2006
Bad debts as % of current year billing 10% 8% 6% 3% 2% 1% 1%
Obsolete stock as % of closing stock 2% 1 .5% 1% 0.5% 0.5% 0.5% 0.5%
Retrenchment Costs. Provision is made for costs of projected retrenchment. Average cost of retrenchmentper employee is assumed at USh 6.7 million in 2000 prices. A provision of UShl billion was set aside in1999 for costs of retrenchment in 2000.
Pension Liabilities. An actuarial valuation of UEB's pension liabilities up to end 2001 has been estimatedat UShI3.9 billion. For this purpose, an exceptional provision of UShl.5 bil'ion has been charged againstincome in 2000.
-79 -

Non Operating Income - net. 1999 non-operating income is escalated in line with domestic inflation infuture years.
Corporate Income Tax. Provision is made for corporate income tax based on the present tax rate of 30%and applied to taxable income according to current legislation. Deductions for capital allowances are basedon the recently announced rates. Tax liability, if any, is assumed to be paid 50% during the current yearand the balance in the next following year. In view of planned heavy investments during the forecast period,it is unlikely that any corporate taxes will arise over the next seven years.
Dividends. Dividends (or returns) to concessionaires' are provided as from 2002 onwards. As indicatedabove, return on concessionaires' investment is provided at 23%, less interest on debt financed element ofthe investments. No dividends are provided on Governnent equity as the Government does not expect toreceive any returns on its investment in the power sector. It is assumed that 50% of all dividends are paidduring the current year and the balance in the next subsequent year.
Investments, Fixed Assets and Work in Progress. Projected investments and financing thereof aredetailed in the table below. Investments during 2001 to 2006 are provided at US$101 million forgeneration, US$128 million for transmission and US$106 million for distribution. All new investments ingeneration (purely rehabilitation) and distribution from 2002 onwards are assumed to be funded byconcessionaires through debt (75%) and equity (25%) funding. Investments in generation are restricted torehabilitation of existing facilities. Investments in new generation in the future are assumed to beundertaken by IPP's.
All figures in current 2001 2002 2003 2004 2005 2006 2001-06US$ millions.
Investments in:
Generation 43.0 22.1 21.3 6.9 5.1 3.0 101.4(29.5%)
Transmission 11.7 34.2 29.7 22.1 18.0 12.3 128.0 (37.3%)
Distribution 24.2 15.8 10.3 11.4 24.6 19.6 105.9 (30.9%)
Administration 1.2 1.2 1.5 1.5 1.2 1.2 7.8 (2.3%)
Total Investments 80.1 73.3 62.8 41.9 48.9 361 343.1 (100%)
Financing Plan:
Borrowing (Donors) 55.6 43.5 37.0 16.8 12.3 6.7 171.9 (50.1%)
Private Capital: Borrowing - 3.3 2.9 3.4 8.8 7.0 25.4 (7.4%)
Equity Distribution - 2.5 2.2 2.6 6.6 5.2 19.1 (5.6%)
Customer Contributions 3.7 4.7 4.8 5.0 5.1 5.2 28.5 (8.3%)
Internal Resources 20.8 19.3 15.9 14.1 16.1 12.0 98.2 (28.6%)
-80 -

Total Financing 80.1 | 73.3 | 62.8 | 41.9 | 48.9 | 36.1 | 343.1
Assets under construction are shown under work in progress in the balance sheet. Costs of assets, includinginterest during construction, are transferred from work in progress to fixed assets on their commissioning.
Fixed assets in the audited financial statements were last revalued in 1997. Fixed assets in the projectedbalance sheets are stated at revalued amounts. The latest valuation carried out by the transaction advisors,is reflected in the balance sheet as at December 31, 2000. Preliminary estimates indicate a valuation ofUS$454 million of all of UEB's fixed assets other than land, buildings, vehicles and office equipment. In allfuture years, fixed assets are indexed to inflation and exchange rates, as forecast. Costs of all assets areassumed to be split 70 percent foreign and 30 percent local.
Revaluation surpluses on fixed assets are taken to equity. All exchange losses on long-term loans areset-off against fixed assets revaluation surpluses taken to equity.
New Connections, Customer Contributions and Deposits. New customer connections are forecast at12,775 in 2000, 12,000 in 2001 and 15000 annually thereafter. The analysis does not consider newconnections through the rural electrification program as it assumes that Governmnent will finance suchinvestments in the future. Customer contributions and deposits per new connection are forecast at actual1999 average and escalated by the projected annual average increase in electricity tariffs for the domesticmarket. Customer contributions are classified as deferred long-tern liabilities. Deferred contributions areamortized over 30 years, being the average life of distribution assets, and recognized as income in theincome statement.
Project Funds. Project funds in the balance sheet are retained at US$1.5 million equivalent throughout.
Investment in Amber House. The historical cost of investment in Amber House Limited (investmentholding company for UEB head office building) is retained in the balance sheet at constant valuethroughout.
Security Deposit for Bujagali. The analysis assumes that Government shall place US$20 million into anescrow bank account as security. The funds are to be built-up during construction of the Bujagali project.Such a deposit has been set aside in two equal installments of US$ 10 million each in 2004 and 2005.
Accounts Receivable and Payable. Accounts receivable and payable at the balance sheet date are forecastas follows:
2000 2001 2002 2003 2004 2005 2006
Days' receivable: Domestic 150 80 60 45 45 45 45
Exports 60 60 45 30 30 30 30
Accounts payable 30 30 30 30 30 30 30
PAYE and VAT payable 30 30 30 30 30 30 30
Project creditors financed from own resources 30 30 30 30 30 30 30
- 81 -

Note: The table shows the receivables and payables in number of days.
The analysis assumes that the Government and the National Water and Sewerage Corporation (NWSC)have settled their overdue electricity bills of Ush 14 billion and USh2.2 billion respectively in early 2001.For GOU accounts, the settlement may be by way of exchange of cheques against UEB's debt serviceobligations to GOU. The NWSC will settle its electricity accounts on the understanding that GOU willsettle its old dues to the water utility. It is further assumed that all GOU agencies will promptly pay theirelectricity bills from 2001 onwards.
Other Debtors and Prepayments. Other debtors and prepayments as at 12/31/99 are assumed to increasein line with domestic inflation in future years.
Stock. Stock of goods and materials at the balance sheet date is forecast at 3.0% in 2000, 2.5% in 2001and at 2.25% thereafter of closing net fixed assets value.
Long-term Loans and Deferred Debt Service (principal and interest). Three financial restructuringoptions involving UEB's existing debt portfolio (including deferred debt service) have been considered anddetailed in Annex 5, Attachment 3. In cases of existing on-lent loans where on-lending agreements betweenGOU and UEB are not in place, terms similar to those previously negotiated and involving the same donorsare assumed. For all proposed future borrowing, the following terms have been assumed:
Fourth Power Fourth Power All other(IDA) (Co-financiers) Investments
Commitment fee per annum 0% 0% 1%
Interest rate annum 7.1% 9% 12%
Interest grace 3 years 3 years None
Repayment grace 3 years 3 years 3 years
Repayment period (including grace 15 years 15 years 9 yearsperiod)
Exchange risk UEB/Successors UEB/Successors UEB/Successors
Foreign currency costs to the extent of 70 percent for all future investments in transmission are assumed tobe financed through borrowing, and the balance from internal resources of the Transmission Company.Interest accruing during construction is capitalized under work in progress.
Government Grants and Equity Contributions. Apart from the proposed conversion of deferred debtservice and loans, as indicated above, no further support from the Govermnent to the power sector has beenassumed in the financial projections.
Table F below is on the following page of the report:
- 82 -

Uganda Electricity Board (UEB) Financial Projections Annex 5Results and Basis of Alternative Financial Restructuring Options Table F
2001 2002 2003 2004 2005 2006 CumulativeTargets (minimum)
Debt Service Ratio (DSR) 1.0 1.3 1.3 1.3 1.3 1.3Current Ratio (CR) 1.0 1.2 1.2 1.2 1.2 1.2
Summary ResultsOption 1 (Base Case) "Real" Tariff Increase 40% 0% 0% 12% 5% 12% 84%
Av Domestic Revenue (USclkWh) In current prices 6.3 7.3 7.5 8.6 9.2 10.5In 2000 prices 6.1 6.9 6.9 7.7 8.0 8.8
Option 2 (Worst Case) "Real" Tariff Increase 70% 4% 0% 0% 0% 4% 84%Av Domestic Revenue (USc/kWh) In current prices 7.1 9.2 9.4 9.6 9.9 10.5
In 2000 prices 7.0 8.7 8.7 8.6 8.6 8.8Option 3 (Best Case) "Real" Tariff Increase 24% 7% 0% 14% 9% 11% 03%
Av Domestic Revenue (USc/kWh) In current prices 5.8 6.9 7.1 8.3 9.2 10.4In 2000 prices 5.6 6.5 6.5 7.4 B.0 8.8
Dates of "Real" Tariff Increase (under all options) 611 1/t 111 111 111 1/1
Option I (Base Case)"Real" Tariff Increases as needed to achieve targets 40% 0% 0% 12% 5% 12% 84%Av Domestic Revenue (USc/kWh) 6.3 7.3 7.5 8.6 9.2 10.5DSR 1.0 1.3 1.6 1.6 1.6 1.4 1.4SFR 11% 22% 40% 50% 66% 32% 34%ROE 3.7% 4.2% 6.0% 10.3% 10.9% 6.6% 6.9%Return on Fixed Assets (Op Income/Av Net Revalued fixe 4.5% 5.8% 6.8% 8.8% 9.7% 7.7% 7.5%CR 1.7 1.2 1.2 1.2 1.2 1.3Cash at Dec 31 (US$ millions) 3.2 -3.7 2.4 2.9 3.2 1.2Dividends as % of Equity 0.0% 0.2% 0.6% 0.8% 1.3% 1.7% 0.8%Total Domestic Revenue (US$ millions) 63 79 91 113 133 176 656
OPtion 2 (Worst Case)"Real" Tariff Increases as needed to achieve targets 70% 4% 0% 0% 0% 4% 84%Av Domestc Revenue (USc/kWh) 7.1 9.2 9.4 9.6 9.9 10.5DSR 1.0 1.5 1.8 1.6 1.5 1.3 1.4SFR 8% 34% 64% 60% 68% 23% 41%ROE 6.1% 10.4% 12.7% 13.8% 12.8% 6.3% 9.6%Retum on Fixed Assets (Op Income/Av Net Revalued fixe 6.2% 9.3% 10.4% 10.8% 11.0% 7.6% 9.4%CR 1.0 1.2 1,6 1.8 2.0 1.8Cash at Dec 31 (US$ millions) 0.5 3.6 26.2 33.8 36.6 31.7Dividends as % of Equity 0.0% 0.3% 0.6% 0.9% 1.3% 1.7% 0.9%Total Domestic Revenue (US$ millions) 72 100 115 128 143 175 733
Option 3 (Best Caset"Real" Tariff Increases as needed to achieve targets 24% 7% 0% 14% 9% 11% 83%Av Domestic Revenue (USc/kWh) 5.8 6.9 7.1 8.3 9.2 10.4DSR 1.0 1.3 1.6 1.6 1.6 1.4 1.4SFR 12% 21% 38% 49% 68% 33% 34%ROE 2.6% 3.2% 4.8% 9.3% 10.9% 6.3% 6.3%Return on Fixed Assets (Op IncomelAv Net Revalued fixe 3.6% 5.1% 6.1% 8.3% 9.7% 7.5% 7.1%CR 1.9 1.4 1.2 1.2 1.2 1.3Cash at Dec 31 (US$ millions) 4.0 -3.4 1.3 0.9 2.3 0.5Dividends as % of Equity 0.0% 0.2% 0.6% 0.8% 1.3% 1.7% 0.8%Total Domestic Revenue (US$ millions) 58 75 87 109 133 174 637
Basis of Alternative Financial Restructuring OptionsOption I (Base Case)7 Convert to equity all overdue debt service (US$31 million) up to 12131/00 on all "old "on-lent loans,
including US$5 million relating to non-grant funded loans.Convert to equity all "old" grant funded on-lent loan balances (US$50 million) as at 12/31/00.
El Defer all debt service due on Power IlIl loans. Repayments to commence from 2001.-i Start debt service payments on all remaining and new loans as they fall due as from 2001.Option 2 tWorst Case)7i Convert to equity all overdue debt service (US$26 million) up to 12131/00 on all "old" grant funded on-lent loans.I All remaining overdue debt service (US$5 million) to be repaid equally over 5 years commencing 2001.
7 Defer all debt service due on Power Ill loans. Repayments to commence from 2001.Start debt service payments on all remaining and new loans as they fall due as from 2001.
Option 3 (Best Case)7 Convert to equity all overdue debt service (US$31 million) up to 12131/00 on all "old " on-lent loans,
including US$5 million relatng to non-grant funded loans.Convert to equity all "old" loan balances (US$70 million) as at 12/31/00 (i.e. including non-grant funded loans).
7 Defer all debt service due on Power IlIl loans. Repayments to commence from 2001.- Start debt service payments on all remaining and new loans as they fall due as from 2001.Note:"Old" refers to all Treasury, Power II, JICA IlIl and JICA IV loans. It excludes all loans associated with Power IlIl and subsequent projects.
- 83 -

Annex 6: Procurement and Disbursement ArrangementsUGANDA: FOURTH POWER PROJECT
Procurement
General:
1. Procurement of all goods, civil works, supply and installation of plant and equipment and servicesto be financed under the IDA Credit will be procured in accordance with the appropriate Bank'sGuidelines: Procurement under IBRD Loans and IDA Credits, (January 1995 and as revised in Januaryand August 1996, September 1997 and January 1999). Consulting services by firms or individuals to befinanced by IDA will be awarded through contracts in accordance with the Bank's Guidelines: Selectionand Employment of Consultants by World Bank Borrowers, (January 1997 and as revised in September1997 and January 1999). The appropriate World Bank's Standard Bidding Documents for all InternationalCompetitive Bidding (ICB) and National Competitive Bidding (NCB) with any appropriate modifications,will be used. The World Bank's Standard Request for Proposals (RFP) will be used for the selection ofconsultants. For details on project costs by procurement arrangements refer to Table A.
Procurement Organization and Capacity Assessment:
2. Procurement of all goods, civil works, supply and installation of plant and equipment and servicesunder the project will be the responsibility of the UEB and the Ministry of Energy and MineralDevelopment (MEMD) with assistance from procurement consultants. The procurement capacityassessment carried out at appraisal concluded that UEB has the general organizational and staff capacity tocarry out procurement under the proposed project. Most members of the implementation unit will compriseof staff from the Third Power Project and several of the staff are already familiar with Bank procurementprocedures. In addition, UEB has recruited a project manager, with expertise in management of powerplant projects, and will strengthen the project accounting team.
3. However, UEB's main weakness is the lack of a proper record keeping system, both at the projectsite (where the Project Manager will be based) and at the head office (where the Project Coordinator andProject Accountant will be based). UEB has agreed to take immediate action to implement goodrecord-keeping systems at both the project site and the head office.
4. The detailed assessment for MEMD shows that the following actions are required to strengthen itsprocurement capacity: (i) provision of procurement training (available within the region at ESAMI) formembers of the project unit; (ii) appointment of at least one dedicated member (coordinator) for the projectimplementation unit; and (iii) implementation of a proper record-keeping system for the project. Theproject coordinator has been appointed.
5. Advertising: A General Procurement Notice (GPN) was published in the UN DevelopmentBusiness (UNDB) on April 16, 2000. It indicated all the procurement contracts estimated to cost theequivalent of US$100,000 or more where the International Competitive Bidding (ICB) method ofprocurement would be used. The GPN will be updated annually. All consultancy assignrnents estimated tocost the equivalent of US$200,000 or more will be advertised in an international newspaper and in theUNDB. In addition, expressions of interest may be sought from prospective consultants by advertising in anational newspaper and or technical magazine. In the case of assignments estimated to cost US$100,000 orless the assignment may be advertised nationally and the shortlist may be made up entirely of national
- 84 -

consultants provided that at least three qualified national firms or individuals are available in the countryand foreign consultants who wish to participate are not excluded from consideration.
6. Procurement Planning: A final Overall Procurement Plan (OPP) for goods, works, supply andinstallation of plant and equipment and consultant services which will be part of the Project ImplementationPlan PIP was reviewed at appraisal and finalized at negotiations. The OPP includes relevant informationon goods, works, supply and installation of plant and equipment and consulting services as well as thetiming of each milestone in the procurement process. The first year's Detailed Procurement Plan (DPP)was agreed upon at negotiations. The DPPs for the remaining years of the project, indicating theprocurement method and processing time for each contract, will be submitted to IDA every year for itsreview and comments not later than three months before the end of each fiscal year.
Procurement methods (Table A)
Table A: Project Costs and Procurement Methods(US$ million Equivalent)
Procurement Method('i
Expenditure Category ICB NCB Other (2) N.B.F. TOTAL(3) COST
1. Civil Works 2.85 0.34 0.00 0.00 3.19(2.55) (0.00) 0.00 (0.00) (2.55)
2. Supply and Installation 56.77 0.00 0.00 17.03 74.01(50.81) (0.00) (0.00) (0.00) (50.81)
3. Goods 1.35 0.44 0.50 0.00 2.29(0.35) (0.04) (0.19) (0.00) (0.58)
4. Services 0.00 0.00 8.52 0.80 9.32Consultants (0.00) (0.00) (7.53) (0.00) (7.54)
5. Training 0.00 0.00 0.53 0.0 0.53(0.00) (0.00) (0.53) (0.00) (0.53)
Total Project Cost 60.97 0.78 9.55 17.82 89.34
of which IDA-Funded Cost (53.71) (0.04) (8.25) (0.00) (62.00)
7. Procurement Method: All contracts for Goods & Equipment estimated to cost US$100,000equivalent or more and all Civil Works, and Supply and Installation of Plant and Equipment estimated tocost US$200,000 equivalent or more will be procured through Intemational Competitive Bidding (ICB).All contracts, estimated to cost more than US$30,000 equivalent but less than US$100,000 equivalent maybe procured through National Competitive Bidding (NCB). The standard bidding document for NCB willbe submitted to IDA by the borrower for prior review. The approved document will form the basis of allNCB procurement under this project. Foreign suppliers will not be precluded from bidding for NCBcontracts. All other contracts for goods, such as office equipment, vehicles, computers and subscriptionand access to information estimated to cost US$30,000 equivalent or less per contract, up to an aggregatevalue of US$190,000 equivalent may be procured through the Inter Agency Procurement Service Office ofthe United Nations Development Program (IAPSO) or Shopping (IS/NS) procedures as detailed inparagraphs 3.5, 3.6, and 3.9 of the Guidelines.
Procurement of Consultant Services:
- 85 -

8. Procurement Methods: As a rule, consultant services would be procured through Quality andCost Based Selection (QCBS) methodology. All consulting service contracts estimated to costUS$200,000 equivalent or more for firms will be awarded using the QCBS method, and will be advertisedin the United Nations Development Business (UNDB) and in at least one national newspaper. In the caseof assignments estimated to cost less than US$200,000 equivalent and greater or equal to US$100,000equivalent, the assignments may be advertised nationally and the shortlist may be made up entirely ofnational consultants, provided that at least three qualified national firms are available in the country andforeign consultants who wish to participate are not excluded from consideration. Consulting servicecontracts estimated to cost less than US$100,000 for firms may be awarded through the Consultants'Qualifications (CQ) selection method in accordance with the provisions of paragraph 3.7 of the Guidelines.All consulting services of individual consultants will be procured under individual contracts in accordancewith the provisions of paragraphs 5.1 through 5.3 of the Guidelines. In exceptional cases, Single-Sourceselection would be used in accordance with the provisions of paragraphs 3.8 through 3.1 1.
9. Training: Training activities totaling US$530,000 equivalent will be awarded through theConsultants' Qualification (CQ) selection method. Training activities are geared towards technicalassistance for reform of the Electricity Regulatory Authority, institutional support to the sector reform,petroleum sector development and reform training, hiring consultants for developing training materials andconducting training, and support for training activities through seminars, workshops, attachments andfellowships. The procurement of these activities will also be in accordance with the provisions ofparagraph 1.20 of the Guidelines.
Table Al: Proposed Consultant Selection Arrangements(US$ million equivalent)
SELECTION METHOD
Consultant QCBS QB SFB LCS CQ Other SS N.B.F. TOTAServices S LExpenditure COSTCategory
A. Firms 6.98 0.00 0.00 0.00 0.00 0.00 0.15 0.80 7.93(6.00) (0.00) (0.00) (0.00) (0.00) (0.00) (0. 5) (0.00) (6.15)
B. Individuals 0.00 0.00 0.00 0.00 0.00 1.35 0.04 0.00 1.39(0.00) (0.00) (0.00) (0.00) (0.00) (1.35) (0.04) (0.00) (1.39)
C. Training 0.00 0.00 0.00 0.00 0.53 0.00 0.00 0.00 0.53(0.00) (0.00) (0.00) (0.00) (0.53) (0.00) (0.00) (0.00) (0.53)
TOTAL 6.98 0.00 0.00 0.00 0.53 1.35 0.19 0.80 9.85
IDA TOTAL (6.00) (0.00) (0.00) (0.00) (0.53) (1.35) (0.19) (0.00) (8.07)
Note: QCBS = Quality-and Cost-Based SelectionQBS = Quality-Based SelectionSFB = Selection under a Fixed BudgetLCS = Least-Cost SelectionCQ = Selection Based on Consultants' Qualifications
- 86 -

Other = Selection of Individual Consultants (per Section V of ConsultantsGuidelines), Commercial Practices, etc.
SS = Single SourceN.B.F. = Not Bank-financedIS = International Shopping
Figures in parenthesis are the amounts to be financed by the IDA Credit.
- 87 -

Review by IDA:
10. Table B below provides the prior review thresholds. Each goods and equipment contract estimatedto cost US$100,000 equivalent or more; each civil works and supply and installation of plant andequipment contract estimated to cost US$200,000 or more will be subject to IDA prior review as perAppendix I of the Guidelines. All other contracts will be subject to post review in accordance withparagraph 4 of Appendix I of the Guidelines. All terms of references, all consulting contracts exceedingUS$50,000 for individuals and US$100,000 for firms, and all training will be subject to IDA prior review.All single-source selection - regardless of value, assignments of a critical nature as determined by IDA oramendments of contracts raising the contract value above the prior review thresholds, will be subject toIDA prior review.
The threshold for SOEs would be set at US$200,000 for civil works, and US$100,000 for goods, andconsultancy and training contracts for firms at US$ 100,000 and for individuals at US$50,000.
Prior review thresholds (Table B)Table B: Thresholds for Procurement Methods and Prior Review 1/
Expenditure Category Contract Value Threshold Procurement Method Contracts(US$ thousands) I/ Subject
to Prior Review1. Civil Works Greater than or equal to 200 ICB All2. Supply and Greater than or equal to 200 ICB AllInstallation3. Goods Greater than or equal to 100 ICB All
Office Equipment, Greater than or equal to 30 NCB None (postComputers & Vehicles and less than 100 review)
Less than 30 or equal to 30 NS/ISLess than 30 or equal to 30 IS/IAPSO None (post
review)None (post
review)4. Services(Consultants) Greater than or equal to 200 QCBS (Intemational Advert.) All
Firms Greater than or equal to 100 QCBS (National Advert.) Alland less than 200
Firms Less than 100 CQ TORs
Individuals Greater than or equal to 50 IC AllLess than 50 IC TORs
Individuals/Firms No threshold (All) SS All5. Training International, Twinning, CQ - Firm/IC - Individual TORs
National
- 88 -

Note: ICB =International Competitive BiddingNCB =National Competitive BiddingIAPSO = Inter-Agency Procurement Services Office of the
United Nations Development ProgramNS =National ShoppingQCBS = Quality-and Cost-Based SelectionIC = Individual ConsultantsCQ = Selection Based on Consultants' QualificationSS = Single-SourceTOR = Terms of Reference
Total value of contracts subject to prior review: US$ 61.60 millionOverall Procurement Risk Assessment:
UEB = AverageMEMD = High
The frequency of procurement supervision missions proposed: Twice in the first year and once every yearafter the first year (including special procurement supervision for post-review/audits and mid-termn review).
- 89 -

Disbursement
Allocation of credit proceeds (Table C)
Table C: Allocation of Credit Proceeds
Expenditure Category Amount in US$ Financing Percentagemillion
1. Civil Works 2.60 100% of foreign expenditures and 85%of local expenditures
2. Supply and Installation 43.00 100% of foreign expenditures and90% of local expenditures
3. Goods 0.40 100% of foreign expenditures and90% of local expenditures
4. Consultants Services 5.53 100%5. Training 0.40 100%6. Project Preparation Facility 1.94 100%Refund7. Unallocated 8.13
TOTAL 62.00
Use of statements of expenditures (SOEs):
Special account:To facilitate disbursements of eligible expenditures, GENCO and MEMD will open two separate accountseach in a commercial bank to cover local and foreign currencies of IDA's share of eligible expenditures asfollows:
* Special Account A (GENCO): Denominated in US dollars, disbursements from the IDA creditfor part A and B will be deposited on this account.
* Special Account B (MEMD): Denominated in US dollars, disbursements from the IDA credit forParts C and D will be deposited on this account.
* Project Account A (GENCO): Counterpart funds for Part A and B in accordance with projectobjectives.
* Project Account B (MEMD): Counterpart funds for part s C and D in accordance with projectobjectives.
Goods Milestones Table is on the following page of the report:
Consultants Milestones Table is on the following page of the report:
- 90 -

UGANDA: Fourth Power ProjectImplementation Schedule for Goods and Works (Summary)
D0 1 2001 1 2002 1 2003Task Name Start Finsh Jl I Oct Jan lApr IJulI Oct Jan r IJUI Oct Jan IApr IJJul Oct Jan
Installation of Units 14 & 15 at Kiira Thu 11/30/00 Wed 12/24/03 0N*W AW*rd
Completion of Unit 13 - Civil Works Mon 4/23/01 Thu 9/18/03 lr co*etAwwm
Petroleum Sector Development Reform - Market Monitoring Thu 2/28/02 Mon 5/5/03 .i _AWEquipment
Petroleum Sector Development & Reform - Office Thsu 10/25/01 Mon 10/7/02 .- rn 7 -]
Equipement & Computers
Petroleum Sector Development and Reform & Power Sector Mon 11/26/01 Fri 7/12/02 = r - ,Development Reform - Vehicles for Field Work
Power Sector Development Reform - Office Equipment, Wed 8/15/01 Thu 6/6/02Computers
Subscription and Access to Information Fri 10/19/01 Fri 12/12/03

UGANDA: Fourth Power ProjectImplementation Schedule for Consulting Services (Summary)
19992000 2001 1 2002 1 2003Task Name Start Finish Se| No| Ja M Maf Jul| Se NolJa I Mal Ma Jul Sel No Ja Ma Ma Jul Se No Ja I MaLMa Jul Se No Ja Mal Ma Jul se No Ja
Design of Units 14 & 15 Sun 11/15/98 Mon 6/18/01 Contract Awd
Supervision of tUnits 14 & 15 Sun 11/15/98 Fri 12/26/03 ContractAward
Project Management Support & Studies - Project Sat 9/30/00 Fri 12/26/03 ContritAwa-d
Manager
Project Management Support & Studies - Unit 15 Wed tO/10/01 Tue 1/15/02 Contract Award
Study
TA - Power Sector Reform & Development Wed 11/14/01 Wed 8/14/02 Contract Award
Support to Regulatory Authority .
Power Sector Reform and Development - Water Fri l2/14/01 Mon 11/4/02 Contract Award
s Management Study mPower Sector Development - Various Studies, Wed 1/16/02 Wed 6/11/03 Contract Award
Surveys & Efficiency Program
Petroleum Sector Development - Design & Tue 10/30/01 Tue 10/1/02 Contract AwrdBidding Documents for Monitoring Equipment
Petroleum Sector Development & Reform - Design Wed 11113/02 Tue 418/03 Contract Award
and Implementation of Regulatory System . I
Petroleum Sector Development - Design & Mon1/14/02 Monl2/16/02 Contract Award
Implementation of Regulatory System
Institutional Support to Sector Reform Training Thu 10/11/01 Fri 12/26/03
Petroleum Sector Development & Reform - Mon 3/10/03 Thu 10/16/03 Contct Awcrd(Various Training)
Petroleum Sector Development & Reform - Mon 12/9/02 Fri 12/26/03 Co;nct AwardTechnical Assistance to Workshop

Annex 7: Project Processing Schedule
UGANDA: FOURTH POWER PROJECT
Projec Schedule _________Planned ____Actual
Time taken to prepare the project (months) 18First Bank mission (identification)Appraisal mission departure 10/09/2000 10/09/2000Negotiations 11/27/2000 02/20/2001Planned Date of Effectiveness 10/01/2001
Prepared by:
Uganda Electricity Board (UEB) and the Ministry of Energy and Mineral Development (MEMD).
Preparation assistance:
Lahmayer International (Consultants), Mr. Dennis Creamer (Consultant-Water Resources Specialist),NORPLAN.
Bank staff who worked on the project included:
Name SpecialityPaivi Koljonen Energy Economist and Team Leader, AFTEG
Reynold Duncan Power Engineer, AFTEG
Edeltraut Gilgan-Hunt Environmental Specialist, AFTEI
Mourad Belguedj Petroleum Sector Specialist, COCPOJoseph Kizito Financial Management Specialist, AFMUGGulam Dhalla Utility Financial Analyst (consultant)
Aberra Zerabruk Legal Counsel, LEGOPModupe Adebowale Financial Management Specialist, LOAG2
Colleen de Freitas Operations Analyst, AFTEGHelen Kofi Procurement Analyst, AFTEGDavid Phan Program Assistant, AFTEG
Peer reviewers:Barry Trembath Hydrology and Least Cost Analysis, EASEGKari Nyman Power Sector Reform, SASEGEdgar Saravia Coordination with Utility Reform and Privatization Project PSDPS
Karen Rasmussen Financial Analysis, AFTEGPhilippe Durand Energy Sector Issues, LCSFE
Rogati Kayani Procurement Specialist, AFTQKRichard Cambridge Operational Quality, AFTQK
Michel Muylle Petroleum Components, COCPOOmar Fye Environmental Aspects, AFTE ICyprian Fisiy Resettlement, EASES
- 93 -

Annex 8: Documents in the Project File*UGANDA. FOURTH POWER PROJECT
A. Project Implementation Plan
Executing agencies' draft Project Implementation Plans.
B. Bank Staff Assessments
Assessment of Financial Management Arrangements, UEB Implemented Components, December 1, 2000.
Assessment of Financial Management Arrangements, MEMD Implemented Components, December 1,2000.
Procurement Capacity Assessment Summary of Findings and Actions, Uganda Electricity Board, January11, 2001.
Procurement Capacity Assessment Summary of Findings and Actions, Ministry of Energy and MineralDevelopment, January 11, 2001.
C. Other
Uganda Electricity Board, Owen Falls Extension Hydropower project, Rehabilitation of Nkenda, Nkongeand Opuyo Substations, and Extension of Lugogo and Mutundwe Substations, Compressed andSimplified, Feasibility Study (2nd Refined Version), NORPLAN, December, 2000.
Uganda Electricity Board, Replacement of Transformers and 132kV Circuit Breakers atOwen Falls, Draft Final Report, CBI/NESA, November 2000.
Net present value of UEB substation Lugogo and Mutundwe, Economic Analysis, NORPLAN, May,2000.
Net present value of UEB substation Lugogo and Mutundwe, Financial Analysis, NORPLAN, May, 2000.
Restructuring Action Plan, Uganda Electricity Board, June 2001.
Uganda Load Forecast Review (Up-date-2001), Electricite de France, January 2001.
Certificate ofApproval of Environmental Impact Assessment, National Environment ManagementAuthority, October 20, 2001.
Environmental Analysis for Power IVExtension Owen Falls Dam, Geomatric Technology Corporation,August 31, 2000.
Review of the Hydrology of the Victoria Nile as it Relates to the Extension of Owen Falls HydropowerPlant, Dennis Creamer (Water Resources Specialist), May 18, 2000.
Hydropower Development Master Plan- Volume 1, Executive Summary-Final Report, Uganda ElectricityBoard, November 1997.
- 94 -

Optimization Study-Hydrology of the Nile River-Final Report, Electricite de France, November 1998.
Owen Falls Hydropower Plant Proposed Extension - Units #14 & 15, Report on Cost-Effectiveness,Dennis Creamer (Water Resources Specialist), May 26, 2000.
Owen Falls Extension-Update of Cost Effectiveness Analysis-Draft Report, Dennis Creamer (WaterResources Specialist), April 16, 2001.
Spreadsheet Modelfor Cost Effectiveness Analysis, Dennis Creamer (Water Resources Specialist) April16, 2001.
Proposed Extension to Owen Falls Generating Station-Feasibility Study Report, Acres International Ltd.,October 1990.*Including electronic files
Armi'>x to the Economic Analysis of the Project, Bank Staff, May 15, 2001.
- 95 -

Annex 9: Statement of Loans and Credits
UGANDA: FOURTH POWER PROJECTMay-2001
Difference between expectedand actual
Orginal Amount in US$ Millions disbursementsProject ID FY Purpose IBRD IDA GEF Cancel. Undisb. Orig Frm Rev'd
P050439 2001 PRIVATIZATION&UTILrrYSECTOR REFORM 0.00 48.50 0.00 0.00 46.06 11.47 0.00
P044695 2001 National Agnc. Advisory Services Proj. 0.00 45.00 0.00 0.00 45.80 0.00 0.00
P072482 2001 HIVIAIDS Contrrl Project 0.00 47.50 0.00 0.00 47.21 0.00 0.00
P073089 2001 EMCBP 11 0.00 22.00 0.00 0.00 21.72 3.32 0.00
P044679 2000 Second Economic and Fin. Mgmt. Project 0.00 34.04 0 00 0.00 28.04 9.40 0.00P002992 2000 LOCAL GOV DEVE.PROGRAM 0.00 80.90 0.00 0.00 64.37 -9.39 0.00
P044213 1999 FIN MKTS ASSISTANCE 0.00 13.00 0.00 0.00 12A5 10.20 0.00
P059127 1999 AGRIC.RES & TRNG. II 0.00 26.00 0.00 0.00 22.03 5.41 0.00
P059223 1999 NAKIVUBO CHANNEL REH 0.00 22.40 0.00 0.00 18.46 13.94 0.00
P002941 1999 ICB-PAMSU 0.00 12.40 2.00 0.00 3.96 1.67 0.00
P002970 1999 ROADS DEVT PROGRAM 0.00 90.98 0.00 0.00 83.17 11.68 0.00
P049543 1998 ROAD SECTANST.SUPP 0.00 30.00 0.00 0.00 22.10 24.30 0.00
P057007 1998 EL NINO EMERG RD REP 0.00 27.60 0.00 0.00 23.58 24.49 0.00
P040551 1998 NUTRIT.CHILD DEV 0.00 34.00 0.00 0.00 21.73 6.15 0.00
P046870 1997 LAKE VICTORIA ENV. 0.00 9.80 9.80 0.00 4.75 3.09 0.00
P046836 1997 LAKE VICTORIA ENV. 0.00 12.10 0.00 0.00 3.66 1.47 0.00
P002987 1997 SAC III 0.00 125.00 0.00 0.00 43.84 24.22 23.69
P002978 1996 ENVIRONMENTAL MGMT & CAPACITY BLDG 0.00 11.80 0.00 0.00 1.26 2.80 2.33
P035634 1996 PRIV. SECTOR COMPETI 0.00 12.30 0.00 2.18 2.24 5.60 0.00
P002971 1995 DISTRICT HEALTH 0.00 45.00 0.00 0.00 3.77 2.07 0.00
P002976 1995 INST. CAPACITY BLDG 0.00 36.40 0.00 0.00 2.27 4.69 0.00
P002963 1994 SEXUAL.TRANS.IN 0.00 50.00 0.00 0.00 3.04 3.89 0.00
P002977 1994 UG:COTTON SECTOR DEVELO 0.00 14.00 0.00 0.00 0.03 0.23 -0.52
P002957 1994 SMALL TOWNS WATER 0.00 42.30 0.00 0.00 4.93 5.89 0.00
P002953 1993 PRIMARY EDUC. & TEAC 0.00 52.60 0.00 0.00 1.95 1.98 0.54
P002929 1991 POWER III 0.00 125.00 0.00 0.00 14.59 -12.47 322.52
Total: 0.00 1070.62 11.80 2.18 547.01 156.14 348.55
- 96 -

UGANDASTATEMENT OF IFC's
Held and Disbursed PortfolioMay-2001
In Millions US Dollars
Committed DisbursedIFC IFC
FY Approval Company Loan Equity Quasi Partic Loan Equity Quasi Partic1998 AEF Skay Electro 0.22 0.00 0.00 0.00 0.00 0.00 0.00 0.001994 AEF Skyblue 0.51 0.00 0.00 0.00 0.51 0.00 0.00 0.001998 AEF White Nile 0.28 0.00 0.00 0.00 0.28 0.00 0.00 0.001999 AEF Wstem Hgh 0.50 0.00 0.00 0.00 0.00 0.00 0.00 0.002000 CelTel Uganda 4.00 0.70 0.00 0.00 2.40 0.70 0.00 0.001994 Celtel 0.43 0.64 0.80 0.00 0.43 0.64 0.80 0.001984/92 DFCU 0.00 0.60 0.00 0.00 0.00 0.60 0.00 0.001993 Jubilee 0.00 0.10 0.00 0.00 0.00 0.10 0.00 0.001996 Kasese Cobalt 12.00 3.60 0.00 0.00 12.00 3.60 0.00 0.001998 Tilda Rice 2.28 0.00 0.00 0.00 1.78 0.00 0.00 0.001995/96 Uganda Leasing 0.98 0.00 0.00 0.00 0.38 0.00 0.00 0.001983 Uganda Sugar 5.08 0.00 0.00 0.00 5.08 0.00 0.00 0.001996 AEF Agro Mgmnt 0.60 0.40 0.00 0.00 0.55 0.40 0.00 0.001992 AEF Clovergem 0.84 0.00 0.00 0.00 0.84 0.00 0.00 0.001997 AEF Conrad Plaza 1.13 0.00 0.00 0.00 1.13 0.00 0.00 0.001998 AEF Exec. Invmnt 1.00 0.00 0.00 0.00 1.00 0.00 0.00 0.001999 AEF Gomba 1.40 0.00 0.00 0.00 1.40 0.00 0.00 0.002001 AEF Kabojja 0.35 0.00 0.00 0.00 0.00 0.00 0.00 0.001998 AEF Kampala Flwr 0.50 0.00 0.00 0.00 0.00 0.00 0.00 0.002000 AEF Kasambya 0.99 0.00 0.00 0.00 0.00 0.00 0.00 0.00
AEF Kiwa n 0.00 0.00 0.00 0.00 0.00 0.00 0.00 0.001997 AEF Ladoto 0.80 0.00 0.00 0.00 0.80 0.00 0.00 0.002000 AEF LongFreight 0.80 0.00 0.00 0.00 0.00 0.00 0.00 0.002000 AEF Mosa Court 0.64 0.00 0.00 0.00 0.64 0.00 0.00 0.001998 AEF Nile Roses 0.16 0.00 0.00 0.00 0.16 0.00 0.00 0.001993 AEF Rainbow 0.79 0.00 0.00 0.00 0.79 0.00 0.00 0.001995 AEF Rwenzori 0.35 0.00 0.00 0.00 0.35 0.00 0.00 0.001993
Total Portfolio: 36.63 6.04 0.80 0.00 30.52 6.04 0.80 0.00
Approvals Pending Commitment
FY Approval Company Loan Equity Quasi Partic1998 AEF Ram Oil 1.00 0.00 0.00 0.00
Total Pending Commitment: 1.00 0.00 0.00 0.00
-97 -

Annex 10: Country at a Glance
UGANDA: FOURTH POWER PROJECTSub-
POVERTY and SOCIAL Saharan Low- _ _ _ _ - _Uganda Africa income Development dlamond
1999Populatin, mid-year (millions) 21,5 642 2,417 Life expectancyGNP per capita (Atlas method. USS) 320 500 410GNP (Atlas method, US$ billions) 6.8 321 988
Average annual growth, 1993-99
Poputation (%J 2.9 2.6 1.9 GNLabor force (%) 2.7 2.6 2.3 GNP Gross
per primaryMost recent estimate (latest year available. 1993-99) capita enrollment
Poverty (% of popufation b elow national poverty line) 44Urban population (% of total population) 13 34 31Life expectancy at birth (years) 42 50 60Infant mortality (pet 1,000 live births) 97 92 77Child malnutrition (% of children under 5) 26 32 43 Access to safe waterAccess to improved water source (% of population) 41 43 64Illiteracy (% of population age 15+) 38 39 39Gross primary enrollment (% of school-age population) 122 78 96 -Uganda
Male 129 85 102 Low-income groupFemale 114 71 86
KEY ECONOMIC RATIOS and LONG-TERM TRENDS
1979 1989 1998 1999 Ecnoi - tlot _Economic ratioa'
GDP (US$ biltions) 5.3 6.8 6.4Gross domestic investmentUGOP t1.1 15.0 16.4Exports of goods and services/GOP 8.0 10.3 113 TradeGross domestic savingslGOP 1.0 5.6 4.9Gross national savings/GDP 1.9 13A4 10.5
Current account balance/GDP 6.9 -10.4 -11 6 D sInterest paymentslGDP 0.6 06 Domestic InvestmentTotal debtUGDP 36.2 53.6 54.3 SavingsTotal debt service/exports 25.S 23.1Present valve of debt/GDP 35.0 27.3Present value of debt/exports 350.6 225.3
Indebtedness1979-89 1989-99 1*98 1999 1999-03
(average annual growth)GOP 3.4 7.1 5.6 7.4 6.3 -UgandaGNP per capita 0.9 4.1 2.8 4.3 3.3 Low-income groupExports of goods and services 1.2 14.8 -14.9 33.0 6.4
STRUCTURE of the ECONOMY1979 1989 1998 1999 Growth of investment and GDP (%)
(% of GDP)Agriculture 56.8 44.6 44.4Industry 10.7 17.6 17.8 t
Manufacturing 5.9 8.9 8.7 2o
Services 32.5 37.8 37.8 a
Private consumption 92.0 84.8 85.2 20 l 9 997 9v 99
General government consumption 7.0 9.6 9.9 -GDI -GOPImports of goods and services 18.1 19.7 22.9 __
1979-89 1989-99 1998 1999 Growth of exports and Imports (%)(average annual growth)Agriculture 2.7 3.7 1.9 6.9 TIndustry 6.4 12.1 11.5 9.1 40
Manufacturing 3.6 13.5 14.4 11.3Services 3.2 8.1 6.6 7.2 2t
Private consumption 3.4 6.3 8.6 0.8General government consumption 0.6 8.2 8.0 17.4 94 95 9S 97 v9Gross domestic investment 13.1 8.2 3.7 9.0 .2D
Imports of goods and services 7.3 9.0 3.1 2.8 -E xports -_--ImportsGross national product 3.5 7.3 5.8 7.3
Note: 1999 data are preliminary estimates.
The diamonds show four key indicators in the country (in bold) compared with its income-group average. If data are missing, the diamond willbe incomplete.
- 98 -

Uganda
PRICES and GOVERNMENT FINANCE
Domestic prices 1979 1989 1998 1999 Inflation (%)
(% change) 30Consumer prices 131.0 S.8 -0.2Implicit GDP deflator .. 115.4 10.7 4-4 1
Government finance(% of GDP, includes current grants) oCurrent revenue 5.5 10.3 10.9 -10Current budget balance .. -1.3 0.9 0.9 -GDPdeflatDr CPIOverall surplusrdefict .. -4.8 -5.6 -5.9
TRADE
(USS millions) 1979 1989 1998 1999 Export and import levels (USS mill.)Total exports (fob) .. 282 458 549 1 sco
Coffee .. 276 269 307Cotton I... 1 I I1Manufactures ' 10.
Total imports (cif) 562 1,411 1,376Food .. .. ..Fuel and energy .. 76 84 65Capital goods .. . .. ..
Export price index (1995=100) .. 92 74 67 93 94 95 96 97 98Import price index (1995= 100) .. 79 106 101 a Exports * ImportsTerms of trade (1995=100) .. 117 70 67
BALANCE of PAYMENTS
(US$ millions) 1979 1989 1998 1999 Current account balance to GDP (%)
Exports of goods and services .. 304 634 726 0Imports of goods and services .. 712 1,871 1,834Resource balance .. -408 -1237 -1107 -3
Net income .. -66 -9 -14 -6 tNet current transfers .. 114 539 375 p a wCurrent account balance .. -360 -706 -746
Financing items (net) .. 342 840 780 -12Changes in net reserves .. 18 -134 -33 -15
Memo:Reserves including gold (US$ millions) .. 46 750 748Conversion rate (DEC, local/US$) .. 170.4 1,149.7 1,362.0
EXTERNAL DEBT and RESOURCE FLOWS1979 1989 1998 1999
(USS millions) Composition of 1999 debt (USS mill.)Total debt outstanding and disbursed .. 1,903 3,631 3,480
IBRD .. 24 0 0IDA .. 605 1,971 2,042 F:58
E: 944Total debtservice ..- .. 172 179
IBRD .. 5 0 0IDA .. 5 24 25
Composition of net resource flows D: 385Officialgrants 36 177 433 277 i: 2,042Official creditors .. . 48Private creditors .. 0 1 418Foreign direct investment 2 2 200 230 c:35Portfolio equity 0 0 0
World Bank programCommitments 0 141 172 267 A -IBRO E -BilateralDisbursements .. 100 242 148 B-IDA D- Other mul6ateral F- PrvatePrincipal repayrnents .. 4 10 10 C -IMF G -Shor-termNetflows .. 96 231 138Interest payments .. 6 14 15Net transfers .. 90 217 123
Development Economics 9/9/2000
_99 -

28-Mar-01 18:37 From-WORLD BANK KAMPALA +267 T-305 P.04/oS F-542
23505114 (4 lnes) Minist of Finance, PlanningFax; z30163 and liconnmic Developmentfeie%ramn-s: fINS-C" PSOB.SOX 8147E-MJ"l:r1nnnce&;muI-0m Kampalain any corresponlence onmnis subject please quote No. ALD 141 120 5 12 5THE REPuBLIC OF UGANDA Uganda.
19 March, 2001
Annex 11Mr. James D. WolferisohnPresident,Intemational Development Associanion
1818 H Street, N.W.Washington, D C. 20433
Dear Mr. \Volfensohn,
RE: LETTER OF POWER SECTOR POLICY
Introduction
i. This letter summarises the major policy objectives and the strategy that theGovermment of Uganda (GniJ) is implementing in order to transformn the powersector into a financially viaLie electricity industry that is able to supply reasonablypriced and reliable electriciTy co the population and ma4ce its contribution to thefurther social and economic development of Uganda.
2. Government's strategy to achieve this goal includes the reform and privatisationof the Uganda Electricity B1o4jrd (UEB), attracting new private sector investmentsto increase and improve electricity supply, and acceleraTe rural electricity accessThis strategy is consisienm with the Government's overall macro-economicpolicies as well as the Poverty Eradication Action Plan (PEAP). An importantcomponent of the PEAP is the creation of an enabling environment for economicgrowth and structural transformnation. As it has been identified that inadequate andunreliable electricity supply is the major infrastructure constraint to growth, thereform of the electricity industry is the major priority area for intervention
The Power Sector Strategic Plan
3. The power sector reforms that the GoU is undertaking are guided by the PowerSector Strategic Plan of lune 1999. Thr Plan was designed to meet the followingspecific objec:tives:
. making the power sector viable and able to perform without subsidies fromthe Goverunent budget;
* increasing the sector's efficiency,
-100 -

* increasing the sector's commercial performance;* rneeting the growing demands for electricity and increasing area coverage;• improving the reliability and quality of electricity supply;* attracting, private capital and entrepreneurs, and* taking advantage of export opportunities.
4. The Strategic Plan spells out the GoU's policy on the reform of the sector andprivatisation of UEB. It proposes the unbundling of UEB into three separatecompanies for generation, transmission and distribution of electricity. Theunbundling process is already underway and the new successor companies will beincorporated by the end of M4arch 2001.
5. The Strategic Plan also proposes that the distribution and the generationbusinesses should be concessioned to private sector players while the transmissionbusiness remains in public hands in the medium term. GoU has adopted thefollowing structure for the power industry:
* The existing distribution network will be concessioned to one privatecompay y.
* Both the eKisting generation plants (Nalubaale and Kiira) will be concessionedto one private company
* The transmission company will remain with Government acting as a singlebuyer that will hold existing power purchase agreemenls.
e Existing UEB assets are tc. remain in Govemrnment hands.• Further investments iti get eration are to be undertaken by the private sector.
Legal Framework in the Power Sector
6. In November, 1999, the pazilmrnent ot Uganda enacted the Electricity Act,1999,which gives the legal backing to the various reforms in the power sector.
Th-e Electricity Regulatory Authoriy
7. The Electricity Act, 1999, provides for the establishment of an independentregulatory Authority for the electricity industry, the ERA. Government hasalready embarked on the establishment of the institutional framework byappointing the ERA Board in April, 2000. ERA is nowv operational.
Improving the Sector's performance and Efficiency
8. The Government is committed to improving the management, commercial andtechnical efficiency of the sector, in particular UEB In this regard, Govcrnzmenthas moved decisively to improve top management in UEB and down-size theutility. IJEB has undertaken ineasures to reduce electricity thefts and improvedebt collection and the billing and collection system.
- 101 -

These measures have resulted in improved performance of UER For instance, in 1999,collections increased from 50% to 79% of the electricity generated.
Meeting the Growing Demand and Increasing Electricity Access
9. In order to meet the growing demand for electriciry, Government has opened upthe sector to private participation in the provision of new generation capacity inthat regard, Government hds already licensed an independent power producer(IPP), AES Nile Power, to develop the 250 MW Bujagali Project on the RiverNile. Government is also in contact with other IPPs for the subsequentdevelopment of other projects.
10. To increase access to electricity in the rural areas, GoU is developing acomprehcnsive rural electrification program meant to increase rural electrificationaccess from the present level of 1% to at least 10% by the year 2010. Theprogram, called Energy for Rural Transformation, is designed to have four maincomponents, namely;
* grid extension and intensi"ication for those areas which are close to the grid;X development of renewable energy resources to provide at lrast 70 MW of
electricity;* development of decentralesed or mini grid systems including from renewable
eniergy resources; and* solar PV systems for izotated households and institutions.
The program also has linkages with the telecommunications, health, agricultureand education sectors.
Financial Viability
11 In order to improve the financial viability of the power sector, the ElectricityRegulatory Authority is working on a stepwise tariff increase to reflect the cost ofsupply. Government in December 2000, recommended to the Regulator that thelast increment should be effected by June 2001 and the tariff should be indexed toinflation and currency fluctuation. IT is also anticipated that there will be markedimprovement when the distribution business is let out to the private sector.
Settlement of Government Electricity Bill Arrears
12. Governrnent is committed to impcoving its clectricity bill payment record in ordcrto ensure a financially sustainable power sector and to provide an amactiveenviroranent for private entrants. To this end Government will release 70% offinancial year 2000/01 budget estimates for current electricity supply by May2001 and also verify and settle arrears for financial year 1999/00 by end of June
- 102 -

28-Mar-OT I8:3d From-WORLU OAro NAMrAL8 TvI , -
200 1. I sent a letter to this effect to your Country Director for Uganda on March14, 2001
Power Export Opportunities
13 GoU is maYcing efforts to increase power exports given the country's comparativeadvantage in hydro power resources. Negotiations are in final stages with Kenyato increase exports.
Environmental Sustainabiliry
14. In April/May 1999, Government carried out an Environmental Analysis (EA) inconsultation with stakeholders as a preparation for the Power IV Project. The EAestablished that the project would not have any major environmental impactsbecause it did not involve construction of new structures- the two generating unitswould he installed in an existing power house. The project will not involveresettlement and cultural heritage issues. The main environmental mitigationmeasure required under the project is a decommissioning plan, includingrestoration of the project area, which will have to be prepared and implemented atthe end of the project. An Environmental Monitoring Plan as well as capacitybuilding will also be included
Implementation Plan for UEB Privatisation
1 5 The pnvatisation process for UE-B is on course. Evaluation of assets was finalised inAugust 2000 and The investment needs analysis done in September, 2000. So far,there have been two successful rvarket consultartons w'ith interested parties, one inJune anid the other in October, 2000. Draft contracts and licences were prepared inAugust and recommendations on tanff reform made in November, 2000.Government shalJ establish thxzt independent corporate entities - generation,transmission and distribution - operating under separate boards of directors andmanagement. The assets and liabilities of UEB will then be assigned to thosesuccessor companies.
16. A transitional step is necessary because there are a number of contracts the liabilitiesfor which cannot be delegated without the pernission of the counter-party to thecontract, for cxamplc long-tern debt and contracts with international suppliers.These liabilities shall remain with UEB Statutory Corporation, which will hold theliabigfnes which cannot be delegated in the first instance until they art either settied,ass$ned directly by the Govermnent, or, with the concurrence of the counter-party,6fgatcd to one of the successor compazies. Once all the liabilities have been dealt
itl accordingly, UEB Statutory Corporation would cease to exist in accordance withthe 1999 Electricity Act.
17. The next steps will include the following,
- 103 -

28-Mar-Ol 18:38 From-WORLD BANK KAMPALA .IU r.JD,w r-.
5
a release of information memorandum - end of March, 2001* approval of shortlists - end of May. 2001;
receipt of bids - end of Augusl,200 1* 4ward of contracts - mid OcTober, 2001.
Government will ensure that the UEB successor companies follow the financialmanagement procedures established for the implementation of the project.
Petroleum Subz-Sector Reforms
Ig Government liberalised the petroLeum sector in 199q. While the liberalisationmeasures have been implemnentea under existing law, Government has nowformulated a new comprehensive Petroleurn Bill and is making efforts to put inplace a monitoring unit for the sector To ensure the quality of the products andalso curb smuggling.
Conclusion
19 1 trust that the above measures give confidence that a viable and efficient energysector is one of Uganda's piiorities and that the Govemrnment is committed toensuring that this objective is achieved.
Yours sincerely,
Gerald M. sendaulaMINISTER OF FINANCE, PLANNING AND ECONOMIC DEVELOPMENT
- 104 -
S

MAP SECTION


IBRD 31 399
_>30t ; 32' 34- 36 UGANDA
S4 __ ' 5 U D A N z./ ? FOURTH POWER PROJECT 5
. ;9 \ ~ C ¢PROPOSED PROJECIET NG|.T\ t' N. .r ', \ To' _.K 4'\ - - 132 kV POWER LINES
:LTo P)T. .°0MdIW f -|6kV POWER LINES
A Or . PEd.b Noam -_ 33 kV POWER LINES
tkoboko go°d°!P * D Adium T ' °fAd - K \ y ---\-- 1 1 kv POWER LINES
Afl.k6 111111111iiV m HYDRO ELECTRIC GENERATING STATIONS
9a4O>ug>0nTTTT. JO Ahok 'T ' PoNent- Al DIESEL GENERATING STATIONS
(.5A g a .; VOPqplul 7 < . sT ° j SUBSTATIONS
DEMOCRATIC ToAbo ) W Co-p PKIA6 Ag61 * S SCADA
REPUBLIC / 7CIŽA,oo#
( 15~~~~~~~~~~~~ , NOL ~ ~ ~ ~ ~ ~ ~ ~ ~ ~ MTOOPRIMARY ROADSOF CONGO IL4L OTE
SECONDARY ROADS
9.)%>Pn?bo Alr <<,<o\° /R/s . Komudin;fW . B -- '--', RAILROADS
SELECTED TOWNS AND VILLAGES
i. o,4 A-.rla a4O ® DISTRICT CAPITALS
/ RIyoTooTpo KK, K * NATIONAL CAPITAL
- BUioLO.w f INTERNATIONAL BOUNDARIES
'5) ' 50 155 150H.i, BgP ra ._-od . L* Kyi &w KpcrO" ;v
Ogoro Haima; ,BNfkBo U > >.~ > u k d e o &TPEhordOKILOMETERS
jE4hutoO %SX NaLsmgoSt ffii4 1 9lg s; 4^/ ~~~~~~~~~~~~~~~~orRhisoopSooooimpIp,ossTIepor ToFIeWord BoDonk,s.
.X jz 4 <Kiog, KhTos,IR erriTrp,oroe 6oedroo
~~~~~~~~~~~~~~~~~~~~~~~~~~~~~~~~~~~~~~~~~~~~~~~~~~~~~TIf, .. p ; ,.d-d by d. M.Qpo NK9 USitf T.W,dB1
Be i oEPl 5, NOPE , 0 -d Eyoo idY--,
koooo,ssuor o- B5ss Edo gUl Boe N ,$ 7Xt .. ; .
) ', - (okoboso ,~~~~~~14 Ih~~ d l,-t.p,,FT.W,dBAGp .
t~~~~~~~~~~~~~~~~~~~~~~~~~~~~ -pow hro I It = _ K. -;N- -*t- Kf -1 - -i-i;107 f.tyUAT. l xJ 7C * i; KPOT RT 7' 1/
N-'<5, T.B--
fusuu Koholoso tM ood * TT AO N -QAN lA 0 " ito ,t;
E /un jA N - Lake Vc i -A .K K E N Y A
307i s32 Isls soc c..3L 00 'MY 0
56' "5 32' 34 '0.~~~~~~~~~~~~~~~~~~~~~~~~~~~~~~~~~~~~~~~~~~~~~~~~~~~~~~~~~~~~0o'b".~~~~~~~~~~~~~~~~~~~~~~~~~~~~~~~~~~~~
jK.1~~~~~~~~~~~~~~~~~~~~~~~~~~~~~~~~~~~~~~~~~~~~~~~~~~~~~~~~~~~~~MT26