world bank fiscal 2017 lending...
TRANSCRIPT

Annual Report 2017
World Bank Lending (Fiscal 2017)
Annual Report 2017
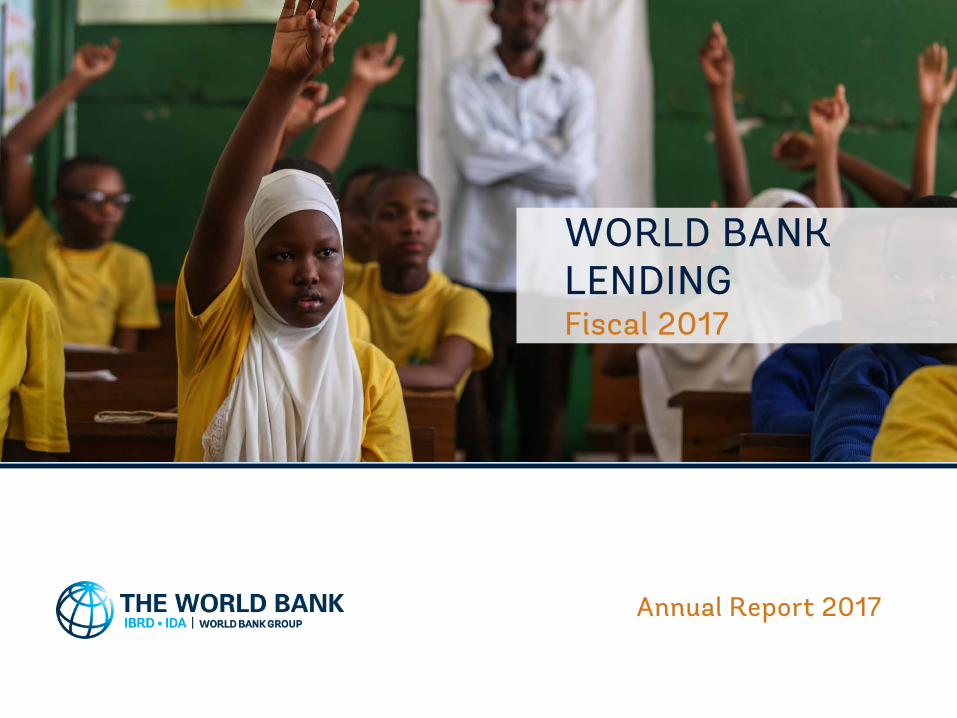
WORLD BANK LENDINGFiscal 2017

The International Bank for Reconstruction and Development (IBRD), the
International Development Association (IDA), the International Finance
Corporation (IFC), the Multilateral Investment Guarantee Agency (MIGA), and
the International Centre for Settlement of Investment Disputes (ICSID) are the
institutions that make up the World Bank Group.
The World Bank Group is one of the world’s largest sources of funding and
knowledge for developing countries, and is committed to reducing poverty,
increasing shared prosperity, and promoting sustainable development.
In fiscal 2017, IBRD, IDA, IFC, and MIGA collectively provided nearly $59 billion in
loans, grants, equity investments, and guarantees to partner countries and
private businesses—including to multiregional and global projects.
World Bank Lending │ Fiscal 20171
The World Bank is comprised of the International Bank for Reconstruction and
Development (IBRD) and the International Development Association (IDA), and it
is committed to the goals of ending extreme poverty and boosting shared
prosperity, and to achieving both goals in a sustainable manner.
Owned by its 189 member countries, the World Bank is a global development
cooperative. It is the largest development bank in the world, and it provides
financing, knowledge, and convening services to help client countries address
their most important development challenges.
The World Bank is solutions-oriented, focused on clients, accountable for quality
results, and dedicated to financial integrity and cost-effectiveness. It is
committed to improving the lives of roughly a billion people now living in
extreme poverty.
World Bank Lending │ Fiscal 20172

The International Bank for Reconstruction
and Development (IBRD)
Established 1944 │ 189 member countries
Fiscal 2017 commitments
$22.6 billion for
133 approved operations
Cumulative lending (since 1945)
$681.3 billion
The International Development
Association (IDA)
Established 1960 │ 173 member countries
Fiscal 2017 commitments
$19.5 billion for
261 approved operations
Cumulative lending (since 1960)
$345.5 billion
3 World Bank Lending │ Fiscal 2017

World Bank Lending │ Fiscal 20174
IBRD and IDA Board of Executive Directors and Alternatesas of June 30, 2017
Dr. Jim Yong KimPresident of the World Bank Group and Chairman of the Board of Executive Directors
Executive Directors Alternates
Khalid Alkhudairy Turki Dhaifallah AlmutairiJason Allford Hoe Jeong KimSeydou Bouda Jean-Claude TchatchouangOmar Bougara Nasir Mahmood KhosaAndrew Bvumbe Anne KabagambeOtaviano Canuto Diana QuinteroHervé de Villeroché Benoit Paul Eleuthere CatzarasSubhash Garg Muhammad Musharraf Hossain BhuiyanFranciscus Godts Guenther SchoenleitnerWerner Gruber Paulina GomulakAndin Hadiyanto Pornwasa SirinupongsMerza Hasan Ragui El-EtrebyFrank Heemskerk Claudiu DoltuChristine Hogan Peteranne Tamara DonaldsonFernando Jiménez Latorre Rodrigo Carriedo HaroKazuhiko Koguchi Daiho FujiiBongi Kunene Haruna MohammedAndrei Lushin Eugene B. MiagkovKaren Mathiasen (Vacant)Patrizio Pagano Nuno Mota PintoMelanie Robinson Clare RobertsMaximo Torero Daniel PieriniSusan Anette Ulbaek Martin PoderYingming Yang Minwen ZhangJuergen Zattler Claus Michael Happe

Fiscal Year Summary
In fiscal 2017, the World Bank (IBRD/IDA) committed $42.1 billion to partner countries, distributed in credits, loans, grants, and guarantees.
World Bank Lending │ Fiscal 20175

Fiscal Year Summary
In fiscal 2017, IBRD committed $22.6 billion for 133 new operations.
IDA committed $19.5 billion for 261 new operations.
World Bank Lending │ Fiscal 20176
Fiscal Year SummaryIBRD’s commitments of $22.6 billion reflect
the institution’s careful attention to ensure continued strong capital adequacy ratios and prudent financial management into the future while responding to client countries’ most pressing development challenges.
World Bank Lending │ Fiscal 20177

Fiscal Year SummaryIDA commitments of $19.5 billion reflect
strong demand for financing, as well as IDA’s efforts to better leverage resources and expand financing options for borrowing countries. These commitments included $16.2 billion in credits, $3.2 billion in grants, and $50 million in guarantees.
World Bank Lending │ Fiscal 20178
As of fiscal year 2017, new sector and theme categories have replaced the previous taxonomy as part of an internal data modernization effort. The data presented here reflects this new taxonomy.
Theme categories are not mutually exclusive; therefore, shares may sum to more than 100 percent of project financing and cannot be represented as a pie chart.
As a result of rounding, numbers in the following figures may not add to totals, and percentages in figures may not add to 100.
All dollar amounts reported are current U.S. dollars.
Note:
World Bank Lending │ Fiscal 20179
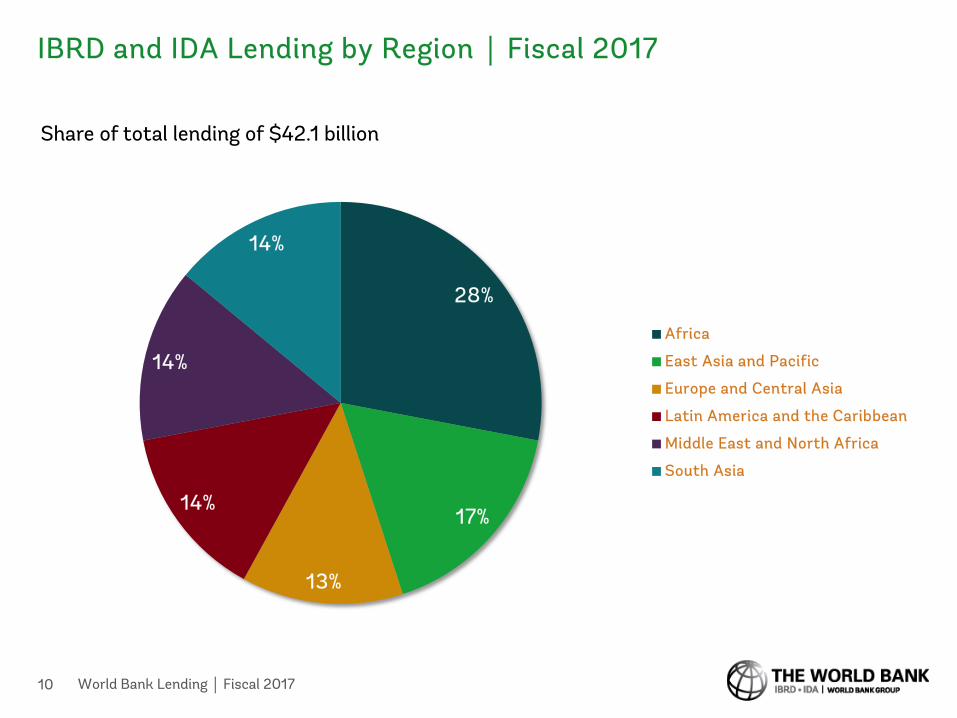
28%
17%
13%
14%
14%
14%
Share of total lending of $42.1 billion
Africa
East Asia and Pacific
Europe and Central Asia
Latin America and the Caribbean
Middle East and North Africa
South Asia
IBRD and IDA Lending by Region │ Fiscal 2017
10 World Bank Lending │ Fiscal 2017
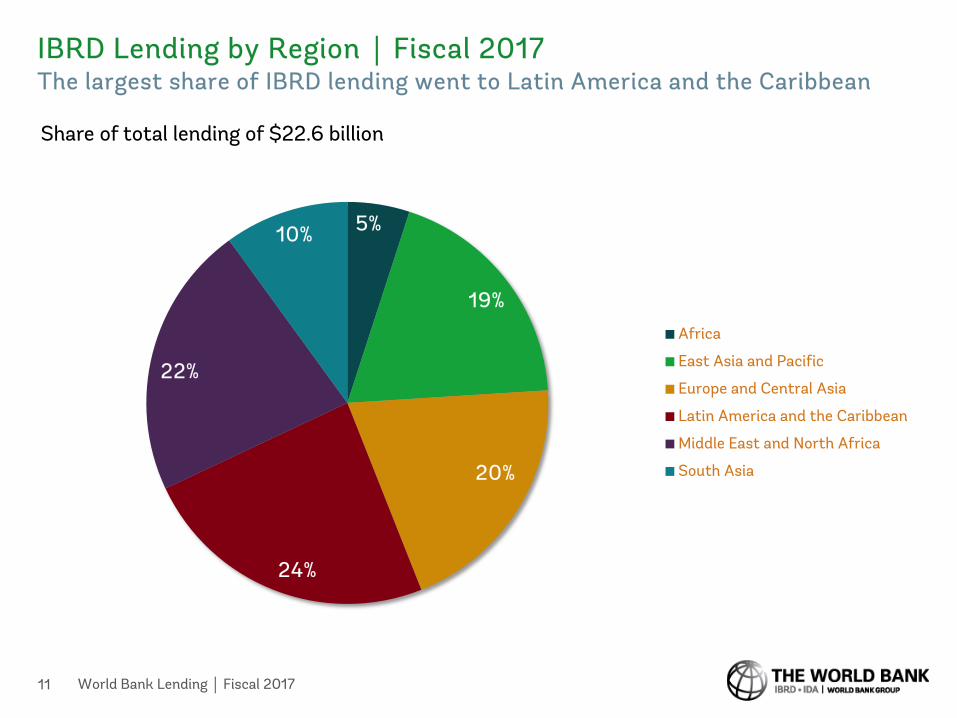
5%
19%
20%
24%
22%
10%
Share of total lending of $22.6 billion
Africa
East Asia and Pacific
Europe and Central Asia
Latin America and the Caribbean
Middle East and North Africa
South Asia
IBRD Lending by Region │ Fiscal 2017The largest share of IBRD lending went to Latin America and the Caribbean
11 World Bank Lending │ Fiscal 2017

55%
14%
4%
3%
5%
20%
Share of total lending of $19.5 billion
Africa
East Asia and Pacific
Europe and Central Asia
Latin America and the Caribbean
Middle East and North Africa
South Asia
IDA Lending by Region │ Fiscal 2017The largest share of IDA lending went to Africa
12 World Bank Lending │ Fiscal 2017
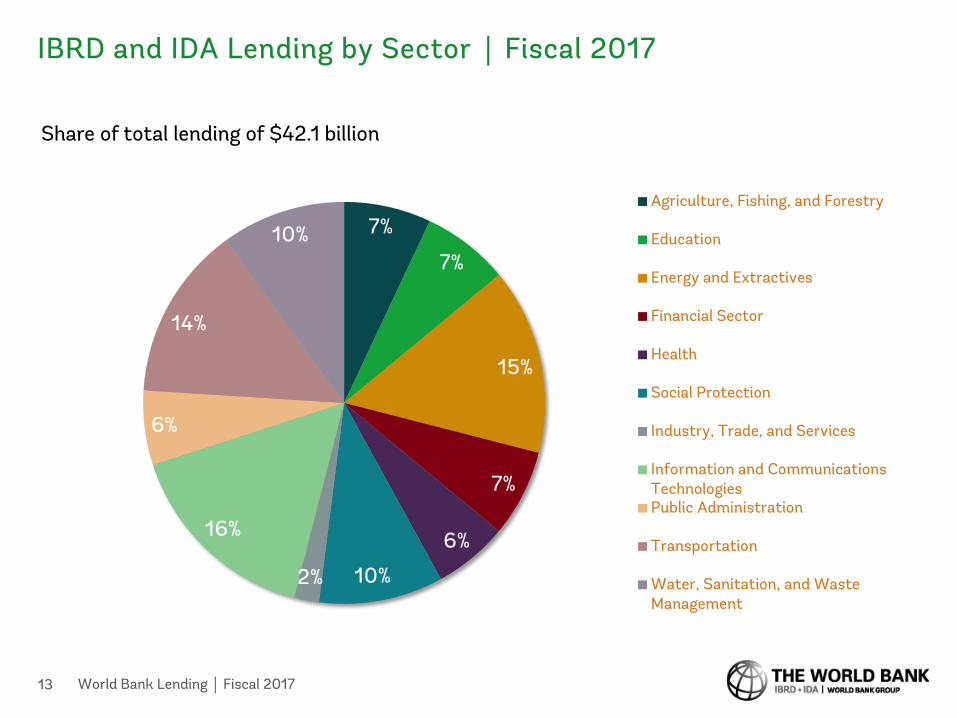
7%
7%
15%
7%
6%
10%2%
16%
6%
14%
10%
Share of total lending of $42.1 billion
Agriculture, Fishing, and Forestry
Education
Energy and Extractives
Financial Sector
Health
Social Protection
Industry, Trade, and Services
Information and CommunicationsTechnologiesPublic Administration
Transportation
Water, Sanitation, and WasteManagement
IBRD and IDA Lending by Sector │ Fiscal 2017
13 World Bank Lending │ Fiscal 2017

IBRD and IDA Lending by Theme │ Fiscal 2017
14 World Bank Lending │ Fiscal 2017
Theme Commitments (US dollar millions)
Economic Policy 3,468
Environment and Natural Resources Management 13,013
Finance 4,837
Human Development and Gender 9,158
Private Sector Development 10,578
Public Sector Management 5,452
Social Development and Protection 3,482
Urban and Rural Development 14,289
Note: As of fiscal year 2017, new sector and theme categories have replaced the previous taxonomy as part of an internal data modernization effort. Themes are not mutually exclusive; therefore, shares may sum to more than 100 percent of project financing and cannot be represented as a pie chart.
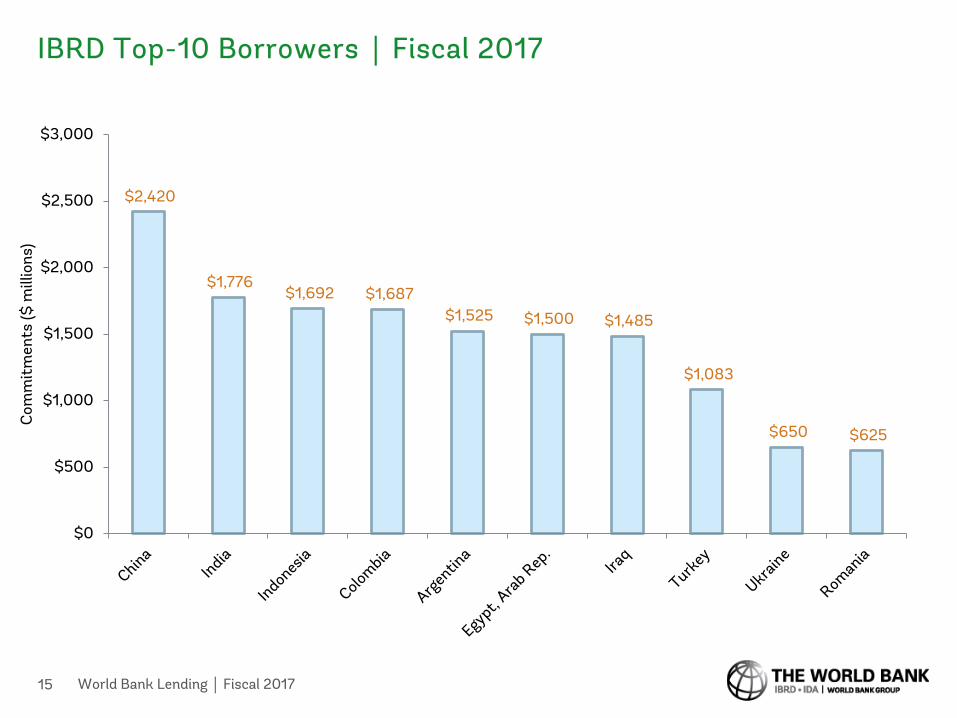
$2,420
$1,776 $1,692 $1,687
$1,525 $1,500 $1,485
$1,083
$650 $625
$0
$500
$1,000
$1,500
$2,000
$2,500
$3,000
Com
mit
men
ts ($
mill
ions
)
IBRD Top-10 Borrowers │ Fiscal 2017
15 World Bank Lending │ Fiscal 2017

$1,601 $1,512
$1,205 $1,152
$903 $900
$783 $736 $710
$640
$0
$200
$400
$600
$800
$1,000
$1,200
$1,400
$1,600
$1,800
Com
mit
men
ts ($
mill
ions
)
IDA Top-10 Borrowers │ Fiscal 2017
16 World Bank Lending │ Fiscal 2017

Regional Lendingby Theme and Sector

Africa Regional Snapshot
18 World Bank Lending │ Fiscal 2017
INDICATOR 2000 2010CURRENT
DATAa TREND
Total population (millions) 670 877 1,033Population growth (annual %) 2.7 2.8 2.7GNI per capita (Atlas method, current US$) 503 1,282 1,504GDP per capita growth (annual %) 0.9 2.6 -1.5Population living on less than $1.90 a day (millions) 391b 399 389Life expectancy at birth, females (years) 51 57 60Life expectancy at birth, males (years) 49 55 58Youth literacy rate, females (% ages 15–24) 62 66 66Youth literacy rate, males (% ages 15–24) 75 77 77Carbon dioxide emissions (megatons) 556 747 784
SDG 1.1 Extreme poverty (% population below $1.90 a day, 2011 PPP) 55.6b 45.7 41.0SDG 2.2 Prevalence of stunting, height for age (% children under 5) 43 38 35SDG 3.1 Maternal mortality ratio (modeled estimate, per 100,000 live births) 846 625 547SDG 3.2 Under-5 mortality rate (per 1,000 live births) 154 101 83SDG 4.1 Primary completion rate (% relevant age group) 54 68 69SDG 5 Ratio of female to male labor force participation rate (modeled ILO estimate, %) 81 84 84SDG 5.5 Proportion of seats held by women in national parliaments (% total) 12 19 24SDG 6.1 Access to safe drinking water (% population with access) 55 63 68SDG 6.2 Access to basic sanitation facilities (% population with access) 25 28 30SDG 7.1 Access to electricity (% population) 27 32 37SDG7.2 Renewable energy consumption (% total final energy consumption) 73 72 70SDG 17.8 Individuals using the Internet (% population) 0.5 10 22
MONITORING THE SUSTAINABLE DEVELOPMENT GOALS (SDGs)
Note: ILO = International Labour Organization; PPP = purchasing power parity. a. The most current data available between 2013 and 2016; visit http://data.worldbank.org for data updates.b. 2002 data.

$7,525
$10,613
$11,569
$9,346
$11,842
$0
$2,000
$4,000
$6,000
$8,000
$10,000
$12,000
$14,000
2013 2014 2015 2016 2017
Com
mit
men
ts ($
mill
ions
)
AfricaTotal IBRD and IDA Lending Trends │ Fiscal 2013–17
19 World Bank Lending │ Fiscal 2017
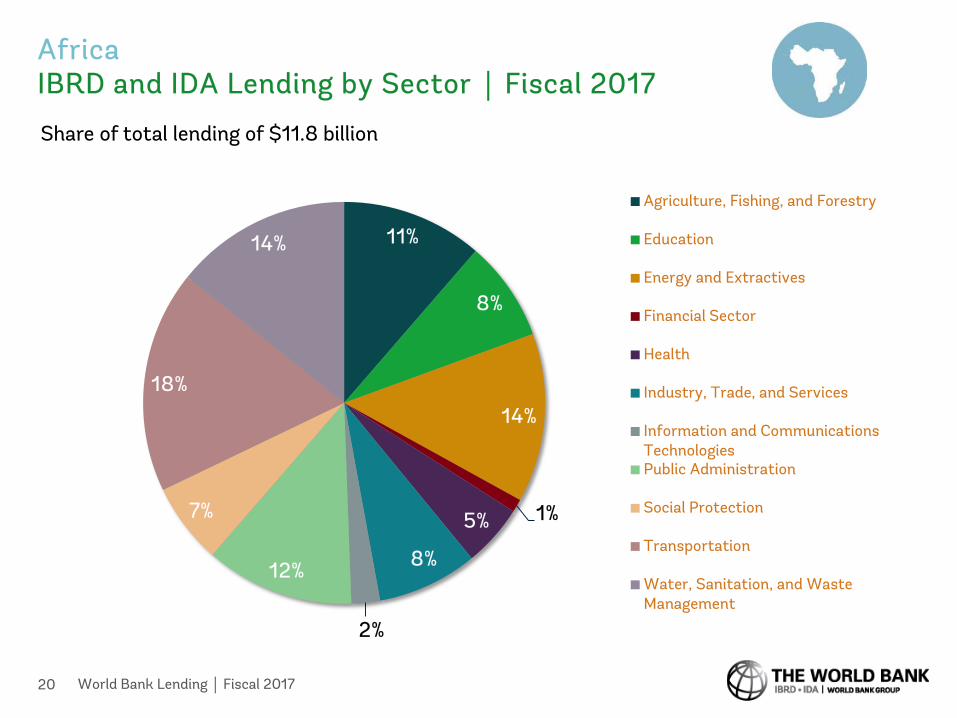
11%
8%
14%
1%5%
8%
2%
12%
7%
18%
14%
Share of total lending of $11.8 billion
Agriculture, Fishing, and Forestry
Education
Energy and Extractives
Financial Sector
Health
Industry, Trade, and Services
Information and CommunicationsTechnologiesPublic Administration
Social Protection
Transportation
Water, Sanitation, and WasteManagement
Africa IBRD and IDA Lending by Sector │ Fiscal 2017
20 World Bank Lending │ Fiscal 2017

Africa IBRD and IDA Lending by Theme │ Fiscal 2017
21 World Bank Lending │ Fiscal 2017
Theme Commitments (US dollar millions)
Economic Policy 1,002
Environment and Natural Resources Management 4,258
Finance 333
Human Development and Gender 3,621
Private Sector Development 3,409
Public Sector Management 1,689
Social Development and Protection 1,278
Urban and Rural Development 5,643
Note: As of fiscal year 2017, new sector and theme categories have replaced the previous taxonomy as part of an internal data modernization effort. Themes are not mutually exclusive; therefore, shares may sum to more than 100 percent of project financing and cannot be represented as a pie chart.
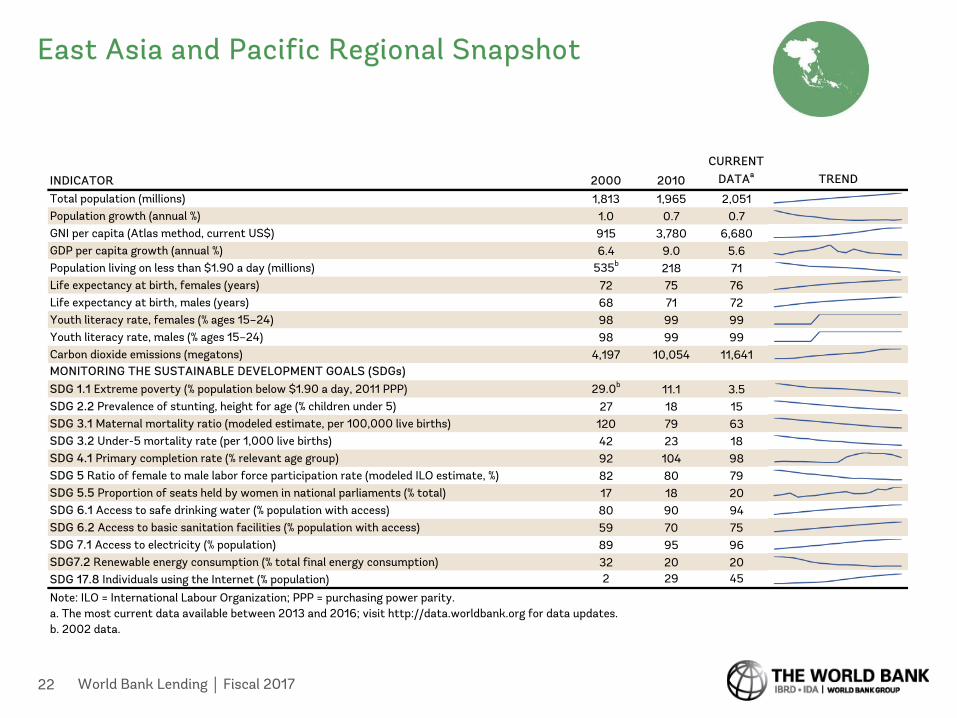
East Asia and Pacific Regional Snapshot
22 World Bank Lending │ Fiscal 2017
INDICATOR 2000 2010
CURRENT DATAa TREND
Total population (millions) 1,813 1,965 2,051Population growth (annual %) 1.0 0.7 0.7GNI per capita (Atlas method, current US$) 915 3,780 6,680GDP per capita growth (annual %) 6.4 9.0 5.6Population living on less than $1.90 a day (millions) 535b 218 71Life expectancy at birth, females (years) 72 75 76Life expectancy at birth, males (years) 68 71 72Youth literacy rate, females (% ages 15–24) 98 99 99Youth literacy rate, males (% ages 15–24) 98 99 99Carbon dioxide emissions (megatons) 4,197 10,054 11,641
SDG 1.1 Extreme poverty (% population below $1.90 a day, 2011 PPP) 29.0b 11.1 3.5SDG 2.2 Prevalence of stunting, height for age (% children under 5) 27 18 15SDG 3.1 Maternal mortality ratio (modeled estimate, per 100,000 live births) 120 79 63SDG 3.2 Under-5 mortality rate (per 1,000 live births) 42 23 18SDG 4.1 Primary completion rate (% relevant age group) 92 104 98SDG 5 Ratio of female to male labor force participation rate (modeled ILO estimate, %) 82 80 79SDG 5.5 Proportion of seats held by women in national parliaments (% total) 17 18 20SDG 6.1 Access to safe drinking water (% population with access) 80 90 94SDG 6.2 Access to basic sanitation facilities (% population with access) 59 70 75SDG 7.1 Access to electricity (% population) 89 95 96SDG7.2 Renewable energy consumption (% total final energy consumption) 32 20 20SDG 17.8 Individuals using the Internet (% population) 2 29 45
MONITORING THE SUSTAINABLE DEVELOPMENT GOALS (SDGs)
Note: ILO = International Labour Organization; PPP = purchasing power parity. a. The most current data available between 2013 and 2016; visit http://data.worldbank.org for data updates.b. 2002 data.

$6,247 $6,313 $6,342
$7,500 $7,107
$0
$1,000
$2,000
$3,000
$4,000
$5,000
$6,000
$7,000
$8,000
2013 2014 2015 2016 2017
Com
mit
men
ts ($
mill
ions
)
East Asia and Pacific Total IBRD and IDA Lending Trends │ Fiscal 2013–17
23 World Bank Lending │ Fiscal 2017
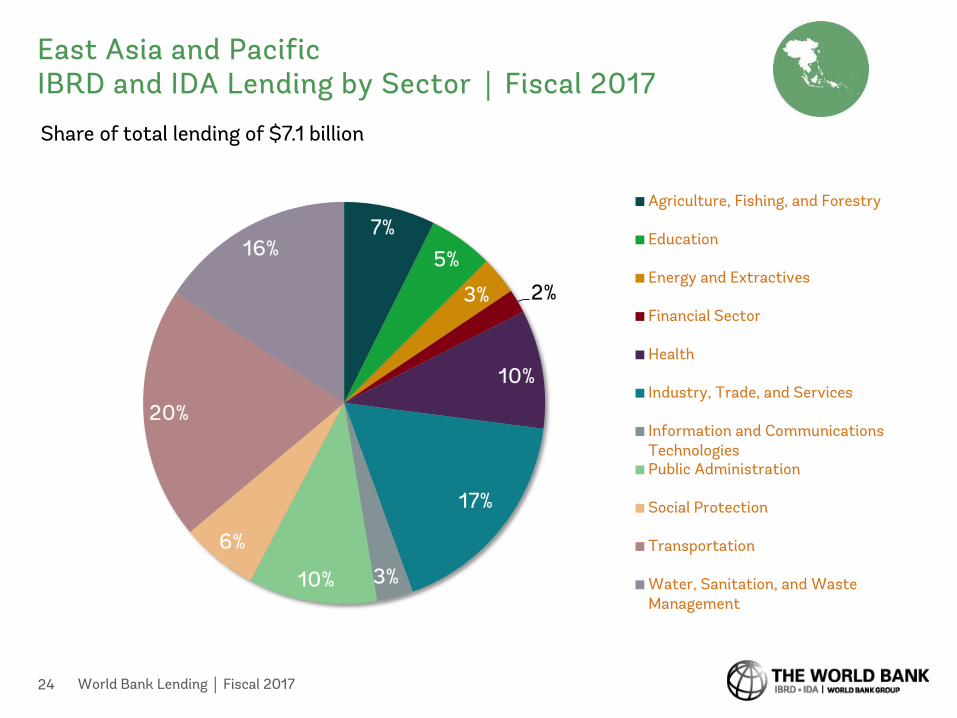
7%5%
3% 2%
10%
17%
3%10%
6%
20%
16%
Share of total lending of $7.1 billion
Agriculture, Fishing, and Forestry
Education
Energy and Extractives
Financial Sector
Health
Industry, Trade, and Services
Information and CommunicationsTechnologiesPublic Administration
Social Protection
Transportation
Water, Sanitation, and WasteManagement
East Asia and Pacific IBRD and IDA Lending by Sector │ Fiscal 2017
24 World Bank Lending │ Fiscal 2017

East Asia and Pacific IBRD and IDA Lending by Theme │ Fiscal 2017
25 World Bank Lending │ Fiscal 2017
0%
Theme Commitments (US dollar millions)
Economic Policy 736
Environment and Natural Resources Management 1,865
Finance 1,001
Human Development and Gender 1,225
Private Sector Development 916
Public Sector Management 441
Social Development and Protection 324
Urban and Rural Development 3,474
Note: As of fiscal year 2017, new sector and theme categories have replaced the previous taxonomy as part of an internal data modernization effort. Themes are not mutually exclusive; therefore, shares may sum to more than 100 percent of project financing and cannot be represented as a pie chart.

Europe and Central Asia Regional Snapshot
26 World Bank Lending │ Fiscal 2017
INDICATOR 2000 2010
CURRENT DATAa TREND
Total population (millions) 397 403 417Population growth (annual %) 0.0 0.5 0.6GNI per capita (Atlas method, current US$) 1,788 7,492 7,676GDP per capita growth (annual %) 7.9 4.6 0.8Population living on less than $1.90 a day (millions) 29b 14 10Life expectancy at birth, females (years) 73 75 77Life expectancy at birth, males (years) 63 66 68Youth literacy rate, females (% ages 15–24) 98 100 100Youth literacy rate, males (% ages 15–24) 99 100 100Carbon dioxide emissions (megatons) 2,712 3,036 3,164
SDG 1.1 Extreme poverty (% population below $1.90 a day, 2011 PPP) 6.3b 2.9 2.2SDG 2.2 Prevalence of stunting, height for age (% children under 5) 19 12 10SDG 3.1 Maternal mortality ratio (modeled estimate, per 100,000 live births) 56 29 25SDG 3.2 Under-5 mortality rate (per 1,000 live births) 37 22 17SDG 4.1 Primary completion rate (% relevant age group) 94 98 101SDG 5 Ratio of female to male labor force participation rate (modeled ILO estimate, %) 73 73 72SDG 5.5 Proportion of seats held by women in national parliaments (% total) 8 15 18SDG 6.1 Access to safe drinking water (% population with access) 93 95 97SDG 6.2 Access to basic sanitation facilities (% population with access) 83 85 86SDG 7.1 Access to electricity (% population) 98 100 100SDG7.2 Renewable energy consumption (% total final energy consumption) 6 6 6SDG 17.8 Individuals using the Internet (% population) 2 36 59
MONITORING THE SUSTAINABLE DEVELOPMENT GOALS (SDGs)
Note: ILO = International Labour Organization; PPP = purchasing power parity. a. The most current data available between 2013 and 2016; visit http://data.worldbank.org for data updates.b. 2002 data.

$5,320 $5,527
$7,207 $7,272
$5,308
$0
$1,000
$2,000
$3,000
$4,000
$5,000
$6,000
$7,000
$8,000
2013 2014 2015 2016 2017
Com
mit
men
ts ($
mill
ions
)
Europe and Central Asia Total IBRD and IDA Lending Trends │ Fiscal 2013–17
27 World Bank Lending │ Fiscal 2017

7%2%
41%
14%
4%
3%< 1%
12%
3%
11%
2%
Share of total lending of $5.3 billion
Agriculture, Fishing, and Forestry
Education
Energy and Extractives
Financial Sector
Health
Industry, Trade, and Services
Information and CommunicationsTechnologiesPublic Administration
Social Protection
Transportation
Water, Sanitation, and WasteManagement
Europe and Central Asia IBRD and IDA Lending by Sector │ Fiscal 2017
28 World Bank Lending │ Fiscal 2017
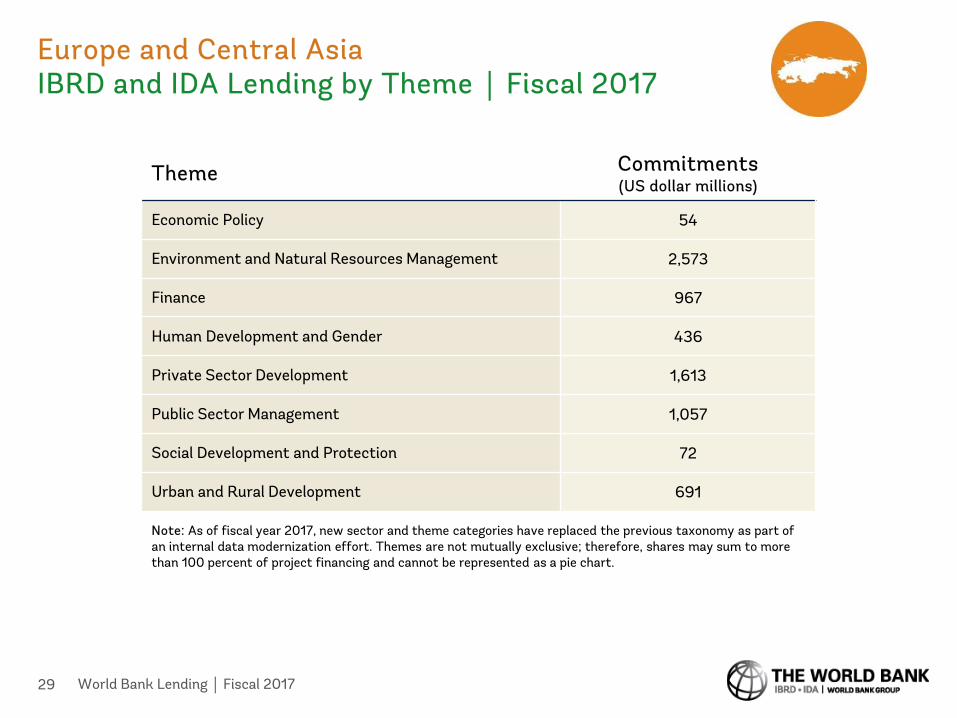
Europe and Central Asia IBRD and IDA Lending by Theme │ Fiscal 2017
29 World Bank Lending │ Fiscal 2017
Theme Commitments (US dollar millions)
Economic Policy 54
Environment and Natural Resources Management 2,573
Finance 967
Human Development and Gender 436
Private Sector Development 1,613
Public Sector Management 1,057
Social Development and Protection 72
Urban and Rural Development 691
Note: As of fiscal year 2017, new sector and theme categories have replaced the previous taxonomy as part of an internal data modernization effort. Themes are not mutually exclusive; therefore, shares may sum to more than 100 percent of project financing and cannot be represented as a pie chart.
INDICATOR 2000 2010
CURRENT DATAa TREND
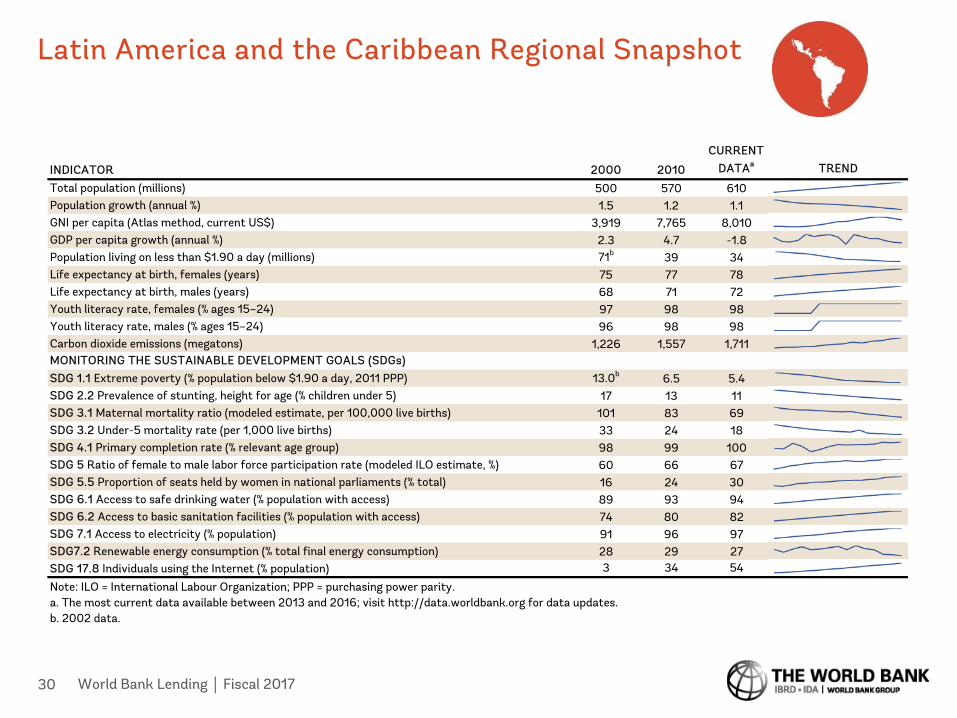
Total population (millions) 500 570 610Population growth (annual %) 1.5 1.2 1.1GNI per capita (Atlas method, current US$) 3,919 7,765 8,010GDP per capita growth (annual %) 2.3 4.7 -1.8Population living on less than $1.90 a day (millions) 71b 39 34Life expectancy at birth, females (years) 75 77 78Life expectancy at birth, males (years) 68 71 72Youth literacy rate, females (% ages 15–24) 97 98 98Youth literacy rate, males (% ages 15–24) 96 98 98Carbon dioxide emissions (megatons) 1,226 1,557 1,711
SDG 1.1 Extreme poverty (% population below $1.90 a day, 2011 PPP) 13.0b 6.5 5.4SDG 2.2 Prevalence of stunting, height for age (% children under 5) 17 13 11SDG 3.1 Maternal mortality ratio (modeled estimate, per 100,000 live births) 101 83 69SDG 3.2 Under-5 mortality rate (per 1,000 live births) 33 24 18SDG 4.1 Primary completion rate (% relevant age group) 98 99 100SDG 5 Ratio of female to male labor force participation rate (modeled ILO estimate, %) 60 66 67SDG 5.5 Proportion of seats held by women in national parliaments (% total) 16 24 30SDG 6.1 Access to safe drinking water (% population with access) 89 93 94SDG 6.2 Access to basic sanitation facilities (% population with access) 74 80 82SDG 7.1 Access to electricity (% population) 91 96 97SDG7.2 Renewable energy consumption (% total final energy consumption) 28 29 27SDG 17.8 Individuals using the Internet (% population) 3 34 54
MONITORING THE SUSTAINABLE DEVELOPMENT GOALS (SDGs)
Note: ILO = International Labour Organization; PPP = purchasing power parity. a. The most current data available between 2013 and 2016; visit http://data.worldbank.org for data updates.b. 2002 data.
Latin America and the Caribbean Regional Snapshot
30 World Bank Lending │ Fiscal 2017
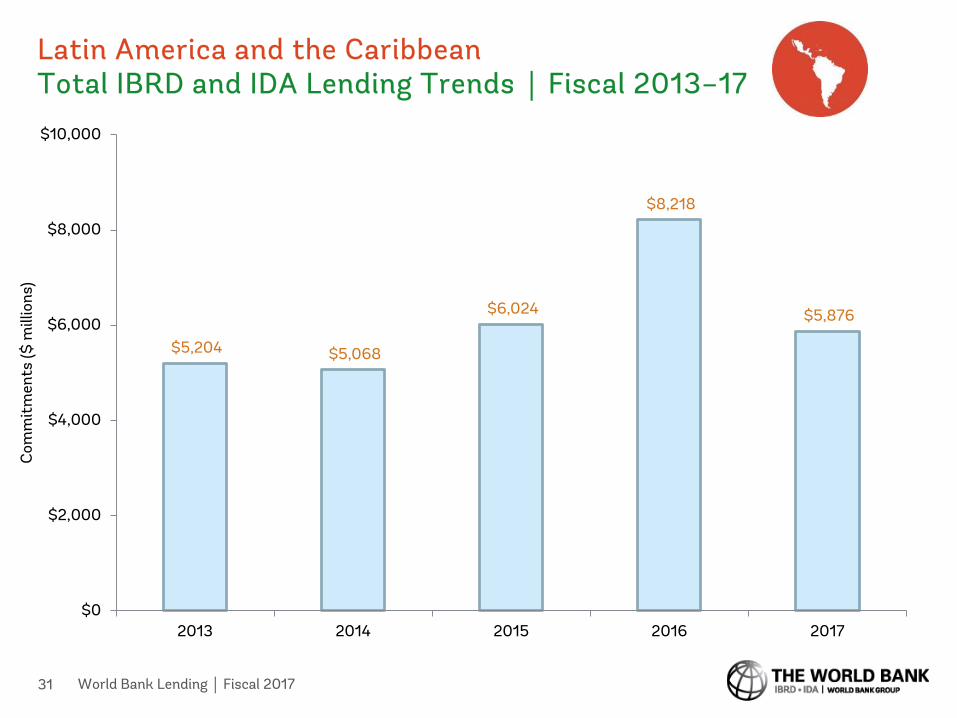
$5,204 $5,068
$6,024
$8,218
$5,876
$0
$2,000
$4,000
$6,000
$8,000
$10,000
2013 2014 2015 2016 2017
Com
mit
men
ts ($
mill
ions
)
Latin America and the Caribbean Total IBRD and IDA Lending Trends │ Fiscal 2013–17
31 World Bank Lending │ Fiscal 2017
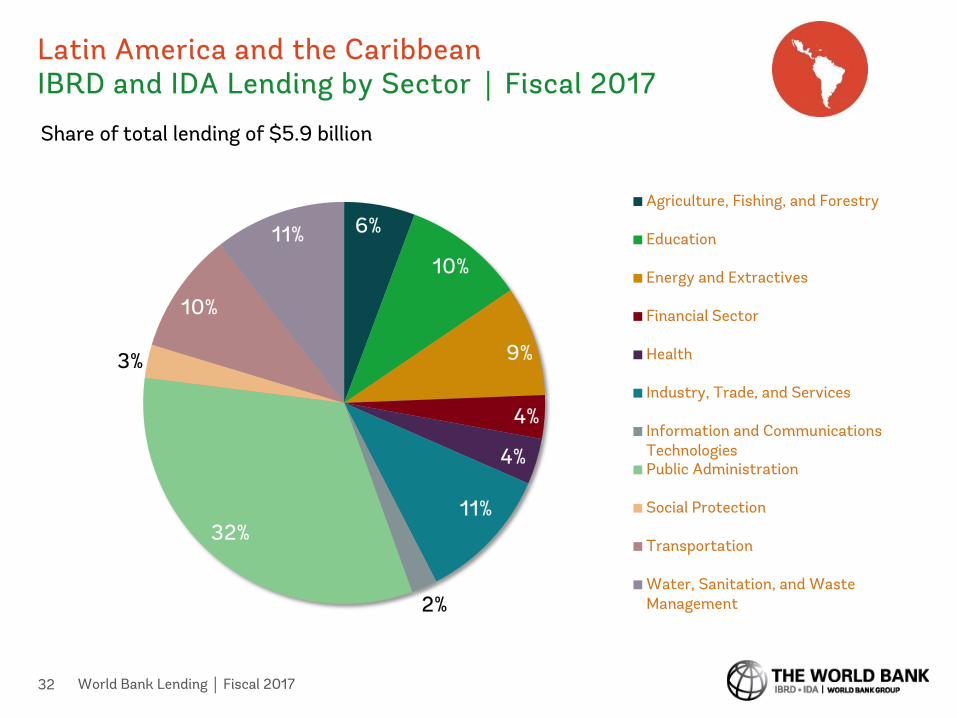
6%
10%
9%
4%
4%
11%32%
3%
10%
11%
Share of total lending of $5.9 billion
Agriculture, Fishing, and Forestry
Education
Energy and Extractives
Financial Sector
Health
Industry, Trade, and Services
Information and CommunicationsTechnologiesPublic Administration
Social Protection
Transportation
Water, Sanitation, and WasteManagement2%
Latin America and the Caribbean IBRD and IDA Lending by Sector │ Fiscal 2017
32 World Bank Lending │ Fiscal 2017

Latin America and the Caribbean IBRD and IDA Lending by Theme │ Fiscal 2017
33 World Bank Lending │ Fiscal 2017
2%
Theme Commitments (US dollar millions)
Economic Policy 387
Environment and Natural Resources Management 1,520
Finance 794
Human Development and Gender 1,039
Private Sector Development 1,488
Public Sector Management 942
Social Development and Protection 186
Urban and Rural Development 2,450
Note: As of fiscal year 2017, new sector and theme categories have replaced the previous taxonomy as part of an internal data modernization effort. Themes are not mutually exclusive; therefore, shares may sum to more than 100 percent of project financing and cannot be represented as a pie chart.
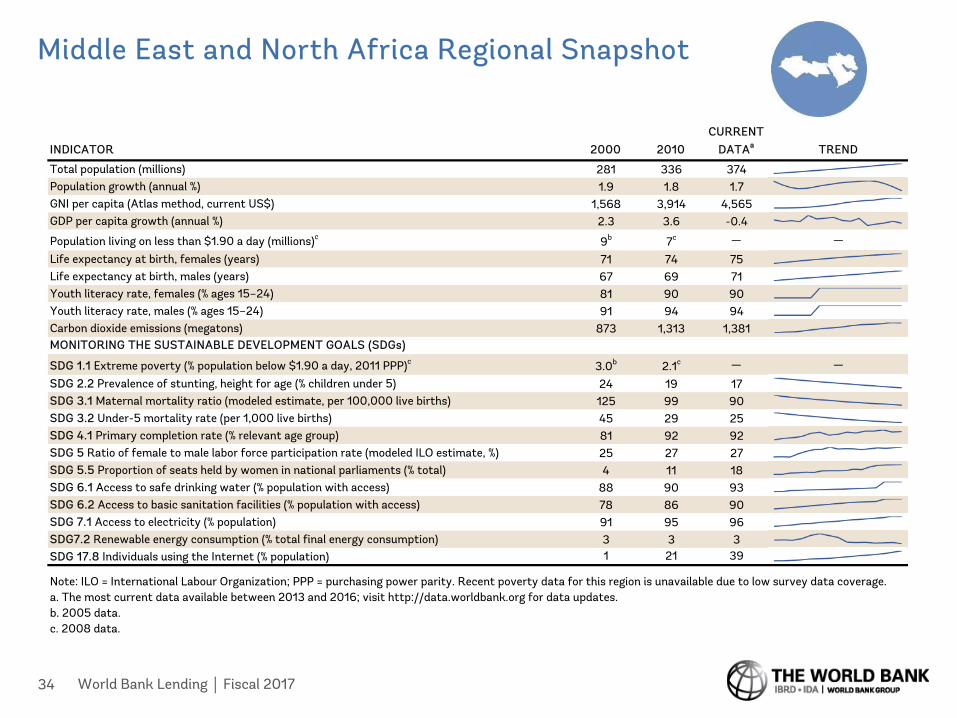
INDICATOR 2000 2010CURRENT
DATAa TREND
Total population (millions) 281 336 374Population growth (annual %) 1.9 1.8 1.7GNI per capita (Atlas method, current US$) 1,568 3,914 4,565GDP per capita growth (annual %) 2.3 3.6 -0.4
Population living on less than $1.90 a day (millions)c 9b 7c — —
Life expectancy at birth, females (years) 71 74 75Life expectancy at birth, males (years) 67 69 71Youth literacy rate, females (% ages 15–24) 81 90 90Youth literacy rate, males (% ages 15–24) 91 94 94Carbon dioxide emissions (megatons) 873 1,313 1,381
SDG 1.1 Extreme poverty (% population below $1.90 a day, 2011 PPP)c 3.0b 2.1c — —
SDG 2.2 Prevalence of stunting, height for age (% children under 5) 24 19 17SDG 3.1 Maternal mortality ratio (modeled estimate, per 100,000 live births) 125 99 90SDG 3.2 Under-5 mortality rate (per 1,000 live births) 45 29 25SDG 4.1 Primary completion rate (% relevant age group) 81 92 92SDG 5 Ratio of female to male labor force participation rate (modeled ILO estimate, %) 25 27 27SDG 5.5 Proportion of seats held by women in national parliaments (% total) 4 11 18SDG 6.1 Access to safe drinking water (% population with access) 88 90 93SDG 6.2 Access to basic sanitation facilities (% population with access) 78 86 90SDG 7.1 Access to electricity (% population) 91 95 96SDG7.2 Renewable energy consumption (% total final energy consumption) 3 3 3SDG 17.8 Individuals using the Internet (% population) 1 21 39
MONITORING THE SUSTAINABLE DEVELOPMENT GOALS (SDGs)
Note: ILO = International Labour Organization; PPP = purchasing power parity. Recent poverty data for this region is unavailable due to low survey data coverage.a. The most current data available between 2013 and 2016; visit http://data.worldbank.org for data updates.b. 2005 data.c. 2008 data.
Middle East and North Africa Regional Snapshot
34 World Bank Lending │ Fiscal 2017

$2,058
$2,788
$3,492
$5,201
$5,880
$0
$1,000
$2,000
$3,000
$4,000
$5,000
$6,000
$7,000
2013 2014 2015 2016 2017
Com
mit
men
ts ($
mill
ions
)
Middle East and North Africa Total IBRD and IDA Lending Trends │ Fiscal 2013–17
35 World Bank Lending │ Fiscal 2017

15%
15%
7%
13%
23%
13%
4% 4%
Share of total lending of $5.9 billion
Agriculture, Fishing, and Forestry
Education
Energy and Extractives
Financial Sector
Health
Industry, Trade, and Services
Information and CommunicationsTechnologiesPublic Administration
Social Protection
Transportation
Water, Sanitation, and WasteManagement
1% 2%
3%
Middle East and North Africa IBRD and IDA Lending by Sector │ Fiscal 2017
36 World Bank Lending │ Fiscal 2017
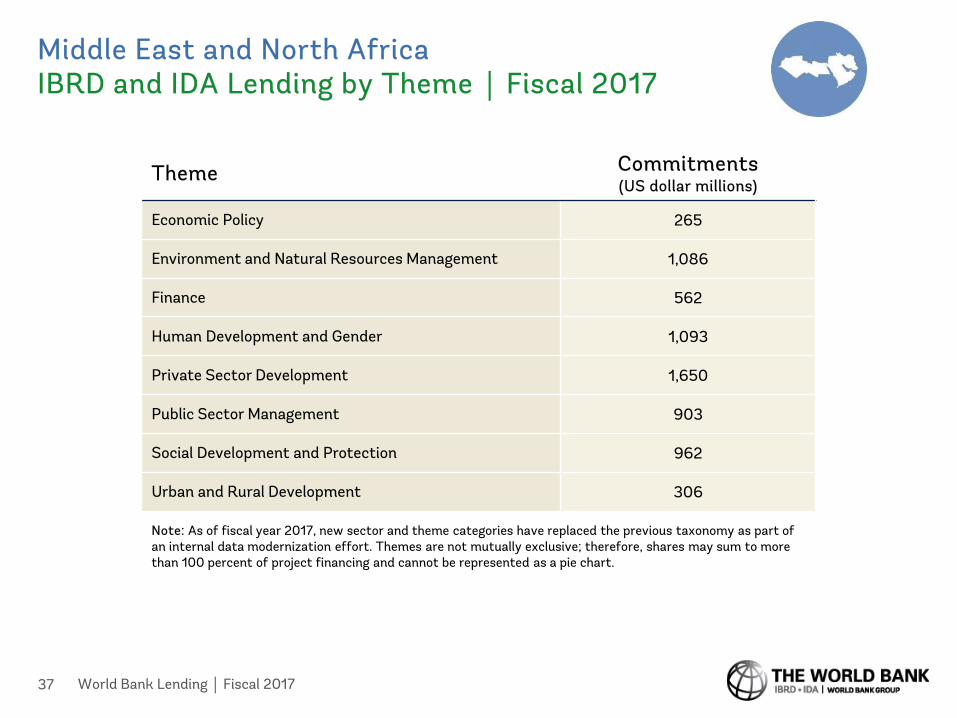
Middle East and North Africa IBRD and IDA Lending by Theme │ Fiscal 2017
37 World Bank Lending │ Fiscal 2017
Theme Commitments (US dollar millions)
Economic Policy 265
Environment and Natural Resources Management 1,086
Finance 562
Human Development and Gender 1,093
Private Sector Development 1,650
Public Sector Management 903
Social Development and Protection 962
Urban and Rural Development 306
Note: As of fiscal year 2017, new sector and theme categories have replaced the previous taxonomy as part of an internal data modernization effort. Themes are not mutually exclusive; therefore, shares may sum to more than 100 percent of project financing and cannot be represented as a pie chart.

38 World Bank Lending │ Fiscal 2017
South Asia Regional Snapshot
INDICATOR 2000 2010
CURRENT DATAa TREND
Total population (millions) 1,387 1,631 1,766Population growth (annual %) 1.9 1.4 1.3GNI per capita (Atlas method, current US$) 441 1,160 1,616GDP per capita growth (annual %) 2.2 7.5 5.5Population living on less than $1.90 a day (millions) 552b 400 256Life expectancy at birth, females (years) 64 68 70Life expectancy at birth, males (years) 62 66 67Youth literacy rate, females (% ages 15–24) 64 79 79Youth literacy rate, males (% ages 15–24) 81 87 87Carbon dioxide emissions (megatons) 1,181 1,970 2,303
SDG 1.1 Extreme poverty (% population below $1.90 a day, 2011 PPP) 38.5b 24.6 15.1SDG 2.2 Prevalence of stunting, height for age (% children under 5) 51 41 36SDG 3.1 Maternal mortality ratio (modeled estimate, per 100,000 live births) 388 228 182SDG 3.2 Under-5 mortality rate (per 1,000 live births) 94 64 53SDG 4.1 Primary completion rate (% relevant age group) 70 88 91SDG 5 Ratio of female to male labor force participation rate (modeled ILO estimate, %) 43 38 37SDG 5.5 Proportion of seats held by women in national parliaments (% total) 8 20 19SDG 6.1 Access to safe drinking water (% population with access) 80 89 92SDG 6.2 Access to basic sanitation facilities (% population with access) 29 40 45SDG 7.1 Access to electricity (% population) 57 75 80SDG7.2 Renewable energy consumption (% total final energy consumption) 53 42 39SDG 17.8 Individuals using the Internet (% population) 0.5 7 24
MONITORING THE SUSTAINABLE DEVELOPMENT GOALS (SDGs)
Note: ILO = International Labour Organization; PPP = purchasing power parity. a. The most current data available between 2012 and 2015; visit http://data.worldbank.org for data updates.b. 2002 data.

$4,474
$10,535
$7,860 $8,363
$6,061
$0
$2,000
$4,000
$6,000
$8,000
$10,000
$12,000
2013 2014 2015 2016 2017
Com
mit
men
ts ($
mill
ions
)
South Asia Total IBRD and IDA Lending Trends │ Fiscal 2013–17
39 World Bank Lending │ Fiscal 2017
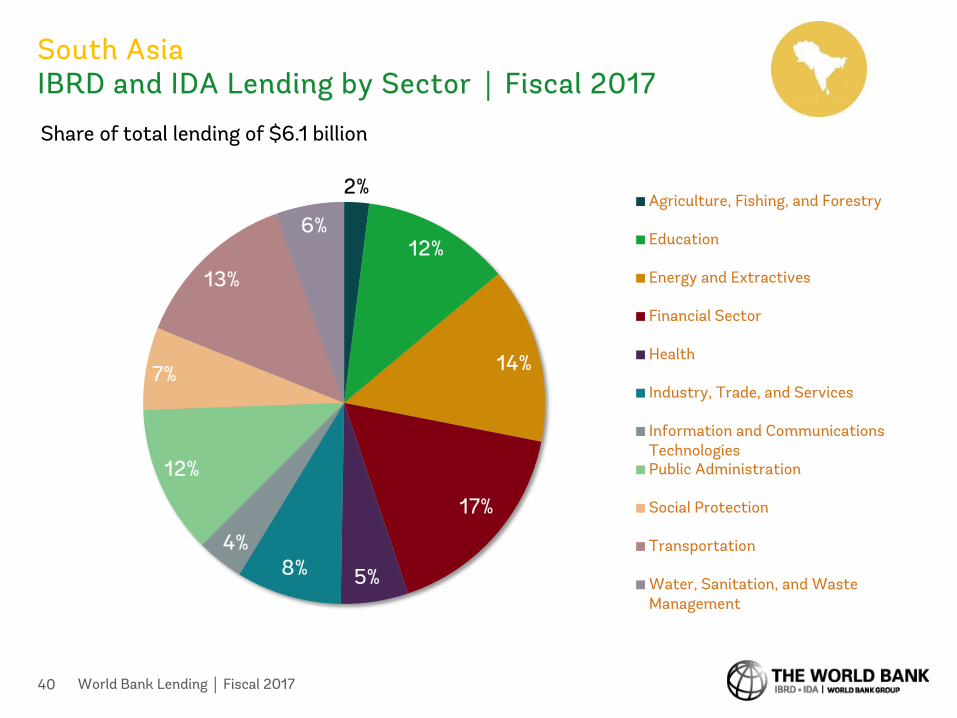
2%
12%
14%
17%
5%8%4%
12%
7%
13%
6%
Share of total lending of $6.1 billion
Agriculture, Fishing, and Forestry
Education
Energy and Extractives
Financial Sector
Health
Industry, Trade, and Services
Information and CommunicationsTechnologiesPublic Administration
Social Protection
Transportation
Water, Sanitation, and WasteManagement
South Asia IBRD and IDA Lending by Sector │ Fiscal 2017
40 World Bank Lending │ Fiscal 2017

South Asia IBRD and IDA Lending by Theme │ Fiscal 2017
41 World Bank Lending │ Fiscal 2017
Theme Commitments (US dollar millions)
Economic Policy 1,023
Environment and Natural Resources Management 1,710
Finance 1,180
Human Development and Gender 1,744
Private Sector Development 1,502
Public Sector Management 420
Social Development and Protection 661
Urban and Rural Development 1,727
Note: As of fiscal year 2017, new sector and theme categories have replaced the previous taxonomy as part of an internal data modernization effort. Themes are not mutually exclusive; therefore, shares may sum to more than 100 percent of project financing and cannot be represented as a pie chart.
Sectoral Lending by Region

49%
19%
13%
12%
3%5%
Share of total lending of $2.8 billion
Africa
East Asia and Pacific
Europe and Central Asia
Latin America and the Caribbean
Middle East and North Africa
South Asia
Agriculture, Fishing, and Forestry IBRD and IDA Lending by Region │ Fiscal 2017
43 World Bank Lending │ Fiscal 2017
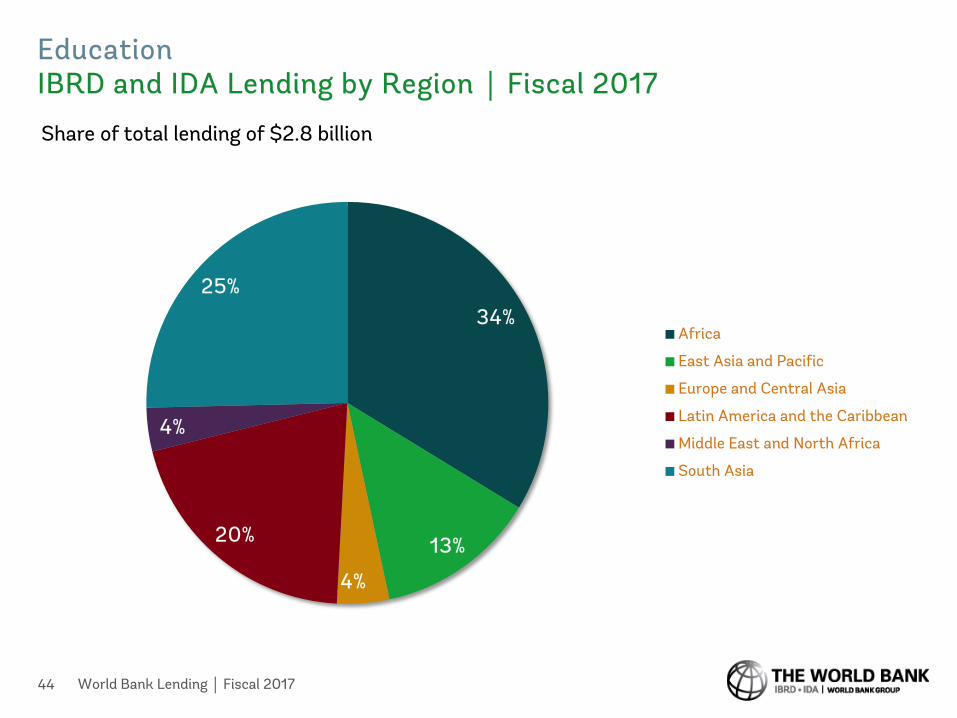
34%
13%
4%
20%
25%
Share of total lending of $2.8 billion
Africa
East Asia and Pacific
Europe and Central Asia
Latin America and the Caribbean
Middle East and North Africa
South Asia
4%
Education IBRD and IDA Lending by Region │ Fiscal 2017
44 World Bank Lending │ Fiscal 2017

26%
3%
35%
8%
14%
14%
Share of total lending of $6.3 billion
Africa
East Asia and Pacific
Europe and Central Asia
Latin America and the Caribbean
Middle East and North Africa
South Asia
Energy and Extractives IBRD and IDA Lending by Region │ Fiscal 2017
45 World Bank Lending │ Fiscal 2017
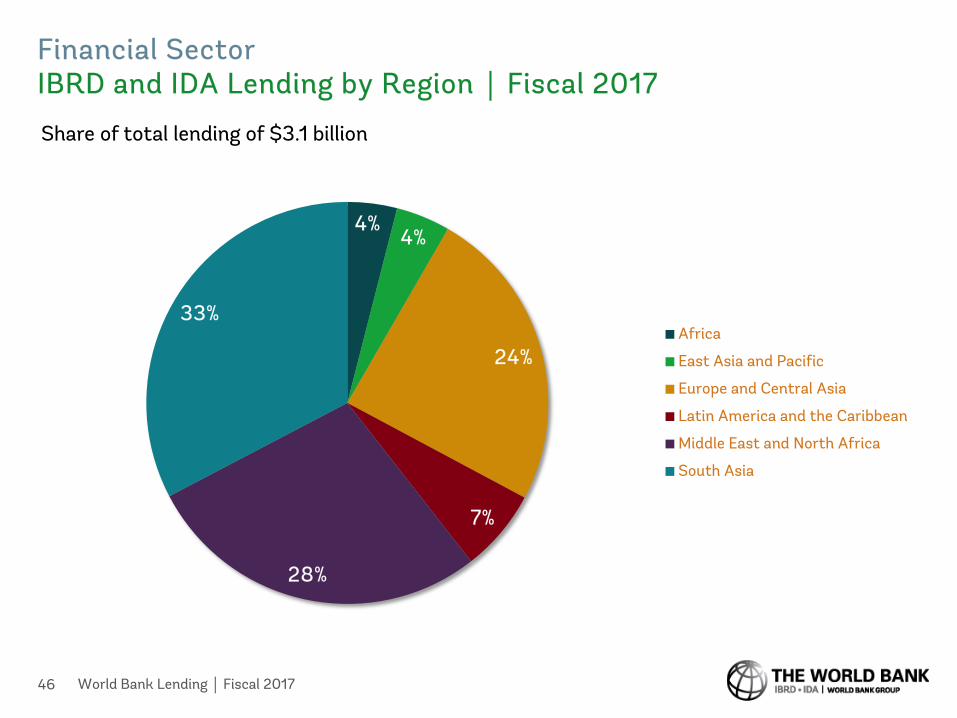
4%4%
24%
7%
28%
33%
Share of total lending of $3.1 billion
Africa
East Asia and Pacific
Europe and Central Asia
Latin America and the Caribbean
Middle East and North Africa
South Asia
Financial Sector IBRD and IDA Lending by Region │ Fiscal 2017
46 World Bank Lending │ Fiscal 2017

24%
28%
8%
9%
17%
13%
Share of total lending of $2.4 billion
Africa
East Asia and Pacific
Europe and Central Asia
Latin America and the Caribbean
Middle East and North Africa
South Asia
HealthIBRD and IDA Lending by Region │ Fiscal 2017
47 World Bank Lending │ Fiscal 2017
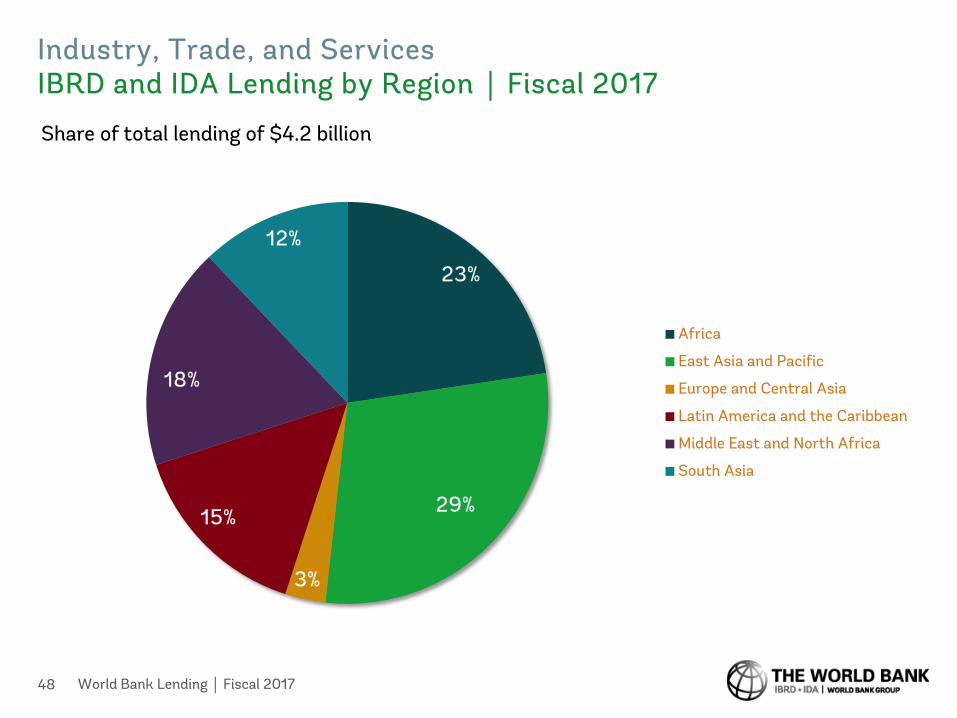
23%
29%
3%
12%
Share of total lending of $4.2 billion
Africa
East Asia and Pacific
Europe and Central Asia
Latin America and the Caribbean
Middle East and North Africa
South Asia
Industry, Trade, and ServicesIBRD and IDA Lending by Region │ Fiscal 2017
48 World Bank Lending │ Fiscal 2017
15%
18%

27%
20%
< 1%
12%
18%
22%
Share of total lending of $1.0 billion
Africa
East Asia and Pacific
Europe and Central Asia
Latin America and the Caribbean
Middle East and North Africa
South Asia
Information and Communications TechnologiesIBRD and IDA Lending by Region │ Fiscal 2017
49 World Bank Lending │ Fiscal 20167

20%
11%
10%
28%
11%
Share of total lending of $6.7 billion
Africa
East Asia and Pacific
Europe and Central Asia
Latin America and the Caribbean
Middle East and North Africa
South Asia
20%
Public Administration IBRD and IDA Lending by Region │ Fiscal 2017
50 World Bank Lending │ Fiscal 2017

29%
16%
5%6%
29%
15%
Share of total lending of $2.7 billion
Africa
East Asia and Pacific
Europe and Central Asia
Latin America and the Caribbean
Middle East and North Africa
South Asia
Social Protection IBRD and IDA Lending by Region │ Fiscal 2017
51 World Bank Lending │ Fiscal 2017

37%
25%
10%
10%
4%
14%
Share of total lending of $5.8 billion
Africa
East Asia and Pacific
Europe and Central Asia
Latin America and the Caribbean
Middle East and North Africa
South Asia
Transportation IBRD and IDA Lending by Region │ Fiscal 2017
52 World Bank Lending │ Fiscal 2017

41%
27%
3%
15%
5%
8%
Share of total lending of $4.1 billion
Africa
East Asia and Pacific
Europe and Central Asia
Latin America and the Caribbean
Middle East and North Africa
South Asia
Water, Sanitation, and Waste Management IBRD and IDA Lending by Region │ Fiscal 2017
53 World Bank Lending │ Fiscal 2017
Thematic Lending by Region

55 World Bank Lending │ Fiscal 2017
Economic Policy IBRD and IDA Lending by Region │ Fiscal 2017
Region Commitments (US dollar millions)
Africa 1,002
East Asia and Pacific 736
Europe and Central Asia 54
Latin America and the Caribbean 387
Middle East and North Africa 265
South Asia 1,023
Note: As of fiscal year 2017, new sector and theme categories have replaced the previous taxonomy as part of an internal data modernization effort. Themes are not mutually exclusive; therefore, shares may sum to more than 100 percent of project financing and cannot be represented as a pie chart.
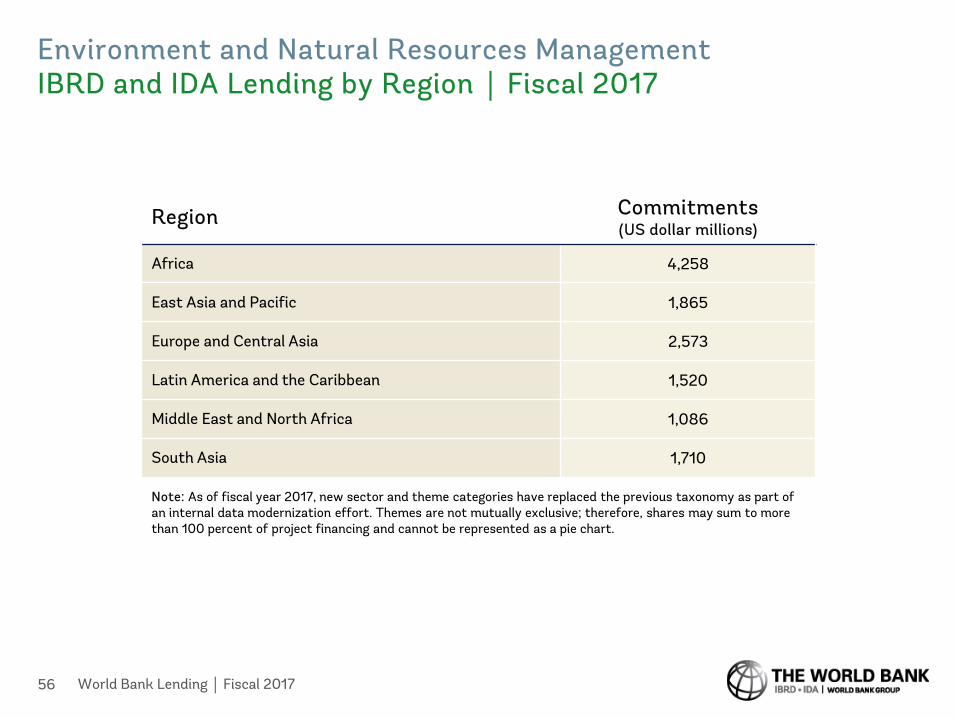
Environment and Natural Resources ManagementIBRD and IDA Lending by Region │ Fiscal 2017
56 World Bank Lending │ Fiscal 2017
5%
Region Commitments (US dollar millions)
Africa 4,258
East Asia and Pacific 1,865
Europe and Central Asia 2,573
Latin America and the Caribbean 1,520
Middle East and North Africa 1,086
South Asia 1,710
Note: As of fiscal year 2017, new sector and theme categories have replaced the previous taxonomy as part of an internal data modernization effort. Themes are not mutually exclusive; therefore, shares may sum to more than 100 percent of project financing and cannot be represented as a pie chart.
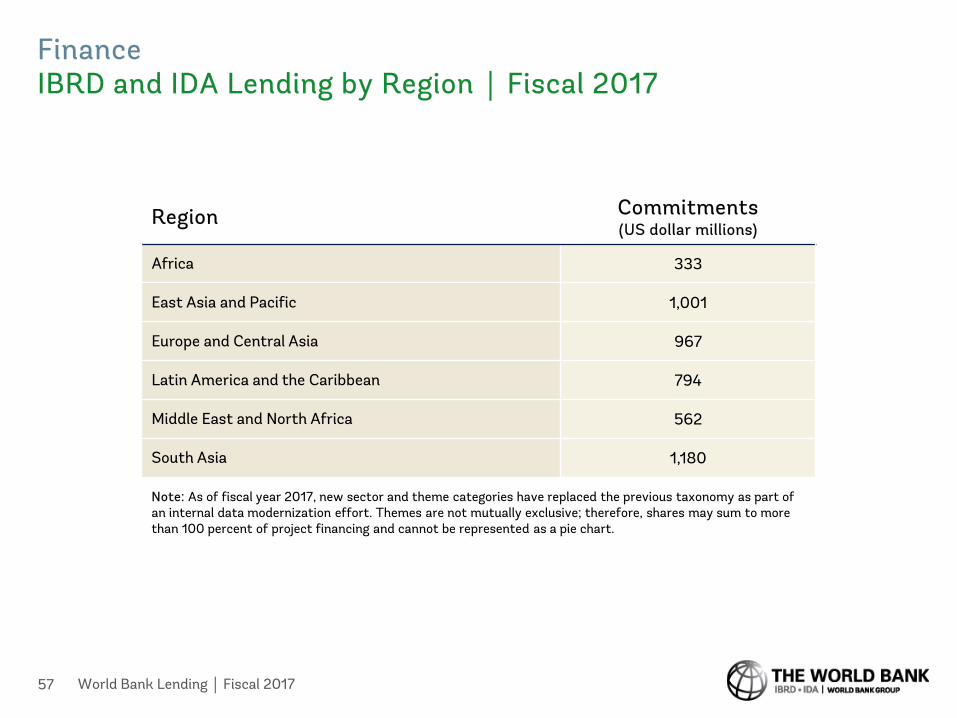
FinanceIBRD and IDA Lending by Region │ Fiscal 2017
57 World Bank Lending │ Fiscal 2017
Region Commitments (US dollar millions)
Africa 333
East Asia and Pacific 1,001
Europe and Central Asia 967
Latin America and the Caribbean 794
Middle East and North Africa 562
South Asia 1,180
Note: As of fiscal year 2017, new sector and theme categories have replaced the previous taxonomy as part of an internal data modernization effort. Themes are not mutually exclusive; therefore, shares may sum to more than 100 percent of project financing and cannot be represented as a pie chart.

Human Development and GenderIBRD and IDA Lending by Region │ Fiscal 2017
58 World Bank Lending │ Fiscal 2017
42%
Region Commitments (US dollar millions)
Africa 3,621
East Asia and Pacific 1,225
Europe and Central Asia 436
Latin America and the Caribbean 1,039
Middle East and North Africa 1,093
South Asia 1,744
Note: As of fiscal year 2017, new sector and theme categories have replaced the previous taxonomy as part of an internal data modernization effort. Themes are not mutually exclusive; therefore, shares may sum to more than 100 percent of project financing and cannot be represented as a pie chart.

Private Sector DevelopmentIBRD and IDA Lending by Region │ Fiscal 2017
59 World Bank Lending │ Fiscal 2017
Region Commitments (US dollar millions)
Africa 3,409
East Asia and Pacific 916
Europe and Central Asia 1,613
Latin America and the Caribbean 1,488
Middle East and North Africa 1,650
South Asia 1,502
Note: As of fiscal year 2017, new sector and theme categories have replaced the previous taxonomy as part of an internal data modernization effort. Themes are not mutually exclusive; therefore, shares may sum to more than 100 percent of project financing and cannot be represented as a pie chart.
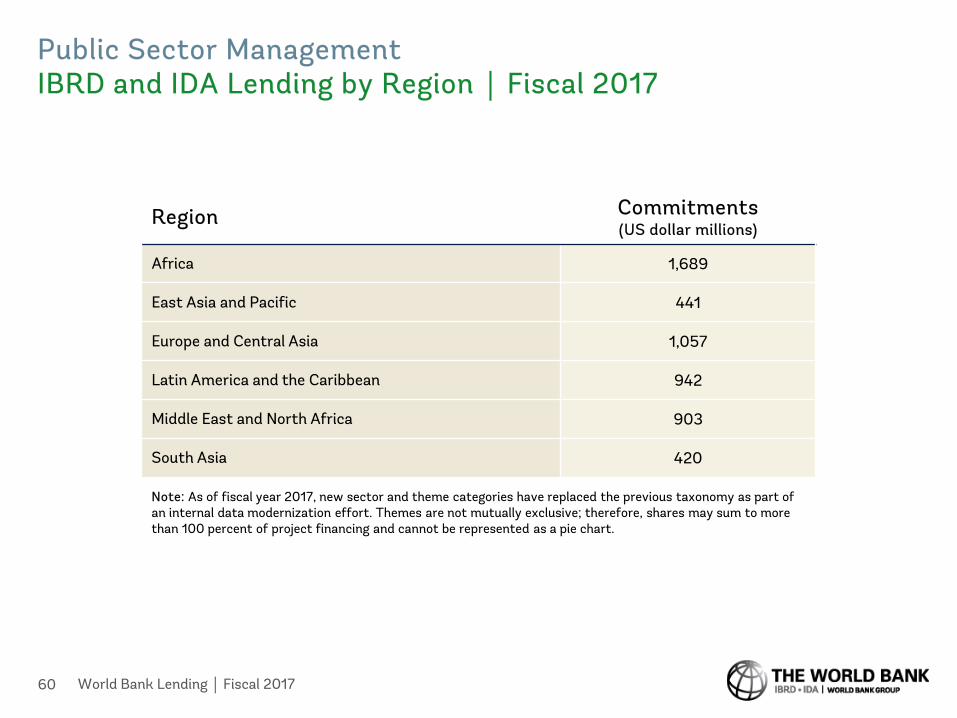
Public Sector ManagementIBRD and IDA Lending by Region │ Fiscal 2017
60 World Bank Lending │ Fiscal 2017
Region Commitments (US dollar millions)
Africa 1,689
East Asia and Pacific 441
Europe and Central Asia 1,057
Latin America and the Caribbean 942
Middle East and North Africa 903
South Asia 420
Note: As of fiscal year 2017, new sector and theme categories have replaced the previous taxonomy as part of an internal data modernization effort. Themes are not mutually exclusive; therefore, shares may sum to more than 100 percent of project financing and cannot be represented as a pie chart.

Social Development and ProtectionIBRD and IDA Lending by Region │ Fiscal 2017
61 World Bank Lending │ Fiscal 2017
Region Commitments (US dollar millions)
Africa 1,278
East Asia and Pacific 324
Europe and Central Asia 72
Latin America and the Caribbean 186
Middle East and North Africa 962
South Asia 661
Note: As of fiscal year 2017, new sector and theme categories have replaced the previous taxonomy as part of an internal data modernization effort. Themes are not mutually exclusive; therefore, shares may sum to more than 100 percent of project financing and cannot be represented as a pie chart.

Urban and Rural DevelopmentIBRD and IDA Lending by Region │ Fiscal 2017
62 World Bank Lending │ Fiscal 2017
Region Commitments (US dollar millions)
Africa 5,643
East Asia and Pacific 3,474
Europe and Central Asia 691
Latin America and the Caribbean 2,450
Middle East and North Africa 306
South Asia 1,727
Note: As of fiscal year 2017, new sector and theme categories have replaced the previous taxonomy as part of an internal data modernization effort. Themes are not mutually exclusive; therefore, shares may sum to more than 100 percent of project financing and cannot be represented as a pie chart.
For more information visit
worldbank.org/annualreport
World Bank Lending │ Fiscal 201763