world bank document€¦ · · 2016-07-17hydropower rehabilitation and system control project...
TRANSCRIPT
Document of
The World Bank
FOR OFFICIAL USE ONLY
Report No: 24947
IMPLEMENTATION COMPLETION REPORT(CPL-38650; TF-20272)
ONA
LOAN
IN THE AMOUNT OF US$ 114 MILLION
TO
UKRAINE
FOR A
HYDROPOWER REHABILITATION AND SYSTEM CONTROL PROJECT
12/24/2002
This document has a restricted distribution and may be used by recipients only in theperformance of their official duties. Its contents may not otherwise be disclosed withoutWorld Bank authorization.
Pub
lic D
iscl
osur
e A
utho
rized
Pub
lic D
iscl
osur
e A
utho
rized
Pub
lic D
iscl
osur
e A
utho
rized
Pub
lic D
iscl
osur
e A
utho
rized

CURRENCY EQUIVALENTS
(Exchange Rate Effective as of November 1, 2002)
Currency Unit = 1 Hrivnya = 100 kopeksUAH 1 = US$ 0.19US$ 1 = 5.33 UAH
FISCAL YEARJanuary 1 December 31
ABBREVIATIONS AND ACRONYMSCAS Country Assistance StrategyCFP Coal-Fired PlantCHF Swiss FrancCIDA Canadian Agency for International DevelopmentDHE DniprohydroenergoEBRD European Bank for Reconstruction and DevelopmentEIRR Economic Internal Rate of ReturnEU European UnionFSU Former Soviet UnionGDP Gross Domestic ProductGEF Global Environment FacilityGoU Government of UkraineGWh Gigawatt hourHPP Hydropower PlantIAS Intemational Accounting StandardsICR Implementation Completion ReportIDC Interest During ConstructionkWh Kilowatt hourMW Megawatt (I0^6 W)MUV Manufacturing Unit ValueNDC National Dispatch CenterNERC National Electricity Regulatory CommissionNPP Nuclear Power PlantNPV Net Present ValueO&M Operations and MaintenancePPI Producer Price IndexPSP Pump Storage PlantSAR Staff Appraisal ReportSCADA Supervisory Control and Data SystemTA Technical AssistanceTWh Terawatt hour (1012 Wh)UAH Ukrainian Hrivnya (1 Hrivnya = 100 kopeks)UE UkrenergoUPS Ukrainian Power SystemVAT Value-Added Tax
Vice President: Johannes F. LinnCountry Manager/Director: Luca Barbone
Sector Manager/Director: Hossein RazaviTask Team Leader/Task Manager: Nikolay Nikolov

UKRAINEHYDROPOWER REHAB
CONTENTS
Page No.1. Project Data 12. Principal Performance Ratings 13. Assessment of Development Objective and Design, and of Quality at Entry 24. Achievement of Objective and Outputs 95. Major Factors Affecting Implementation and Outcome 166. Sustainability 197. Bank and Borrower Performance 208. Lessons Learned 249. Partner Comments 2610. Additional Information 40Annex 1. Key Performance Indicators/Log Frame Matrix 56Annex 2. Project Costs and Financing 58Annex 3. Economic Costs and Benefits 60Annex 4. Bank Inputs 111Annex 5. Ratings for Achievement of Objectives/Outputs of Components 113Annex 6. Ratings of Bank and Borrower Performance 114Annex 7. List of Supporting Documents 115Annex 8. Summaries of project completion reports from the DHE and UE 116
Map IBRD 32185


Project ID: P038820 Project Name: HYDROPOWER REHAB ANDSYSTEM CONTROL
Team Leader: Nikolay Nikolov TL Unit: ECSIE
ICR Type: Core ICR Report Date: December 24, 2002
1. Project Data
Name: HYDROPOWER REHAB AND SYSTEM L/C/TF Nzmber: CPL-38650; TF-20272CONTROL
Country/Department: UKRAINE Region. Europe and CentralAsia Region
Sector/subsector: Power (100%)
KEY DATESOriginal Revised/Actual
PCD. 06/24/1994 Effective: 12/27/1995 05/24/1996Appraisal: 09/14/1994 MTR: 09/30/1997 11/11/1997Approval: 04/11/1995 Closing: 12/31/2000 06/30/2002
Borrower/Inmplementing Agency: GOVT OF UKRAINE/DNIPROHYDROENERGO & NATL. DISPATCH CTR.Other Partners: Governments of Canada, Norway, Switzerland
STAFF Current At AppraisalVice President: Johanes Linn Wilfried ThalwitzCountry Manager: Luca Barbone Basil KavalskySector Manager: Hossein Razavi Dominique LallementTeam Leader at ICR Nikolay Nikolov Laszlo LoveiICR Primary Author: Nikolay Nikolov with
contributions from DennisCreamer - consultant (economicanalysis); Simos Kamchis -consultant (financial analysis);Yun Miroshnichenko; YolandaL. Gedse; Maria Koreniako
2. Principal Performance Ratings
(HS=Highly Satisfactory, S=Satisfactory, U=Unsatisfactory, HL=Highly Likely, L=Likely, UN=Unlikely, HUN=HighlyUnlikely, HU=Highly Unsatisfactory, H=High, SU=Substantial, M=Modest, N=Negligible)
Outcome: S
Sustarnabilety. L
Institutional Development Impact: M
Bank Performance: S
Borrower Performance: S
QAG (if available) ICRQuality at Entry:
Project at Risk at Any Time: Yes

3. Assessment of Development Objective and Design, and of Quality at Entry
3.1 Original Objective:Background
The Ukrainian Power System (UPS) was developed and operated as a part of the integrated power systemof the FSU. The efficient performance of the system was severely affected by (i) a vertical state-ownedmonopoly structure; (ii) high energy intensity; (iii) limited domestic energy endowments, and (iv) a deepeconomic and institutional crisis which followed the disintegration of the FSU in 1991.
The separation of the Ukrainian Power System from the Russian power system revealed serious structuraland functional weaknesses which affected the overall system operation, security, reliability and quality ofpower supply. These weaknesses concemed the insufficient amount of load-following generation capacity,capable of maintaining flexible production schedule and providing frequency regulation, i.e., the lack ofplants which operate in the mid and peak sections of the load duration curve. This critical function wasprovided by the hydropower plants on the Dnieper and Dniester rivers. Most of the Ukraine's thermalplants were base load, especially the coal-fired ones. Some larger gas units were more flexible, but weresuffering from difficulties in fuel supply as the Ukrainian power sector had difficulties paying for gasimports.
To address these issues, the GoU adopted a two-pronged strategy of institutional reforms and investmentsin priority areas. The development of the Government's energy strategy was supported by the Bank since1992 through technical assistance and an Energy Sector Review (Report No. 11646-UA). During thisprocess, the Bank reached an agreement with the Government and other international donors to enhancesupport to power generation and gas transmission and distribution as sectors in which the Bank could makea significant difference in Ukraine. In this context, the Government, assisted by the Bank and other donors,started the preparation of the Hydropower Rehabilitation and System Control Project. A comprehensivefeasibility study outlined the overall rehabilitation needs of the Dnieper cascade. In view of the large scopeof identified rehabilitation works, the project was designed to include as a first phase a portion of theneeded overall hydropower plants rehabilitation. The remaining rehabilitation works at the Dniepercascade were to be pursued in the context of the outcome of the first rehabilitation phase, the furtheradvancement of the Governments priorities in the power sector and the continuation of a project enablingframework.
The project aimed at addressing some of the important priorities in the Ukrainian power system:rehabilitation of hydropower plants meant maintaining the most flexible generation plants at their maximumproductive levels. The project also provided a moderate leverage for implementation of broader sectorreforms, especially in its preparatory stage. The early stage of the project's implementation was affectedby a severe economic and financial crisis which caused a precipitous decline of electricity payments.Nevertheless, through sustained efforts of the Bank, the GoU, the project beneficiaries Dniprohydroenergoand Ukrenergo, and with support from the governments of Canada, Norway and Switzerland, the projectwas successfully implemented, within an unbundled power sector with much improved financial discipline,advancing privatization of electricity companies and a developed regulatory framework.
Obiectives
The project had the following objectives: (i) improve the efficiency, reliability, safety and environmentalperformance of hydropower plants - this objective included enhancement of the dam safety monitoringsystem, improvement of the water quality of the Dnieper River through reduction of oil leakages into the
- 2-
river to minimal level due to installation of new ecologically safe turbines, and improvement of themanagement of the multi-purpose Dnieper reservoirs, (ii) increase hydropower generation capacity, whichimplied increasing peak capacity and power generation in peak time zone; (iii) improve the quality ofelectricity supply by upgrading load and frequency control; and (iv) reduce fuel costs by facilitating theeconomic dispatch of generating units.
The objectives of the project were clear and important for sector development. They were responsive to thepriorities of the least cost investment plan for the power sector which included the rehabilitation of thehydropower plants. The project objectives were also supportive of the Bank's overall strategy to facilitateUkraine's effort to carry out structural reforms and to promote efficiency investments in high prioritysectors such as energy in order to complete the transition to a market economy and to accelerate economicgrowth. The project was designed to respond to the needs of the power sector in a critical period ofUkraine's history, shortly after the country gained independence and suffered a deep economic crisis at thesame time.
The project was quite demanding on the two implementing agencies (Dniprohydroenergo and NationalDispatch Center/Ukrenergo) because of its broad institutional, geographical and technical scope, the relatedcomplexity and risks, and the beneficiaries' limited experience in dealing with projects financed byinternational institutions. In this context, the good technical expertise of the implementing agencies wasconsidered an important counterbalancing factor.
Complex institutional and organizational aspects
The rehabilitation of the hydropower plants (one of the two main investment components of the project),carried out by Dniprohydroenergo, required coordination of the work of eight large power plants on thereservoirs of the Dnieper cascade with a total capacity of 3,799 MW, 18 design institutes, more than 100equipment manufacturers, over 30 installation and commissioning companies, and about 100 othercontractors. The upgrade of the system control and dispatch (the other investment component of theproject) was carried out by an entity - National Dispatch Center (NDC) - which, during the projectimplementation period, was subject to more institutional changes than any other entity in the electricitysector. NDC has endured a series of major reorganizations, starting up just as a dispatch center, then beinga part of the company providing transmission, dispatch and market operation services, and ending up as apart of the Ukraine's unified transmission and dispatch company (Ukrenergo).
Broad geographical scope
The dams of the Dnieper cascade are some of the world's longest, located in six of the most industrializedand heavily populated regions of Ukraine along the basin of the third largest river in Europe. The upgradeof the system control and dispatch encompassed works throughout the country.
Complex technical aspects.
Rehabilitation on such a large scale was not carried out before in Ulraine. In view of the importance of theDnieper cascade for the power system load and frequency regulation, the turbines and generators had to berehabilitated without discontinuing the operation of the remaining equipment at the power plants.Maintaining normal operational parameters of the power plants even during rehabilitation of individualgeneration units was a pioneering approach in Ukraine.
- 3-

Risks
Low cash collections in the electricity sector represented huge financial risk to the project. The need torehabilitate turbines and generators while continuing to generate posed difficult scheduling requirementsand continuously risked delaying the project. The requirement to operate as many units as possible duringthe spring flood seasons put significant pressure on the rehabilitation works as well.
3.2 Revised Objective:The objectives of the project were not revised.
3.3 Original Components.The achievement of the project objectives was ensured by the adequate design of the original projectcomponents, listed below:
(i) Rehabilitation of hydropower plants on the Dnieper cascade;(ii) Installation of a dam safety monitoring system at the main reservoirs on the Dnieper river;(iii) Upgrade of communications, dispatch, and system control;(iv) Technical assistance.
The first two components, implemented by Dniprohydroenergo, supported the first two project objectives ofimproving the efficiency, reliability, safety and environmental performance of hydropower plants; andincreasing hydropower generation capacity. The third component, implemented by NDC/Ukrenergo,supported the other two project objectives (improving the quality of electricity supply by upgrading loadand frequency control; and reducing fuel costs by facilitating economic dispatch of generating units).
Although demanding, the project design capitalized on the beneficiaries' good technical and engineeringcapabilities.
Key aspects of the project components are presented below:
(a) Rehabilitation of hydropower plants on the Dnieper cascade.Cost: US$ 84.2 million.
This component included rehabilitation of the eight HPPs on the Dnieper River. (See attached map). Therehabilitation of the system control and monitoring at HPPs on the Dnieper cascade was also included.
The component addressed critical performance aspects of aging HPPs such as derating of the units, lowefficiency and availability. The oldest HPP, Dnieper-l (Dniproges-l) was built in 1932 and reconstructedin 1947, five of the plants were more than 30 years old and the other two were more than 20 years old.
-4-
(b) Installation of a dam safety monitoring system at the main reservoirs of the Dnieper River (Kiev,Kanev, Kremenchug, Dniprodzerzhinsk, Dnieper, Kakhovka).Cost: US$ 2.5 million.
This component aimed at rehabilitating the existing dam monitoring system in order to improve the safetyof about 100 km of dams and dykes for the multipurpose reservoirs on the Dnieper river. The reservoirdams have low heads and long embankmnents with dykes protecting the surrounding land from floods.
(c) Upgrade of communication, dispatch, and system control.Cost: US$ 55.2 million.
This component included an upgrade of the following key elements of the UPS:
(i) communications systems;(ii) frequency regulation, dispatch and control systems;(iii) relay protection devices of the main transmission network.
The rehabilitation of the system control and monitoring at the Dniester HPP was also included.
This component aimed at overcoming the deficiencies across the UPS that compromised the reliability,quality and security of electricity supply. The poor frequency regulation represented an increased risk foroperation of the nuclear power plants, since their protection system would trip them off if the systemfrequency were to go beyond certain range.
(d) Technical assistance.Cost: US$ 5.0 million.
Building on a lesson learned from an earlier World Bank - financed Institution Building Project in Ukraine(Loan 3614-UA), a technical assistance (TA) component was included in the project to compensate for thebeneficiaries' inexperience in implementing projects with donor financing and international procurement.This was to be done through supporting technical services for preliminary engineering design, preparationof technical specifications and tender documents, conducting international tendering, contract negotiationsand administration, and helping in project monitoring and reporting. Training by equipment suppliers wasenvisaged in the tender documents. Training in management and procurement was also provided by Bankstaff.
In addition, in view of the importance of the multi-purpose use of the reservoirs on the Dnieper river, thetechnical assistance component included a review of the procedures in managing the river basin'sreservoirs.
3.4 Revised Components:The number and the type of the components were not revised, but the schedules and physical quantities ofsome of the components were modified. The main revisions concemed the number of turbines andgenerators subject to rehabilitation which was financed from Dniprohydroenergo's revenues rather thanfrom the IBRD loan.
- 5-

The schedule for the installation of dam safety monitoring system experienced major delays as a result ofthe desire by DHE to have this system delivered by a local contractor and financed from internal funds.However, it turned out that the local contractor at the end was not able to deliver the system withsatisfactory technical performance. Consequently, DHE then decided to procure the system internationallyand finance it from the IBRD loan, but much time had been lost in the meantime. As a result, dam safetymonitoring equipment was installed only at the most critical and longest Kiev dam of the cascade.
The length of the fiber optic conmmunications lines was slightly increased together with the scope ofequipment for hydro generators to better respond to the evolving system needs. The scope of systemcontrol and monitoring equipment was significantly increased and installed on two additional plants tofully accommodate the needs of the entire Dnieper cascade. Such equipment was additionally installed atKremenchug and Dneprodzerzhinsk HPPs in view of their importance for regulating operations of theplants in the cascade. A component for installing thermal power plants (TPPs) governors (technicaldevices which regulate the output of the TPPs) was replaced by a relevant study to respond to the reducedincentives in the power market for installing such governors. The scope and timing of the TA wereadjusted to the overall changes in scope and timing of the project works.
Turbine and Generator Rehabilitation
(a) The original project scope foresaw the rehabilitation of 23 turbines and 37 generators. Upon beginningof the project works, larger than expected wear and tear of the generating units called for a greater level oflocal works per each unit. Consequently, the number of turbines to be rehabilitated was reduced from 23 to22 in the early stage of the project
(b) In addition, the deterioration of electricity payments continued from 1998 to early 2000 and affectedlocal project financing. It was therefore agreed to further scale down the turbine/generator rehabilitationworks, which critically depended on local funds. Thus, the number of turbines and generators to berehabilitated was reduced from 22 turbines and 37 generators to 13 and 15 respectively. At the end of theproject, DHE had managed to exceed this target, rehabilitating 16 pairs of turbines and generators.
Dam Safety Monitoring System
(c) In the beginning of the project, locally financed national manufacturers could not ensure the requiredspecifications of the dam monitoring equipment. It was then decided to launch an international competitivetender for a pilot contract for supply and installation of such equipment for only the Kiev HPP. Theexperience gained from this pilot contract was supposed to be used in procuring monitoring equipment forthe other dams of the cascade. The unexpected replacement of the local supplier with an intemational onedelayed the implementation schedule of the dam safety component. Consequently, the scope of installingmonitoring equipment was reduced from 100 km along all HPPs to 50 km at Kiev HPP, which is mostcritically located at the beginning of the cascade. The experience from preparing tender documents forKiev HPP was used for the design and technical specifications of the dam safety upgrade at the remainingplants.
Control and Monitoring System
(d) During the installation of the system control and monitoring equipment at Dnieper HPPs, additionalpossibilities were identified for a better adaptation of the equipment to the needs of the cascade. Therefore,the original scope of equipment was significantly expanded with modified software, electrical protection
-6-
systems, metering equipment and spare parts, and included two more plants -- Kremenchug andDneprodzerzhinsk - in view of the importance of their regulatory capacity for the entire cascade. At thesame time, system controls at Kiev PSP and Dnieper HPP-2 were rehabilitated partially in response to thespecific needs at these plants.
(e) One hundred and sixty km of fiber optic communications line were laid in addition to the original scopeof 1,000 km in order to connect the Central and Western communications networks of the UPS.
Auxiliary Equipment
(f) The quantity of the equipment for hydro generators was also slightly increased.
(g) The Ukrenergo's component for upgrade of frequency regulation, dispatch and system control includedoriginally a sub-component for upgrading the governors of the generation units of the thermal power plants.This activity was designed to improve the capability of the power system to regulate frequency. However,this sub-component was canceled due to (i) lack of financial incentives for the thermal plants to participatein load frequency regulation, since payments for this service were not recognized by the electricity market;(ii) the requirement for the plants to finance local costs associated with insta1ling new governors, while theplants lacked such funds due to non-payments in the electricity market; (iii) the status of the plants asindependent legal entities, which hampered the management of this project sub-component outside thestructure of the implementing agency Ukrenergo; (iv) the unique water technology of the governors, notsupported by mranufacturers outside the former Soviet Union; (v) physical ware-and-tear of the thermalgenerators and the auxiliary TPP equipment together with outdated boiler automation called for muchlarger investments than expected.
(h) The Bank proposed instead, that a study on the automatic frequency regulation by the thermal powerplants be carried out in order to partially compensate for the cancellation of the sub-component forinstalling governors at these plants. The findings were used by the Ministry of Fuel and Energy as a basisfor preparing official guidelines for providing economic incentives to the thermal power plants involved inautomatic frequency regulation.
Audits and Technical Assistance
(i) The scope and timing of the technical assistance were modified to follow the changes in the actual scopeand timing of the project work. In addition, in view of the insufficient local funds, the project beneficiaries,with the Bank's agreement, chose to use more than half of the technical assistance funds from the Bank tocover the cost of. annual audits under the project. Technical assistance from the Canadian and Swissgovernments compensated for the reduction of the Bank's TA funds as a result of the audit fundingarrangements.
3.5 Quality at Entry:Quality at entry is judged to be satisfactory because the project objectives were consistent with (i) thegovernment priorities; (ii) the CAS, and (iii) the Bank's safeguard policies. In addition, the projectcomponents were designed to enable the achievement of the project objectives.
The project was consistent with the Government's strategy of rationalizing energy use throughrehabilitating hydro and thermal power plants, increasing reliance on renewable energy, and improvingsafety of the power system within the context of overall sector restructuring.
-7-

Bank sector work was used in the project preparation. In addition, the project was also responsive to theBank's strategy to promote efficiency improvements and adapt the energy utilities to the requirements of amarket economy. The project objectives were clearly outlined, and although demanding, were achievable inthe context of the counterparts' implementation capacity and commnitment for results. The project wasdesigned to respond to the priorities of the power sector and the funding arrangements were commensuratewith the project scope and needs. Project conditionality focused on ensuring proper structure andoperations of the implementing agencies in terms of consolidation of the Dnieper HPPs into a single jointstock company, transfer of the ownership of the regional dispatch centers to the National Dispatch Center,establishment of Project Implementation Units, signing adequate agreements for electricity sales andcontracts with strategic domestic turbine and generator manufacturers, observance of proper financialreporting and auditing standards.
The Bank ensured that the Ministry of Energy and the implementing agencies were actively involved in therelevant sector work and feasibility studies. The technical, financial, economic and environmental aspectsof the project were thoroughly assessed. Sensitivity of project sustainability to cost overruns, decline ofeconomic value of electricity and fuel savings was assessed as well.
Readiness for implementation was also analyzed in detail: the implementation capacity of the projectbeneficiaries was reviewed along with the manufacturing potential of the local suppliers, critical to theproject. On the basis of this analysis, technical assistance was envisaged to provide support in the areas ofengineering, procurement and project management. The engineering design was based on detailedfeasibility studies. The project performance indicators were designed to ensure adequate monitoring ofprogress towards achieving project objectives in terms of increasing generating capacity, improvingefficiency and frequency, reducing oil leakages and enhancing dam safety. Major risks related to pricingand non-payments were addressed through relevant loan conditions, political risk of reversal of reforms wasalso outlined.
In compliance with the Bank's safeguard policies, an environmental analysis was carried out and noimplications for intemational waterways were identified. Although the former Operational ManualStatement (OMS) 3.80 on dam safety safeguards was applicable only to the construction of new dams, andnot to the already existing dams included in the project at the time of appraisal, relevant safeguardmeasures, required under the current more rigorous safeguard policies, were actually designed andimplemented in an effort to bring more dam safety benefits to the project company Dniprohydroenergo.
Most of the assumptions made during project preparation were reasonable with the notable exception ofthose related to the timely improvement of the payment collections in the sector and the subsequentimprovement of the financial situation of the project implementing agencies. Non-payments persisted untilearly 2000 when the govemment initiated efficient measures to resolve this issue. These measurescoincided with the actual beginning of the economic recovery, which was forecasted at appraisal to beginmuch earlier in 1997.
In addition, the electricity demand forecast and the related least-cost development program were moreoptimistic at appraisal than their revaluation towards the project's end in 2001. Nevertheless, the finaloutcome was overall satisfactory.
-8-

4. Achievement of Objective and Outputs
4.1 Outcome/achievement of objective*Summary assessment of outcome
The overall outcome of the project is rated as satisfactory. As noted in the following sections, allenvisioned objectives were achieved, although with delays, and on occasion, on a reduced scale. Theproject objectives are in line with the current CAS objectives to attain job-creating sustainable economicgrowth, solve enviromnental issues in the energy sector and move Ukraine closer to the European Union'sstandards, fostering environmentally sustainable development. The development impact has been alsosatisfactory since the two project components brought desired quality, efficiency, safety and environmentalbenefits to the entire power system, although within the smaller scope of turbine/generator rehabilitationworks at commensurate lower total costs. The assessment was facilitated by the performance indicators inthe Staff Appraisal Report (SAR).
Achievement of objectives
Achievement of objective (a) improve the efficiency, safety, and environmental performance of thehydropower plants:
Efficiency of the hydropower plants:The nominal target efficiency parameters have been achieved for all rehabilitated units at the hydropowerplants. (See Annex 1)
Safety of the hydropower plants:The installation of a dam safety monitoring system at the Kiev reservoir dam, situated upstream at the headof the Dnieper cascade, has improved the safety and reliability of the Kiev reservoir and the downstreamreservoirs, all situated along very densely populated and industrialized areas.
In addition, the installation of electrical protection devices and microprocessor-based control systems forturbine/generators units and entire plants has contributed to improved the safety of equipment maintenanceand operation.
Environmental performance of the hydropower plants:Environmental improvements have been also enhanced by upgrading the dam safety instrumentation atKiev HPP. Oil leaks into the Dnieper River have been eliminated by installing new environmentally safeturbines. Environmental risks have been further reduced by improving the water management of theDnieper reservoirs as a result of the installation of modem control and monitoring system equipment andthe follow up on the TA recommnendations of a water management study.
Achievement of objective (b) increase of hydropower generation capacity:
Additional total capacity of 88.1MW (2% increase of total capacity of the Dnieper cascade) was obtainedwithin the reduced project scope vs. 130 MW (3% increase of total capacity of Dnieper cascade) expectedunder the initial full project scope. The lower capacity increase at project completion was commensuratewith the overall reduction of the scope of rehabilitation works under the project.
-9-
Achievement of objective (c) improving the quality of electricity supply by upgrading load and frequencycontrol:
Frequency, a key criterion of the quality of electricity supply, has improved. Deviations of maximum andminimum frequency from the 50 Hz target have been reduced to acceptable ranges. Also, the monthlymaximum accumulated time error has been reduced from minutes to seconds. The number and the amount(MW) of load curtailments per year have been also reduced.
These results have been achieved from the joint effect of (i) the parallel operations of the Ukrainian powersystem with the power system of Russia since August 20, 2001, where Russia regulates frequency based onexchange of power flows with Ukraine; (ii) relatively lower demand and consequently lower system loadwhich allows easier maintenance of adequate frequency; (iii) the further upgrade of load and frequencyregulation under the project which is expected to bring about a substantial improvement of the scheduledinter-state exchange of active power flows.
Achievement of objective (d) reduction of fuel costs by facilitating the economic dispatch of generatingunits:
The project sub-component of upgrading the regulation and management systems of the TPPs wascancelled mainly because of the lack of a friamework for pricing ancillary system services such asfrequency regulation. At project completion, this has contributed to somewhat lower estimates of 0.4%savings of fuel consumption in the UPS, (except nuclear fuel), compared with the original estimates of0.9% of such savings as a result of the upgrade of the communications, dispatch and system control.
4.2 Outputs by components:(a) Rehabilitation of hydropower plants on the Dnieper cascade;Cost: US$ 84.2 million at appraisal, US$ 74.3 million at completion.
The rehabilitation of the hydropower plants on the Dnieper cascade was satisfactory although in reducedscope. Out of 23 turbines and 37 generators, originally planned for rehabilitation, a total of 16 turbinesand generators were rehabilitated at project completion. Hydraulic auxiliary and electric equipment wasreplaced or rehabilitated at all eight HPPs on the Dnieper cascade. The rehabilitation works resulted inincreased efficiency, capacity, reliability, and safety, improved environmental performance and extendedlife of the power plants equipment. Oil leaks into the Dnieper River were eliminated from the rehabilitatedturbines.
In addition, the installation of a new control monitoring and protection system on 5 of the HPPs (Kiev,Kremenchug, Dniprodzerzhinsk Dnieper-l and Kahovka) has optimized the HPPs' output and has furtherenhanced their availability and lifetime due to the system's pre-waming capability in case of abnornaloperation parameters. The ongoing integration of the control, monitoring and protection systems -of thehydropower plants with the SCADA system of the National Dispatch Center will further optimize theperformance of the hydropower plants and will also enhance their load and frequency regulating role inresponse to the needs of the entire power system. Improved frequency regulation also allows to operate thenuclear power plants (NPP) at the right frequency and thus enhances their safety.
- 10-

(b) Installation of the dam safety monitoring system;Cost: US$ 2.5 million at appraisal, US$ 1.9 milhon at completion.
The installation of a computer-aided safety monitoring system at Kiev dam has been rated satisfactory inview of the complexity and umqueness of the component This has been the first such type of equipmentinstalled in Ukraine and the other CIS countries. The uniqueness of this pilot project has been furtherenhanced by the fact that the Kiev 50 km earth dyke is one of the longest in the world, critically situatedupstream at the head of the Dnieper cascade. The upgrade of the control instruments, the automation ofinformation processing, and the reading of the safety meters all have contributed to improving the safety inthe Kiev dam flood zone along with the safety of the downstream HPPs which are all located in denselypopulated and industrialized areas.
As a part of the dam safety works and in compliance with the Bank's new safeguards on dams, (i) a localinstitute has assessed the discharge capacity of the entire Dnieper cascade; (ii) flood assessmentinformation is regularly conveyed to DHE; (iii) inspections of the sediments in water storages in front of theHPPs have been carried out; (iv) drainage devices have been rehabilitated where needed; (v) the emergencyaction plans of the HPPs have been updated; (vi) new guidelines have been developed for the exploitation ofthe reservoirs of the Dnieper cascade; and (vii) the preparation of project designs for installing dam safetyequipment on the remaining HPPs on the Dnieper River is underway.
(c) Upgrade of communication, dispatch, and system control;Cost: US$55.2 million at appraisal, US$46.9 million at completion.
These activities were also rated satisfactory since the initially envisaged equipment was installed. Theintroduction of automated load and frequency control and the enhanced protection of the high voltage (HV)transmission network will improve the quality of electricity supply which will then enhance the system'scapacity to integrate with the neighboring power systems. System efficiency will be also enhanced by thereduced fuel consumption from improved dispatch. The installation of an uninterrupted power supplysystem, including batteries, charging appliances and diesel generators, enhanced the operations of thepower system by counteracting the impact of the emergency outages.
(i) The upgrade of the communications system of the UPS was successfully achieved by laying 1,160 km ofnew fiber optic comrnmunications lines and installing digital automatic telephone stations. The introductionof a modem digital communications system on the basis of fiber optic cable increased considerably the
speed and volume of the transmitted information among the subdivisions of the unified power system ofUkraine. The installation of digital automatic telephone stations at the regional dispatch centers increasedthe reliability of the power dispatch communications.
(ii) The upgrade of the frequency regulation, dispatch and system control has been implementedsatisfactorily by installing:
* an integrated package for automated load and frequency control which replaced outdated inefficientmanual control functions;
* a protection, management and control system at the Dniester HPP (702 MW) which enhancedmaneuverability and life of the plant equipment and integrated its regulating ability into the load andfrequency regulation of the entire power system of Ukraine; and
-1 1-

* relay protection devices on the high voltage transmission lines of the UPS main network, includingtransmission lines connected with the nuclear power plants. These devices further enhanced the reliabilityof the system, including the reliability of operations of the nuclear power plants (NPPs).
(d) Technical assistance.Cost: US$5 million at appraisal, US$7.0 million at completion.
Although this component has been completed in an overall satisfactory manner, the level of success ofseparate TA components varied.
The Swiss consulting company Stucky S.A. assisted in a satisfactory manner in the procurement of projectswitchgear equipment financed by the Swiss government with a grant to the Government of Ukraine,on-lent to DHE. (see note I at the end of this section)
The Norwegian Government financed a study on improved water management and hydropower generation.The study's recomnmendations were taken into account for the development of a new version of the Dniepercascade water reservoir exploitation rules.
A study on the automatic frequency regulation of the thennal power plants, financed by local funds, wascompleted as well. The Ministry of Fuel and Energy of Ukraine used the findings of the study as a basis toprepare guidelines for providing economic incentives to the thermal power plants involved in automaticfrequency regulation.
The local research institute Ukrhydroproekt together with DHE participated in developing the dam safetyconcept and preparing technical specifications for the procurement of project equipment.
The Canadian Agency for International Development (CIDA) financed technical assistance services for thefirst 3 years of the implementation of the project. The technical assistance services were provided byHydro Quebec Intemational (HQ]) in the areas of engineering, procurement and project management.These services initially suffered some difficulties related to the extremely limited number of experiencedspecialists available to work in a Russian and Ukrainian languages environment. However, after solvingprogressively this major recruitment problem, the situation notably improved after mid-1996 when moreexperienced consultants joined the project and at the same time a better interaction was reached with thebeneficiaries. The situation was completely normalized in 1998 when the beneficiaries hired HQI withfunds from the World Bank loan to provide further TA services.
DHE's needs for project management assistance declined during the second half of the project period as aresult of the reduction of the physical scope of some project components. In this regard, and in view of theimproved local financing, DHE opted for hiring local consultants with its own funds until the project'scompletion.
Audits by PriceWaterhouse and KPMG were also financed with technical assistance funds.
The project design was appropriate for achieving the project's objectives.
a/ technical aspects: adequate rehabilitation works and modem equipment were included in the projectscope to ensure the envisaged improvements in the power system. Project sites and specificturbine/generator units were selected for rehabilitation in view of ensuring maximum benefits from the
- 12 -
project works. Technical assistance was expected to compensate for the implementing agencies' lack ofprevious experience with Bank-financed projects.
b/ country needs and Bankpriorities: the project provided critical support to the power sector in line withthe government's priorities and the Bank's CAS.
cl sustainability: the project was designed under the enabling famework for sector reforms, envisaged bythe govemment. The benefits from improving the financial discipline in the power sector under the reformprocess, although delayed, trickled down to the project level and restored the financial stability of theproject implementing agencies beginning in 2000, which consequently ensured successful projectcompletion.
dl project monitoring and reporting: the project performance criteria and the loan covenants weredesigned to enable adequate measurement and reporting of project progress and to provide a leverage forcorrective actions, when needed. The performance indicators for minimizing frequency deviations,increasing operating capacity and turbine/generator efficiency were reasonably quantified to enable theassessment of project achievements during supervision and at completion. The logical framework tool didnot exist at project appraisal. Therefore project outcomes and outputs were outlined at completion on thebasis of analysis of the actual project results. The loan covenants related to auditing requirements, debtratio, and self financing ratio facilitated the monitoring of compliance with the Bank's fiduciaryresponsibilities and financial requirements for the project's agencies. The loan covenants related tocompliance with the power purchase agreement between DHE and NDC, and the contracts between NDCand its downstream clients were deleted from the respective project agreements with the Bank. Instead,during each following supervision mission, requirements for specific allocations of funds from the newlyestablished Energomarket (the wholesale electricity market) to DHE and NDC were agreed and closelymonitored thereafter. This change took place as a result of introducing a new mechanism of allocatingpayments for electricity transactions directly through Energomarket to all participants in the power sector,including DHE and NDC, which made irrelevant the earlier bilateral payment arrangements between DHEand NDC, and NDC and its clients.
Note 1: Under the conditions of a Grant Agreement between the Governments of Switzerland and Ukraine, the SwissGovernment extended a CHF 13.7 rnillion grant to Ukraine. The Grant Agreement also stipulated that the Ministry of Financeof Ukraine should then extend the Swiss grant proceeds as a loan to DHE. DHE has already used this loan to finance thesupply and installation of Swiss switchgear equipment under the project. DHE was supposed to repay the loan with interest tothe Mimstry of Finance. The Mmistry of Finance was expected then to use DIE's loan repayments for setting up fiunds tosupport environmentally friendly initiatives in the energy sector. However, DHE has repaid so far only a mmor portion of theloan due to earlier difficulties in payment collections. On November 14, 2002, the parties agreed on revised loan repaymentoptions.
4.3 Net Present Value/Economic rate of return:Economic returns upon project completion were sustainable, although lower than the ones at appraisal duein large part to the lower benefits as a result of reducing the project scope. The SAR showed an estimatedeconomic intemal rate of return (EIRR) for the total project at 18.1%. The re-estimated EIRR for the totalproject at completion was 13.6%. A separate EIRR was estimated for the Hydropower PlantsRehabilitation component: 17% at appraisal and 13% at completion, and for the System Control andCommunications Upgrade component: 22.7% at appraisal and 17.7% at completion.
- 13 -

Hydropower Plants Rehabilitation Component
The lower EIRR of the hydropower plants rehabilitation component at completion was mainly due to lowergains in capacity and energy as a result of the reduction of the project scope, the revised smaller impact ofimproved reliability and availability of the HPPs.
The reduction of the number of the turbines and generators, which were rehabilitated under the project,resulted in lower net benefits from additional energy output under the project. The original scope envisagedthe upgrade of 23 turbines and generators which represented some 33% of the total energy capability of thehydropower plants. Only 16 turbines and generators, were actually rehabilitated representing about 18% ofthe total energy capability. Had the original number of turbines and generators been rehabilitated, EIRRwould have increased by about 1%.
In addition, at completion, gains in capacity and energy from improved reliability and availability of theHPPs were lower than expected - at about 0.15 % per year. Had the larger appraisal estimate of 0.4%annual gains been materialized, EIRR would have increased by about 2%.
System Control and Communications component
The cancellation of the component for govemors of the thermal power plants led to reducing the benefit offuel savings from improved frequency regulation to 0.4% of the thermal fuel cost of the UPS, comparedwith the estimated 0.9% of such fuel saving at appraisal. This reduction in fuel savings was the mainreason for obtaining a lower EIRR at completion for the System Control and Communications Upgradecomponent, despite the effect of new benefits from fiber-optic-based communication services which werenot identified at appraisal.
Environmental benefits from reducing emissions from fossil fuels as a result of additional hydropowergeneration under the project were estimated at completion. This has led to higher EIRRs at completion asfollows: Total project: 17.7%, Hydropower Plants Rehabilitation component: 16.2%, and System Controland Communications Upgrade component: 23.7%.
The original and completion EIRR estimates were based on total project costs. The appraisal andcompletion analysis included the cost of the technical assistance and dam safety components withoutquantifying any relevant benefits.
4.4 Financial rate of rehirn:The financial intemal rate of return (FIRR) for DHE's hydropower plants rehabilitation component iscurrently estimated at 9.9% (in real terms) which is lower than the appraisal estimate of 13%.Nevertheless, the FIRR at completion still compares favorably with DHE's cost of capital, 8.5%, reflectingthe cost of borrowing under the project (1.5% on-lending interest rate, plus 7.0% estimated World Bankrate).
As in the case of the EIRR, the lower FIRR of the hydropower plants rehabilitation component atcompletion was also due to lower gains in capacity and energy which altogether resulted in a loweradditional average annual electricity output at completion - 270 GWh/yr, compared with the expected 567GWh/yr appraisal.
- 14-
Key assumptions for the analysis at appraisal and completion do not differ. The same cost-recoveryprinciple in tariff formation and the taxation rules relevant to enterprise income were followed at appraisaland completion. Savings from operation and maintenance costs did not differ significantly.
The FIRR is sensitive to changes in project cost, level of electricity output, and rate of inflation. Thesechanges can be absorbed under the present tariff mechanism based on cost recovery. Adding US$ 8.8million equivalent of the Swiss Grant to the project cost (See footnote 3 in Section 4.2), which is 10% oftotal DHE's project cost) would require at least an additional average tariff increase of 0.4% per yearduring the project life in order to ensure the project's financial sustainability. The estimated level of projectelectricity output can be reduced by no more than 1.7% within financial sustainability limits. Any largerreductions will have to be compensated by commensurate tariff increases. Any changes in rate of inflationcan be also absorbed by corresponding tariff increases.
No FIRR was calculated for NDC (Ukrenergo) at appraisal since the quantified benefits from fuel savingsas a result of more efficient economic dispatch did not accrue to the company, but to the entire powersector. Nevertheless, at completion, the financial viability of Ukrenergo was assessed on the basis of thecorresponding framework for the company's operations, reflected in the assumptions on tariffs for UE'sservices, and the electricity transmitted through UE's high voltage lines. The assumptions regardingtaxation, the expected inflation and exchange rate in subsequent years are the same as those used for DHE.The FIRR for UE was calculated at 15.9% on a current basis and 13.4% on a real basis which alsocompares favorably with UE's cost of capital, 8.5%, the same as the one for DHE. The UE's FIRR iscritically sensitive to even very minor to changes in the tariff for UE's services, and less sensitive tochanges in the amount of electricity transmitted through the UE's lines. (See section 10 for details on FIRRcalculations and sensitivities).
4.5 Institutional development impact:Background
As the first Bank investment operation in the energy sector of Ukraine, the project was successful. Itcomplemented the Bank's Programmatic Adjustment Loan (PAL) and the IMF's Extended Fund Facility(EFF) mainly in the area of improving cash collections in the power sector.
The original project design depended on progress of sector reforms, and coupled with the requirements forfinancial viability of the project implementing agencies, contributed to creating an initial basis for thepursuit of key elements of the current joint Bank/GoU strategy to improve institutions and governancethrough (i) design of a regulatory environment with a level playing field in the energy sector; (ii) creationand protection of property rights, and (iii) improvement of fiscal and financial discipline, publicaccountability and management of social and environmental risks.
- 15 -
Sector level impact
The project was designed and implemented in the context of the first steps to improve management of theelectricity sector through restructuring of the hydropower plants into a joint stock company andconsolidating the regional dispatch centers into a National Dispatch Center, followed by sector unbundling,establishment of a National Electricity Regulatory Commission and a Wholesale Electricity Market andprivatization of electricity distribution companies to strategic investors. The improved quality of electricitysupply and stability of the power system, achieved under the project, improved the safety of the NPPs andenhanced Ukraine's possibility for interconnection with neighboring power systems, thus moving thecountry closer to EU standards.
Since 2000, efficient government measures to improve collections and restructure arrears in the powermarket, in addition to all of the above institutional improvements, further contributed to increasing privateinterest in the sector and enhanced the financial stability of the project companies, a key factor forsuccessful project completion.
Company level impact
The project had a direct beneficial impact on improving corporate govemance of the implementing agenciesby (i) involving them in intemational project management, accounting and procurement practices, (ii)ensuring transfer of advanced technologies and know-how, and (iii) enhancing national key scientificresearch and industrial capacity. In addition, the project covered important social and environmentalaspects of the country's policy priorities by generating additional employrnent and reducing environmentalhazards along the Dnieper basin.
The project helped Dniprohydroenergo and Ukrenergo acquire experience in management andimplementation of projects financed by international financial institutions. The companies' accountingimproved by adopting standards closer to international practices.
Project procurement experience contributed to incorporating sound procurement principles of economy andefficiency, international competition, transparency, equity and fairness in the national procurementlegislation. Intemational competitive bidding enabled DHE and Ukrenergo to acquire at least costequipment which was best suited to the project needs and resulted in transfer of most advanced technology.
Transfer of project know-how was ensured by proper training of Ukrainian experts by suppliers. Thisenabled further transfer of knowledge. Inovative technological experience from the project was sharedwith the programs of two key engineering institutes in Ukraine which train high caliber experts for thehydropower industry.
In support of the joint Bank/GoU strategy to ensure employment-generating growth, 10,000 new jobs werecreated in the course of project implementation. In addition, amid the economic crisis, project design workspreserved the existence of research and design institutes.
5. Major Factors Affecting Implementation and Outcome
5. 1 Factors ou2tside the control of government or implementing agencyLengthy Parliamentary ratification procedures and an international economic crisis were the main factorsoutside the control of the Government, DHE and LJkrenergo which affected project implementation.
-16 -

Inclement weather and spring floods additionally constrained project works on occasion. In this context,close flank supervision and intensive work of local contractors mitigated adverse impacts on the project andfacilitated the completion of physical works under a tight schedule.
Parliamentary ratification, and respectively the date of effectiveness of the project Loan Agreement,approved by the Board of the Bank in April 1995, were delayed by more than a year. This postponedaccordingly the start of project implementation. Lengthy and repetitive internal government proceduresalso contributed to the delayed approval of the Loan Agreement by Parliament
Economic instability: Intensified economic problems in East Asia and Russia in 1998 destabilized debtservice dynamics in Ukraine by causing yields on Ukrainian T-bills, issued to foreign investors to finance alarge budget deficit, to rise to unsustainable levels. In this regard, the effort to pay off or restructure theT-bills debt alnost depleted the country's foreign exchange reserves and triggered a severe financial crisis,which then, among other adverse impacts, brought to a halt payments in the power sector and led to aninterruption of local project financing.
Force-Majeure: On occasion, winter blizzards led to icing and damage of power transmission lines andrelated equipment. The unforeseen need to repair these damages imposed an additional strain on the scarcelocal project funds and related project works. Longer than usual spring flood periods, when as manyturbine/generator units as possible have to operate, occasionally delayed project rehabilitation schedules
5 2 Factors generally subject to government control:The main factors subject to government control that critically affected the project were (i) overallinconsistent economic and reform policies, and (ii) poor payrnent discipline in the electricity sector.
Project implementation was also negatively affected by additional factors subject to government controlsuch as (i) varying profit tax and VAT regulations; (ii) burdensome customs and export-import rules; (iii)lack of clear regulations on contract liabilities; (iii) lack of national standards for new project equipmnentand (iv) the 1998 merger of the of the project implementing agency National Dispatch Center (NDC)together with the National Power Transmission Company into a new National Power Company Ukrenergowhich also encompassed the establishment of the Wholesale Electricity Market within the new company.
Economic policies and non-payments in the electricity sector: Adverse extemal economic developmentsonly aggravated persisting domestic economic imbalances caused by a relaxed fiscal stance and weakfinancial discipline, particularly in the power sector, in the context of the overall reversal in thegovernment's drive for economic reforms between 1996 and 2000. As non-paymnents, coupled with barterand promissory notes (veksels) transactions, continued during this period, scarce collections inEnergomarket were re-allocated primarily to ensure emergency purchase of fuel for the thermal powerplants during the winter, to the detriment of the needs for local project financing. Consequently, the overallproject implementation delay, relative to the initial schedule, rose to about 20 months in early 2000 andaffected primarily turbine/generator rehabilitation and installation of already imported equipment, as theseactivities entirely depended on sufficient local financing.
In 2000 the new reform-oriented government undertook active measures to irnprove electricity payments.The cash collections consequently rose from only 9% in April 2000 to 71% in May 2001 and 90% in May2002. The concerted govemment's effort to improve electricity payments provided grounds for extendingthe loan closing date for another 18 months which allowed for overall achievement of project objectives,although with delay and reduced scope of rehabilitation works.
- 17 -

Tax legislation: Introduction of an accruals form of accounting for tax calculations in 1997 resulted inmuch higher accounting profits and consequently higher profit tax obligations for the power sectorenterprises. This measure was enforced without consideration of the actually low revenues of the powercompanies due to non-payments for their output and lack of tax exemptions for their mandatorycontributions to various state funds, unrelated to the companies' activities. In addition, the availability oflocal project funds was further constrained by the temporary introduction of VAT (1998 and 2002) onimported equipment and electricity sales (1999) under the project.
Customs and import-export regulations: Lengthy and complex procedures for customs clearance ofproject equipment compressed subsequent installation and commissioning schedules. Import-exportregulations did not contain provisions for exporting earlier imported project equipment for repairs at thesupplier's site. This limited the possibility for repairs of project equipment under suppliers' contractguarantees.
Lack of clear stipulations in the national legislation regarding local liabilities of foreign contractors andsuppliers, engaging in project activities in Ukraine, hampered preparation of tenders.
Lack of national standards for project equipment which was new to the country required additional timefor testing and acceptance procedures for such equipment.
Restructuring of the National Dispatch Center and frequent changes of its management. The 1998merger of the original project implementing agency (the National Dispatch Center) with the NationalTransmission Company and the Energomarket (the wholesale electricity market) into a new entityUkrenergo seriously constrained the review of the financial performance of the resulting project entity. Thesituation improved since 2000 when Energomarket was separated from Ukrenergo. However, furtherre-organizations within the sector affected the project implementation schedule. Complex project equipmenthad to be contracted and delivered first to the project implementing agency Ukrenergo which then had tolease it for installation, commissioning and operation to other entities which have remained outsideUkrenergo's structure. In addition, throughout project implementation until 2000, changes of Ukrenergo'sdirectors (there have been four directors of Ukrenergo during project implementation) and staff involved inproject implementation adversely affected the project.
5 3 Factors generally subject to implementing agency control:Slow, burdensome and inaccurate intemal procurement review processes within both project agenciesthroughout the project, particularly at its beginning, along with seriously delayed project status reportingfrom UE during the first half of the project, compounded overall project implementation difficulties. Inaddition, some project works were constrained by UE's intemal difficulties to optimally scheduledisconnections of transmission lines to install project equipment.
Nevertheless, the strong ownership and drive for results of DHE's top management and staff at all powerplants throughout the entire project period, along with improved project ownership at UE since 1999, uponthe advent of the company's present management, have altogether compensated for the initial lack ofknowledge of Bank procedures, have mitigated negative external impacts and have ensured overallsuccessful completion of the project works.
- 18-
5.4 Costs andfinancing:Total project costs, including interest during construction (Il)C), were about US$141.5 million equivalent,or 66% of the appraised estimate of US$215.1 million. The difference of US$73.6 million equivalent inproject costs resulted from:
(i) the reduction of the number of rehabilitated turbine/generator units;(ii) the cancellation of the TPP governors sub-component,(iii) and generally lower than estimated local costs of the System Control component.
In addition, actual interest paid during construction was lower than estimated due to cancellation of unusedBank funds.
The above reductions of costs have outweighed increases in the cost of installing dam safety equipment perkm of dam, the cost of higher volume of local works related to a turbine/generator unit along with theincrease in contract values because of additional project quantities of fiber-optic cable, switchgear, systemcontrol and monitoring equipment and extended technical assistance.
The brunt of the project financing was based on a 17-year IBRD loan with a 5-year grace period and alevel repayment pattern. Seventy two percent -US$ 82 million- of the original amount of US$ 114 millionof the Bank loan was used. The Canadian Government more than doubled the funds for the project-relatedconsulting services which were extended to cover additional needs for such services as a result of thealmost one year delay in the start of project implementation due to late Parliamentary ratification of theLoan Agreement. The grant from the Swiss government in the amount of CBP13.7 million was used forthe supply and installation of high voltage (HW) equipment at the hydropower plants. The US$ 0.6 milliongrant from the Norwegian government was used for a study on the management of the reservoirs on theDnieper River.
6. Sustainability
6.1 Rationalefor sustainability rating:The benefits from the project are sustainable in view of the improvements in the power system's efficiency,stability and safety, the system's enhanced possibility for interconnections with the neighboring systems,achieved in the context of macro-economic improvements, coupled with positive trends in the overallbusiness environment, sector privatization, improving cash collections, debt restructuring and GoU'scontinuing commitment to further sector reforms with active support from donors and internationalfinancial institutions.
Continued adequate financial discipline in the sector remains a critical factor for ensuring projectsustainability. Current competition among thermal generators, their expected privatization and thecontinued process of divesting electricity distribution companies are expected to enhance overallperformance of the power sector through attracting new investments.
6.2 Transition arrangement to regular operations:DHE and UE will continue the work to (i) ensure proper financing of their operations; (ii) integratecompletely the project equipment in their systems; (iii) draft internal regulations for equipment operationsand maintenance and train relevant staff accordingly; (iv) ensure arrangements with suppliers for properservicing of the project equipment beyond the contract guarantee period, and (v) monitor key physical andfinancial performance indicators.
- 19 -
DHE and UE will also pursue improvements in their financial management and accounting practices basedon the auditors' recommendations received during project implementation. Both companies will continuetraining staff to improve preparation of their consolidated financial statements based on NationalAccounting Standards (NAS) format, will work on introducing proper registry and software systems alongwith streamlining their tax records and tax payments forecasts. (See details on transition arrangements inSection 10, paragraph V)
UE has estimated that the project impact on the entire power system will be fully felt in about 5-10 years inview of the large size of the system and the additional time needed to fully integrate the project equipmentinto overall system operations. The project rehabilitation improvements in terns of hydropower plants'efficiency, capacity and oil leakages have been already assessed, although it will take more time tocompletely materialize the benefits of better cascade operations as a result of improved system control andmonitoring.
Dniprohydroenergo and Ukrenergo are satisfied with the results achieved under the project, which inaddition to responding to the needs for upgrading dispatch, communications, and system control, alsocovered about 20% of the rehabilitation needs of the Dnieper cascade equipment. Further support to theremaining rehabilitation works at the hydropower plants will enhance the benefits to the power systemprovided (i) the Government's overall reform efforts remain on track; (ii) proper financial discipline in thesector is consistently maintained, and (iii) completion of the hydropower plants rehabilitation, and furtherdam safety improvement remain a Government's prionty.
7. Bank and Borrower Performance
Bank7.1 Lending:Identification
The Bank's performance in project identification was satisfactory. The project was identified in line withthe Bank's country assistance strategy which responded to a far-reaching reform program advanced by theGovemment in 1994-1996. The Bank carried out an Energy Sector Review to assist the Govermment incrafting its strategy for the energy sector. The Bank also agreed with the Govemment and otherinternational donors that power generation was an area in which the Bank's support could make a notabledifference. In this context, the Hydropower Rehabilitation and System Control Project was proposed inconsideration of the Bank's comparative advantage in the sector. An earlier Power Demand and SupplyOptions study of 1993 (report No.1 1561-UA) indicated that the rehabilitation of thermal and hydropowerplants was likely to result in the most significant net benefits for the power system. The priority ofreforming and upgrading the power sector was clearly outlined in the Government's strategy. The Bankprovided critical investment to the power industry along with donors' co-financing in a crucial period of thecountry's transition from a centrally planned to a market economy. At the same time, the Bank alsoinitiated the coordination of the donors' technical assistance to implement the Government's energy sectorstrategy, which was conducive to a proper enabling environment for this investment operation.
-20-
Preparation assistance
The Bank's performance in project preparation was satisfactory. The Ukrainian counterparts benefitedfrom early Bank involvement in the preparation process soon after project identification. The Bankundertook appropriate coordination with donors and Ukrainian counterparts. Feasibility studies werecarried out to prioritize the Government's hydropower rehabilitation programs and analyze therehabilitation needs of system-wide control and dispatch facilities. The studies were carried out byconsultants financed by trust funds of the governments of the Netherlands and Switzerland under thesupervision of the Ministry of Energy. The project investment activities were linked with specific policymeasures regarding tariffs and arrears in connection with the project entities.
Appraisal
The Bank's performance at appraisal was satisfactory. The Bank's appraisal team included experts with acomprehensive skill mix. The Government's and implementing agencies' commitment to the project wasanalyzed. Major risks related to pricing and non-payments were addressed through relevant conditions ofeffectiveness and loan covenants. The political risk of reversing sector reforms was also outlined.Capitalizing on the lesson learned from the first Bank project in Ukraine about the importance of technicalassistance (TA), technical assistance from the Govemments of Canada, Norway and Switzerland wasincorporated in the project scope to complement rehabilitation and water management activities andcompensate for the Borrower's insufficient experience with procurement and project management. Allrelevant safeguard policies were reviewed and discussed within the Bank and with the Government.
Continuity from identification through appraisal was good. Important project benefits were outlined andthe goal of achieving and preserving them served as a key incentive for the implementing agencies and theGovernment to pursue project sustainability.
The loan amount was commensurate with the project scope.
The performance indicators were designed to ensure adequate monitoring and reporting of projectimplementation progress. The institutional and commercial conditions of installing governors at the TPPscould have been assessed in greater detail in order to ensure that the system is ready for such investmnentand avoid cancellation of this sub-component. On the other hand, the project was brealing new grounds asthe first Bank investment operation in Ukraine.
7.2 Supervision.The Bank's performance during supervision was satisfactory in terms of (i) ensuring regularity ofsupervision missions and adequate skill-mix of Bank staff; (ii) providing timely responses to project issuesand involving management when called for by the complexity of the project matters; (iv) actively involvingthe field office in maintaining close working contacts with the local project counterparts; (v) applyingrealistic project performance ratings.
-21 -

The skill-mix and frequency of missions was aligned with the needs of implementation and responsivenessto the issues as they emerged. Close supervision and interaction with the Ukrainian counterparts facilitatedconstructive agreements on amending contracts, loan covenants and project scope in response to evolvingcompany needs, changes in sector structure and adverse external impacts. This approach prevented projectcancellation, and later allowed the extension of the loan closing date by 18 months to ultimately achieveproject objectives, although with delay and reduced physical scope of some components.
In addition, close and regular supervision enabled the Bank to take a pro-active stance and follow up oncases of serious noncompliance with Bank requirements, and even issue a threat to suspend the UE'scomponent when the company continuously failed to present a mid-term progress report and an updatedimplementation plan. The Bank's proactivity continued throughout the project through regularly followingup on key agreements on project financing, audits and completing project works under a realistic timeschedule.
Performance ratings were realistic and when required, "unsatisfactory" and "high risk" flags alerted sectorand country management about critical problems with project implementation and facilitated constructivediscussion to find solutions.
The Bank went to great lengths to ensure high quality advice to the Borrower. A world class dam safetyexpert assisted DHE in implementing current Bank safeguards on dam safety and solving difficult andunique dam safety issues related to some of the major and the longest dams in the world along the Dniepercascade.
The Bank developed a very good working relationship with the management and staff of the implementingagencies during supervision missions, site visits, and regular follow-up communications. A goodinteraction was also developed with the National Electricity Regulatory Commission, Energomarketadministration and the Ministry of Finance to ensure proper project financing. The Bank also maintainedclose contacts on project-related issues with the Ministry of Fuel and Energy despite frequent changes inthe Ministry's leadership.
The Bank should have been more proactive in guiding DHE about formally closing the process of selectionof project management consultants. Although the changes in project scope and the uncertaintiessurrounding the closing date of the project during the second half of 2000 may have made the intended TAinappropriate and unnecessary after the selection was initiated, the process could have been terminatedearlier.
7.3 Ot'erall Bankperformance:In view of the above assessments, overall Bank performance was satisfactory throughout the project cycle.
Borrower7.4 Preparation:
The Borrower's performance during project preparation is assessed as satisfactory. The Borrowerdemonstrated a high level of commitment and responsibility during project preparation since theGovernment assigned high priority to improving electricity supply as a main prerequisite for modemizingthe country's industry. Rehabilitation of the HPPs on Dnieper cascade was considered a key factor forimproving electricity supply in view of the important role of the HPPs in regulating frequency of the powersystem. In this context, there was close cooperation during preparation between the Government and the
- 22 -
Bank. The earlier work on preparing a comprehensive Government strategy for the energy sector ensuredthat the project was appropriate to Ukraine's needs.
7.5 Government implementation performance:
The Government's implementation performance is assessed as satisfactory since the project objectiveswere ultimately achieved with critical Government support, despite the deep financial crisis suffered duringproject implementation. The low level of payment collections in the power sector -the key constraint toproject implementation-- was overcome as a result of the Government's decisive measures aimed atfinancial recovery through elimination of barter and promissory note transactions, enforcing disconnectionsof delinquent electricity consumers along with other measures conducive to improving cash payments in thesector. In addition, the Government and the National Electricity Regulatory Commission adopted specificmeasures to ensure sufficient allocation of local funds to the project companies through Energomarket'sfunds distribution mechanism. The Government's effort to enhance economic growth and continue energyreforms within a broad program to improve institutions and govemance in the economy, with support fromthe Bank and donors, provided a framework which facilitated satisfactory completion of the project works.
7.6 Implementing Agency:The performance of the implementing agencies is rated as satisfactory because they managed to completethe revised scope of project works agreed with the Bank within the extended loan closing date.
Both DBE and UE suffered the adverse influence of a deep financial crisis in the sector which paralyzedimplementation of the DHE's component for more than six months and delayed for more than 20 monthsthe installation of some equipment under UE's component.
Despite the extemal difficulties, DHE demonstrated strong commitment and ownership with respect to theproject throughout the entire preparation and implementation periods. The company did its best to ensurethat all possible actions within the scope of its capacity and authority were undertaken to enable projectcompletion, including provision of adequate management and staffing. Interaction with Bank andGovernment counterparts on project issues was active and contributed to finding solutions to problems.Project reporting and audit compliance were adequate except for delays at the initial stage due to lack ofknowledge of Bank procedures.
NDC/UE's audits suffered delays due to irreconcilable discrepancies of accounts caused by the temporaryinclusion of Energomarket in the structure of the project agency. . UE's management was less persistent atthe early stage of the project in exploring all possible means to mitigate the impact of the external financialcrisis on project implementation.
UE's project staff had the necessary skills and experience which contributed to the final successful projectcompletion.
- 23 -
DHE and UE managed to comply with the agreed self financing ratio only after 2000 as a result of theimproved cash collections and local financing for the project. The companies did not incur any other majordebts except for the borrowing from the World Bank. This ensured compliance with the relevant projectcovenant not to incur debt unless a reasonable forecast of the beneficiaries' revenues and expendituresindicates an agreed debt service ratio throughout the term of the debt.
Both companies, and especially Dniprohydroenergo, had certain problems in conducting procurementefficiently throughout the project, particularly during the early stages of project implementation. In anumber of cases there were significant delays in concluding procurement due to protracted or improperevaluation of bids, vagueness in technical specifications, etc. Subsequently, these deficiencies werecorrected -- with significant involvement of Bank staff, - and did not result in violation of procurementpolicies and procedures, except the case of not properly closing the consultant selection process at DHE.These deficiencies did adversely impact on the project schedule. Despite this setback, DHE managementand current UE management did not spare efforts to coordinate the complex project works in a largelysuccessful manner.
7.7 Overall Borrowerperformance:In view of the above assessments, overall performance of the Borrower was satisfactory.
8. Lessons Learned
Assessment of the Government's long term commitment and ability to carry out reforms is a key aspect ofanalyzing overall project sustainability. It is important to have a reform-oriented government not onlyduring project preparation, but throughout the entire project cycle as well. The experience in Ukraine hasshown that a reversal of the initially progressive course of economic reforns has adversely affected theimplementation of the Bank's investment project
Ensuring the enabling environment for a large scope investment operation is a critical success factorforthe operation: The experience in Ukraine has shown that initial government commitment to provide suchan environment through comprehensive reforms requires sustained support from the international financialinstitutions and bilateral donors throughout the entire reform process. In this context, cross-sectoradjustment operations have led to most tangible results on the ground. Although during project preparationthe Government indicated that improving financial discipline in the energy sector was a priority of itsreform program, and the project itself generated specific pressure on the Government to deliver in thisregard, cash collections reached their highest levels only when included as specific targets in the IMF'sExtended Fund Facility Program and the Bank's Programmatic Adjustment Loan.
Donor coordination and "distribution of labor" in project finance has allowed to exploit the comparativeadvantages of each of the donors' contributions. Thus, the Bank's experience in power sector rehabilitationhas been complemented by Canada's support with technical assistance in project management, Norway'ssupport in reservoir management and Switzerland's supply and installation of switchgear equipment Thegovernments of the Netherlands and Switzerland have generously contributed to the preparation of theproject feasibility studies. The donors' working group on energy sector reforrns has provided valuableassistance to the Government's sector reform efforts.
-24-

Very good technical skills, strong project ownership and commitment to results on the side of the projectbeneficiaries have been critical success factors. Such ownership and commitment have partially mitigatedthe adverse impacts of the financial crisis, the initial lack of experience with the Bank's project cycle, andhave provided the Bank with grounds for extending the closing date to ensure successful projectcompletion.
Flexibility and adaptation to changes in the project environment helped the Bank and the Borrowerovercome adverse external impacts and achieve the project development objectives. The Bank's flexibleapproach to the Borrower's request to reasonably reduce the physical scope of some project components,adjust loan covenants, amend contracts and extend the loan closing date in response to changes in thepower sector and the entire economy have ultimately preserved the project benefits and ensuredachievement of the development objectives.
Conclusions:
(i) The first phase of the rehabilitation of the hydropower plants of the Dnieper cascade and the upgrade ofthe system control of the UPS have been successfully completed.
(ii) The installation of a computerized dam monitoring system at Kiev HPP, at the head of the Dniepercascade, enhanced the safety of the entire cascade which is situated along densely populated andindustrialized areas. The installation of new ecologically safe turbines with adjustable blades eliminatedleakages of lubricating oil from these turbines into the Dnieper River, thus contributing to overallimprovement of the quality of the river water shared for multiple purposes by numerous household, urban,industrial and agricultural users along the Dnieper basin.
(iii) The turbine/generator rehabilitation led to improved efficiency and increased capacity of thehydropower plants. This, coupled with the installation of system control and monitoring equipment andspecialized TA, improved hydropower plants maneuverability, management of the Dnieper reservoirs andoverall power system regulation.
(iv) Improved load and frequency control enhanced the quality of electricity supply. This improved theUPS capacity for interconnections with neighboring power systems and brought the UPS performnancecloser to relevant EU standards.
(v) Important social issues were addressed by opening new job opportunities during project implementation.Know-how was transferred from foreign suppliers to project beneficiaries. Local research and developmentcapacity was enhanced during project preparation and implementation.
(vi) The overall project and its two main components, hydropower rehabilitation and system controlupgrade, are sustainable. In addition, benefits from improved safety and environmental performance of thepower system significantly enhance project sustainability.
(vii) Completion of the remaining hydropower rehabilitation works will bring further benefits to the powersystem provided the Government's overall reform efforts remain on track and adequate financial disciplineis maintained in the power sector.
- 25 -
9. Partner Comments
(a) Borrower/implementing agency:
Comments from the Borrower, implementing agencies and donors were as follows:
MINISTRY OF ECONOMY AND EUROPEAN INTEGRATION OF UIKRAINE
12/2 M. Hrushevskyi St, Kyiv 01008 UkraineTel: 293-93-94, fax: 226-31-81; www.me.gov.ua E-mail: [email protected]
Mr. Luca Barbone December 5,2002Country DirectorUkraine, Belarus and MoldovaEurope and Central Asia RegionThe World Bank
Dear Mr. Barbone:
The Ministry of Economy and European Integration of Ukraine has examined the ImplementationCompletion Report (ICR) for the Hydropower Rehabilitation and System Control Project prepared by theWorld Bank and approves it in the whole.
As evidenced by the materials presented in the report, the result of project implementation isassessed as satisfactory. The goals envisaged by the project have been achieved, although with some delaysand reduced physical volume under some components.
Under conditions of the reduced amnount of work, an additional total capacity of 88.1 MW wasachieved under the project as compared to 130 MW, which was planned with the initial full amount ofwork.
On completion of the project, the economic gains proved to be stable, although smaller thanplanned at the appraisal stage due to reduced gains as a result of the decreased project volume. Based onthe results of project implementation, the lower than calculated rate of return under the hydropower stationrehabilitation component is explained by the lesser volumes of increased capacities and additionallygenerated electricity due to reduced amounts of work under the project, lesser gains from the increasedreliability and available capacities of hydropower stations, and by the revision of the system load forecast.
As a result of project implementation, the efficiency of the rehabilitated turbines of the Kyiv,Kakhovka and DniproHES-1 hydropower stations has increased by 4.3%, 4.1% and 4.2% and constitutes91.8%, 83% and 92.2%, respectively.
The total expenditures under the project, including the percentage paid during the constructionperiod, amounted to nearly $141.5 million (or 66% of the calculated sum that constituted $215.1 million).
The difference totaling $73.6 million was the result of:
- 26 -
a) reduced number of rehabilitated turbines/generators;b) cancellation of the subcomponent of installing governors on thermal power plants, andc) lower than planned local expenditures.
In addition, the actual percentage paid during the construction period was lower than planned dueto the withdrawal of undisbursed funds of the Bank. As regards financing, 72% of the initial sum of theWorld Bank loan was used and $82 million was disbursed out of $114 million.
The report further notes that the proper financial discipline to be maintained in the future continuesto be an extremely important factor in ensuring the viability of the project results. The existing competitionamong the thermal power enterprises, their expected privatization, and continued privatization ofoblenergos are to facilitate the general improvement of the power sector performance by attractingadditional investments to it.
The financial rate of return and internal economic rate of return in rehabilitating theDniprohidroenergo hydropower station (up to 2031) and the financial rate of return of Ukrenergo (up to2020) are deternined in the annexes to the report.
In summing up the material presented in the report, it should be noted that at the appraisal stage,the matunty of the project loan was 17 years, including the 1995 to 2002 period during which the projectwas implemented, with the loan and interest on it to be repaid from 2000 to 2012.
Therefore, it would be appropriate to supplement the report with a mechanism of loan and interestrepayment to the World Bank providing for more precise terms and schedules of loan redemption. In doingso, the actual fulfillment of the schedule of loan and interest repayment should be shown as of December 1,2002, as well as the expected loan redemption for 2003. Problems should also be outlined that arise, as theWorld Bank sees them, in connection with the loan repayment. In our view, concrete reasons for thegeneral decrease in the amount of project works should also be noted in the report.
In addition, we would like to stress that given the results achieved and taking into account theshortcomings that occurred during the carrying out of the above-referenced project, the implementation ofthe second phase of the project associated with the rehabilitation of hydropower stations will bring furtherbenefits to Ukraine's power system.
Sincerely,
(signature)
L. MusinaTranslated by V Ivchenko Deputy State Secretary
Response to the recommendations from the Ministry of Economy and European Integration ofUkraine:
Comment 1: Supplement the report with a mechanism of loan and interest repayment to the WorldBank providing for more precise terms and schedules of loan redemption. In doing so, the actualfulfillment of the schedule of loan and interest repayment should be shown as of December 1, 2002, aswell as the expected loan redemption for 2003.
Attached below are Amortization Schedule and Statement of Account for Loan 38650 UA for theHydropower Rehabilitation and System Control Project. The interest rate is applied to the principal
- 27-
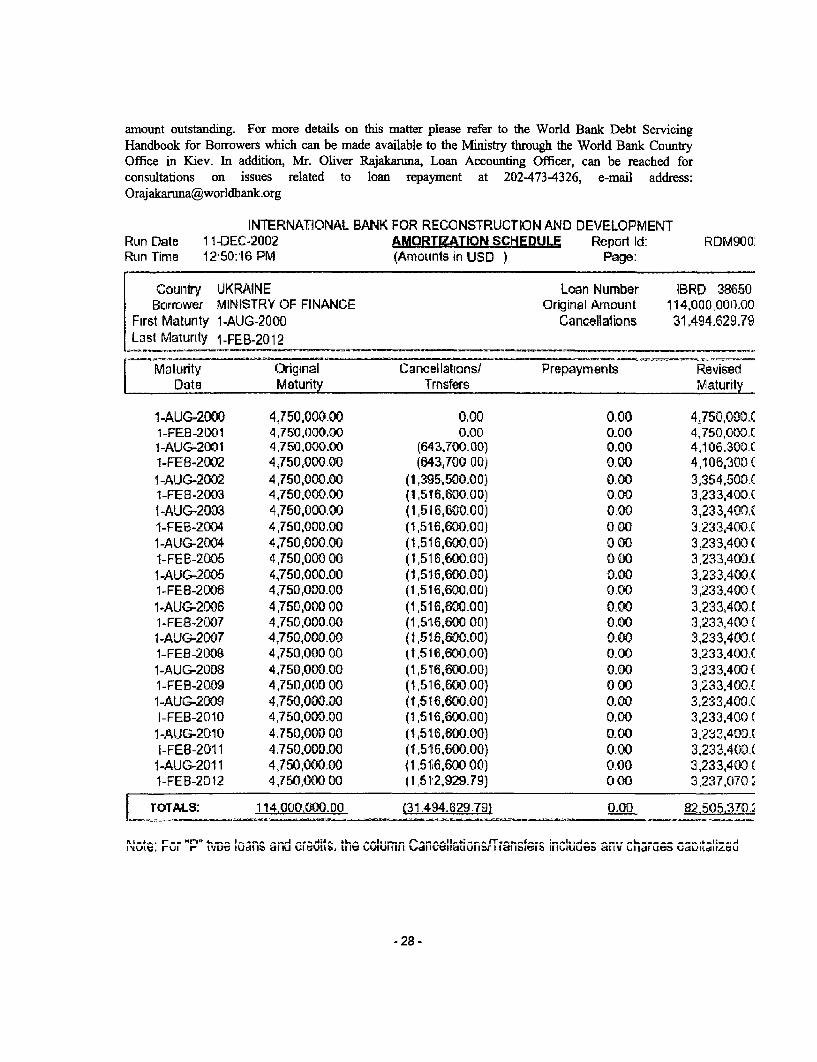
amount outstanding. For more details on this matter please refer to the World Bank Debt ServicingHandbook for Borrowers which can be made available to the Ministry through the World Bank CountryOffice in Kiev. In addition, Mr. Oliver Rajakaruna, Loan Accounting Officer, can be reached forconsultations on issues related to loan repayment at 202473-4326, e-mail address:[email protected]
INTERNATIONAL BANK FOR RECONSTRUCTION AND DEVELOPMENTRun Date 11-DEC-2002 AMORTIATION SCHEDULE Report Id: RDM900Rtun Tinle 12 50:16 PM (AmLounts in USC } Page:
Country UKRAINE Loan Number IBRD 38650Borrower MINISTRY OF FINANCE Original Amount 1114,000,000.00
First Matunty 1-AUG-2000 Cancellatlions 31,494.629.79Last Malurity 1-FEB-2012
Maturity Original Cancellations/ Prepayments RevisedDate Maturity Tmsfers Maturity
1-AUG-2000 4,750,000.00 0.00 0.00 4,750,00.C1-FEB-2001 4,750,000.00 0.00 0.00 4,750,000.C1-AUG-2001 4,750.000.00 (643,700.00) 0.00 4,106.300.C1-FEB-2002 4,750,000.00 (643,700 00) 0.00 4,1061300 (1-AUG-2002 4,750,000.00 (1,395,500.00) 0.00 3,354,500.(1-FES-2003 4,750,000.00 (1,516,60000) 0.00 3,233,4W.CI-AUG-2003 4,750,000.00 (1,516,600.00) 0.00 3,233,400.(1-FEB-2004 4,750,000.00 (1,516,600.001 0.00 3,233,400.(1-AUG-2004 4,750,000.00 (1,516,60000) 0 00 3,233,400 (1-FEB-2005 4,750,000 00 (1,516,600.00) 0 00 3,233,400.(1-AUG-2005 4,750,000°00 (1,516,600.00) 0.00 3,233,400.(1-FEB-2006 4,750,000.00 (1,516,600m) 0.00 3,233,400 (1-AUG-2306 4,750,000 00 (1,516,600.00) 0.00 3,233,400X1-FEB-2007 4,750,000.00 (1,51.6,600 00) 0.00 3,233,400 (1-AUG-2W07 4,750,000.00 (1,51.6,600.00) 0.00 3,233,400.(1-FEB-2008 4,750,000-00 (1,516,600.00) 0.00 3,233,400.(1-AUG-2008 4,750,000.00 (1,5T6600=00) 0.00 3,233,400 C1-FEB-2099 4,750,000 00 (1,516,600.00) 0 00 3,233,400.(1-AUG-2009 4,750,000.00 (1,516,600.00) 0.00 3,233,400.(I-FEB-2010 4,750,000.00 (1,516,600.00) 0.00 3,233,400 CI-AUG-2D10 4,750,00000 (1,516,600.00) 0,00 3,233,400.1-FEB-2011 4,750,000.00 (1,516,600.00) 0.00 3,233.400.(1-AUG-2011 4,750,000.00 (1,51i6,600 00) 0.00 3,233,400 C1-FEB-2012 4,750,000 00 (1,512,929.79) 0 00 3,237,C070C
TOTALS: 114,0U00,0000 (31.494.629.79) 0.00 82,505X,3m.
i'YUtt. rut r-' 1vue IUdlbI ,tu IItUILa triI tiigI dI LIIUIl I IOdfI altI Ili4UUD dInv LiIdrUU ;dtl.tU
- 28-
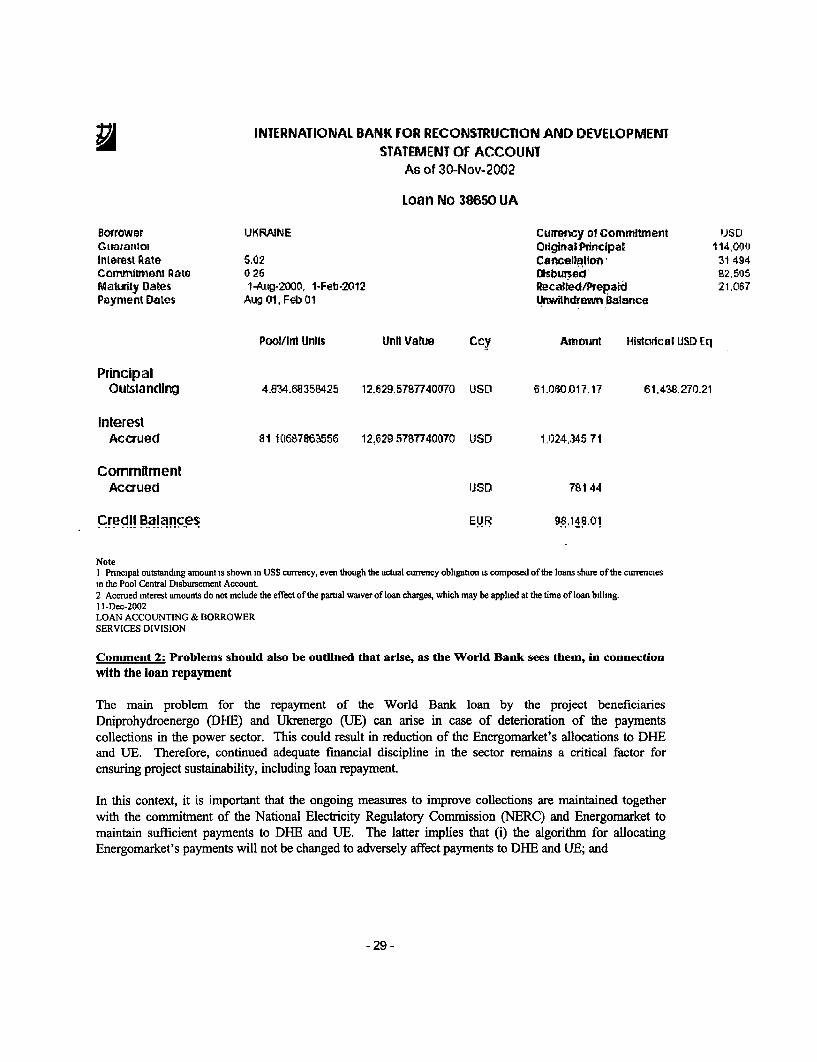
INTERNATIONAL BANK FOR RECONSTRUCTION AND DEVELOPMENTSTATEMENT OF ACCOUNT
As of 30-Nov-2002
Loan No 38650 UA
Borrower UKRAINE Cuirency of Commiment iUSOGuarantol Oignmal Principat 1140001(Interest Rate S.02 Cancellation 31 494Commitmone Rate 0 26 sbursed' 825135Matuity Dates 1-Aug-2000, 1-Feb-2012 Recalted/Prepatd 21.067Paynmenr Dates Aug 01, Feb 01 Unwithctrawn Balance
Pool/Ird Units Unit Vatue Ccy Amount Histokcal USD Eq
PrincipalOutstanding 4.824.68358425 12,629.5787740070 USD 61.0S0.017.17 61.438,270.21
InterestAccued 81 101687863556 12,629 5787740070 IJSD 1,024,345 71
CommitmentAccrued IJSD 781 44
Credit Balances EUR 98.148.01
Note1 Pnncipal outstanding amount is shown in US$ currency, even though the actual currency obligation is composed of the loans share of the currenciesin the Pool Central Disbursement Account2 Accrued interest amounts do not include the effect of the partial waiver of loan charges, which may be apphed at the time of loan bllimg.I I-Dec-2002LOAN ACCOUNTING & BORROWERSERVICES DIVISION
Comment 2: Problems should also be outlined that arise, as the World Bank sees them, in connectionwith the loan repayment
The main problem for the repayment of the World Bank loan by the project beneficiariesDniprohydroenergo (DHE) and Ukrenergo (UE) can arise in case of deterioration of the paymentscollections in the power sector. This could result in reduction of the Energomarket's allocations to DHEand UE. Therefore, continued adequate financial discipline in the sector remains a critical factor forensuring project sustainability, including loan repayment.
In this context, it is important that the ongoing measures to improve collections are maintained togetherwith the commitment of the National Electricity Regulatory Commission (NERC) and Energomarket tomaintain sufficient payments to DHE and UE. The latter implies that (i) the algorithm for allocatingEnergomarket's payments will not be changed to adversely affect payments to DHE and UE; and
-29-
(ii) if factors outside the control of Energomarket's participants or National Electricity RegulatoryCommission- such as hydrology or system demand - were to change in a way which would result inreduced payments to DHE and UE, the payments would be adjusted to meet project needs either throughincrease in DHE/UE tariffs, or through the allocation algorithm.
Comment 3: Concrete reasons for the general decrease in the amount of project works should also benoted in the report.
The original project works were reduced mainly in terms of (i) reducing the number of the turbines andgenerators subject to rehabilitation and (ii) canceling a sub-component for upgrading the governors of thegeneration units of the thermal power plants.
Reduction of rehabilitated turbines and generators
Non-payments in the energy sector continued from 1996 until 2000. In addition, scarce collections inEnergomarket were re-allocated primarily to ensure emergency purchase of fuel for the thermal powerplants during the winter, to the detriment of the needs for local project financing. Such practices led toDniprohydroenergo and Ukrenergo not receiving sufficient payments from the Energomarket. Thereforethe project beneficiaries, and Dniprohydroenergo in particular, were unable to pay for critical project worksperformed by local contractors. Thus, Turboatom, a major local contractor for the turbine and generatorrehabilitation under the project, discontinued rehabilitation works from November 1999 until May 2000.Overall project implementation delay, relative to the initial schedule rose to 20 months in early 2000. Inthis context the Bank and DHE agreed to reduce local financing requirements by reducing the number ofturbines and generators subject to rehabilitation. Thus out of 23 turbines and 37 generators, originallyplanned for rehabilitation, a total of 16 turbines and generators were rehabilitated at project completion.
Cancellation of a sub-component for upgrading the governors of the generation units of thethermal power plants
The Ukrenergo's component for upgrade of frequency regulation, dispatch and system control includedoriginally a sub-component for upgrading the governors of the generation units of the thermal power plants.This activity was designed to improve the capability of the power system to regulate frequency. However,this sub-component was canceled due to (i) lack of financial incentives for the thermal plants to participatein load frequency regulation, since payments for this service were not recognized by the electricity market;(ii) the requirement for the plants to finance local costs associated with installing new governors, while theplants lacked such funds due to non-payments in the electricity market; (iii) the status of the plants asindependent legal entities, which hampered the management of this project sub-component outside thestructure of the implementing agency Ukrenergo; (iv) the unique water technology of the governors, notsupported by manufacturers outside the former Soviet Union; (v) physical ware-and-tear of the thermalgenerators and the auxiliary TPP equipment together with outdated boiler automation called for muchlarger investments than expected.
- 30-
(Unofficial translation)
MINISTRY OF FUEL AND ENERGY OF UKRAINE30 Khreshchatik str., Kyiv, 01601
tel. 221 4333, fax: 462 0561, E-mail: [email protected]
Mr. Luca BarboneDirectorUkraine, Belarus and MoldovaEurope and Central Asia RegionWorld Bank
RE: Comments on the Draft Implementation Completion Report -Hydropower Rehabilitation and System Control Project
Dear Mr. Barbone,
Thank you very much for the attention the World Bank pays to the development of energy sector. Ihope that you share my opinion that the successful implementation of the joint Hydropower Rehabilitationand System Control Project is a bright evidence of our fruitful cooperation.
We fully recognize the valuable efforts the Bank made to support the project and meet the outlinedobjectives in a timely manner, despite of serious obstacles during the whole period of project'simplementation. We would like to thank you in person, Mr. Barbone, as well as the Bank's project team forcooperation and constructive work.
Implementation of this project was an important stage for Ukraine in power sector development.And not only since this project was the first large-scale investment project at the sector, while the first stepis usually uncertain and doubtful. But since the successful completion of the project confirmed thatUkraine is able to perform as a reliable partner in meeting its intemational commitments, and has apowerful economical, technical and highly-qualified staff capacity for implementation economic reforms,outlined by the Govemment for improving the social status of Ukrainian citizens.
We are thankful to the Bank's specialists for making the detailed analysis of projectimplementation outcomes and clear forming of positive and negative aspects of project institutions activity.We are very pleased to know that the Report's conclusions demonstrate the significant positive impact ofthe project to the enhancement of energy system performance and improvement of technical andenvironmental indicators of hydropower plants.
The Ministry of Fuel and Energy does not have comments on the Report in general. However, we could notfully agree on some sections, where the Bank's conclusions are based on the power sector developmentindicators, taken from the Stone & Webster's report (pages 18, 62, 72, 75). Taking into consideration thatthe above work was not presented at the Ministry of Fuel and Energy and forecast indicators used there forplanning are completely different to the indicators, on which the main forecast calculations of the Ministryare based, their use needs additional discussion and agreement.
- 31 -

In addition, page 19 mentions that key assumptions for the analysis at assessment and completionstages do not differ at the part of taxation rules. Meanwhile, during the preparation of SAR, the existinglegislation of Ukraine envisaged preferential taxation for goods/services, funded by international loans,provided under ratified intemational agreements. As you are aware of, during the project implementationthese preferences were canceled. Thus, we propose in para 2 after the words " and the taxation rules" addthe words "in the part of the taxation of enterprises income."
Let me thank once again for the opportunity to review the draft ICR. I would also like to expressmy hopes that the reached outcomes of the first stage of the Dnieper cascade HPP rehabilitation, which is acomponent of this project, is a significant background for continuing of our common cooperation incompleting the rehabilitation of the rest of Dnieper hydro power plants.
Sincerely,
Minister (signed) S. Yemilov
Response to the recommendations from the Ministry of Fuel and Energy of UJkraine
The Ministry has indicated that the forecast indicators for system planning, used for the project economicanalysis in the ICR need additional discussion and agreement. The ICR analysis is based on the findings ofthe Stone & Webster (S&W) study of 2001, commissioned by the European Bank for Reconstruction andDevelopment. This is the most recent least-cost generation expansion plan developed in accordance withstandards acceptable to the Bank. The least cost generation expansion plan was used to determine theeconomic benefits from the additional hydropower generation capacity obtained as a result of theturbine/generator rehabilitation under the project
It is very important to note that according to the ICR economic analysis the benefits from this additionalhydro-generation capacity represent only 21% of the total value of the benefits from the hydropower plantsrehabilitation and do not have a critical importance for ensuring the overall economic viability of therehabilitation works. Far more important are the benefits from additional energy generated with the projectwhich contribute to 71% of the total value of the rehabilitation benefits. The remaining 8% of thehydropower rehabilitation benefits are attributed to O&M savings. (See table 3 on Summary results of theeconomic analysis of the HPPs rehabilitation in Annex 3 of the ICR.)
The sensitivity analysis in the ICR has also concluded that even without capacity benefits the outcome ofthe hydropower rehabilitation remains viable -with a positive NPV and EIRR higher than the 10% discountrate. (See tables 7 and 7.1 on Sensitivity analysis in Annex 3 of the ICR.).
With the current lower load growth used in the S&W study, the S&W study indicated that the existingsystem would be technically sufficient to meet peak demand until 2007 and that rehabilitation of existingthermal power plants was an optimal way to help meet peak demand until 2010. In this context, theadditional hydro capacity as a result of the project was conservatively assigned value for operationsstarting in 2012 when additional peaking capacity would probably be required.
The comments from the Ministry of Fuel and Energy suggest that in the Ministry's view additional peakingcapacity is needed much earlier than 2012. Dniprohydroenergo has indicated the need of additional
- 32 -

operational peaking capacity even at present. In this context, and in view of the real constraints of thethermal power plants to currently provide sufficient peaking capacity because of equipment wear and tearand lack of good quality fuel, the finalized ICR indicates that the additional hydro capacity from the projectcould be assigned value for operations earlier in the project life, assuming also somewhat higher load aswell. Under such a more opfimistic scenario, similar to the one in the SAR, EIRR could increase by aboutanother 1.5%. (See section on SAR comparison in detail, point 3 on Load forecast in Annex 3 of the ICR).
(Unofficial translation)
MINISTRY OF FINANCE OF UKRAINE
12/2 Hrushevsky str., Kyiv, 01008, Ukrainetel. 293 7466, fax: 293 8243, E-mail: [email protected]
December 11, 2001# 074-321/015/581
World Bank Country Office in Ukraine
RE:: Ukraine - Hydropower Rehabilitation and System Control Project -Draft Implementation Completion Report
The Ministry of Finance of Ukraine reviewed the draft Implementation Completion Report forthe Hydropower Rehabilitation and System Control Project and informs that it has no comments andproposals for the above-mentioned draft report.
Head of State Debts Department (signed) V.Vysotsky
- 33 -

DNIPROHYDROENERGO
To World BankWashington D.C.USA
Atten. Mr. N.NikolovSubject "Partners' remarks"
Section 9 "Partners' remarks" World Bank "Implementation Completion Report"
DniproHydroEnergo and its Ukrainian partners (manufacturers of main water-power, hydraulic-mechanicaland transforming equipment, designing, mounting and commissioning enterprises) highly estimate theprocess and the results of implementing stage 1 of Dnipro Cascade HPPs reconstruction, the absolutenecessity of which was proved cooperatively by the World Bank and Ukrainian specialists. The grounds arethe following:
Dnipro Cascade HPPs play a special role in Ukrainian economics, providing daily load curve peak zonecovering, generating the cheapest and ecologically clean energy. Being highly maneuverable, they solveemergency reserve of frequency regulation issue and power flows issue in the power system of Ukraine,which is very important when we take into account the existing structure of generating capacities.
Dnipro reservoirs of multiple utilization solve such important issues as discharges regulation during floodperiods, drinking and industrial water provision, transportation, dry southem country regions watering, fishindustry problems and others.
The overall length of Dnipro river HPPs' hydraulic constructions is more than 100 km. On Cascade HPPssafety depend about 30 million persons lives.
Allowing for all these factors, HPPs safety, reliability and operational efficiency provision is one of themost important and priority targets. This is especially important when we take into account the fact thatHPPs operation time is: 30 years for the youngest one HPP, Kaniv HPP, and Dnipro HPP constructed 70years ago has been in operation already for 50 years after its rebuilding. HPPs equipment is physicallywom-out and morally outaged, requires reconstruction or replacement with simultaneous productiontechnology upgrade.
Thus, successfully implemented 1st stage of Dnipro river HPPs rehabilitation is a technically indispensableand economically reasonable process of renovating mobile generating hydropower capacities of Ukraine.
The scope of the 1st stage of the project included a complex of works (including 16 units turbines andgenerators reconstruction) at Kyiv HPP (about 50% of equipment), at Dnipro-1 HPP (about 70% ofequipment) and at Kakhovka BPP (about 20% of equipment). At other company HPPs in the process of the1st stage of project implementation there has been performed a huge amount of works such asreconstruction of excitation, governing, control, monitoring and diagnostic systems and substationequipment. Besides that there have been performed unique works on 2 blocks (8 hydrounits) of Kyiv HPPfor transition to generator voltage 6,3 kV, and new power transformers have been installed.Computer-aided safety monitoring system has been introduced at Kyiv HPP.
- 34 -

All this allowed getting additional output and peak capacity, HPPs operational reliability increase,operational expenses decrease, ecological situation in Dnipro river improvement by eliminating turbine oilleakages into the water on reconstructed units, personnel working conditions qualitative change, a complexof social problems solving, first of all, by maintaining hydro-turbines and hydro-generators manufacturingat the two biggest Ukrainian plants, and also by providing working places for design institutes,construction, erection and commissioning enterprises.
It is evident that the 1st stage of project implementation became possible thanks to the World Bankfinancial participation and comprehensive active professional assistance provided by Project coordinatorsand Bank specialists. To our opinion, it was this cooperation that allowed us successful implementation ofthe I st stage of such a difficult and unique project.
DniproHydroEnergo would like to express its gratitude to the World Bank for active participation insolving such an important state issue. We are thankful for effective cooperation, mutual understanding tothe World Bank Mission participants who provided direct assistance in technical and administrative issuesand in very difficult financing problems solution.
DniproHydroEnergo and all its Ukrainian counterparts who participated in this important project highlyestimate the results that were reached not only from the point if view of achieved additional economical,technical and social benefits, but also as a unique possibility of successful application of rules andstandards of intemational technical, commercial, financial and trade cooperation with internationalfinancial organizations and equipment manufacturers. Gained experience of performing a complexreconstruction simultaneously at eight operating HPPs with the condition of all industrial and economicalmdicators fulfillment engaging many Ukrainian and foreign firms is in a way DniproHydroEnergo's"know-how" that will be applied during the next stage of Dnipro river HPPs rehabilitation.
Economical effectiveness analysis performed after project stage 1 completion confirms its effectiveness.Allowing for ecological effect connected with computer-aided safety monitoring system commissioning atKyiv HPP and Dnipro river water quality improvement, this project significance becomes even moreimportant for the whole sector and state in general.
Taking the above into account and also the fact that the whole project effectiveness (Ukrhydroprojectcalculations) significantly exceeds I st stage effectiveness (due to majority of hydrounits rehabilitation andgetting additional energy and capacity output), it is necessary to solve as soon as possible the issue ofDnipro cascade HPPs rehabilitation continuation. The company hopes for further fruitful cooperation withthe World Bank and for its participation in the 2nd stage of project implementation.
With gratefulness, SI. Potashnik, Chairman of the Board - General Director
of the X
- 35 -
UKRENIERGO
Miuir.epcj o DanJDHa Ta eHeprweru YcPaTHH
AepzaBne ubupTcmo"Ha L4ioHanmHa OH9preOTmI4 KomnfaHiR "YKPEHEPro"
01032, m. KuWt-32, KoWmiVy.25, m8mi6 227-6747,=VralmnI65 10 IUD . dU,u ','X EUX
D A T E December 05. 2002
To: Mr. Nikolay NikolovTask Team LeaderEnergy and Infrastructure DepartnentEurope and Central AsiaTHE WORLD BANK GROUP
Re: Ukraine Hydropower Rehabilitation and System Control Project,Loan 38650 UA, General comments
Dear Mr. Nikolov,
Thank you for sending us the draft Implementation Completion Report on the UkraineHydropower Rehabilitation and System Control Project
Upon preliminary review of the Report, NPC Ukrenergo considers it overallsatisfactory. We would like to point out that the Report reflects the main resultsachieved during project implementation.
The rehabilitation of the hydropower plants and system control under the project havecontributed to the economic development of Ukraine in general , as well as to theimprovement of the quality of the power system control and reliability of electricitysupply to consumers.
The implementation of part B of the project allowed the original objectives to beachieved and to obtain positive results, which contributed to a certain extent toimproving the situation in the country' s energy sector.
We would like to emphasize the role of the World Bank during projectimplementation. Problematic implementation areas were identified in the course ofconstant cooperation during regular World Bank supervision missions. Decisions
-36-
were made about influencing internal and external conditions in order to ensure projectcompletion in accordance with planned schedules and financing. In view of the lackof experience in implementing such projects, the constant cooperation with the WorldBank experts allowed the Ukrainian counterparts to carry out their responsibilities forimplementing a series of works with higher quality and without substantial delays.Thus, the World Bank played a stabilizing role, which was very important at all stagesof the project.
In view of the above, NPC Ukrenergo considers the Bank' s work successful.
Sincerely,
,/NvA/ f
Vladimir LuchnikovDirector
(b) Cofinanciers:Canadian International Development Agency - Nicole Rivardroyer
NICOLE_RIVARDROY To: [email protected]@acdl-cida.gc.ca cc:12/0212002 01:18 PM Subject: Re: Ukraine Hydropower Rehabilitation and System Control Project
Dear Mr. Nikolov!
As discussed few mninutes ago, I wold like to confirm that CIDA findsacceptable your report on the Ukraine Hydropower Rehabilitation and SystemControl Project. This project, according to our field staff, has been areal success and Hydro Quebec has been instrumental in this.
Many thanks for having consulted us and have a great afternoon!
Nicole
-37 -

Royal Ministry of Foreign Affairs of Norway - Mari Skaare
Skire Mari To: "'[email protected]'" <[email protected]><[email protected] cc: Sandhaland Harald <[email protected]>,> '"[email protected]' <[email protected]>11/28/2002 09:23 AM Subject: RE: FW: Co-financing from the Govemment of Norway to a World Ban
k pr oject in Ukraine for Hydropower Rehabilitation and SystemControl
Dear Mr. Nikolov,
We have no comments on the report as such (which we have studied onlybriefly). We are pleased that the overall outcome of the project isconsidered satisfactory and that the recommendations in the Water Managementand Hydropower Generation study carried out by Norwegian experts have beenconsidered useful and taken into account in the development of the project.
Yours sincerely,
Mari Skare
State Secretariat for Economic Affairs - Switzerland
Von: Tavema Claudia SECO> Gesendet: Donnerstag, 28. November 2002 17:37> An: '[email protected]'> Cc: Derron Jacques SECO; Gruber Werner SECO> Betreff: Ukraine: Hydropower Rehabilitation and System Control> Project> Wichtigkeit: Hoch
> Ukraine: Hydropower Rehabilitation and System Control Project
> Dear Mr. Nikolov,
> We would like to thank you for sending us the draft implementation completion report of the HydropowerRehabilitation and System Control Project. After careful study of the report, we would like to send you ourcontribution:
In 1995, the Swiss Government has provided the Ukrainian Govemment with a grant of a maximum ofCHF 14 Mio. for the rehabilitation and the modemisation of nine hydropower plants. The Government ofthe Ukraine has concluded an onlending agreement with the Hydropower Company, Dniprohydroenergo(DHE) for the financing of Swiss equipment on the basis of the feasibility study of SGI Engineering Ltd,approved by the World Bank and the Ukrainian Government. That project lead had been set up as aparallel co-financing with the World Bank project.
-38 -

> Our Project
The Swiss component of the Hydropower Rehabilitation and System Control Project has been successfullyterminated in August 2002, with a last delivery of spare parts by the Swiss suppliers and a final mission ofthe Swiss consulting firm, Stucky Consulting Engineers, Lausanne. In general, the project has beenimplemented to Dniprohydroenergo's (DHE) and seco's satisfaction and overall project objectives have beenfulfilled:
> the reliability of the high-voltage circuit breakers was considerably increased, expenses and frequency ofmaintenance and repair reduced or eliminated, accounting of disbursed power was improved. From anecological point of view, the new equipment allowed for a decrease of sound effects.> The new circuit breakers are ecologically safe, and work without oil.> There were some delays, which were mainly due to the late conclusion of the necessary frame agreementsand to bureaucratic obstacles with regard to certification problems of the equipment that had to be resolvedby diplomatic means.
> Problems remain with regard to the loan agreement between the Ukrainian Ministry of Finance and DHE.Because of insufficient reforms in the energy sector, including tariff reform, and the economic crisis, thebeneficiary company did not have the expected income and faces difficulties in repaying the contracteddebt. Negotiations for a rescheduling of the debt and discussions for the allocation of the means are ongoingto find a satisfactory solution.
Cooperation with the World Bank
The Swiss component and the World Bank project have been implemented in a very independent manner.There were fewer co-operations than expected, because the Swiss component started before the recruitmentof the intemational consultant. Nevertheless, project contents have been complementary and have lead tobig improvements in the energy sector.
Energy Sector Reforms
Unfortunately, the policy dialogue between the Ukrainian govenmuent and the donor community establishedat the beginning of the program was later interrupted by the Govermnent because of a lack of politicalsupport and did not lead to the expected results with regard to the implementation of an accompanyingcomprehensive sectoral reform program. Therefore, tariffs have not been raised accordingly and DHBEconsequently still seems not to be in a position to pay out of its own resources for appropriate operation,maintenance and replacement of equipment.
Yours sincerely,
Claudia TavemaInfrastructure FinancingState Secretariat for Economic Affairs, Development and Transition
Note from the World Bank project team:
During the period of project design and implementation (1994 - 2002) the power sector in Ukraine evolvedfrom a system of vertically integrated regional utilities to an unbundled system of generating, transmissionand distribution companies, interacting through a wholesale electricity market and regulated by a separate
- 39 -
National Electricity Regulatory Commission. Six electricity distribution companies (oblenergos) have beenalready privatized to strategic investors, while another seven oblenergos were divested to local investors.An international Task Force with representatives of EBRD, USAID, the European Commission, IMF andthe World Bank is working with Ukrainian counter parts at present on furthering sector reforms.
Low level of payment collections in the power sector until mid-2000 was the main factor affecting thefinancial performance of the power sector in general and the project beneficiaries in particular.Dniprohydroenergo and Ukrenergo were not receiving adequate payments from the wholesale electricitymarket Consequently, the two companies, and Dinprohydroenergo in particular, were unable to providesufficient counterpart financing for project needs and therefore project works were temporarilydiscontinued.
In 2000, the new reform-oriented government undertook active measures to improve electricity payments.Cash collections in the wholesale electricity market consequently rose from only 9% in April 2000 to 71%in May 2001 and 90% in May 2002. Improvement of payment discipline and progress in energy assetsprivatization were key conditions of the IMF's Extended Fund Facility (EFF) program and a World BankProgrammatic Adjustment Loan to Ukraine. These developments allowed the project beneficiaries toimprove their liquidity towards the end of the project and honor their obligations to employees, state budgetand local suppliers, including the requirements for local project financing. DHE has repaid so far only avery minor portion of its accumulated debt to the Ministry of Finance under the conditions of the Swissgrant on-lending agreement between the company and the Ministry.
On November 14, 2002, Agreed Minutes were signed between representatives of the Swiss StateSecretariat of Economic Affairs (SECO), the Ministries of Finance, Economy and Fuel and Energy andDHE. The Agreed Minutes outlined a framework for restructuring DHE's schedule of repayment of thegrant-related loan to the Ministry of Finance and usage of the corresponding accumulated funds.
(c) Other partners (NGOs/private sector):
N/A
10. Additional Information
The project financial analysis at completion was carried as required by the ICR guidelines and details of theanalysis are presented in this section. Highlights about the past financial performance of the projectimplementing agencies and their financial management systems are also provided in order to complementthe presentation of the dynamic environment in which the project was implemented. Details about thetransition arrangements for the implementing agencies after project completion are also presented in thissection in view of the importance of these transition arrangements for ensuring sustainability of the projectresults.
I. FINANCIAL ANALYSIS OF THE PROJECT
DHE
The Financial Intemal Rate of Retum (FIRR) for the hydropower rehabilitation component was calculatedon the basis of incremental financial cash flows - defined as the difference between the "with' and"without" project scenarios. FIRR at completion was lower, 9.9% vs. 13.5% at appraisal in real terms,mainly as a result of lower than estimated energy gains with the project.
-40 -
Below is a comparison of the key assumptions used for the financial analysis at appraisal and atcompletion.
1. Output
In the Staff Appraisal Report (SAR), carried out in 1994, it was assumed that there would be an additionalaverage annual output of 567 GWh as a result of the project. This difference would be gradually achievedover the life of the project, as the new equipment would be gradually installed at the power stations. Alower increase of 270 GWh/yr was however achieved in reality due to lower energy gains at the powerplants under the project. In consistence with the economic analysis in annex 3, electricity output estimateswere based on extrapolating historic series of multiannual averaged data including highest and lowest levelsof water flows. (See Annex 3 on economic costs and benefits for details).
2. Tariff Structure
Under the "with the project" scenario, actual average annual tariffs were used in the calculations for theperiod 1996-2002. At appraisal and at completion a cost-recovery mechanism was assumed to cover thelocal investment cost of the project and the capitalized interest during project implementation, whichincluded a 5 year grace period. After the end of the grace period, the amounts equal to the beneficiary'sactual loan-service obligations were recovered through tariffs as well.
For the period 2002-2031, the energy prices were assumed to increase based on the projected averageannual inflation rates for both the "with" and "without' the project scenarios.
3. Taxation
As in the SAR, it was assumed at completion that all revenues associated with the cost-recoverymechanism are subject to the same taxation regime as other revenues of DHE. Thus, 100% of incrementalrevenues will be subjected to profit tax, road maintenance assessment and unemployment fund distributionat a total rate of 32%.
4. Operating and Maintenance Costs
Neither the SAR nor the new analysis adopted any substantial cost savings. For the eight plants as a wholethe SAR used a savings of $120,000/yr in 2001 which increased to $710,000 by 2010. By comparison, thenew analysis has a larger initial savings of $400,000 in 2001 increasing at a lower rate to $780,000 by2010.
5. Project Costs
The project costs are in current US dollars equivalent to the local and foreign investment costs and thecapitalized interest (commitment fees and interest during construction).
-41 -
6. Macro-economic assumptions
a. Rate of Inflation:
At appraisal inflation was expected to be 5% annual in 2000-2001. It was actually higher 25.8% in 2000and 11.9% in 2001. Nevertheless, during the last years, the government has made significant efforts tostabilize the Ukrainian economy and control the level of inflation, reducing it from 182% in 1995 to 11.9%in 2001 (Table Al).
Table Al: Inflation Rate Source: National Bank of Ukraine.1995 11996 11997 11998 1 999 2000 2001181.7% 39.7% 10.1% 20% 19.2% 25.8% 11.9%
Inflation is expected to decline from 11% in 2003 to 7.4% in 2005, remain at the levels of 7% on averageuntil the year 2010 and further decrease to 5% from 2010.
Table A2: Inflation Rate - Projections Source: World Bank (Projections 2002-2004)1 2002 12003 2004 2005 -2010 12011-2031
8.5% 110.9% 8.1% 7% 15%
b. Exchange Rate:
The Ukrainian currency had been considerably vulnerable and weak until fiscal 2000, when the Ukrainianeconomy was stabilized (Table A3). Since then the Ukrainian Hrivnya has remained rather stable due tothe strict monetary policies that the Central Bank has been applying. During the following years, theUkrainian currency is expected to slowly devaluate vis-a-vis the US dollar at a rate of 3% on an annualbasis.
Table A3: UAHIUS$ Exchange Rate Source: National Bank of Ukraine and the WB.1995 11996 11997 11998 11999 12000 120011.473 1.829 1.862 2.450 4.130 5.440 5.372
7. Project life
In the SAR, the Financial Internal Rate of Retum was calculated for the period 1995-2020 on the basis of1994 constant US dollars. In the ICR, however, FIRR was calculated for the period 1996-2031 based on1996 constant US dollars. The first project investments started in 1997. Only minor capitalized interestexpenditures were incurred in 1996. The extension of the project life until 2031 was based on theassessment of the economic analysis of the project. (See annex 3 for details).
8. Sensitivity has been discussed in section 4.4 in the main text of the ICR.
-42 -

DRE HYDROPOWER REHABILITATION -FINANCIAL RATE OF RETURN (RHl figures In current USS unless otherwise noted)
1996 1997 1998 1999 2000 2001 2002 2003 2014
0 1 2 3 4 5 6 7 18
REVENUE WITHOUT PROJECT
Electncity Output GWh/yr 7337 8933 8933 8933 8933 8933 8915 8897 8704
Tanff in UAH (yearly average) UAHkop/IcWh 1.06 1.24 0 65 0 92 1 21 1 25 1 74 1 93 3 81
Tarff in US$ $SkWh 0 0058 0 0067 0 0027 0 0022 0 0022 0 0023 0 0032 0 0035 0 0050
Revenue $million 42.43 5954 23.87 19.98 19.92 2073 2878 3092 43 09
WITH PROJECT
ElectricityOutput GWhlyr 7331 8933 8963 9011 9042 9150 9137 9124 8985
TariffinUAH(yearlyaverage) UAHkop/kWh 106 134 0.96 133 1.89 192 208 231 456
Tanff in USS SlkWh 0 0058 0 0072 0.0039 0 0032 0 0035 0 0036 0 0039 0 0042 0 0059
Revenue Smilihon 42 52 64 30 35 13 29.02 31 41 32.70 35.25 37 90 53 16
Incremental tax Smillion 0 03 1.52 3 60 2 89 3 68 3 83 2 07 2.23 3 22
REVENUE INCREASE (after tax) Smillion 0.06 3.23 7.66 6.14 7.81 8.14 4A0 4.75 6.85
O&M COST REDUCTION Smillion 0 0 08 0 22 0 19 0 22 0 40 0 52 0 68 0 85
PROJECT COSTS
Local Investment Cost Smillion 4.54 10 77 8 11 10 19 10 72 5 09
WB Loan Disbursements Smillion 1.92 2 16 5.68 4.35 7 51 10 17
Capitalised Interest Smillion 0 09 0.21 0 37 0 67 0 93 0.48 0 52
TOTAL PROJECT COSTS Smillion 0.09 6.67 13.30 14A6 15A7 18.71 15.79
INCREMENTAL CASH FLOW (Current S) -0 03 -3 36 -5.42 -813 -7.44 -10 16 -10 86 5 43 7 70
FINANCIAL IRR 12.3%INCREMENTAL CASH FLOW (S 1996) -0 03 -3 29 -5 19 -7 62 -6 82 -9.12 -9.53 4 66 5 20
FINANCIAL IRR (real) 9.9%
Discount Rate (USS Infl. Rate) 2.20%
ExchangeRate(USS/UAH) 183 1.86 245 413 544 5.37 540 556 770
Inflation Rate 3977% 1011% 20.0% 192% 25.8% 11.9% 85% 109% 50%
-43 -
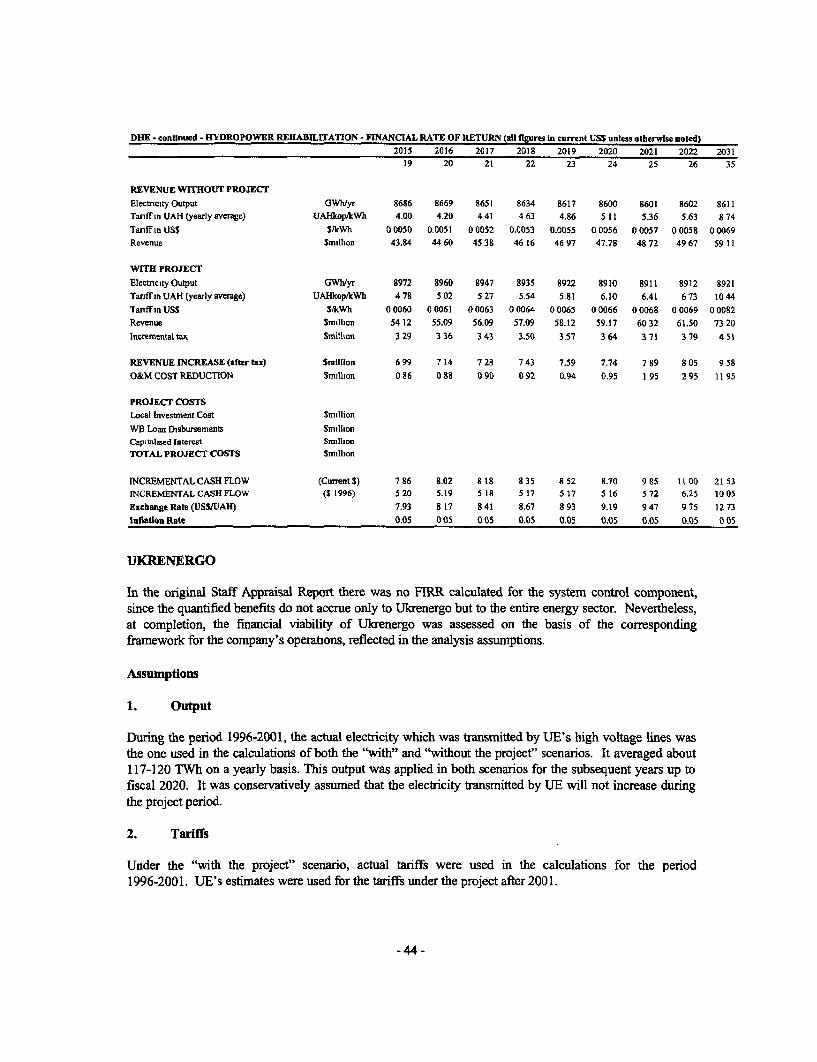
DHE -continued - HYDROPOWER REHABILIATION -FiNANCLAL RATE OF RETURN (all flgures in current USS unless otherwise noted)2015 2016 2017 2018 2019 2020 2021 2022 2031
19 20 21 22 23 24 25 26 35
REVENUE WITHOUT PROJECT
Electncity Output GWh/yr 8686 8669 8651 8634 8617 8600 8601 8602 8611Tariff tn UAH (yearly average) UAHkop/kWh 4.00 4.20 4 41 4 63 4.86 5 11 5.36 5.63 8 74
Tarff in USS SlkWh 0 0050 0.0051 0.0052 0.0053 0.0055 00056 00057 00058 00069Revenue Smillion 43.84 44 60 45 38 46 16 46 97 47.78 48 72 49 67 59 11
WITH PROJECT
Electneity Output GWh/yr 8972 8960 8947 8935 8922 8910 8911 8912 8921
Tanff in UAH (yearly average) UAHkop/kWh 4 78 5 02 5 27 5.54 5.81 6.10 6.41 6 73 10 44
Tanff in USS V/kWh 0 0060 0 0061 0 0063 0 0064 0 0065 0 0066 0 0068 0 0069 0 0082
Revenue Smilhon 5412 55.09 56.09 57.09 58.12 59.17 6032 61.50 7320
Incremental tax Smillion 329 336 343 3.50 3.57 364 371 379 451
REVENUE INCREASE (after tax) Smilnlon 6 99 7 14 7 28 7 43 7.59 7.74 7 89 8 05 9 58
O&M COST REDUCnON $million 086 0 88 0 90 0 92 0.94 0.95 1 95 2 95 11 95
PROJECT COSTSLocal Investment Cost Smillion
WB Loan Disbursements SmilhionCapitalised Interest Smillion
TOTAL PROJECT COSTS Smilhon
INCREMENTAL CASH FLOW (Current $) 786 802 8 18 835 8 52 8.70 985 11 00 2153INCREMENTAL CASH FLOW (S 1996) 5 20 5.19 5 18 5 17 517 5 16 5 72 6.25 10 05
Exchange Rate (USSIUAH) 7.93 817 8 41 8.67 8 93 9.19 9 47 9 75 12 73
Inflation Rate 0.05 0 05 0 05 0.05 0.05 0.05 0.05 0.05 0 05
UKRENERGO
In the original Staff Appraisal Report there was no FIRR calculated for the system control component,since the quantified benefits do not accrue only to Ukrenergo but to the entire energy sector. Nevertheless,at completion, the financial viability of Ukrenergo was assessed on the basis of the correspondingframework for the company's operations, reflected in the analysis assumptions.
Assumptions
1. Output
During the period 1996-2001, the actual electricity which was transmitted by UE's high voltage lines wasthe one used in the calculations of both the "with" and "without the project" scenarios. It averaged about117-120 TWh on a yearly basis. This output was applied in both scenarios for the subsequent years up tofiscal 2020. It was conservatively assumed that the electricity transmitted by UE will not increase duringthe project period.
2. Tariffs
Under the "with the project" scenario, actual tariffs were used in the calculations for the period1996-2001. UE's estimates were used for the tariffs under the project after 2001.
-44 -

Under the "without the project" scenario - as in the case of DHE - it was assumed that tariffs would haveremained at lower levels if the project had not been implemented.
The difference between the "with project" and "without project tariffs" provided the additional tariffincrease needed to cover the additional investment costs under the project. Thus, the UE's own forecastabout the company's tariffs "with project" has been assumed to cover additional project costs. Therequired additional tariff increase to cost recovery level under the project has been also established. Theresults of this simulation are presented below:UE's tariffs
YEAR 1996(1) 1997 1998 1999 2000 2001 2002 2003 2014 2020
with projecttanff(kopecks/kWh) 0.11 012 0 14 0.25 021 026 0.5 063 2.03 2.8
without projecttanff(kopecks/kWh) 01095 0110 0127 0.211 0169 0206 0,487 0614 1.977 2727
tariff increase to 0.0005 0 010 0 013 0 039 0.041 0 054 0 013 0 016 0.053 0 073"with project" tariff level (kopecks/kWh)
(I) Bank staff estimates
At appraisal in 1994, the original project company the National Dispatch Center, in its capacity of a solepurchaser of output from the hydropower and nuclear plants, was supposed to generate its revenue throughreselling electricity at cost - based tariffs form these plants to the then existing eight regional powercompanies and a few large industrial concerns. However, early in project implementation, the newlyestablished Wholesale Electricity Market (Energomarket) assumed the electricity trading function. NDCbecame then dependant on receiving payments from Energomarket for its services - initially dispatch,which was later coupled with transmission within a new company.
Since 1998, upon the merger of the National Dispatch Center with the transmission companyUkrelectroperedacha, the tariff for the services of the newly formed National Power Company Ukrenergoincluded a transmission and a dispatch component. The dispatch component did not change with theproject. Consequently, additional costs under the project were covered by increasing the transmission tariffcomponent.
As of the first quarter of 2002, a unified tariff for transmission and dispatching services was set at 0.5kopeks/kWh. This unified tariff is still far below the average European level and is therefore expected tofurther increase during the following years to 1.5 kopeks/kWh by 2010 and 2.8 kopeks/kWh by 2020.
Thus, for the period 2002 - 2020, it was assumed that Ukrenergo's tariffs will increase at a rate higher thanthe inflation rate in both the "with" and "without" the project scenarios.
3. Taxation
It was assumed at completion that all of the UE's incremental revenues associated with the cost-recoverymechanism will be 100% subjected to profit tax at a rate of 30%.
-45 -

4. Operating and Maintenance Costs
During the project period, it was assumed that there would be no incremental difference in O&M expensesbetween the "with" and the "without" the project scenarios other than rninor specific savings from theinstallation of the fiber-optic cable and other project components, as described below by Ukrenergo'sconsultants:
a. Savings from not renting any more communications channels, as a result of installing fiber-opticcable under the project, estimated at UAH 29,359/ year.b. Reduction of expenditures on the current maintenance of relay protection installation, estimated atUAH 19,752/ year.c. Reduction of expenditures on adaptation of relays protection due to the changed operationsconditions, estimated at UAH 3,840/ year.
5. Project Costs
The project costs are in current dollars based on the US$IUAH exchange rate during the years 1996-2002.
6. Macro-economic assumptions
The assumptions regarding the expected inflation and exchange rate in subsequent years are the same asthose used for DHE.
7. Project life
FIRR was calculated for the period 1996-2020 based on 1996 constant US dollars. The first major projectinvestments started in 1997. Only minor expenditures for equipment and capitalized interest were incunredin 1996.
8. Sensitivity
Maintaining UE's tariff at the expected "with project" level is critical for the company's financial viability.Even a 0.0 1% reduction of the "with project" tariffs results in a FIRR lower than the Ukrenergo's cost ofcapital of 8.5%, reflecting the cost of borrowing under the project (1.5% on-lending interest rate of theMinistry of Finance, plus 7.0 % World Bank rate). FIRR is less sensitive to changes in UE's output(transmitted electricity) which can decline by 37% within the company's financial viability limits. O&Msavings are insignificant and FIRR remains unchanged even without accounting for these savings.
RATE OF RETURN
Based on the above assumptions, the financial intemal rate of return is calculated at 15.9% on a currentbasis and 13.4% on a real basis.
- 46 -

UKRENERCO -Financial Rate of Return (all flgures In current USS unless otherwise neted)
1996 1997 1998 1999 2000 2001 2002 2020
INCREMENTAL REVENUES
Electncity Transmitted Twhfyr 117 118 123 113 118 116 117 117
Tariff increase to cosi-recovery level with project kopecks/kWh 0000 0010 0013 0039 0041 0054 0013 0073
Incremental revenues fromtariff mcreasetocost-recovey level UAH mill 058 12.24 1561 4546 4818 6252 1532 8579
Savings from not renting communication channels UAH mill 0 000 0 o000 0000 0 0 o 0 000 0 000 0 029 0 029
Reduction of expenditures on the current maintenance of relay protectioninstallation UAH mill 0000 0o000 o oo o oo oooo 0000 0000 0 020 0 020
Reduction of expendioitures on adaptation of relays protection due tochanged operations conditions UAH mill 0.000 0.000 0 000 0 000 0 000 0 000 0 004 0 004
Total incremental revenues UAH mill 0582 12241 15611 45463 48 183 62523 15 373 85 844
Total incremental revenue inS S million 0318 6.575 6373 11 007 8 857 11 493 2 847 9 338
Incremental tax Smillion 0.10 2.10 204 3.52 2 83 3.68 091 299
REVENUE INCREASE (after tax) Smillion 0.22 4.47 4.33 7.48 6.02 7.82 1.94 6.35
PROJECT COSTS
Local Investment Cost Smillion 0 0.489 1 303 0755 1 359 0651 0 197
WB Loan Disbursements Smullion 0138 5926 493 10172 7448 10822 2640
Commitment Fee Smilhon 018 0 16 014 0.08 005 002 0
TOTAL PROJECT COSTS Smillion 0.318 6.575 6.373 11.007 8.857 11.493 2.837
INCREMENTAL CASH FLOW (Current S) -0 10 -2 10 -2 04 -3 52 -2 83 -3 68 -0 90 6 35
FINANCIAL IRR 15.9%
INCREMENTAL CASH FLOW (S 1996) -010 -2 06 -I 95 -3 30 -2 60 -3 30 -0 79 3.77
FINANCIAL IRR (real) 13.4%
Discount Rate (USS infl. Rate) 2.20%
Exchange Rate (USStUAH) 1 83 1.86 245 4 13 544 5 44 540 9 19
Inflation Rate 10.1% 20.0% 19 2% 25 8% 11 9% 8 5% 109% 5 0%
H. PAST FINANCIAL PERFORMANCE OF DNIPROHYDROENERGO (DHE)
2.1 The State Energy Generating Joint Stock Company "Dniprohydroenergo" (DHE) operates eighthydropower plants located along the Dnieper River with an available capacity of 3779 MW at design head.
2.2. Production volumes of the hydropower plants are coordinated by Ukrenergo and the electricityproduced is sold to Energomarket. Tariffs are regulated by the National Energy Regulation Commission(NERC) and are set on a monthly basis in consultation with DHE's management.
2.3. In general, DHE's past financial performance has been negatively affected by the low collectionrates in the Ukrainian energy sector. DHE's collections averaged about 70% during the years 1997-1999and were at even lower levels of 30 to 45% during fiscal years 1995 and 1996. As a consequence, thecompany faced considerable liquidity problems resulting in the increase of its accounts receivable to 411days of sales by the end of fiscal 1999. Nevertheless, the company's liquidity significantly improved since
-47 -
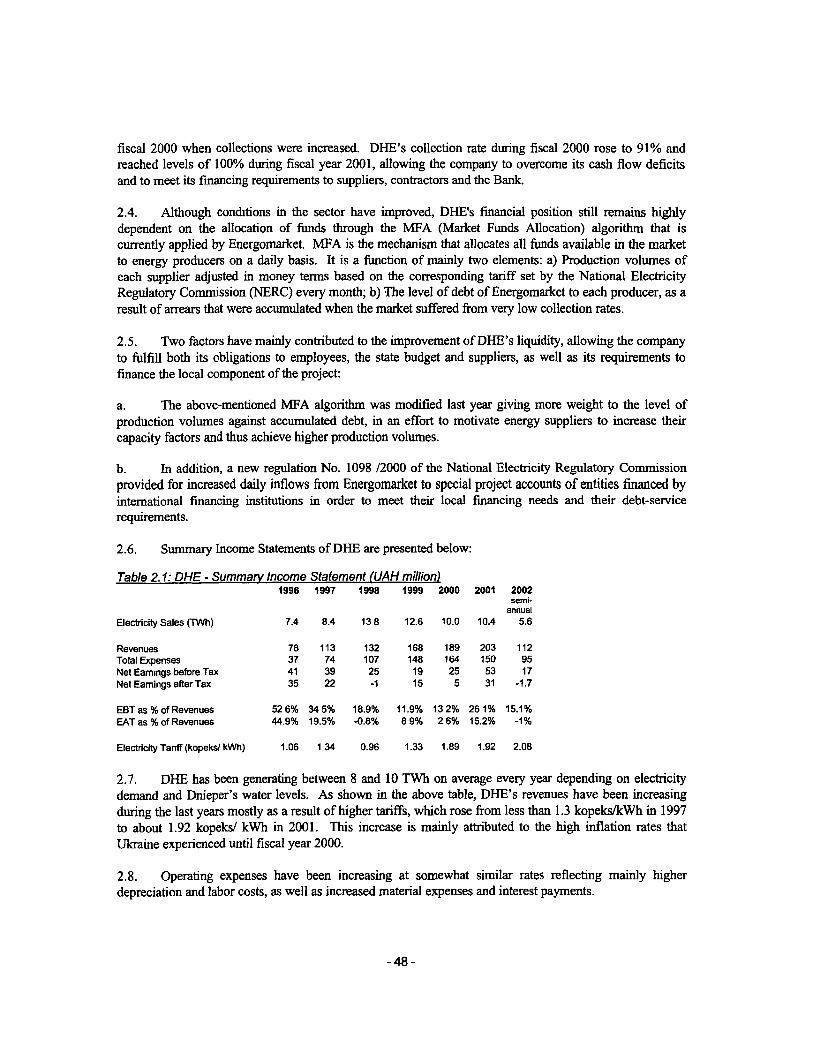
fiscal 2000 when collections were increased. DHE's collection rate during fiscal 2000 rose to 91% andreached levels of 100% during fiscal year 2001, allowing the company to overcome its cash flow deficitsand to meet its financing requirements to suppliers, contractors and the Bank.
2.4. Although condctions in the sector have improved, DHE's financial position still remains highlydependent on the allocation of funds through the MFA (Market Funds Allocation) algorithm that iscurrently applied by Energomarket. MFA is the mechanism that allocates all funds available in the marketto energy producers on a daily basis. It is a function of mainly two elements: a) Production volumes ofeach supplier adjusted in money terms based on the corresponding tariff set by the National ElectricityRegulatory Commission (NERC) every month; b) The level of debt of Energomarket to each producer, as aresult of arrears that were accumulated when the market suffered from very low collection rates.
2.5. Two factors have mainly contributed to the improvement of DHE's liquidity, allowing the companyto fulfill both its obligations to employees, the state budget and suppliers, as well as its requirements tofinance the local component of the project:
a. The above-mentioned MFA algorithm was modified last year giving more weight to the level ofproduction volumes against accumulated debt, in an effort to motivate energy suppliers to increase theircapacity factors and thus achieve higher production volumes.
b. In addition, a new regulation No. 1098 /2000 of the National Electricity Regulatory Commissionprovided for increased daily inflows from Energomarket to special project accounts of entities financed byintemational financing institutions in order to meet their local financing needs and their debt-servicerequirements.
2.6. Summary Income Statements of DHE are presented below:
Table 2.1: DHE - Summart Income Statement (UAH million)1996 1997 1998 1999 2000 2001 2002
semi-annual
Electdricity Sales (TWh) 7.4 8.4 13 8 12.6 10.0 10.4 5.6
Revenues 78 113 132 168 189 203 112Total Expenses 37 74 107 148 164 150 95Net Eamings before Tax 41 39 25 19 25 53 17Net Eamings afterTax 35 22 -1 15 5 31 -1.7
EBT as % of Revenues 52 6% 34 5% 18.9% 11.9% 13 2% 261% 15.1%EAT as % of Revenues 44 9% 19.5% -0.8% 8 9% 2 6% 15.2% -1%
ElectricityTarnf (kopekst kWh) 1.06 1 34 0.96 1.33 1.89 1.92 2.08
2.7. DHE has been generating between 8 and 10 TWh on average every year depending on electricitydemand and Dnieper's water levels. As shown in the above table, DHE's revenues have been increasingduring the last years mostly as a result of higher tariffs, which rose from less than 1.3 kopeks/lkWh in 1997to about 1.92 kopeks/ kWh in 2001. This increase is mainly attributed to the high inflation rates thatUkraine experienced until fiscal year 2000.
2.8. Operating expenses have been increasing at somewhat similar rates reflecting mainly higherdepreciation and labor costs, as well as increased material expenses and interest payments.
-48 -

2.9. As illustrated above in Table 2.1, the company managed to remain profitable (by IAS) throughoutthe period under consideration. During the first six months of 2002 DHE had a UAH 17 million profit,which was however subjected to higher taxes in the amount of UAH 18.7 million. Nevertheless, DHE'scash flow remained positive during the same period. In fiscal 2001, the company demonstrated profits ofUAH 53 million, attaining a net margin of 26% compared to 12% and 13% in fiscal years 1999 and 2000respectively. DHE's net profits in fiscal 1999 reached UAH 19 million and increased by about 30% infiscal 2000 (UAH 25 million). DHE's profitability in fiscal 1999 was negatively affected by increasedmaintenance expenditures, as well as increased depreciation expense. Fiscal 2000 higher profits are mostlyattributed to considerably higher tariffs and a containment of maintenance expenditure.
2.10. Summary Balance Sheets of DHE are presented below:
Table 2.2: DHE Summary Balance Sheet (UAH million)1996 1997 1998 1999 2000 2001 2002
semiannualTotal Assets 993 1002 971 1022 1197 1300 1296Fixed Assets 878 810 736 744 748 793 856Incomplete Constructions 36 45 58 52 86 101 55Current Assets 78 143 158 209 348 392 371of which accountsreceivableu' 67 110 139 189 190 183 179Other Assets 0 4 19 17 15 15 14
Total Liabilites 993 1002 971 1022 1197 1300 1296Equiy & Reserves 867 900 867 878 858 946 946Long-termrdebt 0 11 31 57 79 116 140Current Liabilities 67 44 74 87 260 238 210of which accounts payable? 5 13 23 26 38 21 15Other Liabilites 59 47 1 0 0 0 0
Current Ratio 1.2 3 3 2.1 2.4 1 3 1 64 1 76Days of Receivables 314 355 384 411 366 329 292
W The rehabilitation of the Dniester pump storage station, which does not belong to the DHE's organizational structure, usedto be financed through an additional surcharge of I kopek/kWh on the DHE' s tariff. DHE was supposed to collect this I kopeksurcharge and pass it further on to the Dmester pump storage station. The I kopek/kWh surcharge was recorded in the DHE'sfinancial statements. Therefore, DHE's receivables formally mcluded any receivables related to the Dniester pump storagestation This arrangement inflated overall receivables recorded in DHE's financial statements. This practice has beendiscontinued since the beginning of 2002' Same as above.
2.11. As shown in Table 2.2 above, the net book value of fixed assets decreased until fiscal 1998 mainlydue to high depreciation rates. Since then, however, fixed assets increased reflecting the capital investmentsthat the company has been undertaking in relation to this project.
-49 -
2.12. As in the case of Ukrenergo, current assets significantly rose until fiscal 2000 due to the increase inaccounts receivable from UAH 67 million in fiscal 1996 to UAH 189 million in fiscal 1999 or 411 days ofsales. These accounts represented all the arrears accumulated in Energomarket during the previous years.Since fiscal 2000 however, when DHE's collection rates increased to levels close to 100%, the companymanaged to halt this increasing trend and has gradually begun to reduce its accounts receivable from 411days in fiscal 1999 to 329 days in fiscal 2001.
2.13. Similarly, current liabilities also grew until fiscal 2000, but at lower rates, due to increasedaccounts payable mostly attributed to the financing of the Dniester Pump Station. DHE's financialstatements also used to include accounts payable to Dniester pump storage station which consequentlyinflated the overall accounts payable and the corresponding current liabilities recorded in the DHE'sfinancial statements. (See notes 1 and 2 to table 2.2 above). Since then, however, accounts payable werebrought back to fiscal 1998 levels of UAH 23 million compared to UAH 38 million at the end of fiscal2000. This decrease in accounts payable reflects the company's ability to meet its requirements tosuppliers and to contractors in relation to this project.
HI. PAST FINANCIAL PERFORMANCE OF UKRENERGO
3.1. The National Power Company "Ukrenergo" is one of the largest energy companies in Ulkraineemploying more than 10,000 people. Its main activities today include the provision of transmission anddispatching services via its high voltage lines on the Ukaainian energy grid.
3.2. Since September 1995, when IBRD and the Government of Ukraine agreed on the loan to financethe Hydropower Rehabilitation and System Control Project, Ukrenergo has experienced majorreorganizations. On April 15, 1998, the National Dispatch Center (NDC), which initially carried out PartB (System Control component) of this Project, merged with the National Electric Company"Ukrelectroperedacha". The merged company was named Ukrenergo assuming all assets, liabilities andcontractual obligations of the two predecessor companies. Ukrenergo's activity consisted since then of twomain divisions: a) "Energorynok" or Energomarket, responsible for the coordination of electricityproduction as well as for the collection of payments from customers and the distribution of funds toelectricity producers, acting more or less as a trading company and an intermediary between consumers andproducers; b) Transmission and Dispatching, responsible for maintenance, transmission and dispatching ofelectricity from energy producers to consumers.
3.3. In May 2000, however, Ukrenergo faced a de-merger, when the Government of Ukraine orderedthe spin-off of the "Energomarket" division of Ulkrenergo into a separate legal entity. All assets andliabilities of Ukrenergo relating to electricity purchases and sales were assumed by "Energomarket" andUkrenergo focused solely on transmission and dispatching activities. Nonetheless, Part B of this Project hascontinued to be executed by Ukrenergo.
3.4. Further to the above developments, the evaluation of Ukrenergo's past financial performancebecame a rather difficult task. In general, the company has been very much dependent on the overallperformance of the Ukrainian energy sector, which faced significant setbacks since 1995. Mostimportantly, sector-wide collections had been at very low rates (20-30%) creating a very illiquid energymarket. Huge arrears were gradually accumulated in the Energomarket resulting in major cash flowproblems for most Ukrainian energy companies.
- 50 -

Cash flow deficits have brought Ukrenergo into a weak financial position, unable to meet its financingrequirements by delaying or often withholding payments to its suppliers. Ukrenergo also consistently failedto promptly fulfill its obligations to its employees, the state budget and the various funds.
3.5. Since fiscal 2000, however, the financial performance of Ukrenergo has significantly improved, adevelopment that can be attributed to the following reasons:
a. The spin-off of Energomarket into a separate entity resulted in significantly reduced operatingexpenses, which increased the company's gross margins. Payments to the so-called "innovation fund," forexample, that were at around UAH 30 million on average every quarter were almost eliminated when thesplit was effected.
b. Collection rates were gradually increased creating more liquidity in the energy market reflecting theoverall improvement of the Ukrainian economy.
c. Finally, as in the case of DRE, the new regulation of NERC, No. 1098 / 2000 provided forincreased daily inflows from the Energomarket to special project accounts of the companies financed byinternational financing institutions (i.e. World Bank, EBRD, etc) in order to meet their local financingneeds and their debt-service requirements. This regulation has to a large extent contributed to theimprovement of Ukrenergo's cash flows and the company had been able since then to fulfill both itsobligations to employees, the state budget and suppliers, as well as its requirements to finance the localcomponent of the project.
3.6. Summary Profit & Loss Statements of Ukrenergo are presented below in Table 1. 1.
Table I I Ukrenergo Summary of Income Statement hy IAS (UAHmillion)
1997 1998 1999 2000 i 2001 2 2002sff,aietl
Electricity Transmitted (TWh) 118.0 122.7 117.8 117.6 116.3 57
Revenues from Energomarket n/a 10045 12650 6335 0 0Revenues from Transmission n/a 168 294 230 305 2323Revenues from Dispatching n/a 218 260 156 78Total Revenues 76164 10431 13204 6721 398 229Total Operating Expenses 7455 10637 13492 6672 360 194.3Net Operating Income (lAS) 161 -206 -288 49 38 37.7NetIncomeaftertax 155 -219 -292 32 22 21.3
Operating Income as % of Revenues 2.1% -2.0% -2.2% 0.7% 9.5% 16.2%Net Income as % of Revenues 2.0% -2.1% -2.2% 0.5% 5.5% 9.2%
Average Transmission Tariff (kopeks/ kWh) n/a 0 14 0.25 0.21 026 04(Qi)3
AverageDispatchingTariff(UAHmil/month) n/a 18.1 21.6 13 6.5
I ) Fiscal 2000 incorporates Energomnarket's financial results for one semester until the spin-off of Energomarket into a separate entity was effected onJuly 1 2000.2 ) Fiscal 2001 includes only UKRENERGO's financial results reflecting solely transmission and dispatchmg activittes.3 ) As of the first quarter of 2002 1t was decided to introduce a unified tanff for transmission and dispatch The unified tanffs was at 0 5 kopeks/kWhInQ24) Revenues in 1997 represent NDC's results befhre its merger with UkTelectroperedacha.
-51 -
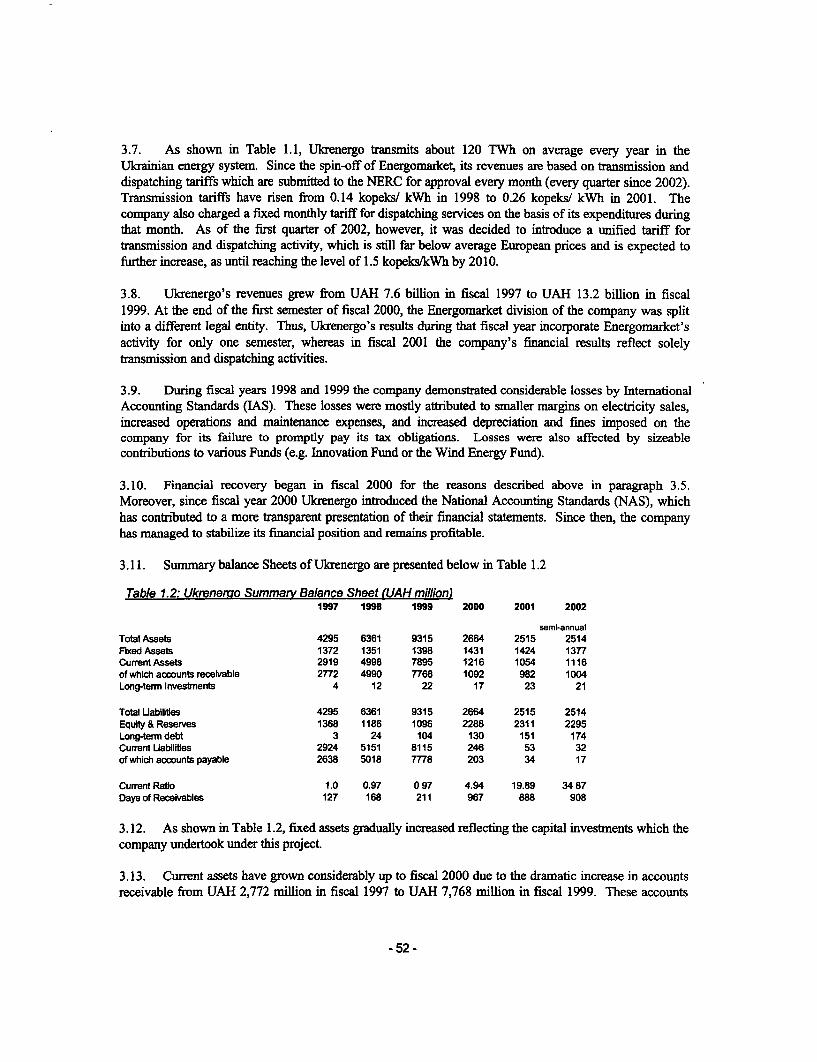
3.7. As shown in Table 1.1, Ukrenergo transmits about 120 TWh on average every year in theUkrainian energy system. Since the spin-off of Energomarket, its revenues are based on transmission anddispatching tariffs which are submitted to the NERC for approval every month (every quarter since 2002).Transmission tariffs have risen from 0.14 kopeks/ kWh in 1998 to 0.26 kopeks/ kWh in 2001. Thecompany also charged a fixed monthly tariff for dispatching services on the basis of its expenditures duringthat month. As of the first quarter of 2002, however, it was decided to introduce a unified tariff fortransmission and dispatching activity, which is still far below average European prices and is expected tofurther increase, as until reaching the level of 1.5 kopeks/kWh by 2010.
3.8. Ukrenergo's revenues grew from UAH 7.6 billion in fiscal 1997 to UAH 13.2 billion in fiscal1999. At the end of the first semester of fiscal 2000, the Energomarket division of the company was splitinto a different legal entity. Thus, Ukrenergo's results during that fiscal year incorporate Energomarket'sactivity for only one semester, whereas in fiscal 2001 the company's financial results reflect solelytransmission and dispatching activities.
3.9. During fiscal years 1998 and 1999 the company demonstrated considerable losses by InternationalAccounting Standards (IAS). These losses were mostly attributed to smaller margins on electricity sales,increased operations and maintenance expenses, and increased depreciation and fines imposed on thecompany for its failure to promptly pay its tax obligations. Losses were also affected by sizeablecontributions to various Funds (e.g. Innovation Fund or the Wind Energy Fund).
3.10. Financial recovery began in fiscal 2000 for the reasons described above in paragraph 3.5.Moreover, since fiscal year 2000 Ukrenergo introduced the National Accounting Standards (NAS), whichhas contributed to a more transparent presentation of their financial statements. Since then, the companyhas managed to stabilize its financial position and remains profitable.
3.11. Summary balance Sheets of Ukrenergo are presented below in Table 1.2
Table 1.2: Ukrenermo Summary Balance Sheet (UAH million)1997 1998 1999 2000 2001 2002
sem-annualTotal Assets 4295 6361 9315 2664 2515 2514Fixed Assets 1372 1351 1398 1431 1424 1377Current Assets 2919 4998 7895 1216 1054 1116of which accounts receivable 2772 4990 7768 1092 982 1004Long-term Investments 4 12 22 17 23 21
Total Uabilities 4295 6361 9315 2664 2515 2514Equity&Reserves 1368 1186 1096 2288 2311 2295Long-term debt 3 24 104 130 151 174Current Uabilifles 2924 5151 8115 246 53 32of which accounts payable 2638 5018 7778 203 34 17
Current Ratio 1.0 0.97 0 97 4.94 19.89 34 87Days of Receivables 127 168 211 967 888 908
3.12. As shown in Table 1.2, fixed assets gradually increased reflecting the capital investments which thecompany undertook under this project
3.13. Current assets have grown considerably up to fiscal 2000 due to the dramatic increase in accountsreceivable from UAH 2,772 million in fiscal 1997 to UAH 7,768 million in fiscal 1999. These accounts
-52 -
represent all the arrears accumulated in Energomarket from the distribution companies, which were notable to meet their obligations as they suffered from very low collection rates. After the spin-off ofEnergomarket in fiscal 2000, Ukrenergo was still left with considerable amounts of receivables equal toUAH 1,092 million or 967 days of sales. Improved collection rates, however, during the last 18 monthshave contributed to the gradual decrease of these receivables to UAH 982 million or 888 days of sales atthe end of fiscal 2001. Nevertheless, a sizeable part of those accounts should be considered doubtful andreclassified as an accrued expense in the company's Income Statement, as the auditors have suggested intheir reports.
3.14. Similarly, current liabilities have grown at very high rates up to fiscal 2000 due to an increase inaccounts payable, attributed to Energomarket's inability to pay the generation companies as long as themarket remained illiquid. Since then, however, and due to Ukrenergo's split from Energomarket, accountspayable were brought down to only UAH 34 million at the end of fiscal 2001 and further down to UAH 17million at the second quarter of fiscal 2002, compared to UAH 203 million in fiscal 2000. This decrease inaccounts payable demonstrates the company's ability to meet its requirements to suppliers and tocontractors in relation to this project.
3.15. The above developments in Ukrenergo's net current assets have resulted in the significantimprovement in the company's liquidity. Notably, at the end of the first semester of fiscal 2002, currentassets were 34 times greater than the company's current liabilities, whereas before the split fromEnergomarket the current ratio used to be lower than one.
IV. REVIEW OF FINANCIAI MANAGEMENT SYSTEMS
4.1. When the project was appraised in 1995, the two implementing agencies, NDC (currentlyUkrenergo) and DHE, still employed a cash accounting system with some elements of accrual accounting.More specifically, revenues were recorded in the income statement on a cash basis only after payment wasreceived, and costs associated with producing revenue were not booked until revenues arrived. Thisaccounting system - still based on Soviet accounting policies - had created serious problems in theevaluation of the financial performance of these two entities. Especially during periods when collectionrates were at low levels, the statutory accounts could seriously misstate financial performance. A relatedproblem was that neither of the compames tracked their receivables and payables on a dated basis, and thusthere was no basis for recognizing inflationary losses. Moreover, there was no recognition of uncollectibleor doubtful debt.
4.2. Since fiscal 1996, however, Ukrainian companies were required to apply new accounting standardsbased on accrual accounting (Ukrainian Accounting Regulations). Until fiscal 2000, the two projectimplementing agencies have maintained their accounting records in accordance with these new UkrainianAccounting Regulations (UAR). Nevertheless, there were still major differences from IntemationalAccounting Standards (IAS) that hindered the evaluation of the companies' financial performance. Forexample, costs, which should be recorded under IAS as cost of sales or general expenses, were oftenrecorded as "use of profit" or as direct charges to shareholders' equity under UAR.
4.3. To provide a more meaningful presentation of the two companies, the Bank had requiredmodifications of their historical financial statements in order to approximate IAS. In addition to theirfinancial statements, the beneficiaries were required to prepare project accounts identifying the sources anduses of funds in carrying out the project. Financial statements, records and project accounts for fiscalyears 1997, 1998, 1999, 2000 and 2001 have been audited by independent auditorsPricewaterhouseCoopers (for fiscal 1997) and KPMG (for the following years) based on IAS. The audit
- 53 -
reports also contained business recommendations and a separate opinion on the compliance by DHE andUkrenergo with the legal and financial covenants under the Bank loan.
4.4. Completion of the audits had often fallen behind schedule by several months - not complying thuswith the relevant loan covenant - until fiscal 2000, mainly due to considerable difficulties that the auditorsfaced in adjusting Ukrenergo's and DHE's records and statements from UAR to IAS. Especially duringthe first audits of fiscal years 1997 and 1998, the accounting personnel of the two beneficiaries were notfamiliar yet with the new accounting standards and still had considerable difficulties in comprehending theconcepts of accrual accounting. Gradually, however, the cooperation between the two parties improvedsignificantly and since fiscal 2000 the audit reports were released within six months of the end of eachfinancial year (with some delays in relation to Ukrenergo's audits).
4.5. On January 1, 2000, new National Accounting Standards (NAS) were introduced in Ukraine thatapproximated to a large extent IAS. Although there are still some differences between IAS and NAS, thefinancial statements of Ukrenergo and DHE during fiscal years 2000 and 2001 reflect to a large extent theirfinancial performance, which has further facilitated the auditors' task.
4.6. The accounting personnel of the two companies are trained in NAS through internal or externalworkshops and seminars organized either by the Ministry of Finance or the Ministry of Fuel and Energy.Moreover, they gain useful experience during the project auditing process carried out by KPMG.
V. TRANSITION ARRANGEMENTS FOR DHE and UE
1. In order to ensure transition to regular operations, DHE will pursue the following activities:
(a) Training of relevant staff at all hydropower plants with support from suppliers and DHE'squalified staff.
(b) Signing one year contracts with equipment suppliers, which can be extended, for servicing about70% of the project equipment for which guarantees have already expired.
(c) Carry out equipment tests to outline all operational modes and parameters as a basis forestablishing mandatory guidelines for equipment operations.
(d) Prepare designs for installing dam safety monitoring equipment on the remaining hydropowerplants following the experience at Kiev HPP.
(e) The following indicators will be registered periodically:
(i) oil leakages (quarterly)(ii) emergency outages (annually)(iii) electricity output (monthly)(iv) turbines efficiency (annually) - to be agreed with JSC "Turboatom"(v) allocations from the Wholesale Electricity Market (monthly)(vi) company debt service ratio - net revenue divided by debt service requirement (quarterly).
2. UE will pursue the following activities, by key types of project equipment:
Relay protection sets for HV transmission lines: work with supplier on (i) expanding the technical use of
- 54 -
the equipment, (ii) interconnecting technical processes with system control for improved information flowswithin Ukrenergo.
SCADA: (i) streamline interaction within UE units regarding SCADA use; (ii) integrate technological andbusiness processes; (iii) concentrate relevant SCADA experts in one SCADA operating unit; (iv) prepareguidelines for interaction between UE and wholesale electricity market (WEM) on SCADA matters; (v)train relevant staff.
Fiber optic cable: (i) sign a contract with a supplier for technical maintenance and staff training; (ii) obtainlicense for leasing fiber optic cable services; (iii) draw key additional connections to the existing fiber opticcommunication lines.
System Control and Monitoring at Dniester HPP: (i) sign a contract for service maintenance with supplier;(ii) establish additional control system for reactive capacity; (iii) install new protection sets for thetransmission lines:
2.1. The following UE indicators will be registered periodically:
(i) system frequency (monthly)(ii) emergency outages (monthly)(iii) allocations from the Wholesale Electricity Market (monthly)(iv) company debt service ratio - net revenue divided by debt service requirement (quarterly)(v) overall fuel consumption/savings in the sector (semi-annually)(vi) transmission losses (quarterly).
- 55 -

Annex 1. Key Performance Indicators/Log Frame Matrix
Outcome / Impact Indicators:
Indicator/Matrix Projected In last'PSR Actual/Latest EstimateImproved collechons In the power sector Cash collections Increased from 8-10% in
early 2000 to 94% in September 2002.Minimum System Frequency (Hz) 49 8 49 95Deviabons from the 50Hz target before Deviabons from the 50Hz target after projectproject +0.3 Hz and -0.8Hz. +1-0.05HzImproved efficiency, safety, quality and Improved efficiency, safety, quality andreliability of the performance of the power reliabildy of the performance of the powersystem. system
Improved connecbons capabilities with Improved connections capabilities withneighboring power systems neighboring power systems.4.3% increase in nominal effidiency of the 4 3% increase to 91 8% 4.3% increase to 91.8%rehabilitated turbines at Kiev HPP.3 5% increase in nominal efficiency of the 4.2% increase to 92 2% 4 2% increase to 92 2%rehabilitated turbines at Dnipro-1 HPP3 9% increase in nominal efficiency of the 4.1% increase to 83% 4.1% increase to 83%rehabilitated turbines the Kahovka HPP.Increase in operabng capacity of hydro plants 88.1 MW increase 88.1 MW increaseby 130 MW. (685 8 MW-total capacity of rehabiltated (685.8 MW -total installed capacity of
generating units reached for Kiev, Dnipro-l, rehabilitated generating units reached forand Kakhovka) Kiev, Dnipro-4, and Kakhovka)
Operatng capacity of a single generating unit 22.0 MW 22.0 MWat Kiev HPP at 19 9 MW at appraisal.Operatng capacity of a single generatng unit 72 MW 72 MWat Dnieper-1 HPP at 65 MW without project.Operabng capacity of a single generating unit 55 8 MW 55.8 MWat Kahovka HPP at 52 2 MW at appraisalImproved accounting prachtes of the prject Natonal accounting practices brought closeragencies Dniprohydroenergo and Ukrenergo. to lAS.Improved technological capabilities of the Know-how transferred through contractproject implementng agencies. implementation and relevant training from
suppliers.Improved environmental performance of the Eliminated oil leakages from the rehabiritatedKiev and Kahovka HPPs turbines at Kiev and Kahovka HPPs
-56-

Output Indicators:
IndicatorlMatrix Jad ii lasti PSR ActualLatestEstimateRehabilitated 23 turbines and 37 generators, Rehabilitated 16 turbines and generators:switch gear equipment and system control nine turbine/generator units at Kiev HPP, sixand monitoring at the Dnieper HPPs. unit at Dniproges-1 and 1 unit at Kahovka
Installed new environmentaly safe turbines HPP.with low pressure turbine runner oil seals. Rehabilitated switch gear equipment and
system control and monitoring at the DnieperHPPs.
Instalged new environmentally safe turbineswith low pressure turbine runner oil seals atKiev and Kahovka HPPs.
Computer dam safety monitoring system Yes Yesinstalled at Kiev HPP.Upgrade of the following key elements of the Upgrade of the folowing key elements of theUPS. UPS:
-communications systems; laid 1000 km -communications systems; laid 1160 kmnew fiber optic communications lines; new fiber optic oommunications lines;
-frequency regulaton, dispatch and -frequency regulation, dispatch andcontrol systems; control systems;
-relay protection devices of the main -relay protection devices of the maintransmission network transmission network.
Installed protection, management and control Instated protection, management and controlsystem at Dniester HPP. system at Dniester HPP.
End of projectA system capacity increase of 88.1MW was achieved at completion vs. expected 130 MW increase insystem capacity at appraisal. These results translate into 2% system capacity increase at completion vs.the expected 3% increase in system capacity at appraisal.
Nominal turbine efficiency at Kiev HPP rose by 4.3% as expected. Nominal efficiency increases atDnipro-l HPP and Kahovka HPP were higher than expected: 4.2% achieved vs. 3.5% planned at Dnipro-1HPP and 4.1% achieved vs. 3.9% planned at Kahovka HPP. These % increases are valid at rated ormaximum output. They were calculated in order to ensure a comparison with the nominal efficiencyparameters estimated at appraisal. Weighted average efficiencies were used in the economic analysispresented in Annex 3 in order to determine the increase in energy attributable to improved efficiency.
- 57-
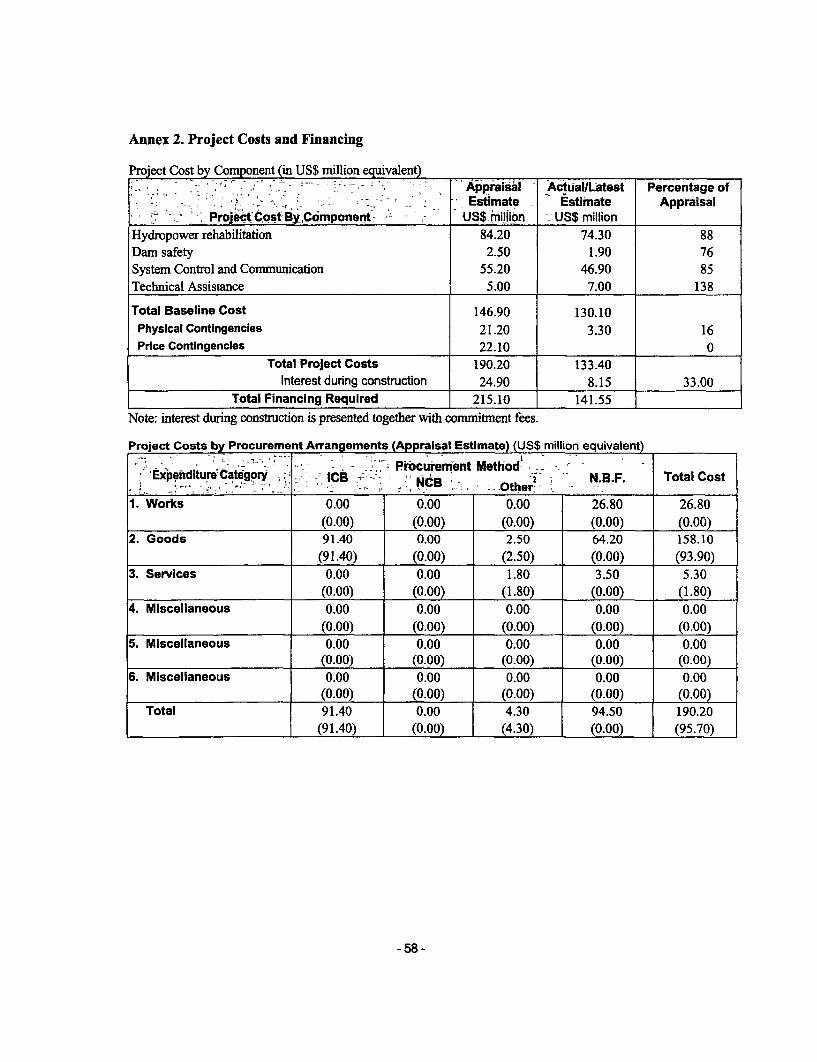
Annex 2. Project Costs and Financing
Project Cost by Component (in US$ million equivalent)Component Appraisai ActualILatest Percentage of
' L~t+"~- ' F>ath -- r,, = ' ' J ~7 | 'Estimate Estimnate Appraisal','.. ProjectJBy US$,m0iHion --US$ million
Hydropower rehabilitation 84.20 74.30 88Dam safety 2.50 1.90 76System Control and Communication 55.20 46.90 85Technical Assistance 5.00 7.00 138
Total Baseline Cost 146.90 130.10Physical Contingencies 21.20 3.30 16Price Contingencies 22.10 0
Total Project Costs 190.20 133.40Interest during construction 24.90 8.15 33.00
Total Financing Required 215.10 141.55Note: interest during construction is presented together with commitment fees.
Project Costs by Procurement Arrangements (Appraisal Estimate) (US$ million equivalent)
, , -,- - ',"~ ProcuFeremnt Method' -Expenditure Categoiy ICa NCB Ohe - Total Cost
1. Works 0.00 0.00 0.00 26.80 26.80(0.00) (0.00) (0.00) (0.00) (0.00)
2. Goods 91.40 0.00 2.50 64.20 158.10(91.40) (0.00) (2.50) (0.00) (93.90)
3. Services 0.00 0.00 1.80 3.50 5.30(0.00) (0.00) (1.80) (0.00) (1.80)
4. Miscellaneous 0.00 0.00 0.00 0.00 0.00(0.00) (0.00) (0.00) (0.00) (0.00)
5. Miscellaneous 0.00 0.00 0.00 0.00 0.00(0.00) (0.00) (0.00) (0.00) (0.00)
6. Miscellaneous 0.00 0.00 0.00 0.00 0.00(0.00) (0.00) (0.00) (0.00) (0.00)
Total 91.40 0.00 4.30 94.50 190.20(91.40) (0.00) (4.30) (0.00) (95.70)
-58 -

Project Costs by Procurement Arrangements (Actual/Latest Estimate) (US$ million equivalent)
Procurement Method'Expenditure Catego9ry - ll l NC B 2 N.8.F. Total Cost
NCB___ Othe r.
1. Works 0.40 0.00 0.00 10.10 10.50(0.40) (0.00) (0.00) (0.00) (0.40)
2. Goods . 72.55 0.00 0.00 43.35 115.90(72.55) (0.00) (0.00) (0.00) (72.55)
3. Services 1.40 0.00 0.00 5.60 7.00(1.40) (0.00) (0.00) (0.00) (1.40)
4. Miscellaneous 0.00 0.00 0.00 0.00 0.00(0.00) (0.00) (0.00) (0.00) (0.00)
5. Miscellaneous 0.00 0.00 0.00 0.00 0.00(0.00) (0.00) (0.00) (0.00) (0.00)
6. Miscellaneous 0.00 0.00 0.00 0.00 0.00(0.00) (0.00) (0.00) (0.00) (0.00)
Total 74.35 0.00 0.00 59.05 133.40(74.35) (0.00) (0.00) (0.00) (74.35)
Interest during construction (8.15)Total Bank Financing (82.50)
"Figures in parenthesis are the amounts to be financed by the Bank Loan. All costs include contingencies.
2/Equipment and Goods to be procured through Intemational Shopping (up to an aggregate amount of US$1.5 million)and Direct Contracting (up to an aggregate amount of US$ 1.0 million) and Procurement under Bank's Guidelines forUse of Consultants by World Bank Borrowers and by the World Bank as Executing Agency (August 1981).
N.B.F. = Non Bank Financing (Governments of Canada, Norway and Switzerland and local funds).
Project Financing by Component (in US$ million equivalent)- _ L --t t[ [L ,,_ / -- +||Sliz "' '' ""; '2- -"l 81 t-] ' IPercentage. of Appraisah
Component ~ Appraisal Estimate l .. Ata/et Estimate eBank Govt. CoF. Bank Govt. CoF. Bank Go'IG . CoF.
Hydropower rehabilitation 28.60 45.10 10.50 26.45 39.45 8.40 92.5 87 5 80.0Dam safety 1.60 0.90 0.00 1.40 0.55 0.00 87.5 61 1 0.0System Control and 41.80 13.40 0.00 41.80 5.05 0.00 100.0 37.7 0.0CommunicationsTechnical Assistance 1.80 0.80 2.40 1.40 2.70 2.90 77.8 337.5 120.8Physical contingencies 12.40 8.90 3.30 26.6 0.0Price contingencies 7.60 14 40 0.0 0.0Interest during 20.70 4.20 8.15 39.4 0.0constructionTotal Financing 114.00 87.70 12.90 82.50 47.75 11.30 72.4 54.4 87.6
- 59 -

Annex 3. Economic Costs and Benefits
This analysis provides a separate assessment of the two main project components: hydropower plantrehabilitation and power system control improvements, plus a combined assessment In addition, thehydropower plant rehabilitation component contains assessments of the eight individual hydropower plantson the Dnieper River - Kiev, Kiev PSP, Kanev, Kremenchug, Dnieper I and Dnieper H, Dniprodzerzhynskand Kakhovka. The present analysis also includes a comparison with the original analysis presented in theStaff Appraisal Report (SAR) of March 1995.
METHODOLOGY
The general approach is similar to that adopted in the SAR, i.e. the application of the discounted cash flowtechnique to 'with and without' project scenarios. An economic evaluation, based on incremental costs andbenefits was carried out for the two main project components and the project as a whole. The analysis atcompletion also included a separate valuation of environmental benefits, which were considered asintangible in the SAR. All figures in the analysis were expressed in constant 1996 US$, the year precedingthe first project investment
The SUMMARY OF RESULTS is shown in Tables 1 and 2 below:
Table 1.
Investment Cost (Smillion'96) NPV ($million'96) EIRRHydro Rehab $95.7 $21.87 13.0%System Control $52.0 $26.4 17.8%Dam Safety $2.2 NA NATechmncal Assistance $8.8 NA NATOTAL $158.6 $40.3*** 13.6%Total (incl. environmental $158.6 $95.9*** 17.8%benefits)
***Note that 'total' results include the cost of dam safety and technical assistance but allow for no related benefits.
Table 2.
EIRR (SAR) EIRR EIRR (incl. env.benefits(completion) (completion)
Hydro Rehab 17.0% 13.0% 16.2%System Control 22.7% 17.8% 23.8%TOTAL 18.1% 13.6% 177%
The differences in the EIRRs at appraisal and at completion resulted mainly from changes in the projectscope combined with a revised lower load forecast and a smaller impact of reliability and availabilityimprovements which altogether affected the corresponding project benefits in terms of energy and capacitygains. The most relevant changes in this regard were already discussed in section 4.3 of the ICR.
- 60 -
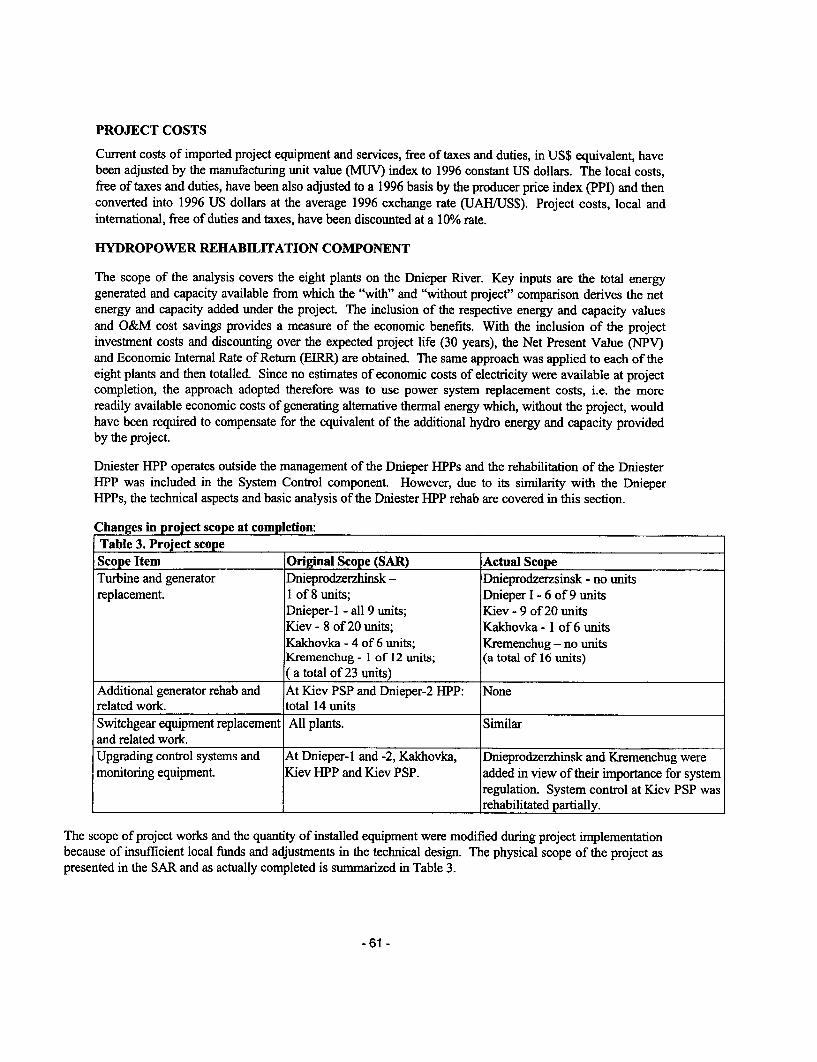
PROJECT COSTS
Current costs of imported project equipment and services, free of taxes and duties, in US$ equivalent, havebeen adjusted by the manufacturing unit value (MUV) index to 1996 constant US dollars. The local costs,free of taxes and duties, have been also adjusted to a 1996 basis by the producer price index (PPI) and thenconverted into 1996 US dollars at the average 1996 exchange rate (UAH/US$). Project costs, local andinternational, free of duties and taxes, have been discounted at a 10% rate.
H[YDROPOWER RERABILITATION COMPONENT
The scope of the analysis covers the eight plants on the Dnieper River. Key inputs are the total energygenerated and capacity available from which the "with" and "without project" comparison derives the netenergy and capacity added under the project. The inclusion of the respective energy and capacity valuesand O&M cost savings provides a measure of the economic benefits. With the inclusion of the projectinvestment costs and discounting over the expected project life (30 years), the Net Present Value (NPV)and Economic Internal Rate of Return (EIRR) are obtained. The same approach was applied to each of theeight plants and then totalled. Since no estimates of economic costs of electricity were available at projectcompletion, the approach adopted therefore was to use power system replacement costs, i.e. the morereadily available economic costs of generating alternative thermal energy which, without the project, wouldhave been required to compensate for the equivalent of the additional hydro energy and capacity providedby the project.
Dniester HPP operates outside the management of the Dnieper HPPs and the rehabilitation of the DniesterHPP was included in the System Control component. However, due to its similarity with the DnieperHPPs, the technical aspects and basic analysis of the Dniester HPP rehab are covered in this section.
Changes in project scope at completion:Table 3. Project scopeScope Item Original Scope (SAR) Actual ScopeTurbine and generator Dnieprodzerzhinsk - Dnieprodzerzsinsk - no unitsreplacement. 1 of 8 units; Dnieper I - 6 of 9 units
Dnieper-l - all 9 units; Kiev - 9 of 20 unitsKiev - 8 of 20 units; Kakhovka - 1 of 6 unitsKakhovka - 4 of 6 units; Kremenchug - no unitsKremenchug - 1 of 12 units; (a total of 16 units)(a total of 23 units)
Additional generator rehab and At Kiev PSP and Dnieper-2 HPP: Nonerelated work. total 14 unitsSwitchgear equipment replacement All plants. Similarand related work.Upgrading control systems and At Dnieper-I and -2, Kakhovka, Dnieprodzerzhinsk and Kremenchug weremonitoring equipment. Kiev HPP and Kiev PSP. added in view of their importance for system
regulation. System control at Kiev PSP wasrehabilitated partially.
The scope of project works and the quantity of installed equipment were modified during project implementationbecause of insufficient local funds and adjustments in the technical design. The physical scope of the project aspresented in the SAR and as actually completed is summarized in Table 3.
-61 -

Additional items included instalation of a dam safety monitoring system and technical assistance in improvingreservoir management and plant operation.
BENEFITS
The tangible benefits are sumnmarized below:
Improved efficiency of the generating equipment is primarily the result of the replacement turbineswhich are of more modem design. The replacements also provide as-new performance in contrast to thesignificantly poorer performance from the old units (typically the units replaced are over 40 years old).As a result, with the same water flow, energy is increased on average by about 3 to 8%"'.
* Increased capacity. The replacement turbines and upgraded generators generally increase theinstalled (maximum) capacity by 10 to 30%.
* Improved reliability and availability is largely attributable to the as-new physical condition ofthe replacement equipment - not only the turbines and generators but also transformers, circuitbreakers, switchgear and protection equipment.
* Improved management and control. The application of updated controls and managementsystems (including for reservoirs) together with related personnel training is expected to increasethe amount of energy and also enhance its timing and value relative to power system demands.Reduced O&M costs - due not only to the new equipment but also to the improved control andmonitoring systems which wiU optimize repairs and reduce labor requirements.
* Reduced environmental pollution associated with replacement of thermal generation withhydropower generation and HPP capacity.
The intangible benefits i.e. not quantified or valued here, are the improved safety and extended plant lifeand improvement of water quality in Dnieper river as a result of elimination of oil leakages from therehabilitated turbines into the river. For details on the context of the current analysis see Attachment 1 onDevelopment of the Ukraine Power System.
QUANTIFICATION OF BENEFITS
It is important to recognize that the benefits represent inherently small incremental improvements andcannot generaly be quantified precisely. In the SAR, for example, only the increased efficiency due to therehab (notably turbine runner replacement) was quoted specifically. All other benefits were simply reflectedin the assumed rates of performance (i.e. energy) loss over time. Moreover, even the increased turbineefficiency is not measured directly but has to be largely inferred from model test results. The presentapproach attempts to improve the analysis by quantifying each specific benefit but of necessity theassessment remains to a large extent judgmental.
Summary of quantified benefits: The overal increase in energy and guaranteed capacity under the projectis summarized in the folowing table:
-62 -

Table 4. Energy and capacity increase
Project Average Energy Increase in 2002 Increase In 2020Added (GWh/yr Energy Guaranteed/Firm Energy Guaranteed/Firmfrom 1998-2031) (GWhIyr) capacity (MW) (GWh/yr) capacity (MW)
Kiev PSP 1 <1 5 1 8Kiev 33 29 30 37 39Kanev 8 3 9 10 15Kremenchug 29 22 10 33 17Dniprodzerzhynsk 23 17 6 26 10Dnieper-I 123 116 68 136 86Dnieper-2 20 8 17 26 29Kakhovka 34 27 10 40 15Total 270 222 156 310 220Dniester*** 12 12 7 12 7
*** Although it is allocated to the System Control component, the Dniester hydro plant is included heresince the evaluation is similar to that for the other HPPs.
The overall increase in energy and guaranteed capacity at completion has resulted from the followingcombined impacts of the HPPs' rehabilitation:
1. Testing-based efficiency improvements of 8.2.% at Dnieper-1; 3% at Kiev and 3.4% at KahovkaHPP.
2. Additional energy output of 107 GWh/year due to improved turbine and generator efficiency.
3. Increase of installed capacity by 88.1MW (an average increase of 14% on the original capacity ofthe rehabbed units) due to the upgrade of the 16 units of turbines and generators. Under the criticalconditions prevailing in winter (generally lower heads) the capacity increase as a result of the project islimited to 73MW when system demand is at a maximum. However, during the periods of maximum dailyload of the power system (morning and evening hours) the whole additional capacity of the rehabilitatedunits could be used for about 30 minutes to one - two hours)
4.. Improved reliability and availability resulting in:
a/ lower loss of capacity at 0.2% per year from the fully rehabilitated units, compared with a 0.5%capacity loss from units without rehabilitation;
b/ lower annual loss of capacity of 0.4% from units with partial upgraded equipment only,compared with a 0.5% capacity loss from units without rehabilitation;
c/ lower 0.1% loss of energy output per year from the fully rehabilitated units, compared with a0.2% loss of energy output from units without rehabilitation;
d/ lower annual 0.15% loss of energy output from units with upgraded equipment only, comparedwith a 0.2% loss of energy output from units without rehabilitation.
- 63 -

5. Improved operations of the power plants leading to a 1.5% increase of energy generation at the 5plants with a complete system upgrade: (Kiev, Dnieper-1, Dniprodzerzhynsk, Kremenchug, and Kakhovka)and a smaller 0.3% increase for the plants with a partial system upgrade: Kiev PSP, Dnieper-2 and newswitchgear at Kanev HPP.
Details of the quantification of the project benefits are presented in Attachment 2.
BENEFIT VALUES'
The main quantifiable benefits are the additional energy and capacity obtained under the project Theadditional hydro energy was valued as the cost savings resulting from replacing the equivalent energyoutput with a combination of a gas and coal/gas fired plant (there is only minimal generation with oil).
The equivalent fuel cost savings are assessed at 2.33c/kWh in 2001, increasing progressively to 2.83c/kWhin 2010, and remaining constant thereafter. Both values are averages for the Dnieper HPPs; addingvariable O&M, the respective values are 2.68 and 3.18c/kWh.
The fuel costs used to estirate the cost savings from replacing thermal energy with additional hydro energyunder the project are presented in Attachment 4.
The additional hydro capacity was valued as the cost of the avoided installation of new gas turbinecapacity which would be needed without the project to meet system peaking demand after 2012 as per thelatest estimate of the electricity demand and the least cost investment plan for the system. The adopted costfor gas turbine (GT) was $375/kW plus 15% for the lower reliability of GT compared to hydro turbines.
Benefits from installing dam safety monitoring equipment at Kiev dam were not quantified and notincluded in the economic analysis because it has not been practical to assign any specific probability offailure - either to the situation prevailing prior to the implementation of the safety monitoring program or inthe context of the expected reduced risk attributable to the new monitoring system. However, the monetaryvalue of downstream damage in the event of a catastrophic failure of Kiev HPP has been estimated to be ofthe order of US$3.5 billion - excluding any value allowed for loss of life or human injury. The populationimmediately at risk downstream is about 100,000. In this context, although no economic benefit can bequantified, the benefit is nonetheless real and substantial - certainly some millions of dollars on a presentvalue basis.
The main environmental benefits were derived from the reduction in polluting emissions attributable tothe reduction in energy generated from thermal plants replaced by the added hydro energy. Three harmfulpollutants have been identified: sulphur dioxide (S02), nitrous oxide (NOX) and carbon dioxide (C02).Data from thermal plants in Ukraine has established representative amounts of these emissions. Thebenefits associated with reducing S02 and NOX emissions have been valued at the correspondingmitigation costs, based on the results in the (Global Environmental Facility) GEF Klaipeda GeothermalDemonstration Project, Report No. 14614 LT. The benefit of reducing C02 emissions was based onestimates provided by the Prototype Carbon Fund (PCF). The results are shown in Table 5. Ukraine iseligible to participate in carbon emissions trade and therefore can directly benefit from reductions in (C02)emissions.
-64-

Table 5. Valuation of emissions reduction
Emission S02 NOX C02Average rates of emission (g/kWh)Coal 12.5 3 1143Gas 13.7 3.4 444Benefit Values ($/t of emission) $600 $250 $3Average unit benefit for 60/40 coal/gas 0.78 0.08 0.26split (c/kWh)
Net present value ($M in 1996) $14 $1 $14
The net present value of the three types of emissions totals $29 million, a little more than the NPV of theproject without allowing for emissions. (See spreadsheet table 3). The benefit from reducing carbonemissions is expected to increase at some 10% annually, thus offsetting the impact of economicdiscounting. The environmental benefits have been additionally enhanced by the non-quantified benefit frominstalling environmentally safe turbine runners, and the subsequent elimination of oil leakages into theDnieper river from these turbines, thus improving the water quality. See details on load forecast andvaluation of project benefits in Attachments 3 and 4.
BASIC RESULTS
The numerical analysis is performed in a series of spreadsheets including one for each HPP and severalsummary sheets. All of the key input parameters such as efficiency improvements, performance loss rates,energy values and emission parameters etc. are provided in the spreadsheet table 4 on Input Parameters andSummary of Results. In the results spreadsheets the economic benefits are summarized under fourcategones: added energy, added capacity, O&M cost savings and environmental benefits. Annual valuesare tabulated from 1997 to 2031 allowing for a 30-year evaluation period from project completion in 2002(capacity benefits were valued only for 20 years to 2020). Economic viability is defined by two resultingvalues: the Net Present Value (NPV) in US$ as discounted to 1996 (the year immediately before the firstproject investment) at the reference discount rate of 10%, and the Economic Intemal Rate of Return(EIRR). These results are also quoted both with and without environmental benefits.
The results obtained with the base case input parameters (see spreadsheet table 4 on Input Pararneters) aresummarized in table 6 below:
Table 6. Summary results of HPPs rehabilitation
Project Investment Cost NPV (excl. EIRR (excd. EIRR (with Average Added($million environmental environmental environmental Energy (GWh/yr
undiscounted) benefits $M) benefits) benefits) 1998-2030)Kiev PSP $1.5 -$0.0 9.7% 10.4% 1Kiev $28.9 -$5.7 (negative) or 69% (or -10%) 9% 33
(-so 0)Kanev $2.1 $1.22 14.3% 16.1% 8Kremenchug $10.9 $0 5 10.6% 13.7% 29Dmprodzerzynsk $6.6 $2 08 15.1% 20.2% 23Dnieper I $34.8 $15.9 15.9% 20.1% 123Dnieper 2 $2.8 $4.5 23.9% 27 8% 20Kakhovka $8.0 $3.3 15.6% 20.2% 34Subtotal $95.7 $21.9 13.0% 16.2% 270Dniester $5.6 $0.6 11 7% 14.9% 11
- 65 -
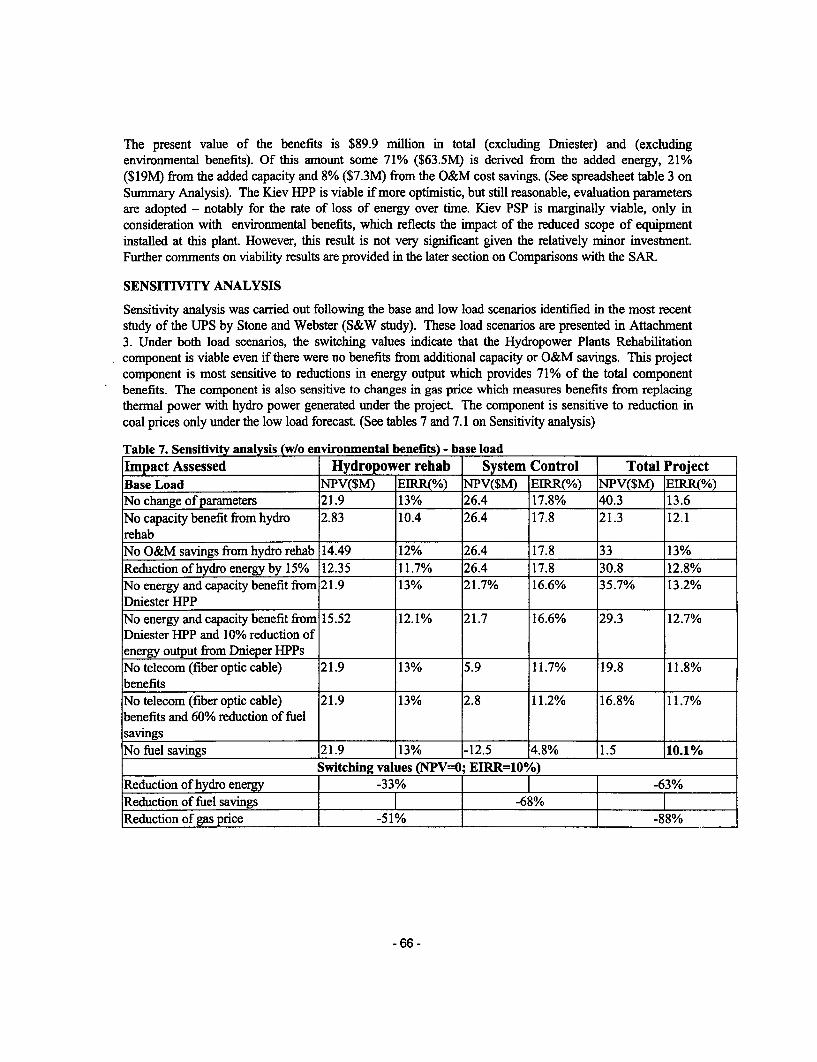
The present value of the benefits is $89.9 million in total (excluding Dniester) and (excludingenvironmental benefits). Of this amount some 71% ($63.5M) is derived from the added energy, 21%($19M) from the added capacity and 8% ($7.3M) from the O&M cost savings. (See spreadsheet table 3 onSumrnary Analysis). The Kiev HPP is viable if more optimistic, but still reasonable, evaluation parametersare adopted - notably for the rate of loss of energy over time. Kiev PSP is marginally viable, only inconsideration with environmental benefits, which reflects the impact of the reduced scope of equipmentinstalled at this plant. However, this result is not very significant given the relatively minor investment.Further comments on viability results are provided in the later section on Comparisons with the SAR.
SENSITIVITY ANALYSIS
Sensitivity analysis was carried out following the base and low load scenarios identified in the most recentstudy of the UPS by Stone and Webster (S&W study). These load scenarios are presented in Attachment3. Under both load scenarios, the switching values indicate that the Hydropower Plants Rehabilitationcomponent is viable even if there were no benefits from additional capacity or O&M savings. This projectcomponent is most sensitive to reductions in energy output which provides 71% of the total componentbenefits. The component is also sensitive to changes in gas price which measures benefits from replacingthermal power with hydro power generated under the project. The component is sensitive to reduction incoal prices only under the low load forecast. (See tables 7 and 7.1 on Sensitivity analysis)
Table 7. Sensitivity analysis (w(o environmental benefits) - base loadImpact Assessed Hydropower rehab System Control Total ProjectBase Load NPV($M) EIRR(%) NPV($M) EIRR(%) NPV($M) EIRR(%)No change of parameters 21.9 13% 26.4 17.8% 40.3 13.6No capacitybenefit from hydro 2.83 10.4 26.4 17.8 21.3 12.1rehabNo O&M savings from hydro rehab 14.49 12% 26.4 17.8 33 13%Reduction of hydro energy by 15% 12.35 11.7% 26.4 17.8 30.8 12.8%No energy and capacity benefit from 21.9 13% 21.7% 16.6% 35.7% 13.2%Dniester HPPNo energy and capacity benefit from 15.52 12.1% 21.7 16.6% 29.3 12.7%Dniester HPP and 10% reduction ofenergy output from Dnieper HPPsNo telecom (fiber optic cable) 21.9 13% 5.9 11.7% 19.8 11.8%benefitsNo telecom (fiber optic cable) 21.9 13% 2.8 11.2% 16.8% 11.7%benefits and 60% reduction of fuelsavingsNo fuel savings 21.9 13% -12.5 4.8% 1.5 10.1%
S Switching values (NPV=C; EIRR=10%)Reduction of hydro energy -33% if -63%Reduction of fuel savings l -68% l
Reduction of gas price -51% -88%
-66 -

Table 7.1 Sensitivity analysis (w/o envronmental benefits) - low loadImpact Assessed Hydropo er rehab System Control Total ProjectLow Load NPV($M) EIRR(%) NPV($M) EIRR(%/°) NPV($M) EIRR(%)No change of parameters 11.74 11.6% 25.9 17.7% 29.8 12.7No capacity benefit from hydro 1.58 10.2% 25.9 17.7% 19.6 11.9%rehabNo O&M savings from hydro rehab 4.36 10.6% 25.9 17.7% 22.4 12%Reduction of hydro energy by 15% 2.41 10.3% 25.9 17.7% 20.4 11.9%No energy and capacity benefit from 11.74 11.6% 21.7% 16.6% 25.5 12.3%Dniester HPPNo energy and capacity benefit from 5.52 10.7% 21.7 16.6% 19.3 11.8%Dniester HPP and 10% reduction ofenergy output from Dnieper HPPsNo telecom (fiber optic cable) 11.74 11.6% 5.4 11.5% 9.2 10.8%benefits
No telecom (fiber optic cable) 11.74 11.6% 2.4 10.9% 6.2% 10.6%benefits and 60% reduction of fuelsavings
Switching values (NPV=0; EIRR-10o%)Reduction of hydro energy -19% 1 -52%Reduction of fuel savings I -65%Reduction of gas price -28% -68%Reduction of coal price -82%
COMPARISON WITH THE SAR
The most significant viability factors at project completion which differ from those adopted in the SAR are(i) a longer project evaluation period; (ii) a reduced physical scope; (iii) a lower load forecast; (iv) reducedadded energy in terms of lower energy and capacity gains from enhanced reliability and availability of theHPPs; (v) higher fuel prices; (vi) larger initial O&M savings increasing at a lower rate.
The key viability factors discussed above have similar quantitative impacts:a/ The longer evaluation period (30 versus 20 years) and higher fuel prices both improve
viability.b/ The reduced project scope, lower load forecast (and consequent delayed capacity benefits)
and reduced added energy (due to the lower loss factors) all have an adverse effect on viability.
In addition, the conversion of current project costs to 1996 base equivalent resulted in a higher US$equivalent which affected the EIRR levels, as described below:
c/ The appreciation of the US$ since 1996 has resulted in a higher US$ equivalent of theforeign project costs in 1996 terms (adjusted by the MUV index), compared with current US$ equivalent.
d/ During the same period, the higher rate of devaluation of the UAH, relative to theapplicable domestic rate of inflation (PPI), also lead to a higher US$ (1996) equivalent of local costrelative to the current US$ equivalent. See Table 8:
-67-
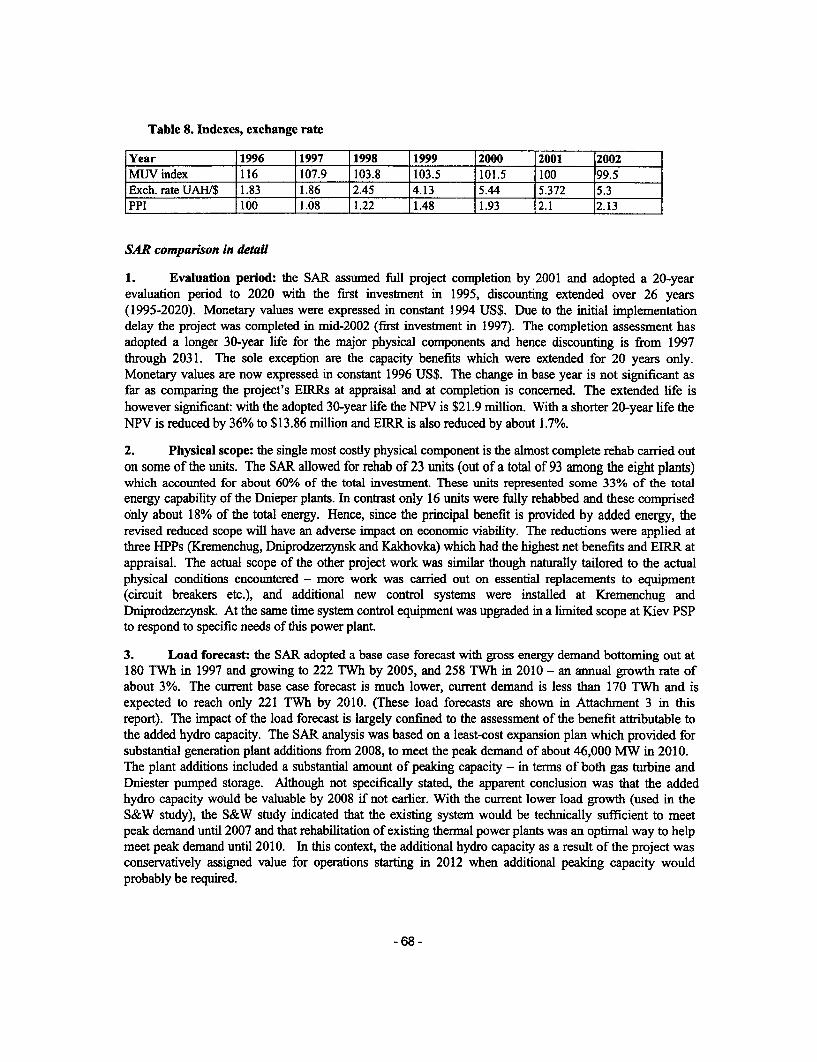
Table 8. Indexes, exchange rate
Year 1996 11997 1998 1999 2000 2001 2002MUV index 116 107.9 103.8 103.5 101.5 100 99.5Exch. rate UAH/$ 1.83 1.86 2.45 4.13 15.44 5.372 15.3PPI 100 1.08 1.22 1.48 1.93 2.1 2.13
SAR comparison in detail
1. Evaluation period: the SAR assumed full project completion by 2001 and adopted a 20-yearevaluation period to 2020 with the first investment in 1995, discounting extended over 26 years(1995-2020). Monetary values were expressed in constant 1994 US$. Due to the initial implementationdelay the project was completed in mid-2002 (first investment in 1997). The completion assessment hasadopted a longer 30-year life for the major physical components and hence discounting is from 1997through 2031. The sole exception are the capacity benefits which were extended for 20 years only.Monetary values are now expressed in constant 1996 US$. The change in base year is not significant asfar as comparing the project's ELRRs at appraisal and at completion is concemed. The extended life ishowever significant: with the adopted 30-year life the NPV is $21.9 million. With a shorter 20-year life theNPV is reduced by 36% to $13.86 million and EIRR is also reduced by about 1.7%.
2. Physical scope: the single most costly physical component is the almost complete rehab carried outon some of the units. The SAR allowed for rehab of 23 units (out of a total of 93 among the eight plants)which accounted for about 60% of the total investment These units represented some 33% of the totalenergy capability of the Dnieper plants. In contrast only 16 units were fully rehabbed and these comprisedonly about 18% of the total energy. Hence, since the principal benefit is provided by added energy, therevised reduced scope will have an adverse impact on economic viability. The reductions were applied atthree HPPs (Kremenchug, Dniprodzerzynsk and Kakhovka) which had the highest net benefits and EIRR atappraisal. The actual scope of the other project work was similar though naturally tailored to the actualphysical conditions encountered - more work was carried out on essential replacements to equipment(circuit breakers etc.), and additional new control systems were installed at Kremenchug andDniprodzerzynsk. At the same time system control equipment was upgraded in a limited scope at Kiev PSPto respond to specific needs of this power plant.
3. Load forecast: the SAR adopted a base case forecast with gross energy demand bottoming out at180 TWh in 1997 and growing to 222 TWh by 2005, and 258 TWh in 2010 - an annual growth rate ofabout 3%. The current base case forecast is much lower, current demand is less than 170 TWh and isexpected to reach only 221 TWh by 2010. (These load forecasts are shown in Attachment 3 in thisreport). The impact of the load forecast is largely confined to the assessment of the benefit attributable tothe added hydro capacity. The SAR analysis was based on a least-cost expansion plan which provided forsubstantial generation plant additions from 2008, to meet the peak demand of about 46,000 MW in 2010.The plant additions included a substantial amount of peaking capacity - in terms of both gas turbine andDniester pumped storage. Although not specifically stated, the apparent conclusion was that the addedhydro capacity would be valuable by 2008 if not earlier. With the current lower load growth (used in theS&W study), the S&W study indicated that the existing system would be technically sufficient to meetpeak demand until 2007 and that rehabilitation of existing thermal power plants was an optimal way to helpmeet peak demand until 2010. In this context, the additional hydro capacity as a result of the project wasconservatively assigned value for operations starting in 2012 when additional peaking capacity wouldprobably be required.
-68 -
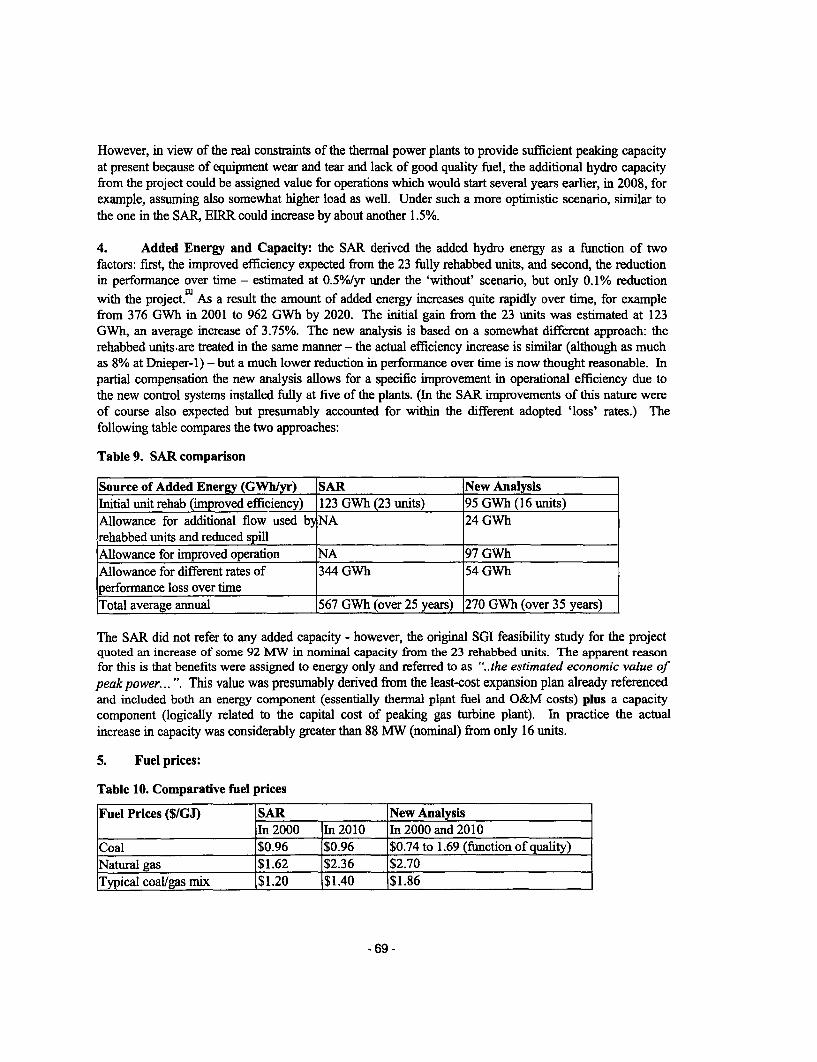
However, in view of the real constraints of the thermal power plants to provide sufficient peaking capacityat present because of equipment wear and tear and lack of good quality fuel, the additional hydro capacityfrom the project could be assigned value for operations which would start several years earlier, in 2008, forexample, assuming also somewhat higher load as well. Under such a more optimistic scenario, similar tothe one in the SAR, EIRR could increase by about another 1.5%.
4. Added Energy and Capacity: the SAR derived the added hydro energy as a function of twofactors: first, the improved efficiency expected from the 23 fully rehabbed units, and second, the reductionin performance over time - estimated at 0.5%/yr under the 'without' scenario, but only 0.1% reductionwith the project.w As a result the amount of added energy increases quite rapidly over time, for examplefrom 376 GWh in 2001 to 962 GWh by 2020. The initial gain from the 23 units was estimated at 123GWh, an average increase of 3.75%. The new analysis is based on a somewhat different approach: therehabbed units.are treated in the same manner - the actual efficiency increase is similar (although as muchas 8% at Dnieper-1) - but a much lower reduction in performance over time is now thought reasonable. Inpartial compensation the new analysis allows for a specific improvement in operational efficiency due tothe new control systems installed fully at five of the plants. (In the SAR improvements of this nature wereof course also expected but presumably accounted for within the different adopted 'loss' rates.) Thefollowing table compares the two approaches:
Table 9. SAR comparison
Source of Added Energy (GWh/yr) SAR New AnalysisInitial unit rehab (improved efficiency) 123 GWh (23 units) 95 GWh (16 units)Allowance for additional flow used b NA 24 GWhrehabbed units and reduced spillAllowance for improved operation NA 97 GWhAllowance for different rates of 344 GWh 54 GWhperformance loss over timeTotal average annual 567 GWh (over 25 years) 270 GWh (over 35 years)
The SAR did not refer to any added capacity - however, the original SGI feasibility study for the projectquoted an increase of some 92 MW in nominal capacity from the 23 rehabbed units. The apparent reasonfor this is that benefits were assigned to energy only and referred to as "..the estimated economic value ofpeak power... ". This value was presumably derived from the least-cost expansion plan already referencedand included both an energy component (essentially thermal plant fuel and O&M costs) plus a capacitycomponent (logically related to the capital cost of peaking gas turbine plant). In practice the actualincrease in capacity was considerably greater than 88 MW (nominal) from only 16 units.
5. Fuel prices:
Table 10. Comparative fuel prices
Fuel Prices ($/GJ) SAR New AnalysisIn 2000 Iln 2010 In 2000 and 2010
Coal $0.96 $0.96 $0.74 to 1.69 (function of quality)Natural gas $1.62 $2.36 $2.70Typical coal/gas mix $1.20 $1.40 $1.86
- 69 -
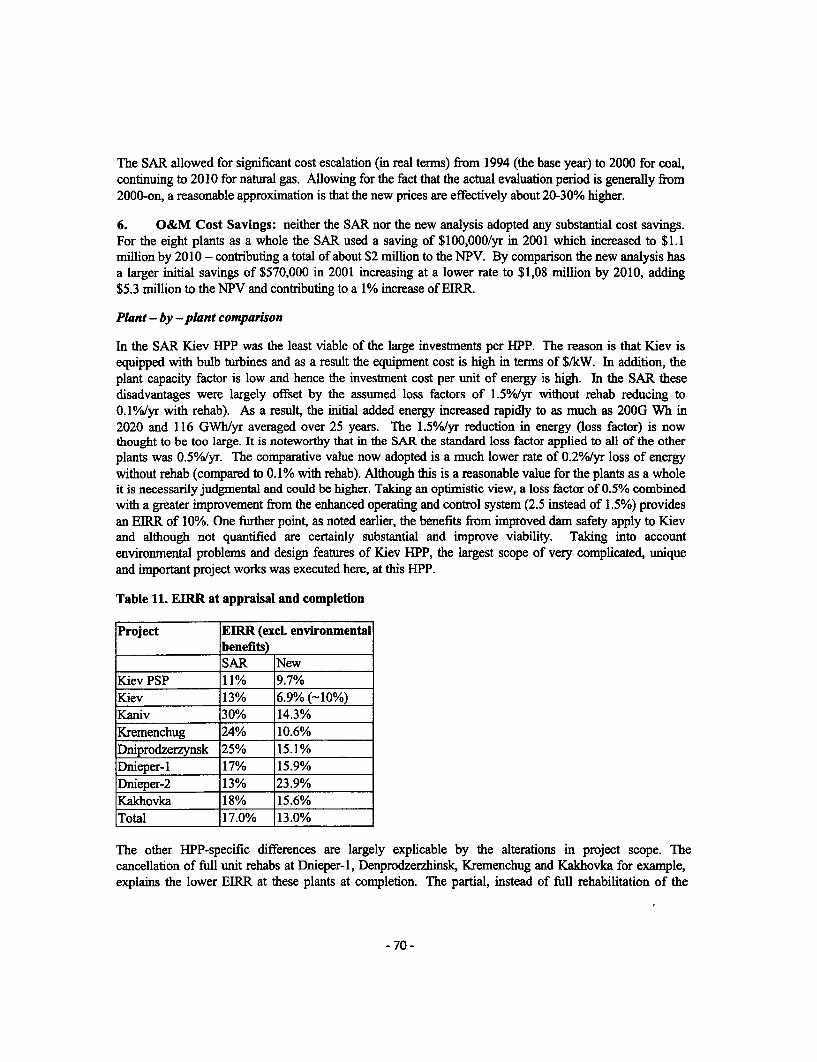
The SAR allowed for significant cost escalation (in real terms) from 1994 (the base year) to 2000 for coal,continuing to 2010 for natural gas. Allowing for the fact that the actual evaluation period is generally from2000-on, a reasonable approximation is that the new prices are effectively about 20-30% higher.
6. O&M Cost Savings: neither the SAR nor the new analysis adopted any substantial cost savings.For the eight plants as a whole the SAR used a saving of $100,000/yr in 2001 which increased to $1.1million by 2010 - contributing a total of about $2 million to the NPV. By comparison the new analysis hasa larger initial savings of $570,000 in 2001 increasing at a lower rate to $1,08 rnillion by 2010, adding$5.3 million to the NPV and contributing to a 1% increase of EIRR.
Plant - by -plant comparison
In the SAR Kiev HPP was the least viable of the large investments per HPP. The reason is that Kiev isequipped with bulb turbines and as a result the equipment cost is high in terms of $/kW. In addition, theplant capacity factor is low and hence the investment cost per unit of energy is high. In the SAR thesedisadvantages were largely offset by the assumed loss factors of 1.5%/yr without rehab reducing to0.10/o/yr with rehab). As a result, the initial added energy increased rapidly to as much as 200G Wh in2020 and 116 GWh/yr averaged over 25 years. The 1.5%/yr reduction in energy (loss factor) is nowthought to be too large. It is noteworthy that in the SAR the standard loss factor applied to all of the otherplants was 0.5 0/o/yr. The comparative value now adopted is a much lower rate of 0.20/o/yr loss of energywithout rehab (compared to 0.1% with rehab). Although this is a reasonable value for the plants as a wholeit is necessarily judgmental and could be higher. Taking an optimistic view, a loss factor of 0.5% combinedwith a greater improvement from the enhanced operating and control system (2.5 instead of 1.5%) providesan EIRR of 10%. One further point, as noted earlier, the benefits from improved dam safety apply to Kievand although not quantified are certainly substantial and improve viability. Taking into accountenvironmental problems and design features of Kiev HPP, the largest scope of very complicated, uniqueand important project works was executed here, at this HPP.
Table 11. EIRR at appraisal and completion
Project EIRR (excl. environmentalbenefits)SAR New
Kiev PSP 11% 9.7%Kiev 13% 6.9% (-10%)Kaniv 30% 14.3%Kremenchug 24% 10.6%Dniprodzerzynsk 25% 15.1%Dnieper-I 17% 15.9%Dnieper-2 13% 23.9%Kakhovka 18% 15.6%Total 17.0% 13.0%
The other HPP-specific differences are largely explicable by the alterations in project scope. Thecancellation of full unit rehabs at Dnieper-l, Denprodzerzhinsk, Kremenchug and Kakhovka for example,explains the lower EIRR at these plants at completion. The partial, instead of full rehabilitation of the
-70 -

system control at Kanev and Kiev PSP has been reflected in the lower EIRR at this power plant. Lowerenergy and capacity gains from improved operations have led to lower EIRR at Kanev BPP. The higherEIRR at Dniper-2 at completion can be mainly attributed to the impact of installing more equipment thanplanned. -
SYSTEM CONTROL COMPONENT
BENEFITS
At appraisal
The sole benefit quantified in the SAR was the fuel saving which was assessed (conservatively) at 0.9%of the total annual fuel consumed in the UPS - excluding nuclear fuel. On completion in 2000 the savingwas quoted as $12.6 million from a total fuel cost of $1,402 million (for 108.6 TWh i.e. at an average of1.29 c/kWh). If expressed as an energy equivalent, the savings amounted to 980 GWh. As the loaddemand grows, including the thermal plant portion, the saving increases to $19.8 million by 2020.'
The evaluation period extended from 1995 (first investment) to 2000 (completion) and for 20 yearsthereafter. Intangible benefits were cited as increased system stability and reliability, improved frequencycontrol and facilitation of future interconnections with neighboring power pools.
At completion
As in the SAR, the principal benefit in the completion analysis is derived from the reduction in fuel costsattributable to improved operations. The fuel savings were now estimated directly by calculating the resultsof:
* Improved allocation of spinning reserve - with the largest unit (nuclear) of 1,000 MW, the sameamount of spinning reserve is typically allocated among the thermal units on-line. Previously this wasdone manually and now that an automatic dispatch is possible, a saving of about 4% of the fuelrequired (equivalent to about 15 tonnes/hour of standard fuel) is expected. Since the full 1,000 MW ofreserve is typically required about two thirds of the time this now amounts to about 87,600 tonnes/year(equivalent to 225 GWh).
nImproved frequency control - this is estimated to reduce fuel consumption by about 0.9%,applicable to some 2,000 MW of thernal capacity that is typically affected. The net savings isestimated at 35,300 tonnes/year of standard fuel (equivalent to 90 GWh). This is only a portion of thesavings expected when full automatic frequency control is applied - as noted earlier some key work inthis area was cancelled.
The most common fuel used by the affected plants is a 70/30 raw coal/gas mix. With the fuel costs asdescribed earlier under Hydro Rehab ($1.86/GJ equivalent to 1.8 c/kWh) the annual saving is $5.7 million.This amounts to about 0.4% of the normal thermal fuel cost for the entire system. This is now regarded asa conservative estimate of the savings which are expected to stay more-or-less constant over the 20 yearevaluation period - barring any change in fuel prices.
-71 -
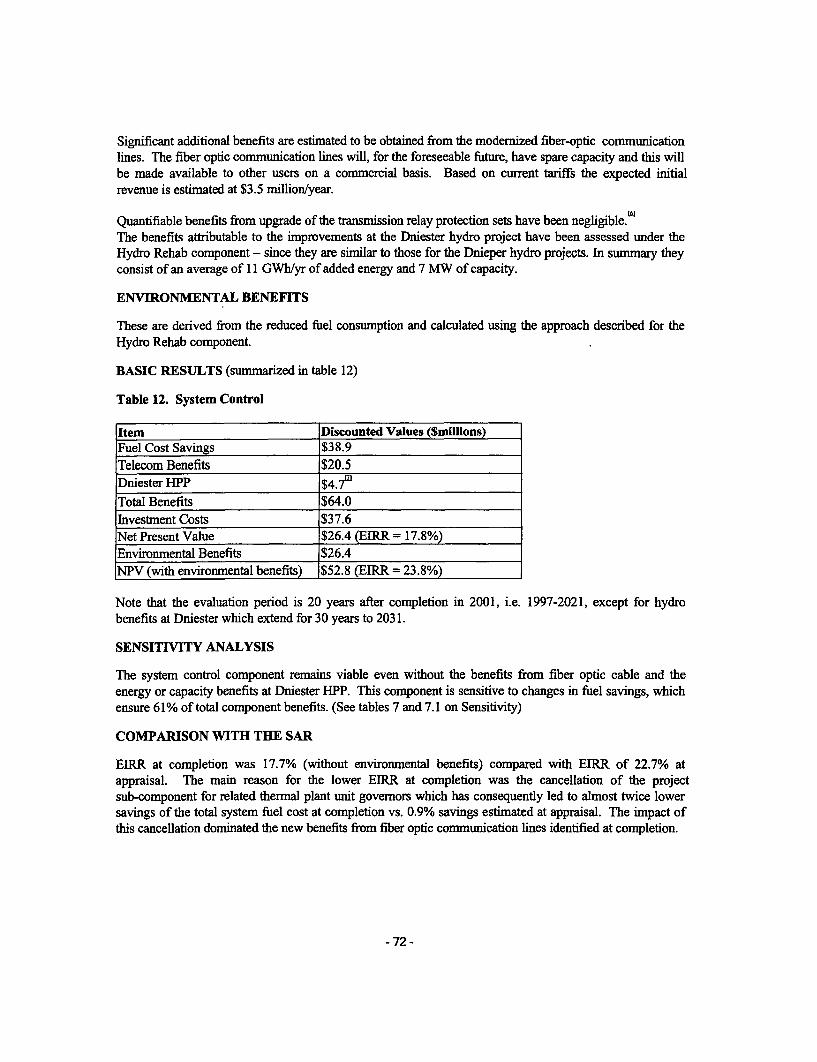
Significant additional benefits are estimated to be obtained from the modernized fiber-optic communicationlines. The fiber optic communication lines will, for the foreseeable future, have spare capacity and this willbe made available to other users on a commercial basis. Based on current tariffs the expected initialrevenue is estimated at $3.5 million/year.
Quantifiable benefits from upgrade of the transmission relay protection sets have been negligible.The benefits attributable to the improvements at the Dniester hydro project have been assessed under theHydro Rehab component - since they are similar to those for the Dnieper hydro projects. In summary theyconsist of an average of 11 GWh/yr of added energy and 7 MW of capacity.
ENVIRONMENTAL BENEFITS
These are derived from the reduced fuel consumption and calculated using the approach described for theHydro Rehab component.
BASIC RESULTS (summarized in table 12)
Table 12. System Control
Item Discounted Values ($millions)Fuel Cost Savings $38.9Telecom Benefits $20.5Dniester HPP $4.7'Total Benefits $64.0Investment Costs $37.6Net Present Value $26.4 (EIRR = 17.8%)Environmental Benefits $26.4NPV (with environmental benefits) $52.8 (EIRR = 23.8%)
Note that the evaluation period is 20 years after completion in 2001, i.e. 1997-2021, except for hydrobenefits at Dniester which extend for 30 years to 2031.
SENSITIVITY ANALYSIS
The system control component remains viable even without the benefits from fiber optic cable and theenergy or capacity benefits at Dniester HPP. This component is sensitive to changes in fuel savings, whichensure 61% of total component benefits. (See tables 7 and 7.1 on Sensitivity)
COMPARISON WITH THE SAR
EIRR at completion was 17.7% (without environmental benefits) compared with EIRR of 22.7% atappraisal. The main reason for the lower EIRR at completion was the cancellation of the projectsub-component for related thermal plant unit govemors which has consequently led to almost twice lowersavings of the total system fuel cost at completion vs. 0.9% savings estimated at appraisal. The impact ofthis cancellation dominated the new benefits from fiber optic communication lines identified at completion.
- 72-
ATTACHMENTS
Attachment 1. Development of the Ukraine Power System
Before the break-up of the Soviet Union the lJkraine Power System (UPS) operated as an integralcomponent of the Soviet system. Most of the generation was provided by thermal plants, largely coal firedand nuclear. Some 4,700 MW of hydropower provided peak power and additional peaking capacity wasexpected from a 2,200 MW pumped storage plant under construction on the Dniester River. Following theindependence of Ukraine, electricity generation has dropped more-or-less continuously in line with domesticdemand and the system was finally separated from Russia in 1993. At present the power system has aninstalled capacity of about 50,000 MW: 30,000 MW of thermal, 12,000 MW nuclear and 4,700 MW ofhydro plus lesser amounts of industrial and combined heat and power plants. Generation in 2000 totalled167,000 GWh with a peak demand of about 29,000 MW - a load factor of 67%. Generation in 2001 was169,000 GWh.
The system demand features a marked seasonal variation with a winter peak and relatively high daily loadfactors. During the winter with relatively low flows, the HPPs operate purely in a peaking role at 15/20%capacity factor and usable capacity can be constrained by the available energy.
The HPPs are used to meet as much of the daily load variation as possible, which results in part from thepoor operating flexibility of most of the thermal plants.
Current planning over the medium-term is based on the retirement from service of some of the leastefficient and oldest thermal plants, rehabilitation of over 9,000 MW of existing thermal plants and theirconversion to more efficient coal-only fuel (at present most of the plants have to bum a mix of coal and gasdue to a combination of poor quality coal and substandard conditions). Most of the existing nuclear plantswill also be rehabbed and some 2,000 MW of nuclear plant capacity will be then be completed.
By 2010 peak demand is expected to grow to about 41,000 MW with a system capacity of 53,000 MW.No new peaking plant is expected to be required during this period and the existing hydro plant willcontinue to meet a large portion of the daily load variation. Details on recent load forecasts are given inAttachment 4 further below. Beyond 2010, with continued load growth of about 4%/yr, i.e. over 2,000MW a year, some new plants will be required, probably including some peaking plant - as and when theexisting hydropower plants are no longer able to meet all of the peak power demands.
- 73 -
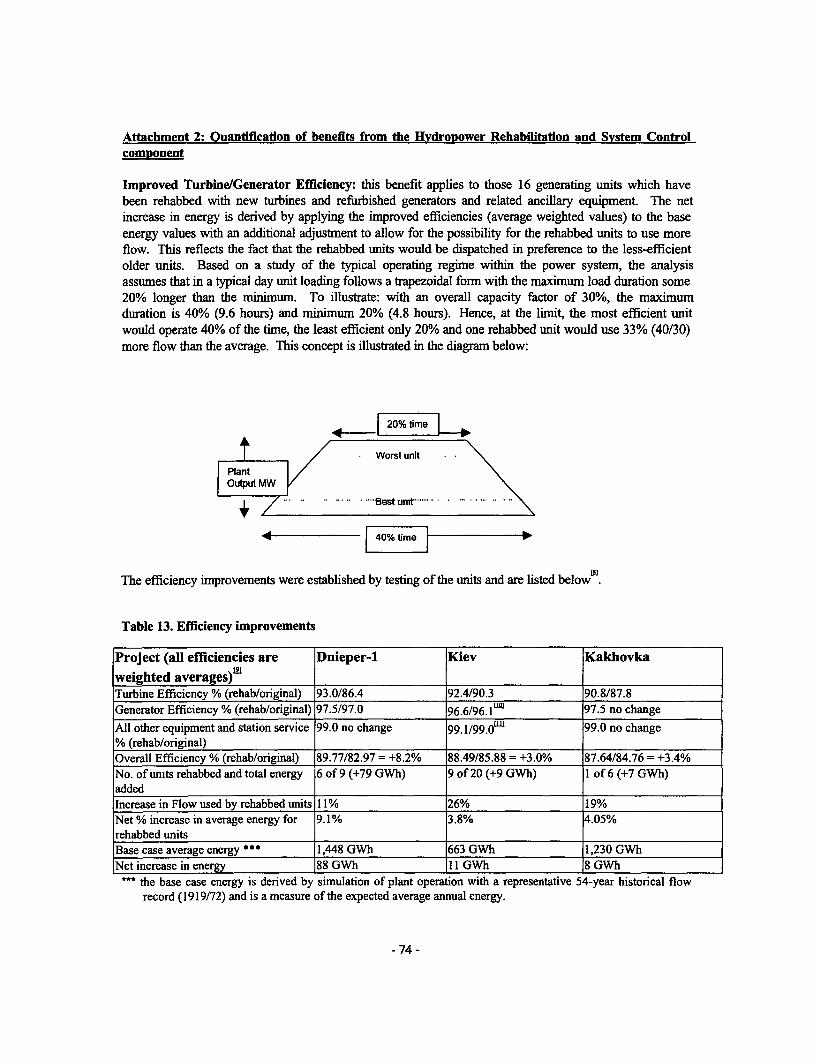
Attachment 2: Ouantification of benefits from the Hydropower Rehabilitation and System Controlcomponent
Improved Turbine/Generator Efficiency: this benefit applies to those 16 generating units which havebeen rehabbed with new turbines and refurbished generators and related ancillary equipment. The netincrease in energy is derived by applying the improved efficiencies (average weighted values) to the baseenergy values with an additional adjustmnent to allow for the possibility for the rehabbed units to use moreflow. This reflects the fact that the rehabbed units would be dispatched in preference to the less-efficientolder units. Based on a study of the typical operating regime within the power system, the analysisassumes that in a typical day unit loading follows a trapezoidal form with the maximum load duration some20% longer than the minimum. To illustrate: with an overall capacity factor of 30%, the maximumduration is 40% (9.6 hours) and minimum 20% (4.8 hours). Hence, at the limit, the most efficient unitwould operate 40% of the time, the least efficient only 20% and one rehabbed unit would use 33% (40/30)more flow than the average. This concept is illustrated in the diagram below:
t / ~~~~~~Worst unit .. \
+ i ~~~~~~~-~- -i-8et unt --- - -.
The efficiency improvements were established by testing of the units and are listed below
Table 13. Efficiency improvements
Project (all efficiencies are Dnieper-1 Kiev Kakhovkaweighted averages)m2Turbine Efficiency % (rehab/original) 93.0/86.4 92.4/90.3 90.8/87.8Generator Efficiency % (rehab/original) 97.5/97.0 96.6/96.1 u 97.5 no change
All other equipment and station service 99.0 no change 99.1/99.0& 99.0 no change% (rehab/original)Overall Efficiency % (rehab/original) 89.77/82.97 = +8.2% 88.49/85.88 = +3.0% 87.64/84.76 = +3.4%No. of units rehabbed and total energy 6 of 9 (+79 GWh) 9 of 20 (+9 GWh) I of 6 (+7 GWh)addedIncrease in Flow used by rehabbed units 11% 26% 19%Net % increase in average energy for 9.1% 3.8% 4.05%rehabbed unitsBase case average energy *** 1,448 GWh 663 GWh 1,230 GWhNet increase in energy 88 GWh 11 GWh 8 GWh
the base case energy is derived by simulation of plant operation with a representative 54-year historical flowrecord (1919/72) and is a measure of the expected average annual energy.
-74-
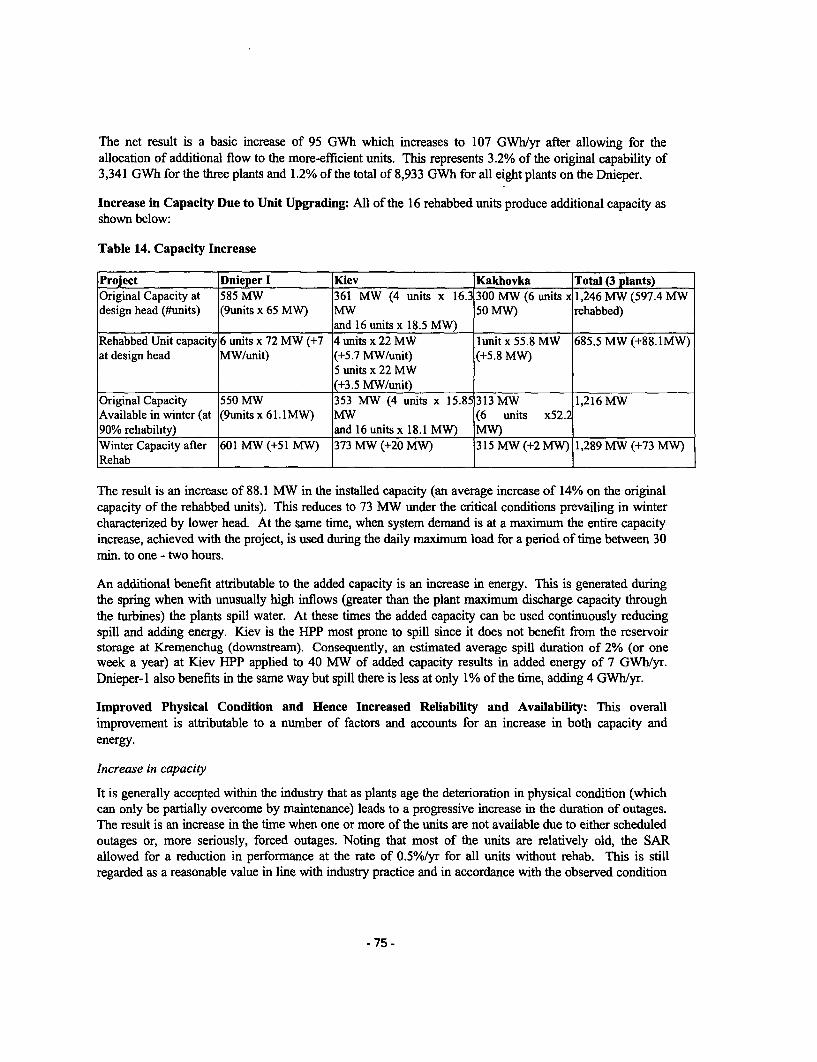
The net result is a basic increase of 95 GWh which increases to 107 GWhlyr after allowing for theallocation of additional flow to the more-efficient units. This represents 3.2% of the original capability of3,341 GWh for the three plants and 1.2% of the total of 8,933 GWh for all eight plants on the Dnieper.
Increase in Capacity Due to Unit Upgrading: All of the 16 rehabbed units produce additional capacity asshown below:
Table 14. Capacity Increase
Project Dnieper I Kiev Kakhovka Total (3 plants)Original Capacity at 585 MW 361 MW (4 units x 16.3 300 MW (6 units x 1,246 MW (597.4 MWdesign head (#units) (9units x 65 MW) MW 50 MW) rehabbed)
and 16 units x 18.5 MW)Rehabbed Unit capacity 6 units x 72 MW (+7 4 units x 22 MW lunit x 55.8 MW 685.5 MW (+88.1MW)at design head MW/unit) (+5.7 MW/unit) (+5.8 MW)
5 units x 22 MW(+3.5 MW/unit)
OriginalCapacity 550MW 353 MW (4 units x 15.85 313MW 1,216MWAvailable in winter (at (9units x 61.1MW) MW (6 units x52.90% reliability) and 16 units x 18.1 MW) MW)Winter Capacity after 601 MW (+51 MW) 373 MW (+20 MW) 315 MW (+2 MW) 1,289 MW (+73 MW)Rehab I_I_I
The result is an increase of 88.1 MW in the installed capacity (an average increase of 14% on the originalcapacity of the rehabbed units). This reduces to 73 MW under the critical conditions prevailing in wintercharacterized by lower head. At the same time, when system demand is at a maximum the entire capacityincrease, achieved with the project, is used during the daily maximum load for a period of tirne between 30min. to one - two hours.
An additional benefit attributable to the added capacity is an increase in energy. This is generated duringthe spring when with unusually high inflows (greater than the plant maximum discharge capacity throughthe turbines) the plants spill water. At these times the added capacity can be used continuously reducingspill and adding energy. Kiev is the HPP most prone to spill since it does not benefit from the reservoirstorage at Kremenchug (downstream). Consequently, an estimated average spill duration of 2% (or oneweek a year) at Kiev HPP applied to 40 MW of added capacity results in added energy of 7 GWh/yr.Dnieper-1 also benefits in the same way but spill there is less at only 1% of the time, adding 4 GWh/yr.
Improved Physical Condition and Hence Increased Reliability and Availability. This overallimprovement is attributable to a number of factors and accounts for an increase in both capacity andenergy.
Increase in capacity
It is generally accepted within the industry that as plants age the deterioration in physical condition (whichcan only be partially overcome by maintenance) leads to a progressive increase in the duration of outages.The result is an increase in the time when one or more of the units are not available due to either scheduledoutages or, more seriously, forced outages. Noting that most of the units are relatively old, the SARallowed for a reduction in performance at the rate of 0.5%/yr for all units without rehab. This is stillregarded as a reasonable value in line with industry practice and in accordance with the observed condition
- 75 -

of the plants. The main impact will be a progressive reduction in the available (firm or guaranteed)capacity.
The total available capacity in winter (the peak demand period) for the eight plants is 3,530 MW at present- under prevailing adverse conditions of low flow and head. Given the current overall physical condition ofthe equipment, an availability factor of 92% was applied to derive the guaranteed capacity of 3,248 MWavailable to the system on demand (nominally 100% reliable, allowing for forced outages). With aneffective loss of 0.5%/yr, the net reduction in guaranteed (firm) capacity is about 16 MW/yr. On the otherhand, the more-or-less as-new rehabbed units will be more reliable and require a lower % provision forreserve. Therefore, a value of 96% for availability is reasonable followed by a lower rate of loss incapacity, estimated at 0.2/o/yr.
In addition, it is expected that the other improvements - apart from those specific to the fully rehabbedunits - such as new excitation systems, circuit breakers, instrumentation and protection equipment - willenhance reliability at all of the plants and reduce the effective capacity loss rate from 0.5% to 0.4% andincrease the availability from 92 to 94%. The net result of these several factors is that the project willincrease the system guaranteed capacity by 152 MW initially (in 2001 and including the 73 MW solelyattributable to the 16 rehabbed units), increasing to 220 MW after 20 years.
Increase in energy output
The same physical deterioration will also reduce the energy capability of the plants. The main cause is aloss of efficiency due to wear and tear on the turbines, typically combined with increased seal leakage. Therate of efficiency (energy) loss is usually much less than the performance (capacity) loss associated withreliability. Therefore, values of 0.20/o/yr reduction in energy were adopted for the existing plants (prior tothe rehab project), a 0.1% reduction for the 16 fully rehabbed units and a 0.15% reduction for the otherunits. (The equivalent rates used in the SAR are different - this issue is discussed in the section onComparison with the SAR in the main text of the analysis). Note that a deterioration in reliability as suchis unlikely to reduce significantly the energy capability of the Dnieper HPPs since they generally havesufficient capacity to avoid any loss due to spill in the event that a unit is out of service during the springhigh-flow period.
Improved Operational Performance: the previous procedure for operating the Dnieper hydropower plantswas largely reliant on outdated instrumentation, control and communication systems and dependence onmanual intervention. The rehab project includes the installation of modem control and monitoring systemsat five of the plants. Among other advantages this allows for the automatic and optimum loading of theunits with consideration of their respective efficiency curves. A related feature is the ability to enhancemanagement of the reservoirs and control flow down through the successive plants along the river. There isno method by which the benefits of improved operations can be readily detemiined. General experiencewithin the industry is that the introduction of an up-to-date control system will increase energy generationby at least one percent. Energy values within the power system, (in effect the ability to match hydro outputto system demands) are also typically enhanced. The provision of a better monitoring system also leads toearlier detection of potential problems and hence improved reliability. The overall conclusion is that theaverage energy generation would increase by 1.5% as a result of these improvements. This increase appliesto the five Dnieper HPPs affected (Kiev, Dnieper-1, Dniprodzerzhynsk, Kremenchug, and Kakhovka) plusthe Dniester HPP. Since more limited but still significant system improvements were also incorporated atthe other three plants {Kiev PSP, Dnieper-2 and Kanev (new switchgear only)} a smaller 0.3% increasewas adopted for them. The impact of increased reliability attributable to the control and monitoringsystems is covered in the preceding section. The overall increase in energy and firm capacity due to all of
- 76 -
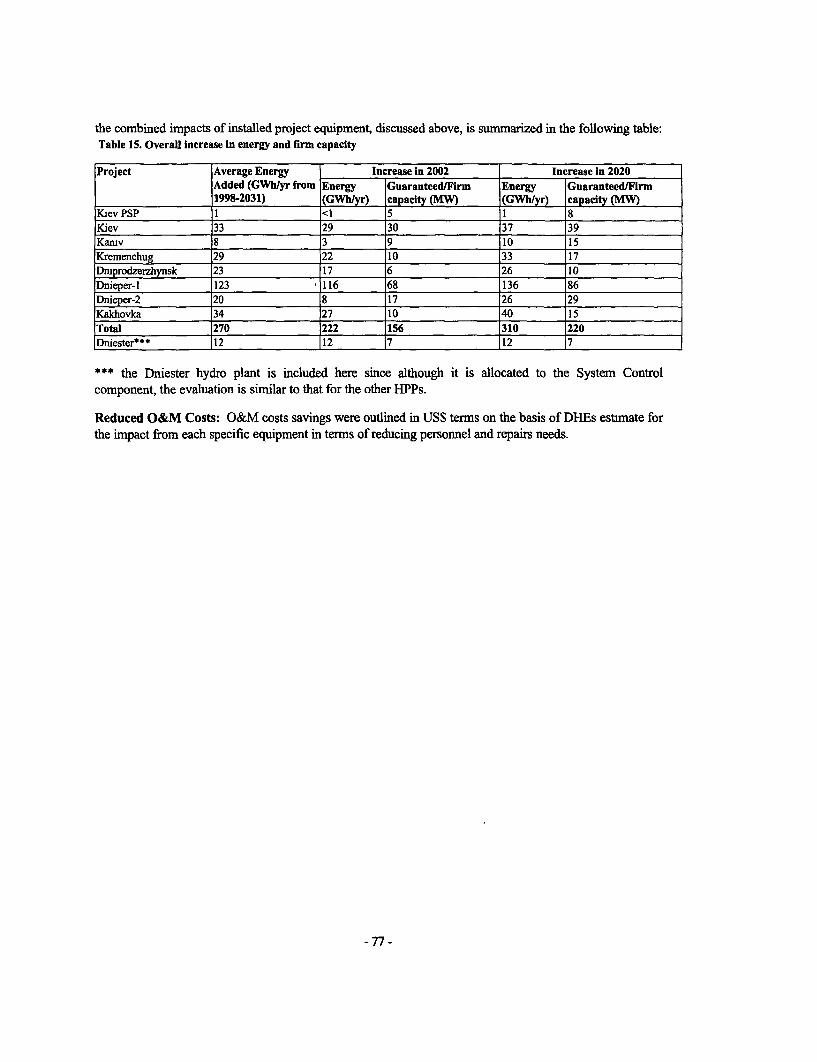
the combined impacts of installed project equipment, discussed above, is summarized in the following table:Table 15. Overall Increase in energy and firm capacity
Project Average Energy Increase in 2002 Increase In 2020Added (GWb/yr from Energy Guaranteed/Firm Energy Guaranteed/Firm1998-2031) (GWb/yr) capacity (MW) (GWh/yr) capacity (MW)
Kiev PSP I <1 5 1 8Kiev 33 29 30 37 39Kaniv 8 3 9 10 15Kremenchug 29 22 10 33 17Dm_prodzerzhynsk 23 17 6 26 10Dnieper-l 123 '_116 68 136 86Dnieper-2_ 20 L_ 8 17 26 29Kakhovka 134 27 10 40 15Total 1270 1222 156 310 220Dniester*** 112 17 112 7
*** the Dniester hydro plant is included here since although it is allocated to the System Controlcomponent, the evaluation is similar to that for the other HPPs.
Reduced O&M Costs: O&M costs savings were outlined in US$ terms on the basis of DHEs estimate forthe impact from each specific equipment in terms of reducing personnel and repairs needs.
- 77 -

Attachment 3: Load forecast
Information on the probable development of the power system was derived largely from the most recentrelevant study - "Completion of Khmelnitsky 2 and Rovno 4 in Ukraine Economic Due Diligence" byStone & Webster Consultants dated July 2001 (S&W study). This study presented a probable least-costdevelopment plan from 2000 to 2010.
The report notes that the base case expansion plan, is in fact a 'rehabilitation plan'. It covers a periodfrom 2000-2010 and the base case forecast demand (EBRD) is from 168.3TWh (29,900 MW peak) in2000 to 221.1 TWh (40,700 MW) in 2010 - growing at -4.5% after 2003. Load factors are about64/62% gradually reducing over time. The report also states that the existing (2001) plants would be'technically sufficient' to meet the peak demand until 2007, i.e. 35,600 MW. (This tends to confirm the
validity of the availability factors adopted in the present analysis.) The load forecasts used in the S&Wstudy are shown in the table and diagram below together with those used in the SAR:
Table 16. Load For casts (' I _h/yr)
Source SAR (basic) SAR (low) S&W (base) S&W (low)Year1995 188 188 1921996 182 182 1811997 179 178 1771998 180 176 1721999 183 174 1692000 189 171 1672001 196 173 1692002 202 176 161 1542003 208 179 165 1552004 215 183 169 1582005 222 188 177 1632006 228 193 185 1692007 235 199 193 1752008 242 205 02 182 _2009 250 210 211 1902010 258 216 21 198Note: actual generation in bold italics
-78 -
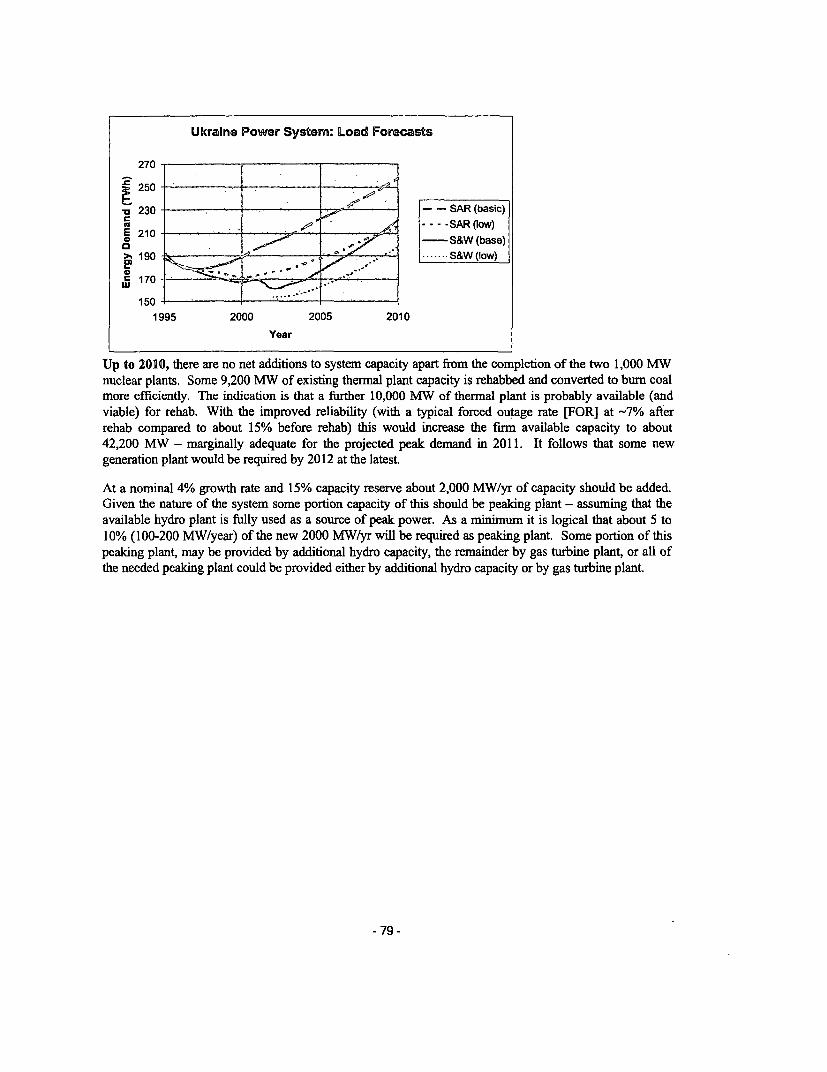
Ukraine Power System: Load Forecasts
270 -.
250 -__
u 230 - - SAR (basic)... SAR (tow)
E 210 -_e R 1w0 - / S&W (base)
>' 190 t . I. P ------ S&W (low)
10
1995 2000 2005 2010
Year
Up to 2010, there are no net additions to system capacity apart from the completion of the two 1,000 MW
nuclear plants. Some 9,200 MW of existing thermal plant capacity is rehabbed and converted to bum coal
more efficiently. The indication is that a further 10,000 MW of thermal plant is probably available (and
viable) for rehab. With the improved reliability (with a typical forced outage rate [FOR] at -7% afier
rehab compared to about 15% before rehab) this would increase the firm available capacity to about
42,200 MW - marginally adequate for the projected peak demand in 2011. It follows that some new
generation plant would be required by 2012 at the latest.
At a nominal 4% growth rate and 15% capacity reserve about 2,000 MW/yr of capacity should be added.
Given the nature of the system some portion capacity of this should be peaking plant - assuming that the
available hydro plant is fully used as a source of peak power. As a minimum it is logical that about 5 to
10% (100-200 MW/year) of the new 2000 MW/yr will be required as peaking plant. Some portion of this
peaking plant, may be provided by additional hydro capacity, the remainder by gas turbine plant, or all of
the needed peaking plant could be provided either by additional hydro capacity or by gas turbine plant.
- 79-

Attachment 4: Valuation of benefits from hydropower plant rehabilitation
Thermal Energy Displaced by Added Hydro Energy.
As a base case, the S&W study used the following fuel costs shown in the table below:
Table 17. Fuel costs
Fuel Type Basic Cost Unit Cost ($/GJ) Typical Plant Fuel Typical CostConsumption (KJ/kWh) (c/kWh)
Coal (washed low $30.8/tonne $1.69 9500 1.6sulphur)Coal Mix (low quality) $13.3/tonne $0.95 9900 0.95Natural Gas $96/000m3 $2.70 9000/9600 2.4/2.6
(-$90/tequiv)Oil $205/tonne $5.05 8800 4.4
(-$29/bbl)Raw unwashed coal $27.3/tonne $1.50 NA NA(Schtib, used with gas)Mix 1 (85%raw $1.68 9600 1.6coal/15%gas)
Mix 2 (70% coal/30% $1.86 9600 1.8gas)Mix 3 (50% coal/25% $2.69 9900 2.7gas/25% oil)Mix 5 (70% gas/30% oil) $3.41 10300 3.5
Note that a reduction of more than 25% in the cost of natural gas brings the effective fuel cost for gas-firedplant below that for the coal/gas mix. Nuclear fuel costs are excluded but average about 0.8c/kWh. Thekey issue is which type of thermal plant generation will be displaced by additional hydro energy and hencethe fuel cost savings.
Examination of probable plant dispatch or stacking diagrams shows that the added hydro energy willnormally be used during the daytime and evening peak hours. The average annual capacity factor for thehydro plants is about 30%, ranging down to 15/25% during the peak winter period and over 40% duringthe short spring high-flow period The S&W study shows that for all years (2000-10) the lower-costnuclear and rehabbed coal fired plant will operate at base load, as will almost all of the plants using thelower cost Mix 1. Therefore the hydro energy will displace some combination of gas and coal/gas firedplant (there is only minimal generation with oil).
There is no exact method of allocating the hydro energy. The assumption adopted is that all hydro energyat up to a 10% capacity factor would displace peak thermal energy (typically during the evening peakdemand during winter). At the other extreme, energy at above the 30% capacity factor would representlargely off-peak power. The following table below shows the resulting allocation adopted - averaged overthe eight Dnieper HPPs:
-80 -

Table 18. Energy allocation
Hydro Energy Class system in 2001 System in 2010% Energy Thermal plant Fuel cost % Energy Thermal plant Fuel costAllocation (typical CF%) (c/kWh) Allocation (typical CF%) (c/kWh)
Peak during winter 34% Gas 10% 2.4 30% Gas (5%) 3.1Intermediate 60% Coal/gas mnix 1.9 55% Part gas & 2.4 (av)winter/summer peak (25%) coal/gas mix
(15/30%)
Other incl. spring 6% Coal/gas mix 1.8 15% Coal/gas mix 1.8high-flow period (50%) (50%)Total (average fuel 2.07 2.52co st) _ _ _ _ _ _ _ _ _ _ _ _ _ _ _ _ _ _ _ _ _ _ _ _ _ _ _
The fuel cost of new gas turbines is quoted as 11,100KJ/kWh at $2.7/GJ i.e. 3.0c/kWh. This is quitesimilar to the cost for the existing displaced plant for the same peaking role. Hence the average cost ofdisplaced fuel should remain the same after 2010.
These fuel consumption rates are for gross generation within the thernal plants and thus include internalconsumption, i.e. station use which typically averages about 7%. The rates are believed to be valid asoverall averages for normal operation. There are strong indications that due to operating constraints withthe existing thermal plant, actual fuel consumption is significantly higher when plants are forced to operateat varying loads - required to follow the daily increase between off and on-peak demand. This is necessarysince the hydro plants (ideal for this role) lack either the capacity or the energy required to provide thisservice completely. For this reason the fuel costs in the above table have been increased by 5% to providea more realistic measure of the fuel cost savings. One further adjustmnent is required to allow for thevariable O&M cost (saved) at the thermal plants. The S&W study used an average of 0.35c/kWh forvariable O&M cost which was adopted.
After the preceding adjustments, the equivalent fuel cost savings are assessed at 2.33c/kWh in 2001,increasing progressively to 2.83c/kWh in 2010, and remaining constant thereafter. Both values areaverages for the Dnieper HPPs; adding variable O&M, the respective values are 2.68 and 3.18c/kWh.
Capacity Benefits
As noted above, analysis of the S&W study leads to the conclusion that, with the base case load forecast,additional peaking capacity would be assigned value starting in 2012. This conclusion was used to derivethe amount of hydro capacity valuable to the system. A further consideration was given to the degree ofavailability of hydroenergy needed to make the project hydro capacity usable and hence valuable to thesystem.
In addition, all indications are that future trends in demand will lead to lower annual and daily load factors.Analysis shows that with the base case load forecast and an assumed typical winter day load factor of 85%(compatible with an annual load factor of 62/64%) all of the firm hydro capacity will be usable well before2010. It follows that the subsequent constraint on capacity benefits is the system demand for peakingpower.
-81 -

Assuming conservatively that only 5% of the growing system demand should be met by new gas turbine(GT) plant after 2012, all of the added firm hydro capacity (some 200MW at that point in time) is usableby 2014. The value adopted is $375/kW (S&W study cost for gas turbine) plus 15% for the lowerreliability of GT compared to hydro.
Dam Safety Monitoring System
The SAR proposed to provide a dam safety analysis and monitoring system at all of the Dnieper HPPs.For a variety of practical reasons such a system was installed only at Kiev HPP. However, the apparentreduction is less than it might appear since the Kiev project creates the most upstream reservoir and isprobably the most sensitive in terms of potential damage in the event of a dam failure.
The new Computer-Aided Dam Safety Monitoring System at Kiev HPP will significantly reduce the risk ofemergency situations. The risk of such situations is lower at hydraulic structures equipped with acomputer-aided monitoring system versus structures which do not have such a system.
In addition, the new Computer-Aided Dam Safety Monitoring System at Kiev HPP increased reliability,effectiveness, and efficiency of monitoring the safety of the hydraulic structures of the Dnieper cascade.The introduction of modem technology and establishment of a database for assessing the conditions of thedams allowed measurement data to be properly acquired and processed. Advanced warning is issued incase of deviations of dam safety indicators from established standards. Monitoring of the safety conditionsof the dams is carried out in real time.
The commissioning of a new Computer-Aided Dam Safety Monitoring System at Kiev HPP helped achievethe project objective to improve the safety of the hydropower plants in terms of:
/ Automation of meter reading and processing, analysis, storage, interpretation and presentation ofall information about dam control. This allows to better assess the level of dam safety and make relevantdecisions;
/ Rehabilitation of control instruments, including upgrade and repair of malfunctioning instruments,installation of additionally needed instruments and their integration witiin modem technological solutions;
V Review and modernization of methodological, technological and organizational procedures inaccordance with modem requirements and existing experience.
A dam safety monitoring system of this kind has been commissioned at the Kiev hydro power plant for thefirst time in the CIS countries. Thus the monitoring of one of the world longest dams (50 km length) hasbeen automated.
Although no economic benefit from the project can be quantified the benefit is nonetheless real andsubstantial - certainly some millions of dollars on a present value basis.
W Using DHE latest values of 95GWhm Information on the probable development of the power system, including system costs was derived largely fromthe most recent relevant study - "Completion of Khmelnitsky 2 & Rovno 4 in Ukraine; Economic Due Diligence"by Stone & Webster Consultants, dated July 2001 (S&W study). This study presented a probable least-costdevelopment plan from 2000 to 2010.
There are minor variations in these two loss rates: Kiev was expected to lose 1.5% "without" and Dnieper 2 and
-82 -

Kanev 0.4% "with" project.x This is the actual calculation used in the SAR, the text refers to 2.5% or 3% of the fuel used at the ONE THIRDof the thermal plants that would be affected - 0.9% is one third of 2.7%.
w The total thermal fuel cost is held constant at 1.29c/kWh from 1995-00, then at 1.27c from 2001-10 and finallyat 1.25c from 2010-20. These costs are reasonably consistent with the 1994$ fuel prices quoted in the SAR (Annex3) but the Annex predicts fuel cost increases of 30 to 45% by 2010. Hence the fuel cost savings may beunderstated.
UE quotes a minimal reduction in O&M cost of only -$5000/yr - not worth considering.
The numbers quoted here come from the SARISGI and DHE.
The values in this table are consistent with the DHE estimated efficiencies and 95GWh.11Q From the SGI study.LW SGI quotes a 0.1% increase.
DHE reports a much lower cost for gas.
-83 -
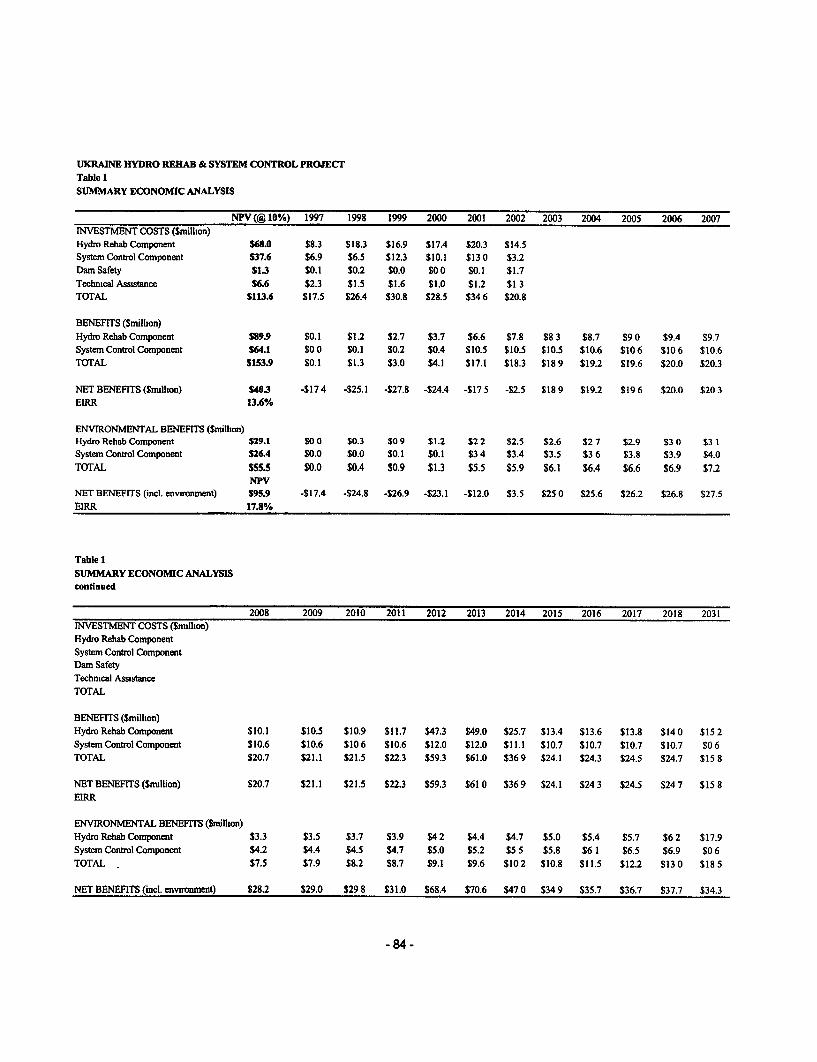
UKRAINE HYDRO REHAB & SYSTEM CONTROL PROJECTTable 1
SUMMARY ECONOMIC ANALYSIS
NPV(@ 10%) 1997 1998 1999 2000 2001 2002 2003 2004 2005 2006 2007IRNVESTMENT COSTS (Sniulion)Hydro Rehab Component $68.0 $8.3 $18.3 $16.9 S17.4 $20.3 $14.5System Control Component S37.6 $6.9 $6.5 $12.3 $10.1 $13 0 $3.2Dam Safety $1.3 $0.1 $0.2 $0.0 $0 0 $0.1 $1.7Techmcal Assistance $6.6 $2.3 $1.5 $1.6 $1.0 $1.2 $1 3TOTAL $113.6 $17.5 $26.4 $30.8 $28.5 $34 6 $20.8
BENEFITS ($milhon)
Hydro Rehab Component $89.9 $0.1 $1.2 $2.7 $3.7 $6.6 $7.8 $8 3 $8.7 $9 0 $9.4 $9.7System Control Component $64.1 $0 0 $0.1 $0.2 $0.4 $10.5 $10.5 $10.5 $10.6 $10 6 $10 6 $10.6TOTAL $153.9 $0.1 $1.3 $3.0 $4.1 $17.1 $18.3 $18 9 $19.2 $19.6 $20.0 $20.3
NET BENEFITS (Sullhon) $40.3 -$17 4 -$25.1 -$27.8 -$24.4 -$17 5 -$2.5 $18 9 $19.2 $19 6 $20.0 $20 3EIRR 13.6%
ENVIRONMENTAL BENEFITS ($tilhon)Hydro Rehab Comnponent $29.1 SO0 $0.3 $0 9 $1.2 $2 2 $2.5 $2.6 $2 7 $2.9 $3 0 $3 1System Control Cornponent $26.4 $0.0 $0.0 $0.1 $0.1 $34 $3.4 $3.5 $3 6 $3.8 $3.9 $4.0TOTAL $55.5 $0.0 $0.4 $0.9 $1.3 $5.5 $5.9 $6.1 $6.4 $6.6 $6.9 $7.2
NPVNET BENEFITS (incl. environment) $95.9 -$17.4 -$24.8 -$26.9 -$23.1 -$12.0 $3.5 $250 $25.6 $26.2 $26.8 $27.5EIRR 17.8%
Table I
SUMMARY ECONOMIC ANALYSIScontinued
2008 2009 2010 2011 2012 2013 2014 2015 2016 2017 2018 2031INVESTMENT COSTS (Smrlhon)Hydro Rehab Component
Systemr Control ComponentDam Safety
Technical Assistance
TOTAL
BENEFITS ($million)
HydroRehabComponent $10.1 $10.5 $10.9 $11.7 $47.3 $49.0 $25.7 $13.4 $13.6 $13.8 $140 $152SystemControlComponent $10.6 $10.6 $106 $10.6 $12.0 $12.0 $11.1 $10.7 $10.7 $10.7 $10.7 $06TOTAL $20.7 $21.1 $21.5 $22.3 $59.3 $61.0 $369 $24.1 $24.3 $24.5 $24.7 $158
NET BENEFITS ($mrullion) $20.7 $21.1 $21.5 $22.3 $59.3 $61 0 $36 9 $24.1 $24 3 $24.5 $24 7 $15 8EIRR
ENVIRONMENTAL BENEFITS (Srnilhon)Hydro Rehab Component $3.3 $3.5 $3.7 $3.9 $4 2 $4.4 $4.7 $5.0 $5.4 $5.7 $6 2 $17.9System Control Component $4.2 $4.4 $4.5 $4.7 $5.0 $5.2 $5 5 $5.8 $6 1 $6.5 $6.9 $0 6TOTAL . $7.5 $7.9 $8.2 $8.7 $9.1 $9.6 $102 $10.8 $11.5 $12.2 $130 $185
NET BENEFITS (incl. environment) $28.2 $29.0 $29 8 $31.0 $68.4 $70.6 $47 0 $34 9 $35.7 $36.7 $37.7 $34.3
- 84 -

Table 2: UKRAINE: SYSTEM CONTROL COMPONENT
(note all $ values are in millions)1997 1998 1999 2000 2001 2002 2003
PVsINVESTMENT COSTS TotalCommunications $30.6 S23.1 $6 I $4 5 $9 0 $5 7 $3 9 $1 4SCADA, AGC, GCD, EMS $13.3 $8.5 $0 0 $02 $1.6 $1 3 $8.8 $1 4Transmission Line Relay Protection $2.6 $2.0 $0 8 $0.7 $0.1 $0.5 $0 1 $0 4Dmester HPP- Control System & Circuit Breakers S5.6 $4.1 $00 $1.1 $1 6 $26 $02 $0 1TOTAL $52.0 $37.6 $6.9 $6.5 $12.3 $10.1 $13.0 S3.2
BENEFITSFuel Cost Savings $38.9 $0 0 $0 0 $0.0 $0 0 $6 6 $6 6 $6 6Telecom Benefits $20.5 $0.0 $0 0 $0.0 $0 0 $3 5 $3 5 $3 5Dniester HPP $4.7 $0 0 $01 $0 2 $0 4 $0 5 $0 5 $0 5TOTAL $64.0 $0 0 $0.1 $0 2 $0.4 $10 5 $10 5 $10 5
NPVNET CASH FLOW $26.4 -$6.9 -$6.3 -$12.1 -$9.8 -$2.5 $7.3 $10.5
EIRR 17.8%ENVIRONMENTAL BENEFITS Unit Value (c/kWh)from SCADA etc fuel savingsS02 Emissions 0.69 $12.8 $0.0 $0.0 $0 0 $0.0 $2 2 $2 2 $2 2NOX Emissions 0.07 $1.3 $0.0 $0 0 $0.0 S0 0 $0 2 $0 2 $0 2CARBON emussions 0.27 $11.0 $000 $00 $00 $0.0 $08 $09 $1 0at Dniester HPPS02 Emissions 0.78 $0.7 $0.0 $0 0 $0.0 $0 1 $01 $0 1 $0 1NOX Emissions 0.08 $0.1 $00 $0.0 $0 0 $0 0 00 S0 0 S0 0CARBON emissions 0.26 $0.6 $0 0 $0 0 $0 0 $0 0 $0 0 $0 0 $0 0Total Environmental Benefits $26.4 $0.0 $0.0 $0.1 $0.1 $3.4 $3.4 $3.5
NPVNET CASH FLOW (with emissions) $52.8 -$6.9 -$6.3 -$12.0 -$9.7 $0.9 $10.7 $14.1
EIRR 23.8%Total benefits 100%Fuel cost savings 61%Telecom beenfits 32%Dniesetr HPP 7%
- 85-

Table 2: UICRAINE: SYSTEM CONTROL COMPONENT-continued(note: all S values are in milons)
2004 2005 2006 2007 2008 2009 2010 2011 2012 2013 2020 2031
INVESTMNT COM
CommunucationsSCADA, AGC, GCD, EMS
Transrmssion Line Relay Protection
Dniester HPP: Conro1 System& Circuit Breakers
TOTAL
BENEFITSFuel Cost Savings $6.6 $6 6 $6 6 $6.6 $6.6 $6 6 $6 6 $6 6 $6.6 $6 6 $6.6Telecom Benefits $3 5 $3 5 $3 5 $3.5 $3.5 $3.5 $3 5 $3 5 $3.5 $3.5 $3 5
Dniester HPP $0.5 $0 5 $0.5 $0.5 $0 5 $0 6 $0 6 $0.6 $1.9 $1 9 $0.6 $0.6
TOTAL $10.6 $10.6 $10.6 $10.6 $10 6 $10 6 $10.6 $10.6 $12.0 $12.0 $10.7 $0 6
NET CASH FLOW $10.6 $10 6 $10 6 $10.6 $10.6 $10.6 $10 6 $10 6 $12.0 $12 0 $10.7 $0.6
ENVIRONMENTAL BENEFITSfrom SCADA etc fuel savingsS02 Emissions $2 2 $2 2 $2 2 $2.2 $2.2 $2.2 $2.2 $2.2 $2 2 $2.2 $2.2NOX Emissions $0.2 $0 2 $0 2 $0.2 $0.2 $0.2 $0.2 $0.2 $0 2 $0 2 $0.2
CARBON emnissions $1 1 $12 $1.4 $1.5 $1 6 $1.8 $2.0 $2 2 $2.4 $2.6 $5 1at Dniester HPPS02 Emissions $0 1 $01 $01 $0.1 $0.1 $0.1 $0.1 $0.1 $0.1 $0.1 $01 $01
NOX Emissions $0 0 $0.0 $0.0 $0.0 $0 0 $0 0 $0.0 $0.0 $0.0 $0.0 $0 0 $0.0
CARBONemtssions $0.0 $00 $00 $00 $0.1 $0.1 $0.1 $0 1 $0.1 $0 1 $02 $05Total Envtromnental Benefits $3 6 $3.8 $3.9 $4.0 $4 2 $4.4 $4 5 $4.7 $5 0 $5 2 $7 8 $0 6
NETCASH FLOW $14.2 $14.3 $145 $146 $148 $15.0 $152 $15.4 $16.9 $17.2 $18.5 $12
(with emissions)
- 86 -

- rz"e di
° s E
- i TI $: %ffif -> g§ | ; | R "8
8 n 8RR"ga an;i
iua
i sooo te A8X ; R
r S~' ° iiiiS f
IH5 H i

Tabkl UICRAE HYDRO REHABSUMMARY-uiflmI
(erd Dnst)20D4 2005 20C6920D7 20 2010 2011 2012 2013 2020 2031
WflHOUTPROECTEERGY 8879.5 88618 88440 88263 88087 8791 1 87735 87559 87384 87210 85996 84123
CAPACrIY 31991 31831 31672 31514 31356 31199 31043 30888 30734 30580 29526 2794.2
WFM PROJECTENERGY 91116 93988 90861 9073A 90607 90480 90353 9S2Z7 9010.1 89975 89097 87736
AddEmuy 23Z1 2371 2421 2470 2520 2569 2619 2668 271.6 276.5 3101 3613PeakEiegy 768 785 802 818 835 852 869 885 902 918 1032 1205
Day,me Emw 1280 1309 133.7 136.6 139.5 1423 1452 1480 150.8 1537 1731 2027
Off-1pakEnw 273 278 282 286 290 294 298 302 306 311 339 382
EAe Vahb Unit a h
Pfak Ezi 3.9 40 4 1 42 43 4.4 4.5 4.5 4.5 4.5 4.5 4.5
Dayu- gy 3 1 32 33 33 3 4 3 5 3. 35 3.5 3.5 3.5 3 5
OffpkEEmR 28 28 Z8 28 Z8 28 28 28 28 28 28 28
PeacEn , $30 S31 $33 S34 $36 937 $39 $39 $40 $41 $4.6 $54
Dayt- Emw $40 S42 $43 $45 S47 $49 S51 S52 $53 S5.4 $61 $72
OffxcEak E3 $08 $0.8 S08 $0.8 $08 $08 S08 $0.8 $08 $09 $09 $11
TOrAL $77 S8.0 S84 S8.7 $91 S94 $98 $100 $102 $104 $116 $136
CAPAaIY 33629 3356.7 33386 33264 33144 33023 32904 32784 3266.5 3254.7 31730 30490
AddCqty 1638 1676 1713 1751 1787 1824 1860 1896 1932 1967 220.5 2548
C2ayVahdw 00 00 0.0 00 00 00 00 13 81.6 850 32 00
S Bene0 Soo SO0 $0 SO0 Soo Soo SOO $06 $360 $375 $14 S00
M Cost SavnE s$10 $10 S 0 $10 $1 0 $1.1 $11 $11 $11 $11 $13 $16
IOTALBENIEFIIr S87 S9.0 $9.4 $97 $101 $10.5 $109 $117 $473 $490 $144 $152
INVESMNTOSIS
NETCASIFYW $87 S90 $94 $97 $1S.1 $105 $109 $117 $473 $490 $144 $152
NVNRALABENE1SS02 Enu s $18 S18 S19 $19 $20 $20 $20 $21 S21 $22 $24 S28
N05XEmor $02 $02 S02 $02 $02 $02 $02 $02 $02 $02 $0.2 $03
CARBONmsxs $07 $08 $09 $10 $12 $13 $15 $16 $1.8 $20 $45 $148
TOTALEmmimBft $27 S29 $30 $31 S33 $35 S37 $39 $42 $44 S71 S179
NErCASHn.FLOW'ansx $114 $11.9 SIZ4 SIZ9 $13A $140 $146 S156 $51.5 S534 $21.5 $332
Namdaiury cambe aTev GWbaglcapadtynwmbea1swi WaU Smuiben am In nMk
-88-
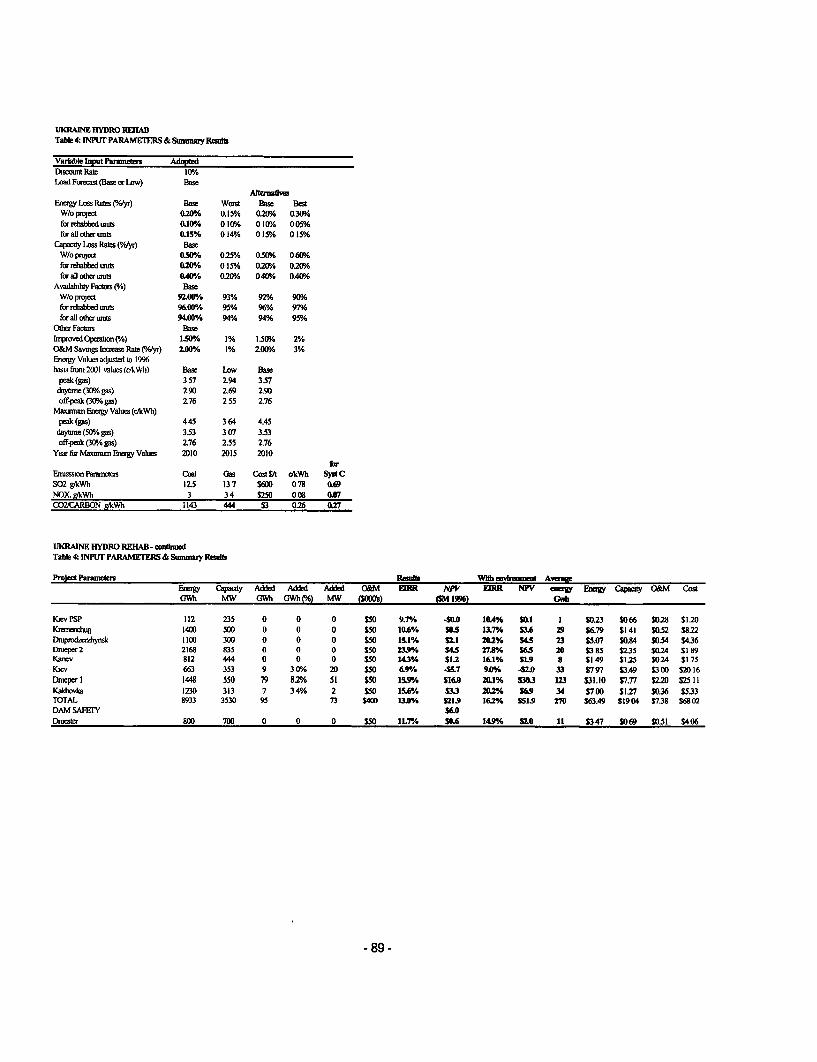
UKRAME EYDRO REMIABIbe 4: INPUT PARAMEIERS & StmmIay Reant
VarIable liput Pammem AdoptedDomut Rat 10%Load Forecast (Base or Low) Base
neg Loss Rates M%tyr) Base WVste Base BestW/o projet 0.20% 0.15°% 020% 03091forr habbd mtm 0610% 010Yo 010% 005%fhraDlatur mts 0.15/ 014% 015% 015%
Cacty Loss Rates (°/ayr) BaseW/o podea 050 025% 0310% 0 60%for rdeabbed saute 020% 015% 020°h 0 20%ftr aDl osl units 0.40A 0.20% 040% 0.40%
Avalabty Factois (%) BaseW/o prljed 92.00% 93% 92% 90%fr rdeabbed Wmas 96.00% 95% 96% 97%fcr al orAer wiuts 9400% 94% 94% 95%
Ot1 Factrbs Basenpadved Opea (t/s) 150% 1% 1350% 2%
O&M SavngsIaea Rate (%yr) 2D00/ 1% 200% 3%Engy Values adjusted to 1996basn fonm 2D01 values (c/k%Th) Base LoW Base
peak (gas) 3 57 2.94 357daybn (130gas) 2 90 269 2.90off-peak (30%. gas) 2.76 2 55 276
Mwomiasm EIeB Valas (rhWh)peak (ps) 445 364 4.45daytsne (50°% ps) 353 3 07 353off-ak (30%/ gas) 2.76 2.55 2,76
YearfirMaxanum EangyValsw 2010 2015 2010for
Emsussoa Pa sem Coal Gas Cost SA okWh SystCS02 gikWh 12.5 137 $600 078 0.69NOX klkWh 3 3 4 S250 008 0007COVCARBON gkcWh 1143 444 53 0126 0.7
UKRAINE HYDRO REHAB -cattbwedTable 4: INPUT PARAMEIERS & Swnmsy Resll
Prject Parameters Rmist Whh aMiusmt AwEBesy C(ady Added Adid Add O&M ERR NPV E2RR NPV mere Eagy Capty O&M CostGWh MW GWM GWhM(%) MW rh) (SM 1G6)b
KscvPSP 112 235 0 0 0 550 9.7% -s5o0 104% 50.1 I 50.23 S066 S028 $120Knesnihug 1400 500 0 0 0 S50 10.6/. 50.5 13.7% 53.6 29 S6.79 $141 S052 S822Dniprodn-hynsk 1100 300 0 0 0 S50 151% 2 20.2% S45 23 S5.07 S0.84 5054 5436Dsueper2 2168 835 0 0 0 S50 23gY. S4.5 27.8% 565 20 S385 S235 S024 $189Kancv 812 444 0 0 0 S50 14.3% 1.2 16.1% S59 8 Sl 49 51.25 $0.24 Si 75Kicv 663 353 9 3Wo 20 550 69% -557 9.0% -2.0 33 S797 S3.49 5300 52016Dnweerl 1448 550 79 82% 51 550 15% S16.0 2D.1% S30.3 123 S31.10 57.77 S220 S2511Kaldhla 1230 313 7 34% 2 S50 15.6% S3.3 20.2% 569 34 S700 S127 S0.36 S533TOTAL 8933 3530 95 73 $400 13A3 521.9 16.2% 551.9 270 63.49 51904 5738 56802DAM SAFETY 56.0Dniester 800 700 0 0 0 S50 111.7A S06 14./9 no 11 5347 5069 $SO1 S406
-89-

Table 5 Project name Dnifow (EIRR Discoatt Rate 10Vw/o cmisions) total no units 12
12% Loadforast Base 1997 1998 1999 2000 2001 2002 2003WllHOUr PROJECr Loss Rates AvailabiltyENERGY Base Energy 800 0.10%/. 800 80 800 800 800 799 2 798 4CAPACITY Capacaty n Wnmler 700 0/.0 94.0% 658 0 658 0 658 0 6580 6580 656 7 655 4
capacity ectDr 13 0%
Wrl7H PROJECr Base EneyENERGY InreasdEfficiency 0'f 0.10/ 8120 800 8030 8060 8090 8120 811.2 8104
Inoved Operaton 1.5% APER4aGEAdded Energy 113 0 3.0 6.0 9.0 12.0 12.0 12.0Peak Energy 0 0 2 3 4 6 6 9 9.2 9.2 9.2
Daytime Energy 0 0 0 7 1 4 2.1 2.8 2.8 2.8Off-peakEnegy Yeanatmaxvahie 00 0.0 00 00 0.0 0.0 0.0Energy Values Umt VkWh 2010Peak EneWy 3.57 445 3 57 3 57 3.57 3 57 3.57 3 67 3 77Daytime Enery 2.90 3.53 2 90 2.90 2 90 2.90 2.90 2.97 3 04Off-peak Eney 2.76 2.76 276 276 276 2.76 2.76 2.76 2.76
Energy BenefitsPeak Energy S000 S008 S016 $025 $033 S0.34 $035Dayt-e Enegy $0 00 $0 02 $004 $006 $0.08 $0 08 $0.09Off-peak Enewy PVs (1996) $000 S0 00 S0 00 $000 $0.00 $0.00 $000TOTAL S3A7 SO.00 S0.10 50.20 S0.31 SOA5 $042 $043
CAPACITY Caparity Wmntr 700 0.20% 95% 665 0 663 7 662 3Added Capacity 7.0 7.0 7.0Capacity Valued 0 0 0 0 00S Benefit Unit Value $SkW $441 $0.69 50.00 50.00 10 $00 S .00 o 000 $00
O&M Cost Savng base vaue ($- 10^3) S58 annual mcae 2.00% $0.51 so.00 $0.01 50.03 $0.04 $0.06 $006 S006O&M (1996) S58
TOTAL BENEFIT S4.67 $0.00 $0.12 50.23 $S035 SA7 $0.48 $0A9
INVESTMENT COSTS $4.06 $0.00 S1.10 51.62 S2.61 $0.17 s$.08
NET CASH FLOW NPV $0.61 $0.00 -$0.98 41.38 42.26 50.30 50.40 $0.49IRR 11.7%
ENVIRONbENlTAL BENEFITS Umt Value (cJkWh) PVeS02 Emusmsons 0.78 $0.70 S0 000 $0 023 S0 047 S0 070 S0 093 S0 093 S0 093NOX Emissions 0.08 S0.07 $0 000 $0 002 $0 005 $0 007 $0 009 $0 009 $0 009CARBON ussions 0.26 S0.57 $0000 S0008 $0016 S0023 S0031 S0031 $0034TOTAL Emssion Benefit S1.35 $0000 S0.034 50067 $0101 $0134 $0134 S0137
NET CASH FLOW w/enusssons NPV S.96 $0.00 -50.95 48.32 42.16 SOA3 S0.53 $0.63IRR 14.9%
all energy numbers are average GWhbyral eapaelty numbers are In MWal Snumb are In mIlMlons
-90 -
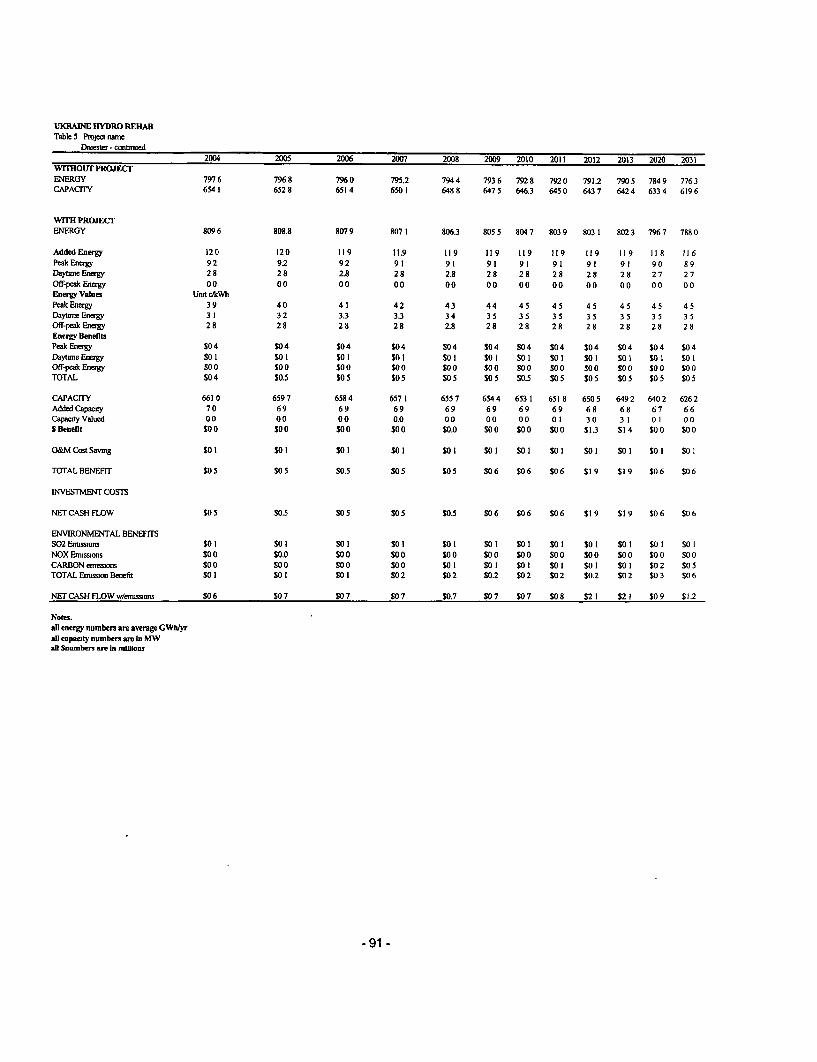
UKRAINE HYDRO REHABTable 5 Project name
Dmnester -conttnued
2004 2005 2006 2007 2008 2009 2010 2011 2012 2013 2020 2031WITHOUT PROJECrENERGY 797 6 796 8 796 0 795.2 794 4 793 6 792 8 792 0 7912 790 5 784 9 776 3CAPACITY 6541 652 8 6514 6501 648 8 647 5 6463 645 0 643 7 642 4 633 4 619 6
WrrH PROJECTENERGY 809 6 808.8 807 9 8071 806.3 805 5 804 7 803 9 8031 802 3 796 7 788 0
AddedEnergy 120 120 119 11.9 119 119 119 119 119 119 118 116PeakEnegyy 92 92 92 91 91 91 91 91 91 91 90 89DayineEnagy 28 28 2.8 28 2.8 28 28 28 28 28 27 27Off-peak Energy 00 00 00 00 00 00 00 00 0 0 0 0 0 0 00Energy Values Unit c/kWhPeakEnegy 39 40 41 4.2 43 44 45 45 45 45 45 45DaytmeEnegy 31 32 3.3 3.3 34 35 35 35 35 35 35 35Off-peakEnergy 28 28 28 28 2.8 28 28 28 28 28 28 28Energy BenefitlPeak Energy $0 4 S04 $04 $04 $04 $0 4 $0 4 $0 4 $0 4 S04 S04 $0 4DaytimeEnergy S0 I S0 I S0 I S0 I S0 I S01 $0 $ S0 I S0 I S0 I S01 $0 1Off-peak Enegy S00 $0 0 $0 0 S0o0 S0 $0 0 S00 $ 0 $ 00 $0 0 S0 0 S$ 0TOTAL $0 4 $0.5 $0 5 $0 5 $0 5 S0 5 $0.5 $0 5 $0 5 S0 5 $0 5 $0 5
CAPACITY 6610 6597 6584 6571 6557 6544 6531 6518 6505 6492 6402 6262AddedCapacity 70 69 69 69 69 69 69 69 68 68 67 66Capacity Valued 0 0 00 00 0.0 00 00 00 01 30 31 01 00S Beneflt S00 $ 0 $ 00 $ 00 $0.0 S00 $ 0 $ 00 $1.3 $1 4 S0 0 S$ 0
O&M Cost Savmng $01 $01 1SO I SO I SO I SO 1 $0S1 $01 1SO I SO I SO I SO I
TOTALBENEFIT $05 S05 S0.5 $05 $05 $06 $06 $06 $19 S19 S06 $06
INVESTMENT COSTS
NET CASH FLOW S05 $0.5 S0 5 $0 5 S0.5 $0 6 $0 6 $0 6 $1 9 $1 9 $0 6 $0 6
ENVIRONMENTAL BENEFITSS02 Emissions $0 1 $0 $ S0 I S0 I S0 I S0 I S01 $0 $ S0 I S01 $0 $ S0o1NOX Emissions S00 $0.0 $0 0 S00 $00 S00 $ 0 $ 00 $ 00 $ 00 $ 00 $0 0CARBONemissions SO0 $0S0 SOO SOO SO I SO1 $0I 1 o 01 $0 1 $0 1 $02 $05TOTAL Emonion Benefit $0 1 S0 I S0 I $0 2 $0 2 $0.2 $0 2 $0 2 $02 $S02 $0 3 $0 6
NET CASH FLOW w/anusions $0 6 S0 7 $0 7 $0 7 S0.7 $0 7 $0 7 $0 8 $2 1 S2 I $0 9 $1 2
Notes.all energy numbers are average GWh/yrall eapacty numbers are in MWall Snumbers a,e In mnilon
-91-
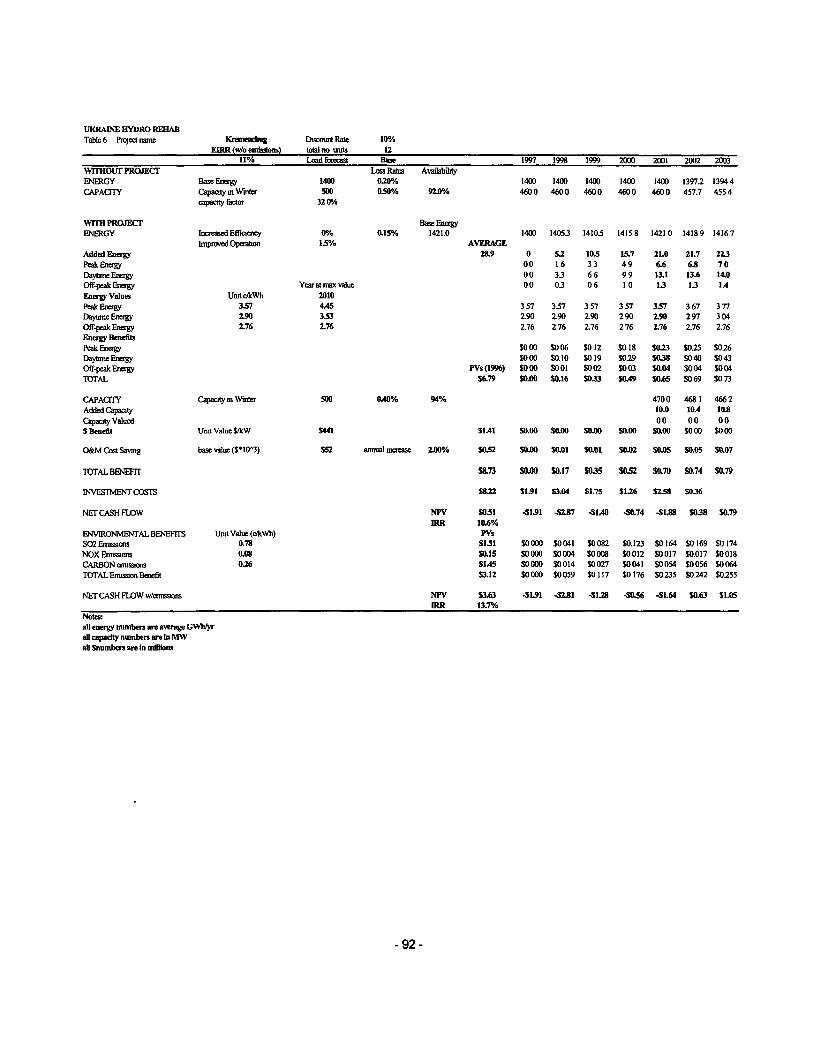
UKRAINE HYDRO REHABTable 6 Project nmne Kremendtug Disoant Rate 10°/e
EIRR (w/o enions) total no ats 1211% Load frest Base 1997 1998 1999 2000 2001 2002 2003
WllHOUr PROJECr Lnss Rates AvaiablityENERGY BaseEnergy 1400 0.20% 1400 1400 140D 1400 140D 13972 13944CAPACITY Capacityim Wute S00 050% 92.0% 4600 4600 4600 4600 4600 457.7 4554
eapacity factor 32 OA
WrlEH PROJECr Base EnmuyENERGY IrreasedEfficiency 0°h 0.15% 1421.0 1400 14053 14105 14158 14210 14189 14167
hnpavedOpaon 1.5% AVERAGEAdded Enagy 28.9 0 5.2 10.5 15.7 21.0 21.7 223Peak E 00 16 3 3 49 6.6 6.8 70DaytimEn ey 00 33 66 99 13.1 13.6 14.0Off-peakEnergy Year at maxvalue 00 03 06 10 1.3 1.3 IAEnergy Values Umt ckWh 2010Peac Enaegy 3.57 4A5 3 57 3.57 3 57 3 57 357 3 67 3 77DaytimeEnergy 2.90 3.53 2.90 2.90 2.90 290 2.90 297 304Off-peakEnerwy 2.76 276 2.76 276 2.76 276 2.76 2.76 276Energy BenefitsPeak Enegy $0 00 S0 06 S012 $0 18 S0.3 $025 $026[atyte ESOy SOO0 SO.IO $019 S029 S0.38 S040 $043Off-peakEnergy PVs(1996) SO00 SOO $002 S003 50.04 $004 S004TOrTAL S6.79 5.00 $.16 $0.33 S0A9 S0.65 $069 SO 73
CAPACrfY Capacty m Wter 500 0.40% 94% 4700 468 1 466 2Added Capacity 10.0 IOA 108Capacity Valued 00 00 00S Benefit Unit Value SkW S441 SA1 SO.00 50.O0 50.00 S5O0 $00oo $000 $000
O:M CostSavmg base vale (Sl10-3) S52 annual mnmase 2.00% 0.52 $0.00 .OI $0.01 0.02 50.05 SO.05 50.07
TOTALBENEFIr $8.73 $0.00 $0.17 S0.35 $052 S0.70 $0.74 S0.79
INVESMENTCOSTS S.22 S1.91 5304 $1.75 51.26 S258 0.36
NET CASH FLOW NV $0.51 41.91 -2.87 -A10 -0.74 -1.88 $0.38 079IR 10.6%
ENVIRONMlNTAL BENEFTrS Unit Vahlc (ctkWh) PVsS02Emissions 0.78 51.51 $0000 $0041 $0082 S0.123 $0164 $0169 $0174NOX Eissions 0.08 .IS 1 $0000 $0004 $0008 S0012 S0017 S0.017 $0018CARBON enissa 026 SIAS $0000 S0014 S0027 S0041 $0054 S0056 S0064TOTAL Emission BSeeit $3.12 $0000 $0059 $0117 $0176 $0235 S0242 $0255
NETCASHFLOWw//mua NPV 53.63 41.91 -2.81 41.28 -50.56 4L64 $0.63 51.05IRR 13.7%
Notewall energy mnmbers are average GWhlyras capadty nuibers are In MWall Snunbers are In mIllIons
- 92 -
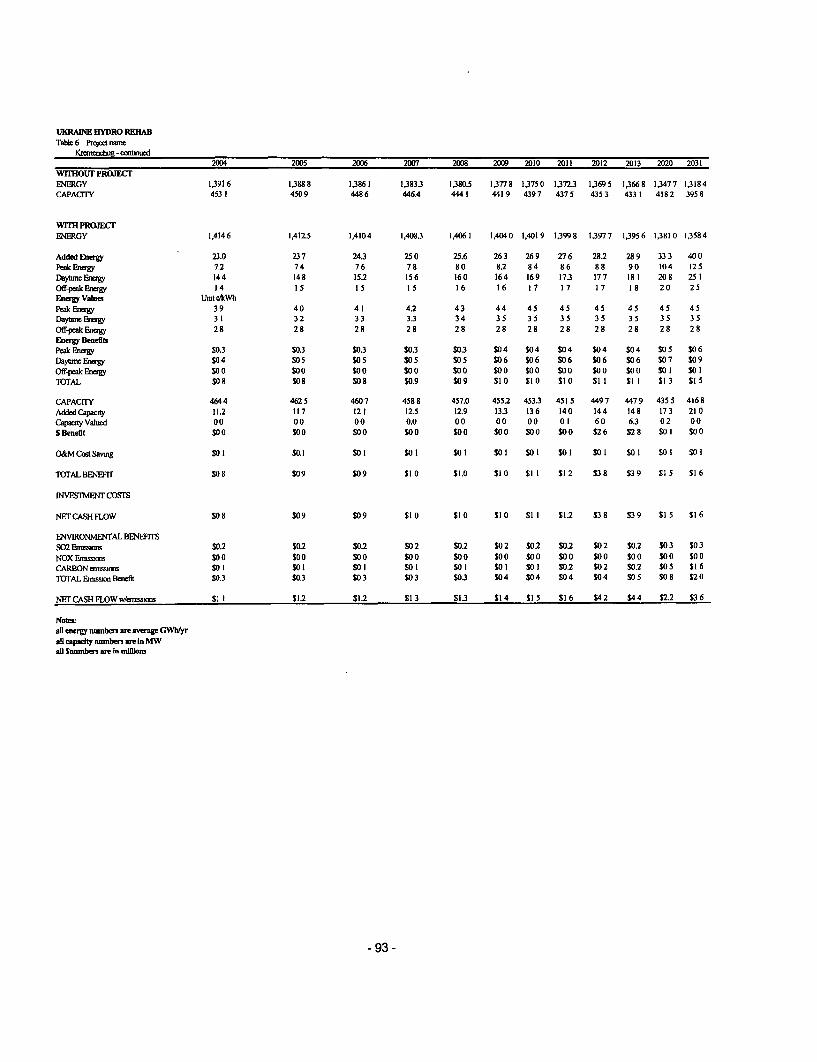
UKRAE4E HYDRO REHABTable 6 Proect narn
KuanL -coninuod2004 2005 2006 2007 20 20 2009 2010 2011 2012 2013 2020 2031
WrmOUr PROJECrENERGY 1.3916 1,3888 1,3861 1,3833 1,380.5 1,3778 1,3750 1,372.3 1,3695 1,3668 1,3477 1,3184CAPACITY 4531 4509 4486 446.4 4441 4419 4397 4375 4353 4331 4182 3958
wrm PROJECrEIERGY 1,4146 1,412.5 1,4104 1,4083 1,4061 1,4040 1,4019 13998 1,3977 1,3956 1,3810 1,3584
Added Energy 23.0 23 7 243 25 0 25.6 26 3 26 9 27 6 28.2 28 9 33 3 40 0
PeakcEmey 7.2 74 76 78 80 8.2 84 86 88 90 104 125
DaytmeqE- y 144 148 152 156 160 164 169 173 177 181 208 251Off-p-kEneuy 14 15 15 15 16 16 17 17 17 18 20 25Energy Valuh Umt dkWhPeakEnEEy 39 40 41 4.2 43 44 45 45 45 45 45 45DaytnneEnagy 31 32 33 33 34 35 35 35 35 35 35 35
Off-peakEnagy 28 28 28 28 28 28 28 28 28 28 28 28
Energy BeneftsPeak Eneny $03 S03 $03 $03 $03 $04 S04 S04 S04 $0 4 $0 5 $0 6
Dayt EneWgy S04 $0 5 S0 5 $0 5 S0 5 $0 6 S0 6 $0 6 $0 6 S06 $0 7 $0 9
Off.-k Energy SO S00 $0 0 $0 0 $0o0 S0 $S00 S00 $ 00 S00 S01 $0 1TOTAL $08 $08 S08 $0.9 $09 $1 0 Si 0 S 0 $1 I Si I Si 3 SI 5
CAPACITY 4644 4625 4607 4588 457.0 455.2 4533 4515 4497 4479 4355 4168
AddedCapacity 11.2 117 121 12.5 12.9 133 136 140 144 148 173 210Capaty Valued 00 00 00 0.0 00 00 00 01 60 63 02 00SlBenefit S00 S00 S00 S00 S00 S0 S00 S000 S26 S28 $0 $ S00
O&MCoatSavnig SO I SO. I SO1 $01 1SO I SO1 $01 1SO I SO I SO I SO I SO I
TUrALBENEFIT S08 $09 $09 S10 $1.0 $10 $11 $12 $38 S39 S15 $16
fVESMET COSTS
NETCAS9FLOW S08 $09 S09 S10 $1 0 S$10 $1 I S12 S38 S39 $15 S16
ENVIRONMENTAL BENEFTISS02 EaissSo $02 $0.2 $0.2 $02 S02 $0 2 $0.2 S02 $02 $0.2 $03 S0 3
NOXEnussitan S00 S00 S00 S00 S00 S00 S00 S00 S00 S00 S00 S00CARBONanissions S01 S01 $01 S01 $01 S01 S01 $02 $02 $0.2 $05 S16
TOTAL Fmssi Benefit S03 $03 $03 S03 S0.3 S04 $0 4 $0 4 $0 4 S0 5 $0 8 S20
NErCASHFLOWw/cmissionn $11 $S12 $1.2 $13 $13 $14 $15 S16 $42 S44 S22 S36
NnotesaDl energy numbers are avera GWh/yraD capadty numbers are In MWa Snumhnb re am mMioms
-93 -
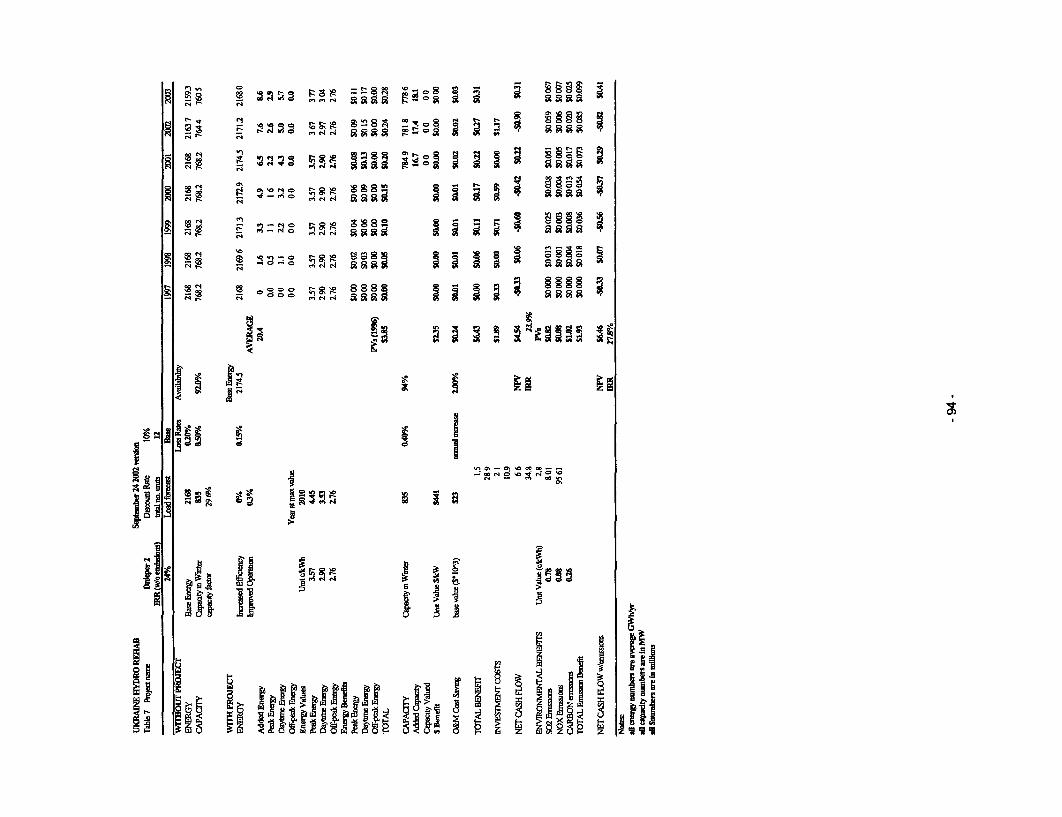
t sw >:Wto og 888 g g M | 4 gSaad S C;-
ffio~e 0 X " s8ai iaWaW a a E Cli~~~~~~~~~~~~~~~~~~~~~~~~~~~~C
MIS S 9U~~~~~~~~~~~~~~~U s al
00- \ 0 00 0o_ I. _swaOiI "e s Ssi
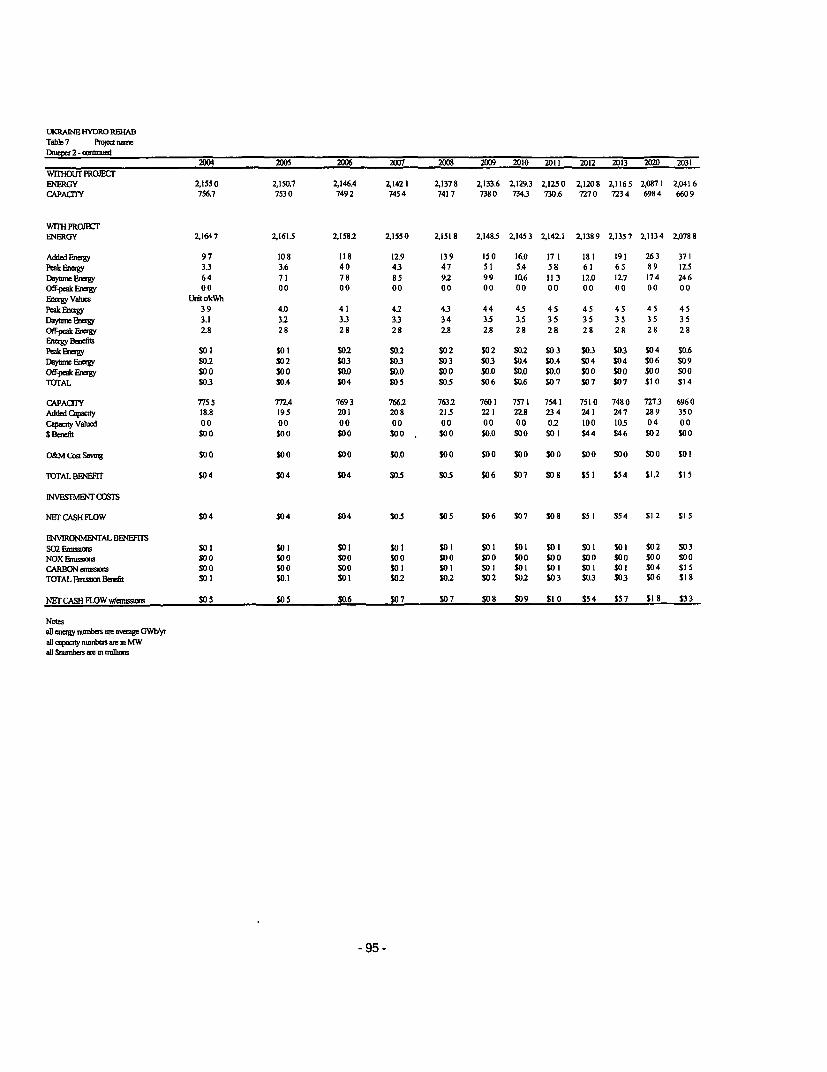
UKRANE HYDRO REHABTable 7 Pojectmnp:Dlepe 2 -o d
2004 2005 2006 2007 2008 2009 2010 2011 2012 2013 2020 2031wnlHoLTr PROECTENERGY 2,1550 2,150.7 2,146.4 2,1421 2,1378 2,133.6 2,1293 2,1250 2,1208 2,1165 2,0871 2,0416CAPACTY 756.7 7530 7492 7454 7417 7380 7343 730.6 7270 7234 6984 6609
wtnl PROJBrENERGY 2,1647 2,161.5 2,1582 2,1550 2,1518 2,1485 2,1453 2,14ZI Z1389 2,1357 Z1134 2,0788
Added lmi 97 10.8 118 12.9 139 150 16.0 17 1 181 191 263 371Pek EnaW 33 3.6 40 43 47 51 5A 58 61 65 89 12.5DaylreEy 64 71 78 85 9.2 99 10.6 113 12.0 127 174 246Off-pekaEgy 00 00 00 00 00 00 00 00 00 00 00 00mgy Values Unit ckWh
Peak EncV 39 4.0 41 42 43 44 4.5 45 45 45 45 45DwstlneEim m 3.1 32 33 33 34 3.5 3.5 35 35 35 35 35Off-peak Ey 2.8 28 28 28 2.8 2.8 28 28 28 28 28 28Erg y BaefiPeakEnugy SOI $01 $0.2 S02 $02 $02 $02 S03 $03 $03 $04 $0.6DaytImeEnaW $0.2 S02 $03 $0.3 $03 $03 $0.4 $0.4 $04 $04 $06 $09OffpeakEiegy $00 S00 $0.0 $0.0 S00 $0.0 $0.0 $0.0 $00 SOO $00 $00TOTAL $03 $0.4 $04 S05 S0.5 $06 $0.6 S07 S07 $07 $10 $14
CAPACTrY 7755 7724 7693 7662 7632 7601 7571 7541 7510 7480 7273 6960Addedapay 18.8 195 201 208 21.5 221 22.8 234 241 247 289 350CapqtyVahmd 00 00 00 00 00 00 00 02 100 105 04 00SBanefa S00 S00 S00 S00, S00 $0.0 $00 S01 $44 $46 S02 S00
O&M GM SavSg SOO$ $00 SOO SO.0 SO $00 $00 $0S 0 $00 $00 SOO $01
TOTALBENEFIT $04 $04 S04 $0.5 $0.5 $06 $07 S08 $51 S54 $12 S15
NVESTTCOSTS
NMrCASHFLOW $04 $04 $04 $0.5 S05 $06 $07 S08 $51 $54 $12 $15
ENVIRONMENTAL BENEFHSS02Ormsm $0 1 S01 S01 $01 S01 S01 S01 0s1 $01 $01 $02 $03NOX EnssKm S0 0 S00 S00 S0 0 S0 0 $0 0 0 0 $00 $00 $00 S00 S00CARBONNrism m SO0 Soo $ $0S0$001 S0o 0s1 $01 S0I S01 $01 $04 $15TUrALI EameBemfn $01 $0.1 $01 $0.2 $02 $02 S02 $03 $0.3 S03 S06 $18
NErCASHIFLOWwlwanusa S05 $05 $0.6 $07 S07 S08 $09 $10 $54 $57 $1 8 $33
Notesall 1m y mnsi are vase GWh/yrall cspity numbas am mn MWan $umnbrs me mn msias
-95 -
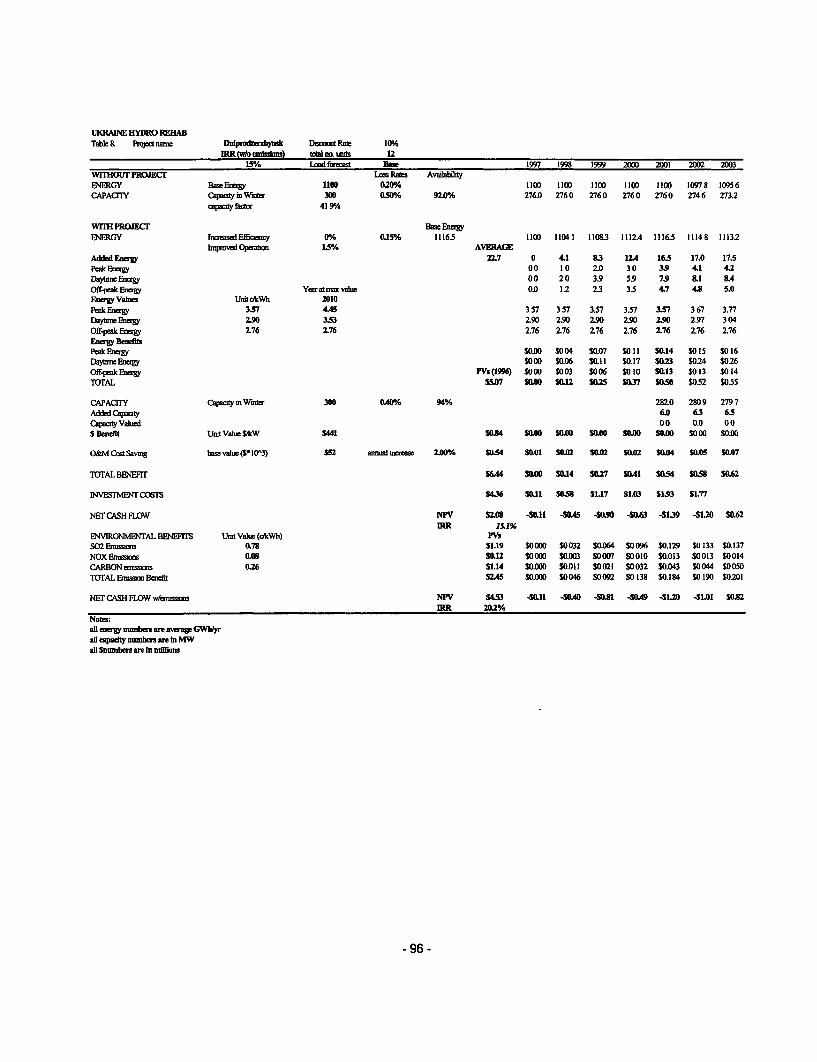
UKURAEiE HYDRO RF.13ABTable 8. Project namp Dsonit Rate 19%
IRR(w/emssoa) tb K ts 12150%. Lad frt Bm 1997 1998 1999 200D 2001 2002 2003
WrIHOUr PROJECI Loss Pat AvilabiltyENERGY Base liV 1100 0.20% 1100 1100 1100 1100 1100 10978 10956CAPACnY Caaciy in Wmter 300 0.50% 92.0%1 276.0 2760 2760 276 0 2760 274 6 273.2
cin fitya 419%
W7TH PROECT BENERGY bheasedEffimamcy 0°% 0.15% 11165 1100 11041 11083 1112.4 11165 11148 11132
hnxlvd Op i 1.5L% AVERAGEAddedEnwg 22.7 0 4.1 83 124 165 17.0 17.5PeakEnegy 00 10 2.0 30 39 41 4.2Dayt Enay 00 20 3.9 5.9 7.9 8I 84Off.p-kEnngy Yewrat mvalue 0.0 1.2 2.3 35 47 4.8 5.0EnW Vahlo LIhttokWh 2010Peak Eny 357 445 3 57 3 57 357 3557 37 3 67 3.77DaytimeE-Vy 2.90 3.53 2.90 2.90 290 2.90 2.90 2.97 304Off-peak Enay 276 2.76 2.76 2.76 276 2.76 2.76 2.76 2.76Ene flenebPeak Ene 0.00 5004 S0.07 S011 5014 5015 $016Daytir-Enuy $000 $0.06 $0.11 $0.17 0.23 S0.24 $026Off- ik E- PVs(1996) $000 $003 $006 $010 S.13 S013 $014TOTAL 55.7 50.00 512 5025 5037 0.50 $0.52 $055
CAPACrY Capaciy m Wmtr 300 0A40% 94% 282.0 280 9 279 7Added Caaqty 6.0 63 6.5Ca=rty Valued 0 0 0.0 00S Beneflt Uni VaheS$/kW 5441 S0.84 50O s5000 S00 50.0 50.0 $000 $0.00
O&M Cot Savng basevalue(S1093) 552 ami mmmese 200 50.54 50.01 50.02 0.02 50.02 50.4 50.5 50.07
ITOAL BENETr S644 50.0 50.14 0.27 SA041 S0S4 S58 50.62
INVESrTW 1C761 S4.36 S.II S0.58 S1.17 L03 51.93 51.77
NET CASH nOW NPV SLO -0.11 40.45 -4090 -50.63 41.39 41.20 50.62IRR .SI%
ENVIRONMENTAL BENEFrS Unit Value (dkWh) PVaS02 Emion 0.78 S.19 $000O $0032 50.064 $0096 50.129 $0133 S0.137NOX Ensms 0.08 S.12 $OODO S0.003 $0007 $0010 50.013 $0013 $0014CARBONaensum 0.26 S1.14 50.000D 5.011 $0021 $0032 50.043 $0044 50050TOTAL Enusam Baifit $2.45 $0.CO S0046 $0092 SO138 50.184 $0190 S0201
NET CASH FLOW wmo NPV 4.53 -QII -440 -4.81 -0.49 41.20 41.01 50.82IRR 20.2%
Notest:aD enegy nmbe ar avanr GWhsyr
ail eapdly numbe asre an MWall Smmbnm am In millons
- 96-

UKRAINE HYDRO REHABTable 8 Pect narnDipmpd2 iynsk -coned
2004 2005 2006 2007 2008 2009 2010 2011 2012 2013 2020 2031
WIIMOU PROJECTIENERGY 1,093.4 1,0912 1,0890 1,0869 1,0847 1,0825 1,0804 1,0782 1,0760 1,0739 1,0589 1,0359
CAPACrrY 2719 2705 269.2 2678 2665 265.2 2638 2625 2612 2599 2509 2375
WMI PROJECrENERGY 1,1115 1,1098 1,1082 1,1065 1,1048 1,1032 1,1015 1,0999 1,0982 1,0966 1,0851 1,0673
AddedEnerg 18.1 186 191 196 201 20.6 212 217 222 227 262 315Peak Ener 4 3 4 4 4 6 4 7 4 8 4.9 5 1 5.2 53 5 4 63 7 5
DaytmeEJ1u 86 89 91 94 9.6 99 101 104 106 108 12.5 150Off-peak Enegy 5 1 53 5 4 5 6 5 7 5 8 6 0 6 1 63 6 4 7 4 8 9
Energy Valuhs Unit dcWhPeak Energ 3.9 4 0 4 1 42 4 3 4 4 4 5 4.5 455 45 4 5 4 5Daymne Engy 3 1 3.2 3 3 33 3 4 35 3 5 3 5 35 3.5 35 3 5OffpeaukEniy 28 28 2.8 2.8 2.8 28 28 28 28 28 28 28
Energy BenefitPeakEner $02 $02 $02 $0.2 $02 $02 $02 $02 S02 $0.2 $03 $03
Day- E-eBY $03 $03 S03 $03 $03 $03 $04 $04 $04 $04 $04 $05
Off-peakEnergy SO1 $01 S01 $02 S02 $02 $02 $02 $02 $02 S02 $02
TOTAL $0.6 $06 $06 $07 S07 S07 $07 S08 $08 $08 $09 $1 I
CAPACITY 2786 2775 2764 2753 2742 2731 272.0 2709 2698 2688 2613 2501AddedCapacty 67 70 72 75 77 80 82 84 86 89 104 126
CapactyVahied 00 00 00 00 00 00 00 01 36 38 01 00SBenedfit S00 S00 S00 SO.0 S00 $00 S00 S00 $16 $17 S01 $00
O,&M Cast Savmg SO I SO I $01 $0I1 $so I S0 1 $0S1 $0 I $01 $0 $ S01 $0 1
TOTALBENEFIT S06 $0.7 $07 S07 $08 $08 $08 $09 $24 $2.5 Sl1 $12
INVESE COSTS
NEr'CASH FLOW $06 S0.7 $07 $07 $08 $08 $08 $09 $2.4 S2.5 $l1 $1 2
ENVIRONMENTAL BENEFTnSS02 Ernussao S01 $0 1 S0 1 $02 $0.2 $0 2 $0.2 $0.2 $0.2 $0 2 $0 2 S02NOX Enrims $00 S00 $00 S00 S00 $0.0 S00 SO0 $00 $0 0 SO0 $00
CARBONenisimas S01 S0.1 $01 S01 S01 S01 S01 S01 $01 S02 $04 S13TOTALEniusmonBncfit $02 $02 $02 $03 $03 $03 $03 $03 $03 $04 $06 $1 6
NETCASHFFLOW sDt'rues $09 S0.9 $09 $10 $10 $1S $1.1 $12 $28 S29 $17 $28
Notes:all energy numbers are aveage GWbtyraD cnpadly numbees ane In MWall Snaeabrm are bn eallliae9
- 97 -
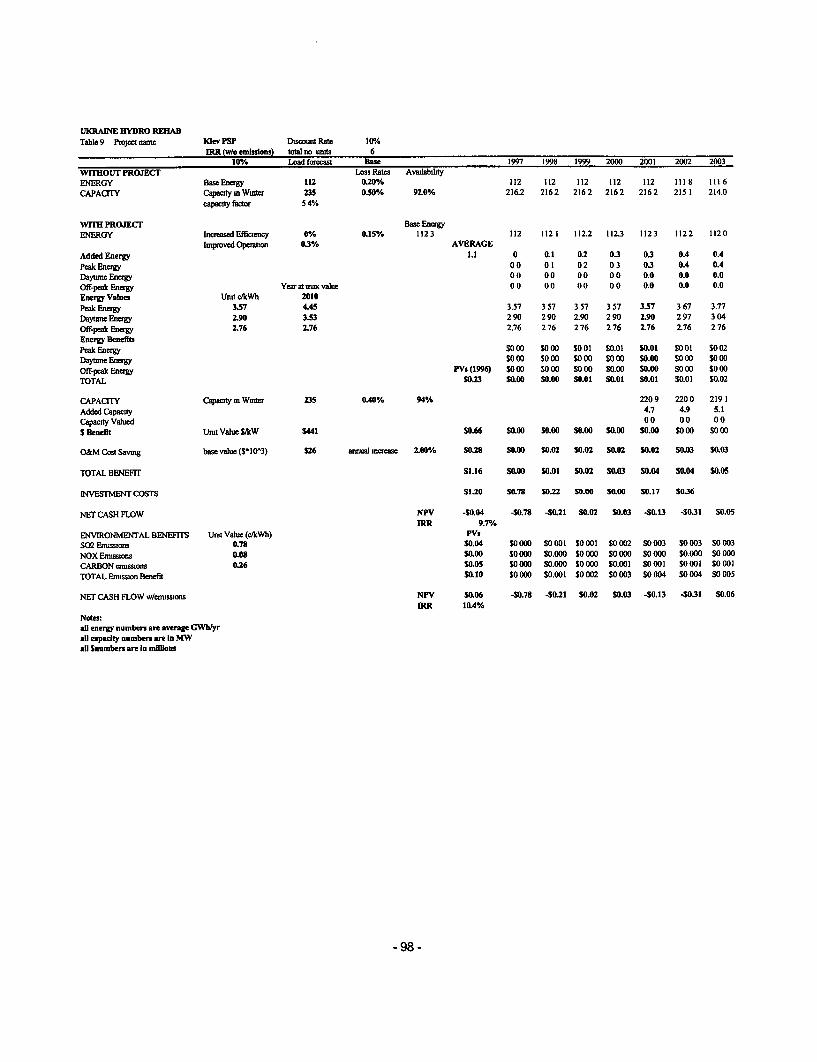
UKRAINE HYDRO REHABTable 9 Piject name KIev PSP Disount Rate 10
1ff
IRR (vdo emissdons) total no unts 610% Load forecast Base 1997 1998 1999 2000 2001 2002 2003
WITHOUT PROJECT Lots Rates AvalabilityENERGY BaseEnergy 112 0.20% 112 112 112 112 112 1118 1116
CAPACITY Capacity mWmter 235 0.50% 92.0% 216.2 2162 2162 2162 2162 2151 214.0
capacity fctor 5 4%
WITH PROJECT Base EnergyENERGY IncreasedEfficiency 0% 0.15% 1123 112 1121 112.2 112.3 1123 1122 1120
Inpoved Operahon 0.3% AVERAGE
Added Energy 1.1 0 0.1 0.2 0.3 0.3 0.4 0.4
Peak Energy 00 01 02 03 0.3 0.4 0.4
Dayume Enegy 00 00 00 00 0.0 0.0 0.0
Off-peak Enegy Year at mx value 00 00 00 00 0.0 0.0 0.0
Energy Value Umt ctkWh 2010Peak Energy 3.57 4.45 3.57 3 57 3 57 3 57 3.57 3 67 3.77
Daynn eEnergy 2.90 3.53 2 90 2 90 2.90 290 2.90 2 97 3 04
Off-peak Emgy 2.76 2.76 2.76 2 76 2 76 276 2.76 2.76 2 76
Energy BenefltsPeak Enegy $000 SO00 $001 S0.01 50.01 $001 $002
Daytne Enegy $0 00 SO 00 $000 $0500 $0.00 $000 $0 00
Offpeak Energy PVs(1996) $000 S000 $000 $0.00 $0.00 $000 $000
TOTAL S0.23 $0.00 $0.00 50.01 $0.01 $0.01 S0.01 $0.02
CAPACITY Capacity m Wnter 235 0.40% 94% 2209 2200 2191
Added Capacity 4.7 4.9 5.1
Capacty Valud 00 00 00S Benefit Umt Value SkW $441 $0.66 $0.00 $0.00 50.00 50.00 S0.00 $0 00 S$ 00
O&M Cost Saving base value ($-I103) 526 annual mcrease 2.00% $0.28 $0.00 50.02 50.02 S0.02 50.02 S0.03 S0.03
TOTAL BENEFIT 51.16 50.00 50.01 50.02 50.03 50.04 $0.04 50.05
VESTIENT COSTS S1.20 S0.78 50.22 S0.00 .00 S0.17 $0.36
NET CASH FLOW NPV -$0.04 -50.78 -50.21 50.02 S0.03 40.13 -5031 S0.05IRR 9.7%
ENVIRONMENTAL BENEFITS Umt Value (c/kWh) PVsS02 Emnssan 0.78 S0.04 S0000 $0001 $0001 $0002 $0003 $0003 $0003
NOX Enussions 0.08 50.00 $0000 $0.000 $0 000 $ 000 $0 000 S.000 $0 000
CARBON eissons 0.26 50.05 S0000 S0.000 S0000 S0.001 $0001 $0001 $0001
TOTAL Enussion Baiefit $0.10 50 000 $0.001 $0 002 $0 003 S0 004 S0 004 $0 005
NET CASH FLOW w/emnisions NPV 50.06 -50.78 40.21 50.02 $0.03 -$0.13 40.31 S0.06IRR 1Q4%
Notes:al energy numben are average GWhlyrall eapadty numbers are In MWall Snumbers are In millorns
- 98 -
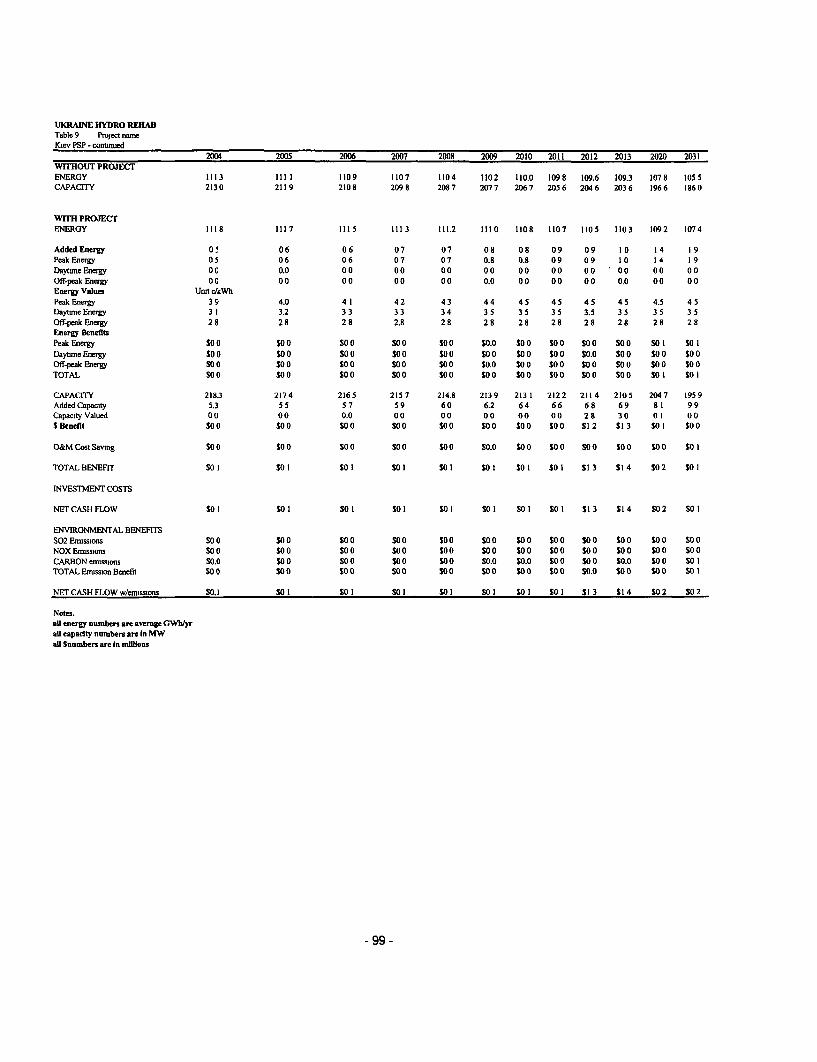
UKRAINE iHYDRO REHABTable 9 Project nateKiev PSP -contued
2004 2005 2006 2007 2008 2009 2010 2011 2012 2013 2020 2031WITHOUT PROJECTENERGY 1113 1111 1109 1107 1104 1102 110.0 1098 109.6 109.3 1078 1055CAPACITY 2130 2119 2108 2098 2087 2077 2067 2056 2046 2036 1966 1860
WITH PROJECTENERGY 1118 1117 1115 1113 111.2 1110 1108 1107 1105 1103 1092 1074
AddedEnergy 05 06 06 07 07 08 08 09 09 10 14 19Peak Energy 05 06 06 07 07 0.8 0.8 09 09 10 14 19Daytime Energy 0 0 0.0 0 0 0 0 0 0 0 0 0 0 0 0 0 0 0 0 0 0 00Off-peak Energy 0 0 0 0 0 0 00 00 0.0 00 00 00 0.0 00 00Energy Values Unit c/kWh
PeakaEnergy 39 4.0 4 1 42 43 44 45 45 45 45 4.5 45Daytotne Energy 31 3.2 33 33 34 35 35 35 3.5 35 35 35Off-peakEnergy 28 28 28 2.8 28 28 28 28 28 28 28 28Energy BenefitsPeak Energy S00 S00 S00 S00 S00 $0.0 S00 S00 S00 S00 $0 I $0 IDayltne Enegy S00 $ 00 $ 0 $ 0 $S00 S0 $ 00 $ 00 S0.0 $0 0 S00 $0 0Off-peak Energy SO $ SO SOO SOO SO $0.0 S00 0 $00 0 $00 $00TOTAL S00 S00 S00 $ S0$00 $00 $00 $00 S0 S00 S0 I S01
CAPACITY 2183 2174 2165 2157 214.8 2139 2131 2122 2114 2105 2047 1959Added Capacity 5.3 5 5 5 7 5 9 6 0 6.2 6 4 6 6 6 8 6 9 81 9 9Capacity Valued 0 0 0 0 0.0 0 0 0 0 0 0 0 0 0 0 2 8 3 0 01 0 0SBeneflt S00 S00 S00 $00 $00 S00 $00 S00 $12 $13 S01 S00
O&MCostSaving S00 S00 S00 $00 $00 $0.0 S0 0 $00 S00 S00 S00 S01
TOTALBENEFIT $01 S01 $01 S01 S01 S01 S01 S01 $13 $14 S02 SOI
INVESTMENT COSTS
NET CASH FLOW S0 I S0 I S0 I S0 I S0 I S0 I SO $ S0 1 $1 3 $1 4 S0 2 S0o1
ENVIRONMENTAL BENEFiTSS02 Emissions S00 $0 0 S00 $S00 S00 $ 00 $ 00 $ 00 $ 00 $ 00 o00 $ 0NOX Emissions $0 0 S00 $ 0 $0 0 S00 $0 0 $0 0 S00 $ 0 $ 00 $ 00 S00CARBONenussions SO.0 SO0 SOO $0S0 $0 $0.0 $0.0 $00 $0 $0.0 $0 S SO ITOTAL Efussion Benefit S00 $ 0 $ 00 $S00 S0o0 S0 $ 00 $00 SO.0 S0o0 S00 S01
NETCASHFLOWw/emissions S0.1 S01 S01 S01 S01 S01 S01 S01 $13 $14 S02 $02
Notes.all energy numbers are average GWh/yrall capacity numbers are In MWall Snumben are In millons
- 99 -

'U4 f' § fufI II g ;Wt
n~~ X3~~~~~~~~~~~~~
X3 lfl § ffi~~~~~~~~~~~~~~~~~~~~~~~~~~~~~~~~I

UERAUNEHYDRD88ABTable 10 P sqetrunKawv -oannal
2004 2005 _ 2D6 2007 2008 20 2010 2011 2012 2013 2020 2031V41M8UrPROJECrENGY gm8071 8055 8039 802.3 8007 7991 797.5 795.9 7943 792.7 7817 7647CAPAaCY 402.4 4004 398.4 3964 394A 392.4 390.5 388.5 3866 3846 3714 3514
WMr PROECTENERGY 8108 8096 8083 8071 8059 8047 803.5 8023 8011 7999 7915 7786
AdbleEawgy 36 40 4.4 48 52 5.6 60 64 68 72 98 139PeaklEney 1 7 1.9 21 2.3 25 2.7 Z9 3 1 32 34 47 67Dlt EeWy 19 2.1 2.3 Z5 2.7 2.9 3.1 3.3 35 37 51 72OfFfpeakEnmw 00 00 0.0 00 00 00 00 00 00 00 00 00E= VahPeak Em 39 40 41 4.2 43 44 45 4.5 45 45 45 45Daytm-EEi 31 32 3.3 33 34 35 35 3.5 35 35 35 35Off-MABErgy 2.8 2.8 2.8 2.8 2.8 2.8 Z8 28 2.8 2.8 28 2.8
Peak ESm I OI $0.1 S .I SD I SD1 $0.1 $1 $0 1 $01 $0 2 SO.2 $0 3Iw,imErW8 $0.1 SOI SD1 $01 $01 $0I $01 o SI SOI SOI $02 S03Offri,kEfm $00 0O $0O SOO SOO $0 $00 $00 SOO SOO SOO SOOTOTAL SO I SO$1 $0.2 $02 $02 S02 $02 $03 $0.3 $0.3 S04 $0 6
CAPAaCY 4124 4107 4091 4074 405.8 4042 402.6 401.0 3994 3978 3868 3701Adled apa,y 10.0 104 10.7 111 114 11.8 121 125 128 131 154 186C(atyVahsd 00 00 00 00 00 00 00 0.1 53 56 O0 00S Benefit $.O $O $0.0 $O $0O $O $00 $00 $2.3 $2.5 SOI SO0
O&MC4oSavn SOO SOO SOO SO $00 $00 $00 $00 $O $00 SOO $0S1
TOTAL BENEFTr S02 $02 $02 $02 $02 $03 $03 $03 S26 S2 8 $0 5 $0 6
INVESTIEN C61ST
NETCASHFLOW $02 S02 $02 $02 $02 $03 $03 $03 S26 S2 8 S0.5 $0 6
ENVITRNMrAL BEN13E;rSS02 Enms $00 SOO $0O $0S0 $0.0 $0O SOO SOO SO SOI SOI SOINOXIEmeu SOO SO $ $0.0 $00 $OO $O SOO 0 $0.0 $0.0 00 $00CARBON neanm SOO SO $0 $0.0 $0.0 $00 $00 $00 $00 0 SI S01 $06TOTAL fimm1 Baf $0.0 $O S0I $01 $0.1 SO1 $01 SOI $.1I SOI S02 $07
Er CASH FLOW ns m S02 S02 S02 $03 $03 S03 $04 S04 S2.8 S29 SO 8 S13
Not:aD ayau meabrs are avou GWWTag capadlynmben am In MWal S~wm are In ndmons
- 101 -
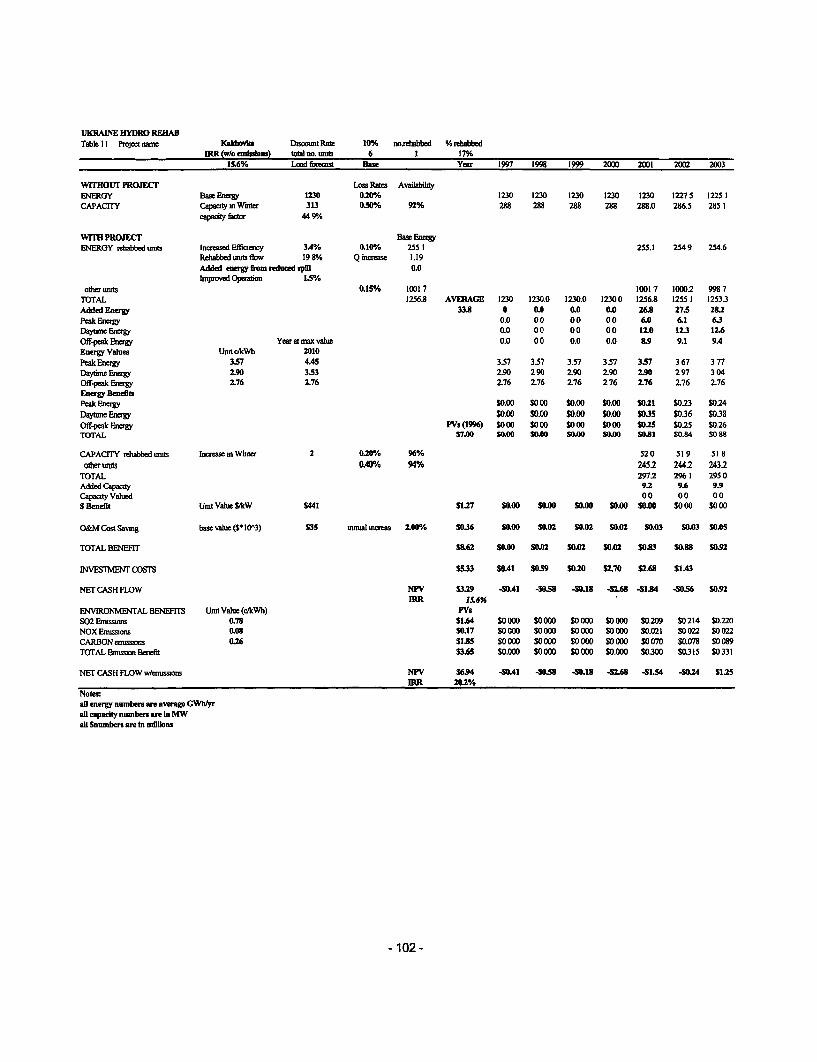
UIRAINE HYDRO REHABTable II Projea nane Kakbnid e Discunt Rae 10% norehabbed % rehabbed
IRR (win enislons) towlno tumts 6 1 17%15.6% Load focast Base Yar 1997 1998 1999 2000 2001 2002 2003
WrrHOUr PROJECF Loss Rates AvailabiltyENERGY Base Enmf 1230 0.20% 1230 1230 1230 1230 1230 12275 12251CAPACrrY Capacty as Wain 313 050/O 92% 288 288 288 288 288.0 286.5 2851
capacity fitr 44 9%A
WrIT PROJECT BaF EacegENERGY rehabbed wuts tnceased Efficiency 3A% 0.10% 2551 255.1 2549 254.6
Rebabbed wu flow 19 8% Q inrease 1.19Added eneny from nduced spll 0.0
nspcved Opea-tion 1.5obier units 0.15%A 10017 10017 1000.2 9987
TOTAL 1256.8 AVEltAGE 1230 1230.0 1230.0 12300 1256.8 1255 1 1253.3Added Energy 33.8 0 0.0 0.0 0.0 26.8 27.5 28.2Peak Eneiy 0.0 0 0 0 0 0 0 6.0 6.1 6.3Daye Ergy 0.0 0 0 0 0 0 0 12.0 12.3 12.6Off-peak Enegy Year at max vile 0.0 00 0.0 0.0 8.9 9.1 9AEney Values Undt c/kWh 2010PeakEnegy 3.57 4AS 3.57 3.57 3.57 3.57 3.57 367 377DaydEnewBgy 2.90 3.53 2.90 290 2.90 2.90 2.90 2 97 3 04Off-peak Enegy 2.76 2.76 2.76 2.76 2.76 276 2.76 2.76 2.76Enegy BenefbtsPealc EDcwgy S0.00 $000 $0.00 $0.00 S. $0.23 $024
Daytie Enzgy $0.00 $0.00 $0.00 $0.00 $0.35 S0.36 $0.38Off-peak nagy PV.(1996) S000 $000 $000 $000 S0.25 S0.25 $026TOTAL S7.00 S0.00 Sm0 s5.00 S0.00 50.81 S0.84 50 88
CAPACITY rebbbed wuts hnrease m Witr 2 0.20% 96% 520 519 518
Oither uts 0A0% 94% 245.2 244.2 243.2TOTAL 297.2 2961 295 0Added Capacity 9.2 9.6 9.9Capacity Valued 0 0 0 0 0 0S Benefit Unit Val S&W $441 S127 $0.00 $0.00 S0.00 O. $0.0 00 $000
O&M Cost Savig base vahle (S103) S35 nnual mcreas 2.00% 50.36 $0o. $0.02 $0.02 S.2 50.03 SO.03 S0.05
TOTAL BENEFIT S&t62 50.00 S0.02 SOD2 S0.02 S0.83 $0.88 S0.92
INVESIAENT COSTS $5.33 S0.41 S0.59 $D.20 S2.70 S2.68 SIA3
NEr CASH FLOW NPV S3.29 -S4A1 -S0S8 40.18 42.68 -51.84 -S0.56 $0.92IRR 116X
ENVIRONMENTAL BENEFITS Unit Vahle (chWh) PVsS02 Enassi 0.78 $1.64 SO000 S0000 $0000 S0000 S0209 $0214 S0.220NOXEmnissins 0.08 $0.17 $0000 S0000 $0000 $0000 $0.021 $0022 S0022CARBON emumca 0.26 S1.85 $0000 $S 000 S0 000 S0 000 $0070 S0.078 S0 089TOTAL Emison Benefit S3.65 S0.000 $0000 $0 50.0D0 S0.300 $0315 $0 331
NEr CASH FOW wAnusnsin NPV S6.94 -. AI -$058 40.18 42.68 -1S4 -$0.24 S.25BRu 20.2%
Notes:aDll eergy numbers are avnae GWb/yrad capacity numbers am In MWad Snumbers ae In mDlllons
- 102-
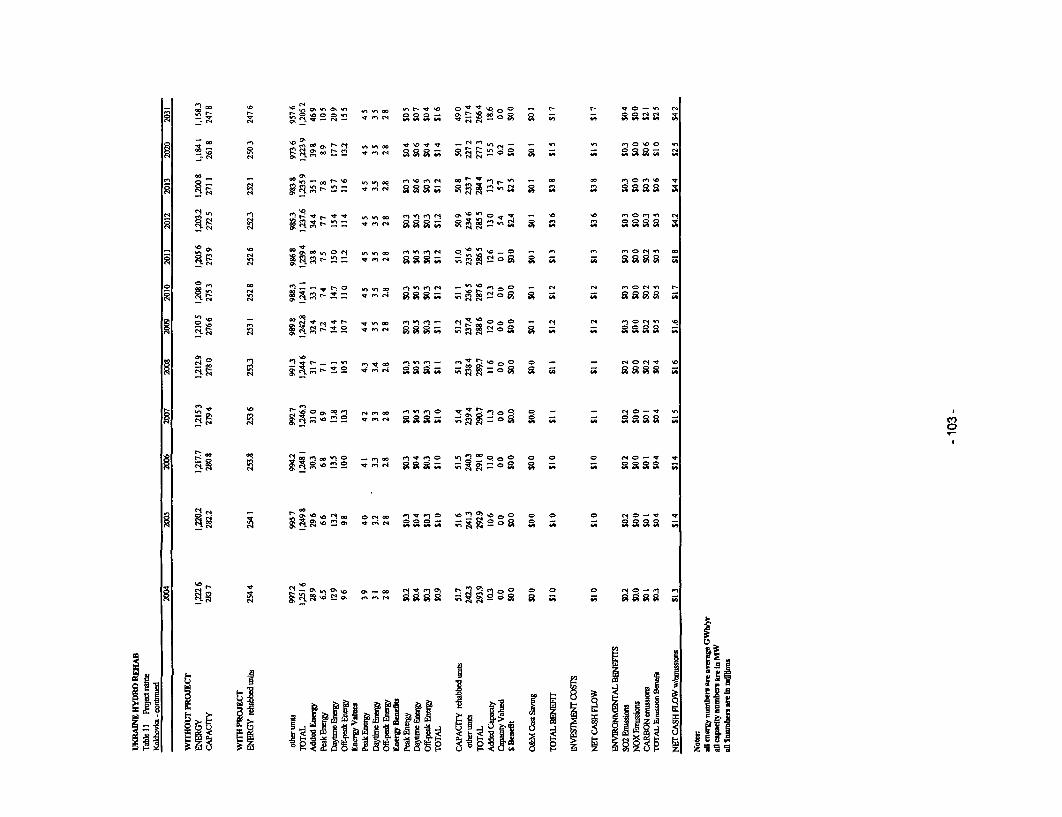
aaa <n~~~>°a a - S aaa
ass- ;"° a " - aa
Saar.u"o "aa
aa °° a SS a°
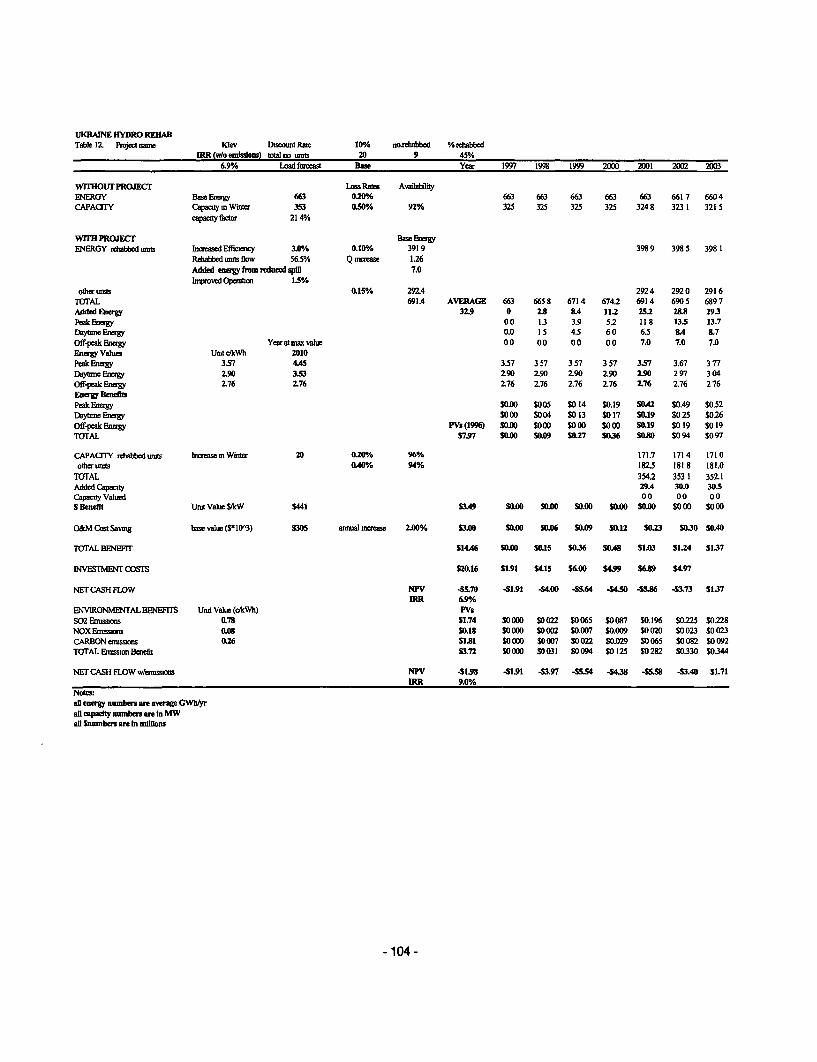
UKRAIE HYDRO REMABTable 12 Pnrjecnarne Kiev Disoud Rate 10-. nortabbed % rhabbed
IRR (w/o embslas) teal no tats 20 9 45°h6.9% Load fomeat Base Year 1997 1998 1999 2000 2001 2002 2003
WTHOUT'PROECT Loss Rats AvalabiliyENERGY BaseEnergy 663 020-o 663 663 663 663 663 661 7 6604CAPACITY Cacaty m Winmter 353 0.50/ 92% 325 325 325 325 3248 323 1 321 5
capacityfator 21 4%
Wrra PROJECr BaseagyENERGY mbboed units IzaswedEflcscy 3A.0 0.10% 3919 3989 3985 3981
Rehabbed tlUts flow 56.5% Q incet 1.26Added energy from reduced spl 7.0firpwved Opmaa 1.5%
oter umu 0.15% 292.4 2924 2920 2916TOTAL 691.4 AVERAGE 663 6658 6714 6742 6914 6905 6897AddedEnergE y 32.9 0 28 8&4 11.2 25.2 28.8 29.3Peak Enegy 00 1.3 3.9 5.2 11 8 13.5 13.7DaytteneEnm 0.0 15 4.5 60 6.5 84 8.7Off-peakEnerg YVesratmnavalw 00 00 00 00 7.0 7.0 7.0Enrgy Values Unit okWh 2010Peak El y 3.57 4A5 3.57 3 57 3 57 3 57 357 3.67 3 77Dayte Eneagy 2.90 3.53 290 2.90 2.90 290 2.90 2 97 3 04Off-peak Enugy 2.76 2.76 2.76 2.76 276 276 2.76 2.76 2 76Enegy BeuibPeaklcetgy $0.00 5005 S014 S0.19 S02 $0.49 $0.52Day1r- EnHg $000 $004 S013 $017 SO.19 $025 $0.26Off-peak Enr PVQ(1996) $0.00 $000 SO00 $000 SO.19 $019 $019TOTAL S7.97 SOD3 $0.09 50.27 536 $00 SO 94 $097
CAPAaCY rabbedn uts bnmase m W te 20 0.20-/ 96% 171.7 1714 1710obmie s 0.40%o 94% 1825 181 8 181.0
TOTAL 354.2 353 1 3521Added Capacity 29A 30.0 30.5Capaciy Vahled 00 00 00S Benefit Unit Vahle $/kW $441 S3A9 S0.00 $0.00 S0.00 $0D0 5.00 S 0 00 $00
O&MCostSavmg base vae (S103) S305 annalm e 2.00% 53.00 50.00 S0.06 S0.09 S0.12 $0.23 S0.30 $0.4
TOTAL BENEFrr 514A6 50.00 S0.15 S0.36 ASO8 S1.03 S1.24 SIX37
INVESTMENT COSTS S20.16 S191 S415 $O6.00 $4.9 $6.89 $4.97
NET CASH FLOW NPV -S70 41.91 -$4.00 -45.64 -$4450 -5.86 43.73 S1.37IRR 69%/
ENVIRONMENTAL BENfITS Unit Vahue (cfkWh) VS502 Emnsons 0.78 51.74 $0000 $0022 $0065 $0087 S0.196 $0225 S0.228NOXEnmsas 0.08 50.18 $0000 $0002 50.007 S0.009 $0020 $0023 S0023CARBON anmsmson 0.26 51.81 $0000 $0007 $0022 $0.029 $0065 $0082 $0 092TOTAL Enusszon Benefit $372 $0000 S0031 S0094 $0 125 $0282 50.330 S0344
NET CASH FLOW M1mussu NPV 41.98 41.91 -3.97 -SS.4 4438 -SS58 43A0 $1.71IRR 9.0%
Notes:al enrgy numben are avemae GWhyral capadty numbes are In MWall Snumben are In mnllions
-104-
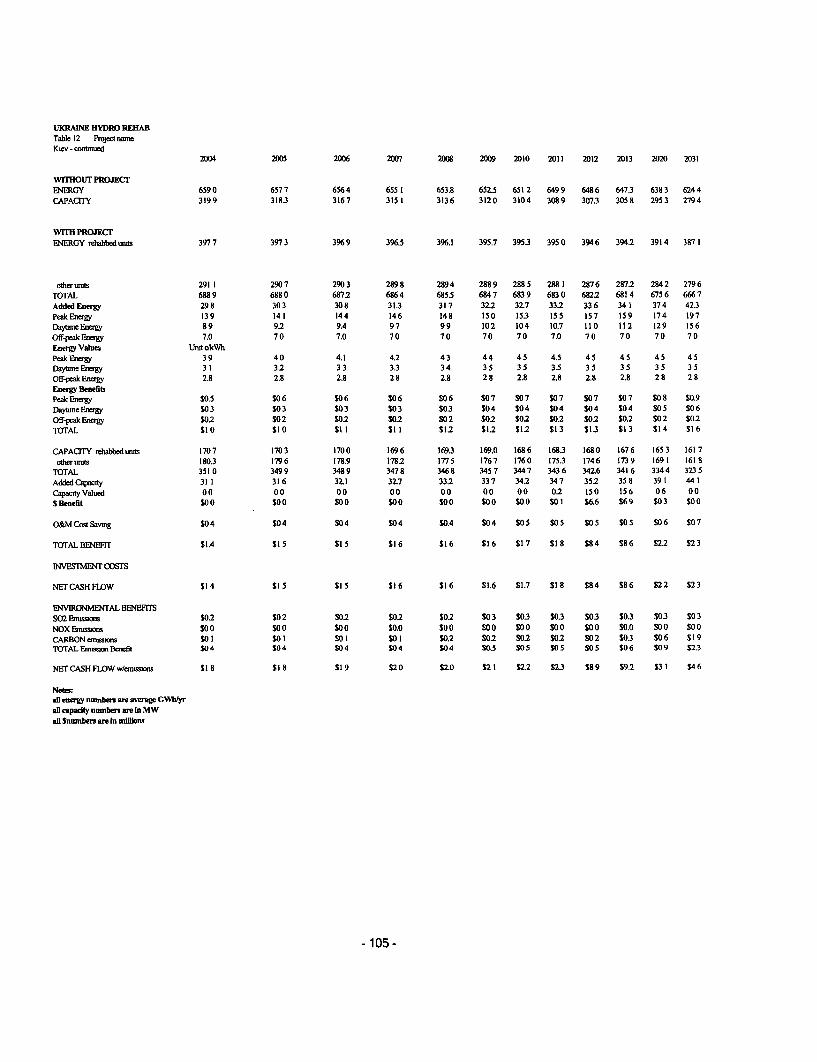
UKRAENE ErYDRO REEIABTable 12 Prert rwsiuKiev -continued
2004 2005 2006 2007 2008 2009 2010 2011 2012 2013 2020 2031
WriOUT PROJECrENERGY 6590 6577 6564 6551 6538 652.5 6512 6499 6486 647.3 6383 6244
CAPACITY 3199 3183 3167 3151 3136 3120 3104 3089 3073 3058 2953 2794
WITH PROJECrENERGY rehabbed units 3977 3973 3969 396.5 396.1 395.7 3953 3950 3946 3942 3914 387 1
othlerltuts 291 1 2907 2903 2898 2894 2889 288 5 288 1 2876 287.2 2842 2796TOTAL 6889 6880 6872 6864 685.5 6847 6839 6830 682.2 6814 6756 6667
Added Energy 29 8 30 3 30 8 313 31 7 32.2 32.7 332 33 6 34 1 37 4 42 3
Peak Energy 139 141 144 146 148 is0 153 155 157 159 174 197
DaytieEnewgy 89 9.2 9.4 97 99 102 104 10.7 110 112 129 156
Off-peak En-ey 7.0 7 0 7.0 7 0 7 0 7 0 7 0 7.0 7 0 7 0 7 0 7 0
Enery Values Unt c1cWhPeak Enegy 39 40 4.1 4.2 43 44 45 45 45 45 45 4S
DaytiEneEne82y 31 3.2 33 33 34 35 35 3.5 35 35 35 35Off-peakEnagy 2.8 2.8 2.8 28 2.8 28 2.8 2.8 2.8 2.8 28 28
Energy BeneflbPeak Enegy S0.5 $0 6 $0 6 $0 6 S0 6 S07 S07 $0 7 S07 $0 7 S0 8 S0.9
Dayme EnegW $0 3 $03 S03 $03 $0.3 $04 $04 $04 $04 S04 S0 5 $0 6Off-peak Eneam $0.2 $02 $0.2 $0.2 S02 $0.2 $0.2 $0.2 $02 S02 $0 2 $0.2TOTAL Si 0 $1 0 $1 I $1 1 $12 $12 $12 $1 3 $13 $1 3 $14 $1 6
CAPACITY reabbedtruts 1707 1703 1700 1696 1693 169.0 1686 1683 1680 1676 1653 1617
olerunuts 180.3 1796 178.9 1782 1775 1767 1760 1753 1746 1739 1691 1618TOTAL 3510 3499 3489 3478 3468 3457 3447 3436 342.6 3416 3344 3235AddedCapaoity 31 1 316 32.1 32.7 332 337 342 347 352 358 391 441
Capacity Valued 00 00 00 00 00 00 00 02 150 156 06 00S Benefit S0o0 S0 0o0 $00 S00 S00 S00 S01 $6.6 S69 $0 3 S$ 0
O&M Cost Saving $04 $04 $04 $04 $0.4 $0 4 S0 5 $0 5 $0 5 S0 5 $06 $0 7
TOTAL BENEFIT $1.4 $1 5 $1 5 $1 6 $1 6 $1 6 $1 7 $1 8 $84 $86 $22 S23
INVESlhT COSSO
NEr CASH FLOW $14 $15 $15 $16 $16 $1.6 $1.7 $18 $84 S86 S2.2 S23
ENV1RONM2ENTAL BENEFITSS02 Emonisso $0.2 $02 $02 $02 $0.2 $0 3 $03 $03 S03 $03 $03 S0 3
NOXEmnxo S00 $0 0 S00 $0.0 S0o0 S0 S00 S00 S00 $0.0 $00 $0 0CARBON arins S0 I S0 I S0 I S0 1 S02 S02 $02 S02 $0 2 S03 S0 6 S1 9
TOTAL Emissi Benefit $04 S04 $04 S04 $04 S0.5 $05 SO 5 SO 5 $0 6 S09 $2.3
NETCASHFLOWw/aatsiona $18 $18 $19 $20 S2.0 $21 $2.2 $2.3 $89 $92 $31 $46
Notes:all enery numbe ae average GWhlhyral capadty numben are in MWal Snumben are In millons
- 105-

UKRAINE HYDRO REHABTable 13 Prot namne Dnieper I Discousit Rate 10°h no.elabbed % rebabbed
t88R (win emissions) total no unts 9 6 67%/15.9% Load forecast Base Year 1997 1998 1999 2000 2001 2002 2003
WITIIOUT PROJECT Loss Rates Avil tyENERGY BaseEnergy 1448 0.20% 1448 1448 1448 1448 1448 1445.1 14422CAPACITY Capacty m Wmter 550 0.50% 92% 506 506 506 506 506.0 503 5 501 0
cpacty flctor 301%
Wlll PROJECr EBnegyENERGY rebabbed touts IsasasedEffimency 8.2% 0.10% 11777 11817 11806 11794
Realbbed unm flow 741% Q ucease 1.11Added energy from redued splll 4.0hrpoved Opeamton 1.5%
other umn 0.15% 381.2 3812 3807 3801TOTAL 15590 AVERAGE 1448 14636 14947 15103 15630 1561.2 15595Added Energy 123.0 0 IS6 46.7 62.3 94.6 116.1 117.3Peak Energ 0.0 5.2 15.5 207 315 38.6 39.0DayinEnergy 00 104 311 414 59.0 73.3 74.0Off-peak Enery Yearat maxvaihe 00 00 0.1 01 4.2 4.2 4.2Energy Values Unit c/kWh 2010Peak Enery 3.57 4.45 3.57 3 57 3.57 3 57 357 3 67 3.77Day-n EEnegy 2.90 353 290 2 90 2.90 2.90 2.90 2 97 3 04Off-prak Enery 2.76 2.76 2 76 2 76 276 276 2.76 2 76 2 76Energy BenefitbPeak Enrgy $000 $019 $056 $074 51.12 $142 S147Day- eEr S000 $0.30 50.90 $120 S1.71 $2.18 $2.25Off-peak Eney PVs(0996) S000 S000 $000 S000 50.11 $012 $012TOrAL S31.10 S0.00 S.49 SIA6 S1.95 S2.95 $3 71 $3 84
CAPACTY rehabbed unts increase n Water 51 0.20% 96% 4010 4002 3994other mnts 0.49% 94% 172.3 171 6 1710
TOTAL 573.3 5718 570 3Added Capacity 67.3 68.3 69.4Capacity Vahied 0 0 0 0 0 0S Bendllt Unut Vahle SkW 5441 S7.77 50.00 S0.00 S0.00 50.00 S0.00 50.00 $0 00
O&M Cost Saving base vahue ($S103) S208 nuameas 2.00% 52.20 50.05 50.10 S50.1 50.11 S0.17 $0.21 S0.27
TOTAL BENEFIT $41.06 50.05 S0.58 51.57 52.06 $3.12 $3.92 $4.11
INVESTMENT COSTS $25.11 52.33 $8.36 S6.98 56.84 S6.09 54.22
NEr CASH tFLOW NPV 515.95 -$218 47.78 4541 44.78 -52.97 -5030 S4.11IRR IS9°.
ENVIRONMlENTAL BENEFITS Unrt Vahe (c4cWh) PVaS02 E rsssions 0.78 56.87 S0.000 S0121 S0364 $0485 S0737 S0904 $0913NOX Enusisons 0.08 S0.70 50 000 $0 012 $0 037 $0 049 50 075 $0 092 S 093CARBON easwons 0.26 56.76 50000 S0040 S0121 $0161 $0245 50.331 50.367TOTAL Emsson Benefit S14.33 S0000 $0174 0o522 S0695 $1057 SI327 $1373
NET CASH FLOW w/emnssons NPV S3028 42.8 47.60 -54.89 44.09 41.92 $1.02 S5.48IRR 20.1%
Notes:all energy numbers are average GWb/yraull capady numbers a In MWall Snumbers are in mOin
- 106-
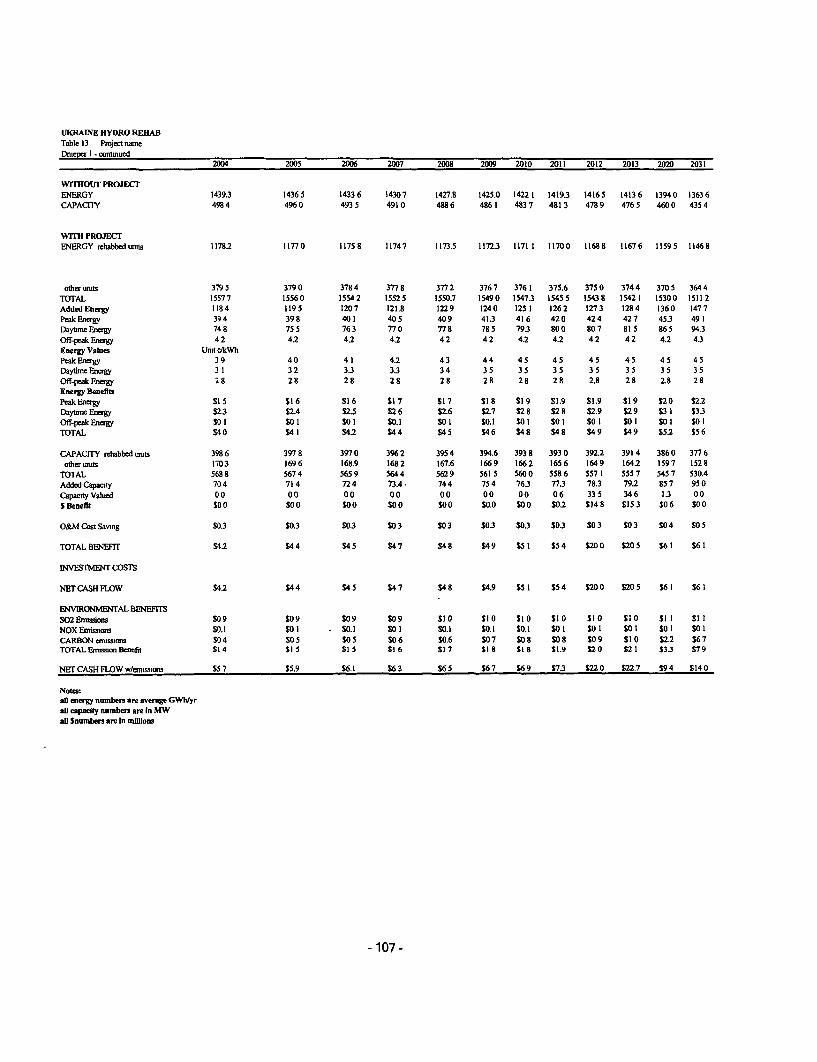
UKRAINE HYDRO REHABTable 13 Project nameDrmepr I - oontmued
2004 2005 2006 2007 2008 2009 2010 2011 2012 2013 2020 2031
WITHOUT PROJECrENERGY 1439.3 14365 14336 14307 1427.8 1425.0 14221 1419.3 14165 14136 13940 13636CAPACITY 4984 4960 4935 4910 4886 4861 4837 4813 4789 4765 4600 4354
WITH PROJECTENERGY rehabbedunits 11782 11770 11758 11747 1173.5 1172.3 1171 1 11700 11688 11676 11595 11468
other uuts 379 5 379 0 378 4 377 8 377 2 376 7 3761 375.6 375 0 374 4 370 5 364 4TOTAL 15577 15560 15S42 15525 1550.7 15490 1547.3 15455 15438 15421 15300 15112AddedEnergy 1184 1195 1207 121.8 1229 1240 1251 1262 1273 1284 1360 1477PeakEnergy 394 398 401 405 409 413 416 420 424 427 453 491Day-menergy 748 755 763 770 778 785 793 800 807 815 865 943Off-peak Energy 4 2 42 4,2 4.2 4 2 4 2 4.2 4.2 4 2 4 2 4.2 4.3Energy Values Unit cAkWhPeakEnergy 39 40 41 4.2 43 44 45 45 45 45 45 45Dayti eEnergy 31 3 2 3.3 3.3 3 4 3 5 3 5 3 5 3 5 3 5 3 5 3 5
Off-peak Energy 2 8 2 8 2 8 2 8 2 8 2 8 2 8 2 8 2.8 2 8 2.8 2 8Energy BenefitsPeakEnrgy $15 $16 $16 $17 S17 S18 $19 $1.9 $1.9 S19 $20 $22Daytneergy $2.3 $2.4 $2.5 2 6 $2.6 $2.7 $28 $28 $2.9 S29 S3 I $3.3Off-peak Energ S0 I S I S0 I S0.1 $0 I $0.1 S0 I S01 $0 $ S0 1 S0 I S0o1TOTAL 54 0 S4 S4.2 $44 4 4 5 54 6 S4 8 54 8 S4 9 $4 9 $52 $5 6
CAPACITY ehabbedunits 3986 397 8 3970 3962 3954 394.6 393 8 393 0 392.2 3914 3860 377 6otlherunits 1703 1696 168.9 1682 167.6 1669 1662 1656 1649 164.2 1597 1528
TOTAL 568 8 567 4 565 9 564 4 562 9 561 5 560 0 558 6 557 1 555 7 545 7 530.4AddedCapacity 704 714 724 73.4. 744 754 763 773 78.3 79.2 857 950CapacityValued 00 00 00 00 00 00 00 06 335 346 13 00SfBeneflt S0 0 $00 So00 $00 S00 $0.0 S00 S02 $148 $153 $06 S00
O&M Cost Saving $03 S03 $03 $0 3 $0 3 $03 $03 $03 $0 3 S03 S04 $0 5
TOTAL BENEFIT S42 S44 S4 5 $4 7 54 8 S49 $5 I $5 4 S20 0 S20 5 S6 I S6 1
INVESTMENr COSTS
NET CASH FLOW 412 S44 54 5 54 7 54 8 54.9 $51 $5 4 $200 $20 5 S6 $6 1
ENVIRONMENTAL BENEFITSS02Enissiomn S09 S09 S09 $09 S10 $10 $10 $10 S10 S10 Sil I $1 INOXEmnissions S0.1 $0 1 $0.1 $0 I S0.1 $0.1 $0.1 S0 I S01 $0 I S0 I S0o1CARBONamssions $04 S05 $05 $06 $0.6 S07 S08 S08 S09 $1 0 S22 $67TOTALEmsssonBenit $14 $15 15 St16 S17 $18 S18 $1.9 S20 S21 $33 S79
NErCASHFLOWw/emnssions $57 $5.9 $6.1 $63 S65 $67 $69 $73 $220 $227 S94 $140
Notes:aU energy numbers are average GWltsyrall capacity numbers are in MWaU Snumbers are In millions
-107-
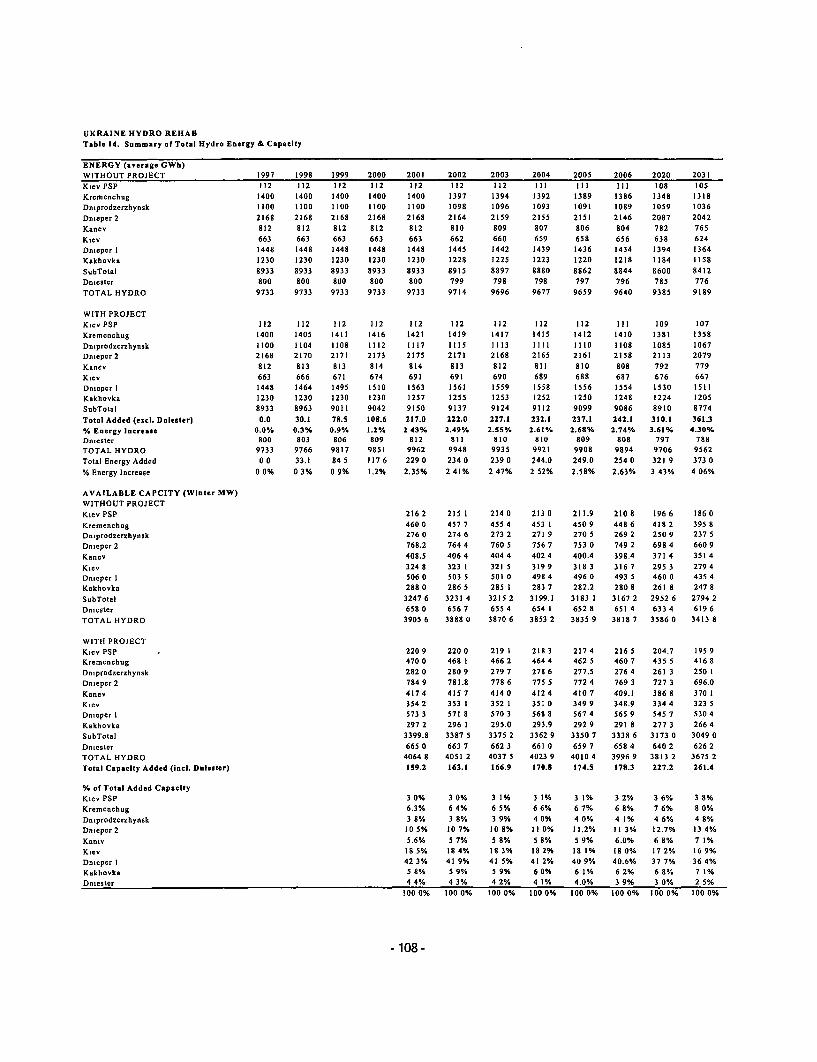
UKRAINE HYDRO REHABTable 14. Summary of Total Hydro Energy & Capacity
ENERGY (overage GWh)WITHOUT PROJECT 19 198 39 200 2001 2002 2003 2004 2005 2006 2020 2031Kiev PSP 112 112 112 112 112 112 112 III III III 108 105
Krcmcnchug 1400 1400 1400 1400 1400 1 397 1394 1392 1389 1 386 1348 1318
Dniprodzcrzhynsk 1100 1100 1300 1100 1100 1098 1096 1093 1091 1089 1059 1036
Dniepcr 2 2168 2168 2168 2368 2168 2164 21359 2155 2151 2346 2087 2042
Kanev 812 812 832 812 812 810 809 807 806 804 782 765
Kiev 663 663 663 663 663 662 660 659 65 8 656 63 8 624
Dnieperl1 1448 1448 3440 1448 1440 1445 3442 1439 1436 1434 3394 1364
Kakhovka 1230 1230 3230 1230 1230 1228 3225 3223 1220 1218 1184 3358
SubTotal 8933 8933 8933 8933 8933 8915 8897 8800 8862 8844 8600 8412
Dniester 800 800 800 800 800 799 798 798 797 796 785 776
TOTAL HYDRO 9733 9733 9733 9733 9733 9714 9696 9677 9659 9640 9385 9389
WITH PROJECTKiev PSP 112 332 332 112 112 132 112 332 112 III 109 107Krmeninchug 3400 3405 1411 3416 1421 3419 1417 1415 1412 3430 1381 3358
Dniprodzcrzhynsk 1300 1304 1308 1312 31137 Ills 1113 3111 3310 3108 1085 1067
Dniepcr 2 2168 2170 2171 2373 2175 2371 2168 2365 2363 2158 2333 2079
Kanev 812 813 833 834 834 813 832 831 830 808 792 779
Kiev 663 666 671 674 691 691 690 689 688 687 676 667
Dnicper 3 3448 3464 1495 3510 3563 1561 1559 1558 3556 1554 1530 1531
Kakhovka 1230 1230 3230 1230 1257 3255 3253 3252 1250 1248 1224 3205
SubTotal 8933 8963 9013 9042 9150 9137 9124 9112 9099 9086 8910 8774
Total Added (excd. Dniester) 0.0 30.3 78.5 308.6 237.0 222.0 227.1 232.3 237.3 242.3 330.1 361.3% Energy Increase 0.0% 0.3% 0.9% 1.2% 2 43% 2.49% 2.55% 2.61% 2.68% 2.74% 3.61% 4.30%Dniester 800 803 806 809 832 813 830 830 809 808 797 788TOTAL HYDRO 9733 9766 9837 9851 9962 9948 9935 9921 9908 9894 9706 9562Total Energy Added 00 33.3 84 5 117 6 229 0 234 0 239 0 244.0 249.0 254 0 321 9 373 0
% Energy Increase 0 0% 0 3% 0 9% 1.2% 2.35% 2 43% 2 47% 2 52% 2.58% 2.63% 3 43% 4 06%
AVAILABLE CAPCITY (Winter MW)WiTHiOUT PROJECTKiev PSP 236 2 21531 234 0 21330 211.9 230 8 196 6 386 0Kremenchug 460 0 457 7 455 4 45331 450 9 448 6 438 2 395 8
Dniprodzerzhynsk 276 0 274 6 273 2 271 9 270 5 269 2 250 9 237 5Dnieper 2 768.2 764 4 768 5 756 7 753 0 749 2 698 4 660 9
Kaney 408.5 406 4 404 4 402 4 400.4 398.4 371 4 353 4Kiev 324 8 32331 323 5 339 9 31 83 31 67 295 3 279 4
Dnieper 3 506 0 503 5 301 0 498 4 496 0 493 5 460 0 435 4Kakhovka 288 0 286 5 285 3 283 7 282.2 280 8 263 8 247 8
SubTotal 3247 6 3231 4 3235 2 3399.1 31 83 3 3367 2 2952 6 2794 2
Dnicster 658 0 656 7 655 4 65431 652 8 651 4 633 4 639 6
TOTAL HYDRO 3905 6 38 88 0 3870 6 3853 2 3835 9 3838 7 3586 0 3413 8
WITH PROJECTKiev PSP .220 9 220 0 21931 213 3 217 4 216 5 204.7 195 9Krcmenchug 470 0 468 3 466 2 464 4 462 5 460 7 435 5 416 8Dniprodzcrzhynsk 282 0 280 9 279 7 278 6 277.5 276 4 261 3 250 1
Dniepcr 2 784 9 781.8 778 6 775 5 772 4 769 3 72 73 696.0
Kancv 437 4 415 7 414 0 412 4 410 7 409.3 386 8 37031
Kiev 354 2 353 3 352 1 351 0 349 9 348.9 334 4 323 5Dnicper I 573 3 57308 570 3 568 8 567 4 565 9 545 7 530 4
Kakhovka 297 2 296 1 295.0 293.9 292 9 291 8 277 3 266 4SubTotal 3399.8 33 87 5 3375 2 33 62 9 3350 7 333 8 6 3173 0 3049 0
Dniester 665 0 663 7 662 3 663 0 659 7 658 4 640 2 626 2
TOTAL HYDRO 4064 8 4053 2 4037 5 4023 9 4030 4 3996 9 38313 2 3675 2
Total Capacity Added (joci. Dniester) 359.2 163.1 166.9 370.8 874.5 878.3 227.2 261.4
% of Total Added CapacityKiev PSP 3 0% 3 0% 3 1% 331% 331% 3 2% 3 6% 3 8%
Kremcnehug 6.3% 6 4% 6 5% 6 6% 6 7% 6 8% 7 6% 8 0%
Dniprodzerzhynsk 3 8% 3 8% 3 9% 4 0% 4 0% 4 1% 4 6% 4 8%
Dnieper 2 10 5% 10 7% 1008% 13 0% 11.2% 31 3% 12.7% 13 4%
Koniv 5.6% 5 7% 5 8% 5 8% 5 9% 6.0% 6 8% 7 1%
Kiev 38 5% 38 4% 18 3% 38 2% 3831% 38 0% 17 2% 16 9%
Dnicper 3 42 3% 4139% 41 5% 4132% 40 9% 40.6% 37 7% 36 4%
Kakhovka 5 8% 5 9% 5 9% 6 0% 6 1% 6 2% 6 8% 7 1%
Dniester 4 4% 4 3% 4 2% 4 1% 4.0% 3 9% 3-0% 2 5%
100 0% 300 0% 100 0% 300 0% 300 0% io000% 100 0% io000%
- 108 -

UKRAINE HYDRO REHABTable 15. Usable System Hydro Capadty
Load Forecast BaseCapadty Benefit Value S/kW S441discount rate 10%winter day energy (%annual) 130°hNPV (2000) S28.9
Year 2001 2002 2003 2004 2005 2006 2007 2008 2009 2010 2011 2020System demandEnergy(TWb) 1607 160.7 1647 1694 1766 184.6 193 2017 211 221 1 2299 3273PeakLoadGW 289 29.3 304 31.3 32.6 341 356 37.2 38.9 407 423 602peak capacity needed MW 0 0 0 0 0 0 0 0 0 0 0 0 0 0 0 0 0 0 0 0 1 4 897 3Daily Load factor 91.5% 85% 85% 85% 85% 85% 85% 85% 85%winterdayMWe 23848 23848 24442 25139 26208 27395 28642 29933 31313 32812 34124 48569winter day peak MW 26064 30833 32229 33696 35215 36839 38602 40146 57140
USABLE CAPACITYWithout projectFinm available energy MWe 583 581.9 5808 5797 5785 5774 576.3 575.2 5741 5730 5719 562 1Peak Capacity Usable % 8.51 1123 10 89 10 57 10.25 9 94 9 62 9 36 7 33Usable Peak MW 2219 2530 2841 3152 3463 3511 3560 3609 3661 3714 3760 4191Firm Plant Capacity MW 3906 3888 3871 3853 3836 3819 3802 3784 3767 3751 3734 3586MAXIMUMUSEDMW 2219 2530 2841 3152 3463 3511 3560 3609 3661 3714 3734 3586
With projectFirm available energy MWe 596 7 595 9 595 1 594 3 593 5 592 6 591 8 5910 590 2 589 4 588 6 5814PeakUsable% 863 11.42 1108 1075 1043 1012 9.80 954 750Usable Peak MW 2250 2568 2886 3204 3522 3572 3623 3675 3728 3784 3832 4285FirmPlantCapacityMW 4065 4051 4038 4024 4010 3997 3983 3970 3957 3943 3930 3813MAXIMUM USED MW 2250 2568 2886 3204 3522 3572 3623 3675 3728 3784 3832 3813Added Capacity MW 31 38 45 52 59 61 63 65 67 70 98 227Capacity valued MW 0 0 0 0 0 0 0 0 0 0 14 227 2Extra Capacity Valued MW 0.0 0.0 0.0 0.0 0.0 0.0 0.0 0.0 0.0 0.0 1.4 3.3S Benefit (millions) 0 0.0 0.0 0.0 0.0 0.0 0.0 0.0 0.0 0.0 0.6 1.5
NPV $28.9ALLOCATION OF CAPACITYKiev PSP 0 0 0.0 0.0 0 0 0 0 0.0 0.0 0 0 0 0 0 0 0 0 01Kmmenchug 0 0 0.0 0 0 0.0 0.0 0.0 0 0 0 0 0 0 0 0 01 0.2Dmprodzerzhynsk 00 0 0 00 0 0 00 0.0 0.0 00 00 0 0 01 0 1Dnieper2 00 00 00 00 00 00 0.0 0.0 00 00 02 04Kanv 00 00 00 00 00 00 00 00 00 00 0 1 02Kiev 0.0 00 00 00 00 0.0 00 00 00 00 0.2 06Dnieperl 0.0 00 00 00 00 00 00 00 00 0.0 06 13Kakhovka 0.0 0 0 0 0 0 0 0 0 0.0 0 0 0.0 0 0 0 0 01 0 2SubTotal (Hydm Rehab) 00 0.0 0 0 0 0 0 0 0 0 0 0 0 0 0 0 0 0 1.3 3 2Dniester 00 00 00 00 00 00 00 00 00 00 01 01
-109 -

UKRAINE HYDRO REHABTable 16. FUEL COSTS (incl. variable O&M)
Base Fuel Prices ($/GJ) (1996) Station service 7%Coal (raw) $1.74 Load following 5%Natural gas $3.13 Variable O&M (c/kWh) 0.406
Total atFuel Used heat rates Fuel cost TOTAL 20% lower
coal gas Mix cost (KJ/kWh) (c/kWh) (c/kWh) gas priceCosts in 1996 adjusted from 2001 levelPeak energy 100% $3.13 9000 2.82 3.57 2.94Daytime 70% 30% $2.16 10300 2.22 2.90 2.69Off-peak 70% 30% $2.16 9700 2.09 2.76 2.55
Costs at maximumPeak energy 100% $3.13 11500 3.60 4.45 3.64Daytime 40% 60% $2.58 10800 2.78 3.53 3.07Off-peak 70% 30% $2.16 9700 2.09 2.76 2.55
UKRAINE HYDRO REHABFUEL COSTS (incl. variable O&M)
Base Fuel Prices ($/GJ) Station service 7%Coal (raw) $1.50 Load following 5%Natural gas $2.70 Variable O&M (c/kWh) 0.35
Total atFuel Used heat rates Fuel cost TOTAL 20% lower
coal gas Mix cost (KJ/kWh) (c/kWh) (c/kWh) gas priceCosts in 2001Peak energy 100% $3.13 9000 2.82 3.57 2.94Daytime 70% 30% $2.16 10300 2.22 2.90 2.69Off-peak 70% 30% $2.16 9700 2.09 2.76 2.55
Costs at maximumPeak energy 100% $3.13 11500 3.60 4.45 3.64Daytime 40% 60% $2.58 10800 2.78 3.53 3.07Off-peak 70% 30% $2.16 9700 2.09 2.76 2.55
- 110 -

Annex 4. Bank Inputs
(a) Missions
Stage of Project Cycle No. of Persons and Specialty Performance Rating(e.g. 2 Economists,-1 FMS, etc.) Implementation Development
Month/Year Count Specialty Progress Objective
Identification/Preparation06/24/1994 9 Mission Leader (1); Power
Engineer (3); Economist (2);Power System Specialist (1);Consultants (2)
Appraisal/Negotiation09/26/1994 8 Mission Leader (1);
Environmental Specialist(1); Economist (2); PowerEngineer (1); FinancialAnalyst (1); Coal MiningSpecialist (1); Project Officer(Kiev Office) (1)
Supervision02/16/1996 6 Senior Sectoral Econ. (1); S S
Procurement Specialist (1);Principal Economist (1);Financial Analyst (1); TaskManager (1); PowerEngineer (1)
04/01/1997 4 Procurement Specialist (1); S UProcurement Specialist (1); TaskManager (1); Financial Analyst(1)
11/21/1997 3 Task Manager-Power Engineer S S(1); Procurement Specialist (1);Financial Specialist (1)
05/22/1998 3 Task Manager-Power Engineer U U(1); Procurement Specialist (1);Financial Specialist (1)
12/7/1998 6 Power Engineer (1); Financial S SAnalyst (2); Operations Officer(1); Procurement/DisbursementAnalyst (1); ProcurementSpecialist
02/15/1999 2 Mission Leader-Power Engineer U U(1); Operations Officer (1)
07/24/1999 5 Mission Leader-Power Engineer S S(1); Dam Safety Expert (1);Financial Analyst (1); OperationsAnalyst
05/09/2000 4 Mission Leader-Power Engineer U U(1); Operations Officer (1);Financial Analyst (1); OperationsAnalyst (1)
-111 -
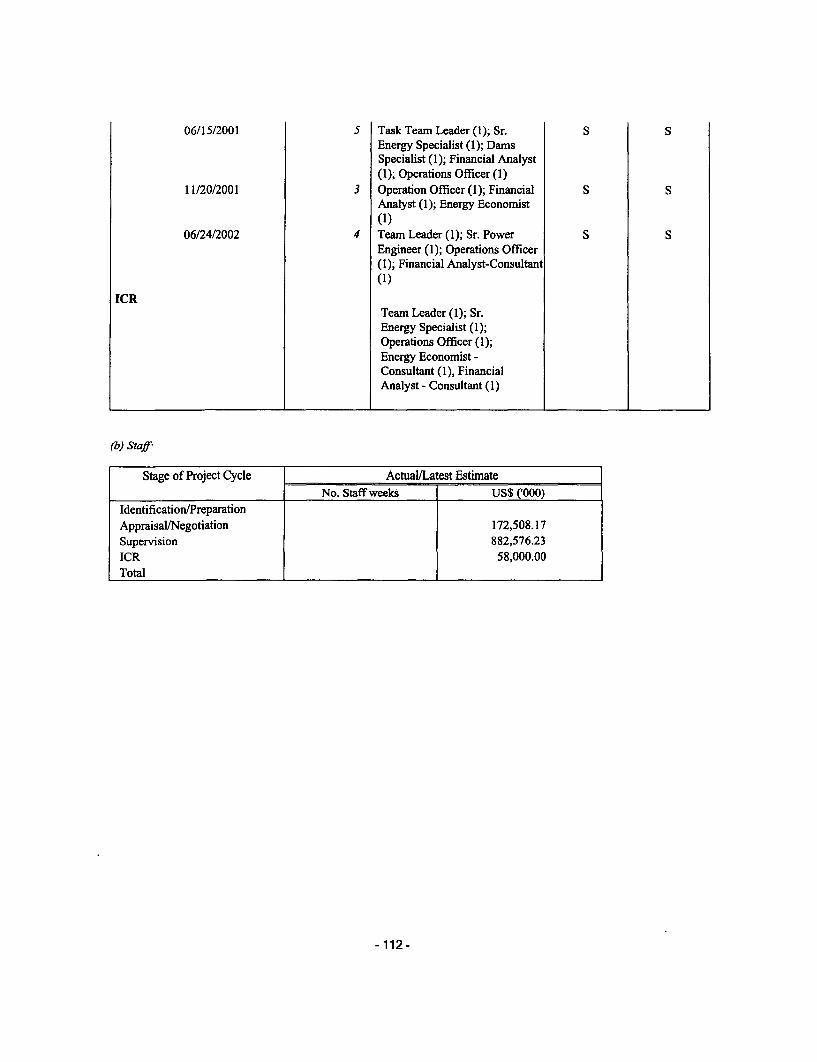
06/15/2001 5 Task Team Leader (1); Sr. S SEnergy Specialist (1); DarnsSpecialist (1); Financial Analyst(1); Operations Officer (1)
11/20/2001 3 Operation Officer (1); Financial S SAnalyst (1); Energy Economist(1)
06/24/2002 4 Team Leader (1); Sr. Power S SEngineer (1); Operations Officer(1); Financial Analyst-Consultant(1)
ICRTeam Leader (1); Sr.Energy Specialist (1);Operations Officer (1);Energy Economist -Consultant (1), FinancialAnalyst - Consultant (1)
(b) Staff
Stage of Project Cycle Actual/Latest EstimateNo. Staff weeks US$ ('000)
Identification/PreparationAppraisal/Negotiation 172,508.17Supervision 882,576.23ICR 58,000.00Total
- 112 -

Annex 5. Ratings for Achievement of Objectives/Outputs of Components
(H=High, SU=Substantial, M=Modest, N=Negligible, NA=Not Applicable)Rating
0 Macro policies O H OSUOM O N O NAU Sector Policies O H OSU*M O N O NA
3 Physical O H OSUOM O N O NAL Financial O H OSUOM O N O NAI Institutional Development 0 H O SU * M 0 N 0 NA
3 Environmental 0 H * SU O M 0 N (D NA
SocialC] Poverty Reduction O H OSUOM O N O NA0 Gender O H OSUOM O N O NAO Other (Please specify) 0 H O SU O M 0 N (D NA
O Private sector development 0 H O SU O M 0 N 0 NAU Public sector management 0 H 0 SU O M 0 N 0 NAU Other (Please specify) O H OSUOM O N O NA
-113 -

Annex 6. Ratings of Bank and Borrower Performance
(HS=Highly Satisfactory, S=Satisfactory, U=Unsatisfactory, HU=Highly Unsatisfactory)
6.1 Bank performance Rating
N Lending OHSOS Ou OHUF2 Supervision OHS OS O U O HUF Overall OHS 4@S O u O HU
6.2 Borrowerperformance Rating
E Preparation OHS OS OU OHU3 Government implementation performance O HS O S 0 U 0 HUF Implementation agencyperformance O HS 0 S O U 0 HUF Overall OHS OS 0 U 0 HU
-114-
Annex 7. List of Supporting Documents
1. SGI Engineering Ltd. Hydropower Rehabilitation Study, September 1994.
2. Staff Appraisal Report No. 13663-UA: Ukraine Hydropower Rehabilitation and System ControlProject, March 20, 1995.
3. EBRD, Stone & Webster Consultants: "Completion of Khmelnitsky 2 & Rovno 4 in Ukraine -Economic Due Diligence", July 2001.
4. Ukraine: Country Assistance Strategy Progress Report, April 29, 1999.
5. Memorandum of the President of the Intemational Bank for Reconstruction and Development and of theIntemational Finance Corporation to the Executive Directors on a Country Assistance Strategy forUlraine, August 16, 2000.
6. Dniprohydroenergo - Implementation Completion Report, July 2002.
7. Ukrenergo - Implementation Completion Report, July 2002.
-115 -
Additional Annex 8.Summaries of project completion reports from DHE and UE.
Annotation on Project Implementation Completion Report
Hydropower Rehabilitation and System Control Project
"DNIPROHYDROENERGO" JSC, Ukraine, 1995 - 2002
Energy Consulting Group
INEKO-Management 2002
List of Abbreviations Used
AMS Automated Monitoring System
CCPP Combined-Cycle Power Plant
DHE <<Dniprohydroenergo>>
HPP Hydroelectric Power Plant
HPSPP Hydroelectric Pumped Storage Power Plant
HTF Hydrotechnical Facilities
IBRD, the Bank the Intemational Bank of Reconstruction and Development
SAR Staff Appraisal Report
TPP Thermal Power Plant
UES United Energy System
WEM Wholesale Electricity Market
The Project was developed in accordance with the IBRD strategy in the energy field, which is aimed atdevelopment of power-saving technologies and adaptation of power system to the market economyrequirements.
The Project's objectives were determined to resolving of some most actual problems of Ukrainian UES:
* increase of efficiency, reliability, safety and environmental performance of HPPs;* increase of hydropower generation capacity;
improve the quality of electricity supply by upgrading load and frequency control, which wouldalso improve safety of nuclear power plants;* reduce fuel costs by facilitating the economic dispatch of generating units."SGI ENGINEERING Ltd." Company has studied (1994) the aspects of HPPs rehabilitation. The Studyindicated priorities of investment, proposals on rehabilitation of all Dnieper cascade HPPs were performed.
The Project can be considered complicated due to the following aspects:
* a large number of participants of the Project (total number of workers involved in the Project isapproximately 10 000);* a wide territorial spread of HPPs and a large number facilities under operation without full stopand withdrawal;* worldwide recognized approaches to the project implementation at the moment of starting theProject were quite new for DHE and Ukraine in general;
- 116 -

* rehabilitation of such large scale have never been performed in Ukraine.This Project is first large-scale project that performed in Ukraine under lack of local financing and inaccordance with a rather dense project schedule, that referred to autumn-winter peak load and floods, aswell as taking into account worldwide recognized approaches to the project implementation.
The dam safety monitoring system is been created for the first time in a former USSR country.
The experience achieved could be used as a recommendation for large-scale Project on many hydropowersites rehabilitation in the CIS countries.
The Project preparation and implementation was performed by 4 components as follows:
Hydropower plants rehabilitation;* Installation of the dam safety monitoring system at the main reservoirs of the Dnieper river;
Upgrade of communication, dispatching, system control and protection and generating unitscontrol;
Technical assistance and optimization of the use of Dnieper reservoirs.Component - Hydropower Rehabilitation
The HPPs play the critical role in load and frequency peaks regulation in the power system of Ukraine.Most of the existing HPPs are old and require rehabilitation (7 out of 8 main HPPs have age of over 20years, 5 - over 30 years, the oldest HPP, the DniproHPP I, was constructed in 1932 and reconstructed in1947).
In the course of reconstruction the following was planned to be done:
* replacement of turbine runners, hydro turbines regulators and other components of the basic BPPequipment at Kyiv, Kakhovka and Dnieper HPP I. At Kyiv HPP, it was planned to reconstruct 8 out of 20hydro units. At Dnieper HPP I all turbines shall undergo rehabilitation. Furthermore, one turbine both atKremenchug and Dniprodzerzhinsk HPPs was for rehabilitation;* rehabilitation of generators;* rehabilitation of the 3, 110, 154 and 330 kV switchgear systems and auxiliary equipment;* upgrade of monitoring and control systems at Dnieper and Kakhovka, Kyiv HPPs, as well as atKyiv HPSPP.The scope of works for this component is exceed scope that were initially foreseen after additionalinvestigations.
Imperfect regulation system of energy sector and WEM operation, tariff formation system, as well as lowlevel of payments for electricity during a long period have limited DHE's capabilities on provision ofsufficient funds for the local portion of the Project.
Constant insufficient financing of the Project's components (such components were financed by localsource) resulted in a decision, later on approved by the IBRD, to decrease number of turbines andgenerators subject to rehabilitation. Instead of 23 hydro turbines and generators originally planned forrehabilitation in accordance with the program of the project's first phase, only 16 hydro units have left (atthe 3 HPPs of the Cascade).
- 117 -
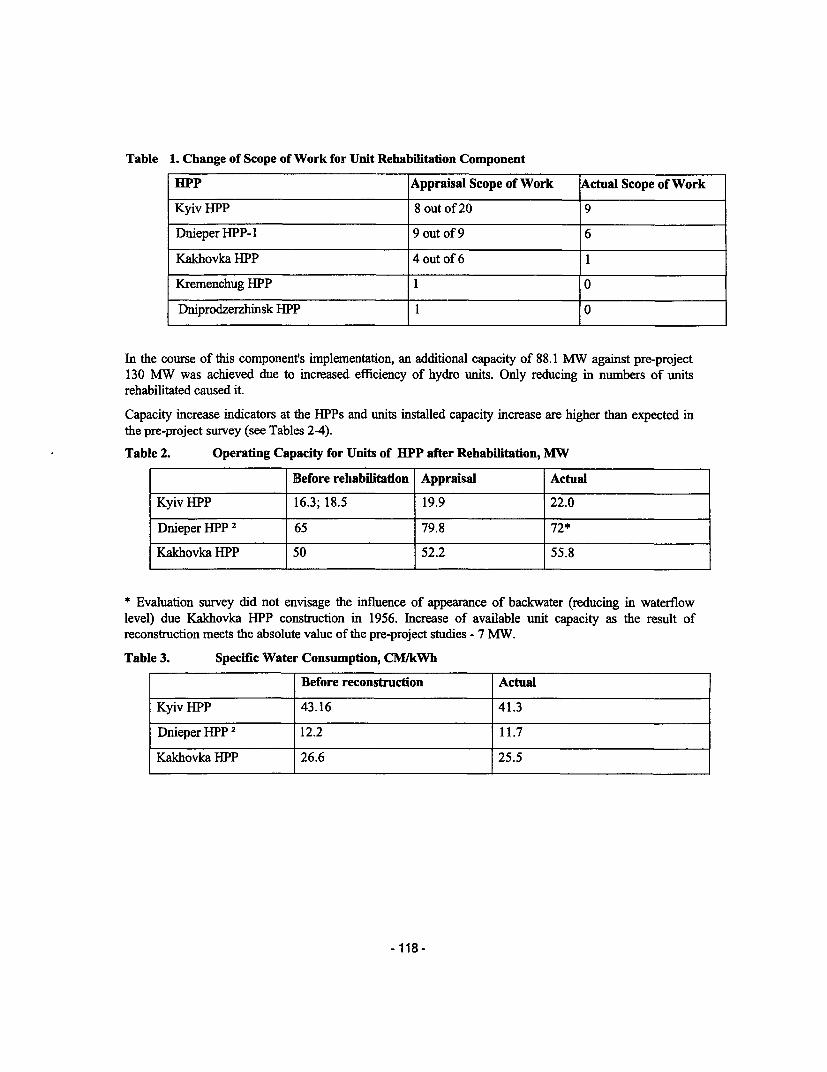
Table 1. Change of Scope of Work for Unit Rehabilitation Component
HPP Appraisal Scope of Work Actual Scope of Work
Kyiv HPP 8 out of 20 9
Dnieper HPP-1 9 out of 9 6
Kakhovka HPP 4 out of 6 1
Kremenchug HPP 1 0
Dniprodzerzhinsk HPP 1 0
In the course of this component's implementation, an additional capacity of 88.1 MW against pre-project130 MW was achieved due to increased efficiency of hydro units. Only reducing in numbers of unitsrehabilitated caused it.
Capacity increase indicators at the HPPs and units installed capacity increase are higher than expected inthe pre-project survey (see Tables 2-4).
Table 2. Operating Capacity for Units of HPP after Rehabilitation, MW
Before rehabilitation Appraisal Actual
KyivHPP 16.3; 18.5 19.9 22.0
Dnieper HPP 2 65 79.8 72*
Kakhovka HPP 50 52.2 55.8
* Evaluation survey did not envisage the influence of appearance of backwater (reducing in waterflowlevel) due Kakhovka HPP construction in 1956. Increase of available unit capacity as the result ofreconstruction meets the absolute value of the pre-project studies - 7 MW.
Table 3. Specific Water Consumption, CMIkWh
Before reconstruction Actual
Kyiv HPP 43.16 41.3
Dnieper HPP 2 12.2 11.7
Kakhovka HPP 26.6 25.5
- 118 -
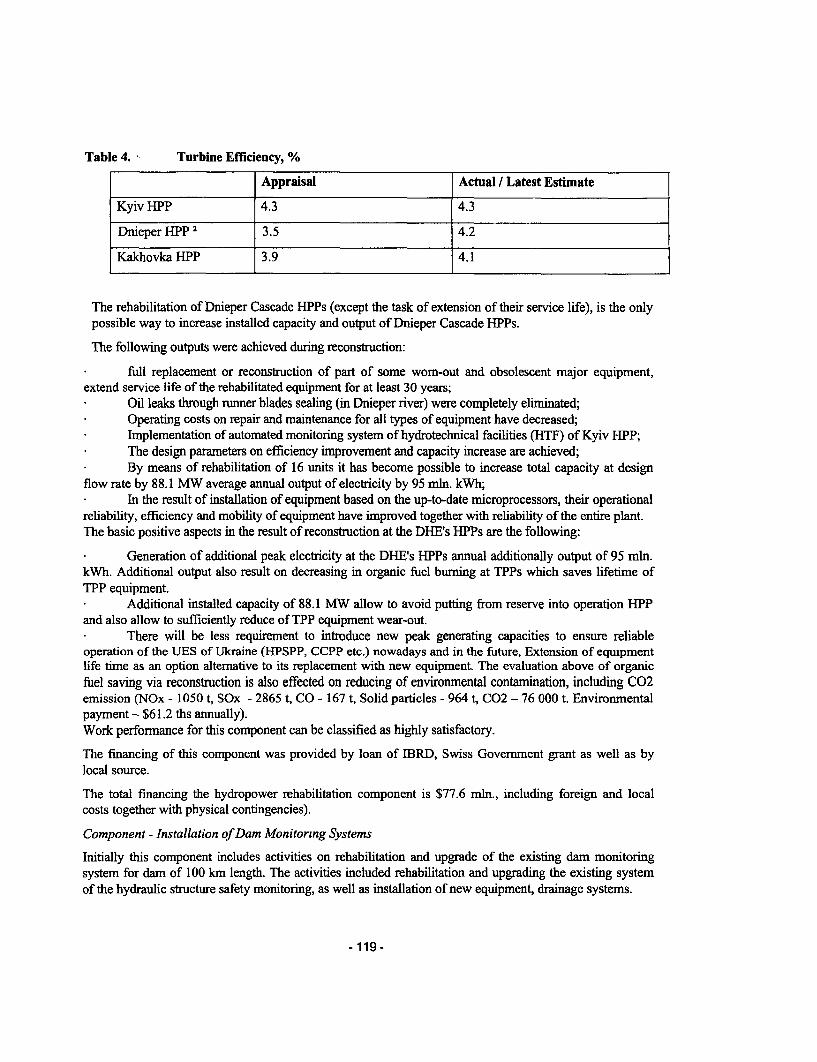
Table 4. Turbine Efficiency, %
Appraisal Actual / Latest Estimate
Kyiv HPP 4.3 4.3
Dnieper HPP 2 3.5 4.2
Kakhovka HPP 3.9 4.1
The rehabilitation of Dnieper Cascade HPPs (except the task of extension of their service life), is the onlypossible way to increase installed capacity and output of Dnieper Cascade HPPs.
The following outputs were achieved during reconstruction:
* full replacement or reconstruction of part of some worn-out and obsolescent major equipment,extend service life of the rehabilitated equipment for at least 30 years;
Oil leaks through runner blades sealing (in Dnieper river) were completely eliminated;* Operating costs on repair and maintenance for all types of equipment have decreased;* Implementation of automated monitoring system of hydrotechnical facilities (HITF) of Kyiv HPP;
The design parameters on efficiency improvement and capacity increase are achieved;* By means of rehabilitation of 16 units it has become possible to increase total capacity at designflow rate by 88.1 MW average annual output of electricity by 95 mli. kWh;
In the result of installation of equipment based on the up-to-date microprocessors, their operationalreliability, efficiency and mobility of equipment have improved together with reliability of the entire plant.The basic positive aspects in the result of reconstruction at the DHE's HPPs are the following:
Generation of additional peak electricity at the DHE's HPPs annual additionally output of 95 mln.kWh. Additional output also result on decreasing in organic fuel burning at TPPs which saves lifetime ofTPP equipment.
Additional installed capacity of 88.1 MW allow to avoid putting from reserve into operation HPPand also allow to sufficiently reduce of TPP equipment wear-out.* There will be less requirement to introduce new peak generating capacities to ensure reliableoperation of the UES of Ukraine (HPSPP, CCPP etc.) nowadays and in the future, Extension of equipmentlife time as an option altemative to its replacement with new equipment. The evaluation above of organicfuel saving via reconstruction is also effected on reducing of environmental contamination, including C02emission (NOx - 1050 t, SOx - 2865 t, CO - 167 t, Solid particles - 964 t, C02 - 76 000 t. Environmentalpayment- $61.2 ths annually).Work performance for this component can be classified as highly satisfactory.
The financing of this component was provided by loan of IBRD, Swiss Govemment grant as well as bylocal source.
The total financing the hydropower rehabilitation component is $77.6 mln., including foreign and localcosts together with physical contingencies).
Component - Installation of Dam Monitoring Systems
Initially this component includes activities on rehabilitation and upgrade of the existing dam monitoringsystem for dam of 100 km length. The activities included rehabilitation and upgrading the existing systemof the hydraulic structure safety monitoring, as well as installation of new equipment, drainage systems.
-119-
Pursuant to revised schedule of the component the system of safety monitoring is installed at Kyiv HPP asa pilot project. However the system of safety monitoring is putting into operation on 50 km of watersidefacilities at Kyiv HPP against 100 km planned.
As a result of HTF AMS implementation at Kyiv HPP the following tasks have been completed:
* automated acquisition of monitoring measurement system readings,* reconstruction of instrumental monitoring means,* review and update of existing methodical, technological and organizational monitoring procedures.It was the first time in Ukraine and CIS countries when 50 kmn of soil-made dam were equipped with AMS.
Work performance for this component can be classified as highly satisfactory.
The financing of this component was provided by loan of WBRD and local source.
The totalfinancingfor installation of Dam Monitoring Systems is $1.9 mln. (foreign and local costs)
Component - Upgrade of Communication, Dispatch and System Control
This component was foreseen the activities on upgrading communication, dispatch control system inUkrainian UES, as well as control, monitoring and relay protection system in high voltage networks.
The main scope of work on this component is carried out within the Ukrenergo NEC activities.
Component - Technical Assistance in Project Implementation and Optimization of the Use of Dnieperreservoirs
The technical assistance during the Project's implementation was supposed to compensate lack of theexperience in international procurement, as well as assistance at the stage of feasibility study of the Project,preparation and holding of international bidding, Project management and audit.
Besides such technical assistance included review of all existing methods of reservoir management andpreparation of suggesti6ns on improvement of the existing methods.
In accordance with SAR Norwegian Government should financed the technical assistance in optimizationof Dnieper reservoir, and the DHE was identified as a beneficiary of the assistance.
During Project implementation name of beneficiary was changed to Ukrenergo NEC. NorwegianGovernment financed the sub-component. The deliverable was the survey carried out by Norplan-NivaAssociation "On Water Management and Hydro Power Control System in Ukraine" for the Ukrenergo NECin 1999.
The financing of this component was provided by loan of IBRD, grant of Canadian Agency of InternationalDevelopment, grant of Swiss Govemment as well as local source.
The total financing for technical assistance for the DHE project component is $6.4 mln. (foreign and localcosts).
Major Factors Affecting Project Implementation
The risks of hard state regulation policy in energy industry, imperfect tariff formation policy (includingtariffs for peak electricity) and, as consequence, worsening of DHE financial performance were determinedas main Project risks at preparation stage.
The main factors, which affected the project implementation significantly, are as follows:
Late date of ratification of IBRD Loan Agreement by Verhovna Rada and, as a result, delay at thepreparation and evaluation stage of the bidding;
- 120 -
* Crisis in economy during 1998 - 1999, 1999-2000 led to significant reduction and suspense oflocal financing of the Project. It caused sufficient delay of the Project implementation;* Changes in tax legislation (increasing Project risks);* The first in Ukraine experiences in realization of international bidding for equipment supply.
In spite of complexity of procedures of international bidding for supply of equipment according to theIBRD standards the terms of realization of the tenders were met.
* Carrying out reforms in power industry sector as well as orientation of state activities ontoughening of paying discipline reduced significantly the main risk of unsuccessful Project implementation,namely, absence or insufficient amount of local financing. In spite of significant fluctuations of localfinancing, systematic transfers and latest amounts, detenmined by the WEM algorithm at the final stage ofthe Project, provided stability of local financing in the acceptable amount.Costs and Financing
1. Total Project costs constituted USD 89.2 million or 67% of total budget costs by IBRD loan -USD 31.8 million or 74% of total budget costs, USD plus 3.3 million - interest during construction;* by co-financing entities - USD 10.8 million or 90.2% of total budget costs,
by local financing source - USD 43.3 million or 65% of total budget costs,The bidding for supply of equipment and goods within the loan was performed in technical assistancecomponent and in accordance with the rules of International Bidding.
The purchase of equipment and rendering services in the scope of local financing has been implementedaccording to the direct contracts.
The revised amount of IBRD loan for DHE component is USD 35.1 million against original IBRD loan forDHE component USD.51.6 million Decrease of loan amount was caused by a requirement to perform alarge amount of additional activities per one hydro unit, limited period of the Project and, as a result,reduction of quantity of hydro units subject to rehabilitation at the first stage, as agreed with the IBRD.
2. Postponing by 1.5-2 years of contracts conclusion dates and equipment supply dates as foreseen bythe SAR has limited the DHE in efficient use of grace period.3. Imperfect WEM funds distribution mechanisms, which acted during the Project's implementationhave caused appearance of deficit of local portion financing, which resulted in need to reduce the number ofhydro units subject to rehabilitation.
This reduction was also caused by a requirement to perform additional work at each hydro unit.
4. Prompt financing from the local source in 2001-2002 has allowed the DHE to fully and properlyperform final activities on the Project.
Sustainability
After implementation of the Project's activities, the main risk is also related to capabilities of the DHE toservice the Bank's loan. Considering the fact that in final stage of the project (2001 - 2002) the DHE didnot experience any problems of financing its portion, as well as there were no prerequisites for worseningof DHE financial status in the future, the Project's sustainability may be classified as highly likely. It isnecessary to take into account that strengthening payments discipline in energy sector, improvement offunds collection in WEM during 2001 - 2002 years may be a guaranty to ensure normal operation of theenergy sector of Ukraine.
- 121 -
The risks related to the further operation of the rehabilitated or new equipment are minor, therefore there isno reason to consider these risks as the risks that may further result in a negative impact on the outcomes ofthe Project implementation.
Transition Arrangements to Regular Operation
The co-operation of the DHE's specialists with foreign experts has allowed implementing Project withinternational project management approach usage.
All rehabilitated hydro units were practically operated, a full number of commissioning and field tests wascarried out. New equipment is provided with spares, design and technical documentation, on the basis ofwhich the detailed operation manuals are published.
Bank's and DEE's (Borrower's) Performance
Bank
The IBRD appeared to be a stabilizing element. The Bank's activity on Project preparation andimplementation included continuous monitoring and support of the Borrower in case of shortcomings,which could have had negative impact on the Project implementation. It is evident that no Project couldhave been implemented without the IBRD's funds, organizational capabilities and authority.
The Bank's activity can be classified as highly successful DiE
Taking into account the complicity and scale of the Project, certain economic environment of Projectimplementation, market economy formation and real changes in energy sector, large number of the projectparticipants in Ukraine as well as foreign participants, other factors DHE's activity can be classified ashighly satisfactory.
Lessons Learned
During the Project activities planning a considerable attention shall be paid to the risks related to possibledelays caused by the project approval by the state agencies, as well as delays during preparation andholding of procurement tender and actual performance.
The Feasibility Study had to pay a lot of attention to the aspects of precise evaluation of technical conditionof equipment subject to rehabilitation or repair, in order to ensure maximum authenticity during estimationof the scope of work and the project financing.
The main task during the project implementation is to discover deviations from what was planned and toinitiate activities aimed at prevention of possible deviations. In order to discover such deviations, allinformation on the project implementation shall be concentrated in one hand on the regular basis. For thisProject it were performed by World Bank's missions on regular basis. Especially it has effect to technicalaspects of works and project schedule.
Summary of Ukrenergo's Implementation Completion Report
Initial Project Objectives
l.a. Project background
Period of Ukraine's independence proclamation was characterized by the dramatic economic decline in thebeginning of 90s. Real GDP contracted by 14% in 1993 bringing the cumulative fall in output since 1990to 38%.This trend accelerated in the first half of 1994.
- 122 -

The existing UPS management system included hierarchy one consisting from 4 - level dispatchmanagement and control system and also local automatic management subsystems installed on differentequipment blocks. At the highest level in the dispatch system stood National Dispatch Center (NDC)connected with 8 regional dispatch centers (RDC) joined with some HPSs and local distribution centers. Atthe lowest - the fourth level there were single generator units available at factories and local distributioncenters connected with regional distribution centers. Operation of the system in real time mode was securedby manual management with the help of telephone communication between dispatchers of the centraldispatch center and regional ones and also with dispatchers of stations and substations. The existingmechanism of data collection was considerably deteriorated. No automatic means were used for generatorsand load management. These disadvantages could not but finally reflect in low quality of electricity supplyto consumers and in non effective production.
Transmission lines and distribution networks in Ukraine operated under voltage of 0,4, 6, 10, 35, 110, 150,220, 330, 400 and 750kV of altemate current. Voltage levels used' under electricity transmission are of330kV and higher. Networks with voltage of 220kV countries of Central Europe and lower are related todistribution system. Ukraine has common power connection with countries of Central Europe, Russia,Romania, Bulgaria and Byelorussia. Networks operating at 750kV voltage were designed as main networksto serve domestic Ukrainian needs and to export electricity from Ukraine to Russia and countries of CentralEurope.
l.b. Project Objectives
Low automation level, aged and non complying with requirements protection, management, metering,communication devices and computer equipment harden the operation of complex in the whole. As it wasalready mentioned frequency was manually regulated, time of initial regulation mechanism was insufficient,regulators had large insensitivity zones. Schedule for load monitoring was also manually prepared unlikewith the practical use of computers for save dispatch management that leads to additional fuelconsumption. Electricity flows management in the joining points with neighboring systems had the sameproblems as with frequency management that created barriers to the interconnection process with CIS andneighboring power systems. This problem aside from creation barriers in electricity trading also led toreduction of reliability and safety of electricity supply and to expensiveness of power system in the wholebecause it required more considerable reserve capacities. UPS operation requires improvement in meteringdevices serving interconnection points of company on electricity supply and wholesale consumers.Mechanism for data collection and communication must be able to secure all working UPS operations inreal time mode by submitting accurate and timely information for working operation schedule needs,calculation of accounts payable by consumers and compensation to members of united system.
To solve the above mentioned problems it was planned to decide the following tasks:* improvement of protection systems at power plants, dispatching system and equipment formonitoring electricity generation;* improvement of protection systems at Overhead High Voltage Lines (OHLs);* installation of computer equipment securing automatic operation modes management of generatorsand also economic dispatch management from National Power Company "Ukrenergo" (NPC "Ukrenergo");* enhancing systems for data collection and transmitting them to NPC "Ukrenergo" at a number ofpower plants and the most important substations by erecting modem distance management terminals andmore powerful computer equipment. This will allow to increase scope and frequency of data coming ondispatch panels that would lead to control improvement, more modem response and would enable toperform automatic process regulation for electricity generation and function of economic dispatchmanagement and to secure effective UPS operation;
- 123-
* improvement of communication system by dismantling existing units at those areas which represent"bottlenecks". The existing system has serious limits. Communication lines (cables, transmission lines andradio broadcasting lines ) were aged, non reliable, sensitive to sound devastation and resembled escalatingdifficulties for service. Taking into consideration the size of Ukrainian power system and requirementsreaching out of it the design of this component should secure functioning of new SCADA system.
Initial Project Objectives coincided in the whole with the strategy of the Govermment of Ukraine in PowerIndustry which at the time of Project preparation consisted in enhancing efficiency of electricity generationand as a result in reducing costs for fuel and improvement of Industry's payment balance. Improvementthe quality of electricity supply which is one of the basic prerequisite for industrial production and fullycorresponds with "Strategic principles of the Bank's country assistance" should have become of theconditions for Ukraine's industry modernization.
2. Initial Project Sub Components
At the preparation stage of the given Project the Sides-Participants defined that its main component partsare:
Part <<A>> consisting in fulfillment of works on HPP rehabilitation is perfonned by State-owned Joint StockHydrogenerating Company "Dniprohydroenergo";
Part <<B>> consisting in carrying of system management modernization is performed by the National PowerCompany "Ukrenergo".
Main attention in the given Report is paid to Part B of the Project, realization of which is in capacity ofNPC "Ukrenergo". According to SAR in the framework of the Part B of the Project component (b) is"Upgrade of communication, dispatch service, management and protection systems and control overgenerating units". Automation management system level which existed before reconstruction stipulatedmanual frequency regulation. Actuation time for initial regulation system was insufficient. Regulators hadlarge insensitivity zones, were made according to aged technology using hydraulic boosters. Monitoringover the load schedule was also performed manually without computer systems of economic dispatchmanagement that led to excessive fuel consumption at TPPs. The result of work on the given componentshould be such data collection system on the use of capacities and generators work efficiency forecastswhich could secure all working UPS operations in real time.
To facilitate further presentation and consequent report structuring the given component may be divided onthe following principal sub components:1) Upgrade of communication system in the UPS of Ukraine. In the framework of this subcomponent three contracts were concluded;2) Upgrade of Frequency Regulation System and Dispatch and System Control. Implementation isprovided by one contract;3) Enhancement of Relay Protection Devices of the Ukrainian UPS Main Network. Implementation isprovided by one contract;4) Dniester HPP Monitoring and Control System Rehabilitation. Two contracts were concluded in theframework of sub component.
These sub components embrace the whole complex of measures undertaken to achieve Project objectives.
- 124 -

3. Achievement of Development Objectives and Outputs
Actual realization of Part "B" of the Project allowed to achieve initially set objectives and get positiveresults permitting to improve to some extent the situation in country's power sector:
* fulfilling a number of measures on replacement the aged equipment allowed to considerablyenhance reliability of Ukrainian UPS;
* purchase and installation of modem dispatch communication means satisfying technicalrequirements of system led to enhancement the quality of real-time dispatch management in Ukrainian UPSthat led to reduction of fuel consumption in the process of electricity generation (quantitative evaluation ofachieved results will be given in the next section of this report);
* construction of modem fiber optic communication lines aside from technological possibilities fortransmitting information allowed to considerably extend existing opportunities in providing communicationservices to domestic consumers at state level;
* introduction of automatic frequency and capacity regulation system promoted improvement thequality of electricity supply to consumers, enhancement of safety in NPP operation;
* reduction of fuel consumption by improvement the quality of dispatch management over thegenerating units;
* permanent cooperation of Ukrainian specialists with western colleagues facilitated acquiringexperience, skills upgrading in different spheres of activities: from installation, mounting and operation ofmodem equipment to management and coordination of works on the Project.
4. Outputs of Project sub component realizationIn the course of the Project Part B realization seven (7) contracts were concluded on equipment delivery,fulfillnent of works and services:
1. Sub component: Communications System Modernization in the Ukrainian UPS
Construction of fiber optic lines of communication (FOCL) -Terms: Beginning - 1998. Completion - 31.12. 2001.Supplier: SIEMENS AG (Germany) with subsequent transfer of rights to Corning (Germany).
Substantiation of the necessity for Contract realization:Development of Power Industry, increasing number of NPC 'Ukrenergo's" structural divisions,development of emergency control automatic system, dispatch control, frequency and capacity automaticregulation system and telemechanics with correspondingly increasing volume of transmitted informationrequired to enhance reliability of work and development of communication means (systems) of the Ministryof Fuel and Energy departmental communication network belonging to the main funds of "Ukrenergo".
The existing analog systems have aged (main cable communication line Kyiv - Chercassy - Zaporizhya -Gorlovka with a tap to Odessa was organized on metallic cables of old design) had been in operation for along time and needed to be changed. More frequent defects of cable and lack of reserve for repairpractically did not provide reliability of transmitting information.
-125-

Taking into account the above mentioned, realization of contract in the framework of which introduction ofmodem digital communication system allowing to increase considerably the speed and volume oftransmitting infonnation between subdivisions of the unified system, was anticipated.
Due to the undertaken technical analysis the decision was taken that the way out from the situationoccurred lies in introduction of modem digital communication system with the use of cable which can belaid on transmission lines (or hanging on transmission lines).
Evaluation of outputs received from Contract implementation:1. Due to the FOCL commissioning National Power Company 'Ukrenergo" received the opportunity
to:* use modem digital cormmunication system for transmission of information which allows to enhancereliability and authenticity of transmitted information;* join separated regional cable communication lines into unified '"Jkrenergo's" communicationsystem with the help of trunk FOCL parts;* join regional automatic telephone stations by non commuted communication channels and 2Mbpsflows that led to more efficient on-line technical solutions;* switch to the digital city automatic telephone stations;* organize new speed E-mail channels;
organize reserve automatic channels for preventing accidents;* train personnel (with the help of SIEMENS) to operate modem digital communication systems;* construct digital communication systems in dispatch-technological management of power systems,allowing to secure solutions of task at modem level.
"Supply of digital automatic telephone stations"Terms: Beginning - 1997. Completion - 1999.Supplier - KAPSH AG (Austria).
Substantiation of necessity for the Project realization:
Necessity of purchase was caused by exigency for change of aged automatic telephone stations ofdecade-step and coordinate system and also dispatch commutators built on relay schemes. Furtheroperation of aged equipment is not possible on the following reasons:V, absence of spare parts in consequence of their lay-off by makers;/ systematic refusals and negative quality of connection;V noncompliance with new digital commutation equipment both on software and on physicalinterfaces;/ lack of additional services.
Evaluation of outputs for Project implementation:
1.Introduction of modem digital dispatch communication commutators (dispatch consoles) enhancedconsiderably the reliability of dispatch communication that influenced effectiveness of operational-dispatchmanagement of UPS of Ukraine in the whole, namely:
V quality of dispatch communication improved;
/ reliability of equipment operation and its repairability enhanced,
- 126 -
/ uniform communication system on the basis of modem equipment is created;
V/ range of realized functions is extended.
2. In the course of project implementation directly at the producer premises Ukrainian specialists weretrained on servicing of each kind of acquired equipment.
3. Introduction of modem digital automatic telephone stations allowed to:/ release considerable production areas;V improve the quality of connection;V organize the required number of departmental communication networks using one and the sameequipment;V connect to cities' digital automatic telephone stations using modem signalization protocols;V change user's numbers without changing cross jumperings;V/ perform traffic analysis on separate directions;V acquire a number of additional services, which were not possible on old automatic telephonestations, more often used by customers from them are: redirection of calls, conference organization,reminder, automatic call, undesirable call blocking, putting in the hold mode.
4. Introduction of modem digital dispatch commutators allowed to:
V/ provide loud voice connection;V secure quality of transit connections;V avoid multi wire commutation at workplace.
<Supply of batteries, charges, UPSs and diesel generators>> -Terms: Beginning - 1996. Completion -1998.Supplier- SCHNEIDER SA (France).
Substantiation the necessity for Project realization:
To solve tasks on modemization communication system in the UPS of Ukraine live issue is the change ofbatteries, charging appliances, UPSs, diesel-generators, distributing AC/DC plates for:/ providing dispatch points of Company's regional power systems with reliable power supplysources;V providing power supply to FOCL equipment;/ change of exhausted batteries.
Rationale for purchasing such equipment was acknowledged during accidents in the main UkrainianUPS network in 2000 -2001 caused by weather factors (icing, tomadoes). For instance, in November2001 dispatch point of Yugo-Zapadnaya (South-Westem) power system was provided with power fromUPS+diesel-generator for three (3) days.
Assessment of outputs for Project implementation:
1. As a result of Project completion eight (8) RDCs-Donbasskiy, Dneprovskiy, Central, Zapadniy,Yugo-Zapadniy, Sevemiy, Yuzhniy and Crimean - were provided with full-value power supply systemsincluding rectifier-invertor, battery + diesel-generator which secured reliable power supply to technologicalequipment of the given dispatch centers separately from primary power supply status.
- 127 -

2. Prepared and are kept in working condition power supply systems for multiplexer equipment(charging appliances + batteries) envisaged by FOCL Project construction at all utilities (substations,power plants, RDC).
3. In the course of Project realization Ukrainian specialists were trained on installation andmaintenance of complex directly at the premises of the Producer - in France and in Italy. technologicalequipment Training on less complex equipment was held in Ukraine. All trainees received correspondingcertificates from the equipment producer allowing its assembling and maintenance. Thus installation ofmodem equipment acquired within the framework of this contract facilitated in achieving of qualitativelynew level of communication under considerable extension of its technological possibilities.
2. Sub component: Upgrade of Frequency Rezulation System and Dispatch and System Control
<<Supply of integral package of Supervisory Control and Data System (SCADA), Automatic GenerationControl (AGC), Generation Control Dispatch System (GCD), Energy Management System (EMS)>>
Terms: Beginning - 1999. Completion - June 30,2002.
The Contract was signed on January 15, 1999 and in accordance with time schedule it had to be fulfilled bythe beginning of 2001. However due to considerable delay in contract processing it became effective onlyon May 7, 1999. Therefore, time schedule for fulfilment of works was shifted and contract was completedin June 2002.
Supplier: CEGELEC (France) with consequent transfer to ALSTOM T&D (France).
Substantiation of necessity for Project realization:
The main designation for integrated apparatus-software complex is to provide handling of telemetricinformation and instrumental means for effective UPS of Ukraine management modes. Commissioning ofcontrol and monitoring system of SCADA modes management anticipates enhancing of quality, reliabilityand effectiveness of operational-dispatch management of generating unions, which belong to the UPS ofUkraine.
Assessing outputs of the Project implementation:
Particularity of power industry anticipates the high level of power systems' automation andtelemechanization, automation of technological processes on units, organization of centralized dispatchmanagement system which creates necessary information and technical basis for effective SCADAfunctioning.
3. Sub component: enhancement of relay protection deyices of the Ukrainian UPS main network
<<High Voltage Overhead Line Protection Relays Supply>
Terms: Beginning - 1996 Completion - June 30, 2002.Installation of equipment was delayed by almost 3,5 years due to the problems with equipment transferprocedure on Leasing Contract (10 relay protection sets - National Nuclear Energy Generating Company)(NAEK "Energoatom") and 2 sets State-owned Joint Stock Energy Generating Company "Zakhidenergo"(DAEK "Zakhidenergo") and problems with local financing.
- 128-

Supplier - SIEMENS AG EV S VI 5 (Germany).
Substantiation of necessity for Project realization:
750, 500, 400, 330 kV network is the basis for reliable operation of Ukrainian UPS. Minimization of timeto liquidate damages is a foundation for sustainable UPS of Ukraine operation. Relay protection failure ordelays in disconnection of damages can form large system disturbances, overloading of equipment and leadto the loss of dynamic sustainability. In connection with normative life term expiration of the main networkrelay protections, the necessity of their change became vivid.
Assessment of outputs on Project implementation:
1. Replacement of morally and physically aged protections on High Voltage Overhead Lines in themain Ukrainian network (including 750kV overhead lines outgoing from NPPs) for new microprocessorprotections is one of the most effective methods for preventing emergency situations occurring due toprotection failures under defects on lines. Prevention of system emergencies, loss of NPP unitssynchronism is not only a technical measure for raising survivability of Ukrainian UPS but also a measurefor preventing man-caused accidents on Ukrainian NPPs and so it posses a definite ecological effect.
2. Installation of new multifunctional microprocessor protection allows to considerably reduce ofareas for installation of control boxes and protections. As a result, disengaged production areas may besuccessfully used under the subsequent reconstruction and modernization stages. It is not possible toevaluate the size of production areas which are disengaged under installation of new relay protection setsbecause disengagement itself will take place at the next stage after replacement of existing static and electromechanic relay protection. Set of SIEMENS relay protections are being installed alongside with preservingthe existing complex of static and electro mechanic relay protections and no areas are disengaged.
3. Modemization of protection relays allows to reduce expenditures on current relay protectionmaintenance and on adaptation of relay installations to the changed modes of operation.
4. Besides, the Contract implementation provides:
4.1. Reducing of load on current and voltage transformners which allows to advantageously use the freedcapacities without installation of additional current and voltage transformers or receive the reserve onadmissible load which can be used further.
4.2. Operational personnel of all levels is becoming more informed on the occurring accidents. Specialregistrator of accidental events and defects location needs to be installed on the overhead line under existingtype of protection while microprocessor protections have the built-in registrators and via modem connectioncan give immediate information to all levels of operational management. With this, time for restoration ofnormal condition reduces considerably.
4.3. Easy adaptation of microprocessor protections into management and protection complexes at furtherstages of development while PDE-2000 type protections have no such opportunity.
4.4. Reduction of probability for errors and failures occurrence in the work of relay protections due to thefact that microprocessor protections have considerably less number of outer commutation apparatuses(faceplates, testing units, switches) than existing ones.
-129 -

4.5 Control of the devices status at any time and not only at the moment of inspection from the outsidesource of current and voltage (as it happens with existing ones) that makes it possible to considerquestions of surplus reserve.
Effect of intellectual character.
This effect even less falls under any quantitative account but it certainly exists as it embraces very broadlayers of Industry's technical specialists.
Necessity for preparation of contract documentation, fulfilling project works connecting into organic wholethe existing microprocessor protections, performing account for the set points of distance protections fromone-phase short circuit on earth earlier not used in national practice and their adapting to previously existedand new protections, setup of new microprocessor protections with the use of new microprocessoradjustment installations with the need for simulation of any possible modes made Ukrainian specialistsperforning these functions practically without education literature, without skilled leaders and teachers inthe very short terms to pass through the way which specialists from Westem Europe went during twodecades, and transform into specialists with whom, not hiding their respect, communicate "Siemens","ABB" and "Alstom" specialists. It would not be possible to organize such massive breakthrough ofindustry specialists to new technologies in the sphere of relay protection without introduction of thisContract.
At present, having such specialists and using their knowledge, training of specialists of all utilities fromall power systems and NPPs on relay protection is held in order to prepare in short future foundation forthe second stage of OHL relay protections modemization with replacement of microelectronic installationwith exhausted life cycle by modem microprocessor protections.
4. Subcomponent: Dnister HPP Monitoring and Control System Rehabilitation
<<Supplv of Circuit Breakers for Dnister Power Plant))
Terms: Beginning - 1997. Completion- June 2001.Supplier: GEC ALSTHOM T&D S.A. (France) with subsequent transfer of rights to ALSTHOM T&DS.A. (France)
Substantiation of necessity for the Contract realization:
By installing high voltage breakers it is possible to solve the issue on enhancement Dnister HPPmaneuverability. This can be achieved by disconnection of any HPP hydro generators that would lead toenhancing of equipment wearing capacity.
<Protection, control and monitoring for Dnister Power Planb> -Terms: Beginning - 1997. Completion- June 30, 2002.Supplier: CEGELEC (France) with subsequent transfer of rights to ABB ALSTHOM POWER,ALSTHOM HYDRAULIQUE SA (France).
Substantiation of necessity for the Project realization:
Necessity to enhance the reliable operation of power equipment at Dniester HPP, equipping of objects and
- 130-
installations of HPP with modem means of protection, management and control.
Short description of works:
In the course of Project realization were introduced electric protection systems of 6 (six) installations inunits with step-up transformers, automatic, thermal, vibrating control system, station and under stationmanagement level, hardware and software support.
4.2 Institutional development impact
At the moment of final appointment on the necessity for the given Project realization, in Ukraine there waspractically no positive experience on realization of international projects of such scale. The country was inconditions of heavy power crisis and taking decision on realization of the given Project was one of the firststeps in enhancing the reliability of UPS of Ukraine operation.
Implementation of the given Project allowed to extend to a definite degree the potential opportunity forparallel operation of Ukrainian UPS with European countries. As a result of undertaken modernization ofaged equipment and introduction of modem control systems considerably reduced network fi-equencyfluctuations that facilitated enhancement of quality for transmitting electricity and enlarged the complianceof Ukrainian electricity with adopted international standards in this sphere. Construction of fibre opticscommunication lines also had a positive impact on further opportunity of Ukrainian UPS parallel operationwith neighboring states. Under additional costs on completion of lacking interconnecting parts thepossibility for direct passage to Poland with the aim of parallel operation.
Preparation and implementation process of the given Project was held in conditions of tight cooperation ofresponsible representatives from the Government of Ukraine and state regulatory bodies with authorizedIBRD representatives that allowed to acquire positive experience in creation of conditions for internationalprojects realization, namely drawing up technical requirements, requirements on the supplied auxiliaryequipment and so far and so on. National Power Company "Ukrenergo" had no such experience before. Itwas the first large project consisting of some important directions for our Company that made it possible toacquire experience at all stages of project implementation - starting from bids organization up tocommissioning.
Development of this Project anticipated holding the integrated estimation on potential national producersand foreign suppliers for realization of the undertaken aims. It is necessary to mark positive experienceacquired by the Ukrainian side under implementation of the initial project cycle starting from evaluation ofpotential suppliers and holding international bids and ending with signing the definite contracts onequipment supply and fulfillment of separate kinds of works. Support provided by the IBRDrepresentatives in realization of enumerated measures also brought considerable benefit in acquiringpositive experience by the Ukrainian side
At the moment of some Project sub components implementation in Ukraine there was absent an experienceon operation of foreign equipment which was installed at utilities in the frame of concluded contracts. As aresult, a definite number of Ukrainian specialists were trained at enterprises - suppliers of equipment andgot certificates confirming their qualification that proves their high level professional training. Further theacquired experience for handling the international standard equipment may be transferred to specialists inplaces under minimal financial costs for enterprises of Ukrainian Power Industry.
In the course of the given Project development a definite financial support was received by a number of
- 131 -

national enterprises which performed works for successful completion of planned measures in the frame ofseparate Project subcomponent implementation. That is, due to introduction of digital communicationsystem aroused a need for cable production (fibre optics) made by Odessa plant for communication lines.
As far as according to projects requirements we received ready equipment which needed only mountingand commissioning than Ukrainian side actively involved design, mounting-construction and adjustmentorganizations. Fulfillment of the entered orders allowed national enterprises to receive financial means inthe amount enough to pay salaries to workers and by that to keep the working seats and to provide receiptsto the state and local budgets by necessary taxes and compulsory payments.
Broadening of interaction of the Ukrainian Govemment and state regulatory bodies with EBRDrepresentatives at the preparation and implementation stages of the given Project has considerable degree ofimpact on getting positive effect for project development. Without the Government of Ukraine and IBRDrepresentatives interaction and without Verkhovna Rada's ratification of the agreement for granting creditthis Project would not be realized.
5. Sustainability
At the stage of Project preparation there were some fears that NPC "Ukrenergo" would not be able tosecure its implementation. These fears were first of all connected with probability that the Govemmentwould not create conditions for NPC "Ukrenergo" to receive money in an amount enough to provide localfinancing and to serve IBRD loan.
Thus at the time of SAR preparation financial status of NPC "Ukrenergo" was evaluated as critical due tomassive non payment for the electricity consumed and considerable accounts payable that in its turn led todoubt in possibility of fulfilling the planned in the frame of project measures on account of local funds infull scope. But the reality showed that Project implementation coincided in time with the Govemment'spolicy aimed at the stabilization of situation in Power Industry, as a result the situation improved: tariff forelectricity gradually raised to the level allowing to cover operational costs, a Wholesale Electricity Market(WEM) was created, privatization of some oblenergos was held and others. Cash collection fromoblenergos for the electricity consumed raised twofold in 2001 as compared with the year 2000 havingincreased from 32,9% to 64,8% that led to inflow growth on "Ukrenergo's" account. All this allowed toconsiderably improve the financial status of NPC "Ukrenergo" and minimize the anticipated risks.Probably in future the Govermment will support the policy on increasing the tariff for services, changing taxlegislation in the part of assessed base taxation reduction.
It is more likely that "Ukrenergo" leaders would undertake measures directed on improvement andstabilization of "Ukrenergo' financial status. Even now leaders conduct and plan to carry out further apolicy for changing amortization policy, reassessment of fixed assets, creation of additional financingsources.
Apparently that in future efforts for further training of technical specialists and management personnel willbe maintained by including in annual programs plan on their skill upgrading.
To drawbacks of project implementation we can relate lack of economic stimulation of specialists workingon project. But the need for such stimulation is vivid that is why it is more likely that it will be realized infuture.
Risks related with operation of delivered equipment are insignificant. That is why to consider these risks asable to negatively influence the projects outputs in future is not reasonable.
- 132-

MAP SECTION

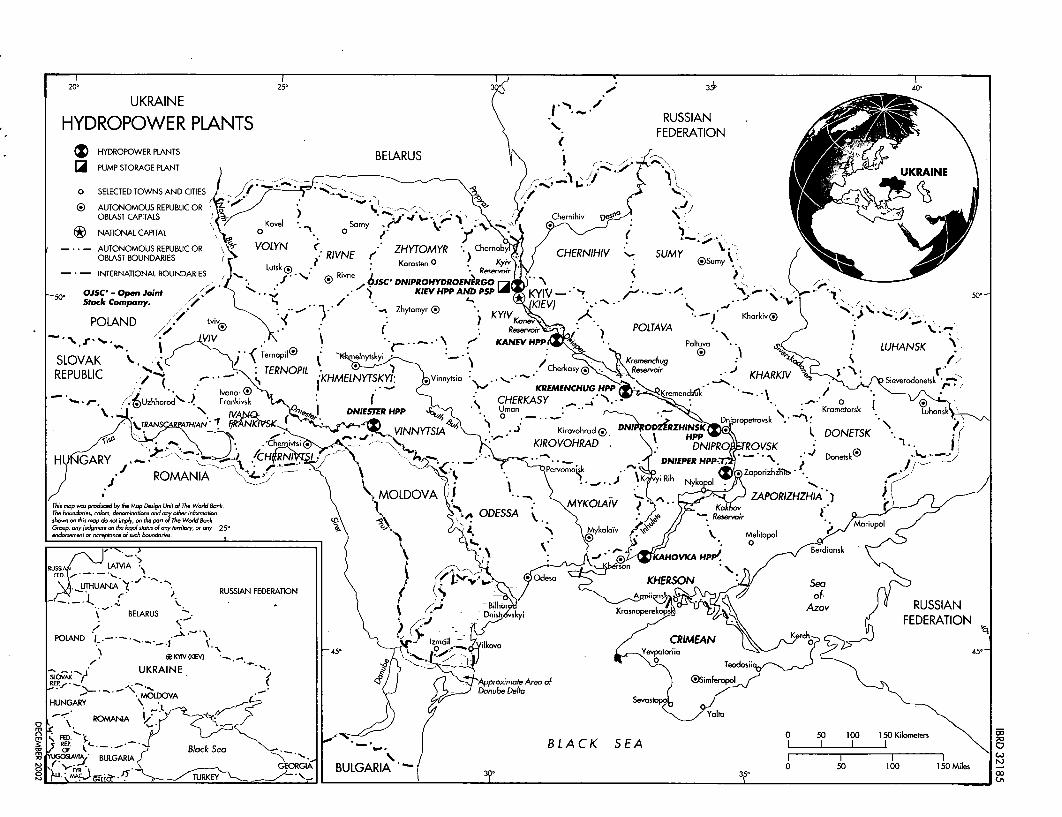
20' URAN 25' 3/~ 0
UKRAINE ~~~~~~~~~~~~~~~~RUSSIANHYDROPOWER PLANTS FDRTO
®HYDROPOWER PLANTS BELARUS 1I~PUMP STORAGE PLANTUKAN
0 SELECTED TOWNS AND CITES
®E AUJTONOMOUS REPUBUC OR OBLAST CAPITALS KvlSm brii
NATIONAL CAPITAL0(
- .-AUTONOMOUS REPUBLIC OR VOLYN ZHYTOMYR ChomoCENIIbSMOBLAST BOUNDARIES KoosenVNHENIIV . SMINTERNATIONAL BOUNDARIES Rusl se-' Suyo
Rine ISC' DNIPROHYDROENERGO rA
-50, OJSC -Open Joint . ) KIEV HPP ANDPSP 'W KYIV-'Stock Company. ,A,. litmr KE)*
POLAND Lviv KYV J KrivC ~~~~~~~~Reservoi POLTAVA .
**~~~.\ ~~~- KANEVHPP ~~~~~~LUHANSK
: TERNOPIL ~~~~~.'/Cherkasy® Jeevi HRI REPUBLIC *KM YTKISin i KAKVieverodonetsk -I . ~~~~~~~~KREMENCHUG HP encj
DNIESTER II Krama.rsk ha~~~~~NIEERHPP, Pervom&sk *~~~~~~ ropetovskzTt
YTS Kirovokrad~ I K RiONETSK .
ICH Donetsk~~~ Daub DltHUGRY 0o
ROMN MANIA io ic l5KRiber
G~~~ORG4AOV ZAULRAHZIATh - pd..JyI>MpD,'~Ui TURKEYM S.MKOAVK


RUSSIANHYDROPOWER PLANTS FEDERATION
HYDROPOWER PLANTS
PUMP STORAGE PLANTA
o SELEClED TOWNS AND CMlES
®E AUTONOMOUS REPUBLIC OROBLAST CAPITALS>Ch
NATIONAL CAPITAL 0
-- AUTONOMOUS REPUBUC OR VOLYN ~'ZHYTMR Coo
OBLAST BOUNDARIES us RIVNE (' Krse CH-ERNIHIV S'M- SLimY
-- INTERNATIONAL BOUNDARIES Rs.vn
-50. stock Cam any ~ ~ ~ ~ ~ ~ ~ iP~~ KYI ronpeeSol-~vRSSA
POLANIDck o LAC SE I I BULGARIA
I I I~~~~~~~~~~~~~~~~~PLTV
G RG4A BULGARIA 3I~~~KANE HPP10 iSOMles
TURKE TrnpiY2 __ __ ___ne_ ___ny__ ___s___y__ __ _LUHAN___ __ ___K_
SLOVAK .%-_ __ __ _ __ _ __ _ __ __ _ __ _ __ _ __ _ __ __ _ __ _ __ _ __ __ __hu__ _ _ 7


.- '1
Report No.: 24947Type: ICR