world bank document - documents & reports - all … · document of the world bank ... ippd...
TRANSCRIPT

Document of
The World Bank
Report No. 15570-GE
STAFF APPRAISAL REPORT
REPUBLIC OF GHANA
BASIC EDUCATION SECTOR IMPROVEMENT PROGRAM
May 24, 1996
Population and Human Resources DivisionWest Central Africa DepartmentAfrica Region
Pub
lic D
iscl
osur
e A
utho
rized
Pub
lic D
iscl
osur
e A
utho
rized
Pub
lic D
iscl
osur
e A
utho
rized
Pub
lic D
iscl
osur
e A
utho
rized
Pub
lic D
iscl
osur
e A
utho
rized
Pub
lic D
iscl
osur
e A
utho
rized
Pub
lic D
iscl
osur
e A
utho
rized
Pub
lic D
iscl
osur
e A
utho
rized

CURRENCY EQUIVALENTS(April 1996)
Currency Unit = CedisUS$1.00 = 1550 cedis
ACRONYMS AND ABBREVIATIONS
ADB Africa Development BankBE Basic EducationBESIC Basic Education Sector Improvement CreditCIDA Canadian International Development AgencyCSPIP Civil Service Performance Improvement ProgramCP Consultative PanelDACF District Assembly Common FundDEO District Education OfficeDEOC District Education Oversight CommitteeGES Ghana Education ServiceERP Economic Recovery ProgramEU European UnionFCUBE A Program for Free, Compulsory and Universal Basic Education by the Year 2005FIMTAP Financial Management Technical Assistance ProjectGER Gross Enrollment RatioGNAT Ghana National Association of TeachersGOG Govemment of GhanaGTZ Deutsche Gesellschaft fur Technische ZusammenarbeitICB Intemational Competitive BiddingIDA Intemational Development AssociationIOC Implementation Overview CommitteeIPPD Integrated Personnel Payroll DataJICA Japan Intemational Cooperation AgencyISS Junior Secondary SchoolKfW Kreditanstalt fur WiederaufbauLIB Limited Intemational BiddingMOE Ministry of EducationMOF Ministry of Finance and Economic PlanningMLGRD Ministry of Local Govemment and Rural DevelopmentMTR Mid-Term ReviewNCB National Competitive BiddingNGO Non-Govemmental OrganizationNIRP National Institutional Renewal ProgramNDPC National Development Planning CommissionODA Overseas Development Administration (U.K.)OHCS Office of Head of Civil ServicePMU Project Management UnitPREP Primary Education Program (USAID)PSDP Primary School Development ProjectPTA Parent Teacher AssociationPUFMARP Public Financial Management Technical Assistance ProjectSDR Special Drawing RightsSMC School Management CommitteeSSS Senior Secondary SchoolUNDP United Nations Development ProgramUNICEF United Nations Children's FundUSAID United States Agency for Intemational DevelopmentWDR World Development Report
FISCAL YEAR EDUCATION STRUCTUREJanuary I - December 31 Years 1-6 PrimarySCHOOL YEAR 7-9 Junior SecondarySeptember - June (Basic and Tertiary) 10-12 Senior Secondary and TechnicalJanuary - December (Sr. Secondary) 13-16 University

4. PROGRAM IMPLEMENTATION ................................................... 29A. PROGRAM PREPARATION ................................................... 29B. PROGRAM MANAGEMENT AND COORDINATION ................................................ 30C. PROGRAM MONITORING, REPORTING AND SUPERVISION .................................. 31D. PROCUREMENT ................................................... 32E. DISBURSEMENT ................................................... 36F. ACCOUNTING, AUDITING, AND REPORTING ................................................... 37G. PROGRAM BENEFITS AND RISKS ................................................... 37
Program Benefits ................................................... 37Program Risks ................................................... 39
5. AGREEMENTS TO BE REACHED AND RECOMMENDATION ........................... 39
ANNEXES
I Basic Data Sheet2 Descriptors of Basic Education
2-1 Participation Indicators2-2 Efficiency Indicators2-3 Student Achievement Indicators2-4 System Outcome Indicators2-5 Teacher Quality Indicators, 1989-19942-6 Manpower Indicator
3 Fiscal and Economic Analysis3-1 Expenditure Analysis3-2 Equity Analysis3-3 Cost-Benefit Analysis3-4 Fiscal Impact and Financial Sustainability Analysis
4 Letter of Sectoral Policy5 Operational Plan
5-1 Key Performance Indicators5-2 Summary Implementation Plan5-3 Key Areas of Technical Assistance5-4 Supervision Plan5-5 Procurement and Disbursement Schedules
6 Draft District Education Oversight Committee Agreement7 Proposed Organizational Structure for FCUBE Implementation8 Management Roles and Relationships9 List of Key Source Documents in Project File
MAP: IBRD No. 28045

REPUBLIC OF GHANA
BASIC EDUCATION SECTOR IMPROVEMENT PROGRAM
TABLE OF CONTENTS
CREDIT AND PROGRAM SUMMARY ......................................................................... iii
1. INTRODUCTION..
2. THE EDUCATION SECTOR AND SOCIO-ECONOMIC CONTEXT ........................ 1A. ECONOMIC AND SOCIAL OVERVIEW .................................................................... 1B. EDUCATION SYSTEM OVERVIEW ......................................................................... 2C. KEY ISSUES IN BASIC EDUCATION ....................................................................... 5
Poor Teaching and Learning Outcomes ....................................................... 5Lack of Management Efficiency .................................................................. 6Unsatisfactory and Inequitable Access and Participation ............................ 9Inadequate Financing Arrangements .................. ....................................... 1I1
D. PREVIOUS BANK OPERATIONS IN THE EDUCATION SECTOR .............................. 13E. OTHER DONOR SUPPORT FOR THE EDUCATION SECTOR ..................................... 14F. LESSONS FROM PREVIOUS IDA AND OTHER DONOR INVOLVEMENT IN GHANA
EDUCATION ................................................................................... 14G. RATIONALE FOR IDA INVOLVEMENT IN BASIC EDUCATION ................................. 15
3. THE BASIC EDUCATION SECTOR IMPROVEMENT PROGRAM ....................... 16
A. PROGRAM OBJECTIVES ................................................................................... 16B. PROGRAM DESCRIPTION ................................................................................... 16
Component 1: Enhanced Quality of Teaching and Learning ........ ............ 17
Component 2: Management for Efficiency ............................................... 19
Component 3. Improving Access and Participation ................................. 22
C. PROGRAM COSTS AND FINANCING .................................................................... 24
Program Costs ................................................................................... 24
Program Financing ................................................................................... 26
Program sustainability ............................................................................... 27
This operation was prepared on the basis of a series of missions in 1995/1996, which worked closely with Govemmentofficials from the Ministry of Education and Ghana Education Service, and with donor agencies including ODA(UK),KfW (Germany), USAID, UNICEF and EU. Mission members comprised at different times Messrs/Mmes GregoryHancock (Sr. Operations Officer), Kazuhiro Yoshida (Human Resources Economist), Josephine Woo (Project Officer),Irene Xenakis (Sr. Implementation Specialist), Tsri Apronti (Project Officer), Eluned Roberts-Schweitzer (EducationSpecialist), Sudharshan Canagarajah (Economist), Rebekah Kirubaidoss (Sr. Staff Assistant); and Kevin Brown, GaryTheisen, David Evans, Joanne Capper, Bing Deng, and Paul Turton (Consultants). Messrs/Mmes RebekahKirubaidoss, Geise Santos (Staff Assistant) and Ross Pfile (Projects Assistant) provided support for report production.Peer reviewers are Messrs/Mmes Marlaine Lockheed, Ward Heneveld, Nicholas Bumett and Dzingai Mutumbuka.Messrs. Ian Porter and Olivier Lafourcade are the managing Division Chief and Director, respectively, of theoperation,

REPUBLIC OF GHANABASIC EDUCATION SECTOR IMPROVEMENT PROGRAM
CREDIT AND PROGRAM SUMMARY
Borrower: Republic of Ghana
Implementing Agency: Ministry of Education/Ghana Education Service
Beneficiaries: School age children, teachers, Ministry of Education, GhanaEducation Service, and district authorities
Poverty Category: Program of Targeted Interventions. Focusing on issues of educationquality, equity and efficiency, the program will particularly benefiteducationally less advantaged groups of the Ghanaian population,directly school-age urban and rural poor children, and indirectly theirparents and communities.
Credit Amount: SDR 34.7 million (US$50 million equivalent)
Terms: Standard IDA terms, with 40 years' maturity
Financing Plan: For phase 1 (1996-2000) of the Government's Basic Education SectorImprovement Program:
US$ millionGhana (Govenrment/communities) ,5120.9Ongoing donor support 54.0Proposed donorf0nancingIDA 50.0UODA (UK) 23.0 equiv. (£15.0 m)GrSAID (tentative) 53.0Germany (tentative) /a 25.0 equiv. (DM 40.0 m)Other (to be confirmed) a 25.3
Rate of Return: Primarv Jr. SecondarvPrivate internal rate of return 27.7% 12.4%Social internal rate of return 18.5% 9.7%
Project ID No. GH-PA-975
- The European Union, Japan and Norway have expressed their interest in supporting the program, but commitmentsare not yet firm.
P Rates of return are based on mean earnings by each subgroup according to their educational background. The rateof return for primary education, for instance, compares costs and benefits between those with no education andthose with primary education over the period of working life. It is also found that the rate of return to basiceducation is higher for girls than for boys in Ghana, justifying interventions targeting girls and poor children.

ii
FCUBE Program 1996-2000Total Costs of Betterment Activities
Local and Foreign Costs by Component(US$ million)
Component Local Foreign Total % Foreign1. Enhanced Quality of Teaching/Learning
(a) In-Service Training of Education Personnel 7.7 2.1 9.8 21.0%(b) Pre-Service Teachers' Training 12.6 14.0 26.7 52.3%(c) Assessment/Evaluation of Student Performance 0.7 0.9 1.5 55.9%(d) Provision of Instructional Materials 38.7 47.7 86.5 55.2%(e) Curriculum Review and Development 0.5 0.4 0.9 46.1%
Subtotal 60.3 65.0 125.4 51.9%2. Management for Efficiency
(a) Institutional/Organizational Analysis & Change 12.4 3.5 15.9 21.9%(b) Staffing and Personnel Management 4.3 1.7 6.1 28.3%(c) Performance Management 1.1 3.2 4.2 74.7%(d) Budgeting and Financial Management 0.4 0.6 0.9 60.3%(e) District Capacity Building 1.4 0.4 1.8 20.0%
Subtotal 19.6 9.3 28.8 32.1%3. Improving Access and Participation
(a) Infrastructure Development and Maintenance 22.8 22.1 44.9 49.2%(b) Increasing Girls' Participation 1.8 0.5 2.3 20.0%(c) Schooling Improvement Fund (SIF) 8.9 2.6 11.4 22.5%(d) Information, Educ and Communication (IEC) 0.2 0.0 0.2 20.0%
Subtotal 33.7 25.2 58.8 42.8%Total Base Costs 113.6 99.5 213.0 46.7%Price Contingencies 8.6 7.5 16.2Physical Contingencies 6.6 5.8 12.4Total Costs of Betterment Activities 128.8 112.8 241.6 46.7%
Estimated Annual Disbursement(US$ million)
j IDA FY 1997 1998 1999 2000 2001Annual 2.5 11.7 13.3 14.8 7.8Cumulative 2.5 14.2 27.5 42.2 50.0

REPUBLIC OF GHANA
BASIC EDUCATION SECTOR IMPROVEMENT PROGRAM
1. INTRODUCTION
1.1 The Government of Ghana has requested IDA assistance of SDR 34.7 million (US$50.0million equivalent) to help finance the first (five-year) phase of a basic education sectorimprovement program which will be implemented over the ten-year period 1996-2005, aimed atimproving: teaching and learning outcomes; access to primary and junior secondary education(especially for girls and the poor); efficiency in resource management; and financialsustainability.
1.2 This request is based on experience gained over nine years from a series of Government,IDA and other externally funded activities in support of the national Education Reform Program.It is in response to a constitutionally mandated requirement that universal basic schooling beavailable to all young Ghanaians by the middle of the next decade.
2. THE EDUCATION SECTOR AND SOCIO-ECONOMIC CONTEXT
A. ECONOMIC AND SOCIAL OVERVIEW
2.1 During the 1970s and the early 1980s, Ghana experienced a serious economic decline,bringing a country which once had enjoyed a relatively high living standard compared with otherSub-Saharan Africa (SSA) countries down to bedrock. The economy had contracted by 2-3percent per annum during this period. Since launching the Economic Recovery Program (ERP)with support from the IMF, the World Bank and other donors, the Government has made thirteenyears of efforts at economic stabilization and structural adjustment. The economy has beengrowing by an average of about 5 percent annually, or at around 2 percent per capita. TheExtended Poverty Studyl found that during the middle stages of the ERP, poverty had fallenmoderately. Sustained and even more rapid growth and more rigorous poverty-fighting activitiesare necessary to improve the quality of Ghanaian life within a reasonable time-span.
2.2 Government has adopted a strategy of trying to accelerate growth and to achieve socialequity and poverty reduction, with agriculture and other parts of the private sector being themain engines.2 Over the past few years, the macroeconomic situation has been less favorable.Despite a successful turnaround in fiscal balance, annual inflation exceeded 60 percent in 1995.It is important that all segments of the population also benefit from growth through participatingin economic activities. This requires all Ghanaians to be functionally literate and numerate.
Ghana Poverty Past, Present and Future, The World Bank, 1995.
2 Ghana 2000 and Beyond: Setting the Stagefor Accelerated Growth and Poverty Reduction, TheWorld Bank, 1993.

2
Human resources development is ranked highly among the Government's key development3objectives; and basic education has a crucial role to play. Key social, economic and education
indicators for Ghana are shown in the Basic Data Sheet (Annex 1).
B. EDUCATION SYSTEM OVERVIEW
2.3 Since independence in 1957, Ghana's educational services have been financed andprovided mainly through the public sector, although private provision is an important part ofprimary schooling and technical training. Due to the heavy dependence on public financing, themacroeconomic turmoil of the 1970s and early 1980s plunged the country's education systeminto severe decline. Between 1976 and 1983, expenditures on education by the Government fellfrom 6.4 percent of GDP to 1.4 percent. A shortage of foreign exchange deprived schools oftextbooks and other essential instructional materials. A mass exodus of trained and qualifiedteachers who were unsatisfied with poor conditions of service left nearly half of the primaryteachers untrained. School buildings, furniture, and equipment deteriorated. In 1987, theGovernment initiated an overall education sector reform as an integral part of its national planfor economic recovery. This process restructured the school system; revised the curricula forprimary, junior secondary school (JSS) and senior secondary school (SSS) levels; developed newteaching and learning materials; provided in-service teacher training; raised teacher qualificationrequirements; steadily replaced unqualified teachers; introduced several cost-saving/sharingpolicies; and began the process of administrative decentralization. In the early 1990's, theGovernment turned its attention also to the tertiary sub-sector, consisting of universities andpolytechnics. These institutions were coming under increasing strain owing to the huge increasein social demand, in part brought on by the creation of mass schooling. Middle level technicaltraining is provided by a mixture of public and private providers, but it is widely regarded asbeing non-responsive to changing labor market needs and the preferences of school leavers.
2.4 Structure. Ghana's current education structure is still in the consolidation stage. Priorto 1987, education in Ghana consisted of a six-year Primary; a four-year Middle; a seven-yearSecondary (the first five years leading to the 'O' level certification and the last two leading to the'A' level); and a three or four-year Tertiary. Legally it was possible to skip the middle schoolyears by passing the Common Entrance Examination in class 6 of primary grade. In reality,however, the majority had to spend as long as 17 years for pre-university education. Thestructural change has been one of the key elements of the reform. The new system consists ofprimary (grades 1-6) and junior secondary (grades 7-9), together forming the Basic Education(BE) cycle, followed by the senior secondary cycle (grades 10-12); and several forms of postsecondary education and training that include technical institutes, universities, polytechnics, andteacher training colleges. The final replacement of the old structure with the new structure isbeing completed during the 1995/96 academic year when the last cohort of students under the oldsystem graduates.
2.5 Dimensions of Basic Schooling. Ghana's nine-year basic education cycle is nominallycompulsory, and children are supposed to enter primary school at the age of six. Primary pupilsare promoted to the next grade every year except for pupils (up to 5 percent) with extremelyweak performance or poor attendance, who repeat with parental consent. In reality, quite a fewpupils are over-age, and about one-fourth of the average Primary One (P1) cohort drops out by
Ghana Vision 2020, Government of Ghana, 1995.

3
P6 (Annex 2-4-1). In the primary school, nine subjects are studied: English, Mathematics,Science, Agriculture, Social Studies, Life Skills, Ghanaian Language, Cultural Studies, andPhysical Education. The lower primary classes (P1-3) are taught in the Ghanaian languageprevailing in the local community; for P4 and beyond, English is the language of instruction.
2.6 After completing the sixth grade, all pupils are automatically eligible to enroll in JSSwithout being screened by examinations, subject to a place being available. JSS is expected toequip those who wish to enter the world of work with the necessary basic skills, or to develop theability to continue study at SSS. Thus to meet these dual objectives, JSS curricula have beenrestructured, and new syllabi and teaching materials developed for thirteen subjects - technicaland pre-vocational skills training have been added to the core primary subjects, with French asan elective course.
2.7 The access and participation situation in Ghana compares favorably with the SubSaharan Africa (SSA) average, and with other countries with a similar level of per-capitaincome. Yet for a country which aims to join the newly industrializing economies, Ghana isfacing a big challenge (Table 2-1 below). Global evidence demonstrates the importance ofwidening opportunity for quality schooling at both primary and secondary levels. In the nationalinterest, efforts of the Government to strive for universal, quality basic education is not only aconstitutional responsibility, it is a prerequisite for the economy to grow and for poverty to bereduced.
Table 2-1. Basic Education Enrollments: A Comparative Look"
| Primary GER Secondary GERSub-Sahara Africa 67 18Low-income' 66 26Fast-growing' 99 52Ghana 78 430
Source: WDR, 1995 and MOE, 1995.aNotes: Enrollment data is of 1992; for Ghana it is of 1993.b Excluding China and India.
Average GER of 9 fastest growing countries (6% or more)d during the period 1980-93.
A combined gross enrollment ratio for JSS and SSS.
2.8 In primary school, a teacher covers all subjects with her/his class group; and is supposedto be competent in at least two Ghanaian languages. Headteachers are nominally detached fromteaching so that they can concentrate on school management and supervision. In many cases, theheadteacher has class duties as well, leaving little time for proper school management. There aresome 63,000 primary school teachers and 31,000 JSS teachers in schools. National Serviceprovides additional temporary teachers, some 2,000 for primary and over 5,000 for JSSrespectively who serve for two years. This makes a theoretical pupil/teacher ratio of 31:1 inprimary and 20:1 junior secondary (Annex 2-2-2), although these national average figures do notcapture the reality in many districts of overcrowded classrooms, a shortage of teachers, and in

4
JSS, a big difference in the student/teacher ratio by subject (Annex 3-2-8). As well, there areover 4,500 Ghana Education Service (GES) staff who are qualified as teachers but serve inadministrative positions at headquarters, regional and district offices and at religiously-basededucational units (Annex 2-6). To become a qualified teacher now, one has to be a graduate ofeither a teacher training college or SSS, and has to have been awarded a teacher certificate.Previously, many became teachers after completing the middle school, and without having anyprofessional training. The situation has improved, and presently around three-quarters ofprimary teachers and two-thirds of JSS teachers are at least minimally trained and certified(Annex 2-5). The Ghana National Association of Teachers (GNAT) counts among its membersall teachers at public schools and those teachers at private schools who are on a fixed termsecondment from the public sector, as well as those with qualification for teaching but presentlyholding administrative posts.
2.9 Private Sector. Until now, Government policy on private sector provision of schoolingmay be described as lightly regulated laissez-faire. Private primary and to a lesser extent JSSsare currently spreading at a higher rate than public schools, mostly in urban areas. There are atleast 900 private primary schools, accommodating about ten percent of primary enrollmentnationally. In addition, there are 200 private JSSs enrolling some 30,000 students, about sixpercent of all JSS enrollments. These private schools charge instructional and other fees, andpay their own teachers while the Government provides textbooks and some other consumables.Fees presently range from 25,000 cedis to 65,000 cedis per term, with extra charges rangingbetween 5,000 and 10,000 cedis a year. GES certifies private schools and has tried to regulatefees, but has met with resistance on the latter from the private schools lobby. There are alsoseveral "international" schools offering high cost (and high quality) services to the national andexpatriate elite without any support from the Government.
2.10 System Administration. The Government, through MOE, is responsible for basiceducation policy. MOE has four core functional divisions: Planning, Budgeting, Monitoring andEvaluation (PBME); Manpower Development, Training and Personnel Policy and Management;Statistics, Information Management, Public Relations and Research; and General Administrationand Finance. In addition, there is a Project Management Unit (PMU), staffed mainly on acontract basis, to facilitate the administration of externally funded projects. MOE is supportedoperationally by the Ghana Education Service (GES), which was established in 1974, largely as aresult of pressure from the Ghana National Association of Teachers (GNAT), to promote a senseof collegiality, accountability and peer discipline among teachers. GES, with offices at Accra,the ten regions and 110 districts, delivers and supervises education services. All public pre-tertiary teachers belong to GES. Each district, under the Local Government Act of 1988, isresponsible for providing and maintaining basic school infrastructure. Teachers, and teachingand learning materials, are provided by MOE to all government schools.
2.11 Government Financial Commitment. The Government's current emphasis on theimportance of education in the development process has been reflected in the budget foreducation. The education budget as a percentage of GDP has increased from the pre-ERP's lowlevel of 1.4 percent in 1983 to 3.2 percent in 1989, and further to 3.8 percent in 1994 (Annex 3-1). Hence, Ghana has shown relatively strong fiscal commitment to the education sector duringits decade of structural adjustment. The proportion of the Government's annual discretionarybudget allocated to education has averaged nearly 39 percent over the last five years, on anactual spending basis. Intrasectoral allocation since the educational reforms began in 1987 has

5
been in favor of basic education which has consistently received 60 percent or more of MOE'sbudget.
2.12 Financing the Basic Education Sector. Over the last four years, of the total amount ofbasic education recurrent expenditure, the Government has contributed about two-thirds,households about a quarter, and donors about 10 percent (Annex 3-1-3). For capital costs,districts are the major source of in-country domestic spending and on average they share the loadequally with external aid partners, although contributions toward capital expenditures fluctuatesignificantly. Two major sources of funding for districts are the District Assembly CommonFund (DACF), a centrally distributed intergovernmental (i.e. national to district level) transfer of5 percent of the national tax revenue; and funds generated by the districts themselves, witheducation levies accounting for most. The Government has thus been responsible mainly forrecurrent expenditure, predominantly salary and administrative costs. Its spending oninfrastructure and instructional materials has been very minimal; which has been compensatedfor by donors.
2.13 Despite substantial real increases over the years which have made teacher salariesrelatively higher than those for civil servants of comparable rank, remuneration is still felt to beinadequate by many teachers. This contributes to alienation and to the inclination to pursueother income-generating activities. Making sufficient resources available for non-salaryexpenditures in schools to improve the quality of education outcome while maintaining teachermotivation through attractive incentive packages are challenging tasks.
C. KEY ISSUES IN BASIC EDUCATION
2.14 Since establishing a joint forum with resident donors in 1994, MOE/GES has beenengaged in collaborative sector studies. A top-level task group was formed by the Minister forEducation to oversee the preparation of reports prepared by professional study teams involvinglocal experts, and a series of participatory workshops has been held involving stakeholders.Parents, community leaders, district and regional officers, teachers, parliamentarians, andMOE/GES staff have all contributed to producing analytic reports that have identified the mainissues which have been addressed in the MOE's Strategic Plan for Universal Basic Education(FCUBE).
2.15 The key issues in basic education flowing from the process outlined above can becategorized into four broad areas as follows: (a) poor teaching and learning outcomes; (b)inadequate access to education services; (c) weak management capacity at all levels of thesystem; and (d) unsatisfactory financing arrangements.
Poor Teaching and Learning Outcomes
2.16 Over the past decade the present education system has been rebuilt on the ruins of itspredecessor. However, despite increased resource inputs and enrollments, the reform movementhas had very limited success so far in improving the quality of teaching and learning outcomes.Pupil achievement continues to be very disappointing. Criterion referenced tests conductedthrough a USAID project (PREP) on a sample of P6 pupils over the last few years continue toshow appalling results. In 1994, only three percent of the pupils tested attained satisfactoryscores for English, and merely 1.5 percent for mathematics (Annex 2-3). If the basic education

6
system continues to fail to produce acceptable outcomes, it will become politically difficult forthe Government to maintain such a large share of budgetary resources for schooling, parentalconfidence will be totally eroded, and a downward spiral will negate the considerable progressover recent years as measured by a number of important indicators.
2.17 Causes identified for this problematic situation include: (a) lack of instructionalmaterials and equipment despite the considerable external funding for them over recent years,and even where available, teachers often do not make effective use of them; (b) inadequatespending on non-salary recurrent items, especially at the school level; (c) high levels of pupil andteacher absenteeism; (d) insufficient teacher-pupil instructional contact hours; (e) inappropriatepre-service teacher training and inadequate in-service teacher training; (f) unmotivated teachersowing to ineffective supervision, unattractive incentives and low societal regard of the teachingprofession; (g) an overly ambitious curriculum, burdensome to both teachers and pupils and; (h)didactic modes of teaching, namely, rote memorization and copying from the blackboard.Furthermore, many private and some public schools, especially some religiously based, do notactually provide the regular courses. A complicating issue is the language of instruction: poorrural children tend to have almost no access to spoken or written English in everyday life. In thelower primary school in which children's mother-tongue is supposed to be the language ofinstruction, insufficient supply of both educational materials and teachers who can communicatein local languages means that few pupils learn the skills of reading and writing even in theirnative language. The majority therefore have no linguistic framework to help them becomeliterate in English as a second language. While recognizing that, as in most multi-linguisticcountries, this is a political as much as a pedagogical issue, it is nonetheless having a devastatingeffect on the learning of core skills.
Lack of Management Efficiency
2.18 Improving the effectiveness and efficiency of MOE/GES cannot be achieved throughaction in the education sector alone. A collective effort is required which will involve a widerange of stakeholders - other Government and public sector agencies, particularly the Ministriesof Finance and Local Government, Office of the Head of Civil Service (OHCS), and the NationalDevelopment Planning Commission (NDPC), communities and employees/unionsrepresentatives. Nonetheless, immediate strengthening of the management capacity ofMOE/GES is required. Some of the immediate management issues to be addressed aresummarized below
2.19 Effective management of basic education depends upon the institutional capabilities offive agencies - the twin bureaucracies of MOE and GES at the central, regional and districtlevels, the Ministry of Finance (MOF), the OHCS, and the schools themselves,. MOEformulates education policy, sets sectoral objectives, determines sub-sectoral resource allocationand monitors the provision of services. GES has its own enabling legislation, the GhanaEducation Service Act of 1994, and provision for a Governing Council. It is the technicalimplementing arm of the education sector. While MOE is a civil service agency and GES asubvented one, to all intents and purposes they are administratively and budgetarily interrelatedin their day to day operations. MOF holds the budgetary and resource allocation levers, althoughMOE/GES are expected to manage their allocations within prescriptive guidelines. OHCScontrols the appointment of new personnel and senior managers.

7
2.20 Significant efforts have been made over the years to enhance the responsibility andauthority of the GES District Education Offices (DEOs). In line with this, it is envisaged that therole of the Regional Education Offices would be one of coordinating and monitoring. RecentlyDEOs were given extended authority over some staffing matters, especially promotions,although the majority of personnel decisions, particularly those concerning appointments andsevere discipline, continue to be taken centrally within the GES. In practice, the regionscontinue to play a significant managerial role in the preparation of budgets, although this isexpected to change with the advent of financial decentralization.
2.21 Restructuring. In 1995, the GES initiated a review of its management structures atheadquarters, regional and district levels in order to bring authority and responsibility forservices closer to communities. As part of this process a workshop was conducted in March1996 for MOE/GES managers, District Assembly members and headteachers in order todetermine management responsibilities at different levels, to define the relationships betweenkey bodies and to formulate priorities for institutional strengthening. The results of this exerciseare set out in Annex 8. This has been motivated both by the pressing requirement to reduce non-school based payroll costs in order to make more resources available for schools; and by thepolitical imperative to decentralize functions. The dilemma is that increased decentralization,whether administratively or politically motivated, often leads to demands for additionaladministrative staff and hence larger payrolls. The restructuring of GES, which is necessarilycoupled with that of MOE, is being conducted in line with the National Institutional Renewal andthe Civil Service Performance Improvement Programs (NIRP/CSPIP), the Government umbrellaarrangement for public sector and financial management reform. The systemic issues arisingfrom workshops, together with the outputs of beneficiary surveys, are currently being analyzed.These will form the basis for actions to address system-wide constraints to public sectorperformance and good governance. The restructuring of MOE/GES and the development ofimproved management systems and skills will need to be facilitated by, and harmonized with,this broader process.
2.22 Decentralization. The restructuring referred to above involves significant delegation ofoperational decision making to the district level. Hence it will give due regard to the localgovernment reform movement which has been pursued since 1988 in order to promote popularparticipation in development by devolving powers and responsibilities for service provision toelected District Assemblies. As a result of the Local Government Acts of 1988 and 1993,District Assemblies have a legal mandate to take over specified Government services includingthe primary and junior secondary schools. District Education Oversight Committees (DEOCs)are in the process of being established (Annex 6). In order to effect this transfer of authority,responsibility and accountability for services to the District Assemblies, additional enablinglegislation such as the passage of the Local Government Service Bill will be required. Further,"Common Funds" have been established to enable District Assemblies to meet capitalexpenditures for all sectors. In time, recurrent budgets may also be devolved to the Assemblies.Accordingly, the restructuring and decentralization which will take place within the MOE/GESwill need to pave the way, ultimately, for full devolution of basic education services to theDistrict Assemblies.
2.23 Devising improved and decentralized management structures and achieving clear rolesand decision making authority are necessary but not sufficient conditions for institutionaleffectiveness. A number of other critical management issues need to be addressed to enable theMOE/GES to achieve its basic education goals. These are summarized below.
8
2.24 Organization Culture. Whilst proposals are being developed to streamlinemanagement and to delegate authority to the districts, a management culture which is rooted incentralized decision making and administration by formal directives remains largely intact.Resistance to change can be anticipated from some. Pre-emptive action is required to counteractimpedance of further operational delegation and local initiative.
2.25 School Supervision. Inadequacies in the supervision of schools, both by district levelofficers and headteachers, and the limitations of disciplinary processes are seriously underminingeffective teaching. Of particular concern are the quality and impact of school inspections and thedegree of professional independence of the inspectors and circuit supervisors. The absence of anappropriate performance management framework which sets out clear and relevantaccountabilities for monitoring purposes simply compounds the problem.
2.26 Educational Management Information. School census and survey data critical forplanning and resource allocation are consistently reported too late to be of practical use. As aresult, user units tend to collect their own information independently. This results in duplicationof effort, data inconsistencies and validity problems, as well as overburdened district officialswho are charged with data collection. The fact that units tend to operate in isolation furtherinhibits informnation sharing and exacerbates the problem.
2.27 Management Skills. There is a dearth of capable managers at all levels of the systembecause they have traditionally been selected on the basis of their teaching qualifications andexperience. Subsequently very few receive any significant management training. Inadequaciesin the supervision of schools, both by district education officers and headteachers, and thelimitations of disciplinary processes are seriously undermining effective teaching and learning.Such weaknesses are reinforced by the absence of an appropriate performance managementframework which sets out clear and relevant accountabilities for monitoring purposes.
2.28 Community Involvement. An important question is how communities can becomemore involved in the management of schools through the new School Management Committees(SMCs) and DEOCs recently legislated in the GES Act of 1995. Although parents are officiallyexpected to play a more active role in school management, many continue to see their role asproviding supplementary financial support only. This is partly due to some confusion betweenthe roles of the PTAs and the SMCs and partly because teachers do not always welcome parental"intrusion".
2.29 Resource Allocation. There is a general shortage of instructional materials especially inprimary schools and of trained teachers particularly in rural areas. There are also weaknesses inthe resource distribution system and the teacher posting system, resulting in considerableinequities between schools, regions and districts (see para. 2.35). These problems are partly dueto absolute resource limitations but can be attributed largely to failure in the resource allocationprocess which allows prior claim to personnel emoluments and to advantaged areas.
2.30 Rewards. Currently there are few incentives available to teaching and non-teachingstaff, beyond the standard remuneration and conditions of service, to encourage and reinforcegood performance. Specific performance-related rewards to motivate staff and salary rangedecompression to attract and retain people in positions of high responsibility, have to be devisedand implemented.

9
Unsatisfactory and Inequitable Access and Participation
2.31 Basic education enrollments have been increasing. Enrollment in public primaryeducation increased by more than 25 percent during the 1988-93 period from 1.6 million to 2.0million. Enrollment in private schools increased relatively more rapidly from about 134,000 to225,000. But because of population growth, enrollment ratios have been stagnating despiteoverall enrollment increases (see Table 2-2 below). The gross enrollment ratio presently standsat 78 percent for primary with 85 percent of children at age 6 entering the first grade (P1); and at61 percent for JSS. Enrollment ratios in the north, where girls comprise only 35 percent ofprimary enrollments and as little as 25 percent in junior secondary, are up to 30 percent lowerthan the national average (Annex 3-2-8). Girls' enrollment ratios continue to decrease steadilythrough the grades (Annex 3-2-2). The direct and indirect costs of education together withparents' lack of confidence in the education system are discouraging poor families from sendingtheir children, particularly girls, to school.
Table 2-2 Population and Primary School Enrollments 1980-93(in thousands)
Average for the period Average Growth Rate1980-84 1984-88 1988-93 1991-93 1980-84 1984-88 1988-93 1991-93
Population 11,516 13,138 15,270 15,963 3.7% 3.4% 3.1% 3.1%School age (6-11) 1,926 2,175 2,511 2,641 3.1% 3.1% 3.5% 3.8%primary (public) 1,468 1,586 1,778 1,855 2.5% 1.2% 3.6% 2.8%primary (private) 112 126 174 209 3.1% 3.1% 10.9% 4.9%GER (pub.& priv.) 82.0% 78.8% 77.7% 78.2% -0.5% -1.8% 0.2% -0.9%
Source: MOE
2.32 During 1988-92, the number of public primary schools increased from 9,368 to 11,270.The mid-term review of the IDA-funded Primary School Development Project (PSDP) foundthat some districts, particularly in the north, put in a significant part of their budget forschooling. But due to limited financial capacity and inefficiency in resource management by thedistricts which are legally responsible for basic education infrastructure, the need to construct,maintain and rehabilitate school facilities is far from being met satisfactorily. Despite MOE'sguideline that all children should not have to walk more than 5 km to school, in rural areas, manychildren walk in excess of 8 km. Progress through PSDP and other donor supportnotwithstanding, classes under trees are not unusual; and many schools do not have protectionfrom rain or wind. The absence of systematic school mapping does not enable MOE to monitorthe actual condition of infrastructure or to determine relative needs for rehabilitation andconstruction of new schools.
2.33 Weak Community Involvement. The majority of parents have not yet regainedconfidence in the public school system because of its perceived poor value for money. Atpresent local communities have a limited role in the running of primary and JSSs: extra-curricular activities organized by Parent Teacher Associations (PTAs) are the most usual form ofinvolvement. For this reason, communities feel little ownership of the schools their childrenattend; and frequently are mistrustful of attempts by the authorities to solicit communityinvolvement lest it be an excuse for extracting additional financial contributions. MOE is aware

10
that new approaches to community participation need to be actively pursued. Draft constitutionshave been prepared for the legislatively mandated SMCs at the primary and JSS levels. Thesecommittees have a potential role to play in relation to the new DEOCs and to DistrictAssemblies. However, the SMCs as presently constituted will have limited influence asgoverning bodies until significant management responsibility is transferred to the schoolsthemselves.
2.34 The key to successful community participation is to ensure that, having regard to distinctfeatures, local people have a real influence over decisions which affect the quality of educationtheir children receive. Ultimately, communities are likely to reject mechanisms which are seenas simply advisory or established to "rubber stamp" decisions taken by school or systemofficials.
2.35 Geographical Disparities. There are multiple disparities among regions. In 1992, thetotal gross enrollment ratio (including both public and private schools) for primary educationwas high in Volta, Ashanti and Greater Accra (ranged from 90 to 86 percent), much higher thanthe national average of 77 percent, while low in Upper East, Northern and Upper West rangingfrom 53 to 46 percent. The three regions with the lowest enrollment are also the three poorestregions. The private sector is especially active in Greater Accra, currently accommodating 36percent of total primary enrollment, and in Ashanti (14 percent), the two regions with thecountry's biggest cities (Annex 3-2-7). Regional spending patterns, however, do not showevidence of action to mitigate this inequity. Upper East and Upper West, two of the mostdisadvantaged regions, spent only US$22-23 per primary school pupil in 1994 against thenational average of US$52 (Annex 3-2-9).
2.36 The Poor. The fact that provision of basic education infrastructure is the responsibilityof district governments and local communities works unfavorably against poor areas because oftheir lesser fiscal capacity, despite supplementary financial support by the central government.Also, there are various direct and indirect costs of schooling. The Bank's poverty study onGhana shows that children without access to basic education predominantly belong to families ofthe poorer segment of the population (Annex 3-2-4). In efforts to mobilize resources locally forschool maintenance, many districts, PTAs, and schools impose levies or fees. These additionalcosts further deny access by the poor. Many school-age children are contributing to familyincome in one way or another. For poor parents, the high direct costs of schooling, the criticalimportance of income earned by their children, and uncertainties about future higher earningderiving from participation in basic education, all contribute to their opting not to send all thechildren to school. The very poor households spend only half as much on primary education asthe richest households do (Annex 3-2-5). In rural areas, where most of the poor reside in Ghana,households spend less on, and benefit less from, education than households in urban areas(Annex 3-2-6).
2.37 Girls. Access of girls to basic education, although gradually improving, is a major issueamong gender concerns in education. On the encouraging side, particularly at the JSS level, thegross enrollment rate increased from 43 to 51 percent in the last five years, and the retention rateis also improving. Less improvement is seen at the primary level (Annex 3-2-1). However, atall grades of schooling, girls enrollment is lower than that of boys. Out of every 100 girlsenrolled, 72 reach P6 and 51 reach JSS3, against the boys' 80 and 63, respectively. Suchdisparities increase in the north. Studies in Ghana show that in addition to the factors militatingagainst the children of poor families attending school, factors known to impede the participation

I1
of girls include: high opportunity costs of education for girls who are needed for household andchild care and parents' perception of boy's superior returns to education; socio-cultural barriersto girls education, and traditional early marriages; lack of parent/community awareness of thebenefits of girl's education; inability of parents to pay for the education of all their children,leading to prioritizing of boys; inappropriate domiciliary and hygiene arrangements associatedwith schools; and insufficient role modeling by women teachers. These access, retention andperformance problems are sourced as much on the "demand" side (i.e. household behavior andcultural attitudes) as on the "supply" side (i.e. education policies and school facilities). Table 2-3 summarizes these disparities at the district level.
Table2-3. Basic Education Characteristics by Neediest Regions
% of % of Pupil/TeacherDistrict Total District Total Districts Ratio
I.GUSHIEGUKARAGA 23.77 JUABESOBIA 25.38 GUSHIEGUKARAGA 56.11ans,R@ex:t* 1eu-11[5]f12 * * * * 11
3.TOLONKUMBUNGU 28.13 AFRAMPLAINS 32.26 ACCRA 46.034.ZABUZUGU 33.02 SENE 38.89 SABOBA 42.575.EASTDAGOMBA 33.96 SAVELUGUNAN. 39.50 KASENANANKANA 41.876.NANUMBA 34.52 TWIFUHEMAN 42.30 BAWKUEAST 40.357.EASTMAMPRUSI 35.48 EASTGONJA 43.63 NADAWLI 40.058.BAWKUWEST 36.14 MPOHORWASSA 45.27 JIRAPALAMB 39.289.SABOBA 37.06 WASSAAMENFI 46.34 GA 39.1010.BAWKUWEST 37.25 ASUNAFO 46.61 BUTLSA 38.701 IBONGO 37.25 ATEBUBU 46.69 BOLGA 38.07 *
|| 12.WESTDAGOMBA 39.21 SEFWIWIAWSO 48.53 KUMASI 37.8213.EASTGONJA 39.90 ZABUZUGUTATALE 49.21 ANLO 37.5014.13OLE 40.18 ADANSIEAST 49.25 BOLE 37.25
[15JIRAPA-LAMB 40.68 AMANSIEWEST 49.78 TEMA 36.86
Source MOE.
Inadequate Financing Arrangements
2.38 The education sector has been receiving 36-40 percent of the Government'sdiscretionary recurrent budget (net of debt servicing and other extra-budgetary items); andaround 3 percent of the development (capital investment) budget. The expenditure side has beenconstantly beset by uncertainties concerning salary obligations. During the past several years forwhich expenditure data is available, MOE's actual expenditures have overrun the budget. Nearlythe entire overrun can be attributed to salary related expenses while in some instances the meageramounts allocated to non-salary items have been underspent. The absence of a workable policyto contain overall personnel emoluments, and of a reliable and timely expenditure monitoringsystem are partly responsible for this poor financial management. In particular, data at thedistrict level, by the time it is consolidated at the regional level and forwarded to GESheadquarters, is out-of-date and is often inconsistent. The Government's central IntegratedPersonnel Payroll Data (IPPD) system is expected to address this problem, although inaccuratedata processing sometimes plays tricks with names from the payroll. Internal resource allocationwithin the basic education subsector is also heavily influenced by the sheer size of the wage bill.Of total MOE/GES expenditures, personnel emoluments account for 85 percent. When lookingat school-level basic education expenditures, around 98 percent of the national budget allocation

12
is absorbed by salary and related personnel costs with only a negligible remainder available forschool operation and maintenance. GES staff already account for over 40 percent of total publicsector personnel,4 but the policy goal of achieving universal primary education by 2005 indicatesthe need for further increasing the number of teaching staff. Given that the education sectorreceives more than one-third of the country's discretionary budget, it is essential to closelymonitor the size of the sector's salary envelope. Textbooks and other teaching/learning materialsare provided, but because the budgetary provision is so small, a substantial part of the costs oftextbook provision is presently financed by donors.
2.39 Inappropriate disbursement practices further impinge use of limited financial resources.Due to uncertainty about the extent of outlays on the emoluments, MOE/GES does not seem toeffect procurement of goods until the third or even the fourth quarter of the fiscal year. Thisoften results in underspending of the already thin non-wage budget. Reallocation from salary tonon-salary budget lines has not been allowed. With the recent agreement between MOE andMOF to undertake such internal reallocation, it is timely to establish a more user-friendlybudgetary system. A more transparent system of budgeting has to be developed: the presentsystem is extremely complicated and it is difficult to tell how much is actually spent on basiceducation or any other level of education.
2.40 Funds for rehabilitation have been provided through support from donors, NGOs,Districts and local communities. The Government has spent almost nothing on capital stock forbasic education in the past decade, except for transfers to the District Assembly Common Fund(DACF). Special resource transfers to the needier regions were made, but the level of supporthas not been adequate. Until recently learning materials have been procured largely fromabroad. This caused a serious supply shortage when foreign reserves and donor support were notavailable for this purpose. Moreover, even when textbooks have been procured, they have takentoo long to reach schools. Development of local capacity to produce and distribute learningmaterials in a timely manner remains a challenge.
2.41 Until the concept of cost recovery was introduced under the Education SectorAdjustment Credits (EdSACs), the Government had no scheme for sharing the financial burdenof public education. Textbook user fees of 0150 per pupil per year (later raised to 0250) wereintroduced in the P3 through JS3 range to offset production costs (less the cost of paper whichwas provided by CIDA). Also, students were charged for stationery items. Special revolvingfunds for stationary and textbooks were established but were not administered effectively.Primary education was regarded traditionally as being free of charges of any sort, and successivegovernments continued to declare that it should be free and universal. In 1991, when MOEimposed textbook fees for primary education, absolute enrollments dropped by 3.5 percent forthe first time in a decade. The memory of the "good old days" still affects many parents' notionsabout the cost of education, and about who should bear them. Unlike decades ago whenschooling was for a privileged minority, it is a pragmatic necessity in an era of mass educationfor governments to seek to establish cost-sharing arrangements to ease the burden on the publicpurse: the issue, of course, is one of equity.
2.42 For cost recovery schemes to be effective, collection rates and appropriate policies haveto be addressed. It is MOE's intention to ensure basic education opportunities for all by reducing
Ghana's public sector has some 345,000 staff; of this number, over 155,000 are GES personnel.

13
the actual private costs of the lower levels of public education and by increasing the proportionof cost-recovery at the higher levels. This is consistent with the differential rates in the socialand private returns to schooling at different levels. Thus, in response to the decreased intakeinto the P1, the Minister for Education announced in January 1995 that textbook fees would beabolished for primary education. This policy decision was accompanied by a raising of thetextbook fees at JSS to ¢1000. MOE policy explicitly forbids a basic education pupil beingexcluded for non-payment of fees of any sort on his/her behalf. Nonetheless, the de factocompulsory nature of ancillary levies is reported to be still widespread, with its accompanyingexclusions.
2.43 Parents/guardians are asked to pay for exercise books, stationery, school uniforms,lunch, transportation, and some other fees and levies which can amount to ¢5,000 per pupil(US$3.25) in rural areas and to ¢ 12,000 (US$8.00) in urban areas. Table 2-4 shows some of thefees paid for each pupil on average in 1992. For large poor families, this means fewereducational opportunities, especially for girls and younger children. It is important that theGovernment clarifies and wins support for guidelines as to which direct costs the householdshould pay. This needs to be done in the context of overall sectoral financial planning.
Table 2-4 Annual Private Costs of Publicly-Provided Basic Education(Cedis per pupil)
ActualMOE guidelines 1992
Tuition fee free 1,331Textbook user fees BE 3-9: 250 (Oct. 1990) )
500 (1991) )free for BEI-6 (1995) ) 710
Exercise books and for primary and JSS )stationery )
PTA levy 264Uniform 1,819Food/lodge 2,126Transportation 148Others 966Total 7,364
Source: GLSS 3: The Incidence of Social Spending in Ghana. 1992.
D. PREVIous BANK OPERATIONS IN THE EDUCATION SECTOR
2.44 The two main objectives of the education reforn that began in 1987 have been toimprove pedagogic coverage and to rebuild a financially sustainable education system. After aninitial emergency Health and Education Project (Cr. 1653-GH, US$5 million for educationsector), the implementation of the reform program was supported initially by the Bank throughthe First and Second Education Sector Adjustment Credits (EdSACs). EdSAC I (Cr. 1744-GH,US$34.5 million), which supported the first three years of the reform (1987-89) and closed onDecember 31, 1991, focused on the reform process particularly at the basic level (primary andJSS). EdSAC 11 (Cr. 2140-GH, US$50 million) supported the second phase of the reform

14
program (1990-92) to help consolidate the reform in basic education and extend it to the seniorsecondary level. The EdSACs have been followed by projects that respectively support: primary(Cr. 2508-GH, US$65.1 million), senior secondary (Cr. 2278-GH, US$15 million), and tertiary(Cr. 2428-GH, US$45 million) levels as well as adult literacy (Cr. 2349-GH, US$17.4 million)and vocational training in the informal sector (Cr. 2695-GH, US$9.6 million). In all, someUS$240 million has been committed by IDA over the past twelve years. The ongoing PrimarySchool Development Project (PSDP) is the antecedent to the proposed Basic Education SectorImprovement Credit (BESIC), and will partially finance the start-up of the FCUBE Programduring 1996 until BESIC becomes effective.
E. OTHER DONOR SUPPORT FOR THE EDUCATION SECTOR
2.45 Over recent times, the largest donors apart from IDA have been: USAID, whichallocated US$35 million to primary education over a six year period (1991-96) and is currentlyin the process of formulating a follow-on program of assistance within the framework ofFCUBE; ADB with US$20 million for tertiary education; CIDA with US$14 million mainly fortechnical education; British ODA with US$8 million for literacy and basic teacher education;Norway with US$8 million for literacy and school pavilions for basic education; and the OPECFund with US$4.4 million for school pavilions and school sanitation. The EU is providingearmarked adjustment funding to support non-salary recurrent expenditure in education. Otherdonors include World Food Program (WFP) for school feeding; UNICEF for primary and pre-school education; Switzerland for secondary school equipment; the Saudi Fund for secondaryschool development; GTZ of Germany for vocational school development and UNDP and ILOfor institutional strengthening. KfW of Germany has recently completed its appraisal of aproject to rehabilitate teacher training colleges serving basic schooling; and is about to preparean implementation strategy in collaboration with GTZ, having regard to FCUBE. Various non-governmental organizations (NGOs) have provided assistance.
F. LESSONS FROM PREVIOUS IDA AND OTHER DONOR INVOLVEMENT IN GHANA
EDUCATION
2.46 Some US$240 million of IDA credits have been approved for the whole education sectorin the past decade. Four projects are ongoing. The education reform movement at the schoollevel, fueled with IDA and other donor support, has seen a significant increase in enrollmentsand a decrease in drop-outs, although participation rates are a problem due to high populationgrowth rates. But the outcomes of schooling are still far from satisfactory.
2.47 One of the most important conclusions of the two Implementation Completeion Reports(ICRs) for the EdSACs as well as the recent mid-term review of PSDP is that continuing toexpand access to basic education and to increase physical inputs into the system are necessarybut not sufficient to ensure that the quality of teaching and learning at the school level improvessignificantly. More attention has to be paid to the "software" (process) aspects of programdesign and implementation. Institutional capacity matters a great deal in this context, withoutwhich new "hardware" (inputs) and existing resources cannot be effectively utilized.
2.48 The recent ICR for the Community Secondary School Construction Project providesequally important lessons: a community participation scheme may not work unless particularneeds and preferences, such as seasonal differences in the flow of income, are carefully

15
considered. Furthermore, the benefits of decentralization will not be realized without buildingstrong capacity at the community and district levels as well as at the central levels.
2.49 It is now necessary to harmonize development efforts to improve outcomes at the schoollevel while continuing to pursue the goal of universal equitable access. To this end, thetraditional project-by-project approach is being consolidated into support for the comprehensiveFCUBE Program, covering both development and recurrent activities. The lessons fromprevious IDA (and other donor) funded operations emphasize the importance of widespreadconsultation and debate at the formative stage, close involvement by the "line" divisions ofMOE/GES and by districts in implementation arrangements, and adherence to agreed prioritieswhile allowing financing flexibility to accommodate periodic program modifications justified byexperience gained over time. For more efficient management of external support to basiceducation, a MOE-donor forum was set up in August 1994 as an MOE initiative, and is now aneffective vehicle for regular communication and coordination among partners.
2.50 USAID, ODA and UNICEF programs in three areas of the country (Cape Coast,Winneba and Afram Plains) have gathered experience in small-scale, integrated approaches toprimary school development, with strong emphasis on community engagement and teachermotivation in the pursuit of improvements in the quality of teaching and learning.
G. RATIONALE FOR IDA INVOLVEMENT IN BASIC EDUCATION
2.51 MOE has affirmed that quality improvement of basic education must receive higherpriority from now on. The FCUBE program aims to achieve this through curriculum reform,continual (re-)training and monitoring of personnel, increasing community participation, system-wide management improvement, and steady expansion of access with priority to the neediestgroups. The FCUBE is the sole program for basic education, involving all current and futureactivities supported by national resources and external donors. The FCUBE will help addressequity, gender and poverty issues in terms of access to basic social services as well as buildingcapacity in the education sector and encouraging a participatory development approach. Theseare all in line with the Bank's own assessment of the situation and are underscored in the Bank'sCountry Economic Memorandum and Country Assistance Strategy. Without the continuedinvolvement of the Bank and other donors in Ghana's education sector, the Government willhave extreme difficulty in furthering the reform process. The Bank's sector knowledge andcomparative familiarity with the integrated sector investment approach will be particularlyhelpful to the Government in mobilizing continued donor support. The activities outlined beloware systemic in impact, affect all on-going basic education activities and structures, and promoteinitiatives to meet demand for access and quality. IDA assistance, in addition to the support ofother donors, for MOE's Sector Strategy and Operational Rolling Plan, will underpin a holisticsolution to a complex development problem.

16
3. THE BASIC EDUCATION SECTOR IMPROVEMENT PROGRAM
A. PROGRAM OBJECTIVES
3.1 The long-term national goal to which the FCUBE program will contribute is anempowered citizenry, regardless of the geographic region in which they live, their gender,religion or ethnicity. By requiring that all Ghanaians receive 9 years of quality basic education,the Government wishes to ensure that young people are prepared for further skills training eitherin the work force or in formal study. The central goal of the basic education system in Ghana isto ensure that all students are equipped with the capability to become full stakeholders in, andbeneficiaries of, development. The policy priorities, commitments and targets of the FCUBEprogram for the period 1996-2005 are outlined in the Government's Letter of Basic EducationSector Development Policy (Annex 4). IDA will support the Government's program, focusingon issues of school-level quality improvement, more equity in resource allocation, greaterefficiency in resource use, expanded access, and increased participation. The Basic EducationSector Improvement Credit (BESIC) will help consolidate the considerable progress made since1987 by helping to (a) improve the teaching process and learning outcomes; (b) strengthenmanagement of the basic education system through better planning, monitoring and evaluationby MOE/GES at central, regional and district levels, and by promoting active involvement ofcommunities in the management of schools; (c) improve access to basic education, especially ofgirls, the poor and other disadvantaged segments of the population; and (d) ensure financialsustainability of the Government program for basic education over the longer term.
B. PROGRAM DESCRIPTION
3.2 The FCUBE program is documented by MOE in two volumes: (a) a Program containinga statement of sector policy along with a description of the strategic framework and itscomponents; and (b) an Indicative Operational Rolling Plan. The second volume will beregularly updated in the light of experience and as additional sources of finance come on stream.A draft of this volume was discussed during negotiations, and as a condition of Crediteffectiveness, the Government will finalize and adopt the Operational Plan, with specificarrangements for activities to be carried out in 1996-98. The FCUBE program comprises threecomponents: (a) enhancing pedagogic effectiveness through support to teacher education,improved supervision, regular assessment of student performance, adequate provision ofinstructional materials and periodic curriculum renewal; (b) developing and strengthening thecapacity for efficient management at the central, district and school levels; and (c) improvingaccess to basic education, especially for girls and the less advantaged groups, and encouragingcommunity interest and participation in the schooling process. It will be necessary tosystematically design activities which explore the interactions between these components, in thelight of the best understandings of the factors that characterize effective education withinschools, focusing on, among others, school-level autonomy, school climate, the teaching/learningprocess, and pupil evaluation/feedback by teachers.
3.3 The program will support wide-ranging strengthening of capacity at districts and schoolsin the delivery of basic education. Among others, the development of leadership skills ofheadteachers, the quality of supervision, and the engagement of the community through SchoolManagement Committees (SMCs) will provide much more focused attention on issues relating tothe quality of schooling. The Government, with donor support, plans to work towards the

17
integration of these components in pursuit of school improvement in selected districts,attempting to develop models of best practice, and building on previous work described in para.2.46-2.50. This approach would involve working with individual schools, clusters of schools,individual headteachers, groups of headteachers, etc., in developing plans and strategies to utilizethe enhanced skill resource provided by the individual program components. It will be necessaryto provide detailed analytical data to monitor the improvements in the quality of pupilperformance in individual schools. It is expected that, as improvements of quality becomevisible, community engagement will increase. The results gained from these models, as well asfrom the proposed Schooling Improvement Fund (para. 3.23), will be applied to the nationalprogram.
Component 1: Enhanced Quality of Teaching and Learning
3.4 The FCUBE program recognizes and addresses the need to further upgrade theprofessional skills of basic education teachers, both before they take their posts as well as afterthey have served in their positions. This component will promote more effective teaching byimproving specific instructional skills through revamped in-service and pre-service trainingprograms and by motivating teachers through the introduction of new incentive and sanctionschemes. It will support the assessment of student performance to inform teachers, students andparents of progress and to provide the MOE with more objective criteria to evaluate theeffectiveness of basic education. Improvement in the quality of learning and studentperformance will also be addressed through the provision of instructional materials, as well ascurriculum review and revision.
3.5 In-Service Training of Education Personnel. With the assistance of participatingdonors, MOE plans to develop a program for in-service teacher training (INSET) that will relypartly on distance education methods and technology and partly on face-to-face workshopsduring school vacations. The INSET program will emphasize the acquisition andimplementation of practical skills and the use of instructional materials to strengthen theeffectiveness of teaching. School-based training for teachers will be increased and supportprovided to them through the development and improvement of Teacher Resource Centers.Teachers' Training Colleges (TTCs) will receive support to train tutors who will work withteachers in classrooms. This initiative will also ensure that graduates of TTCs have morepractical experience and awareness of the complexities of classroom instruction before they arecharged with managing a classroom on their own. Training for headteachers will seek tostrengthen their management and supervisory skills to ensure that they are supportive of reformat the school level and are effective in helping to improve the skills of the teachers.Headteachers will be required to attain accreditation standards after training programs in order tohold positions. Circuit supervisors and district education officers will be trained to carry outeffective supervision of schools and to provide necessary support to the headteachers andteachers. Orientation and mobilization workshops for key district officials and communityleaders will be conducted to encourage their active involvement in school activities. Training foreducational personnel at the district, regional and headquarters levels, some of which will beundertaken as part of the activities in Component 2 (para. 3.10-3.17), will seek to improve theefficiency and quality with which education data are processed, programs are supervised,monitoring is improved, rules and procedures are enforced, and curricula and learning materialsare developed and disseminated.

18
3.6 Pre-Service Teachers' Training. The existing basic education teacher pre-servicetraining program has been criticized for its overly academic focus, and for its lack of articulationwith the school curricula and the instructional needs of students. The FCUBE program willsupport the redesign of the pre-service training programs, emphasizing hands-on trainingactivities in schools and increasing the amount of time in practical teaching prior to certification.Access courses will be given to teacher trainees from deprived districts who may not have therequisite minimum entry qualifications. Links between the schools and teacher educationinstitutions or qualified teacher educators of these institutions will be strengthened. As much aspossible, trainees belonging to a district will be selected for training and contracted to stay in thatdistrict for a minimum specified period on completion of their course. Local communities anddistrict education offices will be asked to sponsor trainers, so that teacher development will bedemand-driven instead of being supply-driven as is currently the case. A study will be carriedout on the 38 TTCs, to define the specific roles to be played by each institution in the redesignedpre-service training program, and to identify those which require rehabilitation (in conjunctionwith support to be provided by KfW) and others which may be closed or merged. Linkages withthe University College of Education at Winneba (UCEW) and Cape Coast University will beexplored to maximize support for the training programs. Over the longer term, FCUBE will alsosupport studies on alternative delivery mechanisms and evaluation of the impact of the trainingprograms.
3.7 Assessment and Evaluation of Student Performance. Criterion-referenced testing ofthe performnance of Ghanaian students currently enrolled in basic education has given tangibleevidence to the ineffectiveness of the system (para. 2.16). To help ensure that curricula andteaching tools are used properly, a comprehensive set of evaluation mechanisms will bedeveloped and put in place. The monitoring scheme will measure both student mastery ofmaterial as well as limitations in the teachers' abilities to implement the new curricula. Resultswill be employed in the on-going process of curricula improvement, and in the training ofteachers. Emphasis will also be placed on enhancing the supervisory capacity of districteducation officers to monitor the instructional process more effectively and to interpret theresults of both continuous assessment outcomes and standardized tests. Greater emphasis will beplaced on the development of strategies to facilitate remedial instruction in the classrooms forthose students in need of supplementary help.
3.8 Provision of Instructional Materials. The lack of instructional materials has beenidentified as a crucial factor which affects the effectiveness of teachers' delivery in classroomsand hence the poor performance of pupils (para. 2.17). The FCUBE program will support theprovision of textbooks, teachers' handbooks, syllabi, and library books to schools. Initially,existing textbooks will be reprinted and distributed to schools, after making provision foradequate school storage facilities. Subsequently, new textbooks will be produced following therevision of the curriculum (see para. 3.9 below). MOE policy currently undertakes to providetextbooks (assuming a book life of three years) for all core subjects (6 subjects for BE 1-6 and 10subjects for BE 7-9) at a 1:1 book/pupil ratio. Textbooks will be provided free to all pupils inBE 1-6, while pupils in BE 7-9 will continue to be charged a user fee. This policy will incur avery significant charge against the total incremental resources of the FCUBE program. The MOEis unlikely to be able to sustain such a flow without substantial assistance from other sources.MOE will undertake a study on the options for the sustainable provision of learning materials,taking into consideration the level of available financing, the potential for private sectorcontribution, the printing (whether local or foreign) and distribution capacity, the storagefacilities in schools, and the systems for encouraging and monitoring the actual use of materials

19
in schools. This study is expected to be completed prior to the first government/donor review(January/February 1997) of the three-year rolling plan for the FCUBE program, to provide thebasis for appropriate modifications to the implementation plan. The provision of library bookswill also be included in this study.
3.9 Curriculum Review and Development. The first major task of this sub-component isto review the existing materials available in the classroom for BE 1-9 pupils and teachers, interms of their value as learning tools in delivering the syllabus for each subject. New textbookswill then be prepared and tested in a sample of schools in various regions in the country. In themeantime syllabi will be drafted for the new subjects, including environmental studies for BE 1-3, integrated science for BE 4-6, pre-technical skills for BE 7-9, and religious and moraleducation for BE 1-9. Course material for Ghanaian languages will also need to be developed.Subject panels involving outside specialists will be set up to review the syllabus for each subjectand revise/write the textbooks. The FCUBE program will support these activities and helpstrengthen the Curriculum Research and Development Division (CRDD) in the GES to carry outits functions.
Component 2: Management for Efficiency
3.10 The over-arching objectives for this component are to improve the efficiency of the GESand to enhance its effectiveness in implementing the FCUBE program. In particular, the aim isto strengthen the management of human and financial resources at the district level in order toaddress the needs and aspirations of communities, parents and children. The design of thecomponent recognizes the public sector reform imperatives of the NIRP as well as theimplications of the Local Government Act of 1993 in the process of transferring to the districtsincreasing responsibility and authority over basic education.
3.11 This component will support the decentralization of responsibility and operationaldecision making within the existing institutional framework of MOE/GES. It will helpstrengthen managerial capacity to enable the District Education Offices (DEOs) of GES to usetheir increasing autonomy responsibly by having qualified managers, relevant skills andimproved information, personnel and financial management systems. The plan is to focus uponearly results in terms of management strengthening (especially at the district and school levels),and to avoid undue disruption. In the longer term, this approach will facilitate the gradualdevolution of responsibility and authority to the District Assemblies as capacity is strengthenedand the appropriate legal instruments are enacted. To help achieve these outcomes, theManagement for Efficiency Component of the FCUBE program is composed of five sub-components, as outlined below.
3.12 Building Capacity for Institutional/Organizational Analysis and Change. This sub-component will aim at helping to develop the internal capacity to lead and manage change on acontinuous basis, to ensure that managers, supervisors and headteachers are effective in carryingout their new responsibilities in a decentralized system, and to enable communities to participatein the management of schools. The following activities will be undertaken to help achieve theseobjectives. First, an organization structure for the MOE/GES will be devised, specifying clearlythe relationships with external bodies, opportunities for contracting activities to the privatesector, new management accountabilities at all levels as well as the scope of delegated decisionmaking. The MOE/GES will develop legal or other normative mechanisms as appropriate tofacilitate cooperation between GES and District Assemblies in order that FCUBE objectives are

20
achieved. Second, a human resource plan will be developed, specifying recruitment, transfer,promotion and redundancy actions to meet the staffing requirements of the revised organizationstructure. The plan will draw extensively on the results of a personnel audit of the numbers andskills of existing staff which will update and extend the personnel database of the IPPD system.Third. to help strengthen the agents and sponsors of change, orientation and training will beconducted for both the technical staff of the nearly established FCUBE Secretariat and acarefully identified core group of senior managers who will be appointed to positions ofresponsibility and influence in the new organization structure. At the same time, commitment tothe revised organization design throughout the MOE/GES will be built up through a "cascading"approach to staff consultations and briefings. Fourth, managers, supervisors and headteachersthroughout the system will be trained to exercise their new managerial roles and responsibilitiesunder decentralization, focusing on interpersonal, supervisory, planning and client consultationskills. The training strategy will emphasize in-country programs specifically designed for theGES and coaching skills for both managers and supervisors to enable them to help solve jobproblems faced by their staff. The overall program design will be based upon a prior trainingneeds analysis. Circuit supervisors will be specifically targeted so that they are able to train thelarge number of headteachers at the circuit level. Fifth, viable SMCs will be established byinitiating a dialogue with community leaders, clarifying their roles in relation to existing PTAs,and subsequently providing them with support through both the DEOs and the District EducationOversight Committees (DEOCs) which are in the process of being established. Finally, regularimplementation reviews of improved management structures and systems, focusing on theDEOs, will be conducted by regional teams and supported by community representatives fromthe District Assemblies and DEOCs. The FCUBE Secretariat will be responsible for conductingreviews at the Headquarters and Regional levels.
3.13 Staffing and Personnel Management. This sub-component will help to achieve amore efficient and equitable distribution of staff and teachers, strengthen personnel proceduresfor a decentralized system and design more appropriate salary structures and incentive schemes.It will include the following activities. First, clear and transparent procedures will be formulatedfor the appointment and deployment of managers, supervisors and headteachers on the basis ofproven competence and identified potential in accordance with the manpower plan. Personnelmanagers and officers will be trained in counseling skills in order to support and advise affectedstaff during this difficult period. The IPPD personnel information system will be reviewed andstrengthened to ensure all staff movements are carried out efficiently and accurately. Second, thejob grade structure within the MOE/GES will be reviewed and revised to reflect new jobcontents and skills within the revised organization structure for MOE/GES and to provide formore appropriate salary differentials. This exercise recognizes Government's emerging publicsector incomes policy which aims to "de-link" the salaries of different bargaining groups. Inaddition, an employee motivation strategy will be developed which emphasizes non-financial aswell as financial incentives and provides discretion for district education offices to designlocally-based schemes. Third, personnel policies and procedures for recruitment, promotions,transfers and discipline will be revised to make them relevant to decentralized personnelmanagement in the DEOs. Special emphasis will be placed upon the development of a revisedcode of professional conduct to support strengthened disciplinary procedures to give linemanagers clear responsibility for initiating disciplinary action.
3.14 Performance Management. This sub-component will help design and implement aneducation management information system (EMIS), and will introduce a performance appraisalsystem which involves objective setting, regular performance review and corrective action. The
21
EMIS will be designed to support policy analysis and planning, the management review process,and the monitoring of FCUBE program targets and standards. The design of the EMIS will buildupon the existing statistical system and the skills available in the MOE/GES, and will be closelycoordinated with other systems being used or to be developed in the context of the NIRP/CSPIP.In addition, a school mapping exercise will be conducted to promote micro-planning. At thesame time, an improved performance appraisal system will be developed which links individualperformance to work unit objectives. This system will form the basis for establishing contractualor other relationships with District Assemblies to ensure FCUBE goals are achieved in thedecentralization process. Mechanisms appropriate to a decentralized education system will beestablished for monitoring, emphasizing performance indicators and management reports, withclearly defined standards for different levels of management and procedures for the periodicreview of work programs and implementation plans. Financing for consultancy services for thedesign and development of an EMIS will be financed under the ongoing PSDP. Duringnegotiations agreement was reached on a time-bound action plan for the operationalization of theEMIS.
3.15 Budgeting and Financial Management. The objectives of this sub-component are toensure that MOE/GES budgets at all levels are prepared consistently in accordance with theFCUBE program structure and established budget guidelines, to enable the MOE/GES to accountfor its revenue from whatever source and expenditure on any item/activity in accordance withestablished accounting standards, and to produce periodic financial management reports whichcan be related to program outputs and outcomes from the EMIS. The current MOE/GESbudgeting and accounting system will be reviewed and an improved system will be designed toprovide relevant and timely management information. An agreed resource allocation formulawill be developed to facilitate the delegation of budgets to the district level by the end of 1997.These activities will be closely coordinated with other ongoing central initiatives to strengthenthe public accounting systems, including the Government's PUFMARP and the Bank'ssupporting FIMTAP operation.
3.16 District Capacity Building. This sub-component will focus on strengthening thecapacity of DEOs and District Assemblies in planning and managing basic education, taking intoconsideration the overall progress towards decentralization in the country. It will help developmechanisms for the GES, in association with other arms of the Government, to provide technicalassistance to District Assemblies. The performance of those Assemblies specifically targeted fortechnical assistance will be closely monitored, in particular in terms of the functioning of theirSocial Services Sub-committees and their use of Common Fund resources for educationalpurposes. MOE will progressively delegate financial management discretion to districts havingviable education plans and administrative systems.
3.17 To help develop and strengthen capacity for the implementation of this component,international ar,d local consultants will work closely with MOE/GES staff in specific activities.A technical advisor with expertise in organization change will be engaged to help develop localcapacity and facilitate overall implementation of the component. In addition, consulting serviceswill be contracted to assist in the review and design of the personnel management system, theEMIS, the performance appraisal system, as well as the budgeting and financial managementsystem. Consultancy firms which can access local expertise will be engaged to conduct thetechnical work and to develop skills within GES to operate the improved systems andprocedures. Appropriate training programs will be designed and conducted for relevant staff.Computer systems and equipment will be procured and installed as necessary.

22
Component 3. Improving Access and Participation
3.18 The overall objectives of this component are to promote wider coverage of the basiceducation system through quantitative and qualitative improvements to school facilities andthrough direct involvement of communities and parents in activities that will help improve theenvironment for teaching and learning in their schools. Efforts will be targeted in particular topromoting access for girls, the poor and for disadvantaged children in rural areas. Thecomponent will build on the experience gained in previous projects and pilot activities in Ghanaand elsewhere.
3.19 Infrastructure Development. Achieving the twin objectives of increased access andimproved quality will necessitate both a quantitative expansion of and qualitative improvementin basic education facilities and support infrastructure. MOE will take stock of progress madeover recent years and rationalize the use of existing resources to maximize their effectiveness.Some urban schools may need to adjust to double-shifts. At the same time, it will continue torehabilitate dilapidated classrooms and support construction of new school facilities includingclassroom buildings and teachers' housing, based on relative need and demonstrated demand.Initially decisions on school location and the type of facilities to be rehabilitated or built will bebased on data currently available from the school census, which will be verified through fieldvisits. Subsequently as data on schools and catchment population become available through theEMIS and school mapping exercise (para. 3.14), MOE will prepare a phased implementationplan for infrastructure rehabilitation and construction, based on selection criteria as shown in theImplementation Manual and to be reviewed annually by MOE, district/community stakeholdersand participating donors. Indicators on poverty and girls' participation will be given primeconsideration in determining the selection criteria.
3.20 School Facilities Planning and Maintenance. With the aid of architectural engineeringfirms, MOE will review and revise as necessary the existing norms and standard designs forschool facilities to enhance the opportunity for learning and to allow flexibility (e.g. multi-gradeschools, addition of classrooms). The profile of school facilities (classrooms, libraries,workshops, girls' boarding facilities) will be based, to the extent possible, on a commonstructural module, possibly an adaptation of the three classroom pavilion currently used inbuilding new primary schools, to allow for flexibility in facilities utilization and efficiency (costand time) in construction. General guidelines will be developed to ensure proper location ofancillary facilities on the school site, as well as to provide for future expansion. School sites willbe inspected and surveyed in advance to assess suitability (access, terrain, soil conditions, wateravailability, and other critical factors) and cost for site improvements. Facilities maintenancewill be budgeted at 1.5 percent of capital costs annually; and resources (in cash or kind) willhave to be made available. In collaboration with communities and districts, MOE will preparedraft facilities maintenance policy and operational guidelines (types of maintenance, financialresponsibilities, modalities of execution).
3.21 Increasing Girls' Participation. The FCUBE program seeks to enhance girls'education through targeted interventions. Several initiatives will be undertaken at the outset.First, a pilot study using participatory learning assessment (PLA) techniques will be conductedin selected districts to identify the constraints to girls' participation in schools and developeffective programs to remove such constraints. Secondly, gender experts will review the currentcurriculum and existing textbooks to ensure gender sensitivity in content and illustrations, andwill continue to be involved in all phases of curriculum development. Field tests of new

23
materials will be analyzed by gender as well as other criteria. Thirdly, a study on scholarshipprograms will be undertaken to assess the impact of award/scholarship schemes that have beenimplemented in Ghana and in similar situations, and to recommend an action plan for providingvarious forms of financial assistance to encourage girls (and possibly other low participationgroups) to attend school. Fourthly, plans will be developed to promote science and mathematicseducation for girls, taking into consideration the Science, Technology and MathematicsEducation (STME) Program and adapting it to the basic level. Pending the outcome of theseefforts, a long term strategy for enhancing girls' participation in education will be formulated,together with implementation plans for various forms of interventions. At the same time pre-service and in-service training will seek to raise awareness in teachers of gender issues, andefforts will be made to recruit more female teachers into the profession. Districts will be askedto identify qualified female candidates for service in their localities, and special trainingprograms will be organized for such candidates in remote areas to help them attain the necessaryminimum skill levels.
3.22 Fostering Community Involvement. MOE recognizes the importance of communityand parental involvement in schooling in improving the teaching and learning environment.Communities have an important role to play in enforcing standards, developing and maintainingschool property, and providing support and encouragement to headteachers, teachers andstudents. The ultimate goal is to develop community ownership, pride and sense ofresponsibility for schools. MOE will promote community involvement in education bystrengthening SMCs, devising mechanisms for consultation with DEOCs to ensure the equitableallocation of resources across basic education, and establishing a system for stakeholderconsultation to provide feedback on progress towards program goals. Much of these efforts willbe undertaken as part of improving management efficiency under Component 2. Specialprograms to foster community involvement will be initiated under this Component, including aSchooling Improvement Fund (SIF) and an Information, Education and Communication (IEC)campaign.
3.23 Schooling Improvement Fund (SIF). In order to bring quality improvements toschooling on a broad basis, MOE realizes that further efforts are needed to motivate communitiesto become more involved in the delivery of education and take initiatives to manage andcontribute to school activities. The SIF is a flexible approach aimed at responding adequatelyand promptly to the specific needs of particular school communities and encouraging initiativesto improve the quality of teaching and learning. Instead of making uniform provision for allschools throughout the country, the SIF will support specific requests from local communitiesthemselves. In this way communities will be involved in modest development projects from thebeginning, and therefore are likely to feel ownership of these projects and be committed tosustaining them. A SIF pilot scheme will begin initially in three districts in 1996 under theongoing PSDP, based on the SIF Operational Manual discussed and agreed with IDA. TheManual provides detailed guidelines for the selection criteria for school-based projects, theceiling for funding such projects, the procedures for project preparation, appraisal, approval andimplementation, as well as the draft terms of reference for NGO(s) to facilitate theimplementation of the pilot scheme. District Assemblies will be empowered to appraise andapprove funding requests from the schools. NGOs will be used to facilitate the process and tobuild local capacity for project design, preparation, appraisal, and implementation. Based on theexperience of the pilot to be evaluated in mid-1997, the SIF will be gradually expanded to anincreasing number of districts. Depending on the pace at which districts and communities areable to develop their capacity to manage the process and implement the school-based projects,

24
the size of the SIF is estimated to increase from $325,000 in 1996 to possibly US$1 million in1997 under the PSDP, and may further increase under BESIC. There are similaries in approachbetween the SIF scheme and the school-based activities supported by ODA, USAID andUNICEF (para. 2.50 and 3.3), and it would be useful to explore the lessons that could be learnedfrom each of these programs.
3.24 Information, Education and Communication (IEC). Much more effort needs to bemade to raise awareness among communities of the need for them to be involved, and for theirchildren to take part, in basic education. In particular, it is necessary to promote understandingof the social and economic benefits of educating girls and to persuade people of the intrinsicworth of basic education, independent of economic returns. MOE will work withcommunications specialists and NGOs to develop an IEC strategy and prepare a plan forimplementation. The plan will identify the specific issues that need to be addressed, the attitudesand behaviors that need to be changed, the target groups most crucial to effecting such changes,the essential messages that need to be conveyed to particular groups, the most effective means ofdelivering these messages, the relative timing of each activity, and the costs. The plan will alsoinclude mechanisms for monitoring and evaluating the impact of the activities so that appropriateand timely adjustments can be made to the IEC strategy and its implementation.
C. PROGRAM COSTS AND FINANCING
Program Costs
3.25 The Government has declared that FCUBE is Ghana's only basic education program. Allongoing and planned activities in basic education, whether financed solely from thegovernment's own resources or with the assistance of donors, will be coordinated under theFCUBE program. Adherence to a common Operational Rolling Plan by the various supportingagencies is thus ensured.
3.26 The total cost of the first phase of the FCUBE program (1996-2000) is currentlyestimated to be about US$1.35 billion. This includes all recurrent and development costs atcentral, regional, district, circuit, school and household levels, except the direct costs of privatelyprovided schooling. A summary of the total program costs is shown in Table 3-1 below. Themajor activities under the three components of the FCUBE program (as described in para. 3.2-3.24), which will be called "Betterment Activities", are estimated to cost about US$241.6million, or 18 percent of the total cost of the program. Other costs of the basic education sectorover the first phase of the FCUBE program, including the projected costs of administration,teachers' salaries, school operation and maintenance, as well as household spending and ongoingdonor-supported projects, are estimated to be about US$1.1 billion, or 82 percent of the totalcost. The overall costs of the FCUBE program will be reviewed annually as part of the jointMOE/donor review of the FCUBE implementation plan, and will be adjusted by the MOE asappropriate.
3.27 Of the current estimates of the total costs of the "Betterment Activities", Component I(Enhanced Quality of Teaching and Learning) will absorb about 59 percent, Component 2(Management for Efficiency) about 13 percent, and Component 3 (Improving Access andParticipation) about 28 percent. The composition of the costs of these three components aresummarized in Table 3-2 below.

25
Table 3-1. FCUBE Program (First Phase) 1996-2000Total Program Costs
(US$ million including contingencies)
Component 1996 1997 1998 1999 2000 TotalBetterment Activities 1. Enhanced Quality of Teaching/Learning 14.0 36.9 36.2 22.4 31.9 141.42. Management for Efficiency 1.5 10.4 9.5 7.0 3.9 32.43. Improving Access and Participation 0.7 4.8 13.3 21.0 28.0 67.8
Subtotal 16.2 52.1 59.0 50.4 63.9 241.6Other Basic Education Sector Costs I1. Administration and Support 15.4 15.9 16.4 16.9 17.5 82.12. Teachers' Salaries 127.4 134.2 141.1 147.7 154.4 704.83. School Operation and Maintenance Cost 5.5 6.4 7.3 8.5 9.9 37.7P. Private (Household) Spending 44.9 46.9 49.1 51.6 54.4 247.1
5. Ongoing Donor-Supported Activities 27.2 9.8 0.3 0.3 0.3 37.9
Subtotal 220.4 213.2 214.2 225.1 236.5 1109.6Total Program Costs 236.6 265.3 273.2 275.5 300.5 1351.2
Source: MOE and Bank staff estimates.
3.28 The bulk of other basic education sector costs consists of teachers' salaries, estimated atabout 82 percent of total other costs. Administration and support takes up about 7 percent andschool operation and maintenance about 3 percent, while private (household) spending oneducation is about 22 percent, and ongoing donor-supported projects in basic education 3.5percent. Administrative costs. including both salary and non-salary items, will be limited to afixed proportion of teachers' salaries over the FCUBE program period, with increased spendingat the school level. The share of the total wage bill in total program costs is estimated to averagearound 50 percent over the program period. absorbing almost 84 percent of the annual MOEbudget. The average salary for basic education teachers is estimated to increase in real terms bytwo percent annually, allowing for relocation and severance payouts and for incentives tomotivate teachers to improve their performance. Household contributions will continue to payfor day-to-day outlays on transportation, meals, uniform, stationery and the like, as well asaugment district capacity in the provision and maintenance of school facilities.
3.29 Ongoing donor-supported projects in basic education include IDA's PSDP (Cr. 2508-GH), USAID's PREP, and other activities supported by ODA and UNICEF. These operationswill continue under their original design or are being restructured to fit in with the overallFCUBE program as appropriate.

26
Table 3-2. FCUBE Program 1996-2000Total Costs of Betterment Activities
Local and Foreign Costs by Component(US$ million)
Component Local Foreign Total % Foreign1. Enhanced Quality of Teaching/Learning
(a) In-Service Training of Education Personnel 7.7 2.1 9.8 21.0%(b) Pre-Service Teachers' Training 12.6 14.0 26.7 52.3%(c) Assessment/Evaluation of Student Performance 0.7 0.9 1.5 55.9%(d) Provision of Instructional Materials 38.7 47.7 86.5 55.2%(e) Curriculum Review and Development 0.5 0.4 0.9 46.1%
Subtotal 60.3 65.0 125.4 51.9%2. Management for Efficiency
(a) Institutional/Organizational Analysis & Change 12.4 3.5 15.9 21.9%(b) Staffing and Personnel Management 4.3 1.7 6.1 28.3%(c) Performance Management 1.1 3.2 4.2 74.7%(d) Budgeting and Financial Management 0.4 0.6 0.9 60.3%(e) District Capacity Building 1.4 0.4 1.8 20.0%
Subtotal 19.6 9.3 28.8 32.1%Improving Access and Participation(a) Infrastructure Development and Maintenance 22.8 22.1 44.9 49.2%(b) Increasing Girls' Participation 1.8 0.5 2.3 20.0%(c) Schooling Improvement Fund (SIF) 8.9 2.6 11.4 22.5% l(d) Information, Educ and Communication (IEC) 0.2 0.0 0.2 20.0%
Subtotal 33.7 25.2 58.8 42.8%Total Base Costs 113.6 99.5 213.0 46.7%Price Contingencies 8.6 7.5 16.2Physical Contingencies 6.6 5.8 12.4Total Costs of Betterment Activities 128.8 112.8 241.6 46.7%
Source: MOE and Bank staff estimates.
Program Financing
3.30 During negotiations, agreement was reached with the Government on the proposedsector financing plan for the first phase of FCUBE (1996-2000), as shown in Table 3-3. TheGovernment of Ghana (MOE and Districts) will be the largest financial contributor (about 64percent of total program costs) to the provision of basic education, both in recurrent anddevelopment activities. Contribution from the Government and communities (togetheraccounting for 83 percent of total program costs) will pay for the costs of teachers' salaries andadministration and an increasing share of non-salary recurrent costs. It will also bear anincreasing share of the sector's capital costs through budgetary transfers to the DACF.Government and community financing capacity over the period 1996-2000 is estimated to be

27
about US$1.1 billion. This implies a total financing need of about US$230 million for theperiod, to be met by contributions from a number of donor agencies which have indicatedinterest in the program. About US$54 million will be met by resources already available underongoing donor-supported projects, including US$1.5 million recently committed by theUNICEF. Additional financing will be provided by IDA under the BESIC (US$50 million),ODA(UK) (US$23 million equivalent), USAID (US$53 million) and KfW/GTZ (US$25 millionequivalent). It is expected that other donors (including the European Union, Japan, Norway andthe African Development Bank) will come on stream to fill the gap of about US$25 million.
3.31 Donor support. Donor agencies which have been active participants in the preparationstage of this program have expressed interest in supporting its implementation. USAID isconsidering continuing its support for primary education through the provision of assistancetargeted at pupil performance and school management improvement in a designated number ofschools. KfW/GTZ (Germany) are preparing to assist in the rehabilitation of TTCs and possiblyother aspects of institutional support. This will complement ODA (U.K.)'s long-standinginterest in the professional training and continuing education of teachers, which it proposes tocontinue with increasing focus on school-based training. UNICEF's experience in community-based education activities will also continue, along with its programmed support forstrengthening policy and planning, rural girls' access to education and early childhooddevelopment. Norway is interested in contributing to gender equity initiatives. The EuropeanUnion (EU) has been providing some 50 percent of MOE's non-salary recurrent budget on amatching basis. This will continue through 1996, after which EU will consider an appropriateform of future support. The Governments of Japan and Norway, and the African DevelopmentBank are among other external donor agencies likely to commit their support based on thecommon framework for FCUBE.
3.32 Activities Financed by the Proposed IDA Credit (BESIC). The proposed IDA Creditof US$50.0 million equivalent will support in-service training of educational personnel,provision of instructional materials to schools, training and workshops for MOE/GES, DEOs andSMCs to improve efficiency in management, rehabilitation and construction of school facilitiesto improve access and the teaching/learning environment, and initiatives to encourage girls'participation and community involvement in education and schooling activities. The level ofIDA financing of specific items and activities will be reviewed annually as part of thegovernment/donor review process (para. 4.13).
Program sustainability
3.33 Recurrent Cost Implications. Implementing FCUBE will have an impact both on theongoing and betterment activities. Preliminary estimates suggest that, except for an increasingdemand for the supply of instructional materials, the costs of continuing the betterment activitiesof the FCUBE program in the second phase (2001-2005) will be significantly lowes, about 40percent of the costs during the first phase. The average rate of growth of teachers' wage bill isprojected to be slightly lowered -- from 4.9 percent in the first phase to 4.7 percent in the secondphase. MOE will regularly monitor the recurrent cost implications during programimplementation. The simulation model developed for the FCUBE will be used to analyzedifferent scenarios to cope with any deviations from the base scenario. Adjustments will bemade if necessary to the composition and structure of the program in the annual jointdonor/MOE reviews, based on agreed performance indicators.

28
Table 3-3. FCUBE Program 1996-2000Financing Plan(US$ million)
1996 1997 1998 1999 2000 Total
FCUBE Program Costs1. Betterment Activities 16.2 52.1 59.0 50.4 63.9 241.62 Other Basic Education Sector Costs 220.4 213.2 214.2 225.1 236.5 1109.6
Total FCUBE Program Costs 236.6 265.3 273.2 275.5 300.5 1351.2|Sources of Financing1. Ghana
(a) MOE 151.4 158.9 166.9 175.2 184.0 836.4(b) District 5.5 6.4 7.3 8.5 9.9 37.7(c) Community/Parents 44.9 46.9 49.1 51.6 54.4 246.9
Subtotal 201.8 212.2 223.3 235.3 248.3 1120.92 Ongoing Donor Financing
(a) IDA (PSDP) - 23.0 18.0 5.0 46.0(b) USAID (PREP) 5.0 5.0(c) ODA 1.5 1.5|(d) Unicef 0.3 0.3 0.3 0.3 0.3 1.5
Subtotal 29.8 18.3 5.3 0.3 0.3 54.03. Proposed Donor Financing
(a) IDA (BESIC) 9.8 11.3 14.1 14.7 50.0(b) ODA (UK) 5.0 8.0 8.0 2.0 23.0(c) USAID 10.0 13.0 15.0 15.0 53.0(d) Germany (KfW/GTZ) 5.0 10.0 10.0 25.0(e) Others (to be determined)
Subtotal 5.0 34.8 42.3 37.1 31.7 151.0Total Financing 236.6 265.3 270.9 272.7 280.3 1325.91
Financing Gap - 0.0 0.0 -2.3 -2.8 -20.1 -25.3
Source: MOE and Bank staff estimates.-Reflecting the undisbursed balance as of January 1, 1996, of which about US$20 million will support some of
the "Betterment Activities' of the FCUBE program consistent with the objectives of the PSDP project, and therest will continue to support ongoing activities in basic education.
L The European Union, Japan and Norway are expected to support the program and contribute to fill the gap.
3.34 The Government's commitment to FCUBE is solid. In its Letter of Basic EducationSector Development Policy, the Government states that it will sustain the current budgetarycommitment to the basic education sector and increase non-salary recurrent outlays annually byan agreed percent in real terms for the duration of FCUBE. The Letter also affirms thatMOE/GES has the authority to deploy personnel and financial resources within the educationsector, and is fully accountable for the proper management of these resources. To gain nationalconsensus and support, MOE/GES has been, and will continue, consulting with parliamentarymembers, other ministries (in particular MOF, MLGRD and OHCS), regional and district GESstaff, district authorities, and school and community representatives.

29
3.35 The FCUBE program is based on the understanding that quality improvement is essentialto obtain parental support and hence enrollment growth. In turn, community participation willcontribute to the improvement of teaching/learning outcomes.
3.36 Financial Sustainability. The program is designed to attain its objectives within theagreed financial framework, which requires the government to maintain its present level of fiscalcommitment to basic education. Quality basic education needs minimum essential inputs to bein place at the school level. As for the subsectoral salary envelope, MOE's budget allocationneeds to allow for a modest pace of growth to accommodate system expansion and rewards forexcellent performance while at the same time ensuring that the share of spending on non-salaryitems increases over time. The Government's policy decision to increase non-salary expenditureby 10 percent annually in real terms will make the budget structure more robust and efficient incontributing to the improved service. The share of teacher salary expenditure within the MOErecurrent budget will gradually decline over the program period, keeping the compound effect ofannual increase in the number of teachers and their average salary below the projected pace ofannual MOE budget increases (see Annex 3-4).
3.37 For capital spending - the responsibility principally of district authorities - an increasedtransfer of funds from the central government will be essential, especially for those districts withseverely limited resource mobilizing capacity. The DACF, for which the Government ismandated to secure 5 percent of national tax revenues, is the only central transfer for mostdistricts. If the financing gap for capital expenditure is to narrow appreciably, spending on basiceducation infrastructure will need to increase annually by 20 percent on average in real terms.This implies that by the year 2005, average DACF spending on basic education will need toreach 40 percent.
4. PROGRAM IMPLEMENTATION
A. PROGRAM PREPARATION
4.1 MOE-Coordinated Preparation. A joint MOE-donor forum was set up in August 1994to facilitate preparation of a sector-wide program to support the FCUBE objectives within a ten-year time frame. USAID, ODA, EU, UNICEF and the Bank have been active members of theforum. KfW/GTZ and JICA are also keenly interested in the sector. Sector analyses werecarried out jointly by government and donor teams. The key issues were discussed in a series ofworkshops involving staff in relevant departments of the MOE, specialists from Ghanaianuniversities and research institutions, as well as representatives from donor agencies. The resultsof the analytical work and discussions have been incorporated into the FCUBE programdocuments prepared by the MOE. It has been agreed among MOE and donors that the FCUBEprogram will cover the entire basic education (primary and junior secondary) subsector and willinclude all ongoing and planned activities. The program will be implemented within a strategicframework and an operational rolling plan. All support for basic education must be offeredwithin these parameters. BESIC will be IDA's contribution to FCUBE for the four year period1997-2000.
30
4.2 Participatory Approach. Local stakeholders and beneficiaries will take the lead in theimplementation of FCUBE, while donors will provide technical support and financial assistance.A sense of local ownership and commitment to the program will continue to be ensured throughsystematic client consultation and consensus building, and through specific program activitiesdesigned to encourage active community participation in education and school management.
B. PROGRAM MANAGEMENT AND COORDINATION
4.3 Since the FCUBE is a sector-wide program for basic education, implementation willrepresent a major part of the regular work of the MOE/GES over the next 10 years, and willrequire the active involvement of all operational and support divisions within MOE/GES.Program management and implementation responsibility, therefore, will be vested in themainstream management structures of the MOE/GES. The Minister and top management ofMOE/GES will be ultimately responsible for the achievement of the goals of the FCUBEprogram, and will draw upon the expertise of a Senior Management Team comprised of heads ofdivisions. This management team will review progress against key indicators annually, reviewand approve the annual program at the beginning of each year and monitor progress quarterly.The Special Assistant to the Minister on FCUBE will facilitate the transition from a conventional"project" model to the "integrated sector program" approach described in paragraphs 4.4 - 4.6below.
4.4 The governance for the program will be provided by an Implementation OverviewCommittee (IOC) which will be answerable to the Minister of Education and on which majorstakeholders will be represented. The IOC will meet regularly to coordinate the various reformand decentralization initiatives, both within the education sector and in the broader public sector.The IOC, comprising members drawn from the MOE/GES Management, MOF, MLGRD, NIRP,CSPIP and GNAT, will be set up prior to Board presentation. A Consultative Panel, chaired bythe Minister of Education and consisting of selected members of the IOC and participating donorrepresentatives, will review past and proposed uses of resources under the FCUBE program. ThePanel will meet on a six-monthly basis, with a July/August meeting constituting the major annualreview.
4.5 Day-to-day administration of each component of the FCUBE program will require thecontribution of functional specialists (e.g. in training, curriculum, personnel, logistics) drawnfrom different divisions and units of the GES. Special organization and managementarrangements will be introduced to ensure that program activities are well coordinated. With thisin view, the MOE has already appointed a Deputy Director-General of the GES as the FCUBECoordinator. His overall role will be to coordinate the work of functional specialists around theneeds of individual components and to participate in the quarterly program reviews conducted bythe Senior Management Team. The Coordinator will have the authority to review annualcomponent and sub-component work plans, to operate systems of control, to convene monthlyprogress review meetings and to negotiate changes in staffing, schedules and work plans asnecessary. The staff involved in implementation would be identified by their managers to workon specific program activities. Nonetheless, they would retain allegiance to their mainstreamdivision which would retain authority for their professional development, promotion, disciplineand appraisal of technical competence. This arrangement will enable the Coordinator to usefully the technical capacity of existing GES divisions and units. The outline management

31
structure for the FCUBE program which reflects these organizing principles is set out in Annex7.
4.6 Because of the complexity and size of the program, the Coordinator will be supported bya core group of staff in the FCUBE Secretariat. The initial composition and staffing of theFCUBE Secretariat was discussed during negotiations and staff appointments are expected to bemade within the next few months.
4.7 Under these strengthened management arrangements, the Project Management Unit(PMU) will provide technical services in procurement, accounting and disbursement, especiallyas these relate to the "banking business" relations with IDA and other donors. In line with thisrevised role, a joint Government/donor review of the staffing in the PMU will be undertaken, toensure that adequate technical support will be provided to the management of the FCUBEprogram at both the headquarters and district levels.
4.8 The FCUBE program will provide the overall basis for the coordination of donor activityand support for basic education. Since the FCUBE Secretariat has the full knowledge of FCUBEcomponent and sub-component plans and their associated resource requirements, it will also bethe focal point for mobilizing donor support. The Coordinator and his staff will, with supportfrom the Special Assistant to the Minister on FCUBE, liaise with donors on new funding to meetidentified resource gaps as well as provide regular reports on ongoing support. These reportswould contain information on procurement status and financial disbursement generated by thereconstituted PMU.
4.9 District Directors of Education will remain answerable directly to the GES Director-General for the achievement of identified program indicators which relate to FCUBE. Asdecentralization proceeds, the DEOs will be strengthened to carry out their assignedresponsibilities for supervising schools, providing support to in-service teacher education andassessing pupil-teacher performance. Since these responsibilities constitute core activities in theFCUBE program, they will also need to be programmed in accordance with its objectives andpriorities. Accordingly, District Directors of Education will set objectives and prepare detailedannual plans and budgets, which will be reviewed by the Regional Education Offices acting onbehalf of the headquarters of the GES. They will also need to coordinate this work with theDistrict Assemblies, which are legally mandated to oversee all schools within their jurisdiction.Headteachers and SMCs will be consulted on their priorities during plan and budget preparationat the district level.
C. PROGRAM MONITORING, REPORTING AND SUPERVISION
4.10 Since the FCUBE is a sector program for which the mainstream MOE/GES isresponsible, the monitoring and reporting arrangements for donors and other key stakeholderswill be a subset of those which the MOE/GES requires for its internal management purposes.Monitoring will examine achievement and progress in relation to the identified program successindicators, component and sub-component performance indicators, and activity plans whichwould be made publicly available. It would, therefore, take place at a number of differentmanagement levels from headquarters to the school level. For instance, SMCs would beinvolved in monitoring teacher/pupil attendance and school achievement.

32
4.11 Under the management component, strengthened procedures for reviewingdivisional/unit work plans would be developed and improved management information systemsintroduced to support the monitoring requirements at all levels of management. In addition, theintroduction of more efficient management structures will ensure that relevant information istransmitted directly from district to headquarters level.
4.12 A regular program planning and monitoring cycle would be established for FCUBElinked to the Government's budget preparation process as well as plans for the rest of theeducation sector. During the year, those organizational units and individuals assignedresponsibility for implementing specific FCUBE sub-components and activities (e.g. in-servicetraining, classroom construction, staff redeployment) would submit regular progress reports tothe FCUBE Secretariat. As appropriate, these reports would also include information on district-based activities. The FCUBE Coordinator and his staff will take into account the implications ofthese reports in updating the implementation plans. These report updates would, therefore,provide the basis for senior management's review of implementation progress against keyperformance indicators in the Operational Plan. The decisions taken at this review would beused as a basis for preparation of materials for reviews by the Consultative Panel (para. 4.4).
4.13 During negotiations, it was agreed that there would be semi-annual review meetingsconvened by the Government with the Consultative Panel, in January/February and June/Julyeach year. The January/February meeting will focus mainly on the overall program performancein the preceding year based on the progress report updates (para. 4.12). Constraints to effectiveprogram implementation will be identified and amendments to the Operational Rolling Plan willbe made as necessary. The June/July meeting will focus on forward planning and financialcommitments for the coming year, drawing upon discussions in the January/February meetingand implementation performance in the subsequent months. The June/July 1998 meeting willconstitute a mid-term review of the program. Donors and other stakeholders will be providedprogress report updates at least one month prior to each review meeting, and will receive, priorto the end of September each year, a draft forward implementation plan and budget. This planand budget should reflect all costs and sources of financing for the entire education sector, inparticular the basic education subsector, and should include specific measures to ensure thatadequate resources will be allocated at the district level for the provision and maintenance ofschool facilities.
D. PROCUREMENT
4.14 IDA-financed activities will fully follow IDA Procurement Guidelines (January 1995edition). The procurement methods are described below and summarized in Table 4-1. Asummary procurement schedule for key activities has been prepared (Annex 5-5) and a muchmore detailed schedule will be included in the Operational Rolling Plan.

33
4.15 Civil works: (BESIC supports US$13.6 million equivalent). Civil works financedunder IDA include: rehabilitation of existing school facilities, new classrooms, and housing forteachers. Contracts will be packaged in lots of at least US$2 million equivalent to attractinternational competition under ICB. Lots that cannot be grouped into such bid packages and/orare unlikely to attract competition from foreign bidders will be procured through NationalCompetitive Bidding (NCB), up to an aggregate of US$8.4 million equivalent. A number ofcontracts which will require labor intensive manpower and/or use of NGOs and local labor maybe procured in accordance with procedures acceptable to IDA. These are mostly smallconstruction (works such as toilet facilities and storage) and rehabilitation works valued atUS$100,000 equivalent or less per contract, up to an aggregate amount not to exceed US$1.4million.
4.16 Goods. (BESIC supports US$10.1 million equivalent). Goods financed under IDAwould include mainly roofing materials for classrooms, instructional materials, vehicles andmiscellaneous equipment (e.g., computer systems and other equipment for education offices andschool workshops). Goods valued at US$250,000 or more per contract would be procuredthrough ICB using the Bank's standard bidding documents. Goods which can be competitivelyprocured nationally and which cannot be grouped into bid packages of at least US$250,000equivalent each will be procured through NCB under procedures acceptable to Bank. Inaggregate these will not exceed US$4.0 million equivalent. Small items and goods which cannotbe grouped into bid packages of at least US$50,000 equivalent will be procured on the basis ofprice quotations (National Shopping) obtained from at least three reliable suppliers, providedthat the aggregate amount of such procurement does not exceed a total of US$1.2 millionequivalent. Limited International Bidding (LIB) may be used for the procurement of specializededucational goods such as didactic material, software and equipment, for which there is only alimited number of suppliers to justify open advertisement for the contract. Bids for contractsestimated to cost less than US$250,000 equivalent, up to an aggregate amount not exceedingUS$500,000 equivelent, will be sought from a list of potential suppliers. Proprietary educationalsoftware, spare parts and other small items which are costing US$400,000 equivalent or less inthe aggregate, may, with IDA's prior agreement, be procured by direct contracting in accordancewith IDA procedures. Local practices for NCB have been recently reviewed by IDA and foundacceptable. They will include: (a) explicit statement to bidders of the evaluation and awardcriteria; (b) local advertising with public bid opening; (c) award to lowest evaluated bidder; and(d) foreign bidders would not be precluded from participating in NCB. Government hasconfirmed the above NCB principles.
4.17 Services: (BESIC supports US$2.2 million equivalent). Consultants financed by IDAwill be contracted in accordance with IDA's Guidelines for the Use of Consultants (August1981). The consultancy services required under the project will be mostly for projectimplementation and supervision, surveys and research studies and for architectural andengineering services. Draft terms of reference for major consulting services have been preparedand details are included in the Operational Rolling Plan.
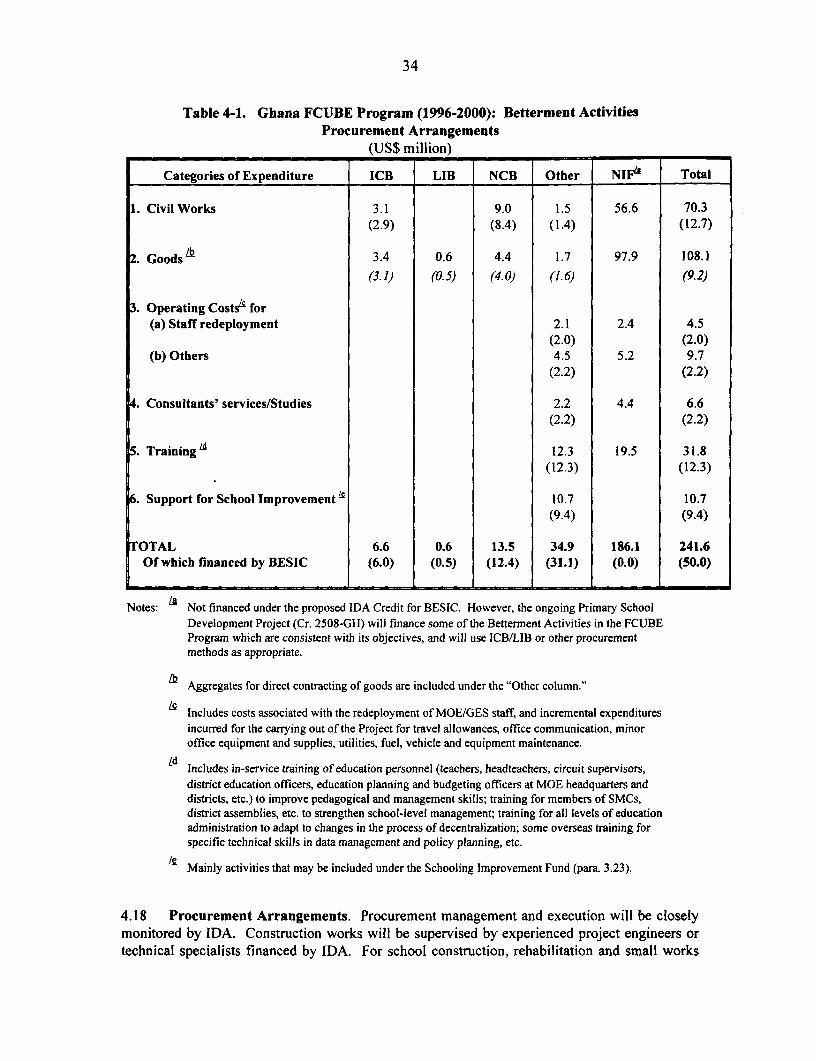
34
Table 4-1. Ghana FCUBE Program (1996-2000): Betterment ActivitiesProcurement Arrangements
(US$ million)
Categories of Expenditure ICB LIB NCB Other NIFP' Total
1. Civil Works 3.1 9.0 1.5 56.6 70.3(2.9) (8.4) (1.4) (12.7)
L Goods& 3.4 0.6 4.4 1.7 97.9 108.1(3.1) (0.5) (4.0) (1.6) (9.2)
. Operating Costsa for(a) Staff redeployment 2.1 2.4 4.5
(2.0) (2.0)(b) Others 4.5 5.2 9.7
(2.2) (2.2)
. Consultants' services/Studies 2.2 4.4 6.6(2.2) (2.2)
. Training a 12.3 19.5 31.8(12.3) (12.3)
. Support for School Improvement ' 10.7 10.7(9.4) (9.4)
TOTAL 6.6 0.6 13.5 34.9 186.1 241.6Of which financed by BESIC (6.0) (0.5) (12.4) (31.1) (0.0) (50.0)
Notes: Not financed under the proposed IDA Credit for BESIC. However, the ongoing Primary SchoolDevelopment Project (Cr. 2508-GH) will finance some of the Betterment Activities in the FCUBEProgram which are consistent with its objectives, and will use ICB/LIB or other procurementmethods as appropriate.
Aggregates for direct contracting of goods are included under the "Other column."
Includes costs associated with the redeployment of MOE/GES staff, and incremental expendituresincurred for the carrying out of the Project for travel allowances, office communication, minoroffice equipment and supplies, utilities, fuel, vehicle and equipment maintenance.
ld Includes in-service training of education personnel (teachers, headteachers, circuit supervisors,district education officers, education planning and budgeting officers at MOE headquarters anddistricts, etc.) to improve pedagogical and management skills; training for members of SMCs,district assemblies, etc. to strengthen school-level management; training for all levels of educationadministration to adapt to changes in the process of decentralization; some overseas training forspecific technical skills in data management and policy planning, etc.
Mainly activities that may be included under the Schooling Improvement Fund (para. 3.23).
4.18 Procurement Arrangements. Procurement management and execution will be closelymonitored by IDA. Construction works will be supervised by experienced project engineers ortechnical specialists financed by IDA. For school construction, rehabilitation and small works

35
payment will be made to contractors only when the work is completed according tospecifications. Only for major works will mobilization advance be given and this will notexceed 20 percent of the contract value. Procurement will be carried out by experienced staff ofthe procurement section of the PMU which will liaise with the MOE/GES units for handling allmatters related to the preparation, implementation and monitoring of work plans for the smoothexecution of procurement of all works, goods, and services, including the preparation of biddingdocuments, launching of tenders, evaluation, and reporting the results to the government and toIDA for review. During negotiations, agreement was reached with the Government on adherenceto the schedule for key procurement steps in Table 4-2, in order to expedite projectimplementation.
Table 4-2. Timetable for Key Procurement Steps
From Bid Opening to Completion From Government Approval oror Official Submission of Bid IDA's No Objection of BidEvaluation Reports to IDA Evaluation to Contract Signing
Goods under US$250,000 30 days 30 daysGoods over US$250,000 60 days 30 daysWorks under US$250,000 45 days 30 daysWorks over US$250,000 60 days 30 daysConsulting services 30 days 30 days
4.19 In addition, adequate records on procurement progress, including staff reports on sitevisits, the timing of works and goods procurement, and compliance with agreed methods ofprocurement will be maintained by the PMU and will be reviewed as part of the routine projectmonitoring by the MOE.
4.20 A project launch workshop will be organized by the Government and IDA shortly afterBoard presentation with the assistance of PMU staff. This workshop will be attended by stafffrom all project entities, deal with all aspects of project implementation, and especiallyconcentrate on procurement, disbursement, monitoring, and reporting. A final version of theOpertional Plan of the FCUBE program will be circulated at the launch workshop.
4.21 Bank Review. Prior review by IDA would be required for procurement of packages ofworks and goods which exceed US$250,000, of consultant services to firms of US$100,000, andto individuals of US$50,000. All terms of reference for consultants, sole source consultancies,assignments of critical nature, and amendments to consultants contracts raising the contractvalue above the aforementioned amounts will be subject to IDA's prior review. Post review ofprocurement actions will be given special care by IDA and will include, as additional to Banksupervision missions, selected review by Third Party verificiation firms. The Bank's StandardBidding Documents will be used for works and goods procured under ICB and for consultants.NCB documents for works and goods will be cleared with IDA as part of the Operational Plan.

36
E. DISBURSEMENT
4.22 The activities financed under the proposed credit are expected to be completed withinfour and a half years by December 31, 2000, with all disbursements made by June 30, 2001. Theestimated disbursement schedule is given in Annex 5-5.
4.23 Table 4-3 gives the categories and amounts to be financed out of the proposed IDAcredit, and the disbursement percentages in each category.
Table 4-3. Allocation and Disbursement of the IDA Credit
(US$ million)
Percentages of Expenditure to beCategories of Expenditure Amount financed
1. Civil Works 11.0 100% of foreign; 90% of local12l Goods expenditures2. Goods
(roofing sheets, instructional 8.2 100% of foreign; 90% of localmaterials, vehicles/equipment) expenditures
3. Operating Costs for(a) Staff redeployment 2.0 95%(b) Others 1.7 50%
4. Consultancies/Studies 1.9 100%
5. Training 10.8 100%
6. Unallocated 14.4
TOTAL 50.0
Note: / See Table 4-1, footnote /c.
4.24 Special Account. To facilitate project implementation and reduce the volume ofwithdrawal applications, a Special Account will be opened in US Dollars in a commercial bankon terms and conditions acceptable to IDA. The authorized allocation amounts to US$2.5million and covers about four months of eligible expenditures. Upon effectiveness, an amount of$1,250,000, representing 50 percent of the authorized allocation, will be deposited in the SpecialAccount. The remaining balance will be made available when the total amount withdrawn from thecredit account and/or special commitments issued amount to SDR 5.0 million. The SpecialAccount will be used for all payments below US$500,000. Replenishments would be submittedmonthly. All replenishments are fully documented except for: (a) contracts of less thanUS$250,000 for civil works and goods, (b) contracts of less than US$100,000 for consultingservices - firms, (c) US$50,000 for consulting services - individuals, and (d) operational costswhich would be claimed on the basis of Statements of Expenditure (SOEs). All supportingdocumentation for SOEs will be retained for review by periodic Bank supervision missions andexternal auditors. Overall responsibility for credit disbursement and financial management of the

37
Special Account will rest with the PMU. All disbursements are subject to the conditions of theDevelopment Credit Agreement and the procedures defined in the Disbursement Letter.
F. AccoUNTING, AUDITING, AND REPORTING
4.25 MOE/GES Accounts. Systems will be installed to ensure compatibility between theaccounting for Government receipts for and outlays in basic education, from all sources. Giventhat BESIC is an across-the-board underpinning to the FCUBE program, the Government willmake available to IDA, on a regular basis, financial management details of the consolidatedProgram Accounts for the education sector as a whole, so that a "part-whole" appreciation oftrends can be maintained.
4.26 In the interests of transparency and financial harmony, all accounts of the entire basiceducation sector (notwithstanding the source of funds) will be maintained by a commonly agreedmethod and at internationally accepted standards. By June 30 of each year, MOE/GES willpresent to IDA and other participating donors in FCUBE an independent auditor's report(management report and audited financial statements) for all program accounts - including thosefor Government funds, BESIC and other donor contributions from the precedingacademic/calendar year.
4.27 Following previous routine audits, IDA has raised concerns about aspects of the financialmanagement and cash flow of existing education projects. The recommendations made duringthe course of these financial audits have been helpful to MOE and will be incorporated into themanagement of the planned program. The MOE will also move progressively from a line itembudget to a program budget during this initiative. This shift should result in more discretionaryfunds being available within the overall MOE/GES budget. Financial management workshopsare planned for District Directors of Education and accounting personnel, with training to beprovided on guidelines stemming from the audit recommendations. Shortlisting of independentauditors for FCUBEIBESIC, under terms and conditions acceptable to IDA will be a conditionof Credit effectiveness.
G. PROGRAM BENEFITS AND RISKS
Program Benefits
4.28 Improved Basic Education Sector Outcomes. The quality of Ghana's basic educationwill improve in general. especially in terms of better teaching/learning outcomes. Government/donor/community cooperation and collaboration will be enhanced, and some more commonprocedures will be developed, because of the "holistic" nature of the Integrated sector approach(SIP) approach. The MOE's capacity to plan, manage, and monitor a range of complementaryinputs to enhance quality and access will be strengthened. The GES will adopt new systems ofassessing school performance and rewarding/sanctioning staff. Capacity for more effectivecurriculum utilization will be enhanced. Pre- and in-service teacher education will berevolutionized. The operation of the whole system, including individual schools, will becomemore gender sensitive. Communities will come to play a more influential and responsible role inthe management of the schools, leading to greater school effectiveness. The synergistic effect ofthe various components will increase net impact.

38
4.29 Gains from Improved Efficiency. FCUBE/BESIC will produce efficiency gains bothat management and school levels. Review and reorganization of the MOE and GES institutionalstructure, while developing an effective EMIS, will substantially reduce the waste andduplication in resource use. This will enable MOE to reallocate more resources to much neededschooling improvement activities. At the school level, reduction in dropout and repetition ratesby 10 percent annually, together with efforts to raise the PI intake rate from the present 82percent to 94 percent by the year 2000, will allow 164,000 more pupils to study at public primaryschools and produce 33,000 more public JSS graduates during 1996-2000 than would be the casewithout FCUBE.
4.30 Impact on the Poor and Girls Participation. A community with inadequate basiceducation services and with low school learning outcome generally has a low demand foreducation. FCUBE/BESIC has policy and program components to target funds to the poorest andeducationally most disadvantageous communities, and to raise awareness of the need andbenefits of education in such communities. The DACF is allocated by the Government havingregard to poverty, equity and needs criteria. To complement this, FCUBE will targetsupplementary resources. For example, when new schools are built with MOE subsidies,priority will be given to relatively poor communities with lower enrollment, especially girlsparticipation, where financial capacity is low but the effort being made is fair. Teacher housingwill be available with subsidized rent in areas where incentives for teachers to serve are adverse.JSS pupils or their families who are judged by a transparent process to be needy may receivesome public financial support during their period of basic schooling. These combined with ademand-stimulating IEC campaign will enable more girls and poor children to go to school whootherwise would not benefit from Ghana's basic education service.
4.31 Economic benefits of investment in basic education. The economic benefits of thisbasic education improvement program can be expressed by the rates of return to investment ineducation. Based on 1992 household survey data in Ghana, the private rate of return toinvestment in primary education compared with no education is estimated at 28 percent,suggesting that if $1,000 is invested in primary education, there will be an annual private benefitof about $280 over the lifetime of the average primary school graduate, above what the sameperson would have earned without attending school. Similarly, the social rate of return toprimary compared with no education has been found to be about 19 percent. The private rate ofreturn to secondary education over primary schooling is about 12 percent and the social rate ofreturn is 10 percent. The gap between private and social returns is explained by the publicsubsidization of education. Subgroup analysis shows that at both primary and secondary levels,girls in Ghana have a higher rate of return than boys, justifying targeted intervention to promotemore girls' participation. Further details on cost-benefit analyses shown in Annex 3-3 suggeststhat investment for expansion of good quality basic education will have a high private and publicpayoff.
4.32 With respect to the economic benefits of the quality of basic education, internationalevidence suggests that the economic benefits of education are greater when a critical minimumof education attainment across the population has been achieved. Cross-country macroeconomicstudies analyzed by the Bank have shown that the average educational attainment of thepopulation has a strong positive effect on economic growth, with one year of additionalschooling of the labor force possibly leading to as much as a 9 percent increase in the domesticoutput for the first three years of schooling and to 4 percent a year for the next three years.

39
Program Risks
4.33 There are three main risks concerning the effectiveness of this operation. First, changingteachers' attitudes towards working seriously will take time and thus quality improvements inthe classroom may not take place as rapidly as would be desirable. Second, the Governmentcould be overstretched in the early stages of the program as it manages simultaneously the fullrange of necessary interventions in the basic school system. Third, despite the interventiontargeting the poor, parents in economically deprived and educationally backward districts maystill be unwilling to send their children to school because of high direct and indirect costs. Thefirst risk will be mitigated through a continuous participatory and consultative process duringwhich all parties will come to clearly understand their respective roles and responsibilities; andthe consequences of certain behavior. Furthermore, communities (through SMCs) will assumesome responsibility for recommending the rewarding or sanctioning of teachers. More effectiveschool level supervision and generating sense of partnership among all key players for improvingschooling also have crucial roles to play in this issue. The second risk will be minimized byensuring that the early years of the program focus on a manageable package of the highestpriority items; that the foreshadowed administrative restructuring and institutional strengtheningproceeds on schedule; and that ongoing Government/community/donor consultation becomesfirrmly embedded in the implementation process. For the third risk, Government/MOE willdevelop special arrangements such as compensatory resource transfers to clusters ofdisadvantaged schools. Further, as an experimental measure, non-conventional approaches tobasic education, with more flexible access and delivery arrangements and reduced cost impact onfamilies, will be introduced.
Poverty Category
4.34 Focusing on issues of quality, efficiency and equity, the proposed operation willparticularly benefit the less advantaged groups of the Ghanaian population: the urban and ruralpoor; and girls. It would thus be included in the Program of Targeted Interventions.
Environmental Aspects
4.35 This operation will include limited small scale construction activities, none of which willhave significant negative environmental or social impacts. In conformity with OD 4.01, this is acategory C project requiring no further environmental analysis.
5. AGREEMENTS TO BE REACHED AND RECOMMENDATION
5.1 During negotiations, the Government reached agreement with IDA on:
(a) a draft Letter of Basic Education Sector Development Policy, outlining theGovernment's policy priorities, commitments and targets for the period 1996-2005 (para. 3.1);
(b) a draft Operational Rolling Plan, including key performance indicators, withspecific arrangements for activities to be carried out in 1996-98 (para. 3.2);

40
(c) a Sector Financing Plan reflecting all costs and sources of financing for theeducation sector, in particular the basic education subsector (para. 3.30);
(d) the management structure for the program, including the establishment of theImplementation Overview Committee and the Consultative Panel involvingparticipating donor representatives (para. 4.3-4.9);
(e) semi-annual review meetings in January/February and June/July each year,convened by the Government with the Consultative Panel, with the June/July1998 meeting constituting a Mid-Term Review (para. 4.13);
(f) Government commitment to delegate, progressively from the beginning of 1998,financial management discretion to designated districts having viable educationplans and administrative systems (para. 3.16);
(g) draft terms of reference for key long-term and short-term consultants (para.4.17).
(h) a schedule for key procurement steps (para. 4.18); and
(i) a time-bound action plan for the design and implementation of EMIS (para3.14).
5.2 As a condition of Board presentation, the Government will have
(a) adopted a Basic Education Sector Development Policy statement satisfactory toIDA (paras. 3.1 and 5.1 (a)); and
(b) established an Implementation Overview Committee, comprising membersdrawn from the MOE/GES Management Team, MOF, MLGRD, NIRP, CSPIPand GNAT, which will meet regularly to advise on implementation issues (para.4.4).
The first condition has already been met as of the date of this report, and the final Letter of BasicEducation Sector Development Policy is included in Annex 4.
5.3 As a condition of Credit effectiveness, the Government will have:
(a) submitted to the Association the Operational Rolling Plan for 1996-98, to thesatisfaction of IDA (para. 3.2); and
(b) shortlisted independent auditors for BESIC, under terms and conditionsacceptable to IDA (para. 4.27).
5.4 Subject to agreement to the above, the proposed program will constitute a suitable basisfor an IDA credit of SDR 34.7 million (US$50.0 million equivalent) to the Republic of Ghana onstandard IDA terms with a maturity of 40 years.

ANNEX IBasic Data Sheet
ANNEX 1: Basic Data Sheet
Indicators Data Year SourceA Social Indicators
1. Total population estimate (thousand) 16,446 1993 a2 School-age population as % of total pop. 32 1990 c3 Average annual growth rate of population 3.1 mre al Average annual growth rate of school-age pop. 3.4 1990-95 c
5. % of population below poverty line (32,981 cedis) 43.0 mre a6. Total fertility rate (births per women) 5.9 mre a7. Infant mortality rate (per 1,000 live births) 79.4 mre a
B. Economic indicators1. GDP (in billion cedis, current price) 5186.3 1994 e2. Average real growth rate of GDP 4.2 1991-94 e3. GDP per capita (US$) 322.7 1994 e4. Average growth rate of GDP per capita 1.1 1991-94 e
C. Education Indicators1. Gross Enrollment ratios (% of school-age pop.)
Primary--total 78.0 1993 bPrimary--Female 71.7 1993 bJunior Secondary--total 60.9 1993 bJunior Secondary--Female 51.4 1993 bGER for 6-23 age group 45 1991 c
2. Efficiency indicatorsStudent/teacher ratio
Primary 29 mre aJunior Secondary 19 mre a
Dropout rates (% per year)Primary 3.3 1992 bJunior secondary 7.2 1992 b
Repetition ratesPrimary 3.2 1992 bJunior secondary 1.2 1992 b
Pupils reaching grade 6 (% of cohort) 77 1989 thru 93 bIlliteracy rates (% of age 15+ pop.) 40 mre a
Female (% of female age 15+ pop.) 49 mre a3. Education expenditure
Average public education spending as % of GDP 4.6 1991-94 dAverage public education expenditure as % of
public expenditure (discretionary) 38.8 1991-94 dShare of MOE recurrent budget
Primary education 39.2 1996 bJunior secondary education 19.5 1996 bSenior secondary education 22.1 1996 bVocational/technical education 1.6 1996 bTeacher education 5.4 1996 bTertiary education 12.2 1996 b
Notee: 'mre' means most recent estimate of the single year between 1988 and 1993.Sources: a. Social indicatorsfor development 1995, World Bank
b. MOE. 1995c. A statistical profile of education in sub-Saharan Africa, 1990-1993, DAEd. Govemment of Ghana, World Bank staff estimates.e. Ghana Country Economic Memorandum, World Bank, May 1995, Table Al, A2 & A7; Quarterly Digest of
Statistics, Ghana Statistical Service, March 1993, Tables 40 &42.

ANNEX 2-1Participation Indicators
Table 2-1-1. Participation in Public and Private Schools, 1989-94
Total Public Admission GER RetentionYear enrollment (%) rate (%) (%) rate (%)
Primary (Age 6-1 1)1989 1,805,258 94 83.3 76.4 67.11990 1,945,422 93 93.5 79.3 75.41991 2,011,602 90 89.4 79.1 78.61992 2,047,293 90 85.5 77.6 80.61993 2,135,421 90 85.5 78.0 84.3Junior Secondary (Age 12-14)1989 625,018 100 57.3 51.5 78.71990 569,343 100 60.4 54.5 83.51991 605,760 98 62.4 56.3 84.61992 644,976 98 63.4 58.2 84.41993 694,724 94 67.2 60.9 85.9
Source: MOE (1995).Note: Retention rates refer to proportion of cohort reaching final grade. The retention rates for
1989 and 1993 are based on the enrollments in public schools only.Enrollment figures covers both public and private schools.

ANNEX 2-2Efficiency Indicators
Table 2-2-1. Repetition, promotion, and dropout rate by grade:1990/91-1992/93 (Public only)
Repetition rate Promotion rate Dropout rate(%) (%) (%)
Primary 90/91 91/92 92/93 90/91 91/92 92/93 90/91 91/92 92/931 6.2 5.7 5.5 81.9 87.0 87.5 11.9 7.3 7.02 3.0 3.5 3.5 90.3 93.1 95.8 6.7 3.4 0.73 2.3 2.7 3.0 91.9 93.8 95.1 5.8 3.5 1.94 1.8 2.3 2.5 91.3 92.8 93.8 6.9 4.9 3.75 1.5 1.9 2.2 93.0 95.2 94.9 5.5 2.9 2.96 1.6 2.1 2.5 93.9 95.0 93.9 4.5 2.9 3.6
Primary Ave. 2.7 3.0 3.2 90.4 92.8 93.5 6.9 4.2 3.3Jr. Secondary
1SI 1.3 1.1 1.2 89.8 92.6 92.2 8.9 6.3 6.6JS2 1.7 1.7 1.7 87.6 90.5 90.6 10.7 7.8 7.7JS3 0.9 0.9 0.9
JS Average 1.3 1.2 1.2 88.7 91.6 91.4 9.8 7.1 7.2
Source: MOE (1995)
Table 2-2-2. Efficiency indicators: 1989-1993 (public only)
Average Average Pupil/ Teacher/ Class/ % of classesYear school class size teacher class classroom without
size ratio ratio ratio classroomsPrimary
1989 173 28 27 1.02 1.24 19.21990 170 28 29 0.99 1.24 19.61991 162 28 27 1.01 1.24 19.41992 164 27 30 0.90 1.28 21.81993 168 27 31 0.89 1.28 -
Junior Secondary1989 122 27 15 1.80 - -
1990 111 32 15 2.111991 115 33 15 2.25 - -
1992 123 33 16 2.03 0.75 17.2
Source: MOE (1995).

ANNEX 2-3Student Achievement Indicators
Table 2-3-1. Criterion-Referenced Test Results on English and Mathematicsfor the 6th-Grade Students, by Region, 1994 (public only)
% of pupils reaching theMean score S. D. criterion score of 60% of the
Region (%) total scoreAshanti English 27.8 7.6 0.6
Math 26.4 8.0 0.2B/Ahafo English 29.1 8.7 1.6
Math 27.0 8.7 1.1Central English 28.1 7.6 0.9
Math 25.8 8.2 0.4Eastern English 29.5 9.2 1.6
Math 26.5 8.5 0.8G/Accra English 40.5 15.5 13.4
Math 32.3 11.5 4.9Northern English 33.0 11.4 4.4
Math 28.7 9.5 1.3Upper English 33.9 11.9 4.8
Math 29.4 11.1 3.6Upper West English 26.1 6.3 0.0
Math 22.8 8.5 0.0Volta English 31.5 11.0 3.4
Math 28.5 9.7 1.6Western English 30.7 9.6 1.9
Math 28.3 10.0 1.9Total English 31.0 11.0 3.3
Math 27.7 9.5 1.5Boys English 31.1 10.9 3.2
Math 28.3 9.7 1.6Girls English 30.9 11.0 3.4
Math 26.9 9.3 1.3Source: MOE (1995).Note: Criterion referrenced tests were administered for 6th grade primary students at 336 schools, withsome 8800 pupils.
Table 2-3-2. Student Achievement on the Basic Education Certificate ExaminationAdministered for Students at the End of Junior Secondary Education, 1991-94
Year No. of candidates % of students passed
1991 149,038 81.4%1992 165,359 83.8%1993 181,824 84.2%1994 198,782 84.8%
Source: MOE (1995).

ANNEX 2-4System Outcome Indicators
Table 2-4-1: System Outcome Indicators: 1991-1994 (public only)
Transitional(pass) rate of Transitional
Completion Completion primary school (pass) rate ofCompletion rate for 3-year rate graduates to junior secondaryrate for 6- junior for 9-year junior school graduates
year primary secondary basic secondary to senioreducation education education school secondary school
Year (%) (%) (%) (%) (%)1991 70.0 82.8 50.5 96.8 35.31992 70.1 82.8 51.0 93.9 33.81993 72.1 82.6 54.3 95.0 34.81994 75.4 82.4 56.8 94.5
Source: MOE (1995).
Notes: Completion rate is the ratio between the number of students in the final grade of the cycle, grade6 in primary and grade 3 in junior secondary in a given year T and the number of studentsentered grade I in year T-6 and T-3 for primary and junior secondary respectively.
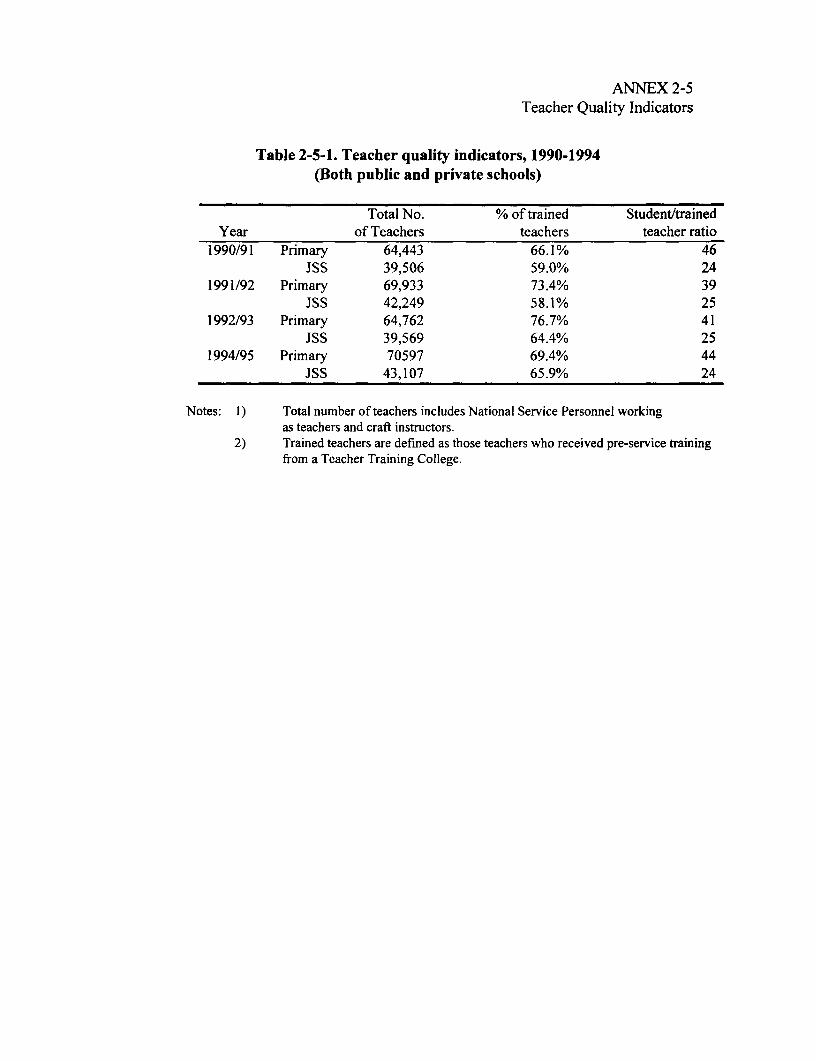
ANNEX 2-5Teacher Quality Indicators
Table 2-5-1. Teacher quality indicators, 1990-1994(Both public and private schools)
Total No. % of trained Student/trainedYear of Teachers teachers teacher ratio
1990/91 Primary 64,443 66.1% 46JSS 39,506 59.0% 24
1991/92 Primary 69,933 73.4% 39JSS 42,249 58.1% 25
1992/93 Primary 64,762 76.7% 41JSS 39,569 64.4% 25
1994/95 Primary 70597 69.4% 44JSS 43,107 65.9% 24
Notes: 1) Total number of teachers includes National Service Personnel workingas teachers and craft instructors.
2) Trained teachers are defined as those teachers who received pre-service trainingfrom a Teacher Training College.

ANNEX 2-6Manpower Indicator
Table 2-6. Ghana Education Service Manpower Statistics, May 1994Teaching and Non-teaching Staff by Level
Level Teaching Staff Non-Teaching TotalStaff
Kindergarten 18,028 766 18,794Primary 62,608 816 63,424J.S.S. 30,580 1,015 31,595Technical 779 786 1,565S.S.S. 10,851 12,831 23,682Training Colleges 946 1,436 2,382Polytechnics 447 327 774Diploma Colleges 57 91 148Education Unit Offices 502 715 1,217District Offices 3,867 2,219 6,086Regional Offices 453 644 1,097Headquarters 222 358 580Study Leave 3,512 40 3,552Total 132,852 22,044 154,896
Source: MOE.

ANNEX 3-1Expenditure Analysis
Table 3-1-1: Public Expenditure on Education in Ghana, 1991-94
(in constant 1994 price, million cedis)Resources and Expenditures Indicators 1991 1992 1993 1994GDP 4,581,395 4,760,726 4,998,765 4,950,379Total public expenditure 625,649 808,248 1,001,437 1,156,762Total public recurrent expenditure 469,242 590,598 765,924 833,152Public recur. expend (discretionary, including only 346,463 441,829 499,467 523,800item 1-5 & subvention)Total capital expenditure 139,824 174,761 181,405 173,864
of which Development 108,158 155,774 153,606 165,605GDP deflator: 1994=100 56.2 63.2 79.0 100l
Total public expenditure on education 205,470 209,551 240,668 242,114Total recurrent expenditure on education 136,112 178,752 196,976 188,573Basic education recurrent expenditure 82,264 112,272 124,261 112,008
(excluding administrative cost.)Total capital expenditure on education 7,295 7,753 8,101 9,800
Total public expenditure on education 4.5% 4.4% 4.8% 4.9%as % of GDP
Total public expenditure on education 32.8% 25.9% 24.0% 20.9%as % of total public expenditure
Recurrent expenditure on education 3.0% 3.8% 3.9% 3.8%as % of GDP
Recurrent expenditure on education 39.3% 40.5% 39.4% 36.0%as % of total recurrent (discretionary) expenditure
Capital expenditure on education as % of GDP .2% .2% .2% .2%Capital expenditure on education 5.2% 4.4% 4.5% 5.6%
as % of total capital expenditureBasic education recurrent expenditure 65.6% 68.3% 68.3% 64.6%
as % of recurrent expenditure on education"
Source: GOG, MOENote: I/ Including administrative expenditure, allocated in proportion to the subsector's share in
the total expenditure.

ANNEX 3-1Expenditure Analysis
Table 3-1-2. Distribution of MOE Recurrent Budget and Expenditure, 1993-94
(million cedis)Budget Expenditure Exp/Budg
ratioTotal share of Salary % Total share of Salary %
(items 1-5) line total of line (items 1-5) line total of lineout of total' out of totalTotal Total
1993Primary 54,877.0 41.1% 95.0% 57,726.6 37.1% 93.9% 105.2%JSS 22,120.8 16.6% 93.7% 40,439.7 26.0% 95.7% 182.8%SSS 15,184.8 11.4% 91.0% 17,593.8 11.3% 90.9% 115.9%Voc/Tech 1,500.7 1.1% 80.0% 1,981.5 1.3% 85.4% 132.0%Teacher Training 4,800.3 3.6% 94.5% 4,068.4 2.6% 94.4% 84.8%Tertiary 2,226.2 1.7% 90.0% 2,104.0 1.4% 85.8% 94.5%Other Education 764.1 0.6% 53.7% 402.2 0.3% 15.8% 52.6%Administration 11,743.4 8.8% 73.7% 11,275.1 7.2% 73.5% 96.0%Subvention 20,273.4 15.2% - 20,019.6 12.9% - 98.7%Total 133,490.7 100.0% 77.5% 155,610.8 100.0% 80.1% 116.6%
1994Primary 75,300.0 40.3% 96.0% 66,993.9 35.5% 95.9% 89.0%ISS 30,343.7 16.2% 94.7% 45,013.9 23.9% 96.7% 148.3%SSS 23,559.5 12.6% 81.4% 24,476.6 13.0% 83.8% 103.9%Voc/Tech 2,138.0 1.1% 77.8% 2,350.0 1.2% 80.8% 109.9%Teacher Training 6,683.8 3.6% 94.0% 6,245.8 3.3% 94.4% 93.4%Tertiary 2,872.8 1.5% 88.9% 1,471.8 0.8% 78.4% 51.2%Other Education 1,047.7 0.6% 49.9% 416.5 0.2% 15.1% 39.8%Administration 15,847.6 8.5% 75.0% 12,956.9 6.9% 75.8% 81.8%Subvention 29,196.5 15.6% - 28,647.2 15.2% - 98.1%Total 186,989.3 100.0% 76.5% 188,572.6 100.0% 78.0%1 100.8%
Source: MOENote: Total salary's share in the Total MOE budget/expenditure does not include the salary
component for the subvented institutions.

ANNEX 3-1Education Expenditure
Table 3-1-3. Expenditures on Public Basic Education by Source. 1991-94
(In 1994 constant price, US$)
source 1991 1992 1993 1994Total Primary Expenditure $76,936,830 $94,191,038 $100.783,623 $107,651,762Total Jr. Secondary Expenditure $50,337,797 $66,762,315 $75.449.633 $82.650.756
Primary Recurrent expenditure Total $73,764,954 $91,097,786 $98,401,986 $94,211,169MOE $52,019,734 $68,778,481 $75,301.347 $70,025,295District $44,322 $125,159 $160.708 $37,304Household $21,700,898 $22,194,145 $22,939,930 $24,148,570Donor $994,468 $207,037 $4,068,471 $11,468,786
JSS Recurrent expenditure Total $48,208,851 $64,700.147 $73,861,875 $73,690,361MOE $30,976,668 $46,923,800 $52,751,485 $47,050,726District $29,548 $83,439 $107,139 $24,869Household $16.539,656 $17,554,883 $18,290,937 $18,968,908Donor $662,979 $138,024 $2,712,314 $7,645,857
Share of contributionPrimary MOE 70.52% 75.50% 76.52% 74.33%
District 0.06% 0.14% 0.16% 0.04%Household 29.42% 24.36% 23.31% 25.63%Donor 1.35% 0.23% 4.13% 12.17%
Jr. Secondary MOE 64.26% 72.53% 71.42% 63.85%District 0.06% 0.13% 0.15% 0.03%Household 34.31% 27.13% 24.76% 25.74%Donor 1.38% 0.21% 3.67% 10.38%
Primary Capital Expenditure Total $3,171,877 $3,093,253 $2,381,637 $13,440,593MOE $0 $0 $0 $0District $2,820,790 $3,076,758 $1,633,865 $3,041,024Donor $351,087 $16,494 $747,773 $10,399,569
Jr. Secondary Capital Total $2,128,946 $2,062,169 $1,587,758 $8,960,395MOE $14,362 $0 $0 $0District $1,880,527 $2,051,172 $1,089,243 $2,027,349Donor $234,058 $10,996 $498,515 $6,933,046
Share of contributionPrimary MOE 0.0% 0.0% 0.0% 0.0%
District 88.9% 99.5% 68.6% 22.6%Donor 11.1% 0.5% 31.4% 77.4%
Jr. Secondary MOE 0.7% 0.0% 0.0% 0.0%District 88.3% 99.5% 68.6% 22.6%Donor 11.0% 0.5% 31.4% 77.4%
% distribution of total expenditurePrimary MOE 67.6% 73.0% 74.7% 65.0%
District 3.7% 3.4% 1.8% 2.9%Household 28.21% 23.56% 22.76% 22.43%Donor 0.5% 0.0% 0.7% 9.7%
Jr. Secondary MOE 61.6% 70.3% 69.9% 56.9%District 3.8% 3.2% 1.6% 2.5%Household 32.9% 26.3% 24.2% 23.0%Donor 1.8% 0.2% 4.3% 17.6%
Recurrent spending/student Primary $41.18 $49.37 $53.31 $50.50iSS $80.93 $102.76 $112.02 $104.34
Total spending/student Primary $42.57 $50.96 $52.76 $56.05JSS $84.91 $106.10 $115.08 $125.26
Source: MOE; Demery et al (1995).Notes: The household unit cost is taken from the GLSS3 for 1992, and assumed unchanged over the period. Some part of the household
expenditure is used also for capital costs, but details are not available.The district expenditure is derived from data available for 27 districts, assuming they represent proportionately for 110 districts.District basic education expenditures consists of contributions by (i) the central government, including District Assembly CommonFund, but excluding MOE budget; (ii) district own-generated resources, and (iii) NGOs and others, and are allocated to primaryand JSS by 60%:40%.

ANNEX 3-1Expenditure Analysis
Table 3-1-4. Public Expenditure on Teacher, 1991-94
(constant 1994 price)1991 1992 1993 1994
Total teacher wage billsPrimary $50,662,150 $63,830,943 $70,250,037 $65,661,068
Growth index 100 126 139 130JSS $30,431,232 $44,791,844 $50,607,445 $44,834,172
Growth index 100 147 166 147Share of teacher salaries inrecurrent expenditure for:
Primary 94.0% 91.5% 92.0% 93.8%JSS 94.8% 94.1% 94.6% 95.3%
Average teacher annual salaryPrimary $763.24 $1,034.13 $1,127.36 $1,014.57
JSS $911.25 $1,361.62 $1,401.48 $1,258.61
Number of teachers (public school)Primary 66,378 61,724 62,314 64,718
iSS 33,395 32,896 36,110 35,622
Notes and Sources: MOE. JSS teachers does not include National Service staff.

Annex 3-2Equity Aanalysis
Tablel 3-2-1. Equity Indicators: Gender gaps in admission rate, GER, retention,and repetition rates, 1989-1993
Admission Rate (%) Gross Enrollment Rate Retention Rate(%) (%)
Year Boys Girls Boys Girls Boys GirlsPrimary Education
1989 - 78.7 - 64.3 71.1 62.31990 99.4 87.6 86.7 71.9 79.0 71.11991 93.9 84.7 85.8 72.4 82.5 74.11992 89.8 81.2 83.7 71.4 83.9 76.71993 90.1 80.8 84.2 71.7 88.4 79.6
Junior Secondary Education1989 - 48.6 - 42.7 80.9 75.61990 70.2 50.6 64.6 44.5 87.0 78.81991 71.6 53.2 66.2 46.4 88.8 78.91992 71.7 55.0 67.4 48.9 86.6 81.31993 75.9 58.4 70.4 51.4 88.7 82.2
Source: MOE (1995).
Table 3-2-2. Enrollment in Basic Education by Grade, Gender, and Sector, 1994/95
Public l PrivateGirls Girls
as% of as % ofGrade Boys Girls Total total i Boys Girls Total total
1 199995 179705 379700 47.3% 23030 22205 45235 49.1%2 179855 158211 338066 46.8% 23142 21698 44840 48.4%3 174092 151360 325452 46.5% 1 22315 20957 43272 48.4%4 169090 143843 312933 46.0% 20073 18719 38792 48.3%5 158800 131547 290347 45.3% 17069 16197 33266 48.7%6 153516 120789 274305 44.0% 14909 13629 28438 47.9%
Primary 1,035,348 895,455 1,920,803 46.6% 120,438 113,405 233,843 48.5%7 137913 107607 245520 43.8% 6770 6421 13191 48.7%8 126319 94557 220876 42.8% 5324 4999 10323 48.4%9 113085 80370 193455 41.5% 3755 3438 7193 47.8%
JSS 377,317 282,534 659,851 42.8% 15,849 14,858 30,707 48.4%Total 1,412,665 1,177,989 2,590,654 45.5% 136,287 128,263 264,550 48.5%
Source: PBME, MOE (1996).

ANNEX 3-2Equity Analysis
Table 3-2-3: Equity indicators by gender, 1992
Equity Indicators Male Female All% of the population with no education 9.17% 9.95% 9.53%% of the population completing primary education 37.43% 42.07% 39.60%% of the population completing middle/JSS 41.71% 39.82% 40.83%% of the population completing secondary educ. 8.34% 6.48% 7.47%% of the population completing tertiary education 3.35% 1.67% 2.56%Average # of years of schooling 6.4 5.82 6.13Average amount of scholarship received (cedis) 25,622 27,100 32,720Average individual income (cedis) 273,411 253,130 263,827Public subsidies per capita on education*Primary education (Cedis) 4,981 3,883 4,416Secondary education (Cedis) 5,702 3,564 4,601Tertiary education (Cedis) 2,119 1,166 1,628All education (Cedis) 12,803 8,614 10,644
Source: GLSS3. Extracted from Demery, et al. (1995).
Table 3-2-4. Equity indicators by poverty group, 1992
Equity Indicators Very Poor Poor Non-poor All% of the population with no education 16.11% 12.66% 8.88% 11.70%% of the population completing primary education 49.07% 48.31% 37.75% 43.18%% of the population completing middle/JSS 31.25% 32.53% 42.47% 37.33%% of the population completing secondary educ. 2.99% 4.32% 8.11% 5.90%% of the population completing tertiary education 0.57% 1.43% 2.79% 1.89%Average # of years of schooling 4.91 5.48 7.06 6.13Average household education expenditure (cedis) 7,976 11,067 20,484 14,240Average amount of scholarship received (cedis) 15,279 20,500 41,441 32,453Average individual income (cedis) 198,736 254,910 292,961 264,254
Source: GLSS3. Extracted from Demery, et al. (1995)."Poor group" is defined as those individuals at or below 2/3 of mean expenditure per capita;"'very poor group" is defined as those individuals at or below 1/3 of mean expenditure per captia.

ANNEX 3-2Equity Analysis
Table 3-2-5 Equity indicators by household expenditure quintile, 1992
Quintile 1 2 3 4 5 AllEquity Indicators Poorest <<<<< >>>>> RichestGross Enrollment Ratios (GER)
Primary education 75% 91% 90% 91% 101% 88%Secondary education 27% 40% 38% 45% 45% 39%
Public subsidies per capita on educationPrimary education (Cedis) 4,815 5,219 4,797 4,147 3,100 4,416Secondary education (Cedis) 3,431 5,026 4,849 5,412 4,285 4,601Tertiary education (Cedis) 485 775 1,551 1,648 3,683 1,628All education (Cedis) 8,731 11,021 11,196 11,207 11,067 10,644
Household spending per student on educationPublic primary schools (Cedis) 5,148 6,028 7,627 8,881 10,617 7,364Public Secondary schools (Cedis) 13,545 17,345 22,223 28,437 38,954 24,441
Source: GLSS3. Extracted from Demery, et al. (1995).
Table 3-2-6. Equity Indicators by locality, 1992
Equity Indicators Urban Rural All% of the population with no education 7.70% 14.23% 11.70%% of the population completing primary education 37.13% 47.01% 43.18%% of the population completing middle/JSS 41.28% 34.83% 37.33%% of the population completing secondary educ. 10.75% 2.83% 5.90%% of the population completing tertiary education 3.15% 1.10% 1.89%Average # of years of schooling 7.39 5.34 6.13Incidence of poverty in the population 46.44% 54.50% 51.89%Average individual income (cedis) 351,021 215,813 264,254Average amount of scholarship received (cedis) 41,093 20,177 32,454Average household education expenditure (cedis) 24,135 8,806 14,240Household education expenditure per student *Public primary schools (Cedis) 12,318 5,248 7,364Public secondary schools (Cedis) 34,072 17,422 24,441Public Tertiary education (Cedis) 105,176 66,500 95,518
Source: GLSS 3.* : Extracted from Demery, et al. (1995).

ANNEX 3-2Equity Analysis
Table 3-2-7. Enrollment in Primary education by Region, by Sector, 1992
Total % of private enrollment GERRegion enrollment (%)
Ashanti 390,238 14.1% 88.2B. Ahafo 208,986 4.9% 76.7
Central 196,065 2.7% 85.7Eastern 287,670 5.3% 81.6
G. Accra 280,672 35.6% 86.5Northern 136,328 2.4% 51.3
Upper East 75,875 0.2% 46.1Upper West 48,909 0.1% 53.7
Volta 219,301 1.7% 90.6Western 203,249 4.0% 79.9
GHANA 2,047,293 9.7% 77.6
Source: PMBE, MOE
Table 3-2-8. Equity indicators by region, 1991-92 (Public only)
Total No. Pupil/ % of % ofTotal % of girl of teachers teacher female trained
Region enrollment enrollment ratio teachers teachersPrimary
Ashanti 337,039 46.9% 11,853 28 41.4% 75.5%B. Ahafo 186,579 46.2% 7,762 24 25.5% 64.4%
Central 187,631 46.3% 6,474 29 34.2% 74.4%Eastern 274,162 46.4% 11,425 24 34.5% 76.8%
G. Accra 174,960 49.2% 4,776 37 72.3% 90.1%Northern 130,338 35.1% 5,400 24 26.4% 65.7%
UpperEast 67,461 39.0% 2,153 31 35.9% 78.6%Upper West 42,841 42.7% 1,551 28 35.8% 84.0%
Volta 205,971 46.1% 7,743 27 33.5% 84.8%Western 200,241 45.8% 7,241 28 28.8% 55.7%National 1,807,223 44.4% 66,378 28 36.8% 75.0%
Jr. SecondaryAshanti 116,680 43.1% 6,267 19 24.7% 75.7%
B. Ahafo 65,877 41.9% 3,969 17 10.8% 66.0%Central 63,573 40.1% 3,644 17 21.8% 71.4%Eastern 88,990 41.0% 5,551 16 23.1% 75.2%
G. Accra 80,859 47.4% 3,428 24 52.0% 82.0%Northern 27,110 25.4% 1,600 17 14.1% 61.3%
Upper East 13,162 35.0% 1,008 13 14.3% 51.5%Upper West 11,133 38.1% 849 13 14.3% 58.1%
Volta 67,591 39.7% 3,396 20 18.1% 81.7%Western 57,892 39.6% 3,631 16 21.9% 62.5%National 592,867 39.8% 33,343 17 21.5% 68.5%
Source: MOE (1995).
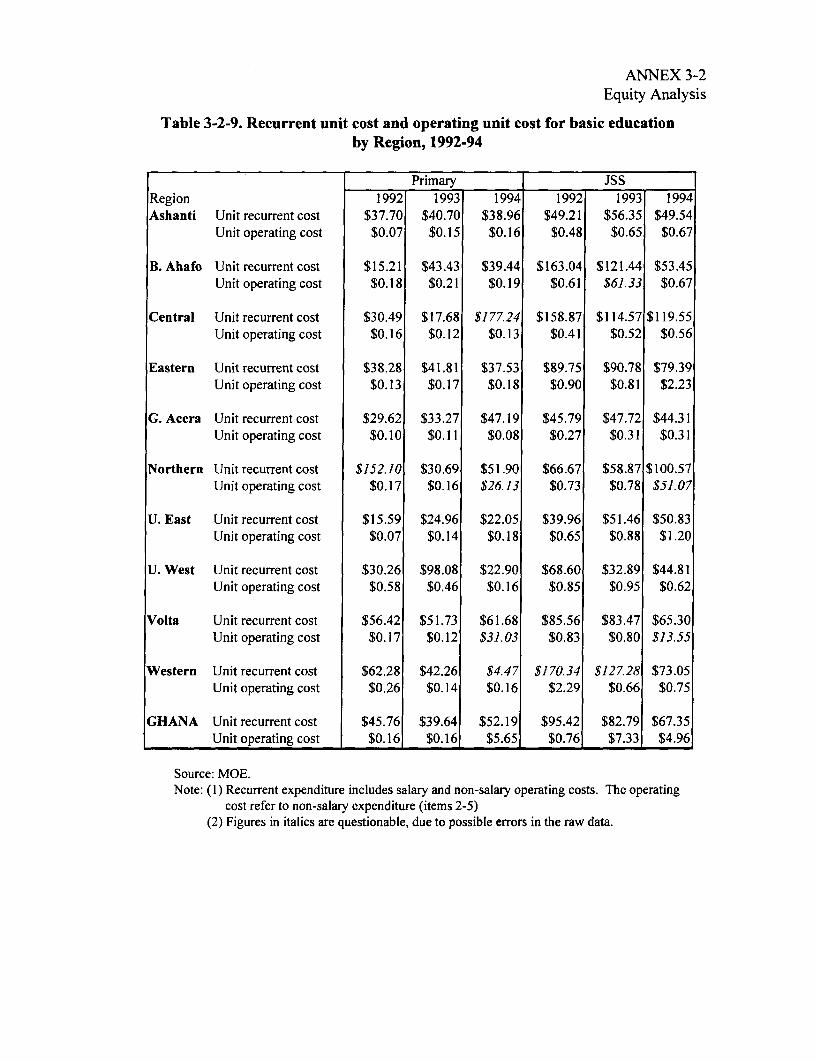
ANNEX 3-2Equity Analysis
Table 3-2-9. Recurrent unit cost and operating unit cost for basic educationby Region, 1992-94
._______ Primary |JSS lRegion 1992 1993 1994 1992 1993 1994Ashanti Unit recurrent cost $37.70 $40.70 $38.96 $49.21 $56.35 $49.54
Unit operating cost $0.07 $0.15 $0.16 $0.48 $0.65 $0.67
B. Ahafo Unit recurrent cost $15.21 $43.43 $39.44 $163.04 $121.44 $53.45Unit operating cost $0.18 $0.21 $0.19 $0.61 $61.33 $0.67
Central Unit recurrent cost $30.49 $17.68 $177.24 $158.87 $114.57 $119.55Unit operating cost $0.16 $0.12 $0.13 $0.41 $0.52 $0.56
Eastern Unit recurrent cost $38.28 $41.81 $37.53 $89.75 $90.78 $79.39Unit operating cost $0.13 $0.17 $0.18 $0.90 $0.81 $2.23
G. Accra Unit recurrent cost $29.62 $33.27 $47.19 $45.79 $47.72 $44.31Unit operating cost $0.10 $0.11 $0.08 $0.27 $0.31 $0.31
Northern Unit recurrent cost $152.10 $30.69 $51.90 $66.67 $58.87 $100.57Unit operating cost $0.17 $0.16 $26.13 $0.73 $0.78 $51.07
U. East Unit recurrent cost $15.59 $24.96 $22.05 $39.96 $51.46 $50.83Unit operating cost $0.07 $0.14 $0.18 $0.65 $0.88 $1.20
U. West Unit recurrent cost $30.26 $98.08 $22.90 $68.60 $32.89 $44.81Unit operating cost $0.58 $0.46 $0.16 $0.85 $0.95 $0.62
Volta Unit recurrent cost $56.42 $51.73 $61.68 $85.56 $83.47 $65.30Unit operating cost $0.17 $0.12 $31.03 $0.83 $0.80 $13.55
Western Unit recurrent cost $62.28 $42.26 $4.47 $170.34 $127.28 $73.05Unit operating cost $0.26 $0.14 $0.16 $2.29 $0.66 $0.75
GHANA Unit recurrent cost $45.76 $39.64 $52.19 $95.42 $82.79 $67.35Unit operating cost $0.16 $0.16 $5.65 $0.76 $7.33 $4.96
Source: MOE.Note: (I) Recurrent expenditure includes salary and non-salary operating costs. The operating
cost refer to non-salary expenditure (items 2-5)(2) Figures in italics are questionable, due to possible errors in the raw data.

Annex 3-3Cost-Benefit Analysis
Cost-Benefit Analysis: Returns to Education
Introduction
1. Of the several important investment decision criteria such as the Net Present Value(NPV), the Benefit-Cost Ratio (BCR) and the Internal Rate of Return (IRR), each with its ownrelative advantages and weaknesses, IRR has been extensively used for establishing educationinvestment priorities at the margin. It has been shown that in education projects in which thenet flow of benefit stream does not change very often, multiple rates of return rarely occur, andIRR criterion gives the same answer as NPV. The present analysis is built around thecalculation of IRR from both private and social perspectives.
Benefits of Education: Age-Education-Earnings Profiles
2. Measurement difficulties allow, among the innumerable education benefits, only thedirect monetary benefits associated with education to be brought into the cost-benefit analysis.In the case of Ghana, the data set obtained from the 1992 Ghana Living Standards Survey(GLSS3) can be used for the construction of age-education earnings profiles. It is assumed thatchildren in Ghana do not enter the labor force before age 9 and their working life ends by age 65.The data set on earnings are further classified into four groups by the educational background:illiteracy or no education, primary education (those who have completed 6 years of primaryschooling), secondary (additional 6 years of schooling beyond primary level), and highereducation (additional 4 years of schooling beyond secondary level). While this four-groupclassification is useful particularly for international comparison, earning profiles can also beobtained for five educational groups dividing the secondary into two: junior secondary andsenior secondary levels according to the current educational structure: 6 years for primary, 3years for junior secondary, 3 years for senior secondary, and 4 years for tertiary education
3. Based on the above age and education classifications , the average age-earnings profileswere derived by level of education. The results show that: (1) earnings are positively correlatedwith the level of education; (2) a profile tends to rise with age to a peak and then fall untilretirement age; (3) profiles for more highly educated individuals are steeper than for the lesseducated; and (4) the higher the level of education, the later the age at which earnings reach theirpeak (Figure 3-3-1). Although the profiles of higher educational levels lie above the lowereducational levels, there is some degree of conversion of the profiles at other levels. This is duein part to the relatively small number of observations in the sample, which places unproportionalweight on exceptional sample cases. In addition to the sample population as a whole, the age-education earnings profiles were also obtained for subgroups: male and female, poverty groupand non-poverty group, and urban and rural areas. The summary of the profiles for all agegroups is presented in Table 3-3-1.
For the purpose of this analysis, the new education structure is used considering its comparability andrelevance, instead of using the pre-1987 structure.

Annex 3-3Cost-Benefit Analysis
Figure 3-3-1. Age-Education Earnings Profilef of Ghana,1992
10,000,000 _ _ - _-_ _ -----T~~~~~~~-L7 - -- - - - -t - \-
1,000.000
-4-- No education
100,000 - Primary
- ---------------- - - --------- A Secondary
-e- Higher
_ _ es N Cn Cn t CD CD uCI I? I? I I , I
0) N 4- _- CO'_ _ D- O._ .- N N ' C t L O
Table 3-3-1. Mean earnings by subgroup, Ghana, 1992
Mean Earmings by Level(cedis)
Subgroup No educ. Primary Secondary HigherMale 136,297 190,867 314,570 938,969Female 118,655 227,406 488,867 1,466,923Poor 109,109 177,793 369,601 461,319Non-poor 143,586 233,763 386,402 1,247,228Urban 150,607 314,426 432,866 581,671Rural 115,807 169,962 213,123 796,911All 126,594 209,103 382,426 1,075,757Source: GLSS3 (1992)
Costs of Education
4. Costs of education consist of two important components: private and public costs.Private cost is defined as that part of the investment in education which is incurred either by thepupil or by his/her parents/guardian or by both. The private costs consist of two major elements:(a) direct household costs on education including tuition fees and non-tuition costs such asexpenditure on books, stationary, transportation, uniformns, and meals; and (b) opportunity cost,also known as "foregone earnings" that would have been earned had the pupil not attendedschool. Foregone earnings have been derived on the basis of the age-earnings profilesconstructed from the GLSS3 data. In contrast, the public costs include the spending oneducation by the public sector at large. The average earnings by level of education for the wholesample and subgroups, presented in Table 3-3-1 above, can be taken as income foregone, andboth public and private unit costs of education are shown in Table 3-3-2.
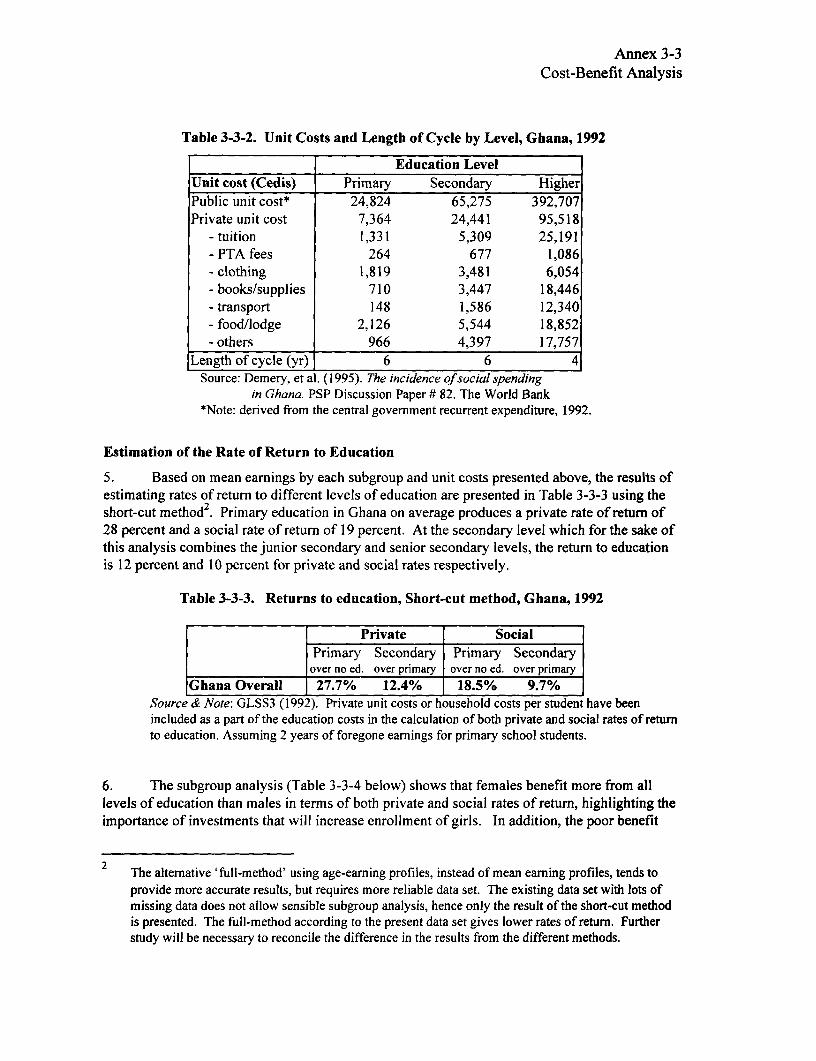
Annex 3-3Cost-Benefit Analysis
Table 3-3-2. Unit Costs and Length of Cycle by Level, Ghana, 1992
Education LevelUnit cost (Cedis) Primary Secondary HigherPublic unit cost* 24,824 65,275 392,707Private unit cost 7,364 24,441 95,518
- tuition 1,331 5,309 25,191- PTA fees 264 677 1,086- clothing 1,819 3,481 6,054- books/supplies 710 3,447 18,446- transport 148 1,586 12,340- food/lodge 2,126 5,544 18,852- others 966 4,397 17,757
Length of cycle (yr) 6 6 4Source: Demery, et al. (1995). The incidence of social spending
in Ghana. PSP Discussion Paper # 82. The World Bank*Note: derived from the central government recurrent expenditure, 1992.
Estimation of the Rate of Return to Education
5. Based on mean earnings by each subgroup and unit costs presented above, the results ofestimating rates of return to different levels of education are presented in Table 3-3-3 using theshort-cut method2 . Primary education in Ghana on average produces a private rate of return of28 percent and a social rate of return of 19 percent. At the secondary level which for the sake ofthis analysis combines the junior secondary and senior secondary levels, the return to educationis 12 percent and 10 percent for private and social rates respectively.
Table 3-3-3. Returns to education, Short-cut method, Ghana, 1992
Private SocialPrimary Secondary Primary Secondary
over no ed. over primary over no ed. over primaryGhana Overall 27.7% 12.4% 18.5% 9.7%
Source & Note: GLSS3 (1992). Private unit costs or household costs per student have beenincluded as a part of the education costs in the calculation of both private and social rates of returnto education. Assuming 2 years of foregone earnings for primary school students.
6. The subgroup analysis (Table 3-3-4 below) shows that females benefit more from alllevels of education than males in terms of both private and social rates of return, highlighting theimportance of investments that will increase enrollment of girls. In addition, the poor benefit
2 The alternative 'full-method' using age-earning profiles, instead of mean earning profiles, tends toprovide more accurate results, but requires more reliable data set. The existing data set with lots ofmissing data does not allow sensible subgroup analysis, hence only the result of the short-cut methodis presented. The full-method according to the present data set gives lower rates of return. Furtherstudy will be necessary to reconcile the difference in the results from the different methods.

Annex 3-3Cost-Benefit Analysis
considerably more from primary education than from any other level of education, suggestingthat interventions for increasing the poor's access to primary education will have high payoffs.Compared with people in rural areas, people living in urban area show higher returns to all levelsof education except higher education, mainly due to job opportunities in urban areas.
Table 3-3-4. Returns to education by subgroup, Short-cut method, Ghana, 1992
Subgroup Private SocialBy Gender Primary Secondary Primary SecondaryMale 17.2% 9.6% 11.7% 7.3%Female 38.6% 17.3% 25.3% 13.7%By Poverty StatusPoor 26.2% 15.8% 16.7% 12.0%Non-poor 27.2% 9.9% 18.8% 7.9%By LocalityUrban Area 47.4% - 33.1% -
Rural Area 19.6% - 12.8% -
7. Mincerian method. The findings in the short-cut method is largely consistent with theresults using the semi-log earning function specification, developed by Mincer. The coefficienton years of schooling can be interpreted as the average private rate of return to one additionalyear of education, regardless of the education level to which this year of schooling refers. Again,there are higher returns to one additional year of schooling for females than males. TheMincerian method, however, gives different results on the rural-urban investment preference:people in rural areas have somewhat higher returns than those in urban areas, suggesting thattargeting on rural areas would have a relatively higher pay off than on urban areas.
Table 3-3-5. The coefficient on years of schooling: Mincerian meanrate of return, by gender, poverty status, and locality, 1992
Group Mean years Coefficientof schooling (percent)
By GenderMale 6.4 9.3Female 5.8 10.6By Poverty StatusPoor 5.2 9.4Non-poor 7.1 9.3By LocalityUrban 7.4 8.0Rural 5.3 8.9Overall 6.1 10.5
Source: GLSS 3 (1992)
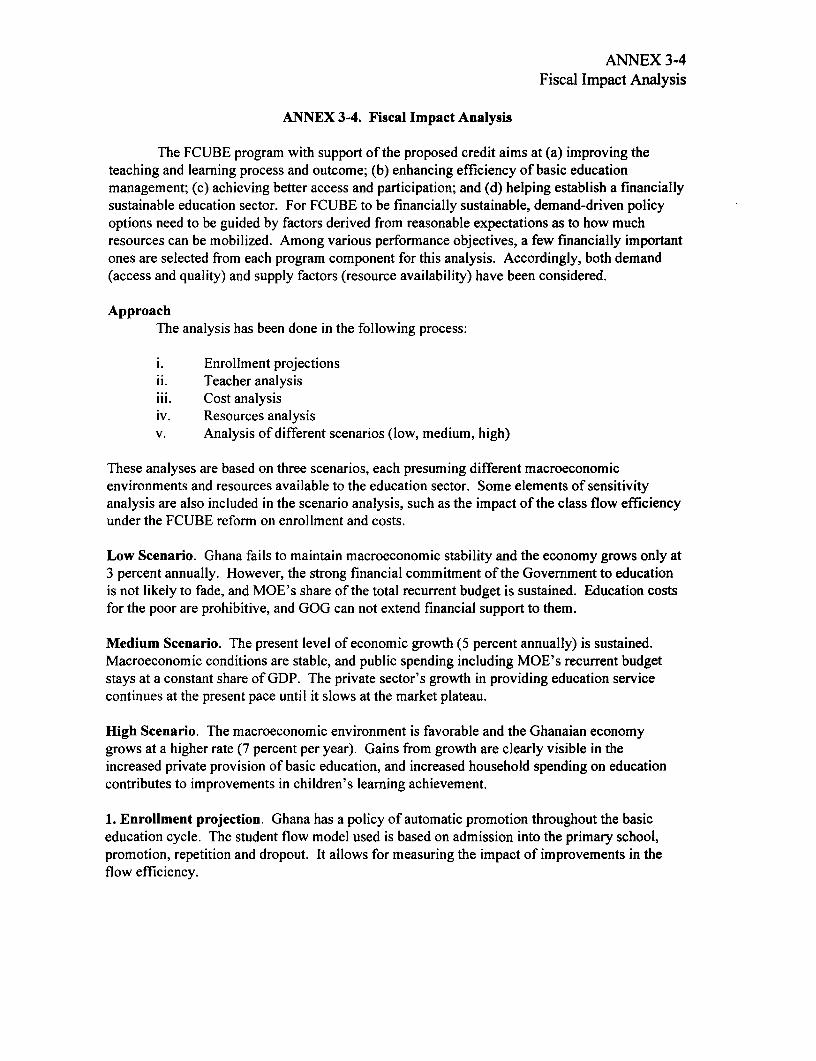
ANNEX 3-4Fiscal Impact Analysis
ANNEX 3-4. Fiscal Impact Analysis
The FCUBE program with support of the proposed credit aims at (a) improving theteaching and learning process and outcome; (b) enhancing efficiency of basic educationmanagement; (c) achieving better access and participation; and (d) helping establish a financiallysustainable education sector. For FCUBE to be financially sustainable, demand-driven policyoptions need to be guided by factors derived from reasonable expectations as to how muchresources can be mobilized. Among various performance objectives, a few financially importantones are selected from each program component for this analysis. Accordingly, both demand(access and quality) and supply factors (resource availability) have been considered.
ApproachThe analysis has been done in the following process:
i. Enrollment projectionsii. Teacher analysisiii. Cost analysisiv. Resources analysisv. Analysis of different scenarios (low, medium, high)
These analyses are based on three scenarios, each presuming different macroeconomicenvironments and resources available to the education sector. Some elements of sensitivityanalysis are also included in the scenario analysis, such as the impact of the class flow efficiencyunder the FCUBE reform on enrollment and costs.
Low Scenario. Ghana fails to maintain macroeconomic stability and the economy grows only at3 percent annually. However, the strong financial commitment of the Government to educationis not likely to fade, and MOE's share of the total recurrent budget is sustained. Education costsfor the poor are prohibitive, and GOG can not extend financial support to them.
Medium Scenario. The present level of economic growth (5 percent annually) is sustained.Macroeconomic conditions are stable, and public spending including MOE's recurrent budgetstays at a constant share of GDP. The private sector's growth in providing education servicecontinues at the present pace until it slows at the market plateau.
High Scenario. The macroeconomic environment is favorable and the Ghanaian economygrows at a higher rate (7 percent per year). Gains from growth are clearly visible in theincreased private provision of basic education, and increased household spending on educationcontributes to improvements in children's learning achievement.
1. Enrollment projection. Ghana has a policy of automatic promotion throughout the basiceducation cycle. The student flow model used is based on admission into the primary school,promotion, repetition and dropout. It allows for measuring the impact of improvements in theflow efficiency.

ANNEX 3-4Fiscal Impact Analysis
Results of enrollment projections are affected by policy decisions on giving priority to quality-improvement or enrollment expansion. Ghana's choice of quality improvement as a priority issound, especially if we take into account the interaction between improvements in the quality ofeducation and increases in enrollment. However, the quality emphasis requires increasingcontribution by the private sector to education service delivery, which in turn requires economicenvironments favorable to private sector growth. The following table gives the enrollmentprojections under the medium case scenario based on the combination of the policies that aredescribed in the following page.
Enrollment: Medium Case Scenario
1994 2000 2005(base*)
Primary school age pop. (6-11) 2,836,772 3,487,117 4,141,601enrollment: public 1,920,803 2,524,360 3,574,412
private 233,843 357,155 579,919gross enrollment ratio 76.0% 82.6% 100.3%admission rate into PI 82.5% 94.0% 108.8%
Jr. Secondary school age pop. (12-14) 1,177,493 1,447,440 1,719,104enrollment: public 659,851 865,847 1,188,108
private 30,707 110,974 170,489gross enrollment ratio 58.7% 67.5% 79.0%
2. Teacher analysis. The annual net increase in the teaching force is derived from the numberof new teachers recruited, teacher attrition rate, and a redeployment of administrative staff withteacher's qualifications back to schools. The number of new recruits is decided by severalfactors: a pupil-teacher ratio as a monitoring reference, TTCs' supply capacity, actual TTCgraduates who take teaching posts, and the impact on the wage bill. The analysis indicates thatannual recruitment of some 4,000 new primary teachers would be appropriate over the FCUBEperiod, while for junior secondary, the number needs to be raised gradually from the presentlevel of 1,100 to 1,900. MOE should make efforts not to enlarge the size of the teacher salaryenvelope beyond the rate of the overall real MOE budget increase. Given the present level of"waste" in graduates, supply capacity of the existing TTCs is not taken as fully and efficientlyutilized, hence no additional TTCs need to be constructed in the medium term.

ANNEX 3-4Fiscal Impact Analysis
Summary of Scenario Analysis
Scenario Low Medium HighAverage GDP growth rate 3 % p.a. 5 % p.a. 7 % p.a.MOE budget growth rate 3 % p.a. 5 % p.a. 7 % p.a.
Policy Guidelines / Key AssumptionsGrowth rate of school-age 1994:3.5% constant 3.5% 1994: 3.5%
(6-1 1) population 2005: 4.0% 2005: 3.2%................................................................................................................ .............................................. .. .......................................P1 public intake growth 1996: 4 % 1996: 4 % 1996: 4 %
2000: 3% 2000: 7% 2000: 8%2005: 3% 2005: 5% 2005: 8%.............................I................................................................................... .............................................. ..........................................
PI private intake growth 1996: 10 % 1996: 10 % 1996: 10%2005: 5% 2005: 8% 2005: 15%................................................................................................................ ........................ ...................... .........................................
Flow rate improvement constant repeaters/dropouts same asdecrease by 10.0% Medium
yearlyAve. teacher salary real constant 2.0% p.a. 3.0% p.a.
growthRecurrent non-wage budget constant 10.0% p.a. 10.0% p.a.
real growth............................ ; ~ ;............................................... ........................ .....................................I......... ..........................................DACF on education 10.0 % p.a. 20.0% p.a. same as Medium
real growthDemand for additional school primary: 12057 primary: 17933 primary: 18351
facility(public, 96-00) jr. Sec.: 5455 jr. Sec.: 6866 jr. Sec.: 6866
IMPACTSPrimary GER in 2005 75.2 % 100.3 % 111.1 %JSS GER in 2005 65.5 % 79.0 % 79.6 %........................... ............................................................................. .............................................. ..........................................Basic Education Costs 1996-00: 1,252 1996-00: 1,351 1996-00: 1,445
$ mil 2001-05: 1,404 2001-05: 1,522 2001-05: 1,871Basic Education Financing 1996-00: 1,062 1996-00: 1,121 1996-00: 1,175
(excluding donors) $ mil 2001-05: 1,245 2001-05: 1,404 2001-05: 1,668BE Financing Gap 1996-00: 190 1996-00: 230 1996-00: 270
(without donors) $ mil. 2001-05: 159 2001-05: 118 2001-05: 203... ...................................................................................................... .............................................. ..........................................Number of BE teachers same as 2000: 113,524 same as
Medium 2005: 129,078 Medium................................................................................................................ .............................................. .........................................Pupil/Teacher ratio 2000: 29.1 2000: 31.5 2000: 31.7
Primary (public) 2005: 29.7 2005: 39.0 2005: 41.2P/T ratio 2000: 24.9 2000: 26.1 2000: 26.1
JSS (public) 2005: 26.3 2005: 31.8 2005: 31.9Class/classrm ratio 2000: 1.4 2000: 1.4 2000: 1.4
Primary (public) 2005: 1.4 2005: 1.3 2005: 1.3Class/classroom ratio 2000: 1.3 2000: 1.3 2000: 1.3
JSS (public) 2005: 1.3 2005: 1.3 2005: 1.3
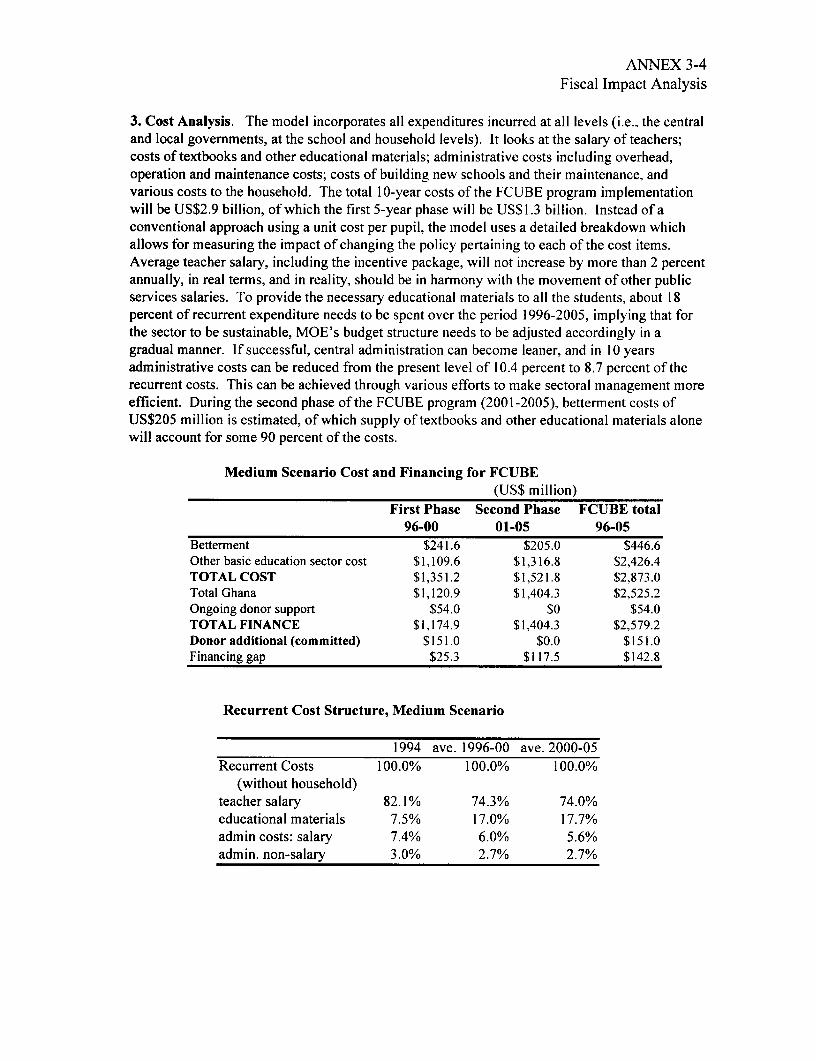
ANNEX 3-4Fiscal Impact Analysis
3. Cost Analysis. The model incorporates all expenditures incurred at all levels (i.e., the centraland local governments, at the school and household levels). It looks at the salary of teachers;costs of textbooks and other educational materials; administrative costs including overhead,operation and maintenance costs; costs of building new schools and their maintenance, andvarious costs to the household. The total 10-year costs of the FCUBE program implementationwill be US$2.9 billion, of which the first 5-year phase will be US$1.3 billion. Instead of aconventional approach using a unit cost per pupil, the model uses a detailed breakdown whichallows for measuring the impact of changing the policy pertaining to each of the cost items.Average teacher salary, including the incentive package, will not increase by more than 2 percentannually, in real terms, and in reality, should be in harmony with the movement of other publicservices salaries. To provide the necessary educational materials to all the students, about 18percent of recurrent expenditure needs to be spent over the period 1996-2005, implying that forthe sector to be sustainable, MOE's budget structure needs to be adjusted accordingly in agradual manner. If successful, central administration can become leaner, and in 10 yearsadministrative costs can be reduced from the present level of 10.4 percent to 8.7 percent of therecurrent costs. This can be achieved through various efforts to make sectoral management moreefficient. During the second phase of the FCUBE program (2001-2005), betterment costs ofUS$205 million is estimated, of which supply of textbooks and other educational materials alonewill account for some 90 percent of the costs.
Medium Scenario Cost and Financing for FCUBE(US$ million)
First Phase Second Phase FCUBE total96-00 01-05 96-05
Betterment $241.6 $205.0 $446.6Other basic education sector cost $1,109.6 $1,316.8 $2,426.4TOTAL COST $1,351.2 $1,521.8 $2,873.0Total Ghana $1,120.9 $1,404.3 $2,525.2Ongoing donor support $54.0 $0 $54.0TOTAL FINANCE $1,174.9 $1,404.3 $2,579.2Donor additional (committed) $151.0 $0.0 $151.0Financing gap $25.3 $117.5 $142.8
Recurrent Cost Structure, Medium Scenario
1994 ave. 1996-00 ave. 2000-05Recurrent Costs 100.0% 100.0% 100.0%
(without household)teacher salary 82.1% 74.3% 74.0%educational materials 7.5% 17.0% 17.7%admin costs: salary 7.4% 6.0% 5.6%admin. non-salary 3.0% 2.7% 2.7%
ANNEX 3-4Fiscal Impact Analysis
4. Financing Analysis. All domestically available financial resources are included in thissubmodel: the central budget, intergovernmental transfers, local government's own generatedfund, and contributions from households. MOE's budget is assumed to grow at the same pace asthe country's economic growth. Internal allocation of the budget is considered to remainunchanged because basic education's receipt of 65% of the recurrent budget is already favorable,and increasing pressure is expected on the secondary and higher levels of education as a result ofimproved basic education. Gradual reallocation within the basic education subsector willbecome necessary as the relative demand for junior secondary education increases. The totalresources domestically available to fund the FCUBE program over the period 1996-2005 will beUS$2.6 billion, and US$ 1.1 billion for the first phase. Funds to be mobilized externally are nottaken into account in here, and will be used to help fill the financing gap. Allowing furtherincreases in the average teacher' salary, even marginally from 2 to 3 percent annually, is justifiedonly under the higher economic growth scenario in which more GOG budget for the educationsector will be available relative to the low and medium scenarios. Under the Medium Scenario,the combination of policy options requires additional US$176 million over the period 1996-2000, annually US$40 million on average, to be mobilized externally. Of this additionalresource requirement, US$151 million has been already committed so far by the programcofinanciers including UNICEF, USAID, ODA, and Germany, and EU and the governments ofJapan and Norway have indicated their interest in contributing to the program. The proposedIDA credit is expected to contribute US$ 50 million.
In all scenarios, even though adequate capital costs for additional intake are estimated,still about 30 percent of classes will have no classroom of their own. This requires continuingthe double-shifting, particularly in densely populated areas.
Overall, Ghana's FCUBE objectives of quality improvement and universalizing basiceducation are attainable, for the primary level within the coming 10-year period, and up to thejunior secondary level by the year 2010. Toward the end of the 10-year program, different setsof policies will be warranted to ensure financial sustainability. These include, among others, areview of policies on the intra-sectoral allocation of resources, annual demand for new teacherrecruitment, and adequate arrangement to continue the provision of educational materials whichwill become increasingly more costly.

ANNEX4Page I of 11
.,., : ..j~I ,. A,,,wt +,- ................t*. MINISTRY OF FINANCEt.... .A ~,.ld ~.s.*P.O. BOX M 40
ACCRA
; lPUMULIC OF CTIANA
PLAN FOR FREE, COMPULSORY AND UNIVERSALBASIC EDUCATION (CUBE) PROGRAMME, 1996 -2005
LEITER OF BASIC EDUCATION DEVELOPMENT POLICY
MR JAMES WOLFENSOHNPRESIDENTTHE WORLD BANKWASHliNGTON, D.C. 20433
Dear Mr Wolfensohn.
GHA.NA: FREE, COMPULSORY AND UNIVERSAL BASIC EDUCATIC)NPROGRAMME: 1996-2005; LETTER OF BASIC EDUCATIONDEVELOPMENT POLICY
I am writing to you in connection with the proposed International DevelopmenrAssociation (IDA) Basic Exucation Sector Isnprovement Credit which is designed Lo
assist all young Ghanaians to receive: at least nine years of quality schooling to ensurethat, irrespective of gcnder, economic circumstance or geographic location, they lcamslills and develop attitudes that wvill enablc them to play a functional role in society asinforned and productive citizens. I would lilke to inform thc Association of the progressmade in the basic education suib.sector since the start of our cducation refonnprogramme in 1987, and give an outline of further policy initiatives that theGovernment plans to implement in this sub-sector over the next ten years.
A. Background and Goals
Basic education is the fundamental building block of any nation. Given that the loiig-term vision for Ghana is to become a middle-income countuy by the year 2020, a Ivncli-pin of thc governrnent's developmnent plan is a nation-wide. susLained effort to expand.
I

ANNEX4Page 2 of 11
suren,grhcn. and make more relevant its basic education systcm. In recognrition of this, theGovernment seeks to provide quality basic educalion (8F) for all school age ch)Idrcn assoon as is practicable.
The central goal of the BE system in Ghana is to ensure that all young people are equippedv,ith the fundamental knowledge. attitudes and skills that will enable them to be activeparticipants in and beneficiaries of national development.
The policy initiatives outlined below are the Government's response to a cons-iturionally-mandated charge. Article 39(2) c the 1992 Constitution of the Fourth Republic of Ghanastates:
The Govemment shall, within two years after Parliament first meets after cominginto force of this constitution. draw up a programme for implementation wivthin theFollowing ten years, (or the provision of free, compulsory and universal basiceducation.
B. Structure
The resrructuring of the educ2tion sysiem has been a k-ey element of the reform that srarredin 1 987. The current system consists of Primary (grades l-6); Junior Secondary (grades 7-9). togerher forming a nine-year BE cycle; followed by Senior Secondary (10-12);Technical; and several optional forms of Tertiary Education that include universities,polytechnics and teacher training colleges.
C- Financing
The Government's emphasis on the importance of education in the development process isunequivocal. The proportion of the national recurrent budget (net oi debt servicing andorher extra-budgetary items) allocated to education has increased from 31 percent in 1987ro almost 39 percent as an average over the past five years. Intra-sectoral allocation has
been increasingly in favour of BE which is currently receiving about 65 percent of MOE'srecurrent budget (up from 60 percent in 1989). Govemment resource commitments toeducation as set out in the policy document "Ghana; Vision 2020" are projected toincrease proportionately with national economic growth rates and to stay at 40 percent ofthe national budget through to 2000.
D. IKey Issues in Basic Education
Key issues in basic education in Ghana mray be care,orised into four areas:
Poor Teaching and learning ouLcomes
2

ANNEX 4Page 3 of 11
A new' education srructure has becn pul in placc. ihc propo7n0on of trainerd 5zai has grow.,ihe volume of materials and equipmenr inco the cecror has incrc_sed, and rncre scnoolzacilities have resulted in increased enrolments- Yer the reform has had limited success indclivering quality teaching and leaminir7 outcomes. Pupil achievement concinues to bevery disappointing. Reasons for weak Il-arnin- rccults include: lack of learning materials,aind even where available, teachers often do nor rnake effective use of ci ern; inadequatefunding oi non-;alary recurrent expenses: high levels of pupil and teacher absenirneism,inefficient use of teacher. pupil instructional contact hours; outmoded pre-s-ervice teachertraining and inadequate in-service teacher development; unmorivated teachers owing tounataractive incentives, ineffective sanctions and low social status of .eachers; an overlyambitious curriculum, burden-some to boch teachers and pupils; and lack of suitablephYs5cal facilities in many locations.
Access and Gcnder Sias
Across the country, conspicuous dispariry exists in access to basic education servicesbetween boys and girls, rhe rich and thc poor, and arnong geographic regions. 8E issupposed to be tuition-free and open to all Currentiv. insufficient access. poor quality andfinancial consrraints make the policy more of a promise than a reality. Nominal grossenrolments at the primary and junior 5econdary levels stand at 78 and 38 per centrespeciively of the relevant age cohorts. There are also equity concerns. Enrolments in thenorthern regions are up to 30 per cenr lower than the national average. In some areas,girls comprise only 35 per cent of primary and as little as 28 per cenr of junior secondaryenrolments. Aithough primary enrolmenrs have grown by about 25 percent since thereform programme began, expansion has come without the requisite improvement in thequality of teachin- and leaming. Furthermore, the expansion has not been rapid enough rokeep up with the pace of the school-age population growth resulting in a stagnating oreven declining rarios oi BE gross enrolment. Insufficienr infrastructure, family poverty,unavailability of teachers and geographic isolation all coincide to form a complex web ofdrsadvantage.
Inappropriate Management Structures and Weak Management Capacity
Effective managernent within the educarion sector depends upon rhe managementcapabilities of the central Ministry, the GES. the districrs and the schools thnem5elves. WithGovemment firmly cornmitted to the process of decentralisacion of administration oi publicsecior institutions, including education. capabilities have to be improved to meet Therequirements of a system under which discricis and communities themselves will haveenhanced responsibility and authority to improve the quality of and participation ineducation at the school level. However, incomplete and unclear transfer of authority, lac:-:of clarity in job descriptions, ineffective ;uff posting procedures, inadequate planning,nmonitoring and evaluation, and inadequarely trained scaff at all levels of rnana,ement have2l conrribured to harnperina the effcc-ive crriplen,entra7on of decenrr.rlrsacinn pcbCiv.

ANNEX 4Page 4 of 11
Critical rnanagement issues are to be addressed: ihe managerient siruciure of 0F-S thatremains "rop heavy with rnany leveis o1 management and with sorne duplication vffunctions amonc headquarrers, regions and districts; tnadequacies in [hp supervision cdschools and the limitation of disciplinary processes that seriously undermine effectivereachins,; data essential for planning and resource utilisation ihat are reported in .a m.anne,of little practical utiliry; coo tew capable managers it all levels of the GES; personnclemoluments that absorb a very high proporsion of the recurrent budger leaving very limrivdresources at the district and school level ro improve qualicy; few incentives available toteaching anc? adminisTrative staff to encourage and reinforce good performance; and lack ofcommunity participation in school governance.
Inadequatc Resource Mobilisation and Inefficient Util;sation
The education sector has been receiving about 39 percent of Government's discretionaryrecurrent budget; and around 3 percent of the development (capital investrmentprogramme) budget. The expenditure side has been constantly affected by uncertainties insalary raises and number of staff on the payroll. MOE's actual expenditures have beenoverrunning the budget, but nearly the entire overrun can be attributed to salary relatedexpenses. The absence of a reliable and timely expenditure monitoring system is partlyresponsible for this.
Furthermore, internal resource allocation within the basic education sub-sector is heavilyinfluenced by the sheer size of the wage bill. Of the total MOE/GES expenditures,personnel emoluments account for 85 percent. When looking at school-level basiceducation expenditure, around 98 percent of the national recurrent allocation is absorbedby the salary related costs and only the tiny remainder is available for teaching/learningmaterials, school operation and maintenance.
11 ELEMENTS OF THE BASIC EDUCATION INITIATIVE
A. Strategic Framework
The Govemment's recently announced Free Compulsory Univer5alf Basic Education(FCUBE ) Programme addresses Three major goals.
Qjalivy Imorony-menr of F cervics will enable the rnajority of BE 1-9 pupils to meet,Acceptable standards of performancc; reduce repetition and dropout rates; increase the BEcompletion rare as well as the pass rate for admission into second cycle senior secondarvand technical) insrirutions.
,M.nagm ilaccj o; thrn uucarlQn Svsrirm will be improved along severald:rnwenS.oni S',;em nariaceneri, will bc strengThened and streamlined overall, wiir
I

ANNEX 4Page 5 of 11
rmcreasng cielegation of decisori-rriakiti- Atihorily and respoiib iloy To she di.rri, r .ndschool levcfs.
Acces_toqjnd paririrpatjin in ha;iC edLucation services will be cxparnded progressivelv forall school-a-e children, but especially for girls and for pupils from disadvantaged areas.Alternativc service delivery arrangements to the traditional model will be piloted. Orie orthe most important lessons leamed since the current education reform programme is thatcontinuing to expand access to basic education and to increase physical inputs Into thesystem are not effective unless the qualiry of activities at the school level improvessi-nificantly.
B. Key Components
The Government affirms that quality improvement will receive the highest prioriry in theFCUBE initiative. All activities under the Programme will cover a 10-year period fromI 996-2005. and will be implemented in two 5-year phases. This initiative is the soleprogramrne for basic education improvement in Ghana, and will embrace all current andfuture acrivities supported from national and external funding sources. The Programme iscomposed of three components which will be implemenred in a comprehensive andcarefully integrated fashion.
1. Imgroving rhe Qualiry of Teaching and Learning
The pedagogical improvement component will promote effective teaching by enhancingspecific teaching skills through pre-service and mainly school-based in-service trainingprogrammes, and bv improving teacher morale and motivating staff through a teacherincentive programme. Improvement in rhe quality of leaming and student performancewill be promoted through curriculum review and adaptation; the reprinting of existing andproduction of new learning materials, syllabuses and teachers handbooks; and the regularmccsccmant of pup;l porformrxanco to inforrr tachrr., parontr 3fnd pupdlt rhemeal_koc oi t&cirprogress and to provide objective measures to evaluate basic education.
Key elements include
a) Strengthening capabilities in curriculum and learning materials developrnent,procurement, distribution and resupply;
b) Ensuring that the curriculum is pedagogically sound, re!evant andimplernentable in all basic schools;
cJ Designing and irnplementing a cost-effective textbook production anddistributiorn sysrem that will ensure universal coveragc of texts in all subjects andtra.ides for every student:

ANNEX 4Page 6 of 11
d) Introducing low-cost reacher training and pupil instruction arrangtements u5:ing
distance education cechnology.
e) Restructuring both pre- and in-service teacher craining and insisting on highc;rstandards of teacher cerriiication, including more emphasis on classroom-basedexperiences;
2. Imoroving mannagemont Fffiienry
The overall objective of this component is to improve both the eFficiency and effecEivcnes,oi the Ministry of Educarion (MOE) and the Ghana EducaLion Service (GES) throughmanagerial reform. In order to ensure that new and existing resource invesemcnts arewisely allocated and effectively utilised, activities will be focused on bringing greaterdiscretion, discipline and accountability to schools, thereby increasing reachingeffectiveness. The component will also increase the timeliness, accuracy and relevancy ofdata to be used for monitoring pcrformance at the district and school levels. I here will betargeted interventions to improve instruction and student 2chievement and to achieve amore rational and equitable allocation of resources For inirastrucrure, materials, andpersonnel.
This component will be implemented in three stagces whichi, alrthough conceptuallydistincr, in practice will overlap.
Key elements include:
a) Redesigning management srruatures which suit the roles and responsibilities orthe MOE and the CES at headquarters, regional and district leve!s and which providefor appropriate delegation on operational maters;
b) Improving mechanisms for monitoring performance at the district and schoollevels and performance standards and targets for all agencies linked to the strategicgoals of FCUBE;
c) Installing an Education Management Information System (Eh415) to collect,analyse, process and report educational data for planning, decision making andmt;nitoring purposes;
d) Strengthening personnel management practices which motivate individuals,groups and departments throughout the sysrern towards achieving berrerperrormances;
6

ANNEX 4Page 7 of 11
e) Upg-ading rinancial management systems developed which improve budgetingand financial control and generate information to support the delegation of budgetaryrespos ibil;Iy; and
r) Staff,ing or-anisation structures at all levels with appropriately trained andqualfied managers and having adequate discretionary budgets in place to ensure thatrhe financ.al resources available can make significant impact on the quality ofeducation.
3. Imkrov'rz Accezs and ParcicoPtian
The quanrtiative expansion and enhanced participation component will promote widercoverage of basic education services by applying selection criteria for building newschools; replac,ng schools with poor infrastructure; expanding overcrowded schools;rehabilitating school physical infrastructure; providing houses for additional teachers; andby developing alternative delivery mechanisms. Measures to increase demand for basiceducation will receive special attention. Girls, poor and rural children will be targeted.FCUBE will use a variety of approaches to increase access to schooling by girls and under-represented groups including Infrastructural development and rehabilitation. Optionsinclude: the provision of scholarships; incentives for female teachers and teachers inremote areas; a pilot scheme to enable rural communities to hire local teachers; anemphasis on gender equity and sensitivity in materials and in training programmes; and theuse of Participatory Learning Appraisal methodologies in selected regions to encouragecommunity involvement in and understanding of the need for schooling. On the supplyside, MOE will first examine and rationalise the use of existing resources. The challenge ofmeeting the increased demand for facilities and services will be tackled from twoperspectives: using existing school facilities to maximum effectiveness; and targeting newinfrastructure to those places where careful investigation has shown there to be mostbenefit in providing increased access.
Key elements include:
a) Strengthening School Management Committees;
b) Improving mechanisms for consultation with District Assembly committees oneducation to ensure the appropriate allocation of funds to basic education, and itsdeployment in an equitable manner;
c) Enhancing the system for stakeholder consultation to provide feedback onprogress towards programme goals;
d) Operating a school improvement fund which will be directly accessible toschools; and
7

ANNEX4Page 8 of II
e) a social marketing campaign to promote education, including anemphasis on the benefits of girls education.
III FINANCING POLICIES
The Government will continue to provide at least the same percentage af thediscretionary recurrent budget to education sector each year during 1996-2000as it has provided over the past five years. Within the education sector,allocation to basic education sub-sector will be maintained at the present level,although the distribution between primary and junior secondary levels willchangeover time.
The Government's FCUBE financing plan is the key reference document fornational resource mobilization and its effective use for BE. The plan entailsvarious quantitative "floor level targets' which were summarised in the tablebelow. Actual resources mobilized and spent, as well as the policy targets willbe monitored regularly, and possible adjustments willbe discussed at regularreview meetings of the financing partners.
Implementation of FCUBE, in particular through improving personnel, educationperformance and financial management, will generate efficiency gains that willresult in savings in the budget. An understanding has been reached between theMinistries of Finance and Education that MOE will implement the financialmanagement strategies outlined in its policy document to ensure sound financialpractices. This will allow MOE to re-allocate the approved budget within therecurrent and capital/development activities respectively.
For the quality of basic education to be assured, the number of teaching staff willneed to be increased as enrollments grow. The Government will make everyeffort to ensure that total number of staff and overall salary expenditure for theGhana Education Service (GES) staff will be consistent with the FCUBE financingplan and national public sector salary guidelines. The ratio between thenumber of teachers in schools and GES administrative staff in the system as awhole (including GES staff in administrative posts) is presently 4.8:1. This figurewill be monitored so that the overhead cost of adminstration will be reduced byshifting the balance in favor of teachers in the classroom.
Provision and maintenance of school facilities are the responsibility of localgovernment. Apart from earmarked external aid support and the nationalyprovided District Assembly Common Fund (DACF), resources are mobilized atthe district and school levels but are far from adequate. The Government willencourage district authorities to increase the proportion of spending from DACFfor basic education steadily not only to the present guideline figure of 10% buteven beyond. Levies collected at the district and school levels must accord withthe MOE guidelines. The Government will undertake to delegate progressivelyfinancial management discretion to designated districts having viable educationplans and administrative systems, and will consider compensatory measures
8

ANNEX 4Page 9 of 11
where districts still face financial problems even after making an adequate fiscaleffort.
The Government maintains its policy that tuition for basic education is free forchildren and parents/guardians. However, for the attainment of FCUBEobjectives, and for securing a heightened commitment and sense of communityownership of schools, it is necessary that beneficlaries of basic educationservices continue to contribute to direct and indirect costs other than tuition.
As part of the FCUBE objectives, target enrolments in private schools willincrease from the present 10.7% for the primary level to 14% by 2000 and 16%by 2005, and from 3.0% for the junior secondary level to 6.6% by 2000 and16% by 2005. For the time being, Government will continue the present policyof providing the textbooks and some teachers to private schools. Meanwhile,there will be a study on appropriate measures to subsidise the private sector,considering the implementation for financial sustalnability of the educationsystem as a whole.
Basic Education Sector Performance Monitoring indicators Phase 1: 1996-2000
miditerm Dec. 2000_(ul. 1998)
Financial Commirmient and Sus-tainiabilityShare of MOE/COG budget 38.8% (min.) 38.8% (rnin.)Share of gasic Educ. (BE)/MOE budget 65% 65%Annual real increase in BE non-salary spending 10% 10%Annual growth rate of average GES staff salary 2% (max.) 2% (max.)A.vcraSe per pupil MOE spending by district t.b.m. r.b.m.Average district spending from DACF on basic educ. 10.5% 15 0%
Enhanced Quality of Teaching and LearningStudent Achievernent (CRT) t.b.m. r.b.m.Teacher absenteeism (year-on-year improvement) t.b.rn. r.b.m.Pupil/texrbook ratio, core subjecrs. Primary & JS 2:1 .:1PupiVteacher ratio, P&IS P- 29.7 P:3 1.5
JS:24.8 JS:26.1
Management for EfficiencyNumber of teachers in public schools2, P&JS P. 75177 P: 802 18
JS:32358 15 33206Number of administrative staff as % of above r,b.1ri. r.b.m.Niumber of SMC established (1% of t of schools; 40% 70%N umber of DEOC establtshcd l% of ^ oi dis;rics) 60 1 O0-"..Number oidistricrs with financial authoriry t.b rrm. r.b.n
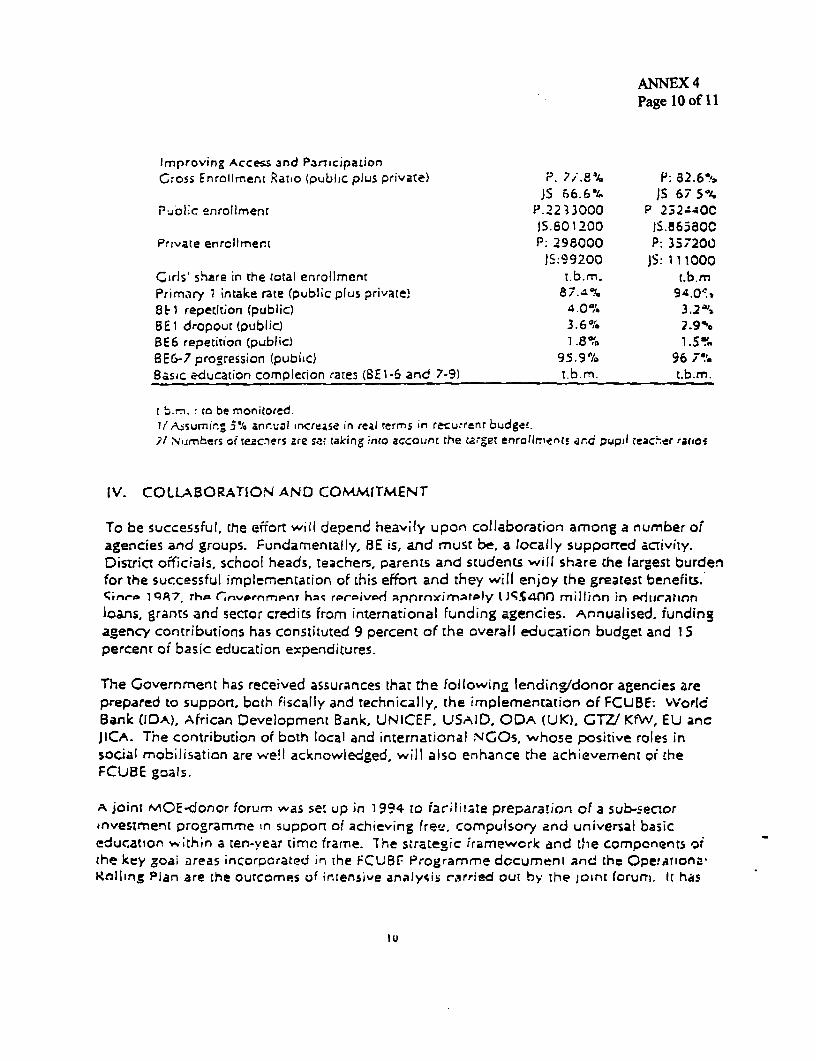
ANNEX 4Page 10 of 11
Improving Access and Pas-icipa:ionC;oss Enrollment Ratio (public plus private) P. 7/.8% P: 82.6%
JS 66.6 1% IS 67 5%Pidlic enrollment P.2213000 P 252.'40C
JS.50 1 200 IS.a6580CR-rvate enrollment P: 298000 P: 337200
)5:99200 Js: 1 11000Girls' share in the total enrollment r.b.rn. t.b.mPrimary I intake rate (public plus private) 87.4°a% 9g4.0%8b1 repetition (public) 4.0C. 3.2 BE1 dropour (public) 3.6% 2.9%BE6 repetition (public) LB% 1.5%BE6-7 progression (pubiic) 95.9% 96 7%Basic education complecion rates (BE 1-6 and 7-9) t.b.m. t.b.m.
t b.rn. to be monitored.7/ A sumin,g 5 % anr.ual increase in real terms in recurrenr budge!.7/ Numbers of teacners are s5 taking into accoint tlhe targer enrollmenis and pupil teac.er raIjo
IV. COLLABORATION AND COMMITMENT
To be successful, (he effort will depend heavily upon collaboration among a number ofagencies and groups. Fundamentally, BE is, and must be, a locally supporred activity.District officials, school heads, teachers, parents and students will share the largest burdenfor the successful implem.entation of this effort and they will enjoy the grealest benefits.fineo- 1 QA7 rhn rnivornmPnt Kha rir ivad ;%nrnrirnqPtly tJ1;$4nrl million in sdiiratlnnloans, grants and sector credits from international funding agencies. Annualised. fundingagency contributions has constituted 9 percent of the overall educaTion budget and 1 5percent of basic education expenditures.
The Government has received assurances thar the following lendingfdonor agencies areprepared to support. both fiscally and technically, the implementation of FCUBE: WorIcBank (IDA), African Development Bank, UNICEF. LISAID. ODA (UK). GTZ/ KfW, EU ancJICA. The contribution of both local and international NGOs, who5e positive roles insocial rnobilisation are we!l acknowledged, will also enhance the achievement o; theFCUBE goals.
A joinT MOE-donor forum was set up in 1994 To farililate preparation of a sub-sec.orinvestment programrne in support of achieving frete. cornpulsory and universal basiceducation within a ten-year timc frame. The strategic framework and the components orthe key -oai areas incorporated in the FCUBF Programme document and che Operationa'Rolling Plan are the outcornes of inlensive analy4is r.-rried out by the joinr forum. Ir has
'u

ANNEX 4Page 11 of 11
been agreed among MOE and funding agencies that FCUBE will: cover the etntil-Cpnmnary and junior secondary sub-sectors including all on-going and planned additionalactivitics; be implcinented within the agreed strategic frameworkc; and be used bv MOEto co-ordinatc all donor support which- must be dcployed withlin the parameters or tlwprogramme framework and tle rolling plan.
In the final analysis, the succCss of this iniLiative will be a function of the willingness andability of diverse groups to w,ork together to mobilise resources, refine policies. planrationally and efficiently, implement effectively and evaluate with rigour and insight. Allof thesc skills are necessary goals wc have set. The Government is confident that Avithlcollaboration and commitment from our partners in this Programmiie, the benefitsFCUBE will be rcalised progrcssively over the next decade.
Yours, sincere
N KWAME PEPMINISTER
I I

ANNEX 5-1Page I of I
REPUBLIC OF GHANABASIC EDUCATION SECTOR IMPROVEMENT PROGRAM
Program Performance Monitoring Indicators Phase 1: 1996-2000
Base Year Midterm Dec. 2000(most recent) (Jul. 1998)
Financial Commitment and Sustainability"Share of MOE/GOG budget 38.5% (1995) 38.8% (min.) 38.8% (min.)Share of Basic Educ. (BE)/MOE budget 64.5% (1995) 65% 65%Annual real increase in BE non-salary spending 10% 10%Annual growth rate of average GES staff salary 2% (max.) 2% (max.)Average per pupil MOE spending by district t.b.m. t.b.m.Average district spending from District Assembly 7.3% (1994) 10.5% 15.0%Common Fund on basic educ.Enhanced Quality of Teaching and LearningStudent Achievement (Criterion Rererenced Test) t.b.m. t.b.m.Teacher absenteeism (year-on-year improvement) t.b.m. t.b.m.Pupil/textbook ratio, core subjects 2:1 2:1Pupil/teacher ratio, Primary &Junior Secondary P: 30.7 (1994) P: 29.7 P:31.5
JS:21.6 (1994) JS:24.8 JS:26.1Management for EfficiencyNumber of teachers in public schools/2, P&JS P: 62608 (1994) P: 75177 P: 80218
JS:30580 (1994) JS:32358 JS:33206Number of administrative staff as % of above t.b.m. t.b.m.Number of School Management Committee 40% 70%established (% of # of schools)Number of District Education Oversight Committee 60% 100%established (% of 4 of districts)Number of districts with financial authority t.b.m. t.b.m.Improving Access and ParticipationGross Enrollment Ratio (public plus private) P: 76.0% (1994) P: 77.8% P: 82.6%
JS: 58.7% (1994) JS: 66.6% JS: 67.5%Public enrollment P: 1920803 (1994) P:2233000 P: 2524400
JS: 659853 (1994) JS:801200 JS:865800Private enrollment P: 233843 (1994) P:298000 P:357200
JS:30707(1994) JS:99200 JS: 111000Girls' share in the total enrollment P: 46.8% (1994) t.b.m. t.b.m.
JS: 43.1% (1994)Primary I intake rate (public plus private) 82.5% (1994) 87.4% 94.0%Basic Education grade I (BE I) repetition (public) 5.5% (1994) 4.0% 3.2%BEI dropout (public) 4.9% (1994) 3.6% 2.9%BE6 repetition (public) 2.5% (1994) 1.8% 1.5%BE6-7 progression (public) 94.5% (1994) 95.9% 96.7%Basic education completion rates (BEI-6 and 7-9) BE1-6: 75.4% (1994) t.b.m. t.b.m.
BE7-9:82.4% (1994)
t.b.m. : to be monitored.1/ Assuming 5% annual increase in real terms in recurrent budget.2/ Numbers of teachers are set taking into account the target enrollments and pupil teacher ratios.

GHANA fCUBE PROGRAM: FIRST PHASE (1996-2000) SUMMARY IMPLEMENTATION PLAN SAR Annex 5-2 Page 1 4/24/96
COMPONENT ACTIVITY Q1/96 Q2196 Q3196 04/96 Q1/97 02197 Q3/97 Q4/97 Q1/98 Q2198 Q3198 Q4198 1999 20001. ENHANCED QUALITY OF TEACHINGILEARNING ___
A In-Service A1 Headteachers' Training _ _ ~~~*** *** *** *** *** *** *** *** *** *****t *****A In-Service Al Headteachers' Training ___- **fI
Training of A2 Teachers' Training **** ***** * * * ** __ **Education A3 Training of DDEs and CSs ** ******* ******* ******* ********************** ******* ****** *******Personnel A4 DistricVCommunity Leaders ***** ****** ******* ****** ****** ****** ******* ****** ***** ****** ****** ****** ****
A5 MOE/GES Planning/Mgmt (Includ ed in Component 2) . _A6 Needs AssessmentA7 Distance Learning StudyA8 Impact Evaluation _ * **
B Pre-Service B1 TTC Study ***** _Teachers' B2 Strengthen UCEW and UCC **** _ _
Training B3 Rehabilitation of Selected TTCs ******* ******* *******B4 Redesign Pre-Service ProgramsB5 Training TTC Tutors ************** ******* ******* ******* ******* ******* *******
_______________ B6 Study of Altemative Delivery__ __ _ B7 Impact Evaluation __ **
C Assessment/ Cl Revise CRT to Reflect New Curr. _ ** __ .Evaluabon of C2 Develop/Prepare Test Material ** ** ** **
Student C3 Test Administrabon ** ** **Performance C4 Analysis/Report Disseminabon -*** _ *** **
D Provision_of Dl Reprint Existing Textbooks _* * ******* ******* __Instructional D2 Distribute Reprints to Schools ** ******* ******* **Materials D3 Procure New Textbooks
= __________ D4 Distribute New Textbooks to SchD5 Procure/Distribute Sch SuppliesD6 Procure/Dist Library Books ******* ******* **** **D7 Storage Facilities in Schools ******* ******* ******* ******* -********** ** **
E Curriculum El Curriculum ReviewReview and E2 Gender Review (TA)Development E3 Syllabus Writing
E4 Write/Trial Textbooks ****** ****** ______ *E5 Strengthen CRDD ***** ***
I~__

GHANA fCUBE PROGRAM: FIRST PHASE (1996-2000) SUMMARY IMPLEMENTATION PLAN SAR Annex 5-2 Page 2 4/24/96
COMPONENT ACTIVITY 01/96 Q2/96 Q3/96 Q4196 Q1/97 Q2197 Q3/97 Q4197 01/98 Q2/98 Q3/98 04/98111999 20002. MANAGEMENT FOR EFFICIENCY
A Institutional/ Al Organization Analysis/Design ************** _ _Organizational A2 MOE/GES-DA Relations ******************** _ _ _Analysis & A3 Personnel AudiVManpower Plan **************Change A4 Reform Mgt. Unit Training
A5 Selection/Training of Snr. MgrsA6 Change Mgt Workshops ***. ****A7 School Mgt. Committees _****** ******* ******* ******* ******* *******A8 Mgt/Supervisory Training ******* ******* ******* ******* ******* *******A9 Implementation Review ** ** ** ** ** ** ** **
B Staffing & _ B1 Job Description Preparation= = *****Personnel Mgt B2 Personnel Operations
B3 AppoinVRedeploy Mgrs/Staff/HT ************** *******B4 Redeploy Teachers ******* ******* ******* *******
B5 Job Grading & Pay Structures ********__ ***
B6 Motivation/lIncentive SchemesB7 Personnel Policies/Procedures **************
B8 Mgt/Personnel Staff Training =*****
C Performance Cl Information Management ReviewManagement C2 Monitoring & Control System **************
C3 EMIS DesignC4 Performance Appraisal SystemC5 Procure/Install Hardware/SoftwareC6 Mgt/Systems Staff Training
D Budgeting Dl Resource Allocaton Formula& Financial D2 Accounting Systems ReviewManagement D3 PUFMARP Relabonship **************
D4 Accountng Systems DesignD5 Manuals/Financial DirectivesD6 Procure/Install Hardware/SoftwareD7 MgVAccounts Staff Training ******* *******
E District El DA Capacity Review ********************.
Capacity E2 GES TA to District Assemblies =__ ___ ____ o1Building E3 Performance Monitoring ******* *******

GHANA fCUBE PROGRAM: FIRST PHASE (1996-2000) SUMMARY IMPLEMENTATION PLAN SAR Annex 5-2 Page 3 4/24196
COMPONENT ACTIVITY Q1/96 Q2/96 Q3196 Q4196 Q1/97 Q2197 Q3/97 Q4/97 Q1/98 Q2/98 Q3198 Q4/98 1999 20003. IMPROVING ACCESS AND PARTICIPATION
A Infrastructure Al Review Selection Criteria * *** ** **DevelopmentV A2 Selecton/Field Verification ************ ******* ******* **Maintenance A3 Issue Maintenance Policy
A4 Design/Bidding/Contract ******* ******* *** *** *,A5 Construebon ******* ******* ******* ******* ******* ******* ******* ****** *******A6 Monitoring & Evaluation ******* ******* ******* ******* ****** ******* *******
B Increasing Girls' B1 Pilot PLA Study of Districts ********* ******* =Participation B2 Review Selection Criteria
B3 Develop Targeted Imp Plan . * **** _B4 Implementation ***** *** *B5 Monitoring & Evaluation ******* ******* ******* ********* ******* ****** ****86 Study of Scholarship Schemes _***
______________ B7 Adaptabon of STME to Basic _*__
C Schooling Cl Pilot Phase *** *******Improvement C2 Evaluabon of PilotFund (SIF) C3 Selection Criteria: 2nd Phase **
C4 Implementabon: 2nd Phase ***** *******C5 Monitoring/Evaluation: 2nd Phase *********************C6 Selection Criteria: 3rd Phase __C7 Implementabon: 3rd Phase ***** *************C8 Monitoring and Evaluation ****** ******
DIEC Dl Design IEC Strategy and Plan. ******************* = tD2 Develop Materials and Testing ******* ******* *** **** ** **D3 Dissemination of Messages ******* ******* ******* ******* ******* ******* ******D4 Build Institubonal Capacity ************** ******* ******* ******* ******* ******* ******* ******* ****** ******
D5 Impact Evaluaton **** ** **** ** | * *
0 I

ANNEX 5-3
GHANA BASIC EDUCATION SECTOR IMPROVEMENT CREDITKey Areas of Technical Assistance
1. Technical assistance will be necessary to help design and implement the BettermentActivities under the Government's FCUBE program. These include:
* redesign of pre-service teachers' training programs;* assessment and review of in-service training programs;* development of tests to assess and evaluate student performance;* study on sustainable provision of instructional materials;* curriculum review and development;* analysis and design of MOE/GES structure;* manpower planning;* design personnel policies/procedures and motivation strategy;* design and implement EMIS;* design and implement personnel performnance appraisal system;* review and design budgeting and accounting system;* develop strategy and targeted plans to increase girls' participation;* develop, implement and evaluate Schooling Improvement Fund scheme; and* develop strategy and implementation plan for IEC.
2. Local expertise where available will be used to help carry out the activities listed above.In all cases where foreign expertise is considered necessary, it is envisaged that internationallyrecruited consultants will work with local consulting teams and MOE staff to ensure technologytransfer. Training will be provided as part of the technical assistance to MOE/GES staff anddistrict education personnel to ensure effective implementation and sustainable operation of thesystems designed.
3. A large part of the technical assistance listed above are being financed under the ongoingPrimary School Development Project (PSDP) and some will be financed by other donoragencies. The terms of reference for these consultancy assignments will be included in theFCUBE Operational Rolling Plan. Terms of reference for technical assistance to be financedunder the Basic Education Sector Improvement Credit (BESIC), which is expected to beimplemented at a later stage, will be prepared as the FCUBE program develops over the next twoyears.

ANNEX 5-4Page 1 of 2
REPUBLIC OF GHANABASIC EDUCATION SECTOR IMPROVEMENT PROGRAM
Supervision Plan
Supervision of implementation will be conducted (i) under the direction of theProgram Coordinator (MOE/GES) reporting to the IOC; and (ii) by the World Bank TaskManagement Team, in collaboration with GOG and other funding partners.
I. Routine MOE/GES supervision will include initial review:(a) prior to forwarding to IDA for "no objection" of:
i. Procurement documentsii. Disbursement requests
iii. Special accounts expenditures/reimbursements and statements ofexpenses (SOEs)
(b) monthly financial statements(c) arranging for annual audits of project accounts and SOEs
II. Periodic MOE/GES supervision will involve:(a) updating the rolling implementation plan(b) preparing progress reports on project implementation(c) monitoring key performance indicators(d) liaising with the World Bank Field Office and IDA supervision
missions
III. Bank staff will spend an estimated 6 staff-weeks per annum on average atheadquarters and the Resident Mission reviewing and commenting on procurementdocuments and disbursement requests; and a further 4 staff-weeks per annum over the courseof project execution for desk work relating to progress reports and audited accounts (total of40 s.w. for the life of the Credit).
In addition, there will be field supervision (as set out below). Semi-annual reviewsof program performance will be undertaken by GOG, IDA and participating donors inJanuary/February and in June/July; the Consultative Panel (CP) Meeting for 1998 will beenhanced to become the MTR. TOR will be prepared jointly by CP members at least twomonths prior to the review date. The Jan/Feb review will focus mainly on the performanceof the preceding year and the Jun/Jul review on finalizing operational plans and financialcommitments for the coming year. The MTR will assess physical, institutional and financialprogress of the first 2 years of project implementation as measured against agreed targets.Based on the MTR, the program will be adjusted to be consistent with the targets in the lightof experience and changing circumstances.

ANNEX 5-4Page 2 of 2
IDA Supervision Input - Through To Mid Term Review
Approximate Activity Staffing StaffDate Weeks10/96 IDA Credit Task Management Team (x3)* 10
Effectiveness Education SpecialistWorkshop (blending Textbook Specialistinto ongoing prog. of Organis. Dev./Managem. Specialistactivities) Architect/Implementation Specialist
2/97 Supervision Mission Management Team (x2) 8Comm. Dev./Participation SpecialistFinancial Analyst
7/97 Annual Review Task Management Team (x3) 10(Meeting of Organis. Dev./Managem. SpecialistConsultative Panel) Curriculum Specialist
Architect/Implementation Spec.Financial Analyst
10/97 Supervision Mission Task Management Team (x3) 5Financial Analyst
2/98 Supervision Mission Task Management Team (x3) 5Comm. Dev./Participation Specialist
7/98 Mid-Term Review Task Management Team (x3) 12(Meeting of Disbursement OfficerConsultative Panel) Procurement Specialist
Education SpecialistOrganis. Dev./Management Spec.Comm. Dev./Participation SpecialistArchitect/Implementation Spec.
Notes: 1. All missions/reviews will be coordinated with similar activities by otherexternalfunding agencies
2. (*) Task Management Team includes Educational, Financial Analysis andImplementation expertise (Team composition will depend on the TOR fora particular mission)
3. Field Supervision through to: MTR = 50 s.w.; End of Credit = 80 s.w.

ANNEX 5-5Par!e 1 of 2
REPUBLIC OF GHANABASIC EDUCATION SECTOR IMPROVEMENT CREDIT
PROCUREMENT AND DISBURSEMENT SCHEDULES
1. Procurement Implementation ScheduleEstimated Annual Contratual and Other Payments (USS million equiv.)
N.v ; 225- - E o ......r. . t . .
Credit TimingSigning xEffectiveness xClosing x
Activities by Category
1. civil Works 0.03 1.61 3.29 4.85 2.92 12.70 ICBANCBSelection Criteria xx x x x xPrequal/Bid/Award xx) x x x xConstruction xxxxxxx xxxxxox xxxxx xxxx
2. Goods 1.11 5.13 1.10 1.23 61.00 9.17
2.1 Roofing sheets 0.31 0.62 0.80 0.98 0.50 3.20 ICBnNCBBid/Award x x xDelivery xx xx xx xx x
2.2 Instructional materials 0.77 4.36 0.07 0.01 0.00 5.22 ICBANCB/OtherBid/Award xxx xx xxDelivery xx xxxxxxx xx x
2.3 Vehicles/Equipment 0.03 0.14 0.23 0.23 0.12 0.75 ICBlOtherBid/Award xx xx xxDelivery xx xxx xx xx xx
3. Training 0.71 2.78 3.97 3.16 1.72 12.33 Other
3.1 Overseas training 0.00 0.30 0.20 0.10 0.10 0.70 OtherImplementation xoxx xx xx x
3.2 Local training/workshops 0.71 2.48 3.77 3.06 1.62 11.63 OtherImplementation xxooxxxx xxxxox xxxxxxx xxxxxxx xxxx
4. Consultancies 0.21 0.47 0.69 0.55 0.25 2.18 OtherBid/Award x xx xx xx xxImplementation xxxxxxx xxxxxxx xxxxxxx xxxxxxx xxxx
5. Operating Costs 0.48 0.77 1.40 1.20 0.36 4.23 Other
5.1 Personnel redeployment 0.26 0.65 1.04 0.65 2.60Implementation xxxxxxx xxxxx xxxxxxx xxxxoxx xx
5.2 Field visits(mon/eval) 0.22 0.12 0.36 0.55 0.36 1.61Implementation xxxxoxx xxxxxx xxxxxxx xxxxxxx xxxxx
6. Unallocated 0.00 0.91 2.78 3.78 1.91 9.40 OtherImplementation xxxxox xxxxxx xxxxxxx xxxxxxx
Total BESIC-financed 2.50 11.70 13.30 14.80 7.80 50.00

DISBBE.XLS
Disbursement Profile
Disbursements Profile
RegionalIDA Fiscal Sector
Years and By Semester Cumulative Project Profile
Semesters (US$ Million) (US$ Million) 1%) I%)
1997 1 1.25 1.25 2.5% 0.0%
2 1.25 2.5 5.0% 6.0% 501998 1 6.0 8.5 17.0% 10.0%
2 5.7 14.2 28.4% 14.0% 40
301999 1 6.3 20.5 41.0% 22.0% 30 _______
2 7.0 27.5 55.0% 26.0%
2000 1 7.0 34.5 69.0% 38.0% " 20 -
2 7.8 42.3 84.6% 48.0% ' 02001 1 3.9 46.2 92.4% 58.0%
2 3.8 50.0 100.0% 66.0% 0a) 02002 1 74.0% a a t 0 0
0 02 86.0% _ _ _N ..2003 1 90.0% Fiscal Years
2 94.0%
2004 1 98.0% -l-Project Profile -M-Regional Profile2 100.0%
a:disb.xdx (rk5)
U,J
O la te1
Page 1

ANNEX 6Page 1 of 4
NMI9ISTRY OF EDUCATIONBASIC EDUCATION SECTOR PJPROVEiMTENT PROGRAMN2E
DISTRICT EDUCATION OVERSIGHT COMMITTEEESTABLISIZIENT AGREEMENT
This Agreement made this ................. day of ... OneThousand, Nine Hundred and Ninety Six (1996) between the Ministry ofEducation, Accra Ghana and the ...................... District Authorityrepresented jointly by the District Chief Executive, the Presiding Memberof the District Assembly and the District Director of Education.
Whereas the Government of Ghana has entered into an agreementwith the International Development Association (IDA) and other Donorsto extend C'redits to support its Basic Education Sector ImprovementPro,gramme (BESIP) to en:able her fulfil her constitutional obligation ofproviding Free Compulsory Universal Basic Education for all Ghanaianchildren of school going-age by the year 2005.
Whereas Section 9, sub-section 2 of The Ghana Education ServiceAct 1994 provides for the appointment in every district of a DistrictEducation Oversight Committee, by the Ghana Education Service Council.
Whereas the functions of the said District Education OversightCommittee, as specified in Sub-section 3 of Section 9 of the GES Act1994, shall be concerned with the oversight of:
1. Conditions of school buildings and other infrastructual requirementsof the schools
T.lt provisions of teachers aiiu in cegular and punctual attendanceof teachers and pupils at the schools
3. Thc proper performance of duties by staff at the schools
4. The moral behaviour of staff of the schools towards pupils
5. Complaints relating to or from teachers and pupils

ANN?RX 6Page 2 of 4
6. The environmental cleanliness of schools and facilities therein; and
7. The supply of textbooks and other teaching and learning materials,
Whereas the Central Government has decided to transfer into theDistrict Assemblies Common Fund part of its annual budgetary allocationfor development expenditure on Education, to be used at the district levelexclusively for educational projects. Now the Ministry of Education andthe .District Authority agree as follows:
i) The District Authority shall ensure that a District EducationOversight Committee, as specified in Section 9, subsections 2 and 3of the Ghana Education Service Act, 1994, is established and giventhe means to perform effectively the functions assigned to it by law,by March 1996.
ii) The District Authority shall ensure that funds sent to the district foreducational projects and programmes are used exclusively for thepurpose for which the funds were released.
iii) The District Authority shall ensure, in collaboration with the DistrictAssembly, that existing laws on Compulsory Basic Education areenforced in the district.
iv) In support of (iii) above, the District Authority shall organise annualin the months of August, September campaigns for enrolment in BSIand ensure that particular attention is given to increasing femaleparticipation in BasicTPducation.
v) The District Authority shall ensure that scholarship schemesinstituted by the District either for academic excellence or to assistpupils students from poor homes are so designed as to ensure genderparity among the beneficiaries.
iiv) The Ministry of Education shall monitor closely the performance ofthe District Education Oversight Committee and shall provide thecommittee with a double cabin pickup as incentive to intensify itsmonitoring activities, when the Ministry is satisfied that theCommittee has been performing its functions satisfactorily consistentimprovement in the CTR results of P6 pupils in the District over 3

ANNEX 6Page 3 of 4
consecutive years shall be the measure for performance.
In witness whereof the parties hereto have hereunto set our handsand day and year first written herein
*.... .... .............................
For and on behalf of the Ministryof Education.
In the presence of
SINAMEt.... :.........................
FOR AND ON BEHALF OF THE DISTRICT AUTHORITY
1. NAME: ........................................
SIGNATURE:....................................DISTRICT CH]EF EXECUTIVE
3
ANNEX 6Page 4 of 4
2 NAME:.
SIGNATURE:....................................PRESIDING MEMBER
3. NAME: .......................................
SIGNATUREl. .. ..DISTRICT DIRECTOR OF EDUCAIION
In the presence of Member of Parliament
NAM :...................
SIGNATNTRE
4

Proposed FCUBE Organization Structure
I Minister
Project mplemcntationManagement Unit Overview
(PMU) Special Assistant Committee
Director General FCUBEGES Senior Ghana EducationManagement Service (GES)
Team-
FCIUJBIE |Regional DirectorFCUBri n t o .......................................... .. ................... of EducationCoordinator.o dcto
Deputy DG, GES
l FCUBESecretariatAdministration _-
Mapwer ..-- ..M_ npower ..-- District Authority
.. . ~~~~AssemblyChief Executive
_ . | ~~~~~~~District Education|. | ~~~Oversight l
| Academic i Trnng I| Cornmittee |Dstrc Dire ctor of|Training Education
SchoolManagementCommittee
Note: Blank boxes represent other functional units at this level.

ANNEX 8Management Roles and Relationships
PROPOSED MANAGEMENT ROLES, RELATIONSHIPS BETWEEN KEY BODIESAND PRIORITIES FOR INSTITUTIONAL STRENGTHENING
A. ROLES
MOE(a) formulating educational policies, determining sectoral resource allocation an approving
operational objectives for implementation;(b) organizing educational management information system;(c) monitoring and evaluating the performance of the education system
GES National(a) setting out financial regulations;(b) providing support for district budgeting and determining allocation of financial resource
allocation to districts;(c) formulation of standards and norms as well as discipline of the educational service;(d) developing curricula and syllabi, purchasing and distributing textbooks;(e) managing technical/vocational education;(f) managing external training.
GES Regional(a) providing advice and training for district offices(b) monitoring and evaluating district offices
GES District(a) staff recruitment, development and discipline(b) data collection and analysis(c) preparation and execution of budgets(d) distribution and monitoring of educational materials to schools(e) academic and pedagogical advice to teachers(f) opening of new BS1-6 schools(g) supervision of schools and assessment of pupil/teacher performance(h) ensuring information is transmitted between community and district office
B. RELATIONSEIPS
MOE-GESWith establishment of Council MOE to have performance agreement with GES specifyingservice to be provided. MOE will monitor and evaluate on this basis.
GES National - DistrictManagerial and supervisory
GES Regional - DistrictCoordination to ensure district plans are prepared and implementedMonitoringSupporting service (collegial relationship)

ANNEX 8Management Roles and Relationships
DEO-District AssemblyCoordination on infrastructure plans and recurrent/capital budget preparationDA supervises and DDE provides information as advisor to DA
District Education Offices-SchoolsManagerial, supervisory, coordinating, monitoring, evaluating, advisory and schools
District Education Oversight Committees-School Management CommitteesSupervisory and advisoryDEOCs support operation of SMCs
C. FUNCTIONS TO BE STRENGTHENED
(Highest priorities in order)
MOE1 . Information analysis and processing2. Policy formulation3. Priority setting
GES National & Regional1. Development, selection, purchasing and distribution of materials, equipment and
textbooks2. Developing manpower plans/developing staffing standards or norms3. Monitoring and coordinating
GES District1. Inspection, supervision and discipline2. Staff recruitment, development, in-service teacher training3. Financial management

ANNEX 9
REPUBLIC OF GHANABASIC EDUCATION SECTOR IMPROVEMENT PROGRAM
List of Key Source Documents in Project Files
Ministry of EducationI. (Draft) Operational Plan: fCUBE Program, February 1996.2. The Program for Free Compulsory and Universal Basic Education (fCUBE) by the Year
2005, February 1996.3. Basic Education Sector Assessment School Review: Curriculum, Instruction and Teachers-
Report on Teacher Training Colleges, June 1995.4. Enrollment Projections for FCUBE, September 1995.5. Quality Assurance and School-level Management: A Review of Education Management
System in Ghana (draft). MOE/USAID (Nana Asare-Bediako, et al). June 1995.6. A Tale of Two Ghanas: The View from the Classroom (draft). MOE/USAID, June, 1995.7. Ghana Education Service Bill, April 28, 1995.8. Program for the Provision of Free, Compulsory and Universal Basic Education by the Year
2005, December 1994. (A document presented to the Parliament)9. Report on National Seminar on Girl's Education. June 199510. Report of Recommendations of the Curriculum Review Committee. CRDD, June 1994.11. Towards Learning for All: Basic Education in Ghana to the Year 2000. April 1994.12. PSDP: Report of the Ghana Education Service for the Mid-Term Review, October 1995.13. Primary School Development Project: External Evaluation of Project Performance.
November 18, 1995
Other GOG documents:1. CSPIP Diagnostic Workshop at Ministry of Education, October 1995.2. Ghana-Vision 2020: The First Step: 1996-2000. January 1995.3. Rural Communities in Ghana. Ghana Statistical Service. October 1993.4. Public Expenditure Review 1994. Ministry of Finance, May 1995.5. Report of the Education Reforms Review Committee on Pre-tertiary Education, October
1995.
World Bank documents:I. Ghana Poverty Past, Present and Future. June 29, 1995.2. Performance Indicators in Bank-Financed Education Operations: Second Edition. HDD.
November 1995.3. Ghana Participatory Poverty Assessment: Synthesis Report (round 1 &2) Norton, A. et al.
December 1994.4. The Economics of School Quality Investments in Developing Countries: An Empirical Study
of Ghana. P. Glewwe, 1994.5. Investing in all the people: Educating women in developing countries. Washington, D.C.:
EDI (L. Summers) 1994.6. Economic Evaluation of Education Projects: Selected Methods (a Working Draft) HDD (Jee-
Peng Tan). October 1995.7. Africa Region Draft Guidelines for Economic Analysis of Projects. AFRSA, September 27,
1995.8. A Review of the Quality of Economic Analysis in Staff Appraisal Reports for Projects
Approved in 1993. OED, May 5, 1995

ANNEX 9
9. A Program to Estimate the Rate of Return to Investment in Education. HCDVP, February,1996.
Other Documents1. Proposal for a Detailed Systems Study of the Performance of the Existing Educational
Management Information System. Oct. 1995.2. DAE with GES/Unicef. A Study of Teacher Motivation and Conditions of Services for
Teachers in Ghana. March, 1995.3. Budgeting and Expenditures in the Education Sector in Ghana. European Union (by Perran
Penrose). December 19954. Extended Poverty Study (PPA3): Access and Utilization of Basic Social Services by the Poor
in Ghana. Unicef (by David Korboe), January 1995.5. Strengthening Information Management Capacity- Ministry of Education, Ghana. USAID
(by Simon Ju). October 1994.6. Returns to Investment in Education: A Global Update. World Development, vol.22 no.9
pp.1 325-1343. Psacharopoulos, G. 1994.7. The Education Finance Simulation Model. (2nd ed.) Zymelman, 1988.

MAP SECTION


IBRD 28045
BURKINA FASO ul.
,g2 ozii -rals g
\%F~~~~~;;n . 9 lt~~~~~PPER f okp,od-.lGHNEAST ~~~GHANA
WX UPPERS- L-enp . N ' \ '\ BASIC EDUCATION SECTOR? \ oY.lo N..i. 6'oo -% ( IMPROVEMENT PROGRAM
WIA BIKSg.~ - WA \-Bulenoo .F O etshig PRIPMARY ROADS
SECONDARY ROADS
. J NORTHERN / S ipl OUX p TERTIARY ROADSa Doboyo o ,,gTAMALE RAILWAYS
Zabsug> 1 ® REGION HEADQUARTERS
-/oChorch. Domon .... 'N/ bC mbulgu * NATIONAL CAPITAL
Ru<ole g°O Danasa Ys, -- REGION BOUNDARIES a-
- INTERNATIONAL BOUNDARIES
The boundaries, colors,05TE ~~~~~~~~~~~~~~~~~~~~~~~~~~~~denominations and any
other information shownD'IVOIRE p~~~~~~~~~~~~~~~~~~~~~n this map do not
DRIVOIRE \ \ oshaim imply, on mhe part of
The Word ahGrup,j f 2 Y@-"ooChindirl , aany judgment on the legal
I. status of any territor,( , amo - /or any endorsement
Dambun or acceptance of such
P, BRONG-AHAFO c, c ~ ~~~~~~~~~~~~~~~~boundaries. a
0 .Md / BRONG-AHAFO vchw i g o 0o 20 30 40 50.Um
-7-~~~~~~~~~~~~~~~~~~~~~~~~~~~~~~~~~~~~~~~~~~~~~~~~~~~~~~~~~~~~~~~~~~~~~~~a
TERN,~~~~~~~SER
/ ochimon A > t l l l |~~~~~~~~~~~~~~~~~~~aI~ coC, 06-7-'U ,* -. I AHN u, Jtr-
t | YUt#AS f B jaye < ~~~~~~EOUTOGOL~Ct ::, ~~~~~~~~~~~~~~~~~~~~~~~~~~~~iyr .. wkwt su3 OrM
i' 7 It' a- noI.V)T
> 5ewl X b g 7 KO~~~~~~~~~~ ~~FORIDU7
R Encho . U kCENTRAL
PIt ACCP Sr
_ J,wi .<xEriomo . X )c A P~~~~~~~~~E COAST SENE >,>\-i -- _ N,GERs / -o
_(kSEKOSEKNDIGU U N
May 1996


IMAGING
Report No: 15570 GHType: SAR