world bank document - documents &...
TRANSCRIPT

Docwiient of
The World Bank
FOR OMCIAL USE ONLY
~ ~ CT:( )1F .1 CD! ReportNo. 10144
y}, ),.Y ,, A ,' 5' i I 1' '; sI(,JX (,I'A,( Wi. (R A .,)' I)
PROJECT COMPLETION REPORT
REPUBLIC OF TUNISIA
GRAIN DISTRIBUTION AND STORAGE PROJECT(LOAN 2052-TUN)
DECEMBER 5, 1991
Agri. ulture Operations DivisionCountry Department IIEurope, Middle East and North Africa Regional Office
This document bas a restricted distribution and maay be u-sed by recipients only in the performance oftheir official duties. Its contents may not otherwise be disclosed without World Bank authorization.
Pub
lic D
iscl
osur
e A
utho
rized
Pub
lic D
iscl
osur
e A
utho
rized
Pub
lic D
iscl
osur
e A
utho
rized
Pub
lic D
iscl
osur
e A
utho
rized

CURRENCY EQUIVALENTS
Currency Unit : Tunisia Dinar (TD)
EXCHANGE RATE
Appraisal year average (1981) US$1 - TD 0.50Intervening years average (1982-87) US$1 = TD 0.75Completion year average (1988) US$1 TD 0.86
WEIGHTS AND MEASURES
Metric System
ACRONYMS AND ABBREVIATIONS
ATI Agrotechnie-Ingdnierie, Consultant Engineers, FranceCCGC Cooperative Centrale des Grandes Cultures (Central
Cooperative for Basic Crops)COCEBLE Cooperative Centrale de Ble (Central Vheat Cooperative)CNEA Centre National d'Etudes Agricoles (National Center for
Agricultural Studies)OC Office des Cereales (Office of Cereals)OPNT Office des Ports Nationaux Tunisiens (Tunisian National Port
Board)PD Project DirectoratePCC Project Coordination CommitteeSAR Staff Appraisal ReportSCET Soci4td Centrale pour l'Equipement du Territoire (Central
Company for Territorial Development)SNCFT Socidte Nationale des Chemins de Fer Tunisiens (Tunisian
National Railroad Company)STPA Societe Tunisienne de Production Alimentaire (Tunisian Food
Production Company)TECI Tunisie Engineering et Construction Industrielle (Tunisian
Engineering and Industrial Construction Enterprise)
FISCAL YEAR
Republic of Tunisia January 1 - December 31Office of Cereals October 1 - September 30

TBN OFFICIAL USE ONLYTHK WOULD BANK
Washington, DC 20433U.S A
OVuice ni oireitn.C.fl41Opsmvws Ivakiattr-
December 5, 1991
MMORANDUM TO THE EXECUTIVE DIRECTORSANTEPRSDT
SUBJECT: Project Completion Report - TunisiaGrain Distribution and Storage Protect (Loan 2052-TUN)
Attached, for your information, is a copy of a report entitled"Project Completion Report on Tunisia - Grain Distribution and Storage Project(Loan 2052-TUN)", prepared by the Government of Tunisia, with an Overviewprepared by the Europe, Middle East and North Africa Regional Office. No auditof this project has been made by the Operations Evaluation Department at thistime.
Attachment I
This document hu a rstricted distribution and may be used by recipients only in the petformance Iof their official duties. Its contents may not otherwise be disclosed without World Bank authoriation.

FOR OFFICIAL USE ONLY
PROJECT COMPLETION REPORT
REPUBLIC OF TUNISIA
GRAIN DISTRIBUTION AND STORAGE PROJECT(LOAN 2052-TUN)
TABLE OF CONTENTS
Page No.
PREEACE . . . . . . . . . . . . . . . . . . . . . .BASIC DATA SHEET . . . . . . .. . . i.iEVALUATION SUMMARY . . . . . . . . . . . . . . . . . . vOVERVIEW . . . . . . . . . ..... . . . . . . . . . vlii
CNEA PROJECT COMPLETION REPORT
I. BASIC DATA . . . . . . .. . . . 1
A. Introduction . . . . . . . *. . . . . . . 1B. Agriculture in Tunisia: General Data . . . . . 1C. The Cereals Office and the Cooperatives . . . . 3D. Storage Infrastructure . . . . . . . . . . . . 6
II. IDENTIFICATION, PREPARATION AND APPRAISAL . . . . . 6
A. Origin .... . . . .. . . . . . . . . . . . 6B. Preparation and Appraisal . . . . . . . . . . . 7C. Description .... . . . . . . . . . . . . . . 8
III. PROJECT EXECUTION . . . . . . . . . . . . . . . . . 10
A. Project Start-up . . . . . . . . . . . . . . .. 10B. Amendments During Implementation . . . . . . . . 10C. Implementation Schedule . . . . . . . . . . . . 10
1. The Seven Silos . . . . . . . . . . . . . . 102. Port Works .... . . . . . . . . .... . 173. Railway Program . . . . . . . . . . . . . 184. Technical Assistance . . . . . . . . . . . . 205. Training .... . . . ...... . . . . . 22
D. Project Cost, Financing and Disbursements . . . 231. Project Cost . . . . . . . . . . . . . . . . 232. Financing and Disbursements . . . . . . . . 24
E. Benefits . . . . . . . . . . . . . . .. . . . 27F. Economic analysis . . . . . . . .. 32
This document has a restricted distribution and may be used by recipients only in the performanceL of their official duties. Its contents may not otherwise be disclosed without World Bank authorization.

TABLE OF CONTENTS (CONT'D)
ANNEX 1 . . . . . . . . . . 34Table 1 Population Structure by Broad Age Group 34
and SexTable 2 GDP, by Activity .. . . . . . . . . . 35Table 3 Areas, Output and Yields . . . . . . . . 36Table 4 Grain Imports, Collections, Demurrage . 37
Quay Storage FeesTable 5 Grain Unloaded, by Port . . . . . . . . . 38Table 6 Demurrage Charges - 1988 . . . . . . . . 39
ANNEX 2 . . . . .. . . . . . . . . . .. . . . . 40Table 1 Supplementary Works and Deductions in the 40
Silo Construction ComponentTable 2 Implementation Schedule . . . . . . . . . 41Table 3 Works Schedule: Seven Silos Program . . 42Table 4 Silo Construction: Delays in Completion . 43Table 5 Contract with BUhler-MIAG (Contract Amount) 44Table 6 Contract with BUhler (Detailed) . . . . . 45
ANNEX 3 . . . . . . . . . . . .. . .. . 46Table 1 Accounting Status of Project . . . . . . 46Table 2 Comparative Costs . . . . . . . . . . . . 47Table 3 Accounting Status . . . . . . . . . . . . 48
ANNEX 4 . ..................... 51Table 1 Handling of Imported Grain with and . . 51
Without Project (1,000 Tons)Table 2 Saving on Handling of Imported Grain . . 52Table 3 Transportation Costs for Imported Grain . 53Table 4 Annual Grain Transportation Costs Over . 54
Planned ItinerariesTable 5 Grain Transportation by Road in 1988 . . 55
ANNEX 5 . e . e. . . . . . . . . . . . .. . 56Table 1 Investment at Economic Prices (in D'0OO) 56Table 2 Staff Wages and Salaries at Economic . . 57
Prices (D'000)Table 3 Staff Wages and Salaries at . . . . . . . 58
Economic PricesTable 4 Electricity Consumption at 1988 . . . . . 59
Economic PricesTable 5 Annual Operating Costs at . . . . . . . . 60
Economic Prices
ATTACHMENT: Comments from the Borrower . . . . . e * 61

PROJECT COMPLETION REPORT
REPUBLIC OF TUNISIA
GRAIN DISTRIBUTION AND STORAGE PROJECT(LOAN 2052-TUN)
PREFACE
This Project Completion Report (PCR) reviews implementation of theGrain Distribution and Storage Project in Tunisia, for which Loan 2052-TUN in theamount of US$42 million was approved on October 6, 1981. The Loan was closed onDecember 31, 1988, two years behind schedule. The last disbursement was made onJuly 19, 1989 and an undisbursed balance of US$804,000 was cancelled at thattime. This brought the total amount cancelled under the Loan to US$9.41 million.
The PCR was prepared by the National Center of Agricultural Studies(CNEA) in Tunis. The overview prepared by the Bank provides additionalinformation obtained from a review of the project files including the preparationreports of the follow-on Project (subsequently dropped from the lending program).
This PCR was read by the Operations Evaluation Departme.nt (OED). Thedraft PCR was sent to the Borrower for comments on September 23, 1991. AnEnglish translation of their telexed response is attached to the Report(Attachment).

PROJECT COMPLETION REPORT
REPUBLIC OF TUNISIA
GRAIN DISTRIBUTION AND STORAGE PROJECT(LOAN 2052-TUN)
BASIC DATA SHEET
KEY PROJECT DATA
Appraisal Actual or Actual as X ofExoectation Current Estimate Aporaisal Estimate
Project Cost CUSS million) 93.9 60.00 64Underrun or Overrun 6X)
Loan Amount CUSS miltion) 42 m. 32.59 78Date Board ApprovaL 10/06/81Date Effectiveness 04/02/82Date Physical Components Completed 11/86 07/88Closing Date 12/31/86 12/31/88Economic Rate of Return 6X) 16.1 12.87
CUMULATIVE DISBURSEMENTSFY82 FY83 FY84 FY85 FY86 FY87 FY88 FY89 FY90
Appraisal Estimate CUSS miLLion) 0.70 13.60 30.50 39.00 42.00ActuaL (USS miltion) - 0.40 0.80 7.54 20.65 30.51 32.34 32.38 32.59Actual as % of Estimate 0.00 0.03 0.02 0.20 0.50
Date of FinaL Disbursement JuLy 19, 1989CancelLation CUSS milLion) 9.40
STAFF INPUTS(staff weeks)
FY81 FY82 FY83 FY84 FY85 FY86 FY87 FY88 FY89 FY90 TOTAL
LDV 3.4 6.1 9.5Identification/ 35.8 35.8Preappraisal
AppraisaL 44.0 5.2 49.2Negotiations 3.6 3.6Supervision 12.6 11.4 15.8 9.0 3.1 10.9 2.0 0.5 0.1 65.4Other 1.3 0.3 1.0 0.8 0.4 3.
Sibotael 83.2 28.8 11.4 15.8 9.3 4.1 11.7 2.0 0.9 0.i 167.3

- iv -
MISSION DATA
Date No. of Staff/Days Specialization Performance Types of Date oftmoLyr) Persons _infield_ represented a/ Reting b/ Trend c/ PLRE d/ Report
Identification 3/79 FAO 06/15/79Preparation 6/79 5 12 FAO 07/26/79Preparation 10/79 4 19 FAO 10/26/79-01/18/80Preparation 9/80 2 7 EC, GRS 10/20/80Preappraisal 11/80 4 14 EC (2), GRS, TREC 12/03/80Appraisal 2/81 5 21 EC (2), GRS, TREC (2) 03/11/81Post Appraisal 5/81 3 5 EC, GRS, PR 06/03/81Supervision 1 12/81 2 5 EC, GRS 2 1 M 01/29/82Supervision 2 4/82 1 8 EC 2 2 M 05/05/82Supervision 3 12/82 1 8 AG. ENG. 3 2 M 01/27/83Supervision 4 4/83 1 5 EC 05/19/83Supervision 5 5/83 1 4 EC 2 1 M 06/03/83Supervision 6 10/83 2 6 EC, FA 11/02/83Supervision 7 2/84 2 17 EC, GRS 2 1 FO 02/27/t4Supervision 8 5/84 1 6 EC 05/08/84Supervision 9 10/84 2 6 EC, SIC 2 2 FM 11/03/84Supervision 10 5/85 2 13 EC, TREC 2 2 FM 06/21/85Supervision 11 5/86 1 4 PA 06/03/86SIR 7/86 3 4 DC, FA, AG 07/31/86LENP Grain Storage 2 4/28/86 4 12 P EC (1), GRST (3) 05/07/87Supervision 12 6/87 1 14 GRST 07/87Supervision 13 12/87 1 5 FA 01/05/88SIR 6/85 1 2 EC 06/13/85SIR 1/89 2 5 FA, OA 03/04/89
OTHER PROJECT DATA
Borrower Republic of TunisiaBeneficiary Office of Cereals (OC)FiscaL Year of OC October 1 - September 30Name of Currency Dinar (DT)Currency Exchange Rate:AppraisaL Year Average (1981) US$1.00 = TDO.50Intervening Years Average (1982-87) US$1.00 = TD0.75Completion Year Average (1988) US$1.00 = TDO.86
Cofinanciers None
Follow-on Projects Grain Storage II was prepared but subsequently dropped from the lending program.
a/ AG = Agronomist; AG. ENG. = Agricultural Engineer; DC = Division Chief; EC = Economist; FA = FinanciaL Analyst;FAO - FAO/CP; GRS e Grain Silo Specialist; OP = Operations Assistant; PA a Project Advisor; PR = ProcurementSpecialist; SIC = Silo Consultant; TREC = Transport Economist.
b/ I = Problem free or minor problems; 2 c Moderate problems; 3 = Major problems.
c/ 1 = Improving; 2 = Stationary; 3 = Deteriorating.
d/ F = Financial; H = Managerial; T = Technical; P = PoLitical; 0 = Other.

- V
PROJECT COMPLETION REPORT
TUNISIA
GRAIN STORAGE AND DISTRIBUTION PROJECT(Loan 2052-TUN)
EVALUATION SUMMARY
Objectives
The project was designed to expand grain storage and throughputcapacity, improve the related domestic transport system and largely completethe conversion from bag to bulk handling in Tunisia's distribution system forimported grain to meet the increased demand for grain. In addition, theproject was to provide assistance for strengthening the technical capacity andfinancial management of the Office of Cereals (OC). The main projectcomponent, accounting for more than 80 percent of total project costs, wasconstruction, rehabilitation and expansion of port and storage silos andrelated facilities.
Implementation Experience
The project had a slow start due to the difficult relationsbetween the OC and its consulting engineers and the time taken to select afirm for silo supervision. This delayed the infrastructure program by twoyears and the loan closing date was extended from December 31, 1986 toDecember 31, 1988. Despite the delays, all the project silos were constructedand/or rehabilitated as foreseen at appraisal and hence the project's physicalobjectives were met. The institutional component was less successful due toweak support for the policy and institutional aspects of the project withinthe OC, staffing problems and the generally poor working conditions at the OC.However, the various organizational units were created within the OC and thestudies were completed and became useful guides for the reform programinitiated under the project. The project has contributed to the reduction ofdemurrage charges through the eliminAtion of bags and to savings from theelimination of quay storage.
Results
The project generally met its objectives. The infrastructureprogram was completed as fores6en, the silos have performed very well and wereable to handle the exceptionally ia~iie volumes of imports arriving at theports in 1988. Although the objectives of the institutional component weremore difficult to achieve, important reforms were initiated under the projectand are still on-going in the context of the Second Agricultural SectorAdjustment Loan. The reestimated economic rate of return (ERR) of the wholeproject is satisfactory at 12.87 percent.

- vi -
Sustainability
Provided reasonable standards of operation and maintenance aremet, sustainability is virtually assured throughout the assumed economic lifeof the project investments.
Lessons Learned
A number of lessons can be drawn from the experience with thisproject.
(a) Institutional objectives of a project can be difficult toachieve if the project institutions operate in a regulatedpolicy environment. This is starting to change with reformsbeing implemented under the ASAL-Il.
(b) In a complex, multi-sectoral project requiring theparticipatior. of various agencies and ministries, moreattention should be paid to ensuring the effectivecoordination of the different actors.
(c) Complex projects of this nature require intensivesupervision both at project start-up and duringimplementation. A greater supervision effort might havehelped resolve inter-agency conflicts at their early stagesand have moved forward difficult institutional reforms(financial and management).
(d) Consultants' qualifications and terms of reference should bechecked carefully to ensure that they have the requiredexperience and sufficient time to carry out their work, andthat they are familiar with the local context.
(e) Continued attention needs to be paid to operation andmaintenance (O&W1) which are crucial to ensure thesustainability and effective utilization of projectinvestments.

PROJECT COMPLETION REPORT
REPUBLIC OF TUNISIA
GRAIN DISTRIBUTION AND STORAGE PROJECT(LOAN 2052-TUN)
OVERVIEW
INTRODUCTION
1. The Project Completion Report (PCR) of the Grain Distribution andStorage Project was prepared by the National Center of Agricultural Studies(CNEA) in Tunisia. The CNEA report provides a detailed and exhaustiv3 reviewof the technical aspects of the project. However, less attention was given toinstitutional issues and the lessons to be derived from the project. TheEvaluation Summary supplements CNEA's report with the Bank's observations.
2. Project Origin. An IBRD mission in May 1978 identified a grainstorage project within the program of investments then being considered by theGovernment. This project was considered to be urgent because rapidly risingconsumption of grain, brought about by rising per capita income, increasedurbanization and a high population growth rate, was increasingly being met byimports and this was putting strains on the Government's systems for grainimporting, storage and distribution.
3. The project included the following components:(a) rehabilitation, adaptation for imports, and expansion to 30,000 toncapacity of the existing port silo in Bizerte, and construction of a 30,000ton port silo in Ghannouch (near Gabes); (b) construction of three storagesilos in Sfax (20,000 tons), Beja and Gafsa (10,000 tons each), and expansionfrom 8,000 tons to 28,000 tons of the storage silo in Kalaa Seghira (nearSousse); (c) rehabilitation of the Manouba (near Tunis) storage silo(50,000 tons); (d) construction and rehabilitation of silo rail sidings;(e) acquisition of about 50 bulk rail hopper cars; and (f) studies, technicalassistance, and training. The OC was to be responsible for silorehabilitation and construction, and the execution of the studies includedunder the Project. The OC was to be assisted by the Tunisian National PortAuthority (OPNT) for port works at Bizerte and by the Tunisian NationalRailroad Company (SCNFT) for components in (d) and (e) listed above. The SARproposed that the OC would work with two grain cooperatives, the Central WheatCooperative (COCEBLE) and the Central Cooperative for Basic Crops (CCGC), for

- viii
establishing an integrated silo maintenance and stock control system. Day-to-day management and coordination with other project agencies was to beprovided by a Project Management Unft (PMU) established in OC, A ProjectCoordination Committee (PCC) was to provide overall project coordination andresolve possible inter-agency conflicts.
4. Proiect Cost and Financing The project was to be implementedover a five year period from 1981 to 1986. Total project cost (includingtaxes and duties of about $14.7 million) was estimated at TD 37.5 million(US$93.9 million equivalent) with a 45 percent foreign exchange component ofwhich the Bank would finance $42 million and grant transfers to the OC fromthe Government would finance the balance.
PROJECT IMPLEMENTATION AND IMPACT
5. Project Implementation. The project start-up was slow due to thedifficult relations between the OC and its consulting engineers, which delayedthe issuance of bid invitations for silo construction (para. 10). Despite thedelays, all of the project silos w:tre constructed and/or rehabilitated by mid-1988 aiid hence the project's physical objectives were largely met. Theinstitutional component was less successful (paras. 13-17). The iotal projectcost at completion was DT 47.8 n'llion (US$60 million equivalent) or127 percent of the appraisal cost estimate in Dinar terms and 64 percent indollar terms. The higher costs were incurred mainly for silo construction andsupplementary works. Costs in dollars terms were lower than those in Dinarterms due to the fall in the value of the Dinar.
6. A Project Coordination Committee was created as intended(para. 3). Unfortunately, it did not convene regularly as envisaged and wasnot very effective in coordinating the various project components andfostering communication and team work. This affected the smoothimplementation of the phys .cal and institutional components of the project.
7. kroiect Design. The basic design of the project was not modifiedduring implementation. However, the Project Agreement was amended in 1984 toprovide new deadlines for submission of 1981-85 audited accounts, and the LoanAgreement was amended twice, in 1984 to increase the local trainingdisbursement percentage to 100 percent, and in 1985 to increase to 60 percentthe disbursement percentage for expenditures on silo construction and silorail sidings and to provide for an expansion of the Beja silo capacity from10,000 to 18,000 tons. A total of about $9.4 million was cancelled from theLoan. The Loan closing date was extended by a total of two years to December31, 1988.

ix-
8. Physical ComRonent. The silos performed very well and were ableto handle the exceptionally large volumes of imports arriving at the ports in1988 (2.04 million tons versus 1.25 million projected by the SAR for 1986).They have led to considerable efficiency gains in import and handling of grain-- a major project success. The railway program was also highly successfuland 912,000 tons were moved in 1988 versus 570,000 estimated in the SAR for1986. The project has, in addition, contributed to the reduction of demurragecharges through the elimination of bags and to savings from the elimination ofquay storage. The Project director was able to very competently supervisesilo operations once the works were completed. As mentioned in paras. 9-11,the process of achieving the physical results described above was, however,fraught with difficulties and delays caused by the poor relations of thepartnership of consultants selected to carry out silo supervision.
9. Silo Consulting Engineers. At the time the project was beingprepared, it was recognized that no Tunisian firm had adequate experience totake overall responsibility for major silo supervision. The Bank thusrecommended, and the OC agreed, that for supervision of silo construction acontract with a joint venture of two partners (Tunisian and foreign) would beestablished with the senior level expertise provided by the foreign firm.
10. However, the project inherited a major problem of incompatibleconsulting engineers and subcontractors. In 1978, prior to the Bank'sinvolvement with the project, the OC had hired an engineering consulting firmto prepare detailed designs for the Bizerte port silo and the storage silos ofBeja, Gafsa, Kalaa Seghira and Sfax. At the OC's insistence, the firmsubcontracted a large share of the engineering work to a Tunisian firm and ajoint contract was signed in early 1979. A Bank preparation mission reportsthat relations between the OC and the international firm were strained andrelations between the two firms (internptional and local) were antagonistic.In fact the international firm, which was vested with legal responsibility forthe planning and supervision of all project works, did not receive a full setof the implementation designs for civil works prepared by the Tunisian firmnor the latter's notes on calculations of quantities of materials required.When these problems became apparent, it was decided that the OC wouldcoordinate the work of the two consulting firms. The Bank felt that acontinuation of the consulting arrangement with coordination by the OC was farfrom ideal but could be tried on an interim basis. OC management was,however, unable to settle the problems between the engineering firms. InFebruary 1983, the OC decided to award the entire engineering assignment tothe sister firms of the original partners. However, due to refusal of thosefirms to include adequate numbers of staff in the proposed contract and to anincrease in the contract amount at the last minute, the OC decided to severall relations with the firms and, on the basis:of a short list provided by theBank, selected a joint venture of new international/Tunisian partners. It wasonly then, when the OC entered into this new contract, that silo bidding couldstart and the project could begin to be implemented.

11. The effectiveness of OC's earlier consultants had been impaired asa result of the problems described above (lack of communication and sharing ofinformation between the partners) and the designs which they prepared had tobe modified to improve certain technical deficiencies (in the case of theManouba silo the execution plans had to be completely redone and sent back toFrance). Negotiations of appropriate amendments took place after signature ofthe contract with the civil works contractor in July 1984.
12. Project Works. Project works were awarded to an internationalfirm following international competitive bidding. The firm was slow inpreparing detailed construction plans and this delayed the start of the works.A large part of the delays were made up, however, during construction. In thecase of the port silos of Bizerte and Gabes, the contractor did not adequatelystudy local conditions. Draft plans did not take into account thepeculiarities of certain sites (e.g., at Bizerte, the depth of foundations wasunderestimated) or reflect sufficient coordination with government agenciesinvolved such as OPNT, SNCFT and the Tunisian Electricity and Gas Society(STEG). In addition, local sub-contractors in some cases proved to beovercommitted and in other cases did not provide fully reliable equipment.Delays were longest for the rehabilitation of Kalaa Seghira and Bizerte portsilos. For Kalaa Seghira, this was due to the fact that supplementary worksfor rehabilitation were needed in addition to expansion of the silo capacity.Bizerte port silo works were affected by a dispute between OPNT and thecontractor concerning delayed payments; additional dredging also becamenecessary and this led to an amendment of the works contract in July 1986. Areallocation was approved by the Bank in October 1986 to cover the additionalcosts incurred (about $590,000). Despite these delays, the infrastructureforeseen at appraisal was all completed: the Ghannouch port silo wasconstructed, the Bizerte port silo was expanded, three storage silos (Sfax,Beja and Gafsa) were constructed, two were rehabilitated (Manouba and KalaaSeghira) and one was expanded (Kalaa Seghira). The 50 bulk grain hopper carswere purchased and the silo rail sidings were constructed to permit rapidloading and unloading of programmed trains.
13. Institutionai Component. Problems of management and organization inmany areas of the OC's operations were identified during preparation of theProject. To correct these deficiencies, new organizational units were to becreated in the OC to fill voids in planning and evaluation, maintenance andtransport. Second, the project provided for two technical assistance studies,one in accounting and finance, the other in the management of OC's operations.Third, the project included a study for the preparation of a second Projectwhich would focus on the rehabilitation and conversion to bulk handling of thedistribution circuit of locally produced grain and on the integration of thiscircuit with that for imported grain. The various organizational units wereeventually created within the OC and the studies were completed during thecourse of the Project and became useful guides for the reform program.Although a number of the reforms recommended by the studies were started underthe Project, progress was slow and was hampered by weak support for the policy

- xi
and institutional aspects of the Project within the OC, staffing problems andthe generally poor working conditions at the OC. This is described below(paras. 14-18). The Second Agricultural Sector Adjustment Loan is followingup on some of the recommendations of the management study (para. 17) and goodprogress has been made recently with maintenance (para. 19).
14. Creation of organizational units in the OC proved to be difficultmainly because of the lack of technical personnel at the OC with the resultthat new senior staff (Directors of PMU, transport, etc.) had to be secondedfrom other Ministries (the private sector was not interested because of thelow salaries). There was also no incentive for incumbent managers to stay atthe OC because they were overworked, had to undertake multiple tasks and wereprovided with poor administrative support and inadequate office facilities. Aproject management unit (PMU) had been established by the OC in September1981. However, a permanent PMU Director was not assigned to the project untilMarch 1983. Although recruited late, he performed well in the job(sea para. 8). His unit produced 11 reports on project progress. TheDirector of Planning and Evaluation came on duty as scheduled in March 1982.As mentioned in the PCR, he took charge in the Fall of 1984 of the division ofcomputerization and management information and the division of statisticswhich gave him the tools to create in the OC an organized planning andmonitoring system. The Director of Transport and Logistics was recruited onloan from the SCNFT only after prolonged intervention by the Bank. He waswell qualified, efficient and dynamic but was not provided with necessarystaff and had to work out of his old office at SCNFT. A silo maintenance unitwas established in late November 1982 (on schedule) and a division chief ofthe unit was appointed about three months later. However, he was not relievedof his previous post in charge of non-Bank financed new construction.Despite the Bank's recommendations, little action was taken to recruit newstaff or to improve working relations and conditions. This had adverseconsequences particularly for the implementation of the maintenance reforms, aproblem which was eventually rectified (in 1989, a decision was taken not tocreate a separate unit for the provision of maintenance services but to hirethe OC's silo contractor for ad-hoc assistance. See para. 19).
15. Studies. Consultrat recruitment for the technical assistancecomponent was planned for April 30, 1982 but was delayed by the laterecruitment of directors of PMU and Plan and Evaluation. A contract wassigned on November 11, 1982 with a partnership of French/Tunisian firms forexecution of the financial and management studies and for the study to preparea second phase project. For all three studies, the degree of complexity andthe time required to carry them out appears to have been underestimated atappraisal. However, all of the studies were eventually completed and providedvery useful recommendations and guidance to the OC.

- xii -
16. Audit and Rehabilitation of Financial and Accounting Systems ofthe OC. In 1984, a Tunisian auditing firm examined OC's accounts andconcluded that (a) they were unauditable and that no credibility could begiven to OC financial statements; (b) generally accepted accounting principleswere not followed and a new accounting system needed to be designed and setup; (c) the accounting, financial management, procurement and administrativefunctions of OC should be reorganized; and (d) the internal control functionshould be strengthened at the OC. After an unsuccessful attempt to reorganizethe OC's accounts in 1984 (financial study), it was decided to abandon theproposed approach of bringing accounts up-to-date chronologically, and to hirean accounting firm to restructure the OC's accounting and financial systems.As a result, in March 1987 the OC signed a turnkey contract with a Tunisianaccounting firm of international caliber to carry out this task in cooperationwith OC staff. One of the objectives was to make end-1987 OC accountsauditable. This task was carried out on schedule. The first audit report byan independent auditor was due June 30, 1988 but was not received by the Bank.Nonetheless, satisfactory audits of the project accounts for 1982-87 wereprepared and received by the Bank.
17. Management study. In January 1984, a draft report (finalizedNovember 1984) on the management of OC's operations presented a number ofuseful reform proposals concerning maintenance and the management of grainimports and stocks. However, for 18 months following the completion of thereport, no significant action was taken on its recommendations. The marketingdirector (appointed part-time in the summer of 1985) prepared an overallreorganizational plan for the OC. The plan was a sound one and was approvedby the OC's Board of Directors in the Fall of 1985 as foreseen.Recommendations were made to (a) improve the management and contracting ofgrain imports; (b) simplify the system of quality bonuses and penalties ingrain pricing; (c) improve the Government's system for financing costs ofgrain storage services; (d) rationalize the formula for equalizationreimbursements (transport); and (e) provide for the joint operations ofcollection centers by the OC and the cooperatives with the better existingfacility in any given locality being rehabilitated and the poorer onesabardoned. This would tend to shift some operational management away from theOC. The objective would be for the OC to progressively withdraw from theoperation of silos which would be turned over to the cooperatives or privatesector and to let the OC assume more of a policy role in the cereals sector.A number of these objectives and recommendations (e.g. in (c), (d) and (e)above) are being pursued under the Second Agricultural Sector Adjustment Loan(ASAL-II) (see para. 20). In addition to restructuring, the plan included anumber of urgently needed improvements in management practices designedi toincrease delegation of authority, provide for better financial controls,improve bilateral communication and provide for full participation of seniorstaff in policy advice to each other and to OC management. Little action wastaken to introduce the improved management techniques included in the plan. ANovember 1985 supervision report noted that senior managers at the OC did notcommunicate adequately with each other, and that the OC's relations with otheragencies, the grain cooperatives, consulting firms and ministries (Plan,Agriculture and National Economy) were not good.
- xiii -
18. Economic Impact. The project generally met its objectives. As notedin para. 8, the infrastructure program (representing more than 80 percent oftotal project costs) was carried out as foreseen and the silos constructed orrehabilitated are performing well. The institutional component was lesssuccessful (para. 13). The reestimated economic rate of return (ERR) of thewhole project is satisfactory at about 12.87 percent compared with the16.1 percent calculated in the SAR. The rate of return is most sensitive tolevels of imports which, as noted above, were at a record high level in 1988,the date of completion of the project. As a result, the return on investmentscalculated by the PCR is probably slightly higher than it would be in a yearof lower imports. Moreover, the PCR calculations include among the benefits"elimination of palliatt ve investments" that the Government would have had tomake if the project had not taken place. If the savings from not making theseinvestments is to be added as a benefit in the economic analysis, then thebenefits that those investments would have generated would have to besubtracted. Proper treatment of this issue would reduce the ERR marginally.However, these reductions would be outweighed by the fact that, when the PCRwas prepared, some of the silos had just become operational and with minoradjustments can raise their performance levels (e.g., the PCR mentions thatthe rate of operation of the Gabes silo was slow in 1988 due to the latecompletion of the rail siding serving the silo). In short, even with theadjustments to the economic analysis discussed above, the ERR would likelyremain satisfactorv.
19. Sustainabilitv. The SAR had recommended the establishment of anintegrated central maintenance service. The OC and the two cooperativesdecided, however, that the creation of a separate unit for maintenance wascostly and unnecessary, especially since the silo contractor, who had beenresponsible for civil works under the project, had trained technicians of theOC and the two coopeiatives in the operation and maintenance of the silos.Those technicians were then operating and maintaining the silos. Additionalassistance was sought from the silo contractor on an ad-hoc basis as needed.In 1989, a renewable contract with the firm was signed by the OC. This willhelp ensure that project investments are sustained and utilized efficiently.
CONCLUSION
20. Follow-un nroiect and recent nrogress on reforms (nara. 17). In1988, the Bank decided not to finance a second phase grain storage projectbecause it was felt that, in the future, emphasis should be given to buildingup the private, rather than public sector grain storage and handling. Thisshould be financed through the credit system. Through the Fourth AgriculturalCredit Project, the National Agricultural Bank:(BNA) is currently providingcredit to farmers for the construction of on-farm storage facilities. BNAwi'll need to mobilize new resources to expand this type of investment in thefuture. A Second Agricultural Sector Adjustment Loan (ASAL-II) was approved
- xiv -
in 1989 and aims to focus the OC on its primary role of regulator of thecereals subsector and stimulate the private and cooperative sectors to play alarger role in domestic cereal collection and feedgrain imports. This processis underway. The OC is starting to withdraw from cereal collection andstorage activities and imports of animal feedgrain are being opened up to theprivate sector. The OC is also disengaging from activities and investmentsnot directly related to the cereals subsector. The medium-term objective forthe cereals subsector supported by the ASAL-II is to create a more liberalizedsystem with the free market playing the predominant role and the Governmentproviding a regulatory and sector monitoring function. Further efforts topromote private sector participation in the cereals subsector are plannedunder a proposed Agricultural Sector Investment Loan (ASIL).
21. Lessons Learned. A number of lessons can be drawn from theexperience with this project.
(a) Institutional objectives of a project can be difficult toachieve if the project institutions operate in a regulatedpolicy environment. At an early stage of projectpreparation, the Bank recognized the need to strengthen theinstitutional capacity of the OC and this prompted theinclusion in the project of technical assistance, trainingand policy studies. This objective was difficult to achievedue to the complex policy environment in which the OCfunctioned (fixed prices, subsidies) and the fact that,while created in the form of a public enterprise, the OCalso served as an implementing agent of Government policy.As discussed in para. 20, the progressive withdrawal of theO from grain storage and collection activities and thestrengthening of its policy role will improve the efficiencyof the cereals subsector.
(b) In a complex, multi-sectoral project requiring theparticipation of various agencies and ministries, attentionshould be paid to ensuring the effective coordination of thedifferent actors. The project dealt with many issues indifferent sectors (grain storage, marketing, transport,financial). As a result, the project was complex andrequired different types of skills and expertise from boththe Tunisians and the Bank. For that reason, more attentionshould have been paid to ensuring that a qualified directorwas appointed to the PMU at project start-up and that theProject Coordination Committee (established before Loansignature) met regularly and;that it was effective inresolving inter-agency conflicts and fostering communicationand team work.
(c) Complex projects require intensive supervision at start-upand during implementation. For reasons explained in (b)above, the Bank should have supervised the project moreintensively particularly when it became apparent that the
- xv -
procurement arrangements which had been agreed to atnegotiations had changed, and that OC management was havingdifficulties making a firm commitment on awarding of thecontract for silo supervision. It would also have beenuseful if senior managers of the Bank had been more involvedin later stages of project implementation to help deal withinstitutional issues (studies, financial sector reforms).
(d) Consultants' qualifications and terms of reference should bechecked carefully to ensure that they have the requiredexperience and sufficient time to carry out their work, andthat they are familiar with the local context.
(e) Continued attention needs to be paid to operation andmaintenance (O&M) which are crucial to ensure thesustainability and effecitive utilization of projectinvestments.

CNEA PROJECT COMPLETION REPORT
REPUBLIC OF TUNISIA
GRAIN DISTRIBUTION AND STORAGE PROJECT(LOAN 2052-TUN)
O. ASC DATA
A. INIRODUCTIO
1.01 The Grain Distribution and Storage Project (Loan No. 2052-TUN, in
an amount of US$42 million for a period of five years) was approved in )ctober1981. The project was identified in March 1979 during an identificatio,nmission for an agricultural credit project ln Tunisia. Its objectives were toimprove collection, handling and storage of imported grain, as well astransportation within the country.
1.02 This document is the final version of the Project CompletionReport, and was prepared by a multidisciplinary CNEA team, using the followingsources
(i) documentation furnished by PD (the Project Directorate);
(Li) contact with the staff of the OC, particularly in the Directorateof Planning and Appraisal, the Directorate of Supply, and theDirectorate of Logistics;
(iii) data from the Technical Directorate of OPNT;
(iv) data from the Directorate of Studies and the Financial Directorateof SNCFT;
(v) a CNEA survey of port and storage silos, carried out in order togather information on flows of imported grain;
(vi) comments by the OC on the provisional report.
B. AGRICULTURE IN TUNISIA: GENERAL DATA
Ponulation
1.03 The general population and housing census of March 30, 1984 showedthe population of Tunisia to be 6,975,450. From 1975 to 1984, the annual rate
of increase was about 2.5%, this being higher than the rate between 1966 and
1975 (2.3%). The main demographic features are as follows:
(i) a masculinity ratio of over 100 (malea constitute 50.9% of thepopulation, in spite of the considerable number working abroad);
(Li) the population is young; in 1984, 40% of the population was under15 years of age, and those aged 65 or over constituted only 4.3%of the total; the median age was only 19.5, and the average agewas 24.5;
(iLL) 53% of the population is urban;
(iv) demographic growth varies from one region to another (Tunis region' 3.2%; South - 3.1%; Center/West - 2.7%; Northwest = only 1.4%).

The estimated population in 1986 was 7.4 million, and by 1991 itwill be about 8.372 million, assuming an annual growth rate of 2.5% from 1986to 1991.
Expenditure
1.04 The 1985 household budget and consumption survey showed annualexpenditure per person for the country as a whole to be D 471, i.e. an annualaverage per household of D 2,665. In general, expenditure in urban areas ismuch larger than in rural areas (D 619 per person per year, compared withD 294). This gap is becoming much more marked as the urbanization rateincreases.
1.05 In the structure of total annual expenditure per person, foodstands out as the largest item (D 184, or 39%). Grain accounts for 15.8% ofexpenditure on food, an annual D 28.9 per person, or 6.1% of the total budget.
GDP and Agriculture
1.06 From 1982 to 1987, GDP at factor cost increased by an annualaverage of 4.06% (at constant 1980 prices) to D 3,959 million. In 1987, theshare of agriculture and fishing in GDP was only about 17%, the remaining 83%being divided between industry (33.5%) and services (49.5%). Over the sameperiod, the annual rate of increase for the primary sector was 7.6% atconstant prices. Tabie 2 in Annex 1 shows trends in GDP from 1982 to 1987.
1.07 Outstanding debt in 1987 totaled D 4.47 billion, equivalent to 56%of GDP at market prices. Debt servicing was D 860 million, and the debt-service ratio was 26.8.
1.08 The external trade balance is perpetually in deficit. In 1987 itwas D 738.4 million, and in 1984 it had risen slightly above D 1 billion. Theimport coverage ratio was 70.6%. This is the highest level recorded since1975.
1.09 In 1987, the trade balance for agricultural products and foodshowed a deficit of D 21 million, and a coverage ratio of 91.4%. The samelevel of performance can certainly not be expected in 1988, because of thedrought that affected the 1987/88 crop year, and which is still continuing.In fact, the falloff in agricultural output in 1988 meant that a considerablevolume of imports was necessary in order to meet the needs of humanconsumption. Projections for 1988 show a defipit of about D 210 million and acoverage ratio of about 54%.
Grain Production
1.10 Grain continues to be a major item in the country's economicpolicy, both as regards production/imports and consumption.

-3-
1.11 Since 1980, the average area devoted to grain production has beenabout 1.5 million ha, including about 0.8 million ha in the north. Over thesame period, output has varied considerably from year to year. Record levelsof about 21 and 19 million guintals were achieved in the 1984/85 and 1986/87crop years (which were mateorologically favorable), whereas output was only2.9 million quintals in the 1987/88 crop year, when there was a drought.Table 3 in Annex 1 shows areas, outputs and yields since the 1961/62 cropyear.
1.12 In spite of achieving these record levels, grain output has notkept pace with consumption, which has increased more rapidly, mainly becauseof the following three factors: population growth, increases in income andthe continuation of subsidies on grain derivatives. This has led toconstantly increasing imports (2.1 million tons in 1988). Table 4 in Annex 1shows imports since 1979.
1.13 In addition, studies for thiB project show the followingprojections for grain, regardless of type:
PROJECTED SUPPLY-AND-DEMAND BALANCE: GRAIN
(in thousands of tons)
1986 1991 1996
DEMAND Projected Actual Projected Projected
Human 1,607 1,635 1,828 2,042Animal 584 584 710 804
Tota1 2,191 2.219 2.538 2,846
Domestic SuP12v 965 956 1,040 1,200
Im_prta 1.226 1.263 ?,498 _1646
C. THE CEREALS OFFICE AND THE COOPERATIVES
The Obiectiyes of the Cereals Office
1.14 The OC was established by Decree-Law No. 62-10 of April 3, 1962,modified and supplemented by Decree-Law No. 70-6 of September 26, 1970(ratified by Law No. 62-18 of May 24, 1962 and Law No. 70-47 of November 20,1970 and Law No. 86-67 of July 16, 1986, respectively). The OC is a publicaector industrial and commercial enterprise, incorporated and endowed with
-4-
financial autonomy. It is under the authority of the Ministry of Agriculture.
1.15 In accordance with the lawo establishing it, and subsequentlegislation, the OC has the following responsibilities:
- organizing, supervising and improving grain production;
- establishing measures for balancing resources and needs;
- organizing and monitoring marketing and the grain market;
- engaging in all necessary buying and selling transactions in orderto supplement supply or sell surpluses;
- organizing the production and distribution of animal feed and, ifnecessary, other agricultural items;
- on behalf of the Government, performing all operations related toagricultural products, in compliance with the relevant specialDecrees.
1.16 The OC holds a monopoly on imports and exports of grains and theirderivatives. In addition, it may issue general or restricted powers tospecial representatives for the purpose of performing certain commercialactivities.
The Orqanization of the OC
1.17 The OC is controlled by a board of directors composed of 13members, including representatives of the Ministries of Planning and Finance,Agriculture, and Industry and Commerce, the Prime Minister, farmers, themilling industry, semolina producers and the two cooperatives. The board ofdirectors is headed by a president-director-general who is responsible forday-to-day management. The president-director-general is assisted by a deputydirector general.
1.18 The OC consists of the following eight directorates, in additionto the Directorate General and the Secretariat General:
- the Directorate of Planning and Appraisal;
- the Directorate of Administrative ,Services;
- the Directorate of Financial Services;
- the Directorate of Supply;
- the Directorate of Logistics;
-5 -
the Directorate of Works and Maintenance;
- the Directorate of Food Industries;
- the Directorate for the Improvement of Production.
The Directorate of Supply is mainly responsible for planning andimplementing measures for the purchase and uale of domestic and importedgrain. The Directorate of Logistics is responsible for organizing,implementing and supervising the storage and distribution of goods marketed bythe OC. It ensures optimal utilization of storage capacity, vehicles andrailway stock. Among the responsibilities of the Directorate of Works andMaintenance is the management of the OC assets, mainly consisting of grainsilos, collection centers, warehouses and handling equipment.
TM 0C Activites
1.19 In the performance of its duties, the OC collects, stores anddistributes grain, using silos that it either owns or rents for the crop year.It import. grain to make up for shortfalls in domestic output, and exportsgrain when there is a surplus. Since the OC's operations usually ahow adeficit, because of the government's policy of subsidies, it receivescompensatory payments from the Calsse G6n6rale de Compensatlon (the PriceEqualization Fund), and these enable it to balance its accounts. At the sametime, the OC acts as the government's agent and office of payment for othercollection and storage agencies such as COCEBLE and CCGC, which collect grainon its behalf. The OC also makes proposals to the government for producer andconsumer price levels and thus also establishes the amounts per ton ofsubsidies at the level of distribution (i.e. milling) and breadmaking. It alsoproposes levels for storage charges. Thus, the OC performs a duel functionthat makes it a "judge in its own case" and puts it in a strong position vie-A-vie other agencies responsible for grain collection.
The Coonerative
1.20 The OC delegates powers to two cooperatives, COCESLE and CCGC, toparticipate in the collection and handling of grain. They are servicecooperatives whose purpose, according to their statutes, is the storage,preservation, processing and marketing of their members' agriculturalproducts, and the purchase, supply and joint manufacture of all productsnecessary for agriculture.
1.21 The cooperatives are under the authority of the Ministry ofAgriculture, and are controlled by boards comprising from three to twelvemembers elected by the General Assembly of their members. The board appointsa Director of the cooperative, who must not be a member of the latter, tomanage its affairs and be responsible to the board.

- 6 -
D. * STOiRAGE IRSTRUCTURE
1.22 In fulfilling its tasko to supply the country and satisfy anincreasing grain demand, the OC possesses a atorage and handl'nginfrastructure with a 633,100-ton capacity (including the silos to becompleted under this project). The breakdown (in tons) by storage agency andregion is as followas
AGENCY REGION SILOS WAREHOUSE FACILITIES TOTAL
OFFICE OF CEREALS NORTH 180,000 86,100 266,100CENTER AND SOUTH 123,700 20,200 143,900
TOTAL 303,700 106,300 410,000
COCEBLE NORTH 96,000 6,100 101,100CENTER AND SOUTH - _ _
TOTAL 96,000 5,100 101,100
CCOC NORTH 111,200 10,800 122,000CENTER AND SOUTH _- -
TOTAL 111,200 10,800 122,000
GRAND TOTAL TUNISIA 510,900 122,200 633,100
Seventy-seven percent of total storage capacity (489,200 tons) is in thenorth of the country, which is the main grain producing area (0.9 million ha).
1I. IDENTIFICATION. PREPARATION AND APPRAISAL
A. ORIGIN
2.01 In 1976, PAO issued a report entitled "A Policy and a Plan ofAction for Reinforcing National Food Security in Tunisia." Subsequently, poorharvests, coupled with rapidly rising demand for industrially milled grain farin excess of normal domestic production, led tb increased grain imports andstrains on the system of grain importing, storage and distribution. Thegovernment then requested Bank financing for a project for improving thecollection, handling and storage of imported grain, together with the systemsfor its transportation.
2.02 The project was identified by the following two FAO/World Bankmissionas

(i) An initial mission at the end of 1978 decided that grain handling,collection and storage facilities ahould be urgentlyrehabilitated, and that, in particular, silos costingUS$20 million (for which the OC had already undertaken studies)should be constructed.
(ii) During the March 1979 mission for identifying an agriculturalcredit project, it was decided that the grain storage projectshould be submitted separately to the World Bank. A projectidentification report (FAO/World Bank Report No. 27/9 TUN 11 ofJune 15, 1979) was drawn up and then discussed in June with thegovernment. An additional preparation work plan was submitted inan aide-mnemoire in July 1979.
B. PREPARATION AND APPRAISAL
2.03 The project was prepared by an FAO/World Bank mission that visitedTunisia from October 1 to October 20, 1979 in order to review projectidentification. In January 1980, a preparation report was drawn up(No. 6/80 TUN 14 of January 18, 1980). After submission and discussion withthe government, this report served as the basis for the government'sapplication to the World Bank for project financing. The studies that the OChad previously subcontracted to ATI (the engineering consultants) for theconstruction of the silos included in the project were annexed to thepreparation report.
2.04 Total project cost over three years (including physicalcontingencies) was D 22.4 million (about US$56.1 million), of which 67% was inforeign exchange. The project consisted of the following:
(i) conversion from bag to bulk handling of about 300 combineharvesters, and purchase of the necessary trailers;
(ii) equipping of three collection centers for the mechanical handlingof bags and of 20 collection centers for bulk reception anddispatch, and construction of four new collection centers;
(iii) construction of four silos with a total capacity of 60,000 tons,and rehabilitation and expanbion to 30,000 tons of the port siloat Bizerte;
(iv) purchase of 245 hopper cars;
(v) studies and technical assistance.
2.05 The preparation report left some issues to be resolved before theloan was negotiated. A World Bank appraisal mission visited Tunisia inFebruary 1981 and reviewed the project, and its conclusions formed the basisfor an appraisal repo_t produced in September 1981 (Report No. 3503-TUN).
- 8 -
2.06 During negotiations, it became clear that the import circuit,which is larger and developing more rapidly (Table 4 of Annex 1), presentedmore urgent problems because of the extreme congestion in the ports (resultingin almost continuous occupation of the quay by grain ships), long waitingperiods for vessels in the harbouL, high demurrage (which must be paid inforeign exchange), high fees for the quay storage of bags of grain, and thecosts of labor and bags, which have to be filled, weighed and handled. Tosolve these problems, the government and the FAO/IBRD mission decided toimplement the program in tranches. The first of these was to consist of theconstruction of 100,000 tons of additional storage capacity for importedgrain, and, once the necessary studies had been made, the second was to dealwith the collection circuit.
C. DESCRIPTION
2.07 The project was designed to:
(i) increase grain storage capacities;
(ii) reduce the congestion, handling costs, demurrage charges and grainlosses incurred at the five main ports because of insufficientbulk handling and throughput capacity;
(iii) reduce the costs of transporting and handling imported grainresulting from insufficient bulk rail transport, poor transportprogramming, and outdated and insufficient downstream silo storageand throughput capacity;
(iv) strengthen the technical capacity and financial management of theOC;
(v) prepare a second project designed to modernize the system ofcollection, storage and transport of local grain.
2.08 According to the appraisal, the components of the project were tobe:
(a) Port Silos:
Rehabi'itation, adaptation for imports and expansion to 30,000tons of the existing port silo at pizerte, implementation ofrelated port works for the handling of imports, and constructionof a 30,000-ton port silo at the new port of Ghannouch on theoutskirts of the city of Gabes.
-9-
(b) Construction of Storage Silos:
Construction of four storage silos, two of lO,000 tons each atBaja in the north and Gafea in the south, one of 20,000 tons atSfax, and one an expansion to 28,000 tons of an existing silo of8,000 tons at Kalaa Seghira near Sousse.
(c) Rehabilitation of Storage Silos:
Rehabilitation of a 50,000-ton storage silo at Manouba (Tunis).
(d) Port Works:
Construction of three dolphins for the mooring of ships at theBizerte silo, and limited quayside dredging to accommodate shipsof up to 30,000 tons.
(e) Rehabilitation and Construction of Rail Sidina3:
Construction and/or rehabilitation under the project of silo railsidings, with a view to accommodating programmed trains with aminimun of maneuvering.
(f) Acguisition of Hoper Cars:
Acquisition of 50 hopper care to be used in three programmedtrains for transporting imported grain from Bizerte andGabes/Ghannouch to the storage silos and downstream millingfacilities.
(g) Technical-Assistance and Training:
Technical assistance for planning grain imports and transportationin Tunisia, silo management and maintenance, stock and costcontrol, and preparation of a second project.
2.09. Estimated project cost over five years, including physical andprice contingencies, was D 37.5 million (about US$93.9 million), of whichD 16.8 million (about US$42.1 million; i.e. 45%) was in foreign exchange. TheOC, which is under the authority of the Ministry of Agriculture, was to beresponsible for project execution, assisted by OPNT and SNCFT. The estimatedeconomic rate of return was 16%. However, thip rate is particularly sensitiveto grain import projections.
2.10 The OC was to be responsible for silo construction andrbhabilitation, preparation of the study of its own financial system, andpreparation of a grain storage project constituting the second stage. OPNTwas to enter into agreements with the OC, making the former responsible forthe construction and maintenance of the dolphins at the Bizerte silo. The

- 10 -
Ministry of Infrastructure (Ministbre de 1'Equipement) was to be responsiblefor construction of the quay at the port silo of Gabes/Ghannouch. As a resultof agreements to be made with the OC, SNCFT was to be responsible forconstructing the silo rail sidings and acquiring, maintaining and operating 50bulk rail cars that would be the property of the OC.
III. POJE CT EXECUTION
A. PROJECT START-UP
3.01 Project start-up was slow, mainly on account of the difficultieswith the consultants ATI and OTE'-PINGAT. The loan became effective as of1982, but construction did not start until around the third quarter of 1984.
B. AMENDMENTS DURING IMPLEMENTATION
3.02 The design of the project as prepared by the appraisal mission wasnot changed. However, the Loan Agreement was amended on two occasions duringexecution: in August 1985 and December 1988. The first amendment concernedthe following points:
- raising of the proportion of expenditures covered by the WorldBank for silo construction and rail sidings to 60%;
- execution of additional works, including in particular expansionof the 8,000-ton Beja silo;
- cancellation of US$4 million of the loan, making the new loanamount US$38 million.
The details of additional works contracted out in accordance withArticle 34 of the Administrative and Financial Conditions (Cahiers des ClausesAdministratives et Financibres) are given in Table 1 of Annex 2.
The second amendment concerned cancellation of US$4.6 million ofthe loan amount, making the final loan amount US$33.4 million.
C. IMPLEMENTATION SCHEDULE
1. THE SEVEN SILOS
Award of Contracts for the Silos
3.03 According to the SAR, bids for construction of the silos were tobe invited in November 1981, evaluation of the bids was to be completed by theend of January 1982 and the notification to proceed was to be given around the

- 11 -
end of October 1982. The SAR implementation schedule is given in Table 2 ofAnnex 2.
3.04 In fact, the call for bids was not issued until 19 months afterthe date set in the SAR (in June 1983). There were several reasons for thisdelay, the main ones advanced by the Project Coordination Committee (PCC)being:1
- the study for the Gabes silo, which required extra time for thesoil study needed by the execution study, was not delivered to theOC by OTEI until June 15, 1982;
- ATI's withdrawal from supervision of the Gabes silo works inNovember 1982 and the OC's decision, following inconclusivenegotiations, to terminate the OTEI-PINGAT group's contract as ofFebruary 1983;
- for the hiring of a group of consultant firms to evaluate the bidsand supervise the construction of the silos, the OC asked forquotations in February 1983 following which a contract was signedin May 1983 with the SCET-SERETE group, whose bid was adjudged themost advantageous.
3.05 The review and evaluation of the bids, scheduled to take ninemonths according to the SAR, was performed by the SCET-SERETE group within thetime set. The contract for construction of the silos was concluded withBUHLER-MIAG on July 11, 1984, said firms' bid being adjudged the mostattractive. The notice to proceed2 notifying the contractor to start workwas sent to BUHLER-MIAG on July 12, 1984 and became effective August 1, 1984,and a new schedule specifying, among other things, setting up of the site asof August 31, 1984, and provisional acceptance of the silos on December 31,19863 was drawn up. The detailed planning of the seven silos program isgiven in Table 3 of Annex 2.
See minutes of the third, fourth, fifth and sixth meetings of thePCC.
2 Minutes of ninth meeting of the PCC.
3 Completion date of the Ghannouch silo, construction of which was totake the most time.

- 12 -
Execution of Works
3.06 Port Silos
The intention was to rehabilitate, expand and develop the Bizerteport silo to receive imported products, raising its capacity to 30,000 tong,and to build a 30,000-ton port silo in the new port of Ghannouch at Gabes.The new cells were to be of reinforced concrete, vertical and cylindrical infcrm, and built using slipform construction. The Bizerte cells were to beintegrated into the existing ones thanks to a new handling, cleaning, weighingand dust-control system. The pneumatic equipment for unloading the ships andthe conveyors for carrying the grain to the silos was to have a capacity of300 tons/hour. At Ghannouch, the conveyor system was to be located in anunderground gallery. The SAR also called for simultaneous hopper-car andtruck loading capacities of 200 tons/hour at Bizerte and of 200 tons/hour forhopper cars and 100 tons/hour for trucks at Ghannouch; a reserve receptioncapacity of 100 tons/hour for intermittent rail and truck deliveries atBizerte; and a supplementary 20 tons/hour bagging capacity for urgentshipments. According to the SAR, execution was to start in November 1982 forprovisional acceptance in April 1985 and final acceptance in April 1986(Gabes/Ghannouch silos, for which the most time was required).
3.07 In fact, execution of the Bizerte silo started three months behindthe contract date of July 1984, while work on the Gabes/Ghannouch silo startedseven months behind schedule. Quarterly Reports 1 and 2 list a number ofreasons for these delays, mainly:
- failure by contractor to properly organize the start of the work,with execution plans that did not take the existing situation intoaccount;
- contractor's unfamiliarity with the local context.
3.08 It proved impossible for these delays to be made up duringexecution of the works, which were completed 15 months and 20 days behindschedule for the Bizerte silo and 6 months and 27 days late for theGabes/Ghannouch silo. The delays in relation to the original schedule for thedifferent silos are given in Annex 2, Table 4.
Storage Silos
3.09 In addition to the Bizerte and Gabes/Ghannouch port silos, fourstorage silos were to be built: two of 10,000 tons each (one at Beja and oneat Gafsa), one 20,000-ton silo at Sfax, and expansion of an existing silo atKalaa Seghira from 8,000 tons to 28,000 tons. The SAR also called for

13 -
rehabilitation of a 50,000-ton silo at Manouba (Tunis). According to the SAR,work was also to be started in November 1982 for provisional acceptance inDecember 1985 and final acceptance in December 1986. The contract scheduledrawn up in July 1984 was based on work being started in October 1984, withprovisional acceptance in July 1986 and final acceptance in July 1987.
3.10 In reality, work started one month behind schedule for Beja, Sfaxand oafsa; 1 month and 24 days behind schedule for Manouba; and 4 monthsbehind schedule for expansion of the Kalaa Seghira silo. As regards the maincontract, the works were completed with delays ranging from 4 months and 22days for the Beja silo to 10 months and 12 days for the Sfax silo. Thesupplementary works for Beja (capacity increase from 8,000 tons) and KalaaSeghira (renovation) were completed with delays of 10 months and 6 days forthe former and 21 months and 15 days for the latter. The starting andcompletion dates for the work on the various storage silos were as follows:
STORAGE SILOS: CONTRACTUAL AND ACTUAL DATES
START OF WORKS COMPLETION OF WORKS ACTUALSILOS PROVISIONAL
Contractual ActuaL Contractual ActuaL ACCEPTANCE
Beja silo 8/1/84 11/7/84 3/15/86 8/6/86 10/6/86
Expansion of 8eja silo / ... ... 3/15/86 1/21/87 2/3/87
Kalaa Seghiro silo 8/1/84 3/1/85 7/15/86 4/10/87 5/21/87
Renovation of K.S. silo 1/ .. ... 7/15/86 4/30/88 6/2/88
Sfax silo 8/1/84 1/1/85 7/15/86 5/27/87 6/22/87
Gafsa silo 8/1/84 3/1/85 7/15/86 2/15/87 3/24/87
Manouba sflo 8/1/84 11/24/84 11/15/85 8/6/86 10/6/86
1/ Supplementary works
3.11 The contract for construction and equipment of the silos wasawarded on a global lump-sum basis not subject to revision or adjustment,under the conditions specified in the Administrative and Financial Conditions.
The following table presents the base contract amounts, the costsincurred and the differences between the estimated and actual figures (fordetails, please see Tables 5 and 6 in Annex 2).

- 14 -
SEVEN SILOS POGR_AM - ESTIMATED AND ACITUL COSTS
Category DT Portion FF Portion DM Portion
1. Be Colnrtact
§BTOT_A 23,760,739.000 60,067,810.000 21,772,910.000
2. Actual Costs
Acc. to base 21,827,629.536 60,174,134.000 21,737,481.000contract
* Sums still to be 137,000.000 62,196.000 44,724.000paid
- Supplementary works 1,911,634.339 3,042,002.74 1,088,017.600Reductions 431,470.864 1,006,688.39 154,208.87
_USU=TAL 23,444.793.011 62.271,644.35 22.7160.13,73
DIFFERENS 31S,945.989 - 2,203,834.35 - 943,103.73
After performance of the contract and on the baois of an estimateof the amount remaining to be paid to BUHLER-MIAG, there is a negative foreignexchange balance (overrun compared with estimates) and a positive figure forlocal currency expenditures. The dinar savings derive entirely from theexemption from import duties and taxes granted to the contract.
3.12 According to the SAR estimates, upon completion of the project thevolume of imports would be around 1,226,000 tonsa 450,000 toni would come inthrough the port of La Goulette, 370,000 tons through Bizerte and 406,000 tonsthrough Gabes. In fact, grain imports in 1988 amounted to 2,043,000 tons.The actual proportions unloaded in the five Tunisian ports also proveddifferent from the SAR estimates. The following table presents grain importsby port. Table 6 in Annex 2 sets out the quantities imported in 1988 by portand by type of grain.

- 15 -
ESTIMATES ACTUALSCATEGORY
Quantity % Quantity %(tons) (tons)
Port of Goulette 450,000 37 804,072 39Port of Bizerte 370,000 30 455,158 22
Port of Gabes 406,000 33 317,174 16Port of Rades --- __ 163,818 a
Prot of Sousse __ __ 53,659 3
Port of Sfax - - 248,761 12
TOTAL 1,226,000 100 2,042,642 100
- ~ ~~ ~~~~~~~~~~~~~~ .1 ... _I
Examination of this table leadr to the following mainobservations:
,i) In 1988, the real project completion year, grain imports exceeded
the estimates by 816,642 tons, making the total actual figure 167%of the SAR estimate.
(ii) The port silos (La Goulette, Bizerte and Gabes) received 1,576,000tons, i.e. 77% of imports, the rest (467,000 tons, or 23% of
imports) was unloaded in the traditional before-project ports(Rades, Sousse, Sfax).
(iii) Despite the completion of the project, the La Goulette port silois still receiving the largest proportion of imported grain. Thissilo made 29 turnovers compared with an estimated 15, the Bizertesilo made 15, compared with an estimated 12, and the Gabes siloabout 11 compared with an estimate of 14. There are severalreasons for this low level of operation, the two main ones being:
- The Gabes-Ghannouch silo (put into service in December 1987)was to be operated at 70% of capacity as of the preliminarydate of entry into service, and at 100% as of the end of theguarantee period, according to the SAR. In 1988 (theguarantee period), this silo was operating at about 80% ofcapacity.
Construction of the rail siding serving the Gabes-Ghannouchsilo was completed four months after the date of entry intoservice of the silo, i.e. on April 15, 1988. For those fourmonths it was very difficult to clear the silo using trucksalone, so that the silo's rate of operation during thatperiod was very slow.

- 16 -
3.13 According to the SAR, the Beja, Gafsa, Sfax and Kalaa Seghirastorage silos were to achieve turnovers of 10, 5, 4.5 and 6, respectively. Infact, the turnover rates posted in 1988 were below the estimates for Beja andKalaa Seghira and above estimates for Gafsa and, especially, Sfax. Thefollowing table presents the quantities received per storage silo and theestimated and actual turnover rates.
QUANTITIES TURNOVER RATESSILO RECEIVED IN 1988
(1000 tons) ESTIMATED ACTUAL
Beja silo 41 10 (1) 2.3Gafsa silo 91 5 (2)Sfax silo 320 4.5 9Kalaa Seghira 16silo 147 6
5.3
1/ Based on estimated capacity of 10,000 tons.J. Based on actual capacity of 18,000 tons.
The following comments can be made concerning this table:
- According to the SAR, the Kalaa Seghira storage silo (put intoservice in May 1987) was to be operated at 70% of its capacity.This silo, still in its guarantee period, was operated at 88% ofcapacity, i.e. a higher rate than estimated.
- The turnover rate for the Beja silo was low. In view of the:drought in 1987 and 1988, the Beja silo was used primarily forstoring seed grain taken from the harvest. As a result, the cellswere occupied for the greater part of the year (about 8months/year) by seed, which precluded a higher turnover rate.
3.14 It is important to note that during the guarantee period and priorto final acceptance of the silos, more or less sizable cracks developed incertain cells. These cracks occurred both in existing cells rehabilitated bythe project (Manouba, Bizerte) and in newly built ones (Beja especially).Regrading the rehabilitated cells, it should be noted that three 2,000-toncells in the Manouba silo are not currently operational due to cracks; theusable capacity of this silo, planned at 50,000 tons, is presently only33-35,000 tons. In the new silos, cracks have been found only in the 2,000-ton cells; no problems of any sort have been found in the small 500-ton cells.It is therefore urgent and imperative that this problem be resolved in orderto safeguard the project benefits and also to prevent similar problems arisingduring the second project, which comprises essentially rehabilitation.
- 17 -
3.15 Lastly, there is presently a financial dispute between BUHLER-MIAGand the OC. The amount of the claim, according to a voluminous dossiercompiled by the contractor, is about D 5.5 million, i.e. around 14% of thetotal cost (including taxes) of the silo program (D 38.6 million). Inaccordance with Article 46 of the Administrative and Financial Conditions,this dispute has been submitted to the Prime Minister's Consultativa Committeefor amicable settlement; the OC rejects the entire claim.
2. PORT WORKS
3.16 According to the SAR, the existing quay at Bizerte was to beimproved and expanded by the construction of three dolphins and limitedquayside dredging to make it possible to accommodate 30,000-ton ships. Theseworks were to be started in July 1982 and completed by the end of December1983. In fact, the works were not started until two years and five monthsafter that date. An international bid request was issued on July 16, 1984 andnotification to commence working was sent to Societa Italiana Dragaggi, whosebid was the most advantageous, on January 15, 1986, hence a total delay of 17months and 20 days, with a work stoppage of about two months (from 3/3/86 to5/4/86). Final acceptance of the works took place on September 17, 1987.
3.17 The total cost of the contract was D 2,912,950, of which D 931,201was foreign exchange (32%). This figure also covered the optional tranche ofdredging works to be performed in the Bay of Sabra (D 596,955). Duringexecution, this optional tranche was eliminated, and a supplementary agreementwas signed with the contractor for the performance of additional works for atotal of D 608,429.320. This raised the contract amount to D 2,924,424.320.Actual cost was D 2,966,245.516, hence a slight overrun of D 41,821.196 or1.4%.
The following table shows the key contract execution dates;together with estimated and actual amounts.

- 18 -
PORT WORKS
CATEGORY ESTIMATED ACTUAL
1. ED.tes
Notice of prequalification 8/1/82 6/14/83Consultation --- 4/1S/84International bid request --- 7/16/84Bid evaluation --- 11/7/84Contract approval --- 1/15/85Notification to start work --- 1/15/85Supplementary agreement --- 7/21/86Total time 18 months 17 months 20 daysProvisional acceptance 12/31/83 9/5/86Final acceptance 12/31/84 9/17/87
2. Amounts (in dinars)
Initial contract 2,315,995.000 ---Optional works 596,955.000
Total 2,912,250.000 ---
3. Amended amounts (in dinars)
Initial contract 2,315,995.000 ---Supplementary works 608,429.320 ---
Total 2,924,424.320 2,966,245.516
3. RAILWAY PROGRAM
3.18 Procurement of Hogper Cars: According to the SAR estimates,procurement of 50 hopper cars for grain hauling (26 narrow gauge and 24standard gauge) of about 64 tons gross weight and a net load capacity of 47tons, was to be effected in the course of 1983. In fact, the internationalbid request was issued by SNCFT, acting on beh lf of the OC, in September1983. The contract with PAUVET-GIREL was signed in July 1984. The amount ofthis contract was F 13,461,660.
3.19 The 50 hopper cars were shipped to Tunisia in two batches:
(i) First shiiment: 13 metric and 12 standard-gauge cars were

- 19 -
delivered in August 1984. These cars were run through thenecessary tests and put into service on December 1, 1984.
(Ui) Second shinment: 13 metric and 12 standard gauge-cars weredelivered in October 1984. The standard-gauge cars were testedand put into service on December 20, 1984, and the metric-gaugecars on December 28, 1984.
3.20 Bail Sidings
The SAR envisaged construction and rehabilitation of the railsidings serving the project silos. These works were to be carried out in1983. In 1982 the OC concluded an agreement with SNCFT under which the latterwao to -- among other things --- build the sidings to the silos for an amountof D 1,760,000. On the basis of this agreement, during the period October-December 1982, SNCFT proceeded to procure the project equipment in small lotsthrough its general equipment procurement contracts. Continuous rail layingwas not started until May 1985 (Manouba) and completed in July 1988 (KalaaSeghira). The following table shows, by silo, the dates work was started andwhen the sidings were put into service.
SILO DATE WORK STARTED DATE TAKEN INTO SERVICE
* Manouba April 1985 June 1986Beja June 1987 July 1987Bizerte August 1986 June 1987Sfax May 1987 June 1987Kalaa Seghira May 1987 July 1988Gafsa June 1987 July 1987Gabes November 1986 April 1988
3.21 According to the SAR estimates, 570,000 tons of grain, or 46% ofimports, were to be shipped from the port silos to all destinations by threeprogrammed trains. In 1988, 912,000 tons, or 45% of grain imports, were movedby rail, representing on average 1.5 turnovers per day. By swiftly moving thegrain out, these trains made above-estimate turnovers possible (see Table inAnnex 4).
3.22 To handle the quantities involved and in addition to the 50 hoppercars purchased by the project and the 12 STPA cars, the OC used a hundrednarrow-gauge cars belonging to SNCFT, including 70 YC 20-ton cars, and sixstandard-gauge cars belonging to CCGC. It is accordingly quite clear that the50 hopper cars included in the SAR would not, by themselves alone, have beenenough to haul the imported grain. For the second project involving localgrain, the hopper car fleet should be increased so that the project goals canbe better met as regards transportation.
- 20 -
4. TECHNICAL- ASSISTANCE
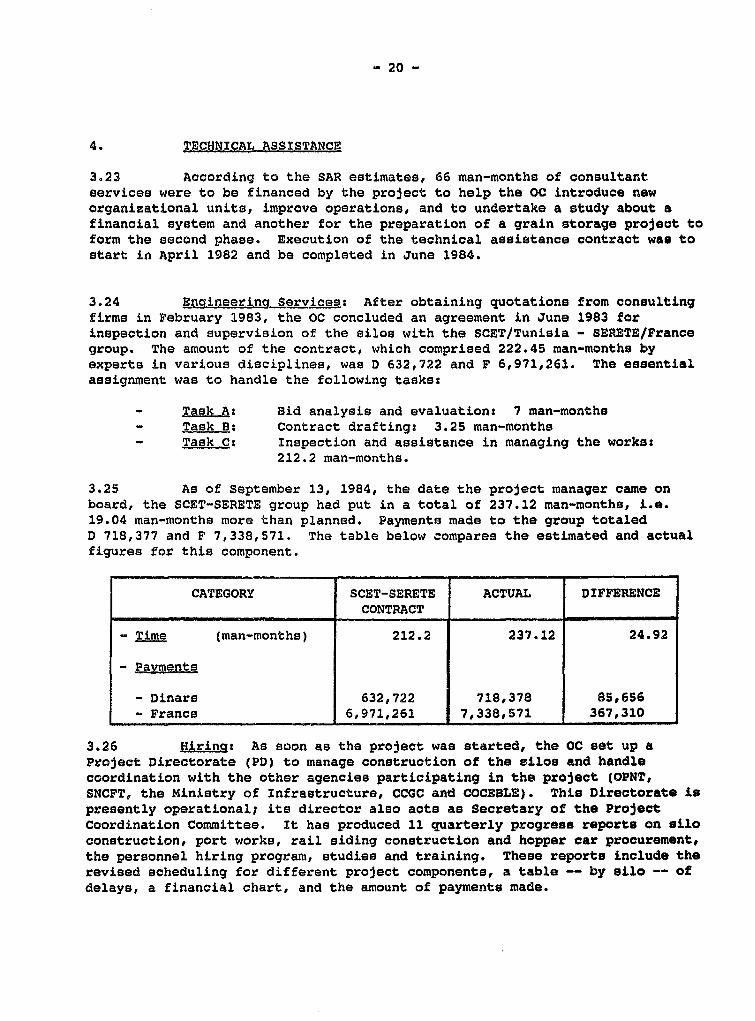
3.23 According to the SAR estimates, 66 man-months of consultantservices were to be financed by the project to help the OC introduce neworganizational units, improve operations, and to undertake a study about afinancial system and another for the preparation of a grain storage project toform the second phase. Execution of the technical assistance contract was tostart in April 1982 and be completed in June 1984.
3.24 En-ineegno Se rvice: After obtaining quotations from consultingfirms in February 1983, the OC concluded an agreement in June 1983 forinspection and supervision of the silos with the SCET/Tunisia - SERETE/Francegroup. The amount of the contract, which comprised 222.45 man-months byexperts in various disciplines, was D 632,722 and F 6,971,261. The essentialassignment was to handle the following tasks:
- Task A: Bid analysis and evaluation: 7 man-monthe- TaskBs Contract drafting: 3.25 man-months= Task C: Inspection and assistance in managing the works:
212.2 man-months.
3.25 As of September 13, 1984, the date the project manager came onboard, the SCET-SERETE group had put in a total of 237.12 man-months, i.e.19.04 man-months more than planned. Payments made to the group totaledD 718,377 and F 7,338,571. The table below compares the estimated and actualfigures for this component.
CATEGORY SCET-SERETE ACTUAL DIFFERENCECONTRACT
- Time (man-months) 212.2 237.12 24.92
- ayments
- Dinars 632,722 718,378 85,656_ Francse 6,971,261 7,338,571 367,310
3.26 Hirinq: As soon as the project was started, the OC set up aProject Directorate (PD) to manage construction of the silos and handlecoordination with the other agencies participating in the project (OPNT,SNCFT, the Ministry of Infrastructure, CCGC and COCEBLE). This Directorate ispresently operational; its director also acts as Secretary of the ProjectCoordination Committee. It has produced 11 quarterly progress reports on siloconstruction, port works, rail siding construction and hopper car procurement,the personnel hiring program, studies and training. These reports include therevised scheduling for different project components, a table -- by silo -- ofdelays, a financial chart, and the amount of payments made.
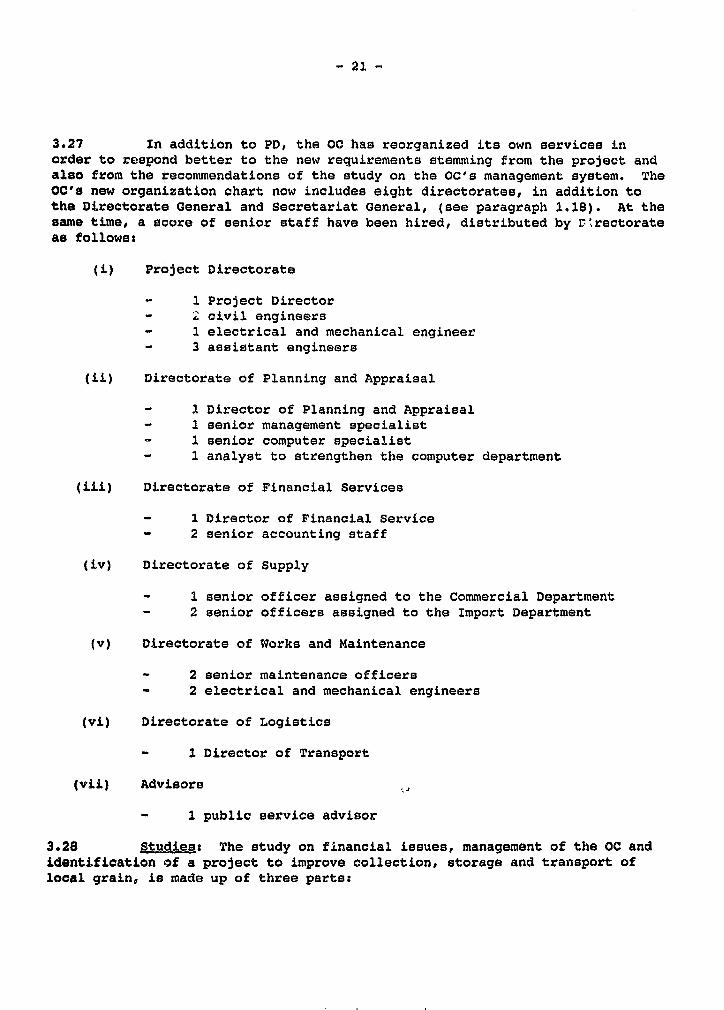
- 21 -
3.27 In addition to PD, the OC has reorganized its own services inorder to respohd better to the new requirements stemming from the project andalso from the recommendations of the study on the Oc's management system. TheOC's new organization chart now includes eight directorates, in addition tothe Directorate General and Secretariat General, (see paragraph 1.18). At thesame time, a score of senior staff have been hired, distributed by r rectorateas followss
(i) Project Directorate
- 1 Project Director- 2 civil engineers- 1 electrical and mechanical engineer- 3 assistant engineers
(ii) Directorate of Planning and Appraisal
- 1 Director of Planning and Appraisal- 1 senior management specialist- 1 senior computer specialist- 1 analyst to strengthen the computer department
(iii) Directorate of Financial Services
- 1 Director of Financial Service- 2 senior accounting staff
(iv) Directorate of Supply
- 1 senior officer assigned to the Commercial Department- 2 senior officers assigned to the Import Department
(v) Directorate of Works and Maintenance
- 2 senior maintenance officers- 2 electrical and mechanical engineers
(vi) Directorate of Logistics
- 1 Director of Transport
(vii) Advisors
- 1 public service advisor
3.28 Studies: The study on financial issues, management of the OC andidentification of a project to improve collection, storage and transport oflocal grain, is made up of three parts:
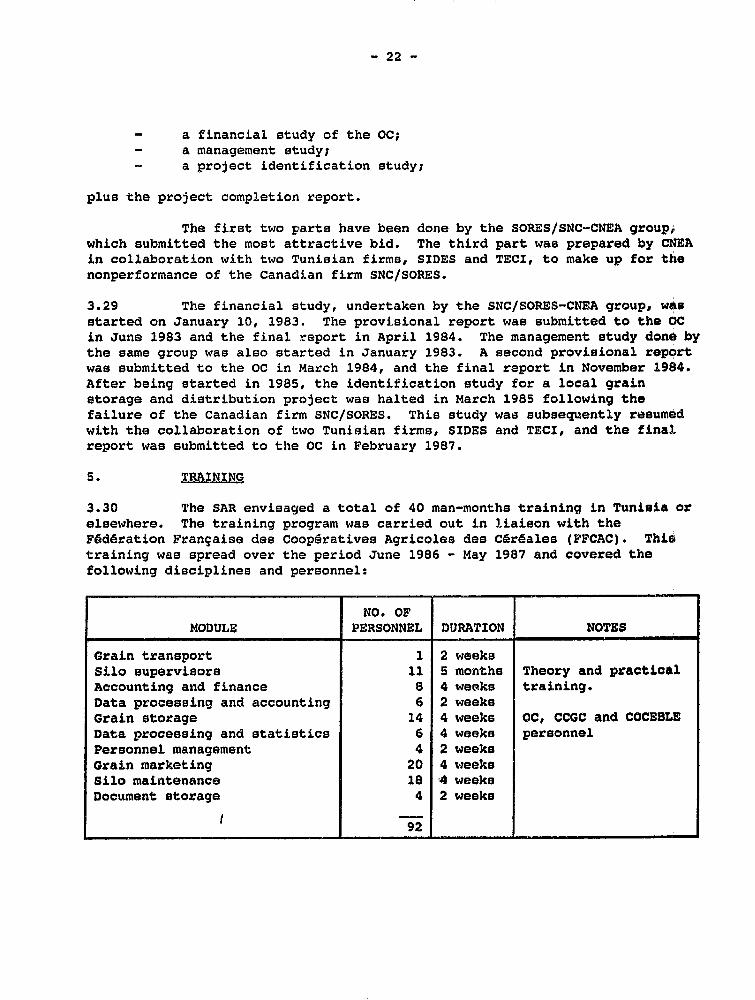
- 22 -
- a financial study of the OC;- a management study;
- a project identification study;
plus the project completion report.
The first two parts have been done by the SORES/SNC-CNEA group,which submitted the most attractive bid. The third part was prepared by CNEAin collaboration with two Tunisian firms, SIDES and TECI, to make up for thenonperformance of the Canadian firm SNC/SORES.
3.29 The financial study, undertaken by the SNC/SORES-CNEA group, wasstarted on January 10, 1983. The provisional report was submitted to the OCin June 1983 and the final report in April 1984. The management study done bythe same group was also started in January 1983. A second provisional reportwas submitted to the OC in March 1984, and the final report in November 1984.After being started in 1985, the identification study for a local grainstorage and distribution project was halted in March 1985 following thefailure of the Canadian firm SNC/SORES. This study was subsequently resumedwith the collaboration of two Tunisian firms, SIDES and TECI, and the finalreport was submitted to the OC in February 1987.
5. TRAINING
3.30 The SAR envisaged a total of 40 man-months training in Tunisia orelsewhere. The training program was carried out in liaison with theF6deration Frangaise des Cooperatives Agricoles des Cdr6ales (FFCAC). Thistraining was spread over the period June 1986 - May 1987 and covered thefollowing disciplines and personnel:
NO. OFMODULE PERSONNEL DURATION NOTES
Grain transport 1 2 weeksSilo supervisors 11 5 months Theory and practicalAccounting and finance 8 4 weeks training.Data processing and accounting 6 2 weeksGrain storage 14 4 weeks OC, CCGC and COCEBLEData processing and statistics 6 4 weeks personnelPersonnel management 4 2 weeksGrain marketing 20 4 weeksSilo maintenance 18 4 weeksDocument storage 4 2 weeks
1 ~~~~~~92
- 23 -
3.31 Evaluation meetings of the personnel responsible for this trainingwere held at the OC and in France, the first in Paris in Octobar 1986 and thesecond in June 1987 in Tunis. During the second meeting, FFCAC arranged avisit to Tunisia focusing on the Beja collection and storage silo for the silopersonnel. This exchange of experience will be strengthened by means ofhigh-level courses; the cost will be met by ONIC.
Moreover, and in the context of the second project (which would beconcerned with local gr&in), the intention is to organize training courses inTunisia, to be led by ON1CZ and FFCAC specialists on the French side, and bythe OC, CCGC and COCEBLE staff on the Tunisian side. The trainers would betrained in France and the cost would be covered by ONIC.
3.32 The training provided by BUHLER-MIAG -- as part of the contractfor constructing and rehabilitating seven silos -- covered 22 technicians.The training, which lasted three months, was given in two periods:
from February 17, 1986 to April 12, 1986: theoretical training ingrain handling machinery;
- from June 15, 1986 to July 19, 1986: theoretical training inelectricity handling and lighting.
After this theoretical training, the 22 technicians were assignedto the silos to follow and participate in the construction and trials of theinstallations. They are presently responsible for all maintenance workrelated to the seven silos.
D. PROJECT COST, FINANCING AND DISBURSEMENTS
1. PROJECT CqOT
3.33 The total project cost, including contingencies and reserves forprice increases, was estimated by the SAR at D 37.5 million (approximatelyUS$93.9 million). Actual cost after implementation is estimated to beD 47.8 million (some US$60 million) or 127% of the SAR estimate. Actual costhas been calculated on the basis of actual expenditures through December 31,1988, and of payments outstanding in the areas of silo construction, railsidings and engineering. Tables 1 and 2 of Annex 3 show actual and estimatedexpenditures from 1982 to 1988, and give a comparison between the costestimated by the preparation report, the appr#1sal report and actual costs. Acost comparison by category is given below:

- 24 -
SAR ESTIMATE(1) ACTUAL AS % OF SARCATEGORY
D '000 US$'O00 D '000 US$'000 DINARS US$
Site purchase - - 302 475 -_Silo conetruction 27,400 68,400 34,730 42,918 127 63Silo rehabilitation 2,400 6,000 3,918 4,737 163 79Port works 800 2,100 2,966 3,967 371 189Rail sidings 2,400 6,100 1,868 2,294 78 38Purchase of Hopper cars 1,800 4,C00 1,404 1,696 78 37Engineering 1,900 4,800 1,896 2,449 100 51Tech. assistance and 800 1,900 701 891 88 47trainingUnallocated - - - 700 - _
Total 37,500 93,900 47,785 60,127 127 64
3.34 Total project cost after completion was 27% higher than the SARestimate, despite reductions for rail sidings, hopper cars, and technicalassistance and training. This cost increase of around D 10.3 million is to beexpected, for the following principal reasonss
(i) The Appraisal Report does not take account of the cost of "sitepurchase" for silo construction. The OC spending on this itemtotals D 302,000.
(ii) The Appraisal Report does not take account of the cost of ATI'sconsultancy services. The OC spending on this item totalsD 178,000.
(iii) The most attractive bid for silo construction is someD 5.5 million higher than the SAR estimate.
(iv) The OC ordered supplementary works at a net cost of aroundD 1.9 million. This amount takes account of deductions for worksnot done or poorly executed.
With the fall in the value of the dinar from US$2.5 in 1981 toUS$1.11 in 1988, the total dollar cost of the project is US$60 million, or 64%of the SAR estimate, a saving of US$33.8 million.
2. FINANCING AND DISBURSEMENTS
3.35 The World Bank loan of US$42 million (D 16.8 million) was tofinance between 40% and 50% of silo construction, 60% of port works, 80% ofexpenditures on engineering, studies and technical assistance, and 100% of theforeign exchange cost of hopper care and overseas training. The Bank loan was
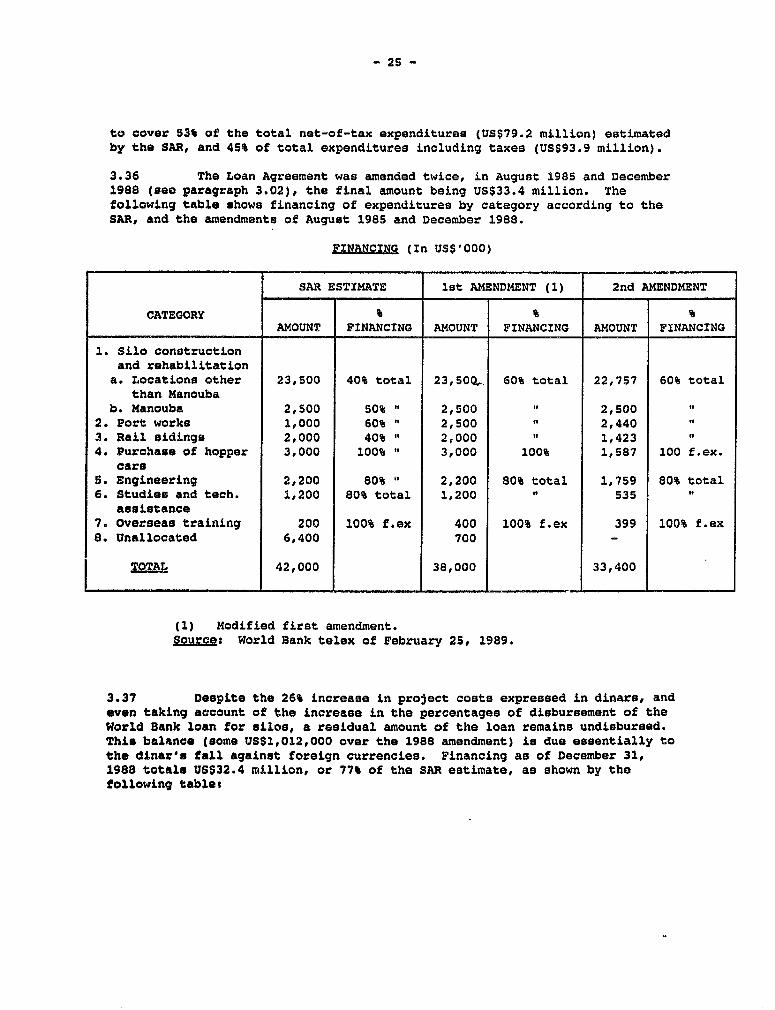
- 25 -
to cover 53% of the total net-of-tax expenditures (US$79.2 million) estimatedby the SAR, and 45% of total expenditures including taxes (US$93.9 million).
3.36 The Loan Agreement was amended twice, in August 1985 and December1988 (seo paragraph 3.02), the final amount being US$33.4 million. Thefollowing table shows financing of expenditures by category according to theSAR, and the amendments of August 1985 and December 1988.
FINANCING (In US5'000)
SAR ESTIMATE 1st AMENDMENT (1) 2nd AMENDMENT
CATEGORY 9 % %AMOUNT FINANCING AMOUNT FINANCING AMOUNT FINANCING
1. Silo constructionand rehabilitation
a. Locations other 23,500 40% total 23,50Q- 60% total 22,757 60% totalthan Manouba
b. Manouba 2,500 50% " 2,500 . 2,5002. Port works 1,000 60% 2,500 n 2,440 n
3. Rail sidings 2,000 40% " 2,000 .. 1,4234. Purchase of hopper 3,000 100% " 3,000 100% 1,587 100 f.ex.
carsS. Engineering 2,200 80% " 2,200 80% total 1,759 80% total6. Studies and tech. 1,200 80% total 1,200 535
assistance7. Overseas training 200 100% f.ex 400 100% f.ex 399 100% f.ex8. Unallocated 6,400 700 _
42,000 38,000 33,400
(1) Modified first amendment.Sources World Bank telex of February 25, 1989.
3.37 Despite the 26% increase in project costs expressed in dinars, andeven taking account of the increase in the percentages of disbursement of theWorld Dank loan for silos, a residual amount of the loan remains undisbursed.This balance (some US$1,012,000 over the 1988 amendment) is due essentially tothe dinar's fall against foreign currencies. Financing as of December 31,1988 totals USS32.4 million, or 77% of the SAM estimate, as shown by thefollowing tables

- 26 -
FINANCING (in US'000)
CATEGORY SAR AMENDMENT 1988 PAYMENTS AS OF12/31/88
Silo construction and 26,000 25,257 25,145rehabilitationPort works 1,000 2,440 2,380Rail sidings 2,000 1,423 823Hopper cars 3,000 1,587 1,521Engineering 2,200 1,759 1,739Tech. assistance and 1,400 934 780trainingUnallocated 6,400 _ _Balance _ _ 1,012
TO TAL 42,000 33,400 33,400
3.38 As of December 31, 1988, the World Bank loan had financed 55% ofactual costs (US$59.2 million), including contingencies. In other words, 97%of the amount according to the second amendment (1988), which canceled US$4.6million of the loan.
3.39 Because of the slow progress of the project during the firstyears, disbursements in 1982, 1983 and 1984 were far lower than the SARestimates. Disbursements started to rise in 1985, the year when the workswere really started. The following table gives a year-by-year breakdown ofestimated (SAR) and actual disbursements.
DISBURSEMENTS (In millions of US$)
SAR ESTIMATE ACTUALIBRD FY ACTUAL AS %
ANNUAL CUMULATIVE ANNUAL CUMULATIVE OF
SAR ESTIMATE
1982 0.7 0.7 0.1 0.1 141983 12.9 13.6 0.4 0.5 41984 16.9 30.5 3.4 3.9 131985 8.5 39.0 7.7 11.6 301986 3.0 42.0 15.1 26.7 641987 - - 4.8 31.5 751988 _ _ 0.9 32.4 77

- 27 -
E. BENEFITS
3.40 According to the SAR, the main project benefits consist ofimproved efficiency of the grain distribution and storage systems and agreater capability for that system to deal with a potential crisis in grainsupply. Such benefits, closely linked to the volume of imports, would derivefrom3 (a) a reduction in transport costs resulting from the capacity tounload a greater number of large ships; (b) a reduction in demurrage chargesas a result of better scheduling and more rapid unloading of ships; (c) areduction in the labor costs of grain handling; (d) a savings from theelimination of quay storage. The benefits and their relative importance areshown in the following table.
BENEFIT ANNUAL AMOUNT SHARE OF(D '000) TOTAL
Reduction in transportation costs 1,818 0.27thanks to use of larger vessels (inforeign exchange).Reduction in demurrage (in foreign 1,802 0.27exchange).Reduction in grain handling costs 1,929 0.29(labor costs).Cost reduction thanks to elimination of 632 0.10quay storage.Cost reduction thanks to savings in 283 0.04bags.Elimination of palliative investments 68 0.01in import handling.Elimination of investments in freight 117 0.02cars.
TOTAL 6,649 1.00
3.41 Now that the project has been implemented, the actual benefits asof 1988 are as follows:
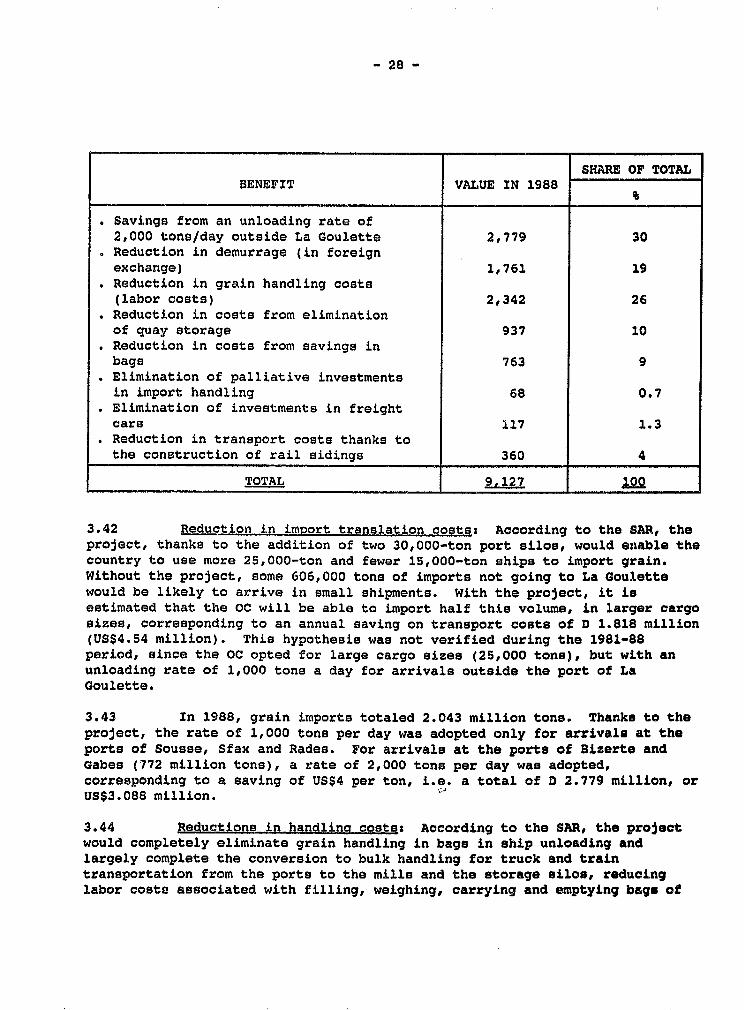
- 28 -
SHARE OF TOTALBENEFIT VALUE IN 1988
. Savings from an unloading rate of2,000 tons/day outside La Goulette 2,779 30
fReduction in demurrage (in foreignexchange) 1,761 19
. Reduction in grain handling costs(labor costs) 2,342 26
. Reduction in costs from eliminationof quay storage 937 10
. Reduction in costs from savings inbags 763 9
. Elimination of palliative investmentsin import handling 68 0.7
I Elimination of investments in freightcars 117 1.3
.Reduction in transport costs thanks tothe construction of rail sidings 360 4
TOTAL 9.127 100
3.42 Reduction in import translation costs: According to the SAR, theproject, thanks to the addition of two 30,000-ton port silos, would enable thecountry to use more 25,000-ton and fewer 15,000-ton ships to import grain.Without the project, some 606,000 tons of imports not going to La Goulettewould be likely to arrive in small shipments. With the project, it isestimated that the OC will be able to import half this volume, in larger cargosizes, corresponding to an annual saving on transport costs of D 1.818 million(US$4.54 million). This hypothesis was not verified during the 1981-88period, since the OC opted for large cargo sizes (25,000 tons), but with anunloading rate of 1,000 tons a day for arrivals outside the port of LaGoulette.
3.43 In 1988, grain imports totaled 2.043 million tons. Thanks to theproject, the rate of 1,000 tons per day was adopted only for arrivals at theports of Sousse, Sfax and Rades. For arrivals at the ports of Bizerte andGabes (772 million tons), a rate of 2,000 tons per day was adopted,corresponding to a saving of US$4 per ton, i.e. a total of D 2.779 million, orUS$3.088 million. '
3.44 Reductions in handlinq costs: According to the SAR, the projectwould completely eliminate grain handling in bags in ship unloading andlargely complete the conversion to bulk handling for truck and traintransportation from the ports to the mills and the storage silos, reducinglabor coste associated with filling, weighing, carrying and emptying bags of

29 -
grain. The total annual saving resulting from conversion of grain handlingfrom bags to bulk was estimated at around D 1.929 million, or US$4.82 million.
3.45 In 1988, thanlcs to the project, and taking account of grainmovement in the without-project scenario (see Annex 4, Table 1), the actualsaving resulting from bag-to-bulk conversion of grain handling wasD 2.342 million, or US$2.602 million (see Annex 4, Table 2).
3.46 Savings on demurrage: Before the project, the demurrage costspaid by the OC in foreign exchange were constantly on the rise because of theslowness and inadequate capacity of the port silos and the competition betweengrain ships and other vessels for access to the general merchandise quays. LaGoulette was the only port with a specialized quay used exclusively by grainships; at the other ports, other factors tended to lengthen the time neededfor unloading, such as priority for ships carrying passengers to Bizerte, andthe prohibition of even temporary quay storage at Sfax. The OC's efforts totrade off demurrage at La Goulette against high bag handling costs at otherports also led a large number of vessels to change their port of destination,at a high cost to the OC. Thanks to the project, bagging at the ports hasbeen eliminated, and vessel movements are now scheduled, while the increasedport silo capacity, with technical assistance on the operating side, hasenabled the OC to reduce demurrage charges to a minimum.
3.47 According to import projections, annual saving on demurrage willincrease from D 1.8 million in 1988 to D 2.4 million in 1996, when the projectwill be fully operational.
3.48 Savings resulting from elimination of q-uay storage: According tothe SAR, the OC pays fees to OPNT for prolonged storage of grain bags onquays. Those fees represent OPNT's estimated opportunity and incon'7eniencecost for occupancy of the quays. Moreover, since the facilities fortransporting grain from the quays to the silos are inadequate, the fees alsoinclude the cost of tarpaulins to cover the piles of bags and the costs ofguarding them against theft. Quay storage costs, which the SAR puts at D632,200 (US$1.58 million), will be eliminated once bulk grain is unloadeddirectly from ships to silos.
3.49 Quay storage costs saved in 1988 thanks to the project amounted to
D 938 million, or US$1.041 million. The following table shows the saving in1988 from eliminating quay storage, taking account of the three warehousesrented by the OC in the ports of Rades, Sousse and Sfax.
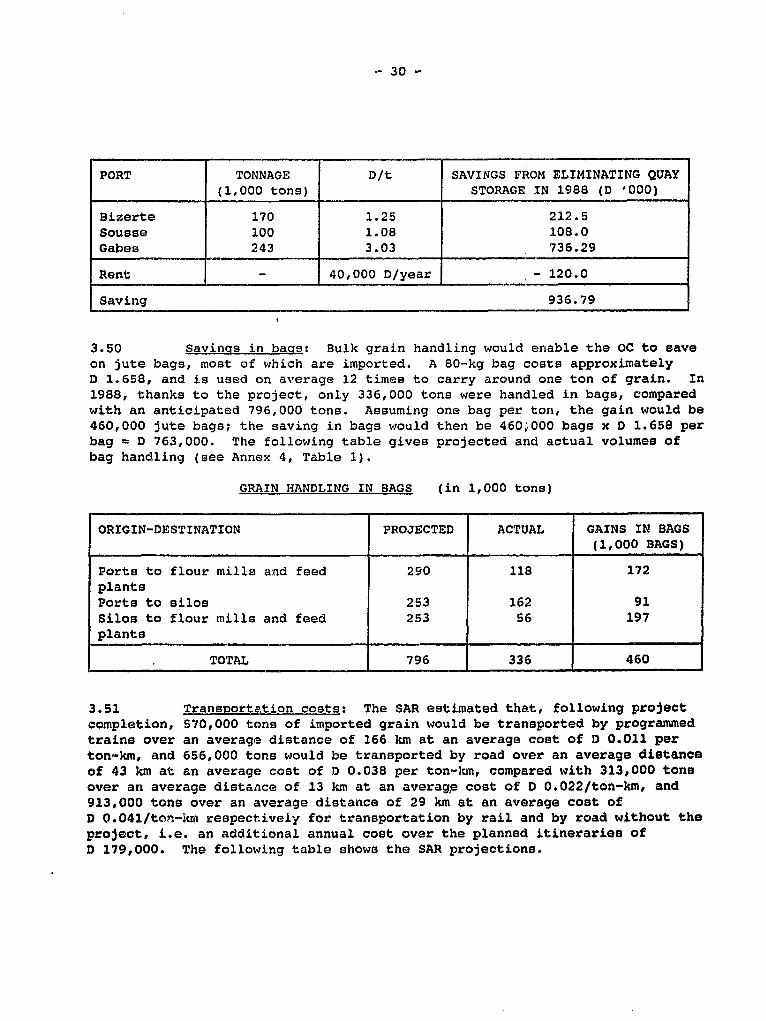
- 30 -
PORT TONNAGE D/t SAVINGS FROM ELIMINATING QUAY(1,000 tons) STORAGE IN 1988 (D '000)
Bizerte 170 1.25 212.5Sousse 100 1.08 108.0Gabes 1 243 3.03 736.29
Rent - 40,000 D/year - 120.0
Saving 936.79
3.50 Savings in bags: Bulk grain handling would enable the OC to saveon jute bags, most of which are imported. A 80-kg bag costs approximatelyD 1.658, and is used on average 12 times to carry around one ton of grain. In1988, thanks to the project, only 336,000 tons were handled in bags, comparedwith an anticipated 796,000 tons. Assuming one bag per ton, the gain would be460,000 jute bags; the saving in bags would then be 460,000 bags x D 1.658 perbag = D 763,000. The following table gives projected and actual volumes ofbag handling (see Annex 4, Table 1).
GRAIN HANDLING IN BAGS (in 1,000 tons)
ORIGIN-DESTINATION PROJECTED ACTUAL GAINS IN BAGS(1,000 BAGS)
Ports to flour mills and feed 290 118 172plantsPorts to silos 253 162 91Silos to flour mills and feed 253 56 197plants
TOTAL 796 336 460
3.51 Trans]2ortation-costs: The SAR estimated that, following projectcompletion, 570,000 tons of imported grain would be transported by programmedtrains over an average distance of 166 km at an average cost of D 0.011 perton-km, and 656,000 tons would be transported by road over an average distanceof 43 km at an average cost of D 0.038 per ton-kIm, compared with 313,000 tonsover an average distance of 13 km at an average cost of D 0.022/ton-km, and913,000 tons over an average distance of 29 km at an average cost ofD 0.041/ton-km respectively for transportation by rail and by road without theproject, i.e. an additional annual cost over the planned itineraries ofD 179,000. The following table shows the SAR projections.
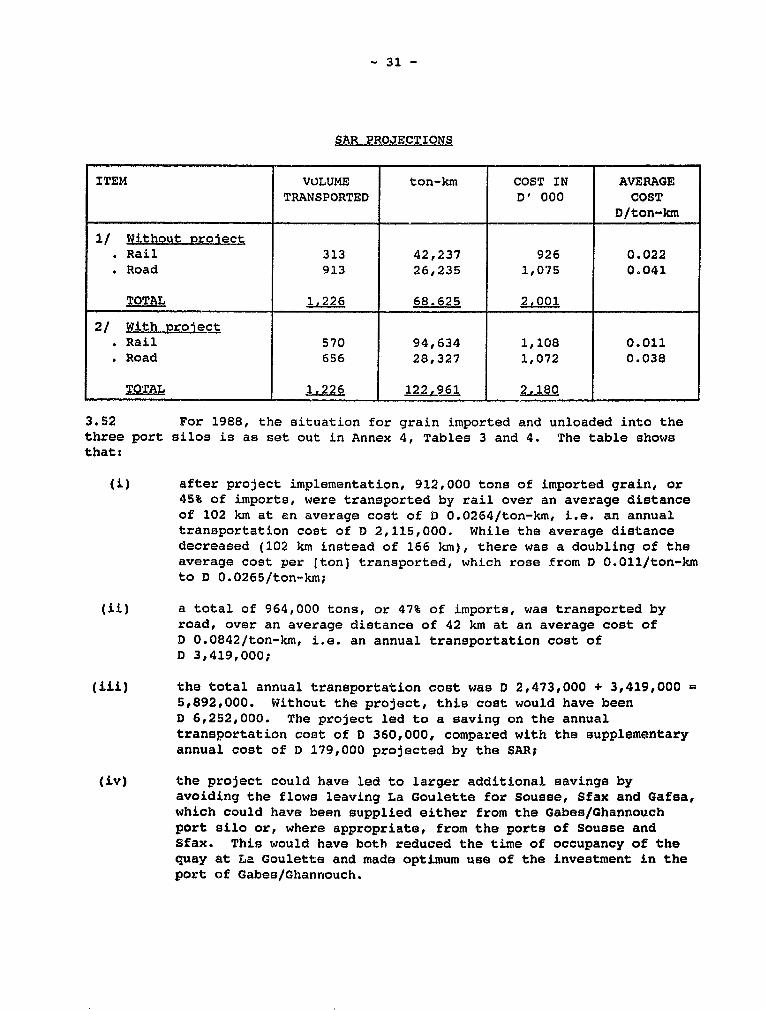
- 31 -
SAR PROJECTIONS
ITEM VOLUME ton-km COST IN AVERAGETRANSPORTED D' 000 COST
D/ton-km
1/ Without project. Rail 313 42,237 926 0.022. Road 913 26,235 1,075 0.041
TOTAL 1,226 68.625 2,001
2/ With i1ro1ect. Rail 570 94,634 1,108 0.011. Road 656 28,327 1,072 0.038
TOTAL 1._26 122,961 2.180
3.52 For 1988, the situation for grain imported and unloaded into thethree port silos is as set out in Annex 4, Tables 3 and 4. The table showsthat:
(i) after project implementation, 912,000 tons of imported grain, or45% of imports, were transported by rail over an average distanceof 102 km at an average cost of D 0.0264/ton-km, i.e. an annualtransportation cost of D 2,115,000. While the average distancedecreased (102 km instead of 166 km), there was a doubling of theaverage cost per [ton] transported, which rose from D 0.011/ton-kmto D 0.0265/ton-km;
(it) a total of 964,000 tons, or 47% of imports, was transported byroad, over an average distance of 42 km at an average cost ofD 0.0842/ton-km, i.e. an annual transportation cost ofD 3,419,000;
(iii) the total annual transportation cost was D 2,473,000 + 3,419,000 =5,892,000. Without the project, this cost would have beenD 6,252,000. The project led to a saving on the annualtransportation cost of D 360,000, compared with the supplementaryannual cost of D 179,000 projected by the SAR;
(iv) the project could have led to larger additional savings byavoiding the flows leaving La Goulette for Sousse, Sfax and Gafsa,which could have been supplied either from the Gabes/Ghannouchport silo or, where appropriate, from the ports of Sousse andSfax. This would have both reduced the time of occupancy of thequay at La Goulette and made optimum use of the investment in theport of Gabes/Ghannouch.

- 32 -
3.54 Ot_her-benefits: In addition to the benefits quantified, theproject has created a number of additional benefits for Tunisia, of which thefollowing is a partial list:
{i) The OC is now able to arrange purchases of imported grain whenworld market prices are advantageous.
(ii) The technical assistance provided for stock control and silomanagement and maintenance has led to:
less double handling of grain (transfers between two storagesilos);
- improved utilization of silo capacity and a decrease inoutdoor storage;
- improved silo operation.
(iii) Rehabilitation of the silos at Bizerte, Kalaa Seghira and Manoubawill eliminate losses and damage in poorly maintained storagecells.
(iv) The use of freight cars for temporary storage of imported grain,resulting from inadequate storage capacity or slowness ofunloading.*
(v) Part of the locomotive time required for moving cars carryingimported grain has been released so that other goods can betransported.
F. ECONOMIC ANALYSIS
3.54fsic] The economic analysis of project costs and benefits was conductedat 1988 constant prices. Both the economic costs of earlier investments andthe benefits were converted into 1988 constant prices through application ofdeflators corresponding to the overall price index. The tables in Annex 5show project costs and benefits. The economic rate of return followingproject implementation is 12.87%; the following table gives the rates ofreturn calculated by the SAR and by the Project Completion Report (PCR).
* Presumably "has been eliminated" is understood here -- Translator.
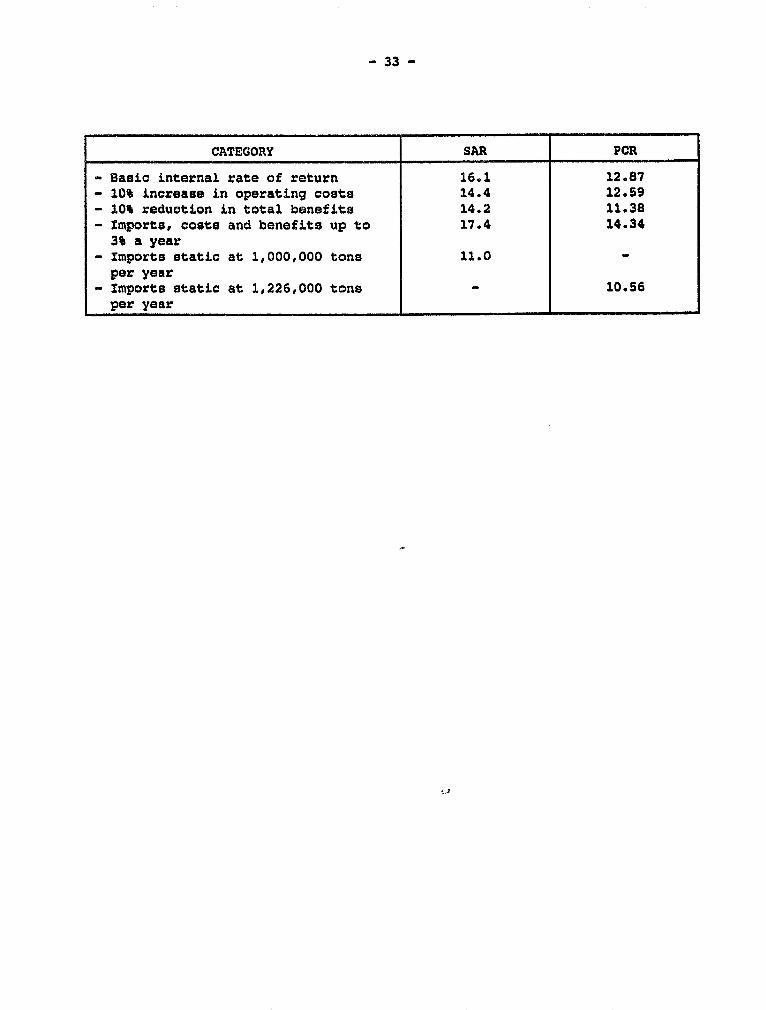
- 33 -
CATEGORY SAR PCR
- Basic internal rate of return 16.1 12.87- 10% increase in operating c08ts 14.4 12.59- 10% reduction in total benefits 14.2 11.38- Importa, costs and benefits up to 17.4 14.343% a year
- Imports static at 1,000,000 tons 11.0 -per year
- Imports static at 1,226,000 tons _ 10.56per year
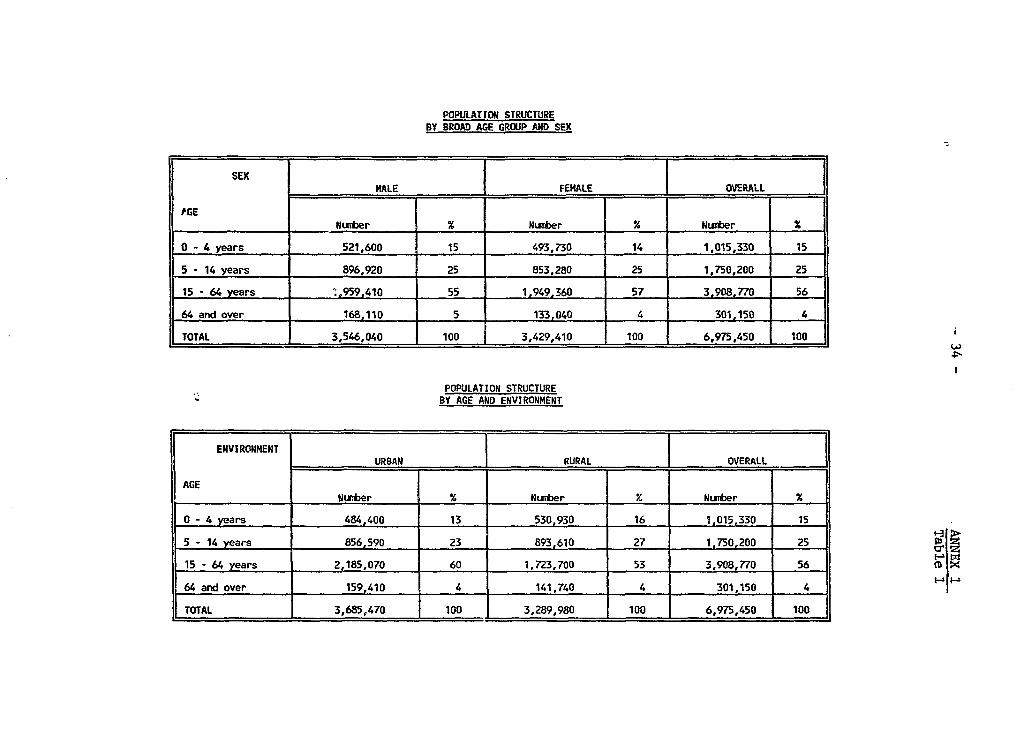
POPULATION STRUCTUREBY BROAD AGE GROUP AND SEX
SEE MALE ________HL = FEMALE = _ OVERALL_=
._______. _______ WNumber % Number X Number %
0 - 4 years 521,600 15 493,730 14 1,015,330 15
5 - 14 years 896,920 25 853,280 25 1,750,200 25
15 - 64 years .,959.410 55 1,949,360 57 3,908,770 56
64 and over 168,110 5 133,040 4 301,150 4
TOTAL 3,546,040 100 3,429,410 100 6,975,450 100
POPULATION STRUCTUREBY AGE AND ENVIRONMENT
ENVIRONMENTURBAN RURAL OVERALL
AGENumber X Number Z Number X
0 - 4 years 484,400 13 530,930 16 1 015 330 15
5 - 14 years 856,590 23 893,610 27 1,750,200 25
15 - 64 years 2,185,070 60 1,723,700 53 3,908,770 56
64 and over 159,410 4 141,740 4 301,150 4
TOTAL 3,685,470 100 3,289,980 100 6,975,450 100

GDP. BY ACTIVITY
(in millions of D)
YEARCATEGORI 1982 1983 1984 1985 1986 1987
(a) At constant 1980prices
Agriculture and fisheries 478 490 553 649 570 670Manufacturing industries 482 522 556 585 613 639Nonmanufacturing industries 694 735 748 743 709 688Nongoverrnment services 1,170 1,206 1,274 1,339 1,358 1,462Government services 427 452 469 487 493 500
GDP at factor cost 3,253 3,405 3,600 3,803 3,743 3,959Duties and taxes 465 487 515 544 535 556 lGOP at market prices 3,718 3,892 4,115 4,347 4,278 4,525 |Growth rate 4.7 5.7 5.7 -1.6 5.8 In
(b) At'Ccurrent erices
Agriculture and fisheries 632 673 863 1,048 933 1,226Manufacturing industries 534 616 733 818 922 1,044Nornanufacturing industries 958 1,061 1,170 1,240 1,105 1,226Nongovernment services 1,532 1,736 1,921 2,133 2,262 2,542Government services 571 674 732 805 869 941
GDP at factor cost 4,227 4,760 5,419 6,044 6,091 6,979Duties and taxes 577 737 821 866 935 1,012GDP at market prices 4,804 5,497 6,240 6,910 7,026 7,991Growth rate 14.4 13.5 10.7 1.7 13.7
SOUWRCE: Financial statistics, BCT, No. 86 - December 1988.
mtD. >CA
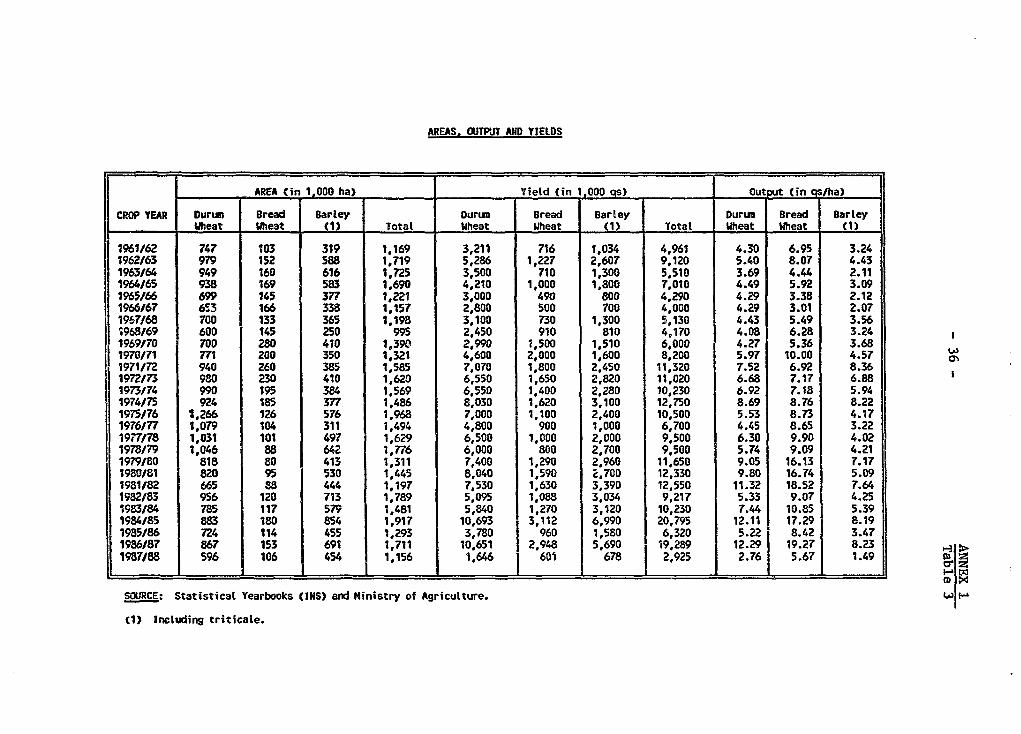
AREAS. OUTPUT AND YIELDS
AREA (in 1.000 ha) Y_ V ield (in 1,000 qs) ___ _ Output (in Qs/ha)
CROP YEAR Ourun Bread Barley Durun Bread Barley Durun Sread BarleyWheat Wheat (1) Total Wheat Wheat (1) Total Wheat Wheat (1)
1961/62 747 103 319 1.169 3,211 716 1,034 4,961 4.30 6.95 3.241962/63 979 152 588 1,719 5,286 1,227 2,607 9,120 5.40 8.07 4.431963/64 949 160 616 1,725 3,500 710 1,300 5,510 3.69 4.44 2.111964/65 938 169 583 1,690 4,210 1,000 1,800 7,010 4.49 5.92 3.091965166 699 145 377 1,221 3,000 490 800 4,290 4.29 3.38 2.121966/67 6S3 166 338 1,157 2,800 500 700 4,000 4.29 3.01 2.0719'57/68 700 133 365 1,198 3,100 730 1,300 5,130 4.43 5.49 3.56*968I69 600 145 250 995 2,450 910 810 4,170 4.08 6.28 3.241969/70 700 280 410 1,390 2,990 1,500 1,510 6,000 4.27 5.36 3.681970171 771 200 350 1,321 4,600 2,000 1,600 8,200 5.97 10.00 4.57 c1971/72 940 260 385 1,585 7,070 1,800 2,450 11,320 7.52 6.92 8.361972/73 980 230 410 1,620 6,550 1,650 2,820 11,020 6.68 7.17 6.881973/74 990 195 384 1,569 6,550 1,400 2,280 10,230 6.92 7.18 5.941974/75 924 185 377 1,486 8,030 1,620 3,100 12,750 8.69 8.76 8.221975/76 1,266 126 576 1,968 7,000 1.100 2,400 10,500 5.53 8.73 4.171976/77 1,079 104 311 1,494 4,800 900 1,000 6,700 4.45 8.65 3.221977/78 1,031 101 497 1,629 6,500 1,000 2,000 9,500 6.30 9.90 4.021978/79 1,046 88 642 1,776 6,000 800 2,700 9,500 5.74 9.09 4.211979/80 818 80 413 1,311 7,400 1,290 2,960 11,650 9.05 16.13 7.171980/81 820 95 530 1,445 8,040 1,590 2,700 12,330 9.80 16.74 5.091981/82 665 88 444 1,197 7,530 1,630 3,390 12,550 11.32 18.52 7.641982/83 956 120 713 1,789 5,095 1,088 3,034 9,217 5.33 9.07 4.251983/84 785 117 579 1,481 5,840 1,270 3,120 10,230 7.44 10.85 5.391984/85 883 180 854 1,917 10,693 3,112 6,990 20,795 12.11 17.29 8.191985/86 724 114 455 1,293 3,780 960 1,580 6,320 5.22 8.42 3.471986/87 867 153 691 1,711 10,651 2,948 5,690 19,289 12.29 19.27 8.23 1987/88 596 106 454 1:156 1,646 601 678 2,925 2.76 5.67 1.49
SOURCE: Statistical Yearbooks (INS) and Ministry of Agriculture.
(1) Including triticale.
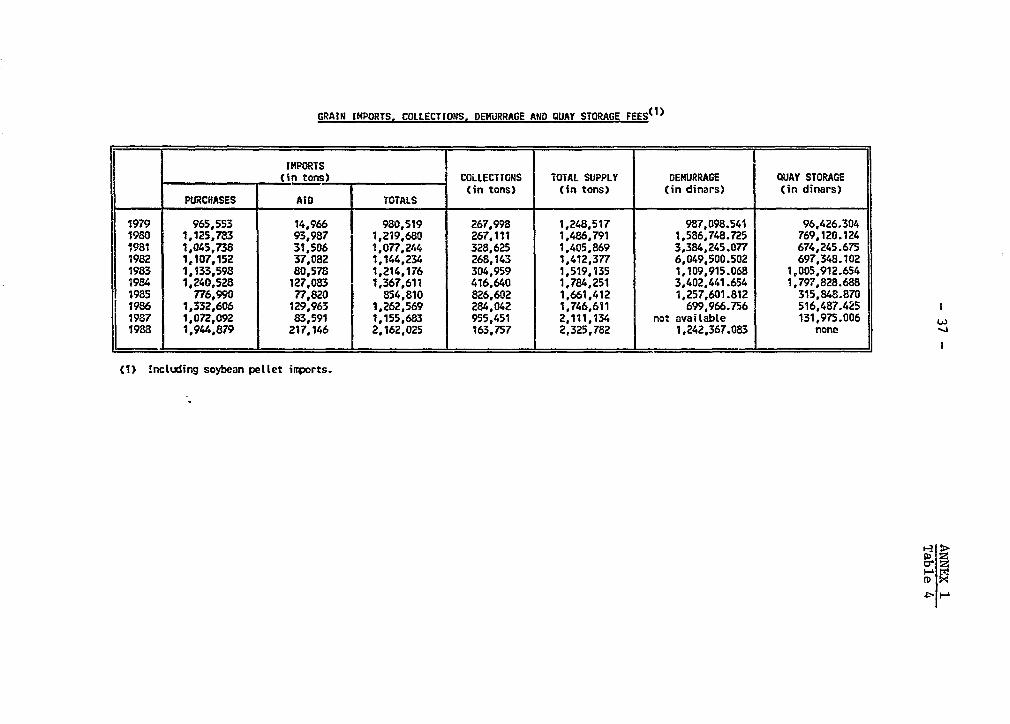
GRAIN IMPORTS. COLLECTIONS, DEKURRAGE AND QUAY STORAGE FEESO1 )
IMPORTS(in tons) COLLECTIONS TOTAL SUPPLY DEMURRAGE QUAY STORAGE
(in tons) (in tons) (in dinars) (in dinars)PURCiHASES AID TOTALS
1979 965,553 14,966 980,519 267,998 1,248,517 987.098.541 96,426.3041980 1,125,783 93,987 1,219,680 267.111 1,486,791 1,586,748.725 769,120.1247981 1,045,738 31,506 1,077,244 328,625 1,405,869 3,384,245.077 674,245.6751982 1,107,152 37,082 1,144,234 268,143 1,412.377 6,049,500.502 697,348.1021983 1,133,598 80,578 1,214,176 304,959 1,519,135 1,109,915.068 1,005,912.6541984 1,240,528 127,083 1,367,611 416,640 1,784,251 3,402,441.654 1,797.828.6881985 776,990 77,820 854,810 826,602 1,661,412 1,257,601.812 315,848.8701986 1,332,606 129,963 1,262,569 284,042 1,746,611 699,966.756 516,487.4251987 1,072,092 83,591 1,155,683 955,451 2,111,134 not avaitable 131,975.0061988 1,944,879 217,146 2,162,025 163,757 2,325,782 1,242,367.083 none
(1) IncLuding soybean pellet iq,orts.
41 P:

GRAIN UNLOADED, BY PORT
(1988)
(in tons)
| ~~~PRCODUCT SHARE OF|PORT DURUf4 WHEAT BREAD WHEAT BARLEY CORN tOTAL PRESENT VOLUME
G wullette 247,377 243,035 156,543 157,127 804,072 39 lRades 74,642 63,140 26,036 163,818 8 lSizer-te 127,355 297,516 30,287 455,158 22 lSousse _ 16.285 37,374 53,659 3 lSfax 92.574 75,750 12,232 68,205 248,761 12 lCabes 57,525 33,015 226,634 317,174 16
Subtotat 599,47Z3 728.731 489.106 201 A874 2.042 642 100I
Other fmports t 14.02.° X
TOTAL 2 156,671
In 1988, the port of La Goutette Sud received 1,704 tons of powdered mitk. 2,218 tons of oil, 118 tons of tea. and 1.468 tons of sugar (WFPgoods).
The port of Rades received 95,379 tons of soybean petllets.
The port of Sfax received 13,142 tons of soybean peltets.
This figure takes account of losses recorded during unloading (500 UT ls Ic).

DEMURRAGE CHARGES - 1988
(in USS)
CATEGORY OEMURRAGE DISPATCHED BALANCE
Bread Wheat 132,707.14 262,790.88 +130,083.74
Durumn Wheat 770,247.95 59,179.53 -711,068.42
Barley 806,140.61 116,417.61 -689.723.00
Corn 159,881.95 50,181.76 -109,700.19
TOTAL 1.868.977.65 488.569.78 -1,380407.87
w
ED XON __

SUPPLEMENTARY WORKS AND DEDUCTIONSIN THE SILO CONSTRUCTION COMPONENT
ITEM SUPPLEMENTARY WORKS(') DEDUCTIONS(2) I ACTUAL COSTS- 2)
Sito D Portion F Portion DM Portion D Portion F Portion DM Portion D Portion F Portion DM Portionlocation _ D
Manouba 122,647.177 118.145.29 87,520.04 75,348.274 311,627.29 - +47,298.903 -193,482.00 +87,520.04
8eja 762,645.796 2.429.541.68 339,407.62 36,186.994 88,509.56 30,088.33 +726,458.802 +2.341.032.12 309,319.29
Bizerte 206,976.312 288,668.04 92,296.38 1 9 128211.28 - 105,017.283 +160,456.76 +92 296.38
KataaSeghira 308.449.422 82.091.88 568 793.56 18.344.018 5,595.75 56.303.47 +290.105.404 +76.496.13 +512 490.09 4
Sfax 42,826.471 106,569.35 - 57990.381 81,589.96 42,681.97 -15,163.910 +24,979.39 -42681.97l
Gafsa 209.112 252.12 44,649.492 49823.25 -44,440.380 -49,571.13 -25,135.10
Gabes 467,880.049 16,734.38 96,992.676 341,331.30 - +370,887.373 -324,596.92 l
TOTAL +1,911,634.339 3,042,002.74 1,088,107.60 431,470.846 1,006,688.39 154,208.87 +1,480,163.493 +2,035,314.35 +933,808.73
Source: Project Directorate.
I {D -
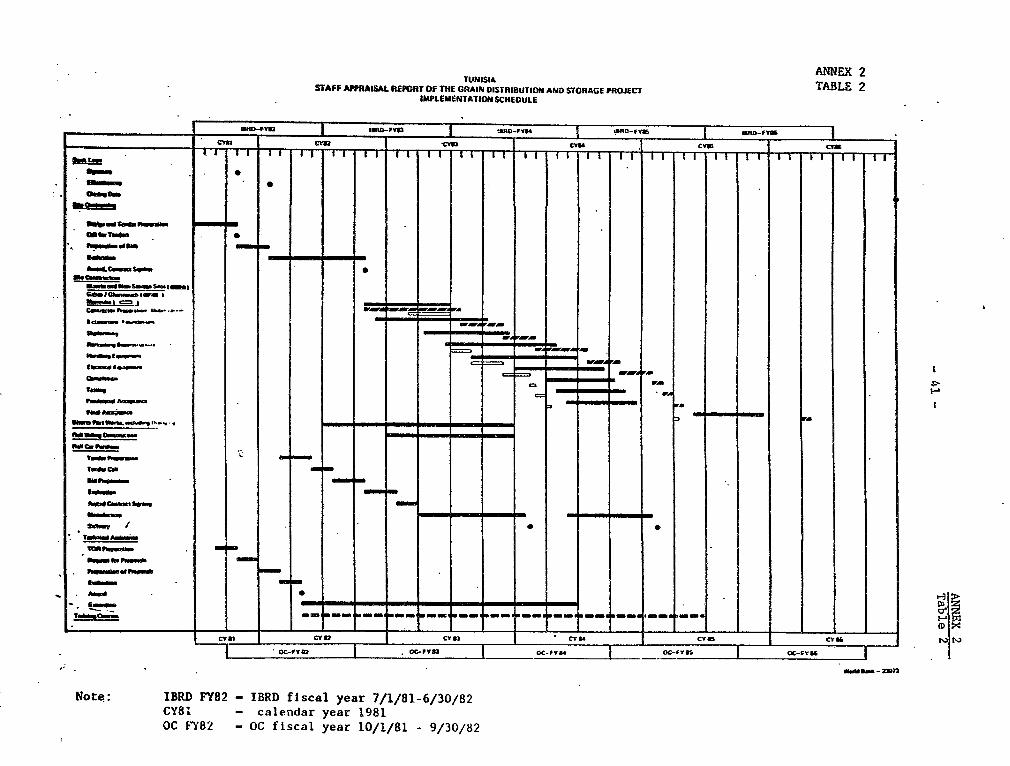
ANNEX 2TUNISIA
STAFF APPRAISAL REPORT Of THE GRAIN CISTRIBUTION AND STORAGE PROJECT TLE 2IMPLElMENTATION SCHEOULE
Ye ~~~~~ODFVIP | D-FV" !OIRD-FM IR-
___________~~~~~~~~~~~~~~~~~~~~~~~~~~~~~~~~~~~~~~~~~~~~~~~~~~s I R-v
CY_l__CY___CY___c_t_ CCY eM CY c cm
P.E C 0 .._
Ca,... ~ O FY8 -a..- OC f-sa ea 01 - a/08
ICa,.. *.. w-UA co -.-
Anad Cwft~~~~~~~~~ &We sS
udhwv~~~~- -
T~~~~w.s ~ ~ c as1-*'Ya c 5CY2 .
CYB - alnda -ar-98
T ~ ~ OCF8 -O isaCea.31/1-9/08

SEVEN SILOS PRO.RAM
________________ 1 2 3 4 S 6 5 8 9 10 11 12 13 14 15 16 17 18 19 5_ 21 22 23 24 25 26 27 28 29 30SJA: loe d mtt cetls _ - _ _ _ _ _ _ m m _ _=Silo, AIR . tras dlv
lh0aWF,_so, ~ _ -_ -- _ _ __ _ _ -__ _ -____
_^6fX~~~~~~ -,-_s -__- _- __ _ _ _ -__ __
ItfIer-Miso, de=fvery…- - - - - - - … - -
g12t315: Siltc, - abes. c_vit - - - - - m mm - - - - - - - - _ _ _1totter-NIlay, divt _Ing - - - -_ -_ _ _ _ = = = _ = _ _ _ _ _
lihler-f11. "ssamy _
iler-lMig, delivery -_ _ -_ _ _ _ _ _ T _ _ _ = _ _ _ _ _ _ _ _ _ _ _ _ -
SFlt lNer A:Stlo-ledtars m _ _m _m mm _ _m. _ _ _ _ I- sttoM Sil r Cii _work==s= = = = _ _ _ | It
110e-Mlog. dimntlin- -- - -_ _ _ _ T
Ithblee-Niaq.aosseaby-- m m mm - m
IlMiter-Nisg. delivery- - - - -
NSA TTAer - - m - m - a m -Silo A1i.atr" div -m --- m Sdler-Nia9,assembly-m - m m
Ithter-iiag, delivery | _
SFAX: lo N ma l tu cells -OF TmlE7xRtE
- Stte l) -It -tit -t -h d te om mme mc mmd mm to mr eerctruttoSie otbtir a fewlloIroI xmeneo ob cntutd ntode vt B°t
"teer-Kiag assmbly- -…m m m m m m mBtZher-Ihia delivery
GAFSA: lower andS sIl Cellts- - - - m m
slitt. #Iii sg. seably -t -f m n m m t nt h
Stitler-Hiag. delIvery- -mm i.- - -{ -
GAffS: Tower- - - - - m m m m m m m m -Silo * quV 111110m 4m
Site ailability by the date of the service ordr, to start constn ertion.Availabitfty of facilItfes ax lady in exestenre or to be constructed in agcordance with proteinbelow:
Availty of centrat b to be fUlly Completed no tater than 13 mnrths, ard the tao others sleDno later than 14 sonths. from the date of the service order to Start construction.
AvailabIlity of six round cetta. to be campletety cteared in a gradual 2-3 moth process. andlthe sq.ar tells block coWtetety cteared emo later than 12 moths from the date of the serviceorder to start construction.
(a) httIliuA
Availability of 16 rnd 32.50Z0-ton cells, completely cleared, amd of 9 square cetls farrmnths from the date of the service order to start constructitn The con-eyor system uder the Repubtic of tuaisiartwod cells wilt be disoantled at the start ot the third mnth Office dses Crkates
seven Silos PrograsAveltability of the block of sqare 22.000-ton cells, comtetely cleared. Inctudireg theundergrou,d area and adjoining tover. mon the retu- of the rourd cells in operating order. Uo-k tis-tabl
tsignattwe of the PDG of OCt
raol

SILO CONSTRUCTION - DELAYS IN C01PLETION
8/1/84
198I4 1985 1986 1987 1988 1989|EASj0-INOtl lijMAA,MjJ,l,A,SjO,I DtJ F,M ,AiMiJ,JiA,S,OiNDtO F,M ,AIM,It]iA,SO tN0XtJ,FlM A,M,lIzJA aS,o,N,t ,F5
15/84 3/ll8 .16186- DEJA , (4 mos,22days)
3J15-86 .2 11At.87- BEJA extension (supp. wks) _(10 mos, 6 days)ll/1S 85 . 8/6/86
- MANOUBA. J4 22
- BIZERTE SIlo. 1|31/86 1(15 ms, 20 days)
,-. 1/311B6 18L25/e7- BIZERTE PORT _---- - _ (18 mos, 25 davs)
. ~~~~~~~~ ~~7/15/E6] 4/10187- KAIAA SEGHIRA Expansion 4 mos, 25 days)43/8
- KALAA RENOVATION (SUpp. wks) / 8 .1 I 2 _ _ da5s)
- SFAX ~~~~~~~~~7L15/b61 .I..8 21Bo,1 as
. .AFSA. 7l151L6 2115/87. (10 mos, 12 days)- GAfSA. r ___ _ _ __ f(7 mos)
6 6/12/87 (6mos, 27 days)- GABES SPlO 1/15/86 1 1 ->. , D
11/15/86 ,l0JD?W( 7 S ZG ABES PORTi:___________
(11 DOS, S days) 4- N

CONTRACT WITH BuHLER-MIAG
SILO CONTRACT AMOUNTSLOCAT10U
D PORTION F PORTION DM PORTION
Manouba Lot 1 1,409,651.000 4,126,772.000 -
Lot 11 836,388.000 2,817.880.000
BEJA Lot 1 1.900,408.000 7.619.349.000 -
Lot 11 701,815.000 . l,860 120.000
BIZERTE Lot 1 1,856,074.000 6,391,666.000 l
Lot 11 1,677,842.000 5,554,240.000
KALAA Lot 1 2,489,940.000 9,969,103.000
Lot 12 1,034,814.000 2,709,190.000
SFAX Lot I 2,641,706.000 11,157,979.000
Lot II1 877,578.000 - 2,184,210.000
GAFSA Lot 1 1,788,490.000 7,512,364.000 _
Lot 21 605,071.000 1,662,490.000
GABES Lot 1 4,010,264.000 13,290,577.000
Lot II 1,878,253.000 4,754,120.000
SUBTOTAL 23,708,294.000 60,067,810.000 21,542,250.000
LOT III 52,445.000 - 230,660.000
TOTAL 23.760.739.000 60.067.810.000 21.772,910.000
> XP.1N

CONTRACT UItR WHLER -IAG
COIST OF UOMs EXEOJTED AS FCE TRA S tfLEPIENTAr WaRKS OROERED V oc D OEDUCTIOiS FOR 1W: NOT DONE R POORLT OVEIIAt TOTALSILO SITES I _- _ EXEJTED _ - -_
0 MTII | F FOTIN ON fIRTIIR 0 PORTIW0 F P0RT611 ON PCI0T D PORTION F PTION__ OH PORT13 0 FOPRTIO F PRTION DM FHTItONPANSA LOT I T 1420.23D249 4,126.83000 95,3v8.4 1 45 75,34a.27 311,627.29 t,ao,2aD.448 3933323.00
tOT 1I 597,742.760 2.817,880.00 27,2.704 . 520.04 .6.24991 - 46. 2,90540D.4BEJA LOT I i.9a,273.608 7,7S2,426 .eo 635,t86.813 2,429.541 . 28,342.994 88,50956 Sf. 2, 525, 117.427 10 073,458.12
LOT _1 520.562.480 1.822.851.00 127.458.983 . 339,407.62 7, Ala _ 30.,ee.33 640, _77. _ _ 2.132.170.29Z81ERTE 1OT I 1.655,336. 6858 1,710. 0 195,905.262 2as.663.04 - e j 9f9.029 128,211.28 1,949 283.091 6,552.116.76 _
LOT It 1, 155602.922 s.sS s52 .OD 11.071.050 92,Z96.38 __ _ -t 9. 2 . s .646. , t48.38 uKALAA LOT I 2.492,049.912 9,962,39.Q ; 75.567.916 82, 091.eB 3.96.9261 5 595.75 . 2,56.621.567 10,036,891.13 -
_ toy t J en709.303 .2 707, faS. l_ 2-2.506 . 568.793.S6 It..347.757 . 56303.47 j, 243.052 3,221.678.09SFAX LOT I 2.591.368.475 1t,158,09.GD . 42.26 .1 0S,69.35 . 46740. 381 81,589.96 . 2_587 454.565 111t3.038,39
_ OT 11 I M,m.657 2,184,213.00 - 11 .5O.DOO - 426e1.97 68,466.6B7 . 2,141,531.03CAFSA LOT 1 1.76.292s500 7,512,617.00 . 209.112 252.12 40,629.492 49,823.25 1 715,872.126 7.463,045.8f
LOT 11 466.636.036 _ 1.664,720.00 . _ - 4,02.000 25.135.10 462,616.036 1.639.584.9GABES tOT I ,9S6,1. 136290.123.00 467 880.049 1634.38 96,9 92.76 341, 33t330 .o,357,3.814 t2.965.526.GB
LOT _ _ I 1.97J405.934 - *,754,t17.00 . - . . . 1 497.405.934 4,754.117.0~S1TOAt 21,719.064.165 60.174,134.00 2tss,s 1 oD 1,911 634.399 3.042.002.74 1 MQ01.o6 431 ,470.864 t1.06,6BB.39 154,9201.8 23.259.227.64 R 2209.44s.3s 22.440,629.73LOT fit 46.565.371 . . . . . . .0
0 48565.3723 .0,660.0
REEAMIIIG 137,QOO.OOD 62,196.00 44,7240 0. . . . 137,0.
0,724
TO13 21,964.629.536 60,236.330.00 21,782,206.00 .911.634.399 3.042.002.74 3.088,0t7.60 431,470.864 1.006,688.39 154.208.87 23,44, 79s.011 62.271.6a4.35 2,716.013.7S
lb D
tD
a% "

ACCQJHTING STATUS OF PROJECT
1982 1983 1984 1985 19B6 1987 1988 1989 TOTAL IfRD TOTALSSilos 0 0 3,74D,373 6,B93 471 9,322,687 2,246,674 127,816 179,439.4 22.510.461 25,145,117 47,655,578
oc a o 34,2 s.909,171 8,395419 2,185,2 27,816 t179,439.4 20,232,340 2!68 69122 42,918,432
CCCC 0 0 305,810.6 984,300.4 9Z7,265 60,M. o 2,27s,151 2,458,995 04,73J16
Sites 157.114.6 317,590.7 __474 705.3 1 474,705.3
SCRFT 0 295 683.3 473,056.5 344,54.7. 30,295.23 19,248 s7,429.91 425, 531.9 1,645,792
Sidings 0 m5683.3 297,6B8.7 344,517.6 30,295.23 19,248 57,429.91 425,531.9 1470 3257 2.293.682
Rail cars 0 0 175,367.9 00 0 0 175,367.9 1,521,277 1,696,645 aEngineering 324,315.5F 1 . 175 24.306.B 1...104.7 132.262.1_ 83.592.6 33.412.08 1.733.527 2.448.603Tecdmical Assistane 14,655.11 31,904.26 21 .sn.es 2,W2.GD3 13.013.25 0 28,963.35 I12,_97.9 ns o077n Bs7174.90Total 496 0852. 645 360.4 4.259.316 7 557.D6 9,498s25B 2.349.514 247621.3 6D4971.3 25 45825 s32
OP__T 1,0on,_868 2,640, 80 248 _560 __ 3,967, 228Unal lotted
7_0,0_0 ____
TOTALS 60,127,615
CD .
tD' Es(0.W

COMPARATIVE COSTS
PREPARATION APPRAISAL ACTUAL FIGURES OR CURRENT.___________ ____________ _ :EST1MATES
D MILLIONS USS MILLIONS D MILLIONS USS MILLIONS D MILLIONS USS MILLIONSButk harvesting 0.510 1.275
Collection Center 0.725 1.812 - - -construction
Silo and C.C. 5.429 13.573 t.700 4.300 3.9 4.7rehabilitation
Silo construction
Port silos 1.584 3.960 10.800 27.100
Storage silos 6.121 15.303 9.000 22.400 34.7 42.9
Port works 0.500 1.250 0.600 1.500 3.0 4.0
Rail sidings 1.700 4.400 1.9 2.3
Ho__er cars 1.300 3.300 1.3 1.5
Engineering 1.400 3.500 1.7 2.2
Technical assistance 0.250 0.625 0.600 1.400 0.7 0.9
Total base cost 20.393 50.983 27.100 67.900 -
Physical contingencies 2.039(1) 5.098 4.100(2) 10.200
Reserves for price 0.369(3) 0.923 6.300 15.800 -increases
Unallocated - 0.7
TOTAL COST 22.801 57.004 37.500 93.900 47.2 59.2 |
10% F4 t4(2) - 15% of
>(3) -6% of 11 and 111. Lio

ACCOUNTING STATUS OF GRAIN STORAGE AND DISTRIBUTION PROJECT
(TUNISIAN PORTION)
(in dinars)
YEAR ;982 1983 1984 1985 1986 1987 1988(1)
T1 7EM .______________ .______________ .______________ 1______________ _______________OTALCARRIED FORWARD . 30.888.477 1,143,586.135 757,440.622 4,738,451.444 761,452.712 -1,188,180.992
Site purchase (100,722.0)(2) (201.030.0) - (301,752.000)Sites (3,100,769.009) (5,733,792.947) (7.341,479.901) (1,864,967.122) (102,932.436) (18,143,941.415)Office 2,847,251.707 4,915,080.210 6,611,269.672 1,814,519.658 102,932.436 16,291,053.683 1CCGC _ 253,517.302 818,712.737 730,210.229 50,447.464 - 1,852.87.732Raitway (196,039.293) (392,163.878) (286,318.678) (23,024.140) (15,671.894) (47,026.401) (960,244.284) coSidings 196,039.293 246,783.550 286,318.678 23,024.140 15,671.894 47,026.401 814,863.956Hopper cars - (145,380.328) .- - (145,380.328)Engineerins (207,910.000)(3) (??,684.570) (20,150.359) (96,482.864) (102,793.039) 69,000.718 (27,893.063) (524,914.613)Technical Assistance ,(9,394.800) (20,791.525) (18,422.595) (2,394.689) 9,695.622 . (25,371.068) (86,090.299)
TOTAL (1) 318,026.800 418,545.388 3,531,525.841 6,118,989.178 7,476,992.702 1,949,639.734 203,222.968 20,016,942.611
Budgetary allocation (1i) _ 1,400,000.000 10.100,000.000 10,100,000.000 3,500,000.000 500,000.000 18,500,000.000
(1) Statement as of Gecember 31, 1988.(2) Out of the Office of Cereats budget.(3) Including initial payments to ATI by OC.
(D
0m
Li

ACCURTIHtG STATUS OF PROJECT
(WELD BAK PIRTION)
(in dinars)
A_____U_ _T___ AHOUN TS SBURSEDto"N AlBEiT IN BALANCE
ITEM o.LARs 1982 1983 1984 1985 1986 1987 t988(0 TOTAL IN us$
Sitoe 26,000,000 (2.101.796.480) (4.686.965.313) (9.8.272.026) (3.355.532.897) (295,456.241) C20,335.222.927) (854.883.23)Office 23.500,000 .t,54.169.110 4.0K,Sd6.785 8.844,084.981 3.271,701.955 (e95.456.241) 18,269,999.072 813,878.45CCGC 2.50.000 247.627.340 6S2,378.528 1.051S.37.045 83.830.942 2.065.223.855 41t004.78Pudtiuy 5.D0000 (105,935.680) (577.784.830) (908,940.840) (34,546.476) (23.507.840) (261,755.451) (1.912.471.t17) (2,655,406.44)
Sidings 2.000,000 . 105.935.660) 205.728.880 213,198.690 34,546.476 23,507.840 70,504.607 653,422.173 1.176,743.07Hopper cars 3D000,000 372,055.950 695.742.150 . . 191.250.844 1t259.048.944 1,478.723.37Enginmering 2.200,000 (92.301.600) (27.400.880) t86.352.040) (266.563.780) (465,631.3Z3) (312,860.768) 119.510.236 (1.370,620.627) 466,472.94Technical assistame 1,200D000 (119,673.967) (82,892.406) (15,383.170) (48.335.706) (21,327.627) (44.409.179) (332,0u2.055) (765,340.13)Training 400,000 . . . (2912.520) (161,788.674) (118,254.764) . (282.955.958) (55,583.38)Unallocated | 7000,CO (700.000.00)
TOTAL 35.500.000(2) 92.301.60D 253,010.527 2,848,825.756 5,880.765.623 10.605,5574.205 3,831t483.896 721,131.107 24,233,092.684 5,497,746.12
(1) Statnnt as of Decmber 31, 198.(2) Excltsting OPNT ccaonent.
(0CD
0(JJ

ANCO IWG STATU5 OF GRAIN STORAGE AND DISTRIBUTION PROECT
(WORLD BANK PORTION)
(in Dollars)
LO AMO U N T S D I S B U R S E DI T E H A IND IN ------------ -------------- -------------- -------------- --------------- -------------- -------------- --------------- BALANCE
DOLtARS 1982 1983 1984 1985 1986 1987 1988 TOTAL
Silo. (26.000.000) - (2,535,339.51) (5,634,919.42) (12,565,658.13) (4.042,316.10) (366,883.61) (25.145,116.77) (854,883.23)
Office (A) 23,500.000 - 2.236.633.43 4.818,652.53 11,322,746.49 3,941.005.49 366,883.61 22.686.121.55 813,878.45
C.C.G.C. (B) 2.500,000 - 298,706.08 816,066.89 1,242,911.64 101,310.61 - 2,458,995.22 41,004.78
Ra11st (5.000.000) - (159,782.33) (696.966.01) (1.093,791.63) (45,455.89) (28.872.48) (319,665.22) (2,344,533.56) (2,655,466.44)
Sidings 2,000,000 - 159,782.33 248,165.11 256,556.79 45,455.89 28,872.48 84,424.33 823,256.93 1,176,743.07 osower Care 3.000,000 - - 448,800.90 837,234.84 - - 235,240.89 1,521,276.63 1,4?8,723.37
Engineering (2,200,000) (143.99w.41) (43,287.33) (104.164.10) (320,774.71) (599,119.79) (379,027.84) (143.156.88) (1,733,527.06) (466,472.94)
Toclmlca Assistance (1,200.000) - (178,462.62) (96,995.94) (18.511.64) (64,873.36) (25,120.88) (50,695.41) (434,659.87) (765,340.13)
Tralnin (400,000) - (3,504.84) (197,948.58) (142,963.20) (344,416.62) (55,583.3B)
Unallocat.d (700,000) - O .O0 (700,000.00)
TOTAL 35.500.000 143,995.41 381,532.28 3,433,465.56 7,01,1502.24 13,473,055.77 4,618,300.50 880.401.12 30,002,253.88 5,497,746.12
OPRT 2,500,000 _ _ _ 646,720.73 1,584,480.29 149,135.83 2,380,336.85 (119,663.15)
Ststemnt as of Pecder 31, 2988.
Hi(DQ
a

- 51 -
ANNEX 4Table 1
HANDLING OF IMPORTED GRAIN,WITH AND WITHOUT PROJECT (1.000 TONS)
WITHOUT WITH_______ _______ _______ _______ PROJECT PROJECT
Port of Arrival
La GouLette 1,030 804
Bizerte 335 455
Gabes 243 317
Rades 164
Sousse 100 54
Sfax 335 249
TOTAL 2,043 2 043
Unloadin11 ..
In butk 1,030 _1796
In bags 511 83
Hopper 502 64
TOTAL 2,043 2,043_
Direct Shipments from Ports
In bulk 1,200 880
In bags 290 118
TOTAL 1 490 998
Shipnents from Ports toStorage-Silo -_ _ __ __O_ _ __ _ _
In bulk 300 883
In bags 253 162
TOTAL 553 1
Shirment6 from Storage Silosto Millts and Feed Plants ________
In bulk 300 987(l)
In bags 253
TOTAL '553 1,045Mi) EsVitmate.

- 52 - ANNEX 4
Table 2
SAVINGS ON HANDLING OF IMPORTED GRAIN
ACTIVITY COST (D/t)
On-Board filling of bags(traditional method of unloading) 3.48
FiLling of bags using hopper alongside ship(another method of unloading) 1.50
Bag handling:
Weighing 0.40Loading onto trucks or rail cars 0.35Emptying into silo 0.20
0.95
SAVINGS ON EACH PHASE OF IMPORTED GRAIN MOVEMENT
Volume Cost Savings(1,000 tons) (D/t) (D '000)
§tage
Vessel unloading
- On-board filling of bags 390 3.48 1,357.20* Filling of bags using hopper 386 1.50 579.00
Ports to mills 282 0.95 267.00Ports to silos 61 0.95 57.95Silos to mills 84 0.95 79.80
Total annual saving through bulk handling 2,341.85
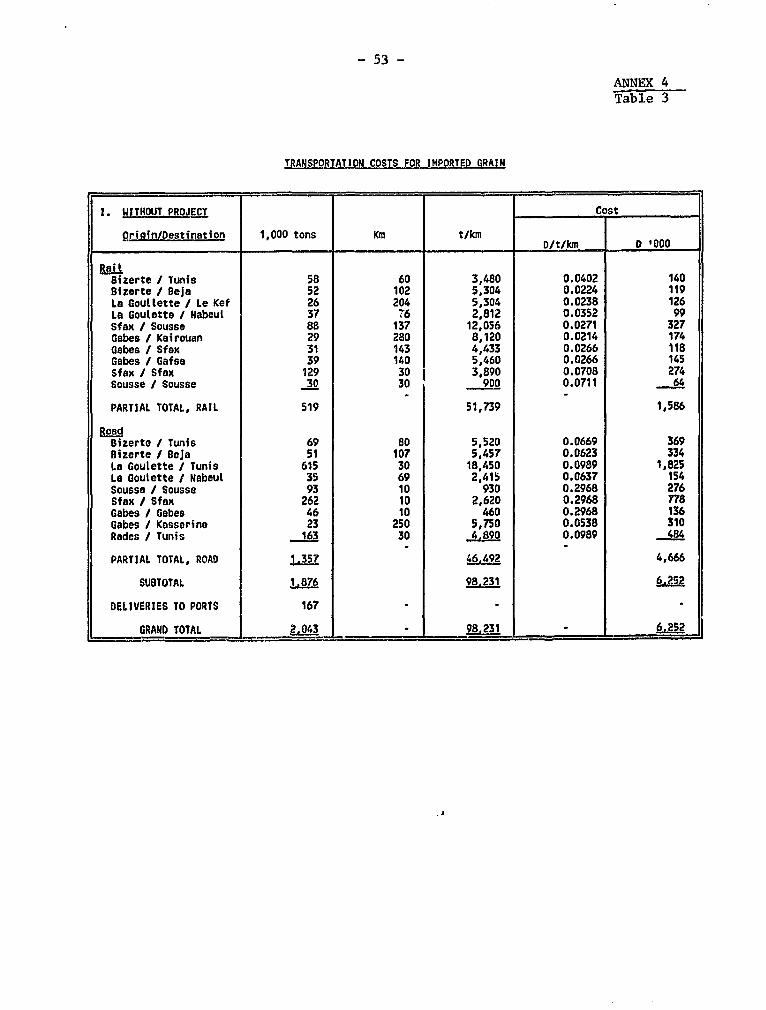
- 53 -
ANNEX 4Table 3
TRANSPORTATION COSTS FOR IMPORTED GRAIN
1. WITHOUT PROJECT Cost
Origin/Destination 1,000 tons Km t/km._ __ _. _ __ _. __ __ D/t/km _ D'000
RailBizerte / Tunis 58 60 3,480 0.0402 140Bizerte / Beja 52 102 5,304 0.0224 119La Goutlette / Le Kef 26 204 5,304 0.0238 126La Goulette / Nabeut 37 T6 2,812 0.0352 99Sfax / Sousse 88 137 12,056 0.0271 327Gabes / Kairouan 29 280 8,120 0.0214 174Gabes / Sfax 31 143 4,433 0.0266 118Gabes / Gafsa 39 140 5,460 0.0266 145Sfax / Sfax 129 30 3,890 0.0708 274Sousse / Sousse 30 30 900 0.0711 __6L4
PARTIAL TOTAL, RAIL 519 51,739 1,586
RoadBizerte / Tunis 69 80 5,520 0.0669 369Bizerte / Beja 51 107 5,457 0.0623 334La Goutette / Tunis 615 30 18,450 0.0989 1,825La Goulette / Nabeut 35 69 2,415 0.0637 154Sousse / Sousse 93 10 930 0.2968 276Sfax / Sfax 262 10 2,620 0.2968 778Gabes / Gabes 46 10 460 0.2968 136Gabes / Kasserine 23 250 5,750 0.0538 310Rades / Tunis 163 30 4,890 0.0989 484
PARTIAL TOTAL, ROAD 1.357 46.692 4,666
SUBTOTAL 1,876 98.231 6.252
DELIVERIES TO PORTS 167
GRAND TOTAL 2.043 ._ 98.231 . 6 2
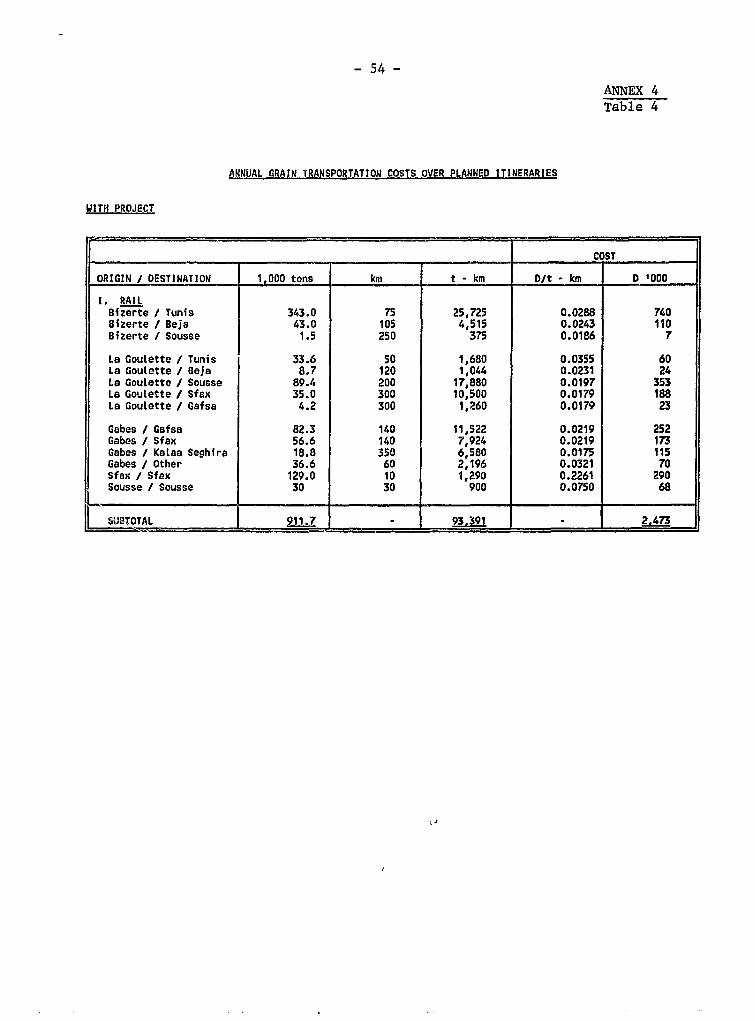
- 54 -
ANNEX 4Table 4
ANNUAL GRAIN TRANSPORTATION COSTS OVER PLANNED ITINERARIES
WITH PROJECT
COST
ORIGIN / DESTINATION 1,000 tons km t - km D/t - km D 1000
1. RAILBizerte / Tunis 343.0 75 25,725 0.0288 740Bizerte / Beja 43.0 105 4,515 0.0243 110Bizerte / Sousse 1.5 250 375 0.0186 7
La Goulette / Tunis 33.6 50 1,680 0.0355 60La Goulette / 3eja 8.7 120 1,044 0.0231 24La Goulette / Sousse 89.4 200 17,880 0.0197 353La Goulette / Sfax 35.0 300 10,500 0.0179 188La Goulette / Gafsa 4.2 300 1,260 0.0179 23
Gabes / Gafsa 82.3 140 11,522 0.0219 252Gabes / Sfax 56.6 140 7,924 0.0219 173Gabes / Kalaa Seghira 18.8 350 6,580 0.0175 115Gabes / Other 36.6 60 2,196 0.0321 70Sfax / Sfax 129.0 10 1,290 0.2261 290Sousse / Sousse 30 30 900 0.0750 68
l SUSTOTAL 911.7 93.391 2.473

ANNEX 4Table 5
GRAIN TRANSPORTATION BY ROAD-IN 1988
WITH PROJECT
COSTORIGIN / DESTINATION 1,000 tons km t - km CO;T
_____________ ~D/t - km D '000
I. ROADBizerte / Tunis 37.2 80 2,976 0.0669 199Bizerte / Beja 8.0 105 840 0.0623 52Bizerte / Other 1.7 30 51 0.0989 5
La Goutette / Tunis 473.7 30 14,211 0.0989 1,406La Goutette / Beja 2.4 130 312 0.0595 19La GouLette / Sousse 14.9 200 2,980 0.0554 165La Goutette / Sfax / Gafsa 1.3 300 390 0.0528 21La Goulette / Nabeul / Other 21.5 60 1,290 0.0733 95
Gabes / Sfax 38.9 140 5,446 0.0587 320Gabes / Kasserine 57.5 50 2,875 0.0784 226Sfax / Sfax 120.0 30 3,600 0.0989 356Sousse / Sousse 24 30 720 0.0989 71Rades / Tunis 163 30 4,890 0.0989 484
SUBTOTAL 964.1 4051 3419
_ _ _ . _ ___ _ -~~~~~~~~~~~~~~-

- 56 -
ANNEX 5TABLE 1
INVESTMENT AT ECONOMIC PRICES
(in D '000)
ITEM 1982 1983 1984 1985 1986 1987 1988
Site Purchase 101 201 . ..office . 3,902 7,403 12,828 4,222 471CCGC . 391 1,171 1,390 105Sidings 272 407 450 52 35 466Hopper cars 398 536 - . 147Engineering 342 32 121 413 648 435 168Technical assistance 9 141 101 21 220 140 70& trainingPort works . 699 1,639 154 -
TOTAL 452 646 51320 _ 63 16, 5.091
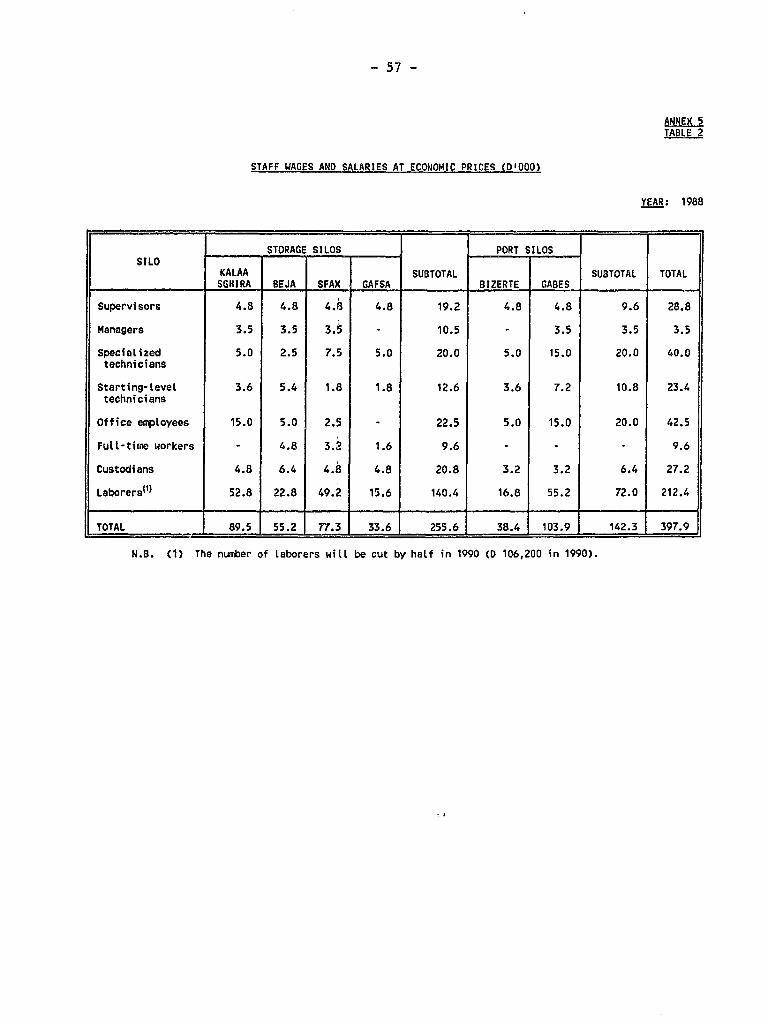
- 57 -
ANNEX 5TABLE 2
STAFF WAGES AND SALARIES AT ECONOMIC PRICES D'000)
YEAR: 1988
STORAGE SILOS PORT SILOSSILO
KALAA SUBTOTAL SUBTOTAL TOTALSGHIRA BEJA SFAX GAFSA BIZERTE GABES
Supervisors 4.8 4.8 4.8 4.8 19.2 4.8 4.8 9.6 28.8
Managers 3.5 3.5 3.5 - 10.5 - 3.5 3.5 3.5
SpeciaLized 5.0 2.5 7.5 5.0 20.0 5.0 15.0 20.0 40.0technicians
Starting-Level 3.6 5.4 1.8 1.8 12.6 3.6 7.2 10.8 23.4technicians
Office employees 15.0 5.0 2.5 - 22.5 5.0 15.0 20.0 42.5
Full-time workers . 4.8 3.2 1.6 9.6 - 9.6
Custodians 4.8 6.4 4.8 4.8 20.8 3.2 3.2 6.4 27.2
Laborers(1 ' 52.8 22.8 49.2 15.6 140.4 16.8 55.2 72.0 212.4
TOTAL 89.5 55.2 r7.3 33.6 255.6 38.4 103.9 142.3 397.9
N.B. (1) The number of Laborers will be cut by half in 1990 (D 106,200 in 1990).
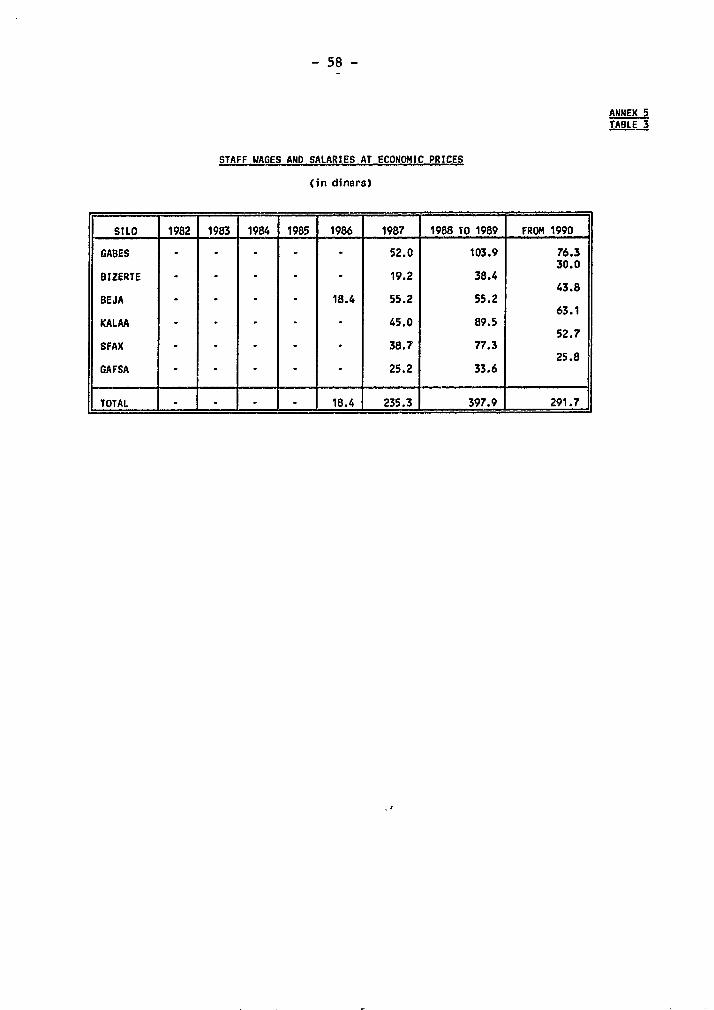
- 58 -
ANNEX 5TABLE 3
STAFF WAGES AND SALARIES AT ECONOMIC PRICES
(in dinars)
SILO 1982 1983 1984 1985 1986 1987 1988 TO 1989 FROM 1990
GABES - 52.0 103.9 76.330.0
BIZERTE . . . - 19.2 38.443.8
8EJA 18.4 55.2 55.263.1
KALAA . . 45.0 89.552.7
SFAX . . . . 38.7 77.325.8
GAFSA . . . . 25.2 33.6
TOTAL . _ - 18.4 235.3 397.9 291.7
,,
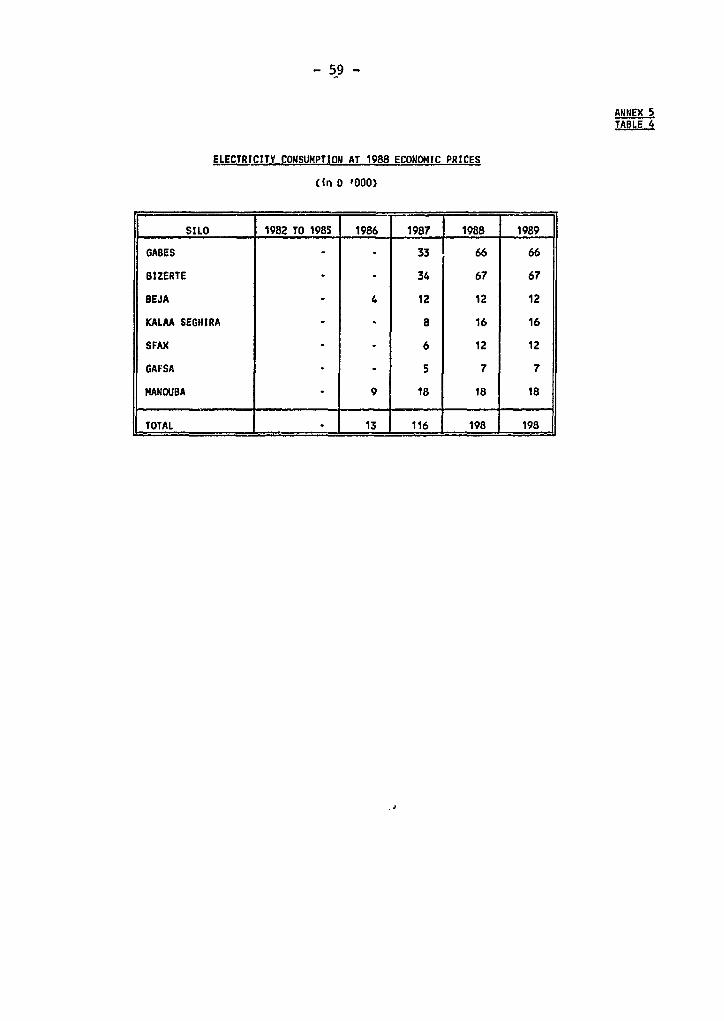
- 59 -
ANNEX 5TABLE 4
ELECTRICITY CONSUMPTION AT 1988 ECONOMIC PRICES
(in D '000)
SILO 1982 TO 1985 1986 1987 1988 1989
GABES . 33 66 66
BIZERTE . 34 67 67
BEJA 4 12 12 12
KALAA SEGHIRA 8 16 16
SFAX 6 12 12
GAFSA 5 7 7
MANOUBA 9 18 18 18
TOTAL __ . __ 13 116 198 198

- 60 -
ANNEX 5TABLE 5
ANNUAL OPERATING COSTS AT ECONOMIC PRICES
(in D '000)
VOLUME MISC., 2%HANDLED MAINTENANCE OF1,000 ELECTRIC WAGES AND AND SPARE PARTIAL PARTIAL
SILO tons POWER SALARIES PARTS(1 ) TOTAL TOTAL TOTAL
GASES 317 66 103.9 357 526.9 11 537.9
B12ERTE 370 67 38.4 238 343.4 7 350.4
BEJA 41 12 55.2 107 174.2 4 178.2
KALAA SEGHIRA 147 16 89.5 155 260.5 5 265.5
SFAX 320 12 77.3 143 232.3 5 237.3
GAfSA 91 7 33.6 95 135.6 3 138.6
MANOU8A 305 18 . 95 113.0 2 115.0
TOTAL 1,591 198 397.9 1,190 1,785.9 37 1,822.9
(1) [sic] The number of laborers wiLl be cut by half in 1990.(2) (sic] Maintenance and spare parts constitute 3X of total capital cost.
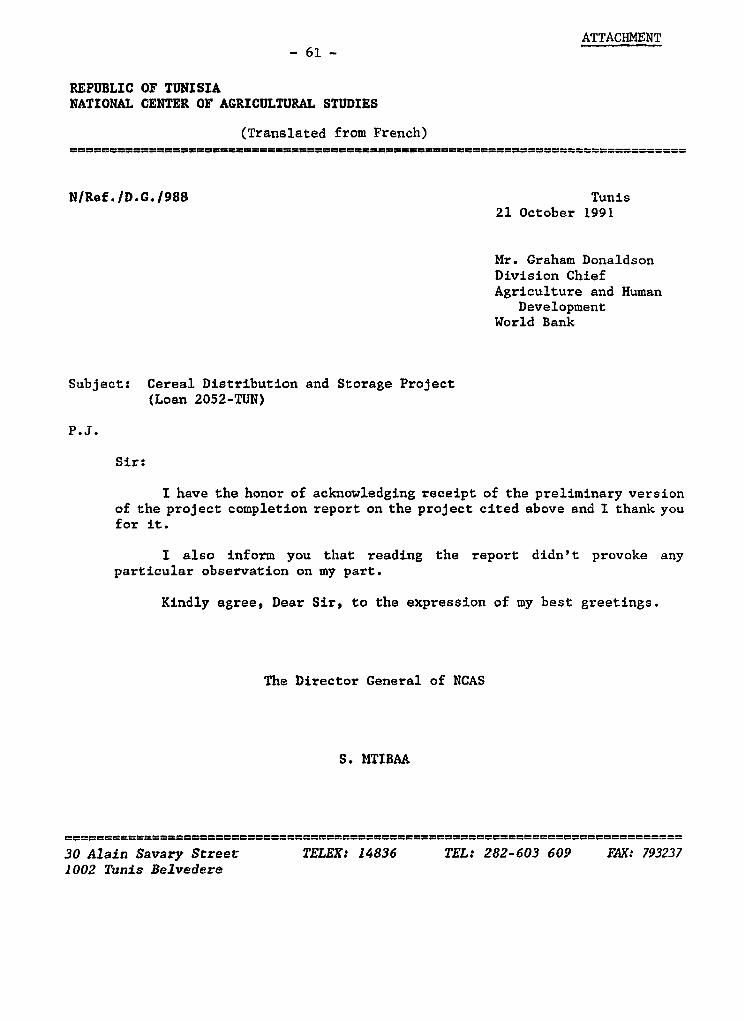
ATTACHMENT- 61 -
REPUBLIC OF TUNISIANATIONAL CENTER OF AGRICULTURAL STUDIES
(Translated from French)
N/Ref. /D.G. /988 Tunis21 October 1991
Mr. Graham DonaldsonDivision ChiefAgriculture and Human
DevelopmentWorld Bank
Subject: Cereal Distribution and Storage Project(Loan 2052-TUN)
P.J.
Sir:
I have the honor of acknowledging receipt of the preliminary versionof the project completion report on the project cited above and I thank youfor it.
I also inform you that reading the report didn't provoke anyparticular observation on my part.
Kindly agree, Dear Sir, to the expression of my best greetings.
The Director General of NCAS
S. MTIBAA
30 Alain Savary Street TELEX: 14836 TEL: 282-603 609 PAX: 7932371002 Tunis Belvedere