world bank document€¦ · document of the world bank report no: 23825-ur project appraisal...
TRANSCRIPT

Document of
The World Bank
Report No: 23825-UR
PROJECT APPRAISAL DOCUMENT
ONA
PROPOSED LOAN
IN THE AMOUNT OF US$ 42.0 MILLION
TO THE
REPUBLICA ORIENTAL DEL URUGUAY
FOR A
THIRD BASIC EDUCATION QUALITY IMPROVEMENT PROJECT
March 27, 2002
Country Management Unit for Argentina, Chile, Paraguay and UruguayHuman Development Sector Management UnitLatin American and the Caribbean Region
Pub
lic D
iscl
osur
e A
utho
rized
Pub
lic D
iscl
osur
e A
utho
rized
Pub
lic D
iscl
osur
e A
utho
rized
Pub
lic D
iscl
osur
e A
utho
rized
Pub
lic D
iscl
osur
e A
utho
rized
Pub
lic D
iscl
osur
e A
utho
rized
Pub
lic D
iscl
osur
e A
utho
rized
Pub
lic D
iscl
osur
e A
utho
rized

CURRENCY EQUIVALENTS
(Exchange Rate Effective March 25, 2002)
Currency Unit = Peso Uruguayo (UYU)UYU I = US$0.067
US$1 = UYU 14.75
FISCAL YEARJanuary 1 -- December 31
ABBREVIATIONS AND ACRONYMS
ANEP National Administration for Public Education (Administraci6n Nacional de Educacion Publica)CAS Country Assistance StrategyCEP Primary Education Council (Consejo de Educaci6n Primaria)CERPs Teacher Training Centers (Centros Regionales de Profesores)CETP Technical Professional Education Council (Consejo de Educacion Tecnica Profesional)CODICEN Central Directive Council of Education (Consejo Directivo Central)EA Environmental AssessmentESA Health and Environmental Education (Educaci6n de Salud y Ambiente)ETC Full-time school (Escuela de Tiempo Completo)FMR Financial Management ReportIADB Inter-American Development BankIBRD International Bank for Reconstruction and DevelopmentICB Intemational Competitive BiddingIFDs Teacher Training Institutes (Institutos de Formaci6n Docentes)LAC Latin America and the Caribbean RegionMEC Ministry of Education and Culture (Ministerio de Educaci6n y Cultura)MECAEP Basic Education Quality Improvement Project (Proyecto de Mejoramiento de la Calidad de la
Educaci6n Primaria)MIS Management Information System (Sistema de Secretarias Escolares)MtR Mid Term ReviewNBF Non Bank FinancingNCB National Competitive BiddingOECD Organization for Economic Cooperation and DevelopmentOM Operational ManualPCU Project Coordinating UnitPDE School Development Program (Programa de Desarrollo Escolar)PIP Project Implementation PlanPISA Program for International Student AssessmentPME Education Improvement Project (Proyecto de Mejoramiento Educativo)SOE Statement of ExpensesTIMSS Third Intemational Math and Science StudyUOR University of the RepublicUY UruguayUMRE Educational Results Measuring Unit (Unidad de Medici6n de Resultados Educativos)
Vice President: David De FerrantiCountry Manager/Director: Myma L. Alexander
Sector Manager (Acting): William ExpertonTask Team Leader/Task Manager: Ricardo Silveira/Andrea Guedes

URUGUAYTHIRD BASIC EDUCATION QUALITY IMPROVEMENT PROJECT
CONTENTS
A. Project Development Objective Page
1. Project development objective 32. Key performance indicators 3
B. Strategic Context
1. Sector-related Country Assistance Strategy (CAS) goal supported by the project 32. Main sector issues and Government strategy 43. Sector issues to be addressed by the project and strategic choices 7
C. Project Description Summary
1. Project components 112. Key policy and institutional reforms supported by the project 143. Benefits and target population 154. Institutional and implementation arrangements 15
D. Project Rationale
1. Project alternatives considered and reasons for rejection 162. Major related projects financed by the Bank and other development agencies 173. Lessons learned and reflected in the project design 184. Indications of borrower commitment and ownership 195. Value added of Bank support in this project 20
E. Sumnmary Project Analysis
1. Economic 202. Financial 213. Technical 214. Institutional 225. Environmental 236. Social 247. Safeguard Policies 25
F. Sustainability and Risks
1. Sustainability 26

2. Critical risks 263. Possible controversial aspects 27
G. Main Loan Conditions
1. E]ffectiveness Condition 282. Other 28
H. Readiness for Implementation 28
I. Cormpliance with Bank Policies 29
Annexes
Annex 1: Project Design Summary 30Annex 2: Detailed Project Description 37Annex 3: Estimated Project Costs 46Annex 4: Cost Benefit Analysis Summary 47Annex 5: Financial Summary 63Annex 6: Procurement and Disbursement Arrangements 68Annex 7: Project Processing Schedule 78Annex 8: Documents in the Project File 79Annex 9: Statement of Loans and Credits 81Annex 10: Country at a Glance 82Annex 11: Social Assessment of Full-time Schools 84Annex 12: Organizational Charts of the Education System and ANEP 87Annex 13: Calculation of Income Levels according to Sociocultural Background from Data in the 89
Continuous Household SurveyAnnex 14: Lessons Learned 96
MAP(S)

URUGUAYThird Basic Education Quality Improvement Project
Project Appraisal DocumentLatin America and Caribbean Region
LCSHE
Date: March 27, 2002 Team Leader: Ricardo Rocha SilveiraCountry Manager/Director: Myma Alexander Sector Manager: William ExpertonProject ID: P070937 Sector(s): EP - Primary EducationLending Instrument: Specific Investment Loan (SIL) Theme(s): Education
Poverty Targeted Intervention: Y
Project Financing DataX] Loan [ ] Credit C ] Grant [ ] Guarantee [ Other:
For Loans/CreditslOthers:Loan Currency: United States DollarAmount (US$m): $42.0
Borrower Rationale for Choice of Loan Terms Available on File: 1 Yes
Proposed Terms (IBRD): Fixed-Spread Loan (FSL)Grace period (years): 5 Years to maturity: 15Commitment fee: 0.75% Front end fee (FEF) on Bank loan: 1.00%
Payment for FEF: Capitalize from Loan Proceeds
Initial choice of Interest-rate basis: Maintain as Variable
Type of repayment schedule:[X] Fixed at Commitment, with the following repayment method (choose one): level[ ], Linked to Disbursement
Conversion options: [X]Currency [X]Interest Rate [X]Caps/Collars: Capitalize from Loan Proceeds
Financing Plan (US$m): Source Local Foreign TotalBORROWER 11.96 2.04 14.00IBRD 33.50 8.50 42.00Total: 45.46 10.54 56.00Borrower: REPUBLIC OF URUGUAYResponsible agency:ANEP - Administraci6n Nacional de Educaci6n Publica (National Adminstration of Public Education)Address: Soriano 1045Contact Person: Javier Bonilla, Director of ANEPTel: (5982) 9013457 Fax: (5982) 9023491 Email: [email protected]
Other Agency(ies):MECAEP Project Implementing UnitAddress: Plaza Independencia 822, piso 10Contact Person: Ines Lacalle, Project CoordinatorTel: (5982) 9027359 Fax: (5982) 9082062 Email: [email protected]

Estimated Disbursements ( Bank FY/US$m):FY 2003 2004 2005 2006 2007 2008
Annual 6.12 8.10 9.37 9.21 9.20Cumulative 6.12 14.22 23.59 32.80 42.00
Project implementation period: 07/01/2002-06/30/2007Expected effectiveness date: 07/01/2002 Expected closing date: 12/31/2007XSPAD F.- R. Md
-2 -

A. Project Development Objective
1. Project development objective: (see Annex 1)
The objective of this project is to increase equity, quality, and efficiency in the provision of preschool andprimary education. These objectives will be achieved by: (i) expanding the full-time school model, whichfocuses on students from socioeconomically disadvantaged backgrounds; (ii) improving the quality ofpreschool and primary education by enhancing the teacher training system and introducing new teachingand learning instruments in the classroom; and (iii) increasing the efficiency of education institutions.
2. Key performance indicators: (see Annex 1)
Progress toward the development objective will be monitored and assessed based on the output anddevelopment outcome/impact indicators listed below:
1. Expand the full-time school model in socioeconomically disadvantaged areas to reach 86,000 studentsbetween the ages of 4 and 11, covering at project completion over one fifth of total enrollment in publicpreschool and primary education.
2. Improve the academic achievement/l results of students from more disadvantaged backgrounds inLanguage and Mathematics in 6th grade by at least 12 percentage points by project completion./2
3. Reduce repetition rates for first and second grade students from more disadvantaged backgrounds by atleast nine and seven percentage points, respectively, by project completion.
1/ Achievement is defined as the percentage of students who achieve a predefined satisfactory level of proficiency in Language and Mathematics (atleast 60 percent of questions answeted correctly).
2/ The unit of measurement used to track project imipact is the school. When we speak of improvements in academic achievement and repetition ratesfor students from more disadvantaged backgrounds, we are actually measuring progress in schools classified as of more disadvantaged contexts.School classification is based on the answers to a questionnaire distributed to students in 6th grade to be filled out by parents. The questionnaire asksfor household informnation such as the education attainment of the mother and availability of certain consumer durables. Schools are then classified bysocioeconomic context as very disadvantaged, disadvantaged, average, favorable and very favorable. Annex 13 provides details on the design of thissocioeconomic classification and its relation to household income. The Project Coordinating Unit is presently mapping schools by household basicneeds and income so that, in the future, school progress may be tracked by these indices in addition to socioeconomic context.
B. Strategic Context
1. Sector-related Country Assistance Strategy (CAS) goal supported by the project: (see Annex 1)Document number: R2000-82 Date of latest CAS discussion: June 6, 2000
The CAS proposes to continue to reinforce Uruguay's economic and socialdevelopment, with increased concentration on activities that affect sustainability,address pockets of poverty, and protect for economic vulnerability. The consultativeprocess involved in the study of social exclusion helped identify key geographic areasand social groups that need assistance. The Country Assistance Evaluation, anddiscussions with Government. have encouraged the Bank to continue supporting theexpansion of access to education, private sector development and financial sectorreform. The largest vulnerable group identified is children in povertv. These childrenare also associated with poor female headed-households that face difficultcircumstances in balancing survival employment and child-rearing responsibilities. Interms of breaking the cycle of poverty in poor neighborhoods, the most critical factoris to start children early and keep them in school with better quality schooling. Thus.
- 3 -

management proposes to expand the Bank's successful program of support for theeducation sector.
Through the proposed project, the Bank supports the government strategy to give priority to the educationsector and to focus on equity, quality, and efficiency in the provision of preschool and primary educationservices as a way to reduce poverty and to improve income distribution in Uruguay.
2. Main sector issues and Government strategy:
2.1. The education system in Uruguay
The formal education system comprises: (i) a 10 year basic education cycle consisting of at least oneoptional year of preschool, six years of compulsory primary, and three years of compulsorylower-secondary; (ii) three years of upper-secondary education offering two tracks to basic educationcompleters to prepare them either to continue on to tertiary education (academic track), or to becomemid-level technicians (technical-vocational track) or professionals (Consejo de Educaci6n TecnicaProfesional - CETP); and (iii) higher education for upper -secondary graduates lasting an average of fouryears. Special education is provided to children aged 5-14 with learning disabilities or other majorimpairments. Adult education is offered to those 15 years or older who need to complete their formal basiceducation or acquire non-formal vocational training. Teacher training lasts three to four years and isprovided to aspiring teachers in Teacher Training Institutes (Institutos de Formacion Docente - IFDs) andin Teacher Training Centers (Centros Regionales de Profesores - CERPs).
Since the passing of the 1985 Education Law (N. 15.739), the education system has been the responsibilityof the National Administration for Public Education (ANEP - Admininistraci6n Nacional de Educaci6nPuiblica,), the Ministry of Education and Culture (MEC), and the University of the Republic (UOR).ANEP is in charge of preschool, primary, secondary, and technical education, pre-service, and in-serviceteacher training. The MEC does not have a direct role in the delivery of education services and isresponsible for cultural activities and for setting science and technology policies. It is also the executivebranch's link to the public and private universities. To carry out its legal responsibilities, ANEP relies on aCentral Directive Council of Education (CODICEN - Consejo Directivo Central), composed of fivemembers who are nominated by the President and appointed by Congress. In turn, CODICEN relies onthree independent and autonomous councils (Primary, Secondary, and Technical Professional). Theyoversee respectively: (i) preschool, primary, and special education; (ii) secondary education; and (iii)technical education and vocational training. CODICEN has administrative and educational planningresponsibilities. In the educational area, CODICEN is responsible for setting curricula guidelines,approving educational programs, and consolidating and analyzing educational statistics.
2.2 Main sector issues
Preschool coverage of five year olds is nearly universal, and enrollment of four year olds has quadrupledsince 1994 and now stands at 85 percent, an unprecedented achievement in the region. At the primarylevel, coverage and completion rates have reached 98 percent, while drop out rates are less than 1 percent.While primary school enrollment in Uruguay is mainly urban, the country has a total of 1,100 ruralschools, with an enrollment of approximately 16,500 students (grades 1 to 6), representing 4.3 percent oftotal primary education enrollment. Approximately 83 percent of rural students at the primary level comefrom a very disadvantaged background.
Despite high primary level completion rates, the results of the 1999 National Student Assessment for 6th
- 4 -

graders have demonstrated quality and equity problems in the system. According to the assessment, nearly60 percent of all the students tested in Mathematics and 40 percent in Language failed the test. Moreover,assessment results were even lower for students attending schools of more disadvantaged socioeconomiccontexts, with 70 percent of them failing the Mathematics exam and 51 percent failing the Language exam.These academic deficiencies are carried into the secondary level.
Uruguay's primary level repetition rate is 10.3 percent, compared to 5.3 percent in Argentina and 5.4percent in Chile. It tends to be concentrated in first and second grades (the average for the first two yearswas 17.4 percent in 2000) and is closely correlated to the socioeconomic context of the students. Amongstudents attending schools of more disadvantaged socioeconomic contexts, almost one-fourth repeat firstgrade. Due to high repetition rates, age-grade distortion at the 6th grade stands at 21 percent. Themajority of the over-aged children are from the more disadvantaged contexts.
In secondary education, despite significant increases in enrollment in the last 30 years (a 70 percentincrease between 1970 and 1998), the overall net enrollment rate is still low, particularly when comparedwith OECD. The lower secondary level has a net enrollment rate of 65 percent (about 70 percent iftechnical education is included), with significant drop-outs (19 percent) and repetition rates nearing 21percent. The upper secondary level has yet more acute problems, with a net enrollment rate of about 44percent and a repetition rate of 23 percent. Secondary education completion rates for 20 to 25 year olds is42 percent, which is lower than many countries in the region (49 percent in Panama, 50 percent inArgentina, 56 percent in Chile, and 61 percent in Peru and Bolivia). The problems that permeate thesecondary level are the result of: (i) inadequate preparation at the primary level; (ii) a rigid curriculumtailored to preparing students for the university, with little relevance to those who plan on joining the laborforce; and (iii) the need to enter the labor market, particularly among the lower income level students (seeTable 1).
Table 1: Percentage of 15 and 18 Year Old Males Who Have Dropped out of School, by IncomeLevel (Urban areas, 1997)
Country Population age Low Income Medium IncomeUruguay 15 years 43.9 9.2
18 years 75.5 55.4Chile 15 years 18.3 14.8
18 years 48.9 42.0Argentina 15 years 21.5 14.9
18 years 41.6 42.2Source: Primer Panorama Social de la Infancia y la Familia en Uruguay. IPES, Universidad Cat6lica deUruguay, 2001.
Tertiary education services are delivered by the University of the Republic-UOR (about 75 percent of totaltertiary enrollment), by private universities and institutes (about 12 percent of enrollment), and by teachertraining institutes and centers (about 13 percent of enrollment). Overall, university enrollment (13 percentof the population aged 18 to 30) is significantly below what could be expected for a country at Uruguay'sincome level. Moreover, public university education is highly regressive, with nearly half of UOR'sresources benefiting the richest 20 percent of the population and only 1.4 percent directed to the poor.Finally, UOR delivers its services rather inefficiently, with one of the lowest graduation rates of the region(5.3 percent of graduates out of overall enrollment, compared with 6.7 percent in Chile, 15.9 in Colombia,and 7.9 in Costa Rica) and first year drop out rates as high as 40 percent in some faculties. The averagestudent who succeeds in graduating takes over nine years to do it at a cost of some US$ 35,000. At theteacher training institutes, efficiency is not a serious issue (average repetition rate of about 1 percent), but
- 5 -

there are concerns about the duration and content of the program, as well as the quality of graduates exitingthe program.
2.3 Government strategy
Since 1995, the Uruguayan Government has been undertaking an education reform which stronglyemphasizes improving equity in the provision of educational services to ensure not only greater access toeducation for the poor but also greater quality in the education that they receive. ANEP has also expressedits commitment to continuing and deepening the transformation and modernization of the public educationsystem and to moving towards the implementation of a lifelong learning education concept to fit thechanging needs of the labor force. Its priorities are to: (i) improve equity by targeting the mostdisadvantaged groups; (ii) improve the quality of education by revising the traditional public schooleducation model and promoting greater access to new technologies; (iii) expand coverage in secondaryeducation to universal levels and offer new ways to enter the secondary cycle, under a more differentiatedcurriculum; and (iv) improve the professional skills of teachers, directors, and supervisors to achieve betterperformance and greater innovation in schools.
These priorities will be achieved by: (i) expanding the full-time school model in urban areas and adaptingthis model for rural schools, integrating new technology in the schools, and piloting bilingual education; (ii)ensuring that preschool coverage of four and five year olds is at universal levels; (iii) improving academicperformance in lower secondary education while expanding coverage at this level; (iv) reforming uppersecondary education to allow graduates either to enter the labor market or to continue on to universityeducation; (v) reforming technical upper secondary education to build links to the labor market and createoptions for technical education to capture those young people who are currently out of school and out of thelabor market; (vi) continue the ongoing efforts to reform teacher training and career development forteachers; and (vii) modernize ANEP institutions.
In primary education, the main emphasis of the reform has been to implement compensatory policies aimedat reducing inequities in the system. In this context, the full-time school program for urban schools waslaunched in 1995, primarily targeting students from disadvantaged and very disadvantaged backgrounds.The efforts carried out by the Government have resulted in improvements in learning achievementsnationvvide, as shown in the results of the 1996 and 1999 National Learning Assessments. While theseimprovements have been greater for disadvantaged and very disadvantaged groups, the gap in learningachievements between students attending schools in more favorable contexts and those attending schools inmore disadvantaged contexts remains wide. In addition, rural schools had very low achievement scores dueto the strong concentration of students from more disadvantaged backgrounds in rural areas.
Table 2: Student Achievement ResultsSchool Socioeconomic Classification
Very Favorable Favorable Average Disadvantaged VeryDisadvantaged
1996 1999 1996 1999 1996 1999 1996 1999 1996 1999
Language%of students achieving satisfactory level 85.4 88.0 70.2 73.9 58.4 61.5 48.5 51.4 37.1 | 46.7Difference in results (1996/99) +2.6 +3.7 +3.1 +2.9 +9.6Mathematics% of students achieving satisfactory level 66.4 | 71.2 46.2 | 51.5 34.0 | 39.4 24.1 | 27.9 16.7 | 27.9Differernce in results (1996/99) +4.8 +5.3 +5.4 +3.8 +11.2
- 6 -

Some of these key strategic priorities are already being addressed with support from the World Bank andthe Inter-American Development Bank (IADB). The World Bank has supported the improvement ofpreschool and primary education through the Basic Education Quality Improvement Project (MECAEP I -Loan 3729-UY, approved May 3rd, 1994; closed June 30, 2001) and the Second Basic Education QualityImprovement Project (MECAEP II - Loan 4831-UY, approved July 6th, 1998). The IADB hasconcentrated its support in two projects focusing on technical and secondary education and on teachertraining. The IADB projects support the secondary education reform, which aims at making the highersecondary level accessible to more youth by introducing a curriculum that is less university-bound.
Both World Bank-financed projects aimed to improve the equity, quality, and efficiency of basic education.MECAEP I emphasized: (i) expanding preschool coverage in socioeconomically disadvantaged areas,improving students' preparation for the first years of primary education and consequently reducingrepetition rates; (ii) improving the quality of primary education by providing free textbooks for all,developing an student assessment system and introducing Education Improvement Projects (PMEs); and(iii) strengthening the management of the basic education system. The implementation of MECAEP Iconcluded on June 30, 2001, having met its objectives and surpassed its targets.
MECAEP II currently supports: (i) the development of the full-time school model in a focused effort toreach students (4 to 11 years old) from the most socioeconomically disadvantaged groups in urban areasand (ii) universal coverage for preschool (ages four to five years old). This project is being successfullyimplemented in terms of its development objectives and targets.
MECAEP III intends to build on the successes of MECAEP I and II and to strengthen and expand on theirachievements. The project supports the promotion of equity, quality, and institutional efficiency in theUruguayan school system.
3. Sector issues to be addressed by the project and strategic choices:
3.1 Improving equity and quality
As previously stated, Uruguay's primary education indicators stand above regional averages and arecomparable to Chile and Argentina. Coverage is practically universal (98 percent), repetition rates are lowexcept for 1st and 2nd grades, drop out rates are less than 1 percent, and completion rates are at 98percent. Notwithstanding, these indicators conceal serious quality problems, as confirmed by the results ofthe 1996 and 1999 student assessment tests. They also obscure equity issues, as repetition rates andage-grade distortions tend to be higher among children from poorer socioeconomic areas.
In 1990, as part of the Government's strategy to improve quality, a longer school-day was introduced inseveral schools of lower socioeconomic contexts. While this extension of the school schedule was notaccompanied by any significant change in the pedagogical model, the results of the 1996 National LearningAssessment indicated that it had a positive impact on student performance. Satisfactory results inLanguage and Mathematics assessments were substantially higher for students from schools ofdisadvantaged contexts with extended hours than those students who attended schools of the samesocioeconomic contexts, but without the extended hours (29.7 percent and 26.1 percent more studentsobtained satisfactory grades in Language and Mathematics, respectively). Similarly, students from schoolsof very disadvantaged contexts with extended hours performed better than their peers in regular schools(19.3 percent and 16.6 percent more students obtained satisfactory grades in Language and Mathematics,respectively).
-7 -

In 1998, with support from MECAEP II, a new pedagogical full-time school model was introduced. Thismodel aimed to contribute to performance improvements beyond those already achieved by longer schooldays. T'he objective was to increase educational opportunities for the most disadvantaged students and toimprove the quality of primary education. Around 80 percent of the full-time schools are classified as ofmore disadvantaged contexts, while about 20 percent of them are classified as from average and morefavorable contexts. The rationale behind the placement of a share of ETCs outside more disadvantagedareas was to avoid stigmatizing full-time schools as schools for the poor. The 1999 National LearningAssessment showed that, at the national level, the overall number of 6th grade students proficient inLanguage increased from 57.1 percent to 61.3 percent, while the proficiency of students in full-time schoolswent up from 52.9 percent to 57.4 percent. In Mathematics, at the national level, satisfactory test resultswent from 34.6 percent to 40.8 percent and for full-time students, they increased from 25.3 percent to 41.0percent.
The evidence confirms that extending the school day has a positive impact on all students, and thatenriching this extended day with nontraditional education activities has an even greater impact. MECAEPIII will support the expansion of the full-time school model as well as its adaptation to rural schools.Additionally, the project will support the introduction of computers and other technology in full-timeschools, as well as in-service teacher training on the new model and new pedagogical practices in theclassroom.
3.2 Strengthening teacher training institutions
Uruguay's pre-service teacher training is a tertiary level, non-university program, lasting three to fouryears, depending on whether the candidate is seeking a magisterio degree to teach at the primary level or aprofesorado degree to teach at the secondary level. About 71 percent of the students currently enrolled atthe Institutos de Formaci6n de Docentes (IFDs) attend the three year program. A survey of the studentscurrently enrolled in these programs show that they are predominantly female and middle-class.
Traditionally, a teaching career has been a popular professional option for young people in Uruguay thusattracting a significant number of students to the teacher training institutes. The main reasons for theattractiveness of a teaching career in primary education are: (i) the short time needed to obtain a formalqualification (three years compared to four or five years for other tertiary level degrees); (ii) the guaranteeof a stable job; and (iii) the relatively high regards in which teachers are held in society. Notwithstanding,in the last few years the teaching profession has gradually been losing its prestige and becoming lessappealing to young people. Salaries are perceived as being low and, once in the system, teachers do nothave many career development opportunities.
While the shortage of teachers stopped being a problem in the last decade, teachers graduating fromtraining institutes are lacking both in knowledge of relevant content and in pedagogical skills, asdemonstrated by the results of public school teacher career entrance examinations that are held annually.For instance, the 1999 entrance examination --comprising of a two theory-based tests (education anddidactics) and a practical test (classroom performance)-- revealed that the majority of teachers tested didnot have the minimum skills expected of them: 69 percent of all primary level teachers and 58 percent ofall preschool level failed the test. All of the teachers who do not pass the examination each year are,nevertheless, teaching in public schools in temporary positions, and almost one-third of all primary publicschool teachers are not considered regular school staff (efectivo) because they have either not taken theentrance examination or have not passed it.
-8 -

There are also concerns as to the quality of teacher trainers. While all of them have some sort of tertiarylevel degree and 13 percent of them hold an university degree, only 10 percent are considered regular staff(efectivo) of the teaching institutes. In order for temporary teacher trainers to become regular, they alsohave to pass a content-oriented examination. Of those who took such examination in 1999, only 32 percentof the Science of Education teachers passed the examination, while only one-fourth of the Languageteachers passed theirs. The results of this examination point to a serious problem in terms of the quality ofthe teacher-trainers.
In addition to quality problems, a preliminary diagnosis of pre-service teacher training program hasconcluded that its curricula needs to be modernized to address today's challenges. Several efforts have beenmade in the past to reformulate the pre-service teacher training program to address these deficiencies. In1992, the pre-service teacher-training program was reduced from four to three years in order to rapidlymeet the increasing demand for teachers. That reduction inevitably limited the amount of time spent onpractical training and on Language and Mathematics training, among other subjects. Finally, the reformdid not address the lack of a relationship between the practice and theory being taught in the institutes. In1999, there was an attempt to reformulate the program to some extent by: (i) rationalizing the subjectstaught and the time allocated for them; (ii) strengthening the areas of Language, Mathematics, and teachingmethodologies; (iii) redesigning the Arts and Expression subject areas; and (iv) introducing Informatics. Atransitional program was established in 2000 to ensure that students who started under the 1999 curriculumcould graduate, while the government seeks to carry out an in-depth diagnosis of the teacher trainingsituation and to design a new proposal for the teacher training curricula. While these changes adequatelyaddressed the problem of teacher shortage, they have resulted in a system permeated with deficiencies dueto the coexistence of a plurality of curricula and modalities; and have furthered sacrificed the quality oftraining due to insufficient time allocated for in-classroom training.
MECAEP III will support ANEP in its efforts to modernize its teacher-training system and to establish a"life-long learning" strategy for teachers. The project will support an in-depth diagnosis of the presentsituation of teacher training and its institutions.
3.3 Strengthening education system institutions
During the second half of the 1990s, advances were made in strengthening the institutional capacity of theeducation system, both in terms of pedagogy and of administrative management. Progress towardsimproving the pedagogical aspects has been more noticeable than on the administrative aspects. Thedemands for information on students and schools are still insufficiently met by the existing evaluation andinformation systems. The Uruguayan student assessment is still sample-based and the informationcollected not comparable internationally. The management information system (Sistema de SecretariasEscolares - MIS) introduced under MECAEP I is not yet comprehensive, therefore data on enrollment,teacher qualifications, and school conditions in areas such as infrastructure, equipment, and teachingmaterials is not sufficiently complete to guide policy decisions. Finally, institutional strengthening, so far,has focused on central systems, with little attention being given to pedagogical planning at the school level.
To address institutional issues, the project will support ANEP's strategy in the following areas: (i)strengthening monitoring and evaluation in the education system; (ii) finalizing the implementation of theMIS; and (iii) strengthening the planning capacity of schools through the School Development Programs(PDEs).
-9-

Table 3: Activities under MECAEP ProjectsActivities MECAEP MECAEP MECAEP III
I n
1. Preschool
* Construction and rehabilitation of X X The project will include construction andclassrooms rehabilitation, learning materials, teacher
* Teaching materials X X training and studies for preschool classes in* Teacher training X X full-time schools.* Teacher salaries X X* Studies X X
II. Primary Education
A. Full-time School Model* Construction, rehabilitation, X x
transformation and equipping of schools* Acquisition of school equipment, leaming X The project will include acquisition of
materials and school libraries computers for all ETCs, educationalsoftware, and learning materials forclassrooms in a bilingual program.
* Teacher training in full-time school X Teacher training in the full-time schoolmodel model includes training on new educational
technologies and bilingual education.* Strengthening the partnership between X x
schools and parentsB. Textbooks X Textbooks will be financed for full-time
schools only and for one year equivalentonly.
C. Institution Building* Design of teacher training reform X* Development, implementation, X In addition to regular PMEs, the project will
mconitoring, and dissemination of School create a separate fund for PMEs specific forImprovement Programs environment and health education.
Introduces training for school staff on theelaboration of School DevelopmentPrograms, as a framework for PMEs.
* Monitoring of the education program X The project will support participation in* Stutdent Assessments X international evaluation exercises.* Management Information System (MIS) X
The project introduces intensive training andexpands coverage of MIS to cover all schoolswith 50 students or more.
- 1 0 -

C. Project Description Summary
1. Project components (see Annex 2 for a detailed description and Annex 3 for a detailed costbreakdown):
Project Component 1 - Expansion of the Full-time School Model - US$ 44.52 milion (79.5 percent oftotal project cost)
The main objective of this component is to expand the existing pedagogical model of urban full-timeschools (Escuelas de Tiempo Completo - ETCs) from 35,000 students to 78,000 students. The componentwill also adapt the urban fill-time school model to rural areas, covering some 8,000 students in 172 ruralschools with 30 students or more. At project completion, approximately 86,000 students will be coveredby ETCs or over one-fifth of the urban and rural enrollment. The project will continue the efforts ofMECAEP II in improving the quality of primary education.
1.1 Construction, transformation, rehabilitation and equipping of ful-time schools
MECAEP III will provide the physical infrastructure necessary to expand the full-time school model tobenefit an additional 51,000 students, representing approximately 13 percent of total enrollment in publicpreschool and primary education. This will consist of: (i) the construction of 540 full-time classrooms indisadvantaged and very disadvantaged urban communities, equivalent to about 68 new schools, coveringnearly 17,000 students; (ii) the transformation and rehabilitation of 816 classrooms in urban double shiftschools into full-time schools, by transferring students from one of the two shifts of a regular school intonew full-time schools and/or by rationalizing regular school enrollment, involving 102 schools andbenefiting around 26,000 students; and (iii) the rehabilitation of 434 rural classrooms (172 schools) toadapt them to the rural full-time school model, benefiting some 8,000 students, or about 41 percent of ruralenrollment.
The project will finance civil works as well as the acquisition and distribution of: (i) furniture for all thenew classrooms and spaces built during the project's implementation and for approximately 15 percent ofexisting classrooms being converted to the full-time school model; and (ii) kitchen equipment for allfull-time schools created under the project.
1.2 Acquisition of school equipment, learning materials, and school libraries
MECAEP III will equip the full-time schools being created and will ensure that they are adequatelyprovided with educational materials. The project will finance the following school equipment and learningmaterials: (i) one television set and audio equipment per school (and one additional set for schools withbilingual program); (ii) one computer (including educational software and large screen) per classroom foreach full-time school in urban areas (including those financed under MECAEP II) and one computer(including educational software) per school in rural areas; (iii) one set of primary level learning materialsper full-time school with eight classrooms and two sets for schools with 16 classrooms; (iv) one set ofpreschool learning materials per school (with two preschool classrooms); (v) one set of learning materialsfor each rural full-time school; (vi) one set of learning materials for each of the 164 bilingual classrooms;and (vii) reading books and one year of textbooks for all full-time schools.
- 1 1 -

1.3 Treacher training on the full-time school model, new education technologies, and bilingualeducation
The new teacher training modules in MECAEP III build on the experience of the previous project andintroduce specific training in bilingual education and new education technologies. The project will financetraining in: (i) the full-time school pedagogical model provided to about 1,800 preschool and primaryschools teachers, principals, inspectors, and teachers in administrative positions and (ii) new educationaltechnology for some 3,700 teachers, principals, and inspectors. The full-time school pedagogical modelwill consist of two modules. The basic module will take 150 hours and will be mandatory. The secondmodule will take 80 hours, will be voluntary, and will be implemented through workshops in socialsciences, natural sciences and language. Training in new technologies will consist of: (i) workshops inTeacher Training Institutes on the use of new technologies; (ii) annual follow-up training at the RegionalTraining Centers for resource teachers; and (iii) tutorials for the resource teachers. The project will alsofinance training for approximately 164 teachers taking part in a program of partial immersion in Englishand Portuguese in 40 full-time schools, benefiting a total of 4,900 students.
1.4 Strengthening the partnership between schools and parents
Under MECAEP II, a school/parent partnership was forged to address the needs of students in schools inparticularly difficult social environments. The program introduced into each school a part-time,remunerated social worker intern (a recent university graduate or senior student) who is supported by ateam consisting of a psychologist and four senior social workers. Together, they work with teachers toidentify children in need of special attention and to develop a support program with the children's families.The project will finance the contracting of the social support teams that will enable the continuation of thisprogram, thus making these services available to 17,000 children in 72 schools. Each school will benefitfrom the program for three years with a gradual reduction in activities over time.
Project Component 2 - Institutional Strengthening - US$ 11.06 million (19.8 percent of total projectcost)
The main objective of this component is to strengthen the school and the overall education system. Theproject will enable education administrators to reformulate the teaching training system on the basis of theresults of a series of diagnostic exercises to be carried out during the project's first phase. The project willalso build on the experience of MECAEP I in implementing Education Improvement Projects (PMEs) andwill expand the scope and number of schools covered, with a particular emphasis on environmental andhealth education. Finally, MECAEP III will continue to finance student assessments and special sectorstudies.
2.1 Rteforming teacher training
The primary objectives of reforming the teacher training system are to improve the academic training ofteachers and to enhance the teaching career. This will be done by revising the curriculum, developing asystem of professional standards, and making a systematic evaluation of the teacher training institutesthrough exit tests for teachers. The project will finance technical assistance for: (i) a diagnosis of thepre-service and in-service teacher training programs; (ii) the development of professional standards; (iii) thedevelopment of teacher training evaluation instruments; (iv) curriculum development; (v) training of teachertrainers on the new curriculum for reformed pre-service teacher training; (vi) development of a careerstream; and (vi) in-service training program for tutors for teachers in practice. The project will alsofnance improvements to the libraries and to the physical structure of Teacher Training Institutes.
- 12 -

2.2 Development and implementation of Education Improvement Projects (PMEs)
The proposed project will finance 250 PMEs per year awarded on a competitive basis in regular andfull-time schools, 100 of which will focus on environmental and health education. A School DevelopmentProgram (PDE) prepared by the school staff, summarizing school problems, strategy, and priority actionswill provide the basis for the PMEs. Each PME will receive an average of US$ 2,100. While the projectwill finance some technical assistance to help to implement, monitor, and disseminate the PMEs, regularPMEs will be implemented by CEP staff, who were responsible for them during MECAEP I. During thefirst year of the project, environmental and health education PMEs will be entirely the responsibility of theMECAEP project implementation unit and will gradually be transferred to the CEP.
2.3 Monitoring of the Education Program
This sub-component will promote institutional strengthening by supporting:
* The ongoing development of the Research and Evaluation Division of the Planning Department(Gerencia de Investikaci6n v Evaluaci6n), which will absorb the Unidad de Medici6n de ResultadosEducativos (UMRE) created and financed under MECAEP I. This division will be responsible forcarrying out student assessments, impact evaluations of programs and innovations in learningachievement methods to be implemented at the primary and secondary levels. The project will alsosupport a universal-based student assessment in 2005 as well as Uruguay's participation inintemational assessments.
* The implementation of the management information system for schools (Sistema de SecretariasEscolares. This sub-component will deepen the efforts to create a school-based information system tocapture information on teachers, students, and school infrastructure. When the information system isfully implemented, ANEP expects to have readily available and current school-level data.
The project will finance: (i) training for 2,400 teachers and directors, 200 inspectors and 20 administrativepersonnel on the use of basic and MIS software; (ii) the purchase of computer equipment, software, andcomputer furniture for schools (250 computers, 350 printers, and 100 furniture sets); and (iii) technicalassistance.
2.4 Project Administration
The unit that has implemented MECAEP I and II will continue to be gradually reduced as its functions areabsorbed by ANEP, leaving only those staff who will be carrying out core implementation activities of theproject. The project will finance technical assistance in the following areas: (i) project coordination andadministration; (ii) management of the financial and physical execution of the project; (iii) management ofthe project's procurement activities; and (iv) monitoring and evaluation of the project. The project will alsofinance office and computer equipment for the Project Coordinating Unit (PCUT).
Front-end Fees
The Government requested that Front-end Fees, equivalent to 1 percent of total loan amount, be paid out ofloan proceeds.
- 13-

Table 4: Project Costs by Component
l_ Indicative Bank- % ofComponent Sector Costs % of financing Bank-
_______________________________ .______________ (US$M) Total (USSM ) financing1. Expansion of the full-time school Primary Education 0.0 0.0model
1.1 Construction, transformation, 33.87 60.5 26.92 64.1rehabilitation, and equipping offull-time schools1.2 Acquisition of school 5.49 9.8 3.80 9.0equipment, learning materials, andschool libraries1.3 Teacher training on the full-time 3.31 5.9 2.59 6.2school model, new educationtechnologies, and bilingual education1.4 Strengthening the partnership 1.85 3.3 1.21 2.9between schools and parents
2. Institutional strengthening InstitutionalDevelopment
2.1 Reforming teacher training 3.83 6.8 2.60 6.22.2 Development and 3.13 5.6 2.88 6.9implementation of PMEs2.3 Monitoring of the Education 2.09 3.7 1.06 2.5Program2.4 Project Administration 2.01 3.6 0.52 1.2
Total Project Costs 55.58 99.3 41.58 99.0
Front-end fee 0.42 0.8 0.42 1.0Total Financing Required 56.00 100.0 42.00 100.0
2. Key policy and institutional reforms supported by the project:
Key policies and institutional reforms include: (i) continued systematic expansion of the urban full-timeschool model from the existing 130 schools (at the end of MECAEP II) to 300 at the end of MECAEP IIIand the intemalization of the experience accumulated during the last few years; (ii) the incorporation of themain findings and recommendations of the social assessment and the teacher training evaluation regardingthe curriculum and institutional and sociological aspects that have not worked as planned when thefull-time school model was first introduced; (iii) adaptations of the pedagogical model to integrate the useof new technologies, partial immersion in foreign languages, and to expand the on-going single-cycleexperience; (iv) adaptation of the full-time school model to rural schools; (v) continuous institutionalizationof project activities into central administration (for example, UMRE) and the CEP (for example, textbooks,PMEs, and MIS); (vi) the elaboration of a new teacher training curriculum; and (vii) the development ofprofessional standards and evaluation for teachers.
- 14 -

3. Benefits and target population:
The main beneficiaries of the project are: (i) students through better education made possible by theexpansion of the full-time school model and other quality enhancing tools being introduced into the system;(ii) student mothers who now might be able to expand the number of hours worked; and (iii) school staffthrough greater teacher training opportunities as well from the teacher training reform.
Expansion of full-time school model. Up to 86,000 students (aged 4 to 11) enrolled in public schools willbe covered by the full-time school model at the completion of MECAEP II and III. These 86,000 studentsare equivalent to approximately one-fifth of the total number of students enrolled in public schools as of1999. Around 80 percent of these students study in schools classified as of more disadvantaged contexts.MECAEP III will introduce 43,000 new urban students (12.2 percent of students enrolled in urban publicprimary schools) and 8,000 rural students (41 percent of students enrolled in rural public primary schools)into the full-time school system
Around 1,800 teachers, principals and inspectors will receive training on the full-time school model. Sinceall full-time schools will receive computers and educational software, around 3,500 education staff(teachers, principals and inspectors) will receive training on the pedagogical use of the new educationtechnology.
Improvement of teacher trainingsy stem. Within this sub-component, beneficiaries include: (i) around 800teacher trainers who will receive training on the revised curriculum; (ii) around 2,200 tutor teachers forintem teachers (teachers-to-be), who will receive in-service training based on a specific program that willbe designed for this purpose.
Pilot Experience on Bilingual education. During the pilot experience to be developed under MECAEP III,around 4,900 students will benefit from foreign language immersion program in English or Portuguese.Around 100 teachers will receive specialized training to teach in these bilingual programs. There isevidence that bilingual education can bring students: (i) cognitive benefits, including improved mentalflexibility, increased metalinguistic awareness, and superiority in concept formation; (ii) academic benefitssuch as proficiency in a second language and higher scores in other subjects; and (iii) attitudinal benefits,including greater respect for and appreciation of cultural diversity and a rich preparation for the future.
Strengthening the partnership between schools and parents. Social services will be made available to17,000 children in 72 schools.
Management Information System (MIS). In order to complete the coverage of the MIS, 2,400 teachers,200 inspectors, and 20 administrative staff will be trained in the use of the school MIS.
4. Institutional and implementation arrangements:
The National Public Education Administration (Administraci6n Nacional de Educacion Puiblica -ANEP)will be the executing agency for the project. Since 1994, when MECAEP I started to be implemented,ANEP established a Project Coordination Unit, PCU (Unidad de Coordinaci6n del Proyecto MECAEP).The same PCU will be responsible for coordinating the implementation of MECAEP H and III projects.Amending the resolution that created the PCU for the ongoing projects is a loan effectiveness conditionwhich has already been met. This amendment expands the existence of the PCU so that it can continuefunctioning as the PCU for the duration of the proposed project.
The PCU has a General Project Coordinator (Coordinador General), responsible for the overall
- 15-

implementation of the project, Technical Coordinators (Coordinadores Tcnicos) responsible for: (i)full-time schools, (ii) teacher-training, (iii) project monitoring and evaluation, (iv) financial management,(v) procurement; (vi) architecture and civil works; and (vii) administration. The Project Coordinator willalways be appointed by CODICEN with the prior "no objection" of the Bank. As was agreed forMECAIEP II, when appropriate, technical specialists will be hired for specific areas. Terms of referencefor the key personnel of the PCU, satisfactory to the Bank, are included in the General Operational Manual.The PCUJ will coordinate the project execution with institutionalized departments within ANEP/CEP.
The Bank and ANEP have agreed on a Project Implementation Plan (PIP), including detailed quantitativeannual monitoring indicators. The Borrower and ANEP agreed to participate in annual project reviews,starting in October 2003. ANEP also agreed to prepare semi-annual progress reports for every calendaryear of the project, the first of which will be due in March 2003. The National Accounting Tribunal(Tribunal de Cuentas de la Reputblica) will audit the project's records and accounts in accordance withprocedures acceptable to the Bank. Audit reports shall be delivered to the Bank within six months of theend of each fiscal year.
D. Project Rationale
1. Project alternatives considered and reasons for rejection:
Project design. The number of issues tackled by the initial project, as proposed by the Borrower, was toowide. During the preparation of the project, it was decided that such a wide range of components wouldjeopardize the implementation of the project and risk its sustainability. Thus, the project team (of Bank andGovernment staff) decided to narrow its focus and to favor alternatives that could be carried out underexisting institutions rather than adding more staff to the PCU.
Project objective. The project team opted to making increasing equity the key objective of the project,thus targeting most of the proposed sub-components to socially disadvantaged groups. The project'smonitoring indicators reflect this in that they measure the impact of the project on the performance of moredisadvantaged groups.
Full-time model. In light of the positive results of the full-time school model, the project team consideredtrying to extend it throughout the education system. However, they decided against this because its highercost would have a negative impact on the quality of new and existing full-time schools due to theBorrower's resource constraint. The full-time school model implies turning double-shift schools intosingle-shift schools, resulting in a need for more physical space, teachers, staff, and special training forteachers and other school staff. In addition, comparative studies of the full-time model with simply an"extended day model" without the additional resources and staff training have shown that the ETC modelhas more value-added than the alternative. Thus, the project team decided to ensure that all full-timeschools operate as envisioned by the model and that they are targeted to the socially disadvantagedsegments of the population.
Rural education. During the preparation of the project, the Borrower requested that a componentfocusing on rural schools be incorporated into the project. The project team decided that the best way torespond to that request was to adapt the full-time school model to rural schools, which already have aschool day that is about one hour longer than regular urban schools, taking into consideration transportlimitations to extending the school day any longer. Because of the large number of very small rurl schoolsthat have very few students and the high cost of reaching all of them, it was decided that only rural schoolswith 30 students or more would benefit from adopting the full-time model.
- 16 -

Health and Environmental Education (ESA). The project team decided against creating an independentESA component, preferring to distribute the activities among the existing institutions. For example, thehealth and environmental PMEs and teacher training will be the responsibility of ANEP along with thosePMEs already institutionalized and regular teacher training modules. This approach should ensure thesustainability of these activities after the project ends.
School autonomy. The project team considered increasing school autonomy by making direct monetarytransfers to the schools themselves to implement building maintenance and other management functions.However, they decided against this proposal because such transfers would imply the need for school staff tospend time on management when they already have too little time available to spend on teaching. The teamagreed to evaluate decentralization experiences during the implementation of the project.
Computers. The project team considered different models for introducing computers to full-time schools(ETCs). The key constraint in all of the alternatives considered was the lack of an extra classroom orschool library in ETCs where the computers could be safely placed so that a large number of students couldaccess them simultaneously and/or where a hands-on class could be taught. With other cost considerationstaken into account, the project team decided that the best alternative was to place up to two computers ineach classroom to be used mostly as a teaching tool rather than as a hands-on learning tool.
Teacher-training. The original project proposal contemplated providing all teachers with in-serviceteacher training. However, evaluations of the current in-service teacher-training program have shown thatteachers have limited content knowledge which is a constraint to the current program. Thus, the projectteam decided to continue financing in-service teacher training on a limited basis for full-time schoolteachers only, while supporting the re-design of Uruguay's overall teacher training program. It was alsoconcluded that this re-design would take far more time than the project preparation cycle and that it shouldinvolve extensive consultations with teachers, directors, and inspectors. So the project will support theactual process of re-designing the overall teacher-training program.
2. Major related projects financed by the Bank and/or other development agencies (completed,ongoing and planned).
Previous MECAEP projects have been performing well, both in terms of implementation as well asachievement of development objectives. Over time, a division of emphasis has developed betweeninternational lenders with the Inter-American Development Bank focusing on secondary education, whilethe Bank has been involved largely with preschool and primary education.
, t | Latest SupervisionSector Issue j Project .. (PSR) Ratings
(Bank-financed projects only)Implementation Development
Bank-financed Progress (IP) Objective (DO)
Basic Education (1994) Basic Education Quality HS SImprovement Project -MECAEP I (Ln 3729- UY)
Basic Education (1998) Second Basic Education Quality S SImprovement Project -MECAEP II (Ln 4381- UY)
- 17 -

Othe-rdevelopment agenciesSecondary education (including Improvement in Secondarytechnical education) and teacher Education and Teacher Trainingtraining Project (MESYFOD-IADB)Secondary Education (including Second Improvement oftechnical education) and teacher Secondary Education andtraining Teacher Training Project
(MEMFOD) -IP/DO Ratings: HS (Highly Satisfactory), S (Satisfactory), U (Unsatisfactory), HU (Highly Unsatisfactory)
3. Lessons learned and reflected in the project design:
The design of this project benefited from advice given by peer reviewers about experiences with similaroperations in other countries in the region. A number of studies and evaluation activities of MECAEP Iand II were also commissioned as inputs into the design of MECAEP III. Annex 14 provides greater detailon the lessons outlined below.
Institulionalization of project components. The creation of MECAEP as a parallel institution introducedmechanisms that sometimes differed from and interfered with those established in the Directorate ofPrimary Education as well as with ANEP/CODICEN. The proposed project supports theinstitutionalization of activities throughout its implementation, using and strengthening existing institutionsin the process. The project preparation team also allocated a substantial amount of resources to carryingout MECAEP reviews and beneficiary assessments to ensure that the voices of both the direct and indirectbeneficiaries were heard and, when appropriate, incorporated into project design.
Preschool and first grade repetition. Preschool evaluations in Uruguay show that there is a strongcorrelation between preschool attendance and repetition rates in the first grade. In very disadvantagedcontexts, first grade repetition is about 45 percent for students who did not attend preschool and 26 percentfor those that did attend. In non-disadvantaged contexts, first grade repetition is about 21 percent for thosewho did not attend preschool and 8 percent for those who attended. To this end, ETCs will continue toextend full-time education to preschoolers in disadvantaged contexts, thus helping to reduce the gap in firstgrade performance between disadvantaged students and the average Uruguayan student.
Contenit of textbooks. As part of the textbook impact evaluation, textbooks were evaluated for theirgeneral content as well as for their gender, racial, and environmental sensitivity. The evaluation found thattextbooks and reading books are generally satisfactory but: (i) fail to reflect wide national realities outsideMontevideo and (ii) do little to single out and promote the achievements of more vulnerable groups, thoughsome effort is clearly made in the area of enviromnental sensitivity. Through PMEs, reading materials,and teacher training, the project will support educational activities to complement textbooks and enhancethe sensitivity of students in the areas of environment, public health, gender, and race.
Stigmatization of full-time schools. Historically, full-time schools were associated with special needs (forexample, children with health problems). The fact that ETCs target more disadvantaged contexts hasreinforced this perception. It is important to allow the mixing of socioeconomic backgrounds in ETCs inorder to limit the extent to which they are "branded" as special needs schools. To ensure that ETCs are notperceived as being schools for the poor and/or for deficient students, the project will endeavor to keep abalance of school contexts aiming to generate an average system-wide mix of 80 percent of studentscoming from more disadvantaged backgrounds and 20 percent coming from other backgrounds.
- 18 -

In-service teacher training. Despite teachers' satisfaction with the training received for the full-timeschools' mode, ad hoc classroom observations indicate that teaching methodologies are still very traditionaland that teachers are deficient in some of the required contents. A full assessment of classroom practices isplanned for the first year of the project and the curricula for teacher training courses will be adapted toreflect the lessons learned from this assessment.
ETC teachers. While the student/teacher relationship has been positively affected in ETCs, as thefull-time model allows teachers to do more one-on-one work with students, thus giving them attention andeducational support, teachers can feel overwhelmed by the demands placed on them to be both a teacherand a surrogate parent to socioeconomically disadvantaged students. To leverage the successes in the newrelationship modes between teachers, students, and communities, the project will expand the on-goingprogram to strengthen the partnership between schools and parents.
Disseminating ETCs. Parents of children who attend ETCs recognize that their children learn more andbetter in those schools. However, despite the fact that a survey has shown that over 80 percent of thegeneral public has heard about ETCs, only 50 percent know about the full-time school model and only 4percent identify the model as an important improvement in education policy. To ensure the politicalsustainability of ETCs, it is important that the population at large recognizes the successes of the model.Therefore, the project will finance broader dissemination of best practices from ETCs, not only to promotethe model but also to introduce some of its lessons into regular schools.
Targeting PMEs. The relative success of a PME depends on its type. Those that emphasize theparticipation of the community tend to be more successful than those that simply rely on students andteachers. Even among successful PMEs, there were variations depending on the socioeconomic context ofthe school population, whether there was community participation, where the school was located (in a ruralor urban area), its educational performance, its size, and the leadership shown by the director. In thesample of schools evaluated, the PMEs that had lasting positive effects were all located in disadvantagedcontexts. Since PMEs seem to have a greater and longer lasting impact in disadvantaged contexts, theproject will earmark enough resources to ensure that schools with a predominance of disadvantagedstudents will be more likely to receive PME resources.
4. Indications of borrower commitment and ownership:
As discussed in greater length in Section B of this document, the Government of Uruguay is committed toimproving equity and quality in education and to carrying out institutional improvements to ensure thecontinuity of activities after the project ends. The passage of Budget Law 17.296, approved on February21, 2001, which establishes the financial resources for MECAEP III until past the Mid-term Review,provides assurances of the Government's commitment to the sector as well as continuity of the preschooland primary education reforms. However, the best assurance of Borrower ownership and commitment toachieving and sustaining the objectives of MECAEP III is the built-in institutionalization of projectcomponents during the life of the project. This institutionalization has already started under the previousprojects and is planned to continue, as indicated in the General Operational Manual. Further indications ofBorrower ownership include broad-based participation of Uruguayan decision-makers and stakeholders inthe preparation of the project, which has benefited from the involvement of working groups within ANEPas well as from numerous consultations with beneficiaries.
The government resources required for the proposed project have already been approved by the NationalAssembly in the Government's five-year budget 2000-2004 (the year 2005 will repeat the allocation for2004, as customary).
- 19 -

5. Value added of Bank support in this project:
The flank is a well-known repository of international knowledge because of its active involvement indevelopment programs worldwide, its extensive contacts with research organizations, and its experience inworking with a wide range of governments, sectors, and local communities. In addition to providingfinancial resources, the Bank contributes with global knowledge and experience, neutrality, and objectivity.It facilitates communication among key actors within and among countries. For example, through theContinuous Learning Framework (MAC), an initiative that regularly brings together experts from variousBank education projects in the region to review specific project components and support Bank supervisionand project preparation, the Bank has been able to act as a conduit for information about education sectoroperations among several Latin American countries. Uruguay has been one of the main contributors and amajor beneficiary of this effort.
Moreover, as the paramount international lending organization in the area of basic education, the Bank hashad the opportunity to evaluate and derive lessons from several countries both inside and outside the region.Many of these lessons, particularly in the areas of teacher training, MIS, PMEs and new educationtechnology, were put to use in the design of MECAEP III.
Finally, since 1994 the Bank has been supporting Uruguay's education reform efforts through two projects,MECAEP I and II. In the process, the Bank has accumulated extensive experience about the country andits education issues and has provided cutting-edge technical assistance to the sector.
E. Summary Project Analysis (Detailed assessments are in the project file, see Annex 8)
1. Economic (see Annex 4):* Cost benefit NPV=US$212.3 million; ERR = 37 % (see Annex 4)O Cost effectivenessO Other (specify)
The economic and fiscal analysis only cover the first component of the project. This component, whichaccounts for 79.5 percent of total cost (including front-end fees), will enable 1,790 additional classrooms tobe used for full-time schooling, 1,356 in urban areas and 434 in rural locations. In steady state, this willallow an additional 51,160 children to attend full-time schools, with about 10,000 and 41,000 students inpreschool and primary education respectively. In both cases, the project will target socioeconomicallydisadvantaged areas. The main activities of this component will be: (i) the construction, rehabilitation, andconversion of classrooms; (ii) the acquisition of computers, classroom furniture, equipment, libraries,teaching materials and books; (iii) the training of teachers, school principals, and inspectors; and (iv)initiatives aimed at strengthening school-community ties. By far, the most relevant sub-component is theconstruction and rehabilitation of classrooms, which will consume US$ 21.0 million (net of taxes andincluding architectural costs).
The expansion in full-time education will entail an increase in indirect expenditures due to three factors: (i)an increase in salary expenditures as new teachers, directors and other personnel are hired or transferredfrom part-time to full-time jobs; (ii) the cost of maintaining the new classrooms and equipment; and (iii)expenditures over time to replace equipment and materials. Particularly important will be the rise in salaryexpenditures, of about US$ 7.8 million per year (net of payroll taxes).
The major benefits accruing from the project are the higher quality of education and the increase in equity,arising from providing better educational opportunities to students from socioeconomically disadvantaged
- 20 -

backgrounds and from the enhanced working opportunities afforded to students and their mothers. Until2016, most of the benefits will be from the enhanced opportunities for mothers to work, but after that thegains derived from higher productivity (higher learning accomplishments) will predominate. Net benefitsare expected to turn positive in 2007 and to generate an economic rate of return (ERR) of 37 percent. If weassume that mothers' participation in the labor force does not change with the extended supply of full-timeeducation, the ERR falls to 14.5 percent, a lower but still substantial rate. A Monte Carlo exercise varyingthe parameters used in the analysis shows that there is a 93.6 percent probability that the ERR will beabove 13 percent.
2. Financial (see Annex 4 and Annex 5):NPV=US$ million; FRR= % (see Annex 4)
The total investment cost of the project is US$ 56 million, including contingencies and front-end fees. Ofthe base cost of US$ 55.2 million, civil works account for about 57 percent, while goods represent some 14percent, training 7 percent and consultancies 10 percent. A Bank loan of US$ 42 million will finance 75percent of total cost. The expected pattern of expenditures shows slow growth in the first year ofimplementation, peaking in the year 2005. This reflects, in part, the existence of remaining MECAEP IIfunds for construction in the first years of the project. The national budget has committed resources forcounterpart financing for the period ending in 2005 (the 2000-2004 budget is approved and the year 2005will repeat the allocation for 2004).
Fiscal Impact:
The project has fiscal implications in the short and long run. In the very short term, the government will bedisbursing its national counterpart funds to finance the project. However, this effect will be mitigated bythe fact that 52 percent of the national counterpart will consist of tax exemptions. In the medium- andlong-term, the government will have to bear the costs of servicing the loan and of the indirect costs of theproject. As early as 2006, the rise in fiscal outlays becomes dominated by the increase in salaryexpenditures, which is also the predominant fiscal burden in the long run. To estimate the project's impacton the overall fiscal accounts, we did not consider taxes, which are simply an intra-govemment transfer,but included the loan service. Using this measure, the project's fiscal impact on public expenditures startsat US$ 429,000 in 2002, peaks at 14.4 million dollars in 2010, and declines afterwards until levelingaround US$ 9.5 million after 2021. As a share of ANEP's projected budget, these are not large numbers,reaching a peak of 2 percent in 2006. As a proportion of GDP, the project's fiscal impact goes from 0.001percent in 2002, to 0.055 percent in 2008, declining continuously after that, to reach 0.017 percent in 2035.These are relatively small figures, when compared to the Central Government public budget, which in thelast five years has averaged 22 percent of GDP.
3. Technical:
The project has been designed to take into consideration the context of the current education system, toprovide appropriate technical responses, and to be aligned with ANEP's education strategy. The project'sdesign is based on sound analytical research, the lessons from two previous education projects in Uruguay,and the Bank's own international experience. Key priority areas of action in the project are: (i) expandingthe full-time school model, including in rural areas; (ii) enhancing the teacher training system andintroducing new teaching and learning instruments into the classroom; and (iii) promoting institutionalchanges to increase the efficiency of educational institutions. The existence of extensive monitoringindicators will enable more accurate targeting of project components and their monitoring during
- 21 -

supernision.
4 . Instiftutional :
4.1 Executing agencies:
ANEP will be the agency responsible for executing the project.
4.2 Ph-oject management:
The present Government staff of the project preparation team will be entrusted with implementing theproject. This team is experienced and has been responsible for the successful implementation of theprevious and ongoing Bank-financed Basic Education Projects (MECAEP I and II). Project managementlessons from these previous projects have been incorporated into MECAEP III, including innovativefinancial management reporting and consistent observance of procurement guidelines. The project willcontinue the practice of maintaining an in-house team of engineers and architects to oversee theimplementation of civil works. A number of project management functions have been decentralized andinstitutionalized. The project management arrangements are spelled out in the General OperationalManual.
4.3 Procurement issues:
An assessment of the capacity of the PCU to implement actions for the project has been carried out by theBank. No significant procurement issues are expected as the current PCU procurement officer has beentrained by the Bank and, as a result, has acquired solid experience in carrying out all the procurementprocedures. Moreover, the PCU is hiring additional staff to support the procurement function in areasfound to be in relative deficiency such as procurement monitoring and filing. The assessment also noteddelays in project implementation due to ANEP/CODICEN control steps in the procurement process. TheCapacity Assessment report provides the action plan to be followed by both the Borrower and the Bank.
4.4 Financial management issues:
The financial management systems relating to MECAEP III were reviewed by a Bank FinancialManagement Specialist during pre-appraisal with the objective of determiniing whether the project had anadequate financial management system in place, as required by the Bank/IDA under OP/BP 10.02. Thereview included visits to the PCU and was based on the Bank's guidelines for "Review of FinancialManagement Systems." It also assessed the project's accounting system, staffing, intemal control, planning,budgeting and financial reporting system, and the selection of an auditor as well as the format and contentsof the Project Management Report (PMR) to be submitted by the Borrower in support of WithdrawalApplications.
The review confirmed that the project satisfies the Bank's financial management requirements. The projecthas in place an adequate project financial management system that can provide, with reasonable assurance,accurate and timely information on the status of the project (PMR) as required by the Bank/IDA forPMR-based Disbursements.
A traditional statement of expenditures system (SOEs) disbursement method has been established.However, the PCU may change to a PMR-based Disbursements system if the Bank approves this move.
- 22 -

5. Environmental: Environmental Category: B (Partial Assessment)5.1 Summarize the steps undertaken for environmental assessment and EMP preparation (includingconsultation and disclosure) and the significant issues and their treatment emerging from this analysis.
A separate cover EA has been issued by the Goverfnment and disclosed through the Bank's Infoshop and inUruguay. As in MECAEP II, the project includes construction of new schools and classrooms. Thisconstruction will take place in urban areas in Montevideo and in the interior on public land, but notinvolving protected areas or ecologically fragile sites. The project will follow local and nationalenvironmental and safety standards. No resettlement will occur as a result of the construction of theseschools. As the project supports the implementation of an environmental education program, developedwith the support of a Japanese grant, this operation is expected to have a positive impact on theenvironment, through the Education Improvement Projects related to environmental and public health issuesas well as through the inclusion of environment and public health themes in the teacher-training curriculum.
5.2 What are the main features of the EMP and are they adequate?
The environmental assessment discusses procedures and/or approvals needed for site selection, landacquisition, permits and licensing, school designs, stakeholder consultations, and mitigation of impactsduring school construction.
Since ANEP has been executing projects, it has been complying with existing national and municipallegislation on environmental matters regarding school construction. As was the case for MECAEP II,ANEP's construction activities under MECAEP III will be guided by the National EnvironmentalProtection Law (Ley N. 17.283; Nov. 2000), which sets the general framework for environmentalprotection. This legislation, which establishes the principles, obligations, and sanctions on individuals andthe state regarding the enviromnent, represents an improvement in national standards relative to theframework that existed at the time when MECAEP II was approved. The law establishes that the Ministryof Housing, Territorial Organization, and Environment is the entity in charge of the quality control of theactivities of other public entities that affect the environment. As standard practice, ANEP complies withexisting legislation for site selection and architectural designs. There is no legal requirement for ex-anteapproval by the Ministry of Housing and Environment, and compliance with environmental standards isverified ex-post. However, it is necessary for MECAEP to get a municipal pernit in order to startconstruction as environmental compliance is administered at the municipal level. As a result of theexperience with school construction under MECAEP I and II, ANEP/CODICEN has issued instructionsregarding the incorporation of best practices from other countries in school construction in issues such aslandscaping and safety (for example, fire safety and quality of paint used in schools).
5.3 For Category A and B projects, timeline and status of EA:Date of receipt of final draft: February 14, 2002
5.4 How have stakeholders been consulted at the stage of (a) environmental screening and (b) draft EAreport on the environmental impacts and proposed environment management plan? Describe mechanismsof consultation that were used and which groups were consulted?
Upon site acquisition (whether through purchase or donation), school designs are formulated through aconsultation process involving local education authorities, including the Primary Education Council,Departmental inspectors, and the community through the Planning Commissions of each local educationgroup.
-23 -

5.5 'What mechanisms have been established to monitor and evaluate the impact of the project on theenvironment? Do the indicators reflect the objectives and results of the EMP?
Impacts will be monitored and mitigated during construction of schools.
6. Social:6.1 Summarize key social issues relevant to the project objectives, and specify the project's socialdevelopment outcomes.
The educational system in Uruguay is considered one of the best in the Region, in line with OECDcountries, and has shown substantial improvements during the last decade. The system is almost universal;equal (not including any type of discrimination); subsidized (the Government is responsible for alleducational needs); and mandatory (all children/youth must have access.) Moreover, as also indicated inthe social analysis conducted by the Government (Annex 11), parents and teachers who were consultedduring project preparation present a high degree of satisfaction with its performance, particularly withfull-time schools.
However, benefits are uneven, with quality deficits felt by the poorest. Although Government efforts haveresulted in quality improvements nationwide, the gap in learning between students from more favorable andmore disadvantage backgrounds remains wide. In this context, improving equity in educational achievementis the most salient social development issue involved in the project's design and, improvement in equity isthe project's most important expected outcome. Tailored interventions have been proposed to respond to theneeds of specific disadvantaged students, with an emphasis on full-time schools and parents' involvement atthe school level.
6.2 Participatory Approach: How are key stakeholders participating in the project?
Since the 1985 passing of the Education Law, ANEP and CODICEN have been advised by threeindependent and autonomous councils responsible for overseeing preschool, primary, special, secondary,technical and vocational education. Under MECAEP I, Education Improvement Projects (PMEs) wereintroduced in an attempt to promote greater school community participation in seeking out solutions to theirpedagogical problems. Impact evaluations of PMEs confirm that the more successful ones were those withgreater community involvement in its design and implementation. The Govenmment has also accompaniedthe implementation of its educational policies by carrying out periodic evaluations, including consultationswith parents and teachers.
With lhe purpose of determining which were the necessary adjustments for MECAEP III, a broad meetingwas organized during preparation with key private and public, national and regional, educationalstakeholders. As full- time schools have been the main educational mechanism to promote equity in learningachievement among different socials groups, in addition to the systematic consultation processes, aqualitative and quantitative survey was carried out with teachers and parents of ETC students. The purposeof the survey was twofold: first, to evaluate the degree of satisfaction of the two major stakeholders of theseschools in relation to its performance and identify main concems; and second, to obtain information on howto improve and expand the model. The project design has benefited by incorporating key results of thissurvey as well as those generated by the broad consultation.
6.3 H:ow does the project involve consultations or collaboration with NGOs or other civil societyorganizations?
Consensus building is a critical element in the implementation of educational policies in Uruguay. Asmentioned above, the Bank has been closely involved in the education policy dialogue in this country forabout ten years and has supported the government in its efforts to advance a policy agenda with a broad
- 24 -

consensus. The proposed project has placed great emphasis on consensus building during its preparation,as has relied on stakeholder feedback for its design.
6.4 What institutional arrangements have been provided to ensure the project achieves its socialdevelopment outcomes?
Full-time schools have been a key element of the Govemment's strategy to improve equity and quality since1995 and they will remain the main institution through which the social development goal of equity willcontinue to be pursued. As a result of this compensatory effort, leaming achievements have improvednationwide, although much remains to be done. With the purpose of closing the gap between the studentsattending schools deemed of favorable contexts and those attending schools considered disadvantaged andvery disadvantaged, the project is placing great emphasis on the expansion of the full-time model andensuring that their inputs are in place.
6.5 How will the project monitor performance in tenns of social development outcomes?
A comprehensive monitoring and evaluation system has been developed during the implementation ofMECAEP I and II and will continue to be strengthened during the implementation of MECAEP III. Thesystem, whose main indicators are described in Annex 1, includes periodic beneficiary assessments and hasbeen designed to ensure transparency and unbiasedness in the evaluation process of the project. Bi-annualproject evaluations will be carried out with the Bank, and these evaluations will be an integral part of theplanning process to guarantee that the proposed investment plans are directly related to the socialdevelopment objectives. The M&E system highlighted in the previous section will constitute the backboneof the project monitoring system.
7. Safeguard Policies:7.1 Do any of the followving safeguard policies apphl to the projecd?
Policy ApplicabilityEnvironmental Assessment (OP 4.01, BP 4.01, GP 4.01) 0 Yes 0 NoNatural Habitats (OP 4.04, BP 4.04, GP 4.04) 0 Yes * NoForestry (OP 4.36, GP 4.36) 0 Yes 0 NoPest Management (OP 4.09) 0 Yes * NoCultural Property (OPN 11.03) 0 Yes * NoIndigenous Peoples (OD 4.20) 0 Yes * NoInvoluntary Resettlement (OP/BP 4.12) 0 Yes 0 NoSafety of Dams (OP 437, BP 4.37) 0 Yes * NoProjects in International Waters (OP 7.50, BP 7.50, GP 7.50) 0 Yes * NoProjects in Disputed Areas (OP 7.60, BP 7.60, GP 7.60)* 0 Yes * No
7.2 Describe provisions made by the project to ensure compliance with applicable safeguard policies.
See part 5.5 of this section.
- 25-

F. Sustainability and Risks
1. Sustainability:
MECAEP III is a project that builds on the achievements of two previous education projects. There arestrong reasons to affirm that the activities that will be financed by the project wi.ll be sustainable once theproject is over. Sub-components of MECAEP I (such as PME and textbooks) are gradually becoming anintegral part of ANEP's structure. Some new activities (such as new education technology) are alreadycore activities of the units that were created within ANEP after its last reorganization. From a financialperspective, some of the above mentioned sub-components will be financed by ANEP's budget after thesecond year of the project's implementation.
2. Critical Risks (reflecting the failure of critical assumptions found in the fourth column of Annex 1):
Risk Risk Rating Risk lMitigation MeasureFrom Outputs to ObjectiveEducation stakeholders in the central N Project components were designed by thesystem and school level are not supportive respective units within ANEP/CEP that willof the project. implement parts of the project. Potential
beneficiaries were consulted through beneficiaryassessments and their opinions are reflected inthe project. The conclusions of the recentassessment of the ETC model are beingincorporated into the project's design to ensurethat teachers remain committed to the full-timeschool model.
Goveinment is unable to absorb the fiscal S The expansion of the full-time school model isimpact of the full-time school model. gradual and targeted and the fiscal impact
limited and spread over time. The 2000-2004budget has been determined and counterpartfunding has been assured until 2005.
Government is unable to avoid perception N Through space management of ETCthat ETCs are schools for the poor and for construction, project design aims at maintainingproblem students. a 20 percent system-wide intake of students
from non-disadvantaged households in order toreduce the chances of "labeling" the schools.Support for ETCs and participation will besought through media campaigns.
From Components to OutputsSatisfactory teacher-training reform is not M A working group has been formed to produce aconcluded in a reasonable time. diagnosis of the situation and to advise on
needed changes. ANEP is fully committed toconcluding the reform in this administration.Project funds will finance TA for the process ofreform.
-26 -

School staff does not utilize the MIS M Assessments of the system through focus groupssystem. indicate that resistance to the MIS system stems
from lack of adequate training and insensitivityof technical staff to the needs of school staff.Training is being significantly strengthened andexpanded to include inspectors and the MIS unitis being moved to CEP to increase its proximityto the clients.
Insufficient number of teachers, able to M The number of schools with bilingual programsteach in the bilingual mode, are found and is modest and not expected to go over 10 percentsuccessfully trained. of ETCs during the life of the project. A
sufficient number of teachers for English andPortuguese classes has been preliminarilyidentified, but accelerating the already signedexchange teachers program with Parana, Brazilis a viable alternative to increasing the numberof Portuguese teachers.
Project Coordination Unit (PCU) and/or N PCU salaries are competitive and activitiesimplementation units within ANEP/CEP professionally challenging. Staff turnover hasare not able to find and maintain high not been a problem in the past. Transferringquality staff. functions to the regular institutions increases the
chances of continuity.
Project implementation is slowed down by S Government agrees to establish and maintainANEP's internal clearance procedures. throughout Project implementation a mechanism
to guarantee timely execution of the Project andan efficient coordination of Project activitiesbetween the PCU and the CODICEN. TheGeneral Operational Manual will spell outclearance authority and process for the Project'sCoordinator.
ANEP in unable to expand on-going M Resolution passed by ANEP in 1999 is wellsingle-cycle (Ist and 2nd grades) known and followed in schools of practice.experience. Government will embark on monitoring and
disseminating results of schools of practice.ETCs are expected by teachers to be innovativeso teachers expect a different environment anddifferent teaching practices.
Overall Risk Rating M
Risk Rating - H (High Risk), S (Substantial Risk), M (Modest Risk), N(Negligible or Low Risk)
3. Possible Controversial Aspects:
No controversial aspects foreseen.
- 27 -

G. Main Loan Conditions
1. Effectiveness Condition
* General Operational Manual with Final PIP (including Procurement Plan) submitted to theBank and found to be of satisfactory quality.
* Operational Manual for PDE/PME submitted to the Bank and found to be of satisfactoryquLality.
* Procurement announcements and first tender documents reviewed and approved by the Bank.* TOR for studies in the first year, including diagnosis of the teacher training situation,
submitted to the Bank and found to be of satisfactory quality.* TOR for the members of the teacher-training working groups submitted to the Bank and
found to be of satisfactory quality.* Resolution that created the PCU for MECAEP I and II is amended to cover MECAEP III.
2. Other [classify according to covenant types used in the Legal Agreements.]
The Government will provide assurances that no involuntary resettlements will occur as a result of projectimplementation. Additionally, the Government shall assist ANEP to:
* Implement, by no later than June 30, 2005, the provisions set forth in ANEP's Resolution No. 1, Acta392, Circular 441 of November 17, 1999, in all full-time schools expanding the single-cycleexperience in I st and 2nd grades.
* Ensure that, by no later than June 30, 2005, a management information system will be functioning andfully implemented in at least 90 percent of all schools of more than 50 students.
* Publish supplementary education materials and carry out in-service teacher training on environment,pulblic health, race, and gender issues in all full-time schools.
* Disseminate the lessons from the best practice PMEs dealing with environment, public health, andvulnerable groups, among all schools.
* Establish and maintain throughout Project implementation a mechanism, detailed in the GeneralOperational Manual, to guarantee timely execution of the Project and an efficient coordination ofProject activities between the PCU and CODICEN. The General Operational Manual will spell outclearance authority and process for the Project Coordinator.
* By 2005 carry out a student performance assessment of all 6th grade students.* Develop, by no later than 6 months after the Effective Date, an index to track student achievement by
income level.
Finally, the preparation of a diagnostic study of teacher training and action plan, satisfactory to the Bank,is a condition of disbursement for civil works under the Institutional Development Component.
H. Rieadiness for Implementation
ER 1. a) The engineering design documents for the first year's activities are complete and ready for the startof project implementation.
Li 1. b) Not applicable.
1 2. The procurement documents for the first year's activities are complete and ready for the start ofproject implementation.
- 28 -

3. The Project Implementation Plan has been appraised and found to be realistic and of satisfactoryquality.
[ 4. The following items are lacking and are discussed under loan conditions (Section G):
1. Compliance with Bank Policies
1 1. This project complies with all applicable Bank policies.LI 2. The following exceptions to Bank policies are recommended for approval. The project complies with
all other applicable Bank policies.
Ricardo Rocha Silveira William Experton Myma'AlexanderTeam Leader Sector Manager Country ManagerlDirector
-29 -

Annex 1: Project Design SummaryURUGUAY: Third Basic Education Quality Improvement Project
Key Performance,, Data Collection Strategy.Hierarchy of Objectives Indicators Critical Assumptions
Sector-reklted CAS Goal: Sector Indicators: Sector/ country reports: (from Goal to Bank Mission)Support the Govemment's In poor socioeconomic National Administration for Adequate economic andefforts to improve the equity, contexts: Public Education (ANEP) budgetary situation.quality, and efficiency of * Increase full-time school Statistical Data.preschool and primary coverage.education as a way to reduce * Increase leaming National Leamingpoverty andl improve income achievements. Assessments.distribution. * Reduce repetition rates.
Project Development Outcome I Impact Project reports: (from Objective to Goal)Objective: Indicators:1. Increase equity in the I.Expand the full-time school ANEP's statistical Govemment maintainsprovision of preschool and model in socioeconomically information on increases in commitment to the project inprimary education by more disadvantaged urban the coverage of ETC and general and to the ETC modelexpanding the full-time and rural areas to reach repetition rates. in particular.school model 86,000 students aged 4 to 11
by end-project (68,000 by Reports on Leaming2. Improve the quality of MtR). Assessment evaluations onpreschool and primary ETC.education (ages 4 to 11) with 2.Improve the academica focus on socioeconomically achievement results of Social Assessment of ETCsdisadvantaged and very students from disadvantaged every two years and thendisadvantaged contexts. and very disadvantaged updated annually.
contexts in Language and3. Increase the efficiency of Mathematics in 6° grade.the preschool and primary Achievement is defined as theeducation system with a focus percentage of students whoon socioeconomically achieve a predefineddisadvantaged and very satisfactory level ofdisadvantaged contexts. proficiency in Language or
Mathematics (at least 60percent of questions answeredcorrectly.) Unit ofmeasurement is the school.
Language (%)Base (1999): 48.8Mid-Term Review: 52.0End-Project: 61.0
Mathematics (%)Base (1999): 27.9Mid-Term Review: 32.0End-Project: 41.0
3. Reduce repetition rates forthe I st and 2nd grades for
- 30 -

students from disadvantagedcontexts. Unit ofmeasurement is the school.
Repetition Ist grade (%)Base (1999): 24.1Mid-Term Review: 22.0End-Project: 15.0
Repetition 2nd erade (%)Base (1999): 16.8Mid-Term Review: 15.0End-Project: 10.0
- 31 -

Key Performance Data Collection Strategy |Hierarchy of Objectives I Indicators J Critical Assumptions
Output from each Output Indicators: Project reports: (from Outputs to Objective)Componeint:1. Expansion of the full-time 540 new ETC classroomsSchool Model builtConstruction of urban (68 new schools built) 1. PCU Progress reports every Education stakeholders in thefull-time schools. semester central system and school
level are supportive of theproject.
Rehabilitation and 816 classrooms 2. ANEP basic statistics. Government is able to absorbtransformation of existing rehabilitated/transformed into the fiscal impact of thedouble-shift urban schools ETC classrooms (102 schools) full-time school model.into full-time schools. (100 classrooms rehabilitated
out of 456 classrooms being Government is able to avoidrationalized and transformed the perception that ETCs arein 57 schools; 360 classrooms schools for the poor and fortransformed without problem students.rehabilitation in 45 additionalschools w/ second shiftstudents moving to newclassrooms ).
Rehabilitation of rural schools 434 rural classroomswith 30 students or more that rehabilitated (172 schools)will become ETCs.
Furnishing urban ETC Acquisition of furniture forclassrooms 540 new ETC classrooms, 100
rehabilitated classrooms and15% of the existing 360vacant classrooms).
Acquisition and distribution 2,428 computers and softwareof equipment and learning sets distributed to 304 urbanmaterials for ETCs. ETCs.
172 Computers and softwaresets distributed to 172 ruralschools.
210 television and video setsdistributed to 170 urban ETCs(40 additional for schoolswith bilingual program)
572 sets of preschool andprimary learning materialsdistributed (urban and ruralETCs).
40 sets of bilingual learningmaterials distributed to
-32 -

selected urban ETCs.1,238 library sets distributed
Acquisition of school libraries (21,030 library books)for full-time schools
276,000 textbooks producedProduction and distribution of and distributedtextbooks for full-time schools
Training of educational 1,779 educational personnel Impact evaluation study of thepersonnel (teachers, trained. training program in 2004.principals, inspectors) in thefull-time school program. Assessment by UMRE of the
I st grade in 2004.
Training of teachers in the 164 teachers trained. Impact evaluation of thebilingual education program. bilingual education program
in 2004.
Training of educational 3, 738 educational personnel Impact evaluation of thepersonnel in the use of trained. (3,000 trained in the training in 2004.educational software. basic use of educational
technology; 304 trained asresource teachers and 434rural teachers trained).
Creation of interdisciplinary Impact evaluation in 2003.support groups, with socialprofiles to strengthen the 72 schools receiving support.school-families partnership
II. InstitutionalStrengthening
Diagnosis of the pre-serviceand in-service teacher Diagnosis studytraining system.
Establishment of new Professional standards defined PCU Progress reportsprofessional standards for and validated. ANEP reportsteachers.
Development of new New pre-service teacherpre-service teacher training curriculumcurriculum. developed.Design and implementation of Pre-service teacher traininga National Evaluation System evaluation systemof pre-service teacher implemented.training.
Training of teacher trainers 800 teacher-trainers andand tutors in new curriculum 2,200 tutors trained.and professional standards.
- 33 -
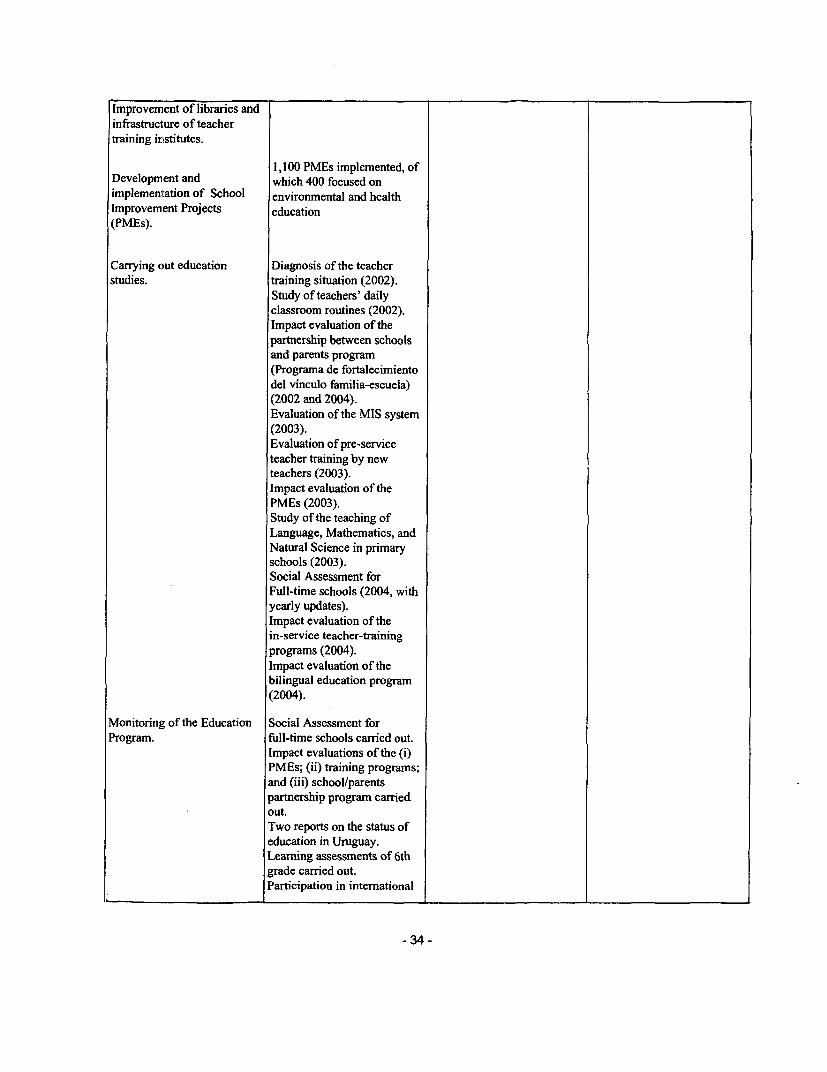
Improvement of libraries andinfrastructure of teachertraining institutes.
1,100 PMEs implemented, ofDevelopment and which 400 focused onimplemenitation of School environmental and healthImprovement Projects education(PMEs).
Carrying out education Diagnosis of the teacherstudies. training situation (2002).
Study of teachers' dailyclassroom routines (2002).Impact evaluation of thepartnership between schoolsand parents program(Programa de fortalecimientodel vinculo familia-escuela)(2002 and 2004).Evaluation of the MIS system(2003).Evaluation of pre-serviceteacher training by newteachers (2003).Impact evaluation of thePMEs (2003).Study of the teaching ofLanguage, Mathematics, andNatural Science in primaryschools (2003).Social Assessment forFull-time schools (2004, withyearly updates).Impact evaluation of thein-service teacher-trainingprograms (2004).Impact evaluation of thebilingual education program(2004).
Monitoring of the Education Social Assessment forProgram. full-time schools carried out.
Impact evaluations of the (i)PMEs; (ii) training programs;and (iii) school/parentspartnership program carriedout.Two reports on the status ofeducation in Uruguay.Leaming assessments of 6thgrade carried out.Participation in intemational
-34 -

student assessments.
Implementation of the MIS Acquisition of 250 computers,for schools. 350 printers, and 100 sets of
fumiture.
2,400 teachers and principalstrained.
200 inspectors trained.
20 administrative personneltrained.
35 -

Key Performance Data Collection Strateg |HierarchV of Objectives Indicators _ Critical Assumptions
Project Components / Inputs: (budget for each Project reports: (from Components toSub-components: component) Outputs)1. Extension of the full-time Satisfactory teacher-trainingSchool Model. reform is concluded in a
1. I Construction, US$ 33.87 million reasonable time.transformation, rehabilitation,and equipping of full-timeschools.1.2 Acquisition of school US$5.49 million School staff utilizes the MISequipment, learning materials system.and school libraries.
1.3 Teacher training on the US$3.31 million A sufficient number offull-time school model, teachers able to teach in thebilingual education and new bilingual mode are found andeducation technologies. successfully trained.
1.4 Strengthening the US$ 1.85 million Project Coordination Unitpartnership between schools (PCU) and/or implementationand parents. units within ANEP/CEP are
able to find and maintain highquality staff.
11. Institutiional A clearance process, detailedStrengthening in the General Operational
Manual, is established inorder to ensure timelyexecution of the Project andan efficient coordination ofProject activities between thePCU and CODICEN.
2.1 Design of teacher US$ 3.83 million ANEP able to expandtraining reform. on-going single-cycle (Ist and
2nd grades) experience.2.2 Development and US$ 3.13 millionimplementation of PMEs.
2.3 Monitoring of the US$ 2.09 millionEducation Program.
2.4 Project Administration US$ 2.01 millionFront-end Fees US$ 420,000
- 36 -

Annex 2: Detailed Project DescriptionURUGUAY: Third Basic Education Quality Improvement Project
By Component:
Project Component 1 - US$44.52 million
EXPANSION OF THE FULL-TIME SCHOOL MODEL
The main objective of this component is to expand the existing pedagogical model of urban full-timeschools (Escuelas de Tiempo Completo - ETCs), introduced under MECAEP II, from 35,000 students to78,000 students. The component will adapt the urban full-time school model to rural schools of 30 studentsor more, covering some 8,000 students in 172 rural schools. By the time the project is completed, it willcover approximately 86,000 students in ETCs or over one-fifth of urban and rural enrollment. The projectwill also continue the efforts of MECAEP II in improving the quality of public preschool and primaryeducation.
The establishment of full-time schools started in 1995 with an increase in the school period from four toseven and a half hours but with little or no change in the pedagogical model. A longer school day seemedto have a positive impact on learning achievements, as captured by the 1996 National Student Assessment.Starting in 1996, Government efforts focused on elaborating a new institutional and pedagogical proposalfor the full-time schools. Education stakeholders, including teachers, directors, and inspectors, activelyparticipated in this process, which led to the approval of the full-time school proposal in 1998 by theConsejo Directivo Central (CODICEN) and Consejo de Educacion Primaria (CEP) (Acta 90, Resoluci6n21 del 29 de diciembre de 1998). Since 1998, a significant effort has been underway to train teachers anddirectors in the curriculum of full-time schools. Also, in 1999 workshops on language, natural and socialsciences, and pedagogical orientation were given to those teachers who had successfully taken the basictraining.
Despite the fact that the majority of Uruguay's school population is urban, the country has around 1,100rural schools with an enrollment of 19,500 students at the primary level (grades 1 to 6). These ruralschools have benefited from training programs for preschool and secondary teachers (grades 7, 8, and 9 inthe context of expanding mandatory secondary education coverage to the rural areas). However, ruralprimary education teachers have not received any training in the last few years.
An evaluation of the impact of the full-time schools on student performance was carried out during the1999 National Evaluation Assessment for the 6th grade. The evaluation showed that: (i) socio-economicindicators for the students in the full-time schools group were similar to those for the students in mostdisadvantaged schools in the random sample; (ii) students attending ETCs classified as of disadvantagedand very disadvantaged contexts achieved higher scores in Mathematics than those attending regularschools of similar contexts (13.8 percentage points higher for ETC students attending schools deemed as ofdisadvantaged context and 4.7 percentage points higher for ETC students attending schools classified as ofvery disadvantaged context); and (iii) students in full-time schools classified as of disadvantaged and verydisadvantaged contexts also achieved higher scores in Language than those in the regular schools in similarcontexts (7.5 percentage points for ETC students in schools classified as of disadvantaged context and 4.7percentage points for ETC students in schools classified as of very disadvantaged context).
- 37 -

1.1 Construction. Transformation. Rehabilitation, and Equipping of Full-time Schools
Under MECAEP II, classrooms were built to support the adoption of the full-time school model.MECAEP II financed the construction of new schools, the improvement of existing full-time schools, andthe rehabilitation required to turn double-shift schools into full-time schools. Under MECAEP II,enrollment in full-time schools was distributed as follows: 20 percent of students attend schools of averageand more favorable contexts; 34 percent attend disadvantaged context schools; and 46 percent attend verydisadvantaged context schools. MECAEP III aims to maintain this overall socioeconomic distribution ofETC schools in order to prevent full-time schools from being stignatized as schools only for the poor.
Under this sub-component, MECAEP III will provide the physical infrastructure necessary to expand thefull-time school model to cover 51,000 additional students. This represents approximately 13 percent oftotal enrollment in public primary education. This support will consist of several elements.
Construwction of Urban Full-time Classrooms. The project will construct 540 new classrooms with anaverage of eight classrooms in each urban full-time school or the equivalent of about 68 new schools.Nearly 17,000 students will be covered by these classrooms. Schools will be built only in disadvantagedand veiy disadvantaged communities, especially those experiencing rapid population growth.
Transformation and Rehabilitation of Urban Double-shift Schools into Full-time Schools. The projectwill treLnsform 816 urban classrooms, or the equivalent of about 102 schools, into single-shift schools.These transformations will be achieved by transferring students from one of the two shifts of a regularschool into the new full-time schools and/or by rationalizing regular school enrollment. Four hundred andsixty urban classrooms will be rehabilitated. About 26,000 students will enter the full-time school systemthis way.
Rehabilitation of Rural Schools and their Adaptation to the Full-time School Model. The project willfinance the rehabilitation of 434 rural classrooms in 172 rural schools, benefiting some 8,000 students or41 percent of rural enrollment. The project will finance civil works and the acquisition and distribution of:(i) furniture for all of the new classrooms and spaces built by the project and for approximately 15 percentof the existing classrooms that will be converted to the full-time school model and (ii) kitchen equipment forall full-time schools created under the project.
The project also finances: (i) the maintenance of the full-time schools created by the project (entirelyBorrower counterpart financing) and (ii) technical assistance (mainly architects) to implement thissub-cornponent.
1.2 Acguisition of School Eguipment. Learnin Materials, and School Libraries
MECAEP I project has financed textbooks for two grades every year since 1995. This first cycle startedwith the distribution of textbooks for Mathematics, Language, and Sciences to students in 1st and 2ndgrades. In 1996, texts for the same subject areas were distributed to 3rd and 4th grade students, and in1997 students in 5th and 6th grades were also covered. Also, teacher guides were distributed to teachersof each grade.
In 1998 a new cycle started with the distribution of books to 1st and 2nd grade students. The cyclecontinued for 3rd and 4th grade in 1999 and 5th and 6th grades in 2000 (in this instance, students receivedseparate textbooks for social sciences and natural sciences). First grade students keep the books, which areprinted every year. Books distributed to other grade levels are on loan from the school and have an
- 38 -

expected life of three years. The quantity of books printed is based on enrollment, plus an additional 25percent contingency for enrollment growth and lost or damaged books. In the first cycle, the publishinghouses presented technical proposals based on the curriculum and very general technical specifications.However, for the following cycle (1998-2000), new technical specifications by grade and area weredeveloped after in-depth consultations with teachers, inspectors, and the CEP.
MECAEP II financed the acquisition of learning materials, thus continuing the efforts of MECAEP I. ACommission composed of a representative of MECAEP, two full-time schools directors, one full-timeschool inspector, and a representative of teachers' associations redefined and expanded the contents thatform the set of learning materials provided to the schools (such as chess games and anatomical models).
MECAEP III will finance (entirely Borrower counterpart financing) the production and distribution of onecycle of textbooks for all full-time schools. The project will finance books for 3rd and 4th grades in 2002and 2005, 5th and 6th in 2003, and 1st and 2nd in 2004, 2005 and 2006. In all, 276,400 textbooks will beproduced and distributed with counterpart funds.
MECAEP III will also finance the provision of books for school libraries, specifically: (i) at least 15 books-- one of which dealing with race or racial harmony topics-- for each new classroom (for 640 classrooms inurban ETCs and 434 classrooms in rural schools with 30 students or more) and (ii) 30 books for eachclassroom in bilingual ETCs. These books will include titles selected by teachers based on a list approvedby the Consejo de Educaci6n Primaria (CEP). The schools' selections will then be aggregated forprocurement purposes. In addition, the Project will finance the acquisition of complementary readingmaterials in the areas of gender, race, and environmental and health education.
Finally, MECAEP III will finance the following school equipment and learning materials for new full-timeschools: (i) one television set and audio equipment per school (and one additional set for schools withbilingual programs); (ii) one computer (including educational software and large screens) per classroom foreach full-time school in urban areas (including those financed by MECAEP II) and one computer(including educational software) per school in rural areas; (iii) one set of leaning materials for eachfull-time school with eight classrooms and two sets for schools with 16 classrooms at the primary level; (iv)one set of learning materials for each school at the preschool level (for two preschool classrooms); (v) oneset of materials for rural schools; and (vi) one set of learning materials for each of 164 bilingualclassrooms/l.
/1. In 2001, ANEP started a pilot partial immersion program in a foreign language in five fiill-time schools. A working group of teachers andinspectors designed all aspects of the program. This group selected 10 Uruguayan teachers proficient in English who were trained to launch the piloLThe pilot covered 300 students.
1.3 Teacher Training in the Full-timne School Model, New Educational Technologies, and BilingualEducation
Under MECAEP II, 1,200 teachers, principals, and inspectors are being trained in the implementation ofthe full-time school pedagogical model. The ETC training consists of two modules. The basic module takes150 hours and is mandatory. The second module is voluntary, takes 80 hours, and is implemented throughworkshops in social sciences, natural sciences, and Language.
The Project will finance training to a diverse group of people involved in the pedagogical and institutionalmodel of full-time schools, including: (i) regular teachers at preschool and primary levels; (ii) principals;(iii) inspectors; and (iv) teachers in administrative positions. Each ETC training course will be designed totake a maximum of 75 participants. It is expected that a total of 1,779 teachers, principals, and inspectors
- 39 -

will be trained (1,345 from urban ETCs and 434 from rural ETCs). The content of the training will beorganized around the following themes: (i) the socioeconomic characteristics of families fromdisadvantaged backgrounds and the implications for schools; (ii) the full-time educational model and itscurriculum, including "single-cycle pedagogy," and the use of supplemental didactic materials and PMEsto cover issues of vulnerable groups, and environment and health education; and (iii) an upgrade ofparticipants' knowledge and teaching skills in various disciplines through workshops. The full-timepedagogical model also sets aside two and a half hours per week of paid time for teachers to meet fordiscussion, planning, and evaluation of their work. The project will finance the: (i) technical assistance toimplement this sub-component and (ii) the adaptation of the full-time school model to rural schools.
MECAEP III will finance training for 3,738 teachers, principals, and inspectors in new educationalinstruments to facilitate the pedagogical integration of computers and other new educational technology intothe classroom. This training will consist of: (i) workshops in the Teacher Training Institutes of thedepartmental capitals to familiarize educational staff with the use of new technology; (ii) annual follow-uptraining at the Regional Teacher Centers for one teacher from each ETC school who will act as "resourceteacher" to coach or lead the other educational staff at the school, and (iii) tutorials for these "resourceteachers" consisting of approximately two hours per month to help them to solve any occasional problemsthat they may face.
The project will finance the training of 164 teachers in a pilot program of partial immersion in foreignlanguages in 40 full-time schools, benefiting a total of 4,900 students (an expansion of ANEP's 2001 pilot).In this partial immersion program, as in similar programs, a native Spanish teacher and a bilingual teacherwill share a group of students. The students will spend half of the school day with the Spanish-only teacherand the other half with the teacher who will only speak one of the selected languages (English orPortuguese). The amount of instruction in the second language will remain constant throughout theelementary school prograrn/2.
/2 Studelts may enter the program during kindergarten or during first grade. In kindergarten, the immersion teacher will reinforce and enrich the basiccurriculum using the target language at all times. In glades I through 6, the subjects to be taught by each teacher will depend on the teachers' skillsand will be determined at the school level. Leaming a second language will be part of the daily routine and instruction. The project will financetraining for some 100 teachers in the bilingual education program and technical assistance to implement it.
1.4 Strenathening the Partnership between Schools and Parents
In October 1999, MECAEP II initiated a program in 12 full-time schools with particularly difficult socialenvironments. The purpose of this program is to improve the institutional climate inside the schools and tostrengthen the relationship between the school and the students' families. The program adds to the staff ofeach school a part-time, remunerated social worker intem (a recent university graduate or senior student).These intems are at the school for part of every day. The intem is supported by a team consisting of apsychologist and four senior social workers. Each senior social worker is in charge of three schools andvisits each school once a week.
The activities under the program include workshops for parents, visits to families in conflict situations,guidance for teachers, counseling for individual students, and networking with other institutions in thecommunity. A rapid assessment was done after the first year of implementation, which showed that theprogram had been very welcomed by the beneficiaries (teachers, students, parents, and principals). Theprogram has been crucial in detecting problems early, in providing solutions that favor conflict resolution,and in improving relations between the school and the community.
The project will finance the technical assistance for the continuation and expansion of this program,
-40 -

reaching 72 schools and 1,700 children. In 2001, the program will continue in the 12 original schools thatwere covered by MECAEP II in 2001, while, starting in 2002, 12 more schools will be added each year.Each school will benefit from the program for three years with a gradual reduction of the program'sactivities over time.
Project Component 2 - US$11.06 million
INSTITUTIONAL STRENGTHENING
MECAEP III will be instrumental in strengthening the overall education system and schools. The projectwill enable sector officials to reformulate the teaching training system on the basis of a series of diagnosticexercises to be carried out during the project's first phase. The project will also build on the experience ofMECAEP I in the implementation of education improvement projects and will expand the scope andnumber of schools covered, adding emphasis on environmental and health education. Finally, the projectwill continue to finance student assessments and special sector studies.
2.1 Desipn Teacher Training Reform
While Uruguay does not suffer from a shortage of teachers, the results of the annual teacher careerentrance examinations demonstrate that teachers graduating from training institutes are lacking both inknowledge of relevant content and in pedagogical skills. For instance, the 1999 entrance examination--comprising of a two theory-based tests (education and didactics) and a practical test (classroomperformance)-- revealed that the majority of teachers tested did not have the minimum skills expected ofthem: 69 percent of primary level teachers and 58 percent of the preschool level failed the test. There arealso concerns as to the quality of teacher trainers. Of those who took such examination in 1999, only 32percent of the Science of Education teachers passed the examination, while only one fourth of theLanguage teachers passed theirs. The results of this examination point to a serious problem in terms of thequality of the teacher-trainers.
In addition to quality problems, a preliminary diagnosis of pre-service teacher training program hasconcluded that its curricula is inappropriate to respond to today's needs and that it must be modernized.Several attempts to reformulate the curricula in the last 20 years were unsuccessful in terms of improvingits quality and content, and have resulted in a system permeated with deficiencies due to the coexistence ofa plurality of curricula and modalities.
The primary objectives of reforming the teacher training system are to improve the academic training ofteachers and to enhance the prestige of the teaching profession. This will take place through the revision ofthe curriculum, the development of a system of professional standards, and a systematic evaluation of theteacher training institutes through exit tests for teachers. During the preparation of the project, theGovernment elaborated a plan to improve pre-service teacher training, which unified the existing threepre-service training plans (Plan de 1992; Plan Experimental de la Costa de 1999; and the Reformulaciondel Plan de 1992). The sub-component includes the following elements.
Diagnosis of the Pre-service and In-service Teacher Training Situation. A working group, under theIn-service and Pre-service Teacher Training Division of ANEP, will be formed to lead workshops involvingstakeholders (teachers, directors, inspectors, local and national authorities) to produce an assessment reporton the status of teacher training. Topics covered by the report will include:
* General information on teachers (numbers, teacher/student ratio, and teacher performance).
- 41 -

* Pre-service teacher training (its duration, curriculum, professional and academic profile of teachertrainers, and recent changes).
* Teacher training institutes (physical situation, libraries, and financial, academic and administrativesituations).
* In-service teacher training and professional development (current status and major issues).* Teaching career including incentives, salary structure, and other compensation issues.
The project will finance technical assistance for the functioning of the working group as well as for thepreparation of the diagnostic report.
Development of Professional Standards. The project will support the elaboration of a framework forprofessional standards for teacher trainers. It will finance technical assistance to elaborate this proposaland for the activities (such as workshops and seminars) with education stakeholders (teachers, teachertrainers, principals, and inspectors) to validate the proposal.
Evaluation of Pre-service Teacher Training. The project will finance technical assistance for thedevelopment, validation, and application of instruments to evaluate teacher training.
Curriculum Development. The project will finance technical assistance for the analysis of the existingcurriculum and elaboration of a new curriculum based on the results of the analysis.
Training of Teacher Trainers on the New Curriculum for Reformed Pre-service Teacher Training. Theproject will finance training for 800 current and future teacher trainers for the teacher training institutes(IFDs). The training will consist of 220 classroom hours at IFDs as well as other complementaryactivities.
In-service Training Program for Tutors for "Teachers in Practice" (maestros adscriptores). As a pillarof pre-service teacher training, the project will support the quality improvement of the 112 schools where"teachers in practice" are tutored. These schools function as regular schools in which experienced teacherscoach teachers-to-be. The project will finance training for the 2,200 tutors, focusing on knowledge ofcurriculum subjects (such as Mathematics, Language, and Natural Sciences), Pedagogy, and tutoring forteacher interns.
Improvement of Libraries and Physical Structure of Some IFDs. The project will finance activities, theneed for which will have been identified in the diagnosis of pre-service and in-service teacher training.
2.2 Development and Implementation of PMEs
In the past five years, with financing from MECAEP I, about 140 schools have been selected, each year, toreceive resources to finance Education Improvement Projects (Proyectos de Mejoramiento Educativo -PMEs). These pedagogical projects are designed by the schools' teachers, directors, students, and parentsbased oln their diagnosis of the school's problems and their strategy for development. A strategic documentsummarizing school problems, strategy, and priority actions is produced (a School Development Program-- PDE). PMEs, which should be among the priority actions of the school, are prepared and submitted forevaluation to a board composed of inspectors, directors of teacher training institutes, and directors of"Escuelas de Practicas. " MECAEP has financed, on average, one out of every three projects presentedfor evaluation. The projects have lasted between one and two years and the resources allocated haveaveraged US$ 3,000, depending on how many students the school serves. More than half of the projects
-42 -

financed came from schools whose students are from disadvantaged social backgrounds.
In 1998, an impact evaluation study of PMEs was carried out under MECAEP II. The evaluation showedthat PMEs have: (i) improved efficiency at the school level in terms of management and programming; (ii)strengthened teachers' professional culture and improved their relationships with students' families andcommunities; (iii) improved the curricular performance of students; and (iv) helped to reduce the gap inacademic achievement between schools in more favorable and more disadvantaged areas. The studyconcluded that there is a significant link between the impact of PMEs and the pre-existing school dynamics,in that they have a greater impact in schools with positive internal climates and greater interaction betweenteachers and parents. PMEs had less of a positive impact in schools with high turnovers of teachers andprincipals.
The National Student Assessment of 1999 included an evaluation of a sample of schools that hadsuccessfully implemented PMEs to try to determine if they were having an impact on academicachievement. The assessment showed that between 1996 and 1999 the marginal increase in studentachievement was greater in schools with PMEs than the national average. Also, PMEs implemented byschools in the most disadvantaged areas exhibited a greater improvement in Language and Mathematicsthan the national average.
Regular PMEs. MECAEP III will finance 150 regular PMEs per year awarded on a competitive basis toboth regular and full-time schools. The funds allocated for PMEs will average US$ 2,100 per school, withan upper limit of US$ 5,000. This sub-component will be implemented within CEP by the samedepartment that has been implementing PMEs under MECAEP I.
Environmental and Health PMEs. This sub-component will continue the environmental and healtheducation initiative being developed with Japanese trust fund resources under MECAEP II. Under trustfund financing, curriculum changes, adapted learning materials for the beneficiary schools, teachers' guideson how to use the learning materials, and teacher training were developed and proposed for introductioninto the project. MECAEP III will finance 100 PMEs for environmental and health education per year inboth full-time and traditional schools. These 100 PMEs will be selected on a competitive basis inaccordance with rules for PME evaluation established under MECAEP I.
In addition to the regular and environmental and health PMEs, the project will finance the technicalassistance needed to assist in implementing, monitoring, and disseminating these PMEs, including trainingfor the school community in the preparation of school development proposals. Guidelines for theimplementation of this component will be spelled out in an Operational Manual for PDE/PME, to beprepared by project effectiveness time.
2.3 Monitoring and Evaluating the Education Program
Under MECAEP I, the Student Cognitive Achievement Unit (Unidad de Medici6n de ResultadosEducativos - UMRE) was established with the purpose of evaluating different aspects of educationpolicies and activities proposed and/or carried out by the Government. This unit was responsible forproducing periodic, valid, reliable, and usable information on progress towards education achievementgoals. Between 1995 and 1999, the UMRE successfully carried out several evaluations: (i) a StandardizedStudent Cognitive Assessment in 1996 for all 6th grade students; (ii) a sample-based assessment of 3rdgrade students in 1998; (iii) a sample-based assessment of 6th graders in 1999; (iv) an evaluation of the 4thgrade; and (v) a national evaluation of learning achievements for preschoolers, Ist, and 2nd graders.
-43 -

On February 2001, CODICEN approved a reorganization of ANEP (Resolution N. 14-acta E-1J), which,inter alia, created a Research and Evaluation Division within the Planning Department (Gerencia deInvestigaci6n y Evaluaci6n). This Division is absorbing the UMRE and the evaluation activities for thesecondary education system, previously financed by the Inter-American Development Bank. As a result,there is a single evaluation unit responsible for preparing a plan to evaluate learning achievements andsocial, environment, and institutional factors. This plan will include, among other items, a NationalStudent Assessment of all 6th grade students (every three years) and of 3rd year students of the basic cycleof secondary (the last year of mandatory schooling). The plan will also include Uruguay's participation ininternational student assessments, including assessments of students in primary education.
This sub-component will support the ongoing establishment of the Research and Evaluation Division. TheResearch and Evaluation Division will be responsible for evaluating the irmpact of the programs andinnovations on learning achievements implemented at the primary level (such as the full-time schoolprogram and the development of bilingual education), as was done during the 1999 National StudentAssessment for Full-time School Program, PMEs, and Integrated Areas Program. This Division will alsoprepare, jointly with the Program and Budget Department, a biannual report on the "Status of Education inUruguay" that will include statistical information, an assessment of key issues affecting the sector, andinformation on sources of financing and use of resources.
Finally, the Research and Evaluation Division will prepare terms of reference, evaluate technical proposals,and monitor the following studies to be carried out by the project:
* Diagnosis of the teacher training situation (2002)* Study of teachers' daily classroom routines (2002)* Impact evaluation of the program of partnership between schools and parents (Programa de
fortalecimiento del vinculofamilia-escuela) (2002 and 2004)* Evaluation of the MIS system (2003)* Evaluation of pre-service teacher training by new teachers (2003)* Impact evaluation of the PMEs (2003)* Study of the teaching of Language, Mathematics, and Natural Science in primary schools (2003)* Social Assessment for Full-time schools (2004, with yearly updates)* Impact evaluation of the in-service teacher-training programs (2004)* Impact evaluation of the bilingual education program (2004).
This sub-component will also support the establishment and implementation of the managementinformation system for schools (Sistema de Secretarias Escolares). This sub-component will deepen theachievements of MECAEP I. With the aim of building a culture of evaluation, MECAEP I financed thecreation of an information system to collect information on teachers, students, and school infrastructure (Sistema de Secretarias Escolares) and it financed the acquisition of computers for all schools with 50students or more. Complemented by the efforts in secondary and technical education, when the informationsystem is fully implemented, ANEP will have up-to-date data on the education system available to facilitatedecision-making.
This project will finance: (i) technical assistance for the Research and Development Division and forcarrying out the studies; (ii) assessments of primary education, including a universal-based assessment in2005, and participation in international evaluations (such as TIMSS and PISA); (iii) MIS training for2,400 leachers and directors, 200 inspectors, and 20 administrative personnel; (iv) computer equipment,software, and computer furniture (250 computers, 350 printers, and 100 furniture sets) for schools; and (v)technical assistance to establish the MIS.
- 44 -

Project Administration
The unit that has implemented MECAEP I and II will continue to be gradually reduced as its functions areabsorbed by ANEP, leaving only those staff who are carrying out core activities involved in theimplementation of the project.
The project will finance technical assistance to carry out: (i) the project coordination and administration;(ii) the management of the financial and physical execution of the project; (iii) the management of theproject's procurement activities; and (iv) the monitoring and evaluation of the project. The project will alsofinance the acquisition of office equipment and computers for the PCU.
Front-end Fees
The Governnent requested that Front-end Fees, equivalent to 1 percent of total loan amount, be paid out ofloan proceeds.
-45-

Annex 3: Estimated Project Costs
URUGUAY: Third Basic Education Quality Improvement Project
Project Cost By Component Local Foreign TotalUS$ million US$ million US$ million
1. Expansion of thefull-time 34.33 9.84 44.17school model1.1 Construction, transformation, 26.47 7.05 33.52rehabilitation, and equipping offull-time schools1.2 Acquisition of school 2.70 2.79 5.49equipment, learning materials,and school libraries ___
1.3 Teacher training in the 3.31 0.00 3.31full-time school model, bilingualeducation, and new educationtechnologies__ _ _ _ _ _ _ _ _ _ _ _ _ _ _ _ _ _ _ _ _
1.4 Strengthening the partnership 1.85 0.00 1.85between schools and parents2. Institutional strengthening 10.85 0.21 11.062.1 Design of teacher training 3.83 0.00 3.83reforrn2.2 Development and 3.13 0.00 3.13implementation of PMEs2.3 Monitoring of the Education 1.88 0.21 2.09Program2.4 Project Administration 2.01 0.00 2.013. Unallocated 0.28 0.07 0.354. Front-end fees 0.00 0.42 0.42Total Project Costs 45.46 10.54 56.00
-46 -

Annex 4: Cost Benefit Analysis SummaryURUGUAY: Third Basic Education Quality Improvement Project
I. Introduction
Building on the success of MECAEP I and II, the Government of Uruguay plans to launch the ThirdProject for the Improvement of the Quality of Primary Education (MECAEP III), making this a keyelement of its strategy in the education sector. The project has two main components. The first will expandthe coverage of full-time education for children attending preschools and primary schools in both urban andrural areas. The second will improve and strengthen institutional the performance of the education systemat both the school level and at the National Council of Public Education (Administraci6n Nacional deEducacion Puiblica - ANEP).
Overall, the project will create or adapt 1,790 classrooms to be used for full-time schooling, 1,356 in urbanareas and 434 in rural areas. In urban schools, one-fourth of the classrooms will be used for preschooleducation, with the other three-fourths being used for primary education. In rural areas, full-time schoolswill concentrate on primary education, with 172 schools with more than 30 students being converted to thefull-time school model, covering some 8,000 students. In steady state, the project will enable 51,160 morechildren to attend full-time schools, 10,238 and 40,922 students in preschool and primary educationrespectively (Table 4.1) 1/. In both cases, the project will target schools located in more disadvantagedneighborhoods.
Table 4.1: Cumulative Enrollment in New Full-time Classrooms (number of students)
Initial Primary Education TotalYear Urban Rural Total2002 240 768 0 768 10082003 2258 7224 1656 8880 111372004 4875 15600 3548 19148 240232005 7748 24792 5676 30468 382162006 9308 29784 7190 36974 462812007 10238 32786 8136 40922 51160
To achieve these targets, the project will finance the construction, rehabilitation, and adaptation ofclassrooms, the acquisition of school equipment and teaching and learning materials, teacher training,initiatives aimed at strengthening the partnership between schools and parents, school improvementprojects, and the strengthening of institutions in the education sector. The total project cost is estimated tobe US$ 56.0 million, 79.5 percent of which will be spent in the first component, and 19.8 percent in thesecond component; US$ 420,000 will be used to cover front-end fees. This annex analyzes only the firstcomponent.
The expected benefits of the enhanced coverage of full-time preschool and primary education are bettercognitive and social development and improved scholastic achievement on the part of the participatingchildren. The links between access to pre-schools and to single-shift, full-time curriculum-based educationand better academic performance are supported by the results of the achievement tests and accompanyingsurveys conducted for sixth grade students in October 1996 and October 1999. 2/Mothers will also benefitdirectly by being able to work, at least part time. The institutional strengthening component will help to
- 47 -

ensure that the benefits are indeed delivered. Last, but not least, the project has important redistributivemerits because of its focus on the most disadvantaged households in the country.
In this annex, we present the project's economic analysis, concentrating on its first component. The nextsection details the cost structure of Component 1, how the costs will be incurred over time, and the indirectcosts that it will generate. Section III estimates the project's expected benefits and its economic rate ofreturn (ERR). Section IV presents a Monte Carlo sensitivity analysis of the ERR, which considers theuncertainty surrounding the various estimates and assumptions used in the analysis. Annex 5 discusses theproject's fiscal implications.
1/ In 2001, a total of about 21,000 children were enrolled in full-time schools, 4,000 in preschool and the rest in primary education.2/ The adcption of education improvement sub-projects, not considered here, were also found to affect academic performance positively.
II. Cost:s
Regarding urban schools, the project's first component has four sub-components:
1. The construction, rehabilitation. adaptation. and conversion of classrooms. The project will finance theconstruction of 540 classrooms, the rehabilitation of 100, the adaptation of 360, and the conversion ofanother 356, totaling 1,356 classrooms to be used in the future for full-time preschool education andprimary schools in urban areas. This will allow enrollment to increase by 10,238 and 32,786 studentsin preschools and primary schools respectively. The unit costs of classroom construction,rehabilitation, and adaptation are estimated to be US$ 30,942, US$ 11,689, and US$ 4,813respectively, all net of taxes. Classroom conversion - in other words, simply using the classroom forfull-time rather than regular schooling - is assumed not to involve any construction work. The annualconstruction schedule is presented in Table 4.2. Half the classrooms will be in Montevideo and theother half in urban areas outside the capital. In both cases, 40 percent of the students in theseclassrooms will be in schools of very disadvantaged contexts, 40 percent of disadvantaged contexts,and 20 percent of average contexts. A total of US$ 21.0 million will be allocated to thissub-component (net of taxes and including the cost of architectural and engineering consultants).
2. Corriputers. classroom equipment. libraries, teachinz materials. and books. The project will finance theacquisition of equipment and furniture for classrooms, including 2,428 computers. It will also financethe purchase of 21,030 books for classroom libraries and 276,400 textbooks (entirelyBorrower-financed) to be directly distributed to students in primary school. Five hundred sets ofteaching materials will be provided for preschool and primary education, including 40 for bilingualeducation classrooms. The project is also expected to finance the acquisition of computer software.This subcomponent is expected to cost US$ 6.2 million (net of taxes).
3. Capacity buildinz. A third subcomponent encompasses various types of training courses directed atteachers, school principals, and inspectors, preparing them to work in full-time schools. Also includedin this sub-component will be the training of teachers who will work in bilingual schools. Thissubcomponent is expected to cost US$ 2.8 million.
4. Strerngthening school-community ties. The first component will also cover the cost of initiatives aimedat strengthening school-community ties through the creation of multi-disciplinary groups to work withparents and other local stakeholders. Overall, US$ 1.6 million will be allocated to this initiative.
-48 -

Table 4.2: Number of Schools and Classrooms Constructed, Rehabilitated, Adapted, and Convertedto Provide Full-time Education (urban and rural areas)
Urban Rural_________ ~~~Classrooms
Year New Rehabilitated Adapted Converted Total Schools Classrooms SchoolsRehabilitated
2002 32 0 0 0 32 4 0 0 322003 88 32 32 114 266 33 70 35 3362004 120 80 32 114 346 43 120 40 4662005 120 96 36 128 380 48 135 45 5152006 120 88 0 0 208 26 69 32 2772007 60 64 0 0 124 16 40 20 164Total 540 360 100 356 1356 170 434 172 1790
Unit cost 30942 11689 4813 0 10314
The first component will also finance the rehabilitation of classrooms in rural schools with 30 or morestudents, converting them into full-time schools. This will comprise the following initiatives: therehabilitation of 434 classrooms, at the cost of US$ 10,314 per classroom, totaling US$ 4.7 million(net of taxes and including cost of consultants).
* The provision of one computer set and furniture for each of the 172 schools to be turned into full-timeschools, at the cost of US$ 1,821 per school.
* The provision of classroom libraries at the cost of US$ 150 per classroom.* The provision of teaching materials at the cost of US$ 1,190 per school (US$ 790 for computer
materials and US$ 400 for other teaching materials).* Special training for each teacher (one per classroom) on how to teach in full-time schools and to use
computers at the cost of US$ 680 and US$ 170 respectively.
Tables 4.3 and 4.4 show the direct costs - in other words, the costs to be covered by the project - of thefirst component in 2002-2007 for schools in urban and rural areas respectively. By far the most relevantsubcomponent in each case is the construction, rehabilitation, and adaptation of classrooms. In addition tothe cost of the civil works associated with this, there will also be costs associated with consultants andtaxes. However, taxes were not considered for the purposes of estimating the project's economic rate ofreturn, since they are simply intra-govenmuental transfers. Other direct costs involved in expanding thecoverage of full-time schools in urban and rural areas include the acquisition of equipment and materials,teacher training, and initiatives to strengthen the partnership between schools and parents. Expenditureswill be concentrated in 2003-2006, as the project will cover only parts of 2002 and 2007.
-49 -

Table 43: Direct Costs of Urban Schools (US$ thousand, net of taxes)
Year2002 2003 2004 2005 2006 2007 Total
New 990.1 2722.9 3713.0 3713.0 3713.0 1856.5 16708.7Rehabilitated 154.0 385.0 462.0 423.5 308.0 1732.7Adapted 374.0 374.0 420.8 1168.9ConsuGltants 94.1 363.0 363.0 363.0 174.8 1357.7Civil WVorks Total 990.1 3345.1 4835.1 4958.9 4499.5 2339.3 20968.0(classrooms) I _IIClassroom 73.6 287.5 377.2 391.0 305.9 161.0 1596.2Computers 449.8 485.7 611.7 395.8 413.8 374.7 2731.4FurnitLre 56.4 60.9 76.6 49.6 51.8 46.8 342.1Equipment I Total 579.7 834.1 1065.5 836.4 771.5 582.5 4669.7Classroom Libraries 4.8 37.5 49.8 57.9 60.0 9.0 219.0Student 50.9 65.1 66.7 124.6 173.0 480.3Books Total 55.7 102.6 116.5 182.5 233.0 9.0 699.3Software 39.5 42.7 53.7 34.8 36.3 33.2 240.2Other 10.8 116.8 143.8 149.2 95.2 43.2 559.0Teachirig Materials Total 50.3 159.5 197.5 184.0 131.5 76.4 799.2ETC 182.9 188.1 190.1 192.1 194.1 182.9 1130.3Computer 102.0 102.0 102.0 102.0 102.0 510.0Tutorin g 51.7 51.7 51.7 51.7 206.7Consultants 101.1 246.9 246.9 246.9 119.8 961.6TeacherTraining Total 182.9 391.2 590.7 592.7 594.7 456.4 2808.6
Strengthening school-parent 0.0 257.3 385.9 385.9 385.9 192.9 1607.8partnershiips I_I_I_I
Total Costs 1875.4 5140.1 7232.5 7116.2 6536.2 3724 31624.3
Table 4.4: Direct Costs for Rural Schools (US$ thousand, net of taxes)
Year2002 2003 2004 2005 2006 2007 Total
Rehabilitation 0.0 907.6 1041.7 1175.8 835.4 515.7 4476.3Consultants 0.0 51.7 59.3 66.9 47.5 29.3 254.8Civil Works Total 0.0 956.9 1098.2 1239.6 880.7 543.7 4719.0Computers 0.0 4.4 5.0 5.7 4.0 2.5 21.7Furniture 0.0 61.1 69.8 78.5 55.8 34.9 300.1Equipment Total 0.0 65.5 74.8 84.2 59.9 37.4 321.8Classroom Libraries 10.5 18 20.25 10.35 6.0 65.1Compul:er 0.0 27.7 31.6 35.6 25.3 15.8 135.9Other 0.0 14.0 16.0 18.0 12.8 8.0 68.8.Teaching Total 0.0 52.2 65.6 73.8 48.4 29.8 269.8Materials IFTS 0.0 0.0 98.6 98.6 97.9 0.0 295.1Computer 0.0 0.0 24.7 24.7 24.5 0.0 73.8Consultants 10.0 10.0 20.0Traininlg Total 10.0 10.0 123.3 123.3 122.4 0.0 388.9Total Costs 10.0 1084.5 1361.9 1520.8 1111.4 610.9 5699.5
The expansion in full-time education will entail an increase in indirect or non-project expenditures becauseof three factors. The first factor will be the increase in salary expenditures for teachers, directors, and otherpersonnel as a result of hiring new personnel and of salary upgrades for staff already in the system.Second, the new classrooms and equipment will have to be maintained, so we assume that annual
- 50 -

maintenance costs will be close to 2 percent of the total capital investment. The third factor will be the needto replace equipment and materials after a number of years as they deteriorate, are lost, or become obsolete.
Therefore, the indirect costs comprise the cost of replacing depreciated equipment and materials andproject-induced recurrent expenditures on teacher salaries and maintenance expenses. To estimate the costsof replacing depreciated equipment we assume the complete replacement of computers, software, materials,and books every five years and of furniture and other classroom equipment (such as video, audio, andkitchen equipment) every 10 years, all of which would have zero residual value by 2035. For theinvestment in classroom construction, rehabilitation, and adaptation, we estimate a residual value in 2035,using an annual depreciation rate of I percent.
To estimate changes in personnel, we assumed that (i) all teachers in full-time classrooms wouldaccompany their students in passing from part-time to full-time jobs; 4/ (ii) each school would have threefull-time adrninistrative staff; (iii) each principal would manage a school with eight classrooms; and (iv)half of the principals and administrative personnel in full-time schools would come from existing schools,with the other half being hired in the labor market. For rural schools, we assume that all personnel werealready working double-shifts and that, therefore, there would be no increase in salary expenditures. Theincrease in salary expenditures was then estimated using the values in Table 4.5.
4/ From Table 4.3, we can see that full-time teachers earn about US$ 6,000 more per year than part-time teachers but US$ 2,333.60 less than teacherswho hold two part-time jobs. This raises the issue of whether "part-time" teachers will be willing to change their work schedules.
Table 4.5: Annual Salaries in Regular and Full-Time Schools, Net of Payroll Taxes (inUS$)*
School Teacher AdministrativePrincipal Support
Regular School 11,234 4,840** 3,473Full-Time School 11,819 8,965*** 4,068
Notes: (*) December 2000 values and US$ I = $12.56; (**) 20 hours per week; (***) 40 hours per week
Table 4.6 presents the project's indirect costs in 2002-35 and shows that the project will generate sizableindirect costs, due particularly to a substantial rise in salary expenditures of approximately US$ 7.8million more per year (net of payroll taxes paid by employers). Sustaining the improvement in qualitybrought about by the project also implies the need for significant expenditure on maintaining facilities andreplacing equipment and materials. Table 4.7 presents all of the direct and indirect costs associated withComponent I of the project. Direct costs predominate while the project is being implemented, but by 2006,indirect costs will surpass direct costs due mainly to the rise in salary expenditures. 5/
5/ The negative figure for civil works in 2035 corresponds to the residual value of the investment in the construction, rehabilitation, and adaptation ofclassrooms in 2002-2006. The annual depreciation rate for construction was assumed to be I perrent.
- 51 -

Table 4.6: Recurrent and Replacements Costs (US$ 1000)Urban Schools Rural Schools Total
Year Increase in Salary Expenditures Maint. Replacement Total Maint. Replacement Total
Urban Rural
Teachers Principals Other Equip. Materials Equip. MaterialsStaff _
2002 12003 132.0 24.8 28.0 31.4 216.2 0.0 0.0 216.2
2004 1229.3 231.0 260.5 113.1 1833.9 19.5 19.5 1853.4
2005 2656.5 499.3 563.1 223.9 3942.7 41.8 41.8 3984.5
2006 4224.1 793.9 895.3 332.5 6247.7 67.0 67.0 6312.7
2007 5082.1 955.1 1077.2 430.7 7547.0 84.9 84.9 7629.9
2008 5593.6 1051.3 1185.6 430.7 449.8 106.0 8816.8 84.9 61.1 52.2 198.1 9014.9
2009 5593.6 1051.3 1185.6 430.7 485.7 262.1 9008.9 84.9 69.8 65.6 220.3 9229.2
2010 5593.6 1051.3 1185.6 430.7 611.7 314.0 9186.8 84.9 78.5 73.8 237.2 9424.0
2011 5593.6 1051.3 1185.6 430.7 395.8 366.4 9023.3 84.9 55.8 48.4 189.2 9212.4
2012 5593.6 1051.3 1185.6 430.7 543.7 364.5 9169.3 84.9 34.9 29.8 149.6 9318.9
2013 5593.6 1051.3 1185.6 430.7 723.0 85.4 9069.5 84.9 65.5 52.2 202.5 9272.0
2014 5593.6 1051.3 1185.6 430.7 903.6 106.0 9270.7 84.9 74.8 65.6 225.3 9496.02015 5593.6 1051.3 1185.6 430.7 926.3 262.1 9449.4 84.9 84.2 73.8 242.9 9692.32016 5593.6 1051.3 1185.6 430.7 969.4 314.0 9544.5 84.9 59.9 48.4 193.2 9737.72017 5593.6 1051.3 1185.6 430.7 603.6 366.4 9231.1 84.9 37.4 29.8 152.1 9383.22018 5593.6 1051.3 1185.6 430.7 413.8 364.5 9039.4 84.9 61.1 52.2 198.1 9237.5
2019 5593.6 1051.3 1185.6 430.7 374.7 85.4 8721.1 84.9 69.8 65.6 220.3 8941.4
2020 5593.6 1051.3 1185.6 430.7 449.8 106.0 8816.8 84.9 78.5 73.8 237.2 9054.02021 5593.6 1051.3 1185.6 430.7 485.7 262.1 9008.9 84.9 55.8 48.4 189.2 9198.0
2022 5593.6 1051.3 1185.6 430.7 741.6 314.0 9316.7 84.9 34.9 29.8 149.6 9466.3
2023 5593.6 1051.3 1185.6 430.7 744.1 366.4 9371.6 84.9 65.5 52.2 202.5 9574.22024 5593.6 1051.3 1185.6 430.7 867.6 364.5 9493.2 84.9 74.8 65.6 225.3 9718.52025 5593.6 1051.3 1185.6 430.7 815.3 85.4 9161.7 84.9 84.2 73.8 242.9 9404.62026 5593.6 1051.3 1185.6 430.7 807.5 106.0 9174.6 84.9 59.9 48.4 193.2 9367.82027 5593.6 1051.3 1185.6 430.7 693.6 262.1 9216.7 84.9 37.4 29.8 152.1 9368.82028 5593.6 1051.3 1185.6 430.7 611.7 314.0 9186.8 84.9 61.1 52.2 198.1 9384.9
2029 5593.6 1051.3 1185.6 430.7 395.8 366.4 9023.3 84.9 69.8 65.6 220.3 9243.62030 5593.6 1051.3 1185.6 430.7 413.8 364.5 9039.4 84.9 78.5 73.8 237.2 9276.62031 5593.6 1051.3 1185.6 430.7 374.7 85.4 8721.1 84.9 55.8 48.4 189.2 8910.3
2032 5593.6 1051.3 1185.6 430.7 579.7 106.0 8946.8 84.9 34.9 29.8 149.6 9096.42033 5593.6 1051.3 1185.6 430.7 834.1 262.1 9357.2 84.9 65.5 52.2 202.5 9559.82034 5593.6 1051.3 1185.6 430.7 1065.5 314.0 9640.6 84.9 74.8 65.6 225.3 9866.02035 5593.6 1051.3 1185.6 430.7 836.4 366.4 9463.9 84.9 84.2 73.8 242.9 9706.8
- 52 -

Table 4.7: Direct and Indirect Costs (US$ 1,000) - Urban and Rural Schools, 2002-2035
Direct Costs (urban and rural) Indirect Costs (urban and rural) Total DirectYear Civil Equipment Materials Training Strength. Increase in Maint. Replac. and Indirect
Works PTAs Salary Expend.2002 990.1 579.7 106.0 192.9 1868.82003 4301.9 899.6 314.2 401.2 257.3 184.8 31.4 6390.32004 5933.3 1140.3 379.6 714.0 385.9 1720.8 132.6 10406.52005 6198.4 920.6 440.2 716.0 385.9 3718.9 265.6 12645.62006 5380.3 831.4 413.0 717.1 385.9 5913.2 399.5 14040.32007 2883.0 619.9 115.2 456.4 192.9 7114.4 515.6 11897.32008 7830.4 515.6 669.0 9014.92009 7830.4 515.6 883.2 9229.22010 7830.4 515.6 1078.0 9424.02011 7830.4 515.6 866.5 9212.42012 7830.4 515.6 973.0 9318.92013 _ 7830.4 515.6 926.0 9272.02014 7830.4 515.6 1150.0 9496.02015 7830.4 515.6 1346.4 9692.32016 7830.4 515.6 1391.8 9737.72017 7830.4 515.6 1037.3 9383.22018 7830.4 515.6 891.5 9237.52019 7830.4 515.6 595.5 8941.22020 7830.4 515.6 708.1 9054.02021 7__ X 7830.4 515.6 852.1 9198.02022 7830.4 515.6 1120.4 9466.32023 7830.4 515.6 1228.2 9574.22024 7830.4 515.6 1372.6 9718.52025 7830.4 515.6 1058.6 9404.62026 7830.4 515.6 1021.8 9367.82027 7830.4 515.6 1022.8 9368.82028 7830.4 515.6 1038.9 9384.92029 7830.4 515.6 897.6 9243.62030 7830.4 515.6 930.6 9276.62031 7830.4 515.6 564.3 8910.32032 7830.4 515.6 750.4 9096.42033 7830.4 515.6 1213.8 9559.82034 7830.4 515.6 1520.0 9866.02035 -18776 7830.4 515.6 1360.8 -9069.3
III. Benefits
The major benefits that will accrue from the project are an improvement in the quality of education and anincrease in equity arising from giving greater education opportunities to students from disadvantagedbackgrounds and from giving enhanced working opportunities to both the students and their mothers. Thisassessment is based on evidence showing that:
- 53 -

Students who come from more disadvantaged backgrounds have higher repetition rates and pooreracademic perfornance than those from better-off families. Students who attend full-time schools performbetter in both Mathematics and Spanish than students who attend regular schools. 6/
Mothers in the lowest income quintiles are less likely to be in the labor force than are mothers in the highestquintiles. The indirect opportunity costs of sending their children to a private preschool may be animportant barrier preventing them from working, given their relatively lower opportunity cost of staying athome (relative to richer households but not necessarily to their own household income).
6/ One would expect students who attend full-time schools also to have lower repetition and dropout rates after controlling for students'socio-economic backgrounds, but the empirical evidence here is not consistent. It was true for efficiency indicators in 1999 but not for the 2000indicators. We opted not to consider this effect
Full-lime Schools
The first set of full-time schools in Uruguay were established in the early 1990s. In the early years, theGovernment most simply extended the number of class hours - from four to seven and a half hours per day- without making any substantive changes in their pedagogical models. Yet the 1996 Learning Evaluationof children in the sixth grade of primary education indicated that the simple extension in their stay at schoolhad had a positive effect on their performance. In particular, the 1996 Evaluation showed that, aftercontrolling for socio-economic context, full-time schools had better learning results than regular schools.7/
Beginning in 1996, the Government discussed a new pedagogical and institutional model for full-timeschocils, and in December 1998 it was approved by ANEP. In 1998 and more intensely in 1999, an effortwas made to train teachers and school principals working in these schools. In 1999, the coverage offull-time schools was expanded to cover more socially and culturally deprived areas. By the end of 1999,52 full-time public primary schools were operating in Uruguay. Of the total number of 6th grade students(excluding the three schools that in 1999 were operating in single shifts for only some of the grades), 79.5percent of the students came from schools of disadvantaged (33.3 percent) or very disadvantaged (46.2percent) socio-economic contexts.
The 1]999 learning evaluation of 6th grade students showed that, although full-time schools are a recentphenomenon, they have been able to improve students' academic performance. As shown in Table 4.9,students in full-time schools performed better than did the average 6th-grade student in both mathematicsand language, controlling for socioeconomic conditions. Consistent with these results, we assume thatstudents who attend full-time schools will be more productive and hence earn higher incomes. Thisincrernent in earnings is estimated to be equal to half of the average improvement in performance inMathematics and Spanish shown in Table 4.9. The same increase in earnings is projected to occur in thecase of students going to rural schools.
7/ This background on filil-time schools was drawn from ANEP/UMRE (Unidad de Medicion de Resultados Educativos), "Evaluaci6n Nacional deAprendizajes en la Lenguay Matematica - 6o Aiio de Primaria - 1999", Segundo Informe, June 2000.
-54 -
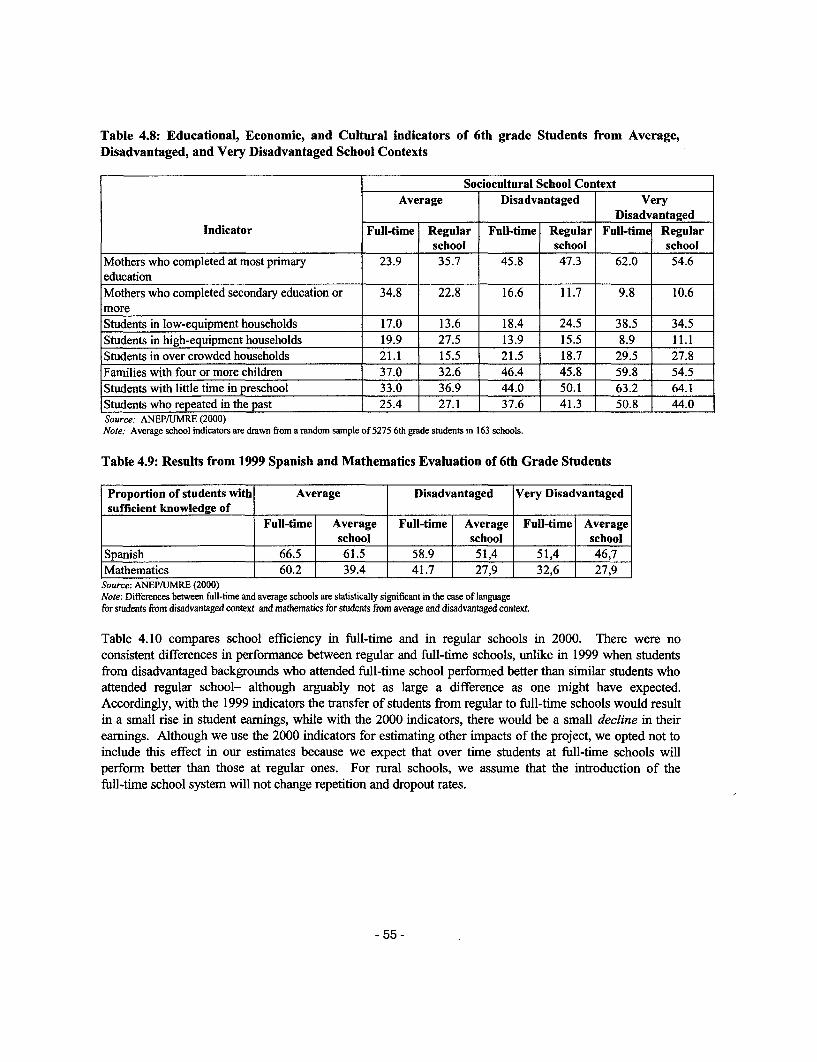
Table 4.8: Educational, Economic, and Cultural indicators of 6th grade Students from Average,Disadvantaged, and Very Disadvantaged School Contexts
Sociocultural School ContextAverage Disadvantaged Very
DisadvantagedIndicator Full-time Regular Full-time Regular Full-time Regular
school school schoolMothers who completed at most primary 23.9 35.7 45.8 47.3 62.0 54.6educationMothers who completed secondary education or 34.8 22.8 16.6 11.7 9.8 10.6moreStudents in low-equipment households 17.0 13.6 18.4 24.5 38.5 34.5Students in high-equipment households 19.9 27.5 13.9 15.5 8.9 11.1Students in over crowded households 21.1 15.5 21.5 18.7 29.5 27.8Families with four or more children 37.0 32.6 46.4 45.8 59.8 54.5Students with little time in preschool 33.0 36.9 44.0 50.1 63.2 64.1Students who repeated in the past 25.4 27.1 37.6 41.3 50.8 44.0Source: ANEP/UMRE (2000)
Note: Average school indicators are drawn from a random sample of 5275 6th grade students in 163 schools.
Table 4.9: Results from 1999 Spanish and Mathematics Evaluation of 6th Grade Students
Proportion of students with Average Disadvantaged Very Disadvantagedsufficient knowledge of
Full-time Average Full-time Average Full-time Averageschool school school
Spanish 66.5 61.5 58.9 51,4 51,4 46,7Mathematics 60.2 39.4 41.7 27,9 32,6 27,9
Source: ANEP/UMRE (2000)Note: Differences between full-time and average schools are statistically significant in the case of languagefor students from disadvantaged context and mathematics for students from average and disadvantaged context.
Table 4.10 compares school efficiency in full-time and in regular schools in 2000. There were noconsistent differences in performance between regular and full-time schools, unlike in 1999 when studentsfrom disadvantaged backgrounds who attended full-time school performed better than similar students whoattended regular school- although arguably not as large a difference as one might have expected.Accordingly, with the 1999 indicators the transfer of students from regular to full-time schools would resultin a small rise in student earnings, while with the 2000 indicators, there would be a small decline in theirearnings. Although we use the 2000 indicators for estimating other impacts of the project, we opted not toinclude this effect in our estimates because we expect that over time students at full-time schools willperform better than those at regular ones. For rural schools, we assume that the introduction of thefull-time school system will not change repetition and dropout rates.
- 55 -

Table 4.10: Promotion, Repetition, and Dropout Rates by Region and Type of School -Uruguay2000
Promotion Repetition DropoutSchools I1. 2 m 3d 4th 5h Toa ' 2 3td I e 5th 6t
1Total '1th 2~ 3' 4~5 ?6~Total
Uruguiay Total 2097 78.7 85.4 91.G 92.3 93.9 96.2 89.1 20.4 14.3 8.7 7.3 5.5 2.A 10.A 1.0 0.2 0.3 0.! 0.6 1.1 0.6Rural Total 1095 78.4 85.9 93.1 94.3 95.4 94.9 89.8 21.1 13.8 6.5 5.2 3.5 2.8 9.3 0.1 0.3 0.4 0.' 1.1 2.2 0.8Full-T!me Total 77 76.8 83.5 89.8 90.3 93.9 96.1 87.6 22.5 16.3 9.8 9.3 5.3 2.1 11.8 0.7 0.2 0.4 0. 0.7 1. 0.6Total Regular 92f 78.8 85.5 90.9 92.2 93.8 96.3 89.1 20.2 14.3 8.8 7.3 5.( 2.8 10.3 1.0 0.2 0.3 0.. 0.( 1. 0.61Urbani I_II_I I_II_
Total 261 75.C 83.8 89.1 90.4 93.1 96.8 87.5 23.0 15.8 10.4 9.1 6.C 2.5 11.f 2.1 0.5 0.1 0. 0.1 0.8 0.8MontevideoMontevideo FTAverage 3 76.5 80.6 88.9 93.6 97.4 96.9 88.4 21.1 18.5 11.1 6.4 2.6 3.1 11.C 2.4 0.8 0.0 0.0. 0.0 0.6Disadvantaged 573.1 79.7 92.8 91.4 94.5 96.3 87.2 26.5 20.3 7.2 8.1 5.5 2.6 12.5 0.4 0.0 0.0 0.5 0.1 1.1 0.3Very 568.1 79.1 81.1 78.1 88.3 96.6 80.1 30. 20.5 18.5 21.1 11.2 2.0 18. 1.6 0.4 0.4 0.4 0.1 1.1 0.8disadvantagedMontevideo
Averagye 56 79.6 85.8 90.C 91.~ 93.9 97.8 89.7 18.( 14.C 9.9 8.C 5.8 1.9 9.7 1.9 0.2 0.1 0.3 0.3 0.3 0.5Disadvantaged 58 69.6 81.5 86.1 87.~ 91.6 95.0 83.9 28. 17. 13.3 1 1. 7.8 4.1 15.0 2.4 0. 0.6 0. 0.6 1 . 1.0,Very 41 66.9 77.0 84.2 85.3 90.7 95.2 81.5 31. 21.8 14.8 13.7 8.2 3.0 17.0 2.2 1. 0.9 1.1 1.2 1.8 1.4disadvantagedInteriorRural InteriorAverage 271.4 80. 83.3 81.8 100.1 100.0 84.4 28.6 20. 16.7 18.2 0. 0. 15.q 0.0 0. 0.0 0. 0.C 0. 0.0Disadvantaged 12 81.3 85.6 91.0 92.4 93.~ 96.3 89.5 17.7 14.4 7.7 6.3 5.1 0.0 9.11.q 0. 1. 1.3 1.3 3. 1.-Very 90 74.6 84.1 91.5 94.9 94.1 93. 88.6 24.9 15.9 8.3 4.8 4.6 4.3 10. 0.5 0.0 0.2 0.2 0.6 2.1 0.7disadvantagedIInterior FT ____
Averag,e 483.2 88.2 94.5 93. 92.~ 97. 91.1 14.~ 11.1 4.9 6.1 3.9 1.3 7.f 2.5 0.0 0. 0.6 3.1 1.3 1.4Disadvantaged 15 85.4 88.4 91.8 91.4 94.1 97.0 91.1 14.1 11.6 8.2 8.6 5.2 1.2 8.( 0.0 0.0 0. 0.0 0. 1.8 0.3Very 35 77.6 84.6 91.6 92. 94.7 94.6 88.3 22.4 15.3 8.4 6.8 4.6 2.7 11. 0.0 0.1 0. 0.4 0.1 2.7 0.7disadvantaged ______
InterioDr urban regular
Avera,ge 95 86.5 89. 94.5 95.1 95.8 97.6 93.1 13.0 10.. 5.4 4.8 3 . 1.9 6.7 0. 0 . 0.6 0.1 0.4 0.5 0.3Disadvtantaged 144 79.5 84.3 90.5 92. 93.2 95.4 88.7 19.S 15.5 9.3 7. 6.2 3.3 10. 0. 0.2 0.2 0.0. 1.T3 0.6Very 322 76.1 83.5 89. 91. 92194.1 87.1 23.( 16.3 1017 8.3.8 12.30 0 0.2 0.6 1.11.6 0.6disadvantaged _____
Note: Definition of dropout includes: actual dropouts (overaged children and others), deceased, and emigrants amnong others
Mincer Equation
To estimate the imnpact of changes in the quality of education on student earnings, we estimnated a Mincerequati.on using earn-ings and other information from the 1999 household survey. Tfhe regression results areshowni in Table 4.1 1. They reveal a good fit with all variables, except for the diummies for sectors (ramas)35 andl 93, which were statistically significant at the 0.1I percent level.
- 56 -

Table 4.11: Mincer E uation for Earnin s in 1999Dependent Variable: Log of hourly incomeMethod: Least SquaresSample: 1 22999Included observations: 22999Weighting seies: EXPERIEN
Variable Coefficien Std. Error t-Statistic Variable Coefficient Std. Error t-StatisticC 2.48630C 0.050661 49.07680 RAMII -0.613561 0.042098 -14.57468
SEXO 0.230444 0.011008 20.93500 RAM 12 -0.636590 0.073652 -8.643212ANIOED5 0.103591 0.028012 3.698283 RAM31 -0.364171 0.040878 -8.908654ANIOED6 0.16458( 0.014876 11.06411 _ RAM32 -0.845254 0.040948 -20.64232ANIOED7 0.278083 0.029163 9.535437 RAM33 -0.760062 0.053511 -14.20376ANIOED8 0.243079 0.022288 10.90647 RAM34 -0.294245 0.059998 -4.904254ANIOED9 0.354199 0.021568 16.42217 _ RAM35 -0.135700 0.051053 -2.658041ANIOEDIO 0.508192 0.020613 24.65428 RAM36 -0.384575 0.071400 -5.386239ANIOEDI 1 0.520775 0.029782 17.48620 RAM38 -0.472242 0.046012 -10.26353ANIOED12 0.692898 0.022652 30.58870 RAM41 0.417042 0.068820 6.059875ANIOED13 0.830331 0.047474 17.49011 RAM42 0.589729 0.070617 8.351062ANIOED14 0.799284 0.040823 19.57917 RAM50 -0.499332 0.038016 -13.13469ANIOED15 0.899002 0.039379 22.82930 RAM61 -0.21623C 0.043039 -5.024069ANIOED16 1.044703 0.032614 32.03255 _ RAM62 -0.684996 0.037105 -18.46100ANIOED17 1.317602 0.041464 31.77726 RAM63 -0.525491 0.044691 -11.75822ANIOED18 1.382521 0.036419 37.96199 _ RAM71 -0.304617 0.039368 -7.737610EXPERIEN 0.033722 0.001723 19.57454 RAM72 0.497787 0.060714 8.198864
EXPERIENCE2 -0.000385 2.18E-05 -17.68370 _ RAM81 0.639277 0.052473 12.18304MONTEV 0.340900 0.009733 35.02537 _ RAM83 -0.369959 0.042752 -8.653601KFISICO 0.120579 0.011756 10.25640 RAM91 0.370100 0.038485 9.616662
RAM93 -0.105653 0.037706 -2.802038_ RAM94 -0.322431 0.044766 -7.202620_ RAM95 -0.608264 0.036335 -16.74058
Weighted StatisticsR-squared 0.872726 Mean dependent var 3.505621Adjusted R-squared 0.872494 _ S.D. dependent var 2.249549S.E. of regression 0.803270 Akaike info criterion 2.401615Sum squared resid 14812.18 _ Schwarz criterion 2.416653Log likelihood -27574.38 F-statistic 3747.890Durbin-Watson stat 1.823685 _ Prob(F-statistic) 0.000000Unweighted Statistics
R-squared 0.449446 Mean dependent var 3.474577Adjusted R-squared 0.448439 S.D. dependent var 0.882439S.E. of regression 0.655362 _ Sum squared resid 9859.589Durbin-Watson stat 1.778326 _
Increase in Earnings of Mothers
We estimate that an important gain from the project will be the increase in the incomes of mothers whosechildren will attend full-time schools. This would come from a higher participation of mothers in thelabor market. As shown in Table 4.12, the proportion of mothers with children of school age who workincreases with income, probably because better-off mothers can afford to have their children taken care of
- 57 -

during working hours. We assume, arbitrarily, that for children entering full-time education theparticipation of mothers in the labor force will rise by a quarter of the difference between the rate ofparticipation in their respective income quintile and that in the fourth quintile. 8/ We also make a directassociation between income quintiles and socioeconomic contexts (in other words 1st quintile and verydisadvantaged socioeconomic context).
Table 4.12: Participation in the Labor ForceMothers with Children in
Income Sociocultural Initial Education Primary EducationQuintile Context Montevideo Interior Montevideo Interior
First Very 0,42 0,30 0,46 0,37Disadvantaged
Second Disadvantaged 0,58 0,45 0,62 0,51Third Average 0,77 0,62 0,75 0,62Fourth Favorable 0,79 0,72 0,75 0,70
Note: These estimates were derived creating an equivalence between income quintiles andsocioecoaomic contexts (for example, 11 Quintile = Disadvantaged). See Annex 13.
Earnings of these mothers were assumed to equal those of mothers with children in the specified agebracket. Separate calculations were done for preschool and primary education, using data from a 1998household survey. The expected rise in the number of mothers participating in the labor force was thenmultiplied by the average annual earnings of working mothers with children of school age and in eachincome quintile (Table 4.13), weighting for the distribution of classrooms (new, rehabilitated, and adapted)according to their socioeconomic context and location. We assume that 40 percent, 40 percent, and 20percent of the classrooms would be located in very disadvantaged, disadvantaged, and averagesocioeconomic contexts, respectively. Half of the classrooms are expected to be located in Montevideo andthe other half in the other urban locations in Uruguay (Table 4.14).
Because rural schools already work on an extended, one-shift regime, we do not expect this initiative tochange mothers' participation in the labor force in rural areas. Therefore, for students in rural areas, weassume that there will be no direct increase in the number of mothers entering the labor force as a result oftheir children attending full-time schools.
Table 4.13: Avera e Mother Salaries per Income Quintile (US$ /year)With children in
Preschool Education Primary EducationIncome Quintile Montevideo Interior Montevideo InteriorFirst 2108 1414 2480 1442Second 4264 2583 4041 2683Third 6435 3473 5937 3809
Table 4.14: Planned Distribution of Classrooms by Region and Context (%)Context Montevideo Interior TotalVery Disadvantaged 20 20 40Disadvantaged 20 20 40Average 10 10 20Total 50 50 100
8/ For instance a mother in the first income quintile (very disadvantaged social-cultural context) living in Montevideo andhaving a child in full-time primary school will have the likelihood of working increased by 0.0725 = (0.75-0.46)/4.
- 58 -

Other Benefits
The economic analysis in this annex focuses on the two benefits that can reasonably be quantified.However, this there are several other hard-to-quantify benefits.
Reduced Poverty and Enhanced Equity. Because full-time schools will be located in worse offneighborhoods, most of the benefits will accrue to poor students and mothers, raising income among thepoor and contributing to improve income distribution, with likely positive impacts on other socialindicators, such as the prevalence of urban violence and public health indices such as maternal and childmortality, preventable diseases, etc.
Reduced Expenditures on Education. If adoption of the full-time system eventually causes a faster flow ofstudents through the education system, through lower repetition rates, as it should, it will also producesavings in costs.
Reduced Repetition due to the Availability of Books. Logit models estimated during the preparation ofMECAEP II indicate that having books available in students' homes tends to reduce the likelihood of thatthey will have to repeat a school grade. Therefore, the project's wide distribution of books to students -276,400 textbooks will be produced and given to full-time primary education students - should have apositive impact on students' academic performance.
Reduced Repetition Rates. The same logit models showed that the probability of a student repeating agrade during the six years of primary education will fall by 10 and 11 percentage points in Montevideo andthe Interior respectively if he or she has attended preschool. Both in Montevideo and the Interior, theprobability of a student repeating at least one grade of primary education is around 50 percent. Thissuggests that attending preschool reduces the probability that a student will repeat a grade of primaryschool by approximately one-fifth. Because the project is not expanding the coverage of preschool butrather is changing preschool education from the double-shift model to the full-time model, its impact onrepetition should not be as great as that. Nevertheless, better preschool education should lead to studentsperfonning better in primary school. Also, repetition and dropout rates in secondary education, which arevery high, should come down as a result of the improvement in the quality of preschool and primaryeducation.
Estimates of Benefits and the Economic Rate of Retum
In Table 4.15, we present the flow of gross and net benefits of the project's first component. As shown, netbenefits are projected to turn positive in 2007, when project outlays will only be needed early in the year,and will grow continuously after that. Until 2016, most benefits will consist of enhanced opportunities formothers to work, but after that the gains derived from higher productivity (higher learningaccomplishments) predominate.
The economic rate of return (ERR) that results from the flow of net benefits in Table 4.15 is 37.0 percent,and the net present value associated with it is US$ 212.3 million at an annual discount rate of 10 percent.Even if we were to assume that mothers' participation in the labor force will not change, then the ERRwould fall only to 14.5 percent and the net present value to US$ 60.9 million (10 percent discount rate).This reflects the importance of the extended supply of full-time preschool and primary education tomothers' earnings Although these values are lower, they are still significant, indicating that the project'sattractiveness is not limited to its impact on female labor market participation.
-59 -

Table 4.15: Gross and Net Benefits - 2002-2035Increase in Student EarningsBetter Quality of Education
Year Increase in Rural Urban Total Benefits Total Costs Net BenefitsMothers'Earnings
2002 0 1869 -18692003 206 0 0 206 6390 -61852004 2852 0 0 2852 10407 -75542005 7419 0 2 7421 12646 -52252006 12673 6 27 12706 14040 -13342007 16588 38 159 16784 11897 48872008 24149 115 481 24746 9015 157312009 24149 260 1078 25487 9229 162582010 24149 479 1984 26613 9424 171892011 24149 809 3305 28263 9212 190512012 24149 1268 5136 30553 9319 212342013 24149 1879 7532 33560 9272 242882014 24149 2633 10438 37220 9496 277242015 24149 3508 13763 41421 9692 317282016 24149 4448 17364 45961 9738 362242017 24149 5443 21147 50740 9383 413562018 24149 6465 25050 55664 9237 464272019 24149 7500 29081 60729 8941 517882020 24149 8545 33191 65885 9054 56831202 1 24149 9622 37423 71194 9198 619962022 24149 10751 41755 76655 9466 671892023 24149 11964 46177 82291 9574 727162024 24149 13561 50689 88399 9719 786812025 24149 15245 55291 94686 9405 852812026 24149 17003 59984 101136 9368 917682027 24149 18974 64765 107888 9369 98519202'8 24149 21816 69634 115599 9385 1062142029 24149 23888 74588 122625 9244 1133812030 24149 25975 79625 129749 9277 1204732031 24149 27882 84743 136774 8910 1278632032 24149 29603 89939 143690 9096 134594203.3 24149 31230 95209 150589 9560 1410292034 24149 32823 100552 157524 9866 1476592035 24149 34410 105964 164523 -9069 173593
IV. Sellsitivity Analysis
We conducted two exercises to assess how robust these results were:
1. A AMonte Carlos analysis, with 2,000 runs, to estimate the distribution of the economic rate of return(ERR) and the net present value of the project (10 percent discount rate), given a set of assumptionsabout the distributions of the parameters of the model (such as the impact on mothers' participation inthe labor force).
- 60 -
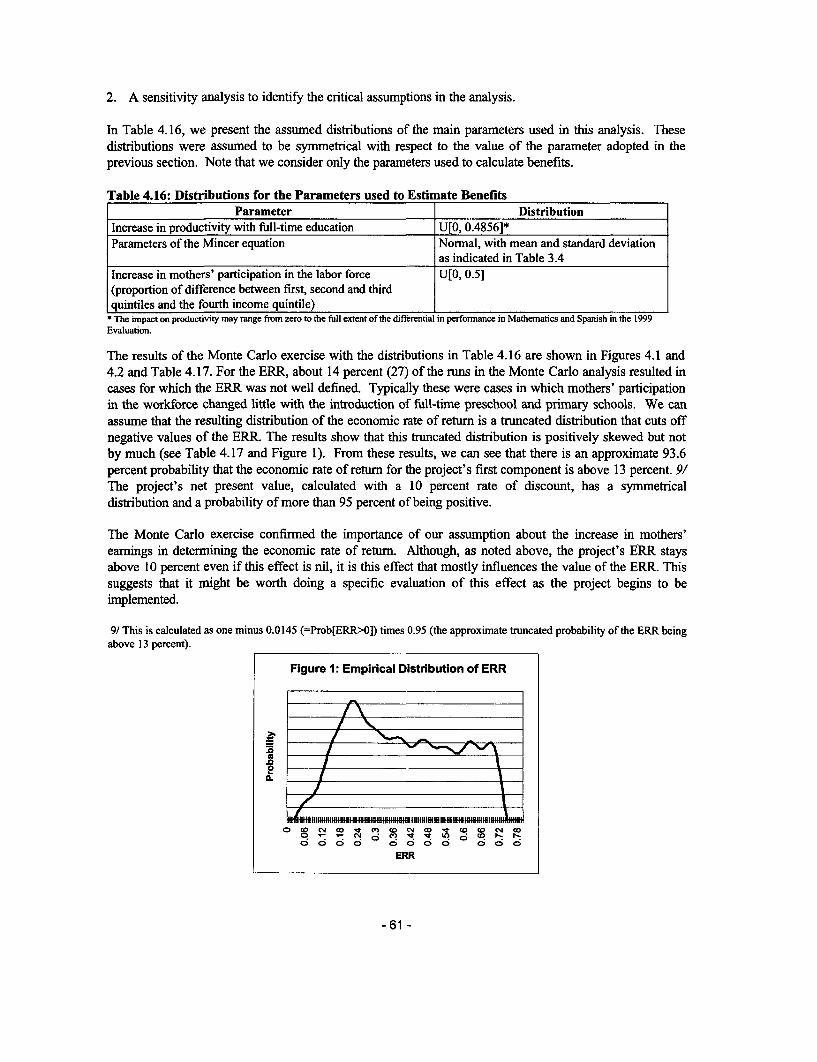
2. A sensitivity analysis to identify the critical assumptions in the analysis.
In Table 4.16, we present the assumed distributions of the main parameters used in this analysis. Thesedistributions were assumed to be symmetrical with respect to the value of the parameter adopted in theprevious section. Note that we consider only the parameters used to calculate benefits.
Table 4.16: Distributions for the Parameters used to Estimate BenefitsParameter Distribution
Increase in productivity with full-time education U[0, 0.48561*Parameters of the Mincer equation Normal, with mean and standard deviation
as indicated in Table 3.4Increase in mothers' participation in the labor force U[0, 0.5](proportion of difference between first, second and thirdquintiles and the fourth income quintile)
* The impact on productivity may range from zero to the full extent of the differential in performance in Mathematics and Spanish in the 1999Evaluation.
The results of the Monte Carlo exercise with the distributions in Table 4.16 are shown in Figures 4.1 and4.2 and Table 4.17. For the ERR, about 14 percent (27) of the runs in the Monte Carlo analysis resulted incases for which the ERR was not well defined. Typically these were cases in which mothers' participationin the workforce changed little with the introduction of full-time preschool and primary schools. We canassume that the resulting distribution of the economic rate of return is a truncated distribution that cuts offnegative values of the ERR. The results show that this truncated distribution is positively skewed but notby much (see Table 4.17 and Figure 1). From these results, we can see that there is an approximate 93.6percent probability that the economic rate of return for the project's first component is above 13 percent. 9/The project's net present value, calculated with a 10 percent rate of discount, has a symmetricaldistribution and a probability of more than 95 percent of being positive.
The Monte Carlo exercise confirmed the importance of our assumption about the increase in mothers'earnings in determining the economic rate of return. Although, as noted above, the project's ERR staysabove 10 percent even if this effect is nil, it is this effect that mostly influences the value of the ERR. Thissuggests that it might be worth doing a specific evaluation of this effect as the project begins to beimplemented.
9/ This is calculated as one minus 0.0145 (=Prob[ERR>0]) times 0.95 (the approximate truncated probability of the ERR beingabove 13 percent).
Figure 1: Empirical Distribution of ERR
OERR
0 C- C> C, CO a C CD CD CD
ERR
- 61 -
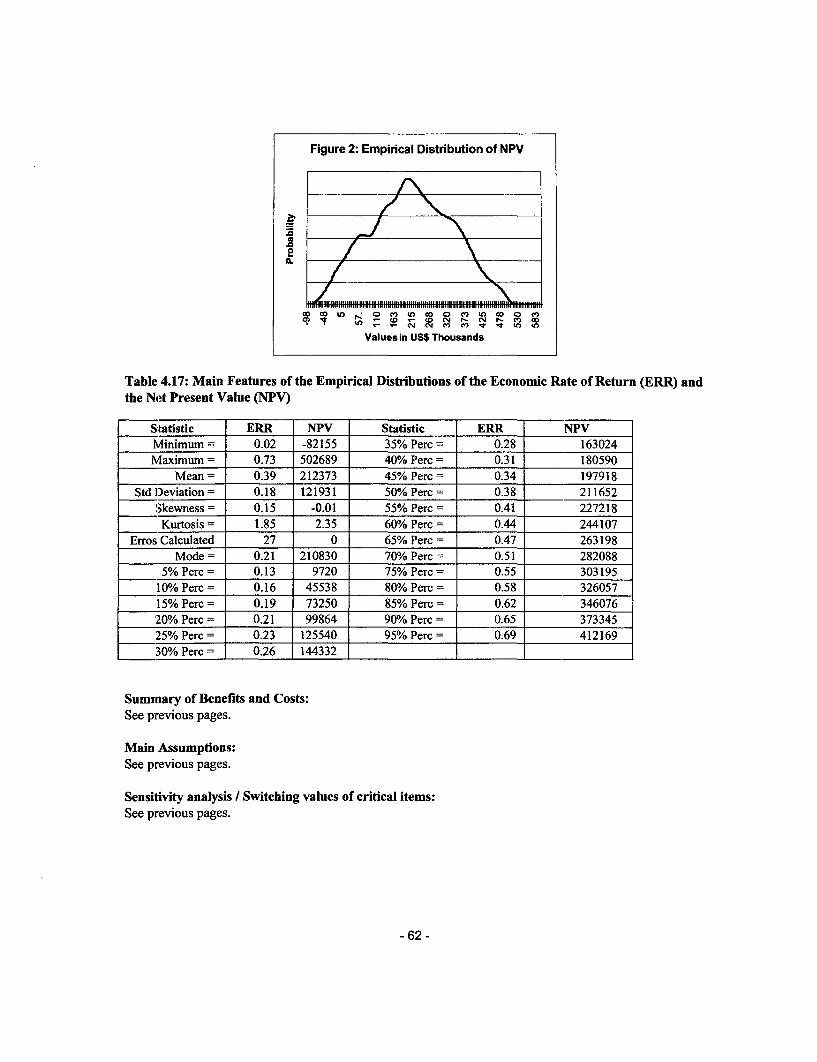
Figure 2: Empirical Distribution of NPV
IL
0 0) U) *s 0 C' ) 0z 0 C' *) 0 0 C'0 t - CD -(O N C N CD 0'- _ N ('4 C') n t It W) U)
Values in USS Thousands
Table 4.17: Main Features of the Empirical Distributions of the Economic Rate of Return (ERR) andthe Net Present Value (NPV)
Statistic ERR NPV Statistic ERR NPVMinimum = 0.02 -82155 35% Perc = 0.28 163024Maximum = 0.73 502689 40% Perc = 0.31 180590
Mean = 0.39 212373 45% Perc = 0.34 197918
Std l)eviation = 0.18 121931 50% Perc = 0.38 211652Skewness = 0.15 -0.01 55% Perc = 0.41 227218Kurtosis = 1.85 2.35 60% Perc = 0.44 244107
Erros Calculated 27 0 65% Perc = 0.47 263198Mode = 0.21 210830 70% Perc = 0.51 282088
5% Perc = 0.13 9720 75% Perc = 0.55 30319510% Perc = 0.16 45538 80% Perc = 0.58 32605715% Perc = 0.19 73250 85% Perc = 0.62 34607620% Perc = 0.21 99864 90% Perc = 0.65 37334525% Perc = 0.23 125540 95% Perc = 0.69 412169
30% Perc = 0.26 144332 _
Summary of Benefits and Costs:See previous pages.
Main Assumptions:See previous pages.
Sensitivity analysis / Switching values of critical items:See previous pages.
-62 -

Annex 5: Financial SummaryURUGUAY: Third Basic Education Quality Improvement Project
Public Expenditures in Education
The education budget is dependent on the overall economic context and, in particular, on the fiscalrevenues, the level of Government expenditure. Between the end of the 1980s and 1998, the Uruguayaneconomy grew and its GDP increased at an annual average rate of 3.8 percent. Since then, the economyhas entered a recession that still prevails. Such evolution was paralleled by a worsening of the publicsector financial public deficit from a low of -0.9 percent of GDP in 1998, to -3.8 percent in 2000.Meanwhile, the financial position of the Central Govermment went from -1.8 percent of GDP to -3.5percent of GDP, respectively.
Despite the reductions in government expenditures, they did not keep pace with the decline in GDP and, asa result, the relative share of central government expenditures in GDP grew from 19.7 percent to 23.9percent between 1996 and 2000.
Table 5.1: Public Sector Expenditure as a Per of GDPYear Consolidated Central Social Social Education
Central Government Expenditures Expenditures ExpendituresGovernrnent Expenditures excluding Social
Expenditures (I) Security1996 29.3 19.7 22.3 4.2 3.21997 29.2 20.4 21.4 3.8 3.21998 31.0 20.7 23.5 4.4 3.31999 32.1 23.3 23.9 4.9 3.52000 31.5 23.9 23.8 4.7 3.5
Source: BCU, INE, and CEPRE-OPP
The central government's transfers to finance the social security deficit continue to represent a significantshare of its expenditures. They currently amount to about 6 percent of GDP, having grown in the past yearas a result of the 1989 constitutional reform that resulted in a real increase in the number of retirees and inthe value of their pensions. Several studies have shown that this component of government expenditure hasa negative impact on equity and does not benefit the poorest segments of the population but only workersfrom the formal sector. According to official projections, once the new system matures, its deficit will besignificantly reduced (1.8 percent of GDP by 2040).
For reasons already mentioned, during the short period that we are considering, there was a moderategrowth in public social expenditures as a percentage of GDP which currently stand at 23.8 percent. Socialsecurity payments represent 83 percent of these public social expenditures, while education, housing, andhealth expenditures represent between 4 percent and 5 percent of GDP. This percentage is extremely lowcompared to other countries of similar income levels in the region such as Argentina and Chile.
Public education expenditures from ANEP, the Public University, and the Ministry of Education andCulture (MEC) increased by a real 2.8 percent, annually, during the period 1996-2000, and the proportionof GDP accounted for by education expenditures slightly increased from 3.2 percent to 3.5 percent.
- 63 -
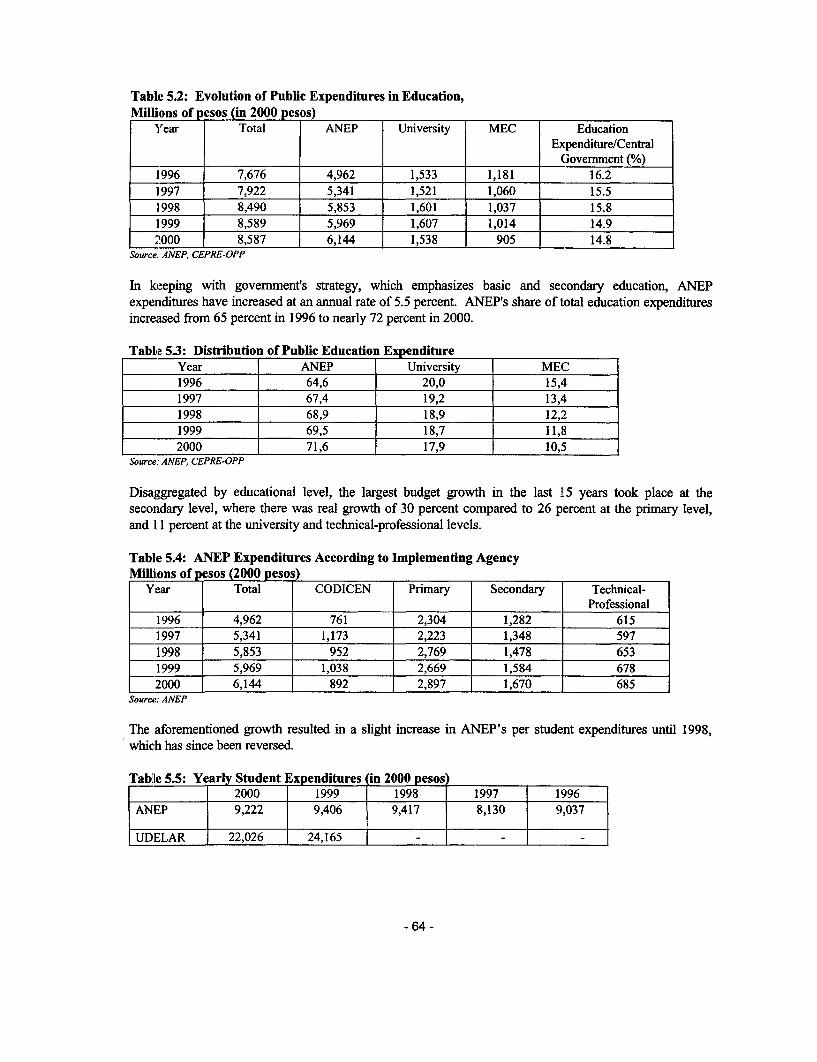
Table 5.2: Evolution of Public Expenditures in Education,Millions of pesos (in 2000 pesos)
Year Total ANEP University MEC EducationExpenditure/Central
Government (%)1996 7,676 4,962 1,533 1,181 16.21997 7,922 5,341 1,521 1,060 15.51998 8,490 5,853 1,601 1,037 15. 81999 8,589 5,969 1,607 1,014 14.92000 8,587 6,144 1,538 905 14.8
Source. ANEP, CEPRE-OPP
In keeping with government's strategy, which emphasizes basic and secondary education, ANEPexpenditures have increased at an annual rate of 5.5 percent. ANEP's share of total education expendituresincreased from 65 percent in 1996 to nearly 72 percent in 2000.
Table 5.3: Distribution of Public Education ExpenditureYear ANEP University MEC1996 64,6 20,0 15,41997 67,4 19,2 13,41998 68,9 18,9 12,21999 69,5 18,7 11,82000 71,6 17,9 10,5
Source: ANEP, CEPRE-OPP
Disaggregated by educational level, the largest budget growth in the last 15 years took place at thesecondary level, where there was real growth of 30 percent compared to 26 percent at the primary level,and 1I percent at the university and technical-professional levels.
Table 5.4: ANEP Expenditures According to Implementing AgencyMillions of pesos (2000 peso )
Year Total CODICEN Primary Secondary Technical-Professional
1996 4,962 761 2,304 1,282 6151997 5,341 1,173 2,223 1,348 5971998 5,853 952 2,769 1,478 6531999 5,969 1,038 2,669 1,584 678
= 2000 6,144 892 2,897 1,670 685Source: ANEP
The aforementioned growth resulted in a slight increase in ANEP's per student expenditures until 1998,which has since been reversed.
Tablle 5.5: Yearly Student Expenditures (in 2000 pesos2000 1999 1998 1997 1996
ANEP 9,222 9,406 9,417 8,130 9,037
UDELAR 22,026 24,165 - -
-64 -

II. The Project's Expected Fiscal Impact
In Table 5.7 we illustrate the net flows of expenditures that will be generated by the implementation ofMECAEP III. These flows consist of:
* Those related to national counterpart pavments that complement Bank disbursements in projectcontracts. These expenditures, which originate from ANEP's budget resources, will occur during theproject implementation period between 2002 and 2007. Counterpart funds can be broken down intotwo components: (i) the amounts - free of taxes - that will be paid by ANEP for the acquisition ofgoods and services and (ii) the indirect taxes that are incurred on some of these acquisitions. Sincethese indirect taxes are merely transfers and do not contribute to the fiscal load, they have beendeducted from the national counterpart payments.
* Servicinn the US$ 42,000.000 loan with Bank taken out to finance the project. Flow estimates werebased on the following repayment terms: (i) five years of grace; (ii) LIBOR 180 days plus 0.55; (iii)0.75 percent annual commitment fee (on the undisbursed loan amount); (iv) up-front fee of I percent ofthe loan value; and (v) 20 semesters of amortization beginning in 2007..
* The recurrent costs induced by the project. These include: (i) the salaries of teachers and principals;(ii) the maintenance of project-generated infrastructure and equipment; (iii) the replenishment of schoolmaterials; and (iv) taxes on salaries. We have not included in our calculations the increase in taxcollections derived from the expected rise in the salaries of students who will benefit from the projectonce they join the labor force. Likewise, we have not accounted for the tax benefits derived from theexpected increase in the number of mothers entering the work force, as estimated in the previoussection.
In order to estimate the evolution of GDP, we have established its absolute value in year 2000 dollars. Tothis base, we have applied an annual growth of 3 percent, which is the average growth rate of GDP over thelast 20 years. To forecast ANEP's budget, we used the annual budget approved by the government for2000-2004, and then assumed a 3.2 percent annual growth rate based on ANEP's budget growth since1980, including projections until 2004.
The project has fiscal implications in the short and long run. The short-run implications essentially consistof the national counterpart to the Bank's financing of the project, in this case of 34.1 percent (for the firstcomponent) of total disbursements. The medium and long-term implications stem from servicing the loan(interest and amortization) and the indirect costs of the project, such as higher salary and maintenanceexpenditures and the replacement of equipment and materials necessary to keep up the quality ofeducational services.
Table 5.7 shows the increase in fiscal expenditures caused by the project. Disbursements of the nationalcounterpart funds dominates in the very short term. However, the fiscal impact of this is mitigated by thefact that 52 percent of this funding consist of taxes to be paid by ANEP on the goods and services to bepurchased as part of the project. These service of the debt contracted with the Bank will be financed out ofANEP's budget. As early as 2006, the project's fiscal imnpact will become dominated by the rise insalaries, which is the predominant effect in the long run, together with disbursements to pay for themaintenance of classrooms and equipment and for the replacement of books, materials, and equipment. 1/
There are two different sorts of fiscal implications to consider. Concerning ANEP's ability to finance theproject, all expenditures matter, including taxes but not including the loan service, which will be paid by
- 65 -

the central govermment. Table 5.7 shows that the project will cause ANEP's expenditures to rise, startingwith UJS$ 429,000 in 2002 and leveling out at around US$ 12 million from 2009 onwards. As a proportionof ASEP's projected budget, these are not large amounts. They are forecasted to rise to 2.0 percent in 2006but will decline afterwards as the budget is forecasted to grow, keeping the fiscal impact constant in realterms.
1/ The fiscal implications for ANEP's budget of replacing materials, books, and equipment is somewhat underestimated by the fact that these costs areassessed net of taxes.
Table 5.6: Fiscal Impact of MECAEP IIIin thousands of dollars)
Componente I: Escuelas de Tiempo Corn leto Total as a % of
National Loan Service Increase in Maintenance Replacement Total Taxes on Anep's 1/ ANEP 2/ GDP
Counterpart salary (excluding salaries Total budget
expenditures taxes)
Year Taxes OtherA B C D E F H=B+C+ G I=H+G I/J H/K
D+E+F +A-C2002 334 95 201 296 429 0.079 0.0012003 1219 794 497 185 31 0 1507 66 2295 0.411 0.0072004 1696 1156 651 1721 133 0 3661 619 5325 0.938 0.0162005 1687 1962 821 3719 266 1 0 6768 1337 8971 1.580 0.0292006 1510 1660 976 5913 400 0 8949 2126 11609 1.977 0.0372007 791 950 3178 7114 516 0 11758 2558 11929 1.965 0.0472008 5168 7830 516 669 14183 2816 11831 1.885 0.055
2009 ' _ 5056 7830 516 883 14285 2816 12045 1.856 0.0542010 4946 7830 516 1078 14370 2816 12240 1.825 0.0522011 4836 7830 516 866 14048 2816 12028 1.734 0.0502012 4725 7830 516 973 14044 2816 12135 1.692 0.048
2013 4615 7830 516 926 13887 2816 12088 1.631 0.0462014 4505 7830 516 1150, 14001 2816 12312 1.606 0.0452015 ' 4394 7830 516 1346 14086 2816 12508 1.578 0.0442016 ' 4283 7830 516 1392 14021 2816 12554 1.532 0.0432017 ' 2100 7830 516 1037 11483 2816 12199 1.440 0.0342018 7830 516 892 9238 2816 12054 1.376 0.0272019 7830 516 595 8941 2816 11757 1.298 0.0252020 7830 516 708 9054 2816 11870 1.268 0.0252021 ' 7830 516 852 9198 2816 12014 1.241 0.0242022 7830 516 1120 9466 2816 12282 1.227 0.0242023 7830 516 1228 9574 2816 12390 1.198 0.0242024 7830 516 1373 9719 2816 12535 1.172 0.0232025 _ 7830 516 1059 9405 2816 12221 1.105 0.022
2026 ' _ 7830 516 1022 9368 2816 12184 1.066 0.0212027 ' _ 7830 516 1023 9369 2816 12185 1.031 0.0212028 ' 7830 516 1039 9385 2816 12201 0.998 0.0202029 _ 7830 516 898 9244 2816 12060 0.954 0.0192030 7830 516 931 9277 2816 12093 0.926 0.0192031 7830 516 564 8910 2816 11726 0.868 0.017
2032 7830 516 750 9096 2816 11912 0.853 0.0172033 . 7830 516 1214 9560 2816 12376 0.857 0.018
2034 __ ' ________ 7830 516 1520 9866 2816 12682 0.850 0.0182035 ______ 7830 516 1361 9707 2816 12523 0.811 0.017
1/ Total excluding loan services
2/ Total excluding taxes
To eslimate the project's impact on the country's overall fiscal accounts, we did not consider taxes, whichare simply an intra-govemment transfer, but we did include the loan service. Using this measure, theproject's fiscal impact on public expenditures will start at US$ 296,000 in 2002, peak at US$ 14.4 millionin 2010, and thereafter decline, leveling out at around US$ 9.7 million after 2020. As a proportion of
-66 -

GDP, the project's fiscal impact goes from 0.001 percent in 2002 to 0.055 percent in 2008 decliningcontinuously after that, to reach 0.017 percent by 2035. These are relatively small figures when comparedto the overall public budget, which in the last five years has averaged 22 percent of GDP.
-67-

Annex 6: Procurement and Disbursement ArrangementsURUGUAY: Third Basic Education Quality Improvement Project
Procurement
Procurement for the proposed project would be carried out in accordance with World Bank Guidelines:Procurement under IBRD Loans and Bank Credits, published in January 1995, (revised January/August1996, September 1997, and January 1999); and Guidelines Selection and Employment of Consultants byWorld Bank Borrowers published in January 1997 (revised in September 1997 and January 1999), and theprovisions stipulated in the Loan Agreement.
Procurement methods. The methods to be used for the procurement described below, and the estimatedamounts of each method, are summarized in Table A.
Procurement of Works. Works to be procured under the Loan and totaling about US$ 31.6 millionequivalent (including contingencies) are the following: construction, transformation, and rehabilitation ofclassrooms for full-time schools. ICB procurement of some US$ 5.9 million is foreseen. Works forclassroom construction and rehabilitation and likely works for the rehabilitation of teacher trainingInstitutes costing less than US$ 3 million, but over US$ 100,000 will be procured through NCB proceduresup to an aggregate amount of US$ 20.9 million. Works costing less than US$ 100,000 will be procuredunder lump-sum, fixed-price contracts awarded on the basis of written quotations obtained from threequalified contractors, up to an aggregate amount of US$ 4.8 million. Small works, costing less than US$5,000 will be procured under Bank-acceptable shopping procedures or direct contracting, up to anaggregate amount of US$ 100,000.
Procurement of Goods
Goods procured under the project may include school equipment and furniture, computing equipment andsoftware, leamning materials, books for classroom and teachers training libraries, and textbooks totalingUS$ 7.4 million. To the extent possible, contracts for goods procured will be grouped into biddingpackages of more than US$ 250,000 equivalent and procured following ICB procedures. Packagescosting less than US$ 250,000 will be procured through NCB procedures up to an aggregate amount ofUS$ 1.3 million. Packages costing less than US$ 50,000 will be procured through national andinternational shopping up to an aggregate amount of US$ 2.0 million. Finally, goods estimated to cost lessthan US$ 5,000 will be procured through Bank-acceptable shopping procedures or direct purchases, up toan aggregate amount of US$ 2.2 million.
Selection of Consultants
Consulting firms and individual consultants will be contracted in the project for the provision of: (i) adiagnosis of the training situation and design the teacher training reform; (ii) the social assessment offull-time schools; (iii) the impact evaluation of the PMEs; (iv) the impact evaluation of the in-serviceteacher training programs; (v) the impact evaluation of the partnership between schools and parentsprogram; (vi) a study of teachers' daily routines; (vii) an evaluation of the MIS system; (viii) an evaluationof pre-service teacher training; (ix) a study of the teaching of Language, Mathematics, and Natural Sciencein primary schools; (x) an impact evaluation of the bilingual education program; (xi) implement MIS forschools; (xii) provide technical assistance to design and implement PMEs and PDEs; and (xiii)architectural, engineering and technical support. These services are estimated to cost US$ 5.6 million.
- 68 -

Consulting services above US$ 200,000 will be procured using Bank's Standard Request for Proposals(RFP) document whenever advertisement for Expressions of Interest in Development Business (DB) isrequired. For consultant service contracts with an estimated price below the threshold of US$ 200,000,standard RFP agreed in advance with the Bank will be used.
Firms:All consulting services with contract values above US$ 100,000 will be procured using Quality-Cost BasedSelection (QCBS) procedure, using Bank RFP. Other consulting services of a routine nature with contractvalues estimated to cost less than US$ 100,000, may be contracted following Least-Cost selectionprocedures, as described in paragraph 3.6 of Guidelines, up to an aggregate amount of US$ 300,000. Theshort-list of consultants for these services, estimated to cost less than US$ 200,000 per contract, maycomprise entirely of national consultants. All terms of reference (TORs) for consulting services in thiscategory would be subject to prior review of the Bank. For contracts valued at more than US$ 100,000,Bank's prior review would apply also to short lists, criteria for selection and contracting documentation.
Individuals:
Specialized advisory or technical assistance and project administration services, including long-term staff inthe Project Coordinating Unit (PCU) would be provided by national and international individual consultantsselected by comparison of qualifications of at least three candidates and hired in accordance of theprovisions of paragraphs 5.1 through 5.3 of the Consultant Guidelines, up to an aggregate amount of US$4.0 million. All TORs would be subject to prior review by the Bank.
Training
The Project will finance training for some 9,000 teachers in the areas of the full-time school model, newtechnologies, the bilingual program, and innovations in teacher training. Staff from ANEP will conduct thetraining, and the financing will cover transportation and activities related to the delivery of trainingseminars and workshops, production and printing of training materials and logistics costs related to housingand subsistence of trainees and trainers. There will be also about 2,600 school staff trained in MIS use. Ifthere is a need to hire a firm and/or individual consultant to be responsible for the logistic arrangements ofthe training, that will be done according to the procedures and contract value thresholds agreed for theprocurement of other consultant's services in the project.
Subgrants
The project will finance Education Improvement Projects - PMEs (school subprojects) designed by schoolteachers, directors, and parents as described in Component 2.2. The execution of each subproject will lastbetween one and two years, and the resources allocated will average US$ 2,100 per subproject up to anaggregate of US$ 2.3 million. Participating schools will follow procurement procedures for smallpurchases and works, outlined above and detailed in the Procurement Manual, satisfactory to the Bank.
Prior Review thresholds. The proposed thresholds for prior review are summarized in Table B.
Capacity Assessment
The PCU for this project is the same as the one that was created for the first education project byResolution No. 57 on February 2, 1994, but with some changes in its administration.
- 69 -

The PCU is directed by a General Project Coordinator and the procurement team is composed of aProcurement Coordinator and a Legal Advisor assisted by a secretary and a staff responsible forestablishing and maintaining the procurement files. The civil-works team (planta Jisica), which comprisesthree architects and a lead engineer, two consultants (as needed), and two assistants (engineering andarchitecture students), works in close relationship with the Procurement Coordinator. There is also anindustrial engineer specialist in educational equipment who works closely with the procurement team andwith the component coordinators involved in educational materials and equipment.
An assessment of the capacity of the PCU to implement procurement actions for the project has beencarried out and sent to the Regional Procurement Advisor on November 29, 2001. The assessmentreviewed the organizational structure of the proposed PCU and the interaction between the ProjectCoordinator, Procurement Coordinator, ANEP, the Tribunal de Cuentas, and CODICEN.
Risk Assessment
An assessment of the capacity of the PCU to implement procurement actions for the project has beencarried out by the Bank. The assessment reviewed the organizational structure of the proposed PCU andthe interaction between the Project Coordinator, Procurement Coordinator, ANEP, the Tribunal deCuentas, and CODICEN. The potential risks identified in the assessment include: (i) delays inimplementing the project due to ANEP/CODICEN slow approval processes; (ii) little PCU authority todisburse funds; (iii) the need to improve procurement filing; and (iv) the need to strengthen theadministrative systems and procurement capacity of the PCU to select and contract consultant firmsaccording to the Bank's Guidelines.
The project preparation team has already presented a detailed plan to address these risks, including: (i)rationalizing control steps in the procurement process; (ii) greater disbursing authority for the ProjectCoordinator; (iii) implementing the new financial and procurement monitoring system and hiring staff tocreate arid maintain the filing system to comply with the Bank's requirements; and (iv) training for PCUstaff, either at headquarters or in neighboring countries.
The overall risk rating for procurement implementation of MECAEP III has been assessed as "Average."
The following is the proposed Action Plan agreed with MECAEP at Negotiations.
ACTION PLANActivities | CompD-tion Dates
PLANNINGCompletion of GPP for the project for the first year of the - By effectivenessproject implementation.Completion of a detailed procurement plan for the first year - By negotiationsof the project implementation.Annual. Procurement Plans - Ongoing. Report to Bank delays above 15
calendar days of agreed procurement schedulePOLICY & PROCEDURES
Preparation of chapter in the Operational Manual (OM) - By effectiveness for Bank's prior reviewregarding (i) procurement covenants, (ii) detailed proceduresfor approval and contracting of all contracts; (iii) detaileddefinition of responsibilities, and (iv) monitoring ofprocurement.
- 70 -
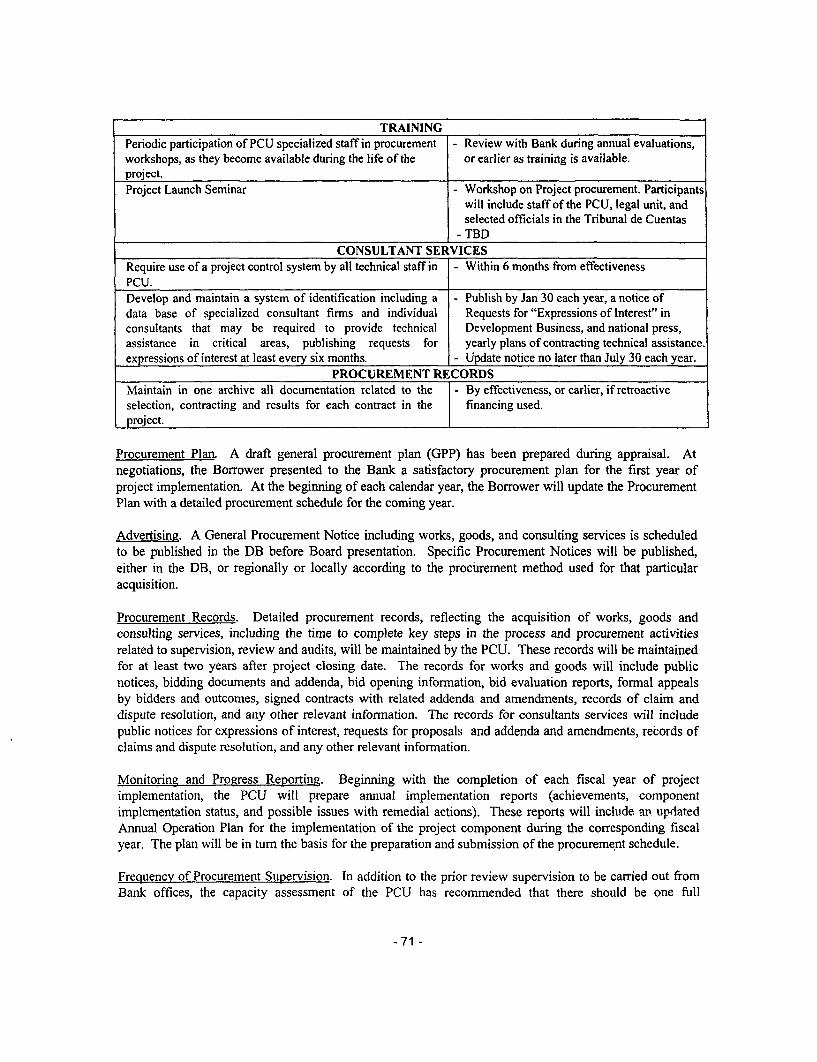
TRAININGPeriodic participation of PCU specialized staff in procurement - Review with Bank during annual evaluations,workshops, as they become available during the life of the or earlier as training is available.project.Project Launch Seminar - Workshop on Project procurement. Participants
will include staff of the PCU, legal unit, andselected officials in the Tribunal de Cuentas
- TBDCONSULTANT SERVICES
Require use of a project control system by all technical staff in - Within 6 months from effectivenessPCU.Develop and maintain a system of identification including a - Publish by Jan 30 each year, a notice ofdata base of specialized consultant firms and individual Requests for "Expressions of Interest" inconsultants that may be required to provide technical Development Business, and national press,assistance in critical areas, publishing requests for yearly plans of contracting technical assistance.expressions of interest at least every six months. - Update notice no later than July 30 each year.
PROCUREMENT RECORDSMaintain in one archive all documentation related to the - By effectiveness, or earlier, if retroactiveselection, contracting and results for each contract in the financing used.project.
Procurement Plan. A draft general procurement plan (GPP) has been prepared during appraisal. Atnegotiations, the Borrower presented to the Bank a satisfactory procurement plan for the first year ofproject implementation. At the beginning of each calendar year, the Borrower will update the ProcurementPlan with a detailed procurement schedule for the coming year.
Advertising. A General Procurement Notice including works, goods, and consulting services is scheduledto be published in the DB before Board presentation. Specific Procurement Notices will be published,either in the DB, or regionally or locally according to the procurement method used for that particularacquisition.
Procurement Records. Detailed procurement records, reflecting the acquisition of works, goods andconsulting services, including the time to complete key steps in the process and procurement activitiesrelated to supervision, review and audits, will be maintained by the PCU. These records will be maintainedfor at least two years after project closing date. The records for works and goods will include publicnotices, bidding documents and addenda, bid opening information, bid evaluation reports, formal appealsby bidders and outcomes, signed contracts with related addenda and amendments, records of claim anddispute resolution, and any other relevant information. The records for consultants services will includepublic notices for expressions of interest, requests for proposals and addenda and amendments, records ofclaims and dispute resolution, and any other relevant information.
Monitoring and Progress Reporting. Beginning with the completion of each fiscal year of projectimplementation, the PCU will prepare annual implementation reports (achievements, componentimplementation status, and possible issues with remedial actions). These reports will include an updatedAnnual Operation Plan for the implementation of the project component during the corresponding fiscalyear. The plan will be in tum the basis for the preparation and submission of the procurement schedule.
Frequency of Procurement Supervision. In addition to the prior review supervision to be carried out fromBank offices, the capacity assessment of the PCU has recommended that there should be one fill
- 71 -

supervision mission per year to visit the field to carry out a review of procurement actions. Based on theoverall risk assessment ("Average"), the post-review field analysis should cover a sample of not less than Iin 10 of the contracts that have been signed.
Procurement methods (Table A)
Table Al: Project Costs by Procurement Arrangements(in US$ million equivalent)
Expenditure Category Procurement Method Total Cost(including
_ . eontingencies)ICB NCB Other N.B.F
1. Works(a) Classroom Construction and 5.93 19.60 4.1 1\a 29.64
Rehabilitation (4.83) (15.98) (3.35) (24.16)(b) IDFs 1.25 0.67 1.92
(0.46) (0.25) (0.71)2. Goods (school firniture, 4.12 1.27 2.01 7.40
computing equipment, (3.21) (0.99) (1.56) (5.76)learning materials)
3. Consultants' Services 5.60 5.60(4.57) (4.57)
4. Training 4.07 4.07(4.07) (4.07)
5. Recurrent Expenditures 4.63 4.63(0.00) (0.00)
6. Subgrants (PMEs) 2.31 2.31(2.31) (2.31)
7. Front-end Fees .42 .42___________ ~(.42) _ _ _ __(.42)
Total 10.05 22.12 19.19 4.63 56.0(8.04) (17.43) (16.53) (0.0) (42.0)
N.B.F. = Not Bank-financed( ): Figures in parenthesis are the amounts to be financed by the Bank loan.
\a: Wrintten quotations from at least three qualified contractors.
Table A2: Consultant Selection Arrangements(in US$ million equivalent)
Expenditure Category Selection Method Total Cost(including
._______ -_____ . contingencies)QCBS LCS Other N.B.F.
A. Firns 1.30 0.30 1.60(1.05) (0.24) (1.29)
B. Individuals 4.00 4.00B._____Individuals ______________ (3.28) (3.28)Total 1.30 0.30 4.00 5.60
(1.05) (0.24) (3.28) (4.57)Notes: SBQC: Selection Based on Quality and Cost
LCS: Least Cost SelectionOther Selection of individual consultants (per Section V of Consultants Guidelines)N.B.F.: NotBank-financed.0: Figures in parenthesis are the amounts to be financed by the Bank loan.
- 72 -

Prior review thresholds (Table B)
Table B: Thresholds for Procurement Methods and Prior Review
Expenditure Contract Value Procurement Contracts Subject toCategory (Threshold) Method Prior Review I
Estimated TotalValue Subject to
________________ Prior ReviewUS$ thousands US$ millions
1. WorksSchool Construction and More than $ 3,000 ICB AllRehabilitation
Less than $ 3,000 NCB All over I million($4.0)
Less than $ 100 3 Quotations none2. GoodsSchool Furniture, More than $250 ICB All ($3.5)Computing Equipment, Less than $250 NCB First each year ($1.0)Learning Materials, Less than $50 Int'l & Nat'l Shopping noneBooks for Libraries,Textbooks3. Consultants' Services- Firms More than $ 200 QCBS, Mandatory All
PublicationMore than $100 QCBS All ($0.20)Less than $ 100 LCS TORs ($0.95)
- Individuals More than $50 Section V All ($1.5)Less than $50 TORs ($3.28)
Total value of contracts $13.43 millionI___________________ subject to prior review: 21%
Overall Procurement Risk Assessment:High
Average XLow
-73 -

Disbursement
Allocation of loan proceeds (Table C)The proposed allocation of proceeds of the loan is shown in Table C. Disbursements would not be made forworks, goods and services which have been procured from ineligible sources or which have not beenprocured according to the Bank's procurement and consultants' guidelines.
Table C: Allocation of Loan Proceeds
Expenditure Category Amount In USS Financing Percentage1. WorksL.a. Classroom construction and 24,165,000 82%
rehabilitationL .b. IDFs 505,000 32%2. Goods (school furniture, computing 5,755,000 78%
equipment, and leaming materials)3. Consultant services 4,570,000 82%4. Training 4,075,000 100%5. Subgrants 2,310,000 100%6. Unallocated 200,000
Total Project Costs 41,580,000Front-end fee 420,000
Total 42,000,000
Financial Manaeement Assessment
Background
This assessment was conducted in accordance with the directive OP/BP 10.02, the Project FinancialManagement Handbook dated February 1999, Assessment of Financial Management Arrangements inWorld Bank-financed Projects Guidelines to Staff dated June 30, 2001, and applicable Bank guidelines.The objective of the assessment was to determine if the PCU supported by ANEP has the capacity toproperly manage and account for all project proceeds and to produce timely accurate and reliable projectmanagement reports for use by management and submission to the World Bank.
The evaluation was performed in Montevideo, Uruguay, initiating discussion meetings December 10 andfinishing December 28, 2001.
The review included: (i) discussions with Government officials; (ii) discussions with the Bank team; and,(iii) a review of documents, financial statements and related administrative processing documentation. ThePCU was assessed during October 2001, and it received Bank administrative support related with financialmanagement covenants up to now.
-74-

Scope
The purpose of the review was to: (i) perform a Financial Management Assessment of the PCU, includingan evaluation of all major components of project financial management, such as structure for internalcontrol, financial reporting, procedures for budget control and a MIS which supports accounting processesand transactions; (ii) provide guidance and technical assistance to PCU on strengthening of existingsub-systems such as the accounting system; and, (iii) agree with the team to an Action Plan (if necessary)for establishing a financial management reporting system and disbursement method.
Executive Summary
Conclusion:
On the basis of the assessment performed, the Financial Management Specialist (FMS) concluded that thePCU under support of ANEP meets the Bank's financial management requirements. The initial visit to theproject took place in October 2001. Thereafter, the FMS continued to provide guidance to projectmanagement up to now.
Project Management Reports (PMRs) will be submitted by compatible computerized system as reportinginformation to monitoring the project implementation by PCU. However the project has decided tomaintain the traditional disbursement method (SOEs).
Summary table of the Risk Assessment
Overall risk: LOW (L)
sk Risk Radn Risk Mitigation Measures
Inherent riskCountry specific LowEntity/project specific: ANEP/PCU Low
Control riskImplementing Entity: PCU Low
Funds Flow: Credit funds Low
Staffing Low If changes occur in staffing before effectiveness,the PCU has to alert the TTL project.
Accounting policies and procedures LowInternal Audit N/AExternal Audit LowReporting and Monitoring LowInformation Systems Low
Findings and conclusion
Finance InformationFinancing Plan (US$m):Source Local Foreign . TotalBORROWER 11.96 2.04 14.00IBRD 33.50 8.50 42.00Total: 45.46 10.54 56.00
- 75 -

Estimated disbursements ( Bank FY/US$m):2003 2004 2005 2006 2007 2008
Annial 6.12 8.10 9.37 9.21 9.20Cumulative 6.12 14.22 23.59 32.80 42.00
Audit compliance. The Basic Education Quality Improvement Project (MECAEP I - Loan 3729-UY,approved on May 3rd, 1994; closed June 30, 2001) and the Second Basic Education Quality ImprovementProject (MECAEP II - Loan 4831 -UY, approved July 6th, 1998), executed by the PCU, are in compliancewith audit covenants.
Flow of funds. The project will receive the funds in Banco Central del Uruguay in a Special Account.ANEP's Director will open a commercial account in the Banco de la Republica Oriental del Uruguay andhe will authorize the certified responsible to sign. The payments, with properly authorizations byCODICEN and ANEP, are submitted by the PCU.
Project financial reporting arrangements. The quarterly financial statements will include the Statementof Sources and Uses of Funds and the Advance Reconciliation Statement (similar to the SA reconciliationstatement). These project financial statements, along with the physical progress and procurement sectionsof the Project Management Reports (PMRs) will be submitted to the Bank no later than 45 days after theend of each reporting quarter.
For Bank purposes, the annual financial statements will include, additionally, the schedule of Statements ofExpenditure (SOEs) presented during the year in support of Withdrawal Applications.
Audit arrangements. Annual project fnancial statements will be audited in accordance with InternationalStandards on Auditing by an independent firm and in accordance with terms of reference (TORs) bothacceptable to the Bank.
The PCU as executing entity will be audited in accordance with Bank TORs of Auditing annually.
The project and entity audit reports will be submitted to the Bank no later than six months after the end ofthe reporting period (which coincides with the calendar year). The Supreme Audit Institution Tribunal deCuentas de la Republica Oriental del Uruguay, is acceptable to the Bank as auditor firm.
Staffing
Project financial management will be undertaken by the PCU (under ANEP support) specialized unit thatsupports development projects in financial/administrative functions (procurement, fund management,recruitment, etc.). The PCU has to inform before effectiveness about any change in the structure showingbelow:
-76 -

Organizational ChartPosition Name ResponsibilityFinancial and Disbursement Officer Ignacio Frechou Financial Management Coordination
Juana Bentos AccountingAccountant Monica FrancaLocal Accountant Eduardo Busnelli Petty Cash and paymentsAssistant I Natalia Techera Consultants monitoring, and trainingAssistant 2 activities; Taxes and general
processing activities with ANEPPatricia Travieso Civil Works monitoring, bank
Assistant 3 reconciliation; payments processing_with ANEP
Accounting Policies and Procedures
Administrative procedures are in place to ensure that financial transactions are made with consideration tosafeguarding project assets and ensuring proper entry in the accounting/monitoring systems. The PCU hasdevelopment the accounting system from Memory Software and it has the capacity to record assets,liabilities and financial transactions of the project, and produce financial statements useful to projectmanagement and meeting IBRD's fiduciary requirements.
Segregation of duties. PCU under ANEP support will channel financial transactions through itsorganizational structure and established procedures, which support an adequate segregation ofprocurement, payment authorization and recording activities. Any given commitment and subsequentexpenditure requires the signatures of the committing (certifying) officer and the verifying (approving)officer, who must be two distinct individuals not in a reporting relationship.
Accounting System
The software Memory will receive the information from different modules related with operations. TheChart of Accounts has at least 20 digits, and it has the flexibility enough to be restructured. It allows toobtain information by components, activities, physical units, or at PCU requirement.
- 77 -

Annex 7: Project Processing Schedule
URUGUAY: Third Basic Education Quality Improvement Project
Project Schedule Planned ActualTime taken to prepare the project (months) 8 9
First Bank mission (identification) 12/03/2000 12/03/2000Appraisal mission departure 11/25/2001 11/25/2001
Negotiations 02/28/2002 02/28/2002
Planned Date of Effectiveness 07/01/2002 __
Prepared by:
Ricardo Silveira and Andrea Guedes, LCSHE
Preparation assistance:
Veronica Jarrin, LCSHE
Bank staff who worked on the project included:
Name SpecialityRicardo Silveira Team Leader/Task Manager, LCSHEAndrea Guedes Task Manager, LCSHEM. Rosa Puech Operations Specialist, Consultant, LCSHEAntonio Pereira Educator, ConsultantArmando Castelar Economist, ConsultantJuan Prawda Lead Education Specialist, Peer Reviewer, LCSHEJacob Bregman Lead Education Specialist, Peer Reviewer, AFTH4Barbara Bruns Knowledge Coordinator, Peer Reviewer, HDNEDValeria Junho Pena Lead Sociologist, LCSEOMariangeles Sabella Council, LEGLAMorag Van Praag Senior Disbursement Officer, LOAELSusana Cirigliano Financial Management Specialist, LCC7CKarla McEvoy Operations Analyst, LCSHEMarta Ospina Procurement Analyst, LCSHEFiona Mackintosh Editor, ConsultantVeronica Jarrin Program Assistant, LCSHE
- 78 -

Annex 8: Documents in the Project File*URUGUAY: Third Basic Education Quality Improvement Project
A. Project Implementation Plan
(under preparation)
B. Bank Staff Assessments
"Aplicaci6n de la Metodologia de Evaluaci6n de la Infraestructura Escolar. El Caso de Uruguay". TheWorld Bank. April, 2001.Evaluaci6n de la Gestion Financiera del Proyecto MECAEP. Oficina Regional de Latino America y elCaribe. Octubre 2001.Financial Management Issues. October, 2001. LCR Regional Office.Economic Analysis of MECAEP III. November, 2001.Uruguay: Procurement Capacity Assessment of the Project Implementation Unit. MECAEP III.November 2001.Procurement Capacity Assessment. Summary of Findings and Actions. November 2001.
C. Other
- "Estudio de Evaluaci6n del Sistema de Adquisici6n y Distribuci6n de Libros de Texto, dentro delComponente de Libros, Textos y Material DidActico de MECAEP III". Centro de Informaciones yEstudios del Uruguay (CIESU). Noviembre 2001.
- Estudio de la Evaluaci6n Social de las Escuelas de Tiempo Completo. Proyecto MECAEP. Noviembre2001.
- Estudio de Evaluaci6n de los Programas de Capacitaci6n en Servicio para Maestros y Directores de lasEscuelas de Tiempo Completo". CIESU, Proyecto MECAEP. Noviembre 2001.
- "Bilingualism. A Rationale for Introducing a Second Language in the Context of Uruguay PublicSchool". Montevideo. October 2000.
- La Formaci6n de Maestros. Problemas y Posibles Soluciones. Agosto 2001. Direcci6n de Formaci6n yPerfeccionamiento Docente. ANEP.
- La Educaci6n Rural Hoy. Octubre 2001. Departamento para el Medio Rural. ANEP."Calculo de los Niveles de Ingreso seguin Contexto Socio-Cultural. Una aproximaci6n a partir de losdatos de la Encuesta Continua de Hogares". Noviembre 2001.
- Informe de Evaluaci6n. Programa de Fortalecimniento del Vinculo Familia, Escuela, Comunidad en lasEscuelas de Tiempo Completo. Periodo de Ejecuci6n Octubre 199- 30 de Septiembre 2000. MECAEP.
- Programa de Apoyo a las Esuelas de Tiempo Completo. Informe 2000. MECAEP.- Proyectos de Ciencias Sociales, Lenguaje, Ciencias Naturales en Escuelas de Tiempo Completo.
MECAEP/ANEP. Abril 2001.- Proyecto de Actividades Recreativas y Expresicas en ETC de Montevideo y Zona Metropolitana como
Espacio de Socializaci6n de Ninos en Situaciones de Pobreza. Instituto de DesarrolloHumano/Asociaci6n Cristiana de J6venes/MECAEP.
- Estudio de Evaluaci6n de hnpacto de la Educaci6n Inicial en el Uruguay. Proyecto MECAEP.Noviembre 2001
- PME: Evaluaci6n de Impacto. Hallazgos Principales del Analisis Cualitativo . Informe diciembre1998. ANEP
- Evaluaci6n Nacional de Aprendizajes en 3er. afio de Educaci6n Primaria. 1998. UMRE, ANEP,
-79 -

MECAEP.- Evaluaciones Nacionales de Aprendizajes en Educaci6n Primaria en el Uruguay 1995-1999. ANEP.
Proyecto MECAEP-ANEP-BIRF. UMRE.- Evaluaci6n Nacional de Aprendizajes en Lengua y MatemAticas 6to anio de Ensenianza Primaria 1999
- SEGUNDO INFORME. Proyecto MECAEP. Junio, 2000.- Esl:imacion de las Necesidades de Infraestructura Fisica. Nivel Primario. Sector urbano. Zona Urbana.
Diciembre 2000. Luis Secco/ANEP.- Estudio de los Factores Institucionales y Pedag6gicos que inciden en los aprendizajes en las escuelas
prirmarias de contextos desfavorecidos en el Uruguay. ANEP. MECAEP.UMRE. 1999.- Estudio del Lenguaje en los Nifios de cuatro afios del Uruguay. Proyecto MECAEP. 1999.- Proyectos en Acci6n. II Edicion. ANEP. 1999.- Pautas de Seguimiento, Asignaci6n y Gesti6n de Recursos Financieros de los PMEs.
ANEP-MECAEP-PME. 1998.- Propuestas para el uso de material didactico. Educaci6n Inicial. ANEP-MECAEP. Junio 1997.- Panorama Social de America Latina. Cepal. 2001- Urmguay - Mainting Social Equity in a Changing Economy. The World Bank. 2001
*Including electronic files
- 80 -

Annex 9: Statement of Loans and Credits
URUGUAY: Third Basic Education Quality Improvement Project06-Feb-2002
Difference between expectedand actual
Original Amount in US$ Millions disbursementsProject ID FY Purpose IBRD IDA Cancel. Undisb. Orig Frm Rev'd
P074543 2002 FOOT& MOUTH DISEASE -ERL 18.50 0.00 0.00 11.07 -7.43 0.00
P070058 2001 PUBLIC SERVICES MODERNIZATION TA 6.00 0.00 0.00 5.79 0.06 0.00
P063383 2000 APL OSE MOD&REHAB. 27.00 0.00 0.00 24.73 -2.27 0.00
P049267 1999 TRANSPORT II 64.50 0.00 0.00 2.47 0.82 0.00
P041994 1999 UY-BASIC ED2 28.00 0.00 0.00 9.49 5.91 0.00
P039203 1997 FOREST PROD.TSP 76.00 0.00 5.00 43.73 48.73 0.00
P008177 1996 POWER TRNMSN & DISTR 125.00 0.00 0.00 69.52 68.02 0.00
P008161 1995 UY-HEALTH SECTOR DEVELOPMENT 15.60 0.00 5.00 2.54 7.54 2.54
P008173 1994 IRRG NAT RES MGMT 41.00 0.00 0.00 0.08 0.08 -1.32
Total: 401.60 0.00 10.00 169.42 121.46 1.22
URUGUAYSTATEMENT OF IFC's
Held and Disbursed PortfolioOCT-2001
In Millions US Dollars
Committed DisbursedIFC IFC
FY Approval Company Loan Equity Quasi Partic Loan Equity Quasi Partic
1985/92 Azucitrus 0.00 0.00 0.00 0.00 0.00 0.00 0.00 0.001995 Consorcio Aerop. 1.87 0.00 4.00 2.73 1.87 0.00 4.00 2.731991 Granja Moro 1.78 0.75 0.00 0.00 1.78 0.75 0.00 0.00
1980/88/96 Surinvest 0.00 0.00 1.93 0.00 0.00 0.00 1.93 0.002001 UMontevideo 5.00 0.00 0.00 0.00 1.50 0.00 0.00 0.00
Total Portfolio: 8.65 0.75 5.93 2.73 5.15 0.75 5.93 2.73
Approvals Pending Commitment
FY Approval Company Loan Equity Quasi Partic
2001 Banco Montevideo 0.00 9.00 9.00 0.00
Total Pending Commitment: 0.00 9.00 9.00 0.00
- 81 -

Annex 10: Country at a Glance
URUGUAY: Third Basic Education Quality Improvement ProjectLatin Upper-
POVERTY and SOCIAL America middle-Uruguay & Carib. Income Development diamond
2000Population, mid-vear (millions) 3.3 516 847 Life expectancyGNI per cupita (Atlas method, USS). 6.000 3,680 4,620GNI (Atlas method, US$ billions) 20.0 1,895 2.986
Average annual growth. 1994-00
Population (%) 0.7 1.6 1.3 GNLabor force (%) 1.2 2.3 2.0 GNI . Gross
per primaryMost recent eatimate (latest year *valable, 1994-00) capita enrollment
Povertv (% of population below national poverty line)Urban population (% of total populatIon) 91 75 76Life exDectancv at birth (Years) 74 70 69Infant mortality (per 1,000 live births) 15 30 28Child main utrition (% of children under ) .. 9 .. Access to improved water sourceAccess to in Improved water source (% of populatIon) 98 85 87IlliteracV (% of population age 15+) 2 12 10Gross primarv enrollment (% of school-age population) 109 113 107 Uruguay
Male 109 106 Upper-middle-income groupFemale 108 105
KEY ECOtiOMIC RATIOS and LONG-TERM TRENDS
1980 1990 1999 2000Economic ratIos"
GDP (USS billions) 10.1 9.3 20.7 19.7
Gross domestic investmentUGDP 17.3 12.2 15.1 13.9 TradeExports of qoods and services/GDP 15.0 23.5 18.0 19.3Gross domestic savinqs/GDP 11.7 17.6 13.9 12.5Gross national savings/GDP 8.1 14.0 12.4 10.8
Current account balance/GDP -7.0 1.8 -2.8 -2.4 Domesc Interest Davments/GDP 1.2 3.4 1.8 2.1 InvestmentTotal debt/GDP 16.4 47.5 36.0 44.6 svnTotal debt %ervlcelexDorts 18.8 40.8 25.3 30.2Present vatue of debt/GDP 36.3Present value of debtexports 179.7
Indebtedness1980-90 1990-00 1999 2000 2000-04
(average annual growth)GDP 0.5 3.4 -2.8 -1.3 2.6 - UruguayGDP per crapita -0.1 2.6 -3.6 -2.0 2.1 - - - Upper-middle-income groupExports of qoods and services 3.9 5.9 -7.4 4.0 4.6
STRUCTURE of the ECONOMY1980 1990 1999 2000 Growth of Investment and GOP (%)
(% of GDP,' 20Agriculture 13.5 8.7 5.4 5.7Industrv 33.7 32.9 26.3 26.0 10
Manufacturing 25.9 26 5 16.0 16.1 o Services 52.8 58.4 68.3 68.3 to ss5 N 97 go
Private consumpton 75.8 70.3 73.1 74.5 .20--General government consumption 125 12.1 13.0 13.0 GDI GDPImports of tioods and services 20.6 18.1 19.3 20.7 -_7D
1980-90 1990-00 1999 2000 Growth of exports and Imports (%)(average erinua/ growth)Agriculture 0.1 2.8 -7.5 -2.6 20
Industrv -0.2 1.1 -5.0 -2.1 I:
Manufactujring 0.4 -0.1 -8.4 -2.4 1Services 1.0 4.6 -1.1 -0.7 N' ''
Private consumption 0.7 5.0 -1.5 -0.5 s General government consumption 1.8 2.1 0.6 -3.5 -10Gross domestic Investment -6.6 6.3 -9.8 -12.7 Expos -Impors,Imports of qoods and services 0.0 9.8 -5.8 -0.9
Note: 2000 data are preliminary estimates.
The diamcnds show four kev Indicators in the country (in bold) compared with Its Income-qroup average If data are missinq, the diamond willbe incomDlete.
- 82 -

Uruguay
PRICES and GOVERNMENT FINANCE1980 1990 1999 2000 Inflation (%)
Domestic prices 50(% change)Consumer prices .. 111.4 5.6 4.8 _0Implicit GDP deflator 54.8 106.8 4.2 3.6 3
20Govemment finance o.(% of GDP, includes current orants) o ,Current revenue .. 16.0 19.4 19.1 95 96 97 98 99 ooCurrent budget balance .. 1.7 -1.4 -2.2 GDP deflator OCPIOverall surplus/deficit .. -0.1 -3.8 -4.0
TRADE1980 1990 1999 2000 Export and Import levels (USS mill.)
TUSo eillions)Total exports (fob) 1,693 2,237 2,295 70.0
Meat .. 422 373 700 .000Veaetables .. 192 354 255 30Manufactures ..f837 981 1.061 3 3.466 2,000
Toal imports (cif.. 1.343 3.357 3.46 1Food .. 95 306 316 2 o0_ Fuel and eneraVy* 219 490 462 . _ _ _ _ _ _ _Capital goods ., 393 1,050 973 o -a 9
ExPort Price Index (1995=100) .. 105 88 90ImportPrice Index (1996=100) .. 115 97 102 *Exports mimportsTerms of trade (1995=100) .. 91 90 89
BALANCE of PAYMENTS1980 1990 1999 2000 Current account balance to GOP (%)
(USS millions)Exports of goods and services 1.526 2,159 3,530 3,680 0
Imoorts of goods and services 2.144 1.675 3.981 4.149Resource balance -618 483 -451 469 -
Net Income -100 -321 -191 -73Net current transfers 9 8 70 66 I '.111Current account balance -709 170 -572 -476 -2
Financing items (net) 827 -109 586 647Changes in net reserves -118 -61 -13 -171 -3
Memo:Reserves Including gold (US$ millions) .. 1.098 2.524 2.695Conversion rate (DEC, local/USS) 9.10E-3 1.2 11.5 12.3
EXTERNAL DEBT and RESOURCE FLOWS1980 1990 1999 2000
(USS millions) Composition of 2000 debt (USS mill.)Total debt outstandina and disbursed 1.660 4.415 7.447 8.796
IBRD 72 359 476 552 A: 552IDA 0 0 0 0 G: 1,917 C:149
Total debt service 299 987 1,059 1,313IBRD 13 70 96 100 i 1 :1,34eIDA 0 0 0 0
ComDosition of net resource flows E:332Official grants 0 0 0 0Official creditors 37 104 252 136Private creditors 190 -192 -112 856Foreign direct investment 290 0 229 195Portfolio equitv -7 108 128 376 F: 4,500
World Bank programCommitments 74 63 93 108 A-IBRD E-BilateralDisbursements 4 51 66 134 B-IDA D- Other multilateral F- PrivatePrincipal repayments 6 43 63 58 C- IMF G- Short-termNet flows -2 8 3 76Interest payments 7 28 33 42Net transfers -9 -19 -30 35
Development Economics 9/21/01
- 83-

Additional Annex 11: Social Assessment of Full Time SchoolsURUGUAY: Third Basic Education Quality Improvement Project
Background
As part of the preparation effort of MECAEP III, the Govenmment conducted an evaluation of the ETCprogram based on qualitative information gathered from directors, teachers, and parents. A researchinstitution (Equipos Mori) conducted the field work and wrote the final report, presented by theGovernment to the Bank prior to appraisal. In addition to the qualitative work, the report also includesresult; from a survey of 900 randomly selected households, conducted to evaluate the degree of informationabout ETCs and how are they perceived. Finally, the analysis took into consideration a desk review of themain bibliography and data concemed with the performance of ETCs.
The main recommendations of the study have been incorporated into project design. Overall, they validatethe existing model and recommend that ETC schools be understood as a new pedagogical model, not asschools for the poor or schools with extended schedules.
Two criteria oriented the selection of schools where the field work took place: location and number ofyears functioning as a full-time school. Twelve schools were included in the evaluation, representing awide array of Uruguayan departments -- Tacuaremb6; Canelones; Colonia; Salt; San Jose; Montevideo;and Treinta y Tres. Some of the schools have had the full-time program since 1992; others began toimplement it in 2000. In total, 34 focus groups were organized with parents and teachers. All groupdiscussions were conducted through a moderator and recorded. Finally, in some schools, directors werealso interviewed.
Key Results
The main conclusions of the study are the following:
* A. slight majority of household members who responded the ETC survey (54 percent) were not awarethat the ETC model existed. There are no significant regional differences regarding the degree ofinformation.
* Of those who had knowledge of the ETC model, the greatest majority evaluate it as good or very good.The model is also appreciated regardless of socioeconomic differences and the level of schooling of theperson responding the survey. Positive aspects of the model highlighted by parents and teachersiriclude: (i) it increases the educational and socializing effects that schools have on children, especiallyin the case of children from disadvantaged socioeconomic backgrounds; (ii) it appears as a "protective"environment in which leaming and socializing can flourish; (iii) it helps tremendously in bringing upchildren and in allowing parents to enter the labor market. For teachers, full-time schools provide adifferent and more satisfactory environment for their professional growth. The main features of thefiull-time school model are enhanced when stakeholders compare these schools to regular schools.
* Significant differences exist in the views about ETC between those from schools established asfiull-time from the start, and others which were transformed into full-time and are still going throughadjustments in their fimctioning. While full-time tends not be an issue in the former group, in the laterone it is a reference to justify anything considered as good or bad that is part of the process ofconversion.
-84 -

* Stakeholders show some degree of dissatisfaction with the fact that the model has yet to beimplemented in full. This is due to a lack of resources to fully finance core aspects of the full-timeschool model, such as aftemoon time at the school, special space needs, or teachers for non-teachingtasks.
* In the schools created as ETC from the onset, a key issue for teachers and directors is to avoid"adverse selection," by controlling the enrollment of more students perceived as difficult sent byregular schools. In those ETCs, teachers mentioned the tendency of regular schools to get rid of the"problematic students" by sending them to the ETC. The category of "problematic student"encompasses two different types: those with learning disabilities and those with bad social behaviors.In summary, teachers perceive these transfers as a deliberate strategy from directors of other schoolsto use the new policy as a pretext to transfer unwanted students from their schools to ETCs.
* As long as ETCs get the reputation of schools for problematic children, there is the inevitable risk thatthey will be stigmatized. The challenge for them is how to avoid the stigma of being a school forchildren with problems and/or a school for the poor. In addition, the stigma may impact the child andworse, trickle down through a fulfilled prophecy of bad social behaviors. The more parents understandthat a new model is in place, the lesser the chances of stigmatizing ETCs.
* The success of ETCs seems to be directly linked to their capacity of projecting a new image of whateducation consists of, rather than an image of "a new place" or "an extended schedule program." If theschool is perceived as only a new place, the novelty extinguishes very rapidly. If it is perceived as onlya longer school day, it becomes confused with previous educational practices. Under these conditions,the challenge is to project a model that contains "differences" rather than "additions."
* In schools partially converted into the full-time model, teachers tended to be less satisfied, and therewas a higher number of problems perceived by them. The coexistence of two models within the samespace is perceived as problematic, with what is mentioned as esquizofrenia institucional. According toteachers in those schools, and differently from what prevails in schools created as full-time from theonset, full-time students and teachers, whose salaries increased accordingly, are seen as privileged incomparison to others.
* Among parents, two models within the same institution is generating a sense of uncertainty. There is afear that the school will revert to a regular school and their new home arrangements will be negativelyimpacted.
* Changing schools from one model to another is also provoking uneasiness with respect to the amount ofadditional resources required. In the schools created as full-time, the question is how to allocateavailable new resources; in the converted ones, the question is how to pull existing resources to face theexpansion. As perceived by both parents and teachers, instead of providing resources as the new tasksare implemented, tasks are defined and then the school needs to run after resources. The study suggestselaborating a strategy to deal with a scarcity of resources. These situations are not likely to arise anyless frequently in the short term. Thus, discussing them openly could be an important way to adjustexpectations to reality and to find solutions that optimize the use of existing resources at the local level.
* Relationships among directors, teachers and parents have greatly improved with the new model. A newkind of director seems to have emerged, more community oriented and, at the same time, morebusiness-like.
- 85 -

* In the short run, the support for the model from parents and teachers is not at risk because of thesystem's novelty and the positive results that it has achieved. Nevertheless, the study warns that, insome groups and areas, uneasiness with the model can develop and have a negative impact on thesupport for the full-time school model. This appears to be case with teachers in full-time schools.There is a gap between teachers' expectations and the reality of the implementation of the full-timemodel in the schools, with no signs of improvement likely in the near future.
* The study recommends taking a look at the potential effects of disseminating information on the modelas an element to generate support for it.
SomeExamples of Teacher's Views on ETC
"In a school offour hours daily, we have to fight against the clock. One does not have time to doanything else than what has been programmed ".
"I like the model because there is time to know the child, gives you more time to dedicate to her and togo beyond and teach also habits. "
"Something else with which I do not coincide is the size of classes. It needs to be smaller than 3students so we can work. "
"One has more tranquility to work with the child because when you have only four hours, one need tospeed Up."
Some Examples of Parent's Views on ETC
"The teacher gives more time to the children."
"She had many problems to integrate in a group. She was ashamed. Now, everyone notices thedifferences, in her way of being. "
"I am happy because I see how happy my girls are happy with the school."
- 86 -

Additional Annex 12: Organizational Charts of theEducation System and ANEP
URUGUAY: Third Basic Education Quality Improvement Project
''SW L~~~~~~~~~
87 -

URUT,&UlAY - 6RG ALNIATZ O -NoAL CHART OP AF.NLP(ORGANIZAC ONDEANEP)
Consejo Directivo CentralDirector Nadonal de oGsnlEducacd6n PObiice Focl6b
DIRECTOR NACIONALlDE EDUCACI6N
n Gubedrcd6n | SubAdcldiAela doi AM
Genra Gwrbeia Gsrand9 Gomfi A| crbGeneral del General de Ganl de F Ltrda
OAr Proamacon PanbwnltfEcon6Io y Prnupuesto y GodUh
AudItorla | Secretarla Fin rn EducatUvnInbema Admebsativa
S8cretar deReascion"
PubDcas

Additional Annex 13: Calculation of Income Levels According to SocioculturalBackground from Data in the Continuous Household Survey
URUGUAY: Third Basic Education Quality Improvement Project
I. Introduction
This report summarizes the results obtained from a comparative analysis two socioeconomic classificationsin Uruguay from two different data basis. The analysis compared data from the Evaluaci6n Nacional deAprendizajes 1/ (the National Achievement Evaluation) and a measurement of household income 2/,specifically per capita income, taken from the 1996 3/ round of the Continuous Household Survey (theEncuesta Continua de Hogares or ECH) conducted by the National Statistics Institute (Instituto Nacionalde Estadistica). From the ECH, we analyzed a sub-sample of households in communities of 900 or morehabitants that in 1996 contained at least one child who was attending primary school. Thus, this sample didnot include households in rural areas or in small populations. This is an important fact to bear in mind as itmeans that the results are not strictly comparable because the learning evaluation included 201 ruralschools that in 1996 had six or more children enrolled in grade six.
1/ National Learning of Mother Language and Mathematics Evaluation, 6th Year of Primary Education - Second report forpublic distribution of results - MECAEP ANEP/BIRF Project's Achievement Evaluation Unit.2/ Income is the variable commonly used as an indicator of poverty (the poverty line).3/ The "contexts" were categorized in 1996, which is why we selected that year.
II. Methodology
In this study, we aimed to replicate the following variables from the data:
(1) the Socioeducational Context Index (the Indice de Contexto Socio Educativo) or SECI.
(2) the Economic Background Index (the fndice de Contexto Econ6mico) or ECI.
We gave each school in both indices a value (on a scale from -100 to 100).
(3) We also constructed a third variable from both indices - a Sociocultural Context variable withfive categories from 1 to 5.
Construction of the SECI Variable
First, we created the "years of mother's education of households in which at least one child attendsprimary schoor, variable (EDUCMADRE). In the Continuous Household Survey, a mother's years ofeducation is calculated from information on the person's age, the maximum educational level reached 4/,the last grade level achieved, and if this level was completed.
The available information did not indicate whether female members of the household were mothers or not.This problem was resolved in the following manner:
(i) Any female household head or the spouse of the household head in households that containedchildren was assumed to be a mother.
(ii) In those households in which there was no female household head or if the household head did not
- 89 -

have a spouse, then the average years of education were calculated for all women wvithin the household whowere o ver 18 years of age (domestic employees were excluded).
(iii) In those households in which there were no women over 18 years of age, then the years ofeducation for the (male) household head were calculated.
Since our intention was to replicate the SECI, we transfomned the EDUCMADRE variable into a scaleindex from -100 to 100 in the following manner:
SECI 5/ = [200(EDUCMADRE - min.)/(max. - min.)] -100
Then, we classified the households into five categories corresponding to the income quintiles constructed inthe reference sample: very low, low, medium, high and very high.
4/ Levels according to the [NE classification: I-Primary, 2-Lower Secondary, 3-Upper Secondary, 4-Technical University,5-Teacher Training, 6-University, 7-Military Institute, 8-Preschool, 9-Other.5/ Min and max refer to the minimum and maximum value of the variable (EDUCMADRE) in the sample.
Constraction of the ECI Variable
The caltegories of "assets within the home" that appears in the Continuous Household Survey do notinclude those items who were exempt from the school census of children in 6th grade, from which thevariable for home equipment was originally constructed 6/. This variable (EQUIP) constructed from theECH quantifies the assets within the home from a selected list and varies from 0 to 8. In the ECI, thisvariable (which varies from -100 to 100) was transformed in the following manner:
ECI = [200(EQUIP - min)/(max - min)] -100
Then the households were classified into five categories according to their income quintiles constructed inthe reference sample: very low, low, average, high, and-very high.
6/ Of the 11 items, "computer", "telephone," and "videogame or similar" do not appear in the ECH questionnaire.
Construction of the Sociocultural CONTEXT Variable
The CONTEXT variable was constructed by crossing referencing the five categories of both indices: 1=very favorable, 2= favorable, 3= average, 4= unfavorable, 5= very unfavorable.
Table I summarizes the ratio of households assigned to each of the 25 possible combinations between theSECI and the ECI. Table 2 shows the sample of households according to their sociocultural context.
- 90 -

Table 13.1: Percentage of Households with Children Attending Primary School according to theSECI and the ECI
ECI lSEC Very Low Low Average High Very High TotalVery Low 7.74 4.24 2.99 1.56 0.96 17.49Low 8.51 5.95 4.91 4.03 2.32 25.72Average 4.09 4.33 4.84 4.86 2.92 21.05High 1.00 2.73 3.13 3.39 3.03 13.29Very High 0.66 1.51 3.01 6.85 10.43 22.46Total 22.01 18.77 18.87 20.69 19.66 100Source: ECH, 1996
Table 13.2: Percentage of Households with Children attending Primary School according to theirSociocultural Context
Very Favorable Average Unfavorable Very Totalfavorable unfavorable
Percentage 10.40 19.20 25.10 24.80 20.50 100Accumulated Percentage 10.40 29.60 54.70 79.50 100.00Source: ECH, 1996.
Table 3 presents the linear correlation coefficient between the per capita income of households and theindices that we constructed. This was both positive and significant, creating an initial result that does notallow us to reject the hypothesis that the SECI and the ECI are positively associated with economichousehold welfare. We reached the same conclusions when using either the Pearson or the Spearman 7/coefficient.
7/ Spearrnan's correlation is used in the presence of ordinal variables.
Table 13.3: Correlation between Household Per Capita Income with the SECI and the ECI
SEC ECIPearson Coefficient 0.472* 0.526*Spearman Coefficient 0.494* 0.681** significance at 1%
Source: ECH, 1996.
Table 4 presents some descriptors for income according to the household's sociocultural context. Averageincome increases from the most unfavorable to the most favorable contexts. Tables 5 and 6 present thedistribution of income for these particular households and for all of the households in 1996.
-91-

Table 13.4: Average Per Capita Income of Households containing Children attending PrimarySchool in 1996 by Sociocultural Background (in Uruguayan pesos)
Mean Median Percentile Percentile Standard Minimum Maximum5 95 Deviation
Venii favorable 5394.16 4403.94 1842.43 12832.29 3596.93 640.99 30437.89Favorable 3232.34 2736.25 1076.45 7138.87 2015.85 78.71 16579.93Average 2102.83 1862.94 1862.94 4346.87 1326.22 0.00 16534.14Unfiavorable 1493.08 1282.17 493.20 3130.58 872.13 86.99 6934.37Very 1067.34 909.66 909.66 2432.99 714.00 57.61 8814.83unfavorable _Tota.l 2299.28 1735.76 559.69 5482.60 2123.20 0.00 30437.89
Source: ECH, 1996.
Table :13.5: Per Capita Income Percentiles for Households containing Children attending PrimarySchool in 1996
Percentile Income Percentile Income5 496.87 55 1881.2710 656.08 60 2046.7615 796.41 65 2225.5820 921.41 70 2480.8725 1044.34 75 2780.6730 1160.30 80 3163.4535 1284.91 85 3639.9640 1424.78 90 4538.4545 1574.38 95 6218.65
= 50 1713.44Source: ECH, 1996.
Table 13.6: Per Capita Income Percentiles for Al Urban Households in Uruguay in 1996(Populations of 900 or more)
Percentile Income Percentile Income5 769.72 55 2992.3810 1042.15 60 3271.7015 1270.75 65 3602.6220 1486.42 70 4014.6925 1688.06 75 4509.1830 1886.69 80 5093.0635 2076.74 85 5931.7940 2277.27 90 7251.9845 2485.49 95 9828.1950 2724.84 _ _ _ _ _ _ _ _ _ _ _ _ _
Source: ECH, 1996.
- 92 -

Elniination of Atypical Observations
In order to correct for the possibility of disturbance in the calculated measures, we eliniinated the "outliers"or atypical observations. The criteria we adopted was to eliminate 1 percent of extreme cases of the threevariables: SECI, ECI, and Income; in other words, for each variable, all observations in the first and lastpercentiles were eliminated 8/. The previous calculations were recalculated for the new sample of 4,192observations.
8/ Four hundred and ninety seven observations (10.6 percent) were excluded. It should be borne in mind that, when notdealing with continuous variables (especially indices), exactly I percent of observations cannot be excluded from the extremesof distribution.
Table 13.7: Correlation between Per Capita Income of Households with the SECI and ECIVariables
SECR ECRPearson Coefficient 0.480* 0.548*Spearman Coefficient 0.468* 0.630** significance at 1%
Source: ECH, 1996.
Table 13.8: Average Per Capita Income in Households in 1996 by Sociocultural Contexts (inUruguayan pesos _
Mean Median Percentile Percentile Standard Minimum Maximum5 95 Deviation
Very favorable 4379.31 3864.82 1773.33 8600.38 2136.18 640.99 11256.27Favorable 3082.58 2696.07 1076.27 6542.33 1715.76 334.47 10682.24Average 2044.83 1853.71 746.30 4140.16 1140.22 335.53 9993.66Unfavorable 1493.32 1289.04 522.62 3075.62 834.36 290.82 6934.37Very 1193.33 967.71 400.25 2456.44 666.49 287.27 5118.96unfavorableTotal 2169.16 1735.76 559.69 5482.60 1598.56 287.27 11256.27
Source: ECH, 1996.
Next, the regression by least squares of Income, with respect to both indices, is presented. The estimate isonly part of a practice of the relation between the indices and Income, but it does not hope to be an efficientapproximation of the parameters to ensure that they make economic sense. Clarification is necessary giventhat a regression of this sort presents the problem that the regressors are non-exogenous, which determninesthe bias in the coefficients estimated by Ordinary Least Squares (OLS).
Both indices proved highly significant; it should be noted that if both indices were strongly correlated(which could be interpreted as both measuring the same thing), the t values would be very low despite thejoint significance of the model.
- 93-

Table 13.9: OLS Estimation of Income for the Whole Sam le with Regard to the IndicesDependent variable: Income Coefficient T valueConstant 1985.924* 65.439SECI 13.327* 20.674ECI 19.270* 28.392No. of observations 4689Adjuasted R2 0.337Statistical F 1189.108
*significance at 1%
Finallv, we adjusted the regression in which the income of households is explained by the "socioculturalcontext" variable. For this purpose, five binary variables were defined for each:
Table 13.10: OLS Estimation of Income with Regard to th Indices, Excluding Extreme ValuesDependent variable: Income Coefricient T valueConstant 1803.753* 71.577SEC 11.526* 20.632ECI 17.769* 29.737No. of observations 4192Adjuasted R2 0.365Statistical F 1202.934
*significance at 1%
Finally, we adjusted the regression in which the income of households is explained by the "socioculturalcontext" variable. For this purpose, five binary variables were defined for each:
CONTEXT i = 1 if the home belongs to context i, and CONTEXT i = 0 in anyother case, where i = 1, 2, 3, 4 y 5.
The estimated coefficients grow monotonically from the quite unfavorable to the most favorable context, aresult verified by the analysis of the mean of income by sociocultural context 9/. The second positiveresult is the elevated R2 (0.78). This result can be interpreted in the following manner: the variableresulting from the combination of both indices, namely, our final "sociocultural context" variable, is a goodexplicative model of household income.
9/ In fact, the regression coefficients are interpreted as a mean of the income for each context.
Table 13.11: OLS Estimation of Income concerning the Context Variables, Excluding ExtremeValues
Dependent variable: Income Coefficient T valueCONTEXT I 4379.305* 67.126CONTEXT 2 3082.578* 70.679CONTEXT 3 2044.825* 54.098CONTEXT 4 1493.317* 38.774CONTEXT 5 1123.334* 23.477No. of observations 4192Adjusted R2 0.78Statistical F 2896.521
*significance at 1%
- 94 -

Figure 13.1: Household Incomeand Sociocultural Context
L2C0D
LtD _O
Rom
6_A
clasiicaio of bA i._ *
The summary of the connection found between the household per capita income and the socioculturalcontext variable is presented in Figure 1. This figure corroborates the relationship between income and theclassification of contexts. Specifically, if we move from the context Very Favorable towards the morecritical contexts, the different measurements of income that decrease monotonically can be appreciated(minimum, maximum, average, first quartile, and third quartile.
- 95 -

Additional Annex 14: Lessons LearnedURUGUAY: Third Basic Education Quality Improvement Project
The design of this project benefited from advice given by peer reviewers about experiences with similaroperations in other countries in the region. A number of studies and evaluation activities of MECAEP Iand II were also commissioned as inputs into the design of MECAEP III.
Lessons learned from a review of textbooks for primary education
Existing textbook procurement and distribution systems have succeeded in providing the majority ofprimary school students with good quality books in time for the beginning of classes. Any deficiencies intextbook distribution were confined to disadvantaged areas, due to unusually high rates of textbookdeterioration and unexpected shifts in migration flows which caused some schools to have excess supply ofbooks while others experience shortages.
These disadvantaged areas overlap those where the full-time schooling model will be adopted aspart of the project. The project will only finance textbook distribution to students in disadvantagedareas enrolled in ETCs and only to cover one full year of operation for each grade, after which timeANEP will cover textbook distribution to ETCs along with the rest of the system.
Textbooks have been further evaluated for their general content as well as for their gender, racial, andenvironmental sensitivity. Preliminary results of this evaluation indicate that the content of textbooks andreading books is generally satisfactory and meets the established national textbook policy ofnondiscrimination and promotion of classroom harmony. However, the evaluation found that the textbooksand reading books: (i) fail to reflect wide national realities outside Montevideo and (ii) do little to single outand promote the achievements of more vulnerable groups, though some effort is clearly made in the area ofenvironmental sensitivity.
Through PMEs, the project will support educational activities to complement textbooks andenhance the sensitivity of students in the areas of environment, public health, gender, and race.
The project's lending for textbooks will be conditional on: (i) a reduction in the number ofpublishing reviews of these textbooks (increasing the number of years between these reviews fromthree to six years) and (ii) the production of supplementary material and teacher training onenvironmental and health education and the dissemination of best practice PMEs dealing withvulnerable groups.
Lessons learned from a beneficiary assessment of ETCs
The student/teacher relationship has been positively affected by ETCs, as the full-time model allowsteachers to do more one-on-one work with students, thus giving them attention and educational support thatis often not available in the households of students from disadvantaged backgrounds as well as developingstronger personal ties between teachers and students with a significant socializing impact. On the otherhand, teachers can feel overwhelmed by the demands placed on them to be both teacher and surrogateparent to these disadvantaged students.
-96 -
To leverage the successes in the new relationship modes between teachers, students, andcommunities, the project will expand the program to strengthen the partnership between schoolsand parents.
Parents of children who attend ETCs recognize that their children learn more and better in ETCs.However, despite the fact that a survey has shown that over 80 percent of the general public has heardabout ETCs, only 50 percent know about the full-tirne school model and only 4 percent identify the modelas an important improvement in education policy. To ensure the political sustainability of ETCs, it isimportant that the population at large recognizes the successes of the model. Therefore, the project willfinance broader dissemination of best practices from ETCs, not only to promote the model but also tointroduce some of its lessons into regular schools.
The ETC model is still not fully operational in all full-time schools. Special workshops have still not beeninstituted in many schools, and in "transformed schools" (in other words, those converted from double tosingle shift schools), school materials are less available than in newly built schools. For many ETCs,"imore time" rather than "full-time" is still the rule.
The ETC model has been evaluated as being superior to a simple expansion of classroom hours.The rate of expansion of the ETC system will depend on ANEP's ability to fully implement themodel in all of the ETCs that are created. This includes not only the provision of the requiredlearning materials but principally the training of all teachers who will teach in the system.
Historically, full-time schools were associated with special needs (for example, children with healthproblems). The fact that ETCs target disadvantaged areas has reinforced this perception. Thus, ETCs areoften viewed with suspicion when they first open but rapidly gain acceptance in the community. It isimportant to allow the mixing of socioeconomic backgrounds in ETCs in order to limit the extent to whichthey are "branded" as special needs schools.
To ensure that ETCs are not perceived as being schools for the poor and/or for deficient students,the project will enforce an average mix of 80 percent of students coming from disadvantagedbackgrounds and 20 percent coming from other backgrounds.
Lessons learned from an assessment of in-service teacher training for ETCs and independentclassroom observations
Teachers are pleased with the class methodology for ETC in-service training; with more involvement of thestudent-teachers in the learning process. Teachers value the courses and want more of them. There is nearunanimity that these high-quality courses have been very important not only in changing teachers'classroom behavior, evaluation practices, education planning, and relations with students outside theclassroom but also in updating teachers' knowledge of the subjects that they teach.
Despite teachers' satisfaction with the training received for the full-time schools mode, ad hocclassroom observations seem to indicate that teaching methodologies are still very traditional andthat teachers are deficient in some of the required contents. A full assessment of classroompractices is planned for the first year of the project and the curricula for teacher training courseswill be adapted to reflect the lessons learned from this assessment.
-97 -

Lessons learned from a workshop on the MECAEP design
The creation of MECAEP as a parallel institution introduced mechanisms that sometimes differed from andinterfered with those established in the directorate of Primary Education as well as with ANEP/CODICEN.The ability of the project team to avoid bureaucratic interference served to expedite the project'simplementation. However, inspectors and teachers had not been consulted enough during the project'sdesign phase and, therefore, felt no ownership of the project. The fact that MECAEP created self-sufficientteams to implement each component exacerbated its distance from other institu.ions, to the point that theteams were not providing even minimal infonnation about the project's progress to the establishededucation institutions. At a point, MECAEP project monitoring began to duplicate the role of inspectors,creating ill feelings in the process.
The feeling of exclusion on the part of important members of the education system confirms theneed to design consultation methods to be used during the project preparation phase and tocontinue the institutionalization of activities throughout the implementation of the project, usingand strengthening existing institutions in the process. This is particularly the case with the PrimaryEducation Directorate. The project preparation team allocated a substantial amount of resourcesto carrying out MECAEP reviews and beneficiary assessments to ensure that the voices of both thedirect and indirect beneficiaries were heard. Some of the activities begun in MECAEP I, such astextbook distribution and PMEs, have already been institutionalized within the Primary EducationDirectorate, and others are now carried out in close coordination with the Directorate. The UMRE(the Educational Results Measuring Unit) has been institutionalized within ANEP.
The Bank will seek assurances that information about the activities under the MECAEP PCUresponsibility is shared with the Primary Education Directorate as well as with ANEP/CODICENand that coordination is institutionalized, where required. The Bank will also seek specificationsand assurances as to CEP and CODICEN's roles in the project's implementation. Theseinstitutional relationships will be specified in the General Operational Manual, which is a conditionof effectiveness.
Lessons learned from a review of the impact of PMEs
The benefits of PMEs go beyond their direct educational impact on students. The entire dynamic of aschool changes while implementing a PME; the relationship between school and community, betweenteachers and students, and among teachers becomes focused on a common project, a common objective.The high level of motivation involved in the implementation of a PME usually influences the entire attitudeof teachers and students. Another highly positive outcome is the introspection required of a school thatmust prepare a development plan in order to bid to have a PME. The preparation of a project is, in itself,the development of a skill, the benefits of which gets passed on to the whole school community.
The relative success of a PME depends on its type. Those that emphasize the participation of thecommunity tend to be more successful than those ones that focus on the relationship betweenstudents and teachers. Even among successful PMEs, there were variations depending on thesocioeconomic area, whether there was community participation, where the school was located (ina rural or urban area), its educational performance, its size, and the leadership shown by thedirector. In every socioeconomic setting, there were some PMEs that were deemed to have had asubstantial positive impact. However, in the sample of schools evaluated, in the review, the PMEsthat had lasting positive effects were all located in disadvantaged areas. In disadvantaged and
- 98 -

average socioeconomic areas, schools where PMEs had been successfully implemented were foundto be positively correlated with academic performance in the last student achievement exaxn.
Since PMEs seem to have a greater and longer lasting impact in disadvantaged areas, the projectwill earmark enough resources to ensure that schools with a predominance of disadvantagedstudents will be more likely to receive PME resources.
Also, given the relative success of environmental education PMEs, the project will finance 100environmental and health education PMEs per year.
Lessons learned from a review of the impact of preschool education
There is a strong impact of preschool education on reducing repetition in the first grade. In disadvantagedareas, first grade repetition is about 45 percent for students who did not attend preschool and 26 percent forthose that did attend. In non-disadvantaged areas, first grade repetition is about 21 percent for those whodid not attend preschool and 8 percent for those who attended.
Under MECAEP III, ETCs will continue to extend full-time education to preschoolers indisadvantaged areas, thus helping to reduce the gap in first grade performance betweendisadvantaged students and the average Uruguayan student.
- 99 -


MAP SECTION


IBRD 19541 R
< ~ ~~ ~~~~~~~~~~~~~~~~~~~~~~~~~~~~ -JOA CAIA
LLJ + s ( tl-l~~~~~~~~~~~~~~~~~~~~~~~~~~~DGES
;9 .( - .i j s \ + _I~~~~~~~~~~~~~~~~~~~~~~~-RPORTS
Cl L: . ;::-1,,,, -)RTS
r~~~~~~~~~~~~~~~~~~~~~~~~~~~~~~~~~~~~~~~~~~ o,-Im-- --- -IT u.- E 9I-.
g _ 0 c-lii ~~~~~~~RIO NECRO / I ! \ | @ > ~~~~~~~~~RESERVOIR, a
I j j~~~~~~~~~~~~~~~~~~~~~~~~~~~i L;- 1. 1 rgr.ga: ...4r
\' ~~~~~~~~~~~~~~~~~~~~~~~~~~~~~~~~~~~~~~~. :;,- 0 C !.^ .orribS7!malr
<;D (ok7nlr dsl'1+|-l ~ ~ ' ~ I It '~ Z : l ' ' > 3 ;N!-h-t--
'I 30 AF 50 t.0"6s ||;'!_EirlSlN. .. PCdrrn CA ,gi,
80~~~~~~~~~~~~~~~~~~~~~~~~~~~~~~~~~~~~~~~~~~~~F F161me ATLAN '