world bank document · changes in market structure/function because intervention indicators,...
TRANSCRIPT
E N V I R O N M E N T
0 Z g ~~~~D E P A R T M E N T rEo.6
PAPERS PAPER NO 066
TOWARD ENVIRONMENTALLY AND SOCIALLY SUSTAINABLE DEVELOPMENT
CLIMATE CHANGE SERIES
Monitoring and Evaluationof Market Developmentin World Bank-GEF
limate Change Projects
*Framework and Guidelines
Eric Martinot
December 1998
Environmentally dnd Socially Sustainable Development The World Bank
-ESSD
Pub
lic D
iscl
osur
e A
utho
rized
Pub
lic D
iscl
osur
e A
utho
rized
Pub
lic D
iscl
osur
e A
utho
rized
Pub
lic D
iscl
osur
e A
utho
rized

i t sGlobal Environment Division
Monitoring and Evaluationof Market Developmentin World Bank-GEFClimate Change Projects
Framework and Guidelines
Eric Martinot
December 1998
The author wishes to thank Charles Feinstein, Shel Feldman, Andres Liebenthal, Ramesh Ramankutty, RobertTaylor, and Ernie Terrado for their comments. Support by the United Nations Development Program and theStockholm Environment Institute is also appreciated. The views expressed herein are strictly those of the author.Papers in this series are not formal publications of the World Bank. They are circulated to encourage thought anddiscussion. The use and citation of this paper should take this into account. Copies are available from the WorldBank's Environment Department, Global Climate Change Unit, Room S-2145.
Acronyms
CFL Compact Fluorescent LightDSM Demand-Side ManagementGEF Global Enviromnent FacilityG(G Greenhouse GasICR Implementation Completion ReportIPP Independent Power ProducerM&E Monitoring and EvaluationMGO Non-governmental OrganizationPAD Project Appraisal DocumentPCD Project Concept DocumentPIR Project Implementation ReviewPPF Project Preparation FacilityPV Photovoltaic

Contents
Executive Summary i
1 Introduction 1
2 Measuring Changes in Markets 3
3 Market Development in the World Bank-GEF Project Cycle 13
4 Monitoring and Evaluation Approaches and Issues 17
5 Project Indicator and Evaluation Examples 23Mauritius Sugar Bio-Energy 24India Alternate Energy 26Sri Lanka Energy Services Delivery 30Argentina Renewable Energy in Rural Markets 32China Renewable Energy Promotion 34Brazil Biomass Power Commercial Demonstration Project 36Thailand Promotion of Electricity Efficiency 38Poland Efficient Lighting 40China Efficient Industrial Boilers 42China Energy Conservation 44
AnnexesAnnex A: Determining Avoided C02 Emissions 45Annex B: Sample Terms of Reference for Project Assessors 47Annex C: Review of Literature on Market Transformation Asssessment 49
Bibliography 55
List of Tables
Table 1: A Framework for Measuring Changes in Markets 6Table 2: Indicator Examples for Physical Changes in Markets 9Table 3: Indicator Examples for Market Structure/Function Changes 10Table 4: Indicators in the Project Logical Framework 11Table 5: Monitoring and Evaluation in the World Bank-GEF Project Cycle 15
Climate Change Series


Executive SummaryThe Global Environment Facility (GEF) strat- to a market, suc:1 as access to information,egy for climate change encompasses three awareness and -ttitudes, capabilities, financ-operational programs that are designed to ing mechanism-v, codes and standards, andpromote energy efficiency and renewable institutional di -iensions of many forms.energy by reducing barriers, implementation Measurement of changes in markets can focuscosts, and long-term technology costs. The on all of these dimensions.goal of projects under these operationalprograms is to catalyze the sustainable devel- Projects can employ three types of indicators toopment of markets for specific technology measure their success: market interventionapplications considered particularly desirable indicators, market development indicators, andfrom a climate-change-mitigation perspective. market sustainability indicators. Market inter-
vention indicators measure the most directGEF projects have both direct and indirect impacts - those that typically occur during aimpacts on markets. Direct impacts occur project (project output indicators) and that willduring the project itself in the form of specific generally be known by the time of the project'sproject outputs. Indirect impacts occur as the completion. Market development indicatorsdirect impacts of the project "ripple out" in reflect a project's indirect impacts (outcome/space and time, or among institutions to affect impact indicators), and significant changes inthe market in a geographically broad, long- these indicators may not be seen until someterm, and/or institutionally diverse manner. years after project completion. MarketIndicators of avoided greenhouse-gas emis- sustainability indicators, which reflect thesions can mark how successfully a project degree to which a developing market isachieved its expected outputs and can promote sustainable without further intervention, takeaccountability of project agencies. But in the even longer to observe and verify. Marketcontext of assessing overall GEF effectiveness sustainability could also be interpreted inin mitigating climate change, direct project terms of the degree of permanence of barrieroutputs are much less significant than indirect removal -whether barriers will reemerge orimpacts and sustainability. not. GEF project evaluation must go beyond
market intervention and also focus on marketIndirect impacts and sustainability are evalu- development and market sustainability.ated by measuring changes in markets. Mea-suring changes in markets is not simple Each of these three types of market changebecause markets have many dimensions. The indicators can measure investments or salesmost common quantitative dimensions of a ("physical changes"), or changes in themarket are sales volumes, investment volumes, institutions, capabilities, knowledge, transac-prices, technical characteristics of products, tion rules, and available goods and servicesnumber and size of market participants that define markets ("market structure/(producers, distributors, financiers, and function changes"). Proxy indicators forservice firms), and purchaser demographics. physical changes can also include energyBut there are also many qualitative dimensions
Climate Change Series i
Monitoring and Evaluation of Market Devlopment in World Bank-GEF Climate Change Projects
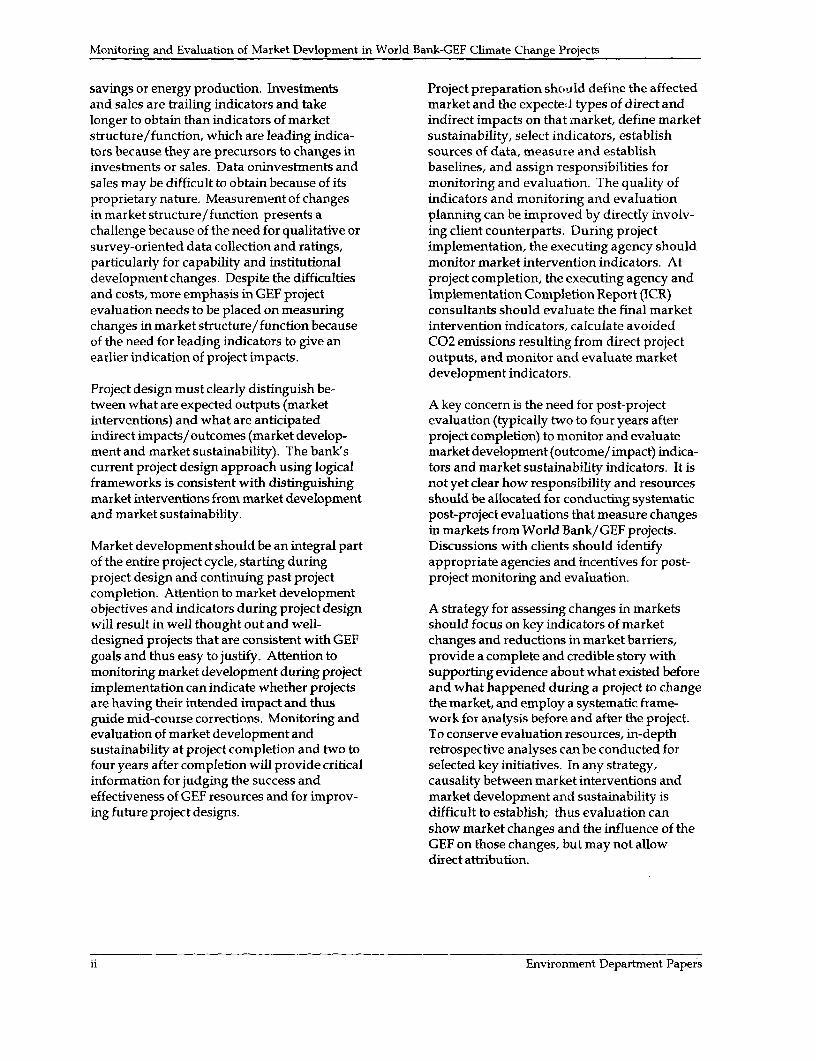
savings or energy production. Investments Project preparation shc.old define the affectedand sales are trailing indicators and take market and the expected types of direct andlonger to obtain than indicators of market indirect impacts on that market, define marketstructure/function, which are leading indica- sustainability, select indicators, establishtors because they are precursors to changes in sources of data, measure and establishinvestments or sales. Data oninvestments and baselines, and assign responsibilities forsales may be difficult to obtain because of its monitoring and evaluation. The quality ofproprietary nature. Measurement of changes indicators and monitoring and evaluationin market structure/function presents a planning can be improved by directly involv-challenge because of the need for qualitative or ing client counterparts. During projectsurvey-oriented data collection and ratings, implementation, the executing agency shouldparticularly for capability and institutional monitor market intervention indicators. Atdevelopment changes. Despite the difficulties project completion, the executing agency andand costs, more emphasis in GEF project Implementation Completion Report (ICR)evaluation needs to be placed on measuring consultants should evaluate the final marketchanges in market structure/function because intervention indicators, calculate avoidedof the need for leading indicators to give an C02 emissions resulting from direct projectearlier indication of project impacts. outputs, and monitor and evaluate market
development indicators.Project design must clearly distinguish be-tween what are expected outputs (market A key concern is the need for post-projectinterventions) and what are anticipated evaluation (typically two to four years afterindirect impacts/ outcomes (market develop- project completion) to monitor and evaluatement and market sustainability). The bank's market development (outcome/impact) indica-current project design approach using logical tors and market sustainability indicators. It isframeworks is consistent with distinguishing not yet clear how responsibility and resourcesmarket interventions from market development should be allocated for conducting systematicand market sustainability. post-project evaluations that measure changes
in markets from World Bank/GEF projects.Market development should be an integral part Discussions with clients should identifyof the entire project cycle, starting during appropriate agencies and incentives for post-project design and continuing past project project monitoring and evaluation.completion. Attention to market developmentobjectives and indicators during project design A strategy for assessing changes in marketswill result in well thought out and well- should focus on key indicators of marketdesigned projects that are consistent with GEF changes and reductions in market barriers,goals and thus easy to justify. Attention to provide a complete and credible story withmonitoring market development during project supporting evidence about what existed beforeimplementation can indicate whether projects and what happened during a project to changeare having their intended impact and thus the market, and employ a systematic frame-guide mid-course corrections. Monitoring and work for analysis before and after the project.evaluation of market development and To conserve evaluation resources, in-depthsustainability at project completion and two to retrospective analyses can be conducted forfour years after completion will provide critical selected key initiatives. In any strategy,information for judging the success and causality between market interventions andeffectiveness of GEF resources and for improv- market development and sustainability ising future project designs. difficult to establish; thus evaluation can
show market changes and the influence of theGEF on those changes, but may not allowdirect attribution.
ii Environment Department Papers
1 IntroductionThe Global Environment Facility (GEF) strategy How should market development be monitoredfor climate change encompasses three operational and evaluated for specific GEF projects? Thisprograms that are designed to promote energy document provides a conceptual framework,efficiency and renewable energy by reducing some practical guidance, and specific projectbarriers, implementation costs and long-term examples to help answer this question. Thistechnology costs. The goal of projects under these document is intended to assist World Bank taskoperational programs is to catalyze the sustain- managers, staff, and consultants engaged in theable development of markets for specific technol- design and implementation of monitoring andogy applications considered particularly desir- evaluation components of climate change mitiga-able from a climate-change-mitigation perspec- tion projects funded by the GEF. The guidelinestive. The basic presumption is that project can also serve as a useful reference for clientinterventions will result in greater and more government agencies, nongovernmental organiza-accelerated replication and adoption of the tions (NGOs), and others involved or interested intechnology applications than would otherwise the design, implementation and evaluation ofoccur. Thus, market development and market climate change mitigation projects.sustainability are at the core of GEF objectives andgoals and require substantial scrutiny before, Section 2 presents a framework for measuringduring, and after project implementation. changes in markets, defines several categories of
indicators, discusses what each type of indicatorGEF project design must clearly distinguish is supposed to measure, and provides a set ofbetween what are expected outputs (market generic indicator examples. Section 3 shows atinterventions) and what are anticipated indirect what point in the project cycle the different typesimpacts/ outcomes (market development and of indicators and monitoring and evaluationmarket sustainability). Early attention in the tasks are relevant. Section 4 discusses severalproject cycle to market development and market issues associated with the design of a monitoringsustainability will result in good project designs and evaluation approach, including trailingthat are consistent with GEF goals. This task is (physical) vs. leading (nonphysical) indicators,straightforward because the bank's logical causality, establishing a project baseline, mea-framework approach to project design facilitates surement sources, selection of monitoring andthe distinction between market interventions and evaluation agencies, and the costs of marketmarket development and sustainability. Addi- assessments. Finally, Section 5 provides a set oftional attention to market development and examples to illustrate the various types of indica-market sustainability later in the projectcycle, for tors and how they fit within the project logicalexample in the post-project phase, will provide framework (Project Planning Matrix). A few of thecritical information for judging the success and project examples are of early pilot-phase GEFeffectiveness of GEF resources and for improving projects that have recently been completedfuture project designs.
Climate Change Series

Monitoring and Evaluation of Market Devlopment in World Bank-GEF Climate Change Projects
(Mauritius, Poland, India, and Thailand); these Further information about GEF programs, Worldexamples also contain illustrative narrative Bank practices for monitoring and evaluation,evaluations of market changes. renewable energy, and energy efficiency can be
found in other existing World Bank and GEFThree annexes follow the text. Annex A discusses documents (see GEF 1996 and 1997; Mosse andgeneral technical considerations for determining Sontheimer 1997; World Bank 1993,1996, 1997a,avoided C02 emissions from projects. Annex B 1997b).gives sample terms of reference for a consultantresponsible for monitoring and evaluating marketdevelopment. Annex C reviews literature that isrelevant to assessing markets changes.
2 Environment Department Papers
2 Measuring Changes In Markets
GEF projects have both direct and indirect will vary spatially - even neighboring regions canimpacts on markets. Direct impacts occur during exhibitquite differentmarketcharacteristics. Thea project itself in the form of specific project most common quantitative measures of a marketoutputs. Indirect impacts occur as the direct are:impacts of the project "ripple out' in space andtime or among institutions to affect the market in a * Sales volumes of the target technology ' -geographically broad, long-term, and/or institu- different groups of purchaserstionally diverse manner. Although traditional * Stock of the target technology alreadyproject performance monitoring usually captures existing among different groups ofdirect impacts, it falls short of understanding how purchasersprojects have a broad, long-term impact on market Prices, technical characteristics, anddevelopment and marketsustainability. In the ' o 'context of GEF projects, indirect impacts are much quality of the target technology availablemore significant than direct impacts in terms of in the marketavoided greenhouse gas emissions; however, i Number, size, and characteristics ofindirect impacts are also more difficult to measure producers, distributors, or service firms inprecisely. The problem of measuring indirect the marketimpacts is fundamentally one of measuring * Demographics and other characteristicschanges in markets. of different groups of purchasers in the
market
The Challenge of Measuring Changes There are also many qualitative measures of a
in Markets market, such as:
Measuring changes in markets is not simple * Accessibility of technology information,because markets are complex phenomena. financing, purchase opportunities (stores,Although no overarching theory or framework catalogs, and maintenance and repairhas become widely accepted yet, research and servicespractice have produced useful insights. Accord- * Awareness of and attitudes towards theing to Feldman (1994), the three key defining target technologydimensions of a market are: (1) the number and * Motivations and incentives to purchasenature of participants, (2) the variety and charac- and install the target technologyteristics of the products and services available, Programs and plans to produce, market,and (3) the rules governing exchanges in the or purchase the target technologymarketplace. These dimensions represent the D ig gydifferent components of a "snapshot" of the Distributors' and dealers' practices formarket for a particular technology application at stocking and promotion of the targetany given time. Changes in these dimensions can technologybe tracked over time to provide a dynamic picture * Momentum of standard practices or habitsof market development. These dimensions also with already-established technology
Climate Change Series 3

Monitoring and Evaluation of Market Devlopment in World Bank-GEF Climate Change Projects
* Skills and capabilities of purchasers to Measuring transaction costs essentially meansassess, choose, specify, and use the target measuring barriers, some of which are created bytechnology the presence of high transaction costs. Feldman
* Skills and capabilities of producers to (1996) explains:
develop, produce, and market the target Increased sales are simply indirect evidencetechnologytechnology. that transaction costs have been
* Skills and capabilities of distributors and tha trnato ot aebereduced... .The effectiveness of market trans-service firms to market and service the formation programs should not be judgedtarget technology only by savings achieved or by surrogate
* Existence of opportunity information like measures such as sales of efficient productsrenewable-energy geographical-resource and services. Instead, evaluation of marketassessments and engineering estimates of transformation programs should also focusenergy-efficiency potential on the identification and measurement of
* Existence and use of standard contrac- transaction costs. Among the transactiontual models (independent-power-pur- costs that can be identified are hassle, lack ofchase contracts and non-negotiable information, and avoidance of risk [concernpower-purchase tariffs) over potential product failure or premature
* Existence and use of financing (dealer or wear-out]. Marketers and analysts canproducer credit, revolving funds, com- readily specify proximate indicators of eachmercial loans) of these costs(p.ii)
* Existence of formal or informal industry Also important to understanding changes incodes of conduct for market actors (anddere of copi .c wit thscds markets is knowing what suppliers of technolo-dExistenee of tcmphancewical h codes)d gies are thinking, the decisions they are making,
* Existence of technical codes and stan- and why. Because of the commercial nature ofdards for the target technology (and such data, however, understanding the supplydegree of compliance with these codes side is more difficult, as Feldman (1995) andand standards) others have pointed out. Still, it is important to
* existence of institutions that allow understand the business plans of suppliers orgroups of individual purchasers to make potential suppliers: how they see the futurecollective decisions (condominium market and how they plan on participating in aassociations) market. Similarly, it is important to understand
* Relevant legal institutions, regulatory the plans and views of financiers, dealers, andframeworks, taxes, duties, and other other market participants. For before-aftermacroeconomic and legal conditions comparisons associated with specific project
interventions, suppliers' views are also key. ForMeasuring changes in markets requires thinking example, in comparison with the preprojectbeyond measuring direct energy savings or situation, do suppliers see a significantly en-energy production. An example of such a change larged segment of potential customers with accessin thinking is occurring for energy-efficiency to nonconcessional finance and continuedprograms in the United States: "Regulators and adequate technical and maintenance supportcorporate managers must totally rethink conven- organizations even in the absence of projecttional [energy efficiency] program designs and interventions? Suppliers' views regarding marketevaluation techniques .... evaluation may not be segments, consumer willingness to purchaseviewed as simply an exercise in counting kWh products or services, banks' willingness to extendbut as a serious examination of the marketplace credit, price trends, after-service networks, andbefore, during, and after program intervention.... It competition are likely to be valuable for anymay be more important to focus on indicators market evaluation.such as dealer stocking patterns than actual kWhsavings" (Saxonis 1997, p.171). Finally, the sustainability of a market means the
sustained adoption of a particular technologyTransaction costs can provide one way to look at application over time up to the technology'schanges in markets, particularly in how transac- economic potential (the top-most point of thetion costs are decreasing or increasing over time.
4 Environment Departrnent Papers

Measuring Changes In Markets
technology diffusion curve; see Annex C). Key to given in Tables 2 and 3. In addition, Section 5measuring whether specific project interventions provides illustrations of indicators for specificresult in sustainable markets is the "market GEF projects under implementation or prepara-response" after a project is completed. Does a tion. Indicators generally can be grouped into themarket return to its prior state? Does it undergo a Project Planning Matrix as shown in Table 4."transient" response for some number of yearsafter the project, or does it continue to grow faster All three types of indicators (market intervention,than would have been the case in the absence of market development, and market sustainability)the project? The type of project could be a factor. can measure different degrees (in space, time, andFor example, if subsidized equipment is sold as a institutions) of "barrier removal." For example aproject intervention and then subsidies are project output might be a pilot financing mecha-abruptly removed, there is likely to be some nism among a certain set of institutions or in atransient response before a "true" market re- specific region of a country, measured by marke,sponse can be observed. If specific institutions or intervention indicators. This project reduces thepractices remain in place after the project, then the financing barrier by demonstrating a viabletransient response is likely to be smaller and the financing mechanism in a specific region orfinal phases of the project and immediate post- among specific institutions. After the project, ifproject period are more likely to reflect the begin- is proven successful, the pilot financing mecha-ning of a "true" market response. nism could be replicated on a larger scale or
among other regions or institutions. Thesechanges would be measured by market develop-
Three Types of Indicators to Measure ment indicators. Finally, the long-termProject Impacts sustainability of such a mechanism (for example,
repayment rates and reinvestment rates of revolv-
We can define three types of indicators to ing funds) or its ultimate viability among othermeasure project impacts: market intervention institutions or regions would be measured byindicators, market development indicators, and market sustainability indicators. At each stage,market sustainability indicators. These indicators the financing barrier is being reduced, but in ameasure three different ranges of "directness" or different way - at a different temporal, geo-"proximity" of market impacts from the project graphic, or institutional proximity and scale(see Table 1). Directness and proximity can be in relative to the original intervention.terms of time, space and/or institutions. Marketintervention indicators measure the closest, most The China Efficient Boilers Project (see Section 5)direct impacts on markets, corresponding to further illustrates the concept of "proximity." Aproject outputs. These impacts typically occur large group of boiler manufacturers was invited toduring the project itself and will generally be participate in a project to upgrade the efficiency ofknown by the time of a project's completion their products. Nine manufacturers were se-Market development indicators reflect a project's lected. Their performance in designing, produc-indirect impacts at project completion or at a ing, and marketing more efficient boiler modelspoint in time after project completion. Signifi- through the project could be measured usingcant changes in market development indicators market intervention indicators. Through replica-may not be seen until some years after project tion and dissemination efforts (especially by thecompletion. Market sustainability takes even Ministry of Machinery), other manufacturers (i.e.,longer to observe and verify. Market those that were involved in the initial projectsustainability indicators measure the "furthest", stages and submitted proposals for participation)sustainaiircty inflncators measurkethe "urthest", would be better able and more motivated tomost indirect influence on markets. Marketuprdanmrktterbirmolsswllsustainability reflects the degree to which a upgrade and market their boiler models as well.developing market is sustainable without further These indirect impacts would be measured byintervention- the degree to which market market development indicators, for examplefunctions are performed by those who profit from through surveys and monitoring of these manu-the market. Another way to think about market facturers. Finally, market sustainability would besustainabihty is the degree of permanence of measured by sustained market share of morebarrier removal -whether barriers will reemerge efficient boilers industry-wide (almost 100or not. Examples of all of these indicators are manufacturers) at a level commensurate with the
economic potential in the Chinese economy.
Climate Change Series 5

Monitoring and Evaluation of Market Devlopment in World Bank-GEF Climate Change Projects
saved through investments by energy-serviceEach of the three types of indicators can measure companies or the quantities of energy producedinvestments or sales ("physical changes") or from installed renewable energy systems. Proxy(often less tangible) changes in the institutions, energy indicators have the advantage of focusingcapabilities, knowledge, and transaction rules attention on measurable outcomes that can bethat underlie markets ("market structure/function specified in contracts and used to promote andchanges"). Physical changes refer to changes in a manage project performance. Proxy energymarket in terms of sales, investments, and other indicators also more closely reflect the perfor-physical consequences of transactions. Market mance of a project in terms of the GEF's strategicstructure/function changes reflect conditions or goal-reducing greenhouse gas emissions. Butcharacteristics of a market that determine what proxy energy indicators "confound" the measure-market transactions occur. Examples include ment of physical changes with other variablesincreases in awareness, changes in perceptions of such as the effectiveness of technology choice andrisks and benefits, adoption of standards, adop- the quality of installations, equipment, or mainte-tion of new contractual models, reductions in nance. Directly measuring sales or investmentscosts, and greater availability of products at and measuring these other variables separatelydealers. provides more inform. non. Proxy energy indica-
tors are also subject tk analytical manipulationPhysical changes in markets (sales and invest- even if they are based upon metered data. Fur-ments) could also be measured by proxy indica- ther, proxy energy indicators take longer to obtaintors of energy use, such as the quantities of energy than sales and investment data because measure-
Table 1: A Framework for Measuring Changes in Markets
Time, Space, and/or Institutional Proximity to Project<<<---Closer --- Further-->
Type of Market intervention Market development Market sustainabilitychange indicators indicators indicators
Physical: Direct investments or sales Indirect investments or sales Evolution over time of* investments supported by the project: not financed or subsidized by investments and sales to a* sales * direct subsidies the project sustainable level appropriate to
* direct financing economic potential* direct financing through
private-sector entitiesMarket Direct results of technical Market participants (i.e., Evolution over time of marketstructure and assistance: producers, dealers, consumers, characteristics thatfunction: * institutional development service firms, financiers): demonstrate market* institutions * enhanced capabilities * number of participants sustainability* capabilities * information dissemination awareness* knowledge new contractual capabilities* transaction mechanisms * perceptions
rules new regulations * plans* types of new codes and standards * decisions
goods and satisfactionservices
Technologies:* prices* characteristics* quality
Basis of market transactions:* contract forms* codes, standards, and
certification* product labeling* other regulations
6 Environment Department Papers
Measuring Changes In Markets
ments must be made over an extended time period changes in addition to physical changes becausebefore results are known. Sales and investment physical changes are "trailing indicators" ofdata are available sooner. Engineering estimates market development; they take longer to appearof "energy savings capacity" installed, although and discem than market structure/functioneven more subject to analytical manipulation, are changes. By contrast, indicators of marketa compromise that provides more immediate data structure/function changes (i.e., reflectingabout energy savings. Finally, investment reduced transaction costs) are "leading indica-volumes are better indicators of financial tors"; they change first and can be reasonablesustainability and the degree to which financing predictors of future market behavior.and credit barriers, which are key barriers inalmost any energy efficiency or renewable energy Below are more detailed descriptions of theseproject, are being overcome. three types of indicators.
Monitoring and evaluation efforts of GEF projectsto-date have focused on market intervention Market Intervention Indicatorsindicators of direct physical changes and theirassociated avoided C02 emissions. Less empha- Market intervention indicators measure thesis has been placed on market intervention specific "forcing" effect that a project has on aindicators of market structure/function changes market. These indicators measure the directand even less on market development indicators consequences of project activities and correspondof both types. One of the reasons for such a to the "project output" level of the Project Plan-historical bias is that market development indica- ning Framework. Generally, the outputs mea-tors are generally more difficult to measure sured are under the control and responsibility of(especially the most intangible ones). This project management. Many of these indicatorssituation should be reversed. Evidence from measure the conditions created by the project thatrecent evaluations of GEF projects has suggested could be thought of as "reduced barriers" for athat projects are having a large impact on market specific group of market actors or in a specificdevelopment indicators (especially in such location in time or space (dissemination andintangible but important aspects of market replication should then reduce barriers for astructure/function as "outlook" of consumers wider class of actors or locations).and producers and the degree to which technolo-gies become "fashionable"). These impacts are Physical changes are hardware installations thatoccurring even through project outputs them- can be directly attributed to the project, which areselves did not occur to the extent expected (espe- generally in one of the following three categories:cially physical changes, like the number of (i) the project procured the hardware; (ii) theinstallations). This experience confirms what project provided financing for installations bymany believe: the main value of direct invest- private-sector developers or energy-servicements or sales in GEF projects is not in the direct companies; or (iii) the project provided directhardware installed (and associated avoided C02 subsidies to producers or consumers.emissions). Instead, the main value of an installa-tion is the degree to which it demonstrates Market structure/function changes reflect projecttechnical, economic, financial, social, institu- outputs in terms of, for example, increasedtional, and/or operational viability of the technol- awareness and capabilities of specific groups orogy and sustainable market mechanisms for its organizations targeted by the project, specificcontinued dissemination. The value of hardware policies or standards enacted, specific financinginstalled in GEF projects also comes from creating mechanisms or credit availability created by thea "critical mass" of market volume to attract project, and demonstrations of new contractualfurther capital, production, demand, and distribu- forms that the project is supposed to develop.tion. It is, however, very difficult to predict the Care should be taken that market interventionlevel of installations required to achieve these indicators are not really implementation progress"demonstration" and "critical mass" effects. indicators. For example, "training conducted" or
even "30 people trained" are more appropriatelyWhen measuring market development, it is implementation progress indicators; marketimportant to measure market structure/ function
Climate Change Series 7

Monitoring and Evaluation of Market Devlopment in World Bank-GEF Climate Change Projects
intervention indicators would be "ratings of ume of equipment produced according tocapabilities of group or organization X" or standards," "increased quality or reliability of"activities Y undertaken by group or organization installations," or "failure, replacement, orX [that demonstrate the desired capabilities]." maintenance rate of installations."
As the degree of adoption of a technology follows
Market Development Indicators the classical technology diffusion curve (seeAnnex C), different "adopter groups" that previ-
Market development indicators measure changes ously resisted doing so may begin to adopt ain the broader marketbeyond direct project technology. Tracking these different groups mayimpacts. Market development impacts are provide a useful indicator of market development.facilitated by the project but are beyond the Adopter groups are categorized as innovators,immediate control of project management and early adopters, early majority, late majority, andthus are considered "indirect impacts." Market laggards (Rogers 1995). Market developmentdevelopment indicators correspond to traditional indicators may also treck different groups ofdevelopment outcome/impact indicators used by market participants (n edia, government agencies,the World Bank and correspond to the "develop- utilites, consumers, producers, developers,ment objective" level of the Project Planning financiers) in differen-. geographical regionsFramework. Mostmarketdevelopmentindicators through five classical technology diffusion stages:measure activity that occurs after the GEF project (1) becoming aware of a technology, (2) becomingis completed although some indirect impacts may persuaded to adopt it 3) deciding to adopt it, (4)occur during the project. Physical changes adopting it, and (5) verifying the validity of therepresent sales or investments that are not directly adoption decision. These types of indicators areprovided, subsidized, or financed by the GEF difficult to measure in practice and require in-project. In a purely private-sector approach, these depth social research, so they are not consideredsales or investments should result from private- in detail here. Nonetheless, an understanding ofsector decisions using private financing in a free- different adopter groups and progression throughmarket environment. However, government or the different diffusion stages may help clarifymultilateral financing, special tax incentives, thinking about indicators and their meaning.subsidies, or parallel projects may continue after aGEF project. It is always a question of interpreta-tion whether market changes represent true Market Sustainability Indicators"market development" or are simply further"market forcing" by other intervenors. Market sustainability reflects the degree to which a
developing market is sustainable without the needMarket structure/function changes measured by for further interventions. There are three key aspectsmarket development indicators do not result to market sustainability indicators: (i) measuringdirectly from a GEF project Common indicators the degree of cost-competitiveness of a technologyare the characteristics of products and services application in the absence of subsidies or special taxoffered in a market, especially prices and costs, treatment (which affects the asymptote of thebut may also may include indicators which technology diffusion curve; see Annex C); (ii)measure the number of producers, dealers, or measuring the degree to which essential marketservice firms in the market; broad plans, percep- fumctions are performed by those who profit fromtions, and awareness of market actors; and the market; and (iii) measuring the sustainability ofchanges in the (either explicit or tacit) rules public-sector institutions (including regulations)governing market transactions (through regula- that provide essential market functions. Anothertions, common contractual forms, standard way to think about market sustainability is to assesspractice, etc.). Care should be taken that market how pernanently barriers have been removed -indevelopment indicators are not really market other words, whether barriers will reemerge or not.intervention indicators. For example, "stan- The removal of barriers can be assessed in terms ofdards enacted" or even "number of suppliers whether information, intermediation, financing,adopting standards" are probably market contractual mechanisms and other "essential"intervention indicators. Market development market functions continue to be provided after aindicators related to standards would be "vol- project ends.
8 Enviromnent Departmnent Papers
Measuring Changes In Markets
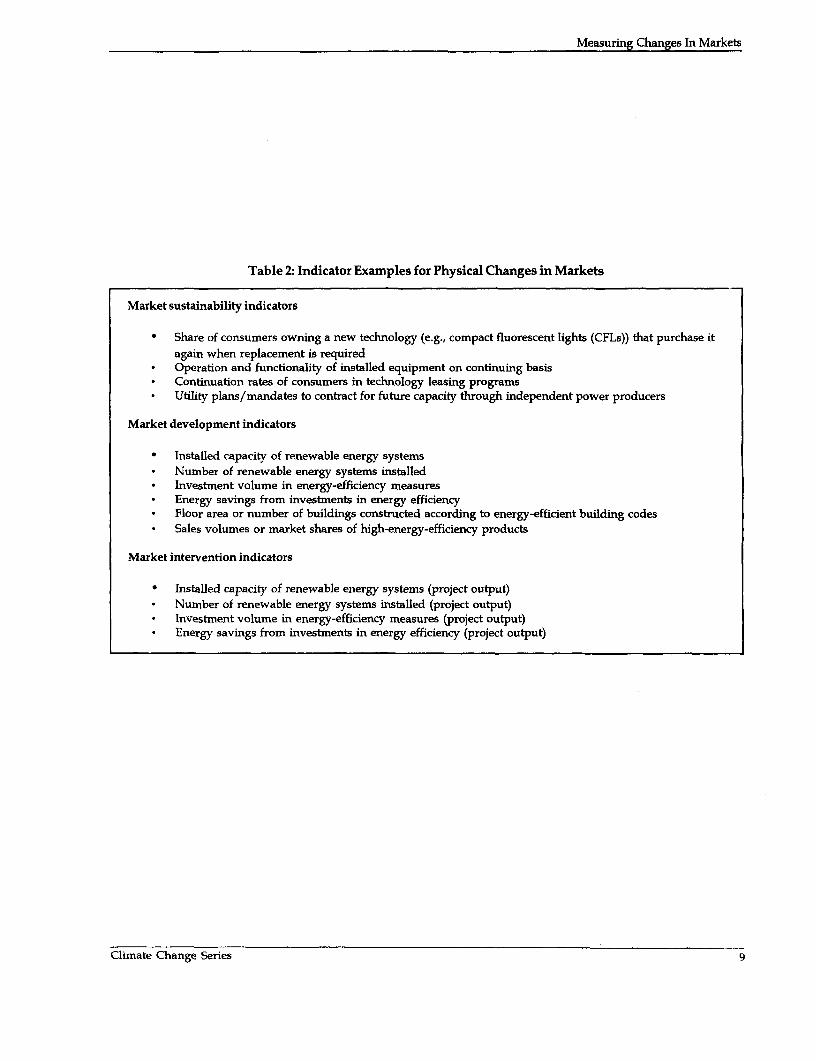
Table 2: Indicator Examples for Physical Changes in Markets
Market sustainability indicators
Share of consumers owning a new technology (e.g., compact fluorescent lights (CFLs)) that purchase itagain when replacement is required
* Operation and functionality of installed equipment on continuing basis* Continuation rates of consumers in technology leasing programs* Utility plans/mandates to contract for future capacity through independent power producers
Market development indicators
* Installed capacity of renewable energy systems* Number of renewable energy systems installed* Investment volume in energy-efficiency measures* Energy savings from investments in energy efficiency* Floor area or number of buildings constructed according to energy-efficient building codes* Sales volumes or market shares of high-energy-efficiency products
Market intervention indicators
* Installed capacity of renewable energy systems (project output)* Number of renewable energy systems installed (project output)* Investment volume in energy-efficiency measures (project output)* Energy savings from investments in energy efficiency (project output)
Climate Change Series 9
Monitoring and Evaluation of Market Devlopment in World Bank-GEF Climate Change Projects
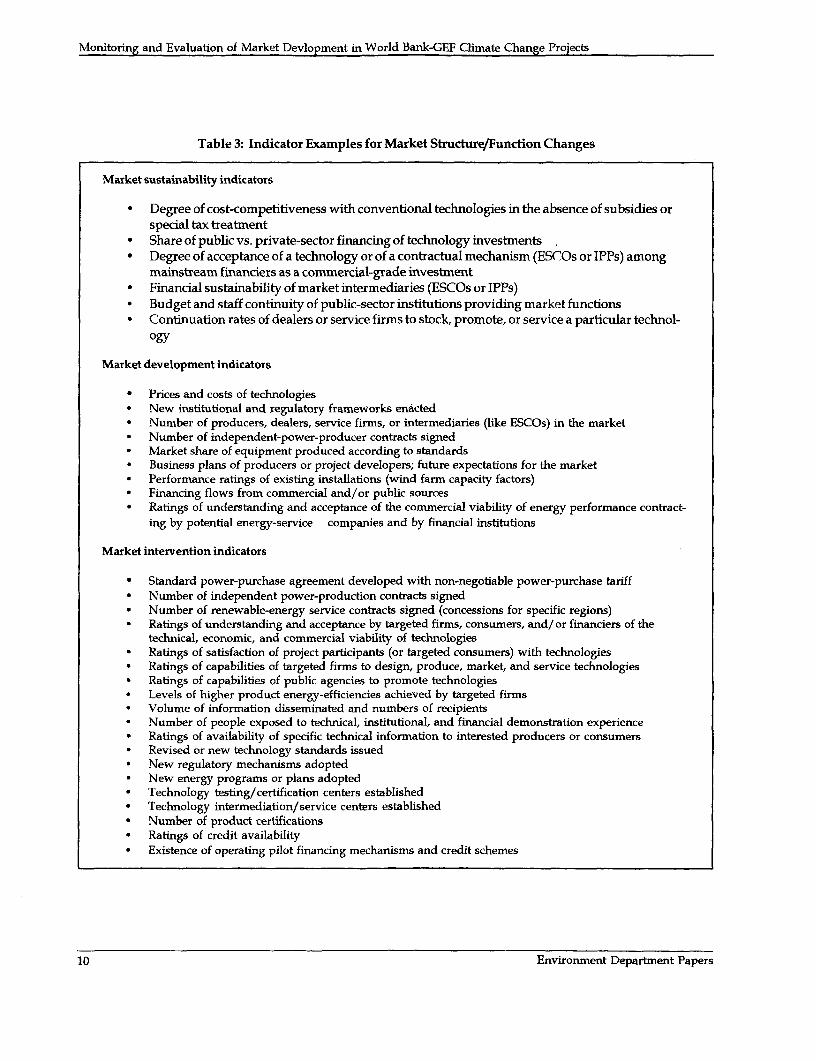
Table 3: Indicator Examples for Market Structure/Function Changes
Market sustainability indicators
* Degree of cost-competitiveness with conventional technologies in the absence of subsidies orspecial tax treatment
* Share of public vs. private-sector financing of technology investments* Degree of acceptance of a technology or of a contractual mechanism (ES('Os or IPPs) among
mainstream financiers as a commercial-grade investment* Financial sustainability of market intermediaries (ESCOs or IPPs)* Budget and staff continuity of public-sector institutions providing market functions* Continuation rates of dealers or service firms to stock, promote, or service a particular technol-
ogy
Market development indicators
* Prices and costs of technologies* New institutional and regulatory frameworks enacted* Number of producers, dealers, service firms, or intermediaries (like ESCOs) in the market* Number of independent-power-producer contracts signed* Market share of equipment produced according to standards* Business plans of producers or project developers; future expectations for the market* Performance ratings of existing installations (wind farm capacity factors)* Financing flows from commercial and/or public sources* Ratings of understanding and acceptance of the commercial viability of energy performance contract-
ing by potential energy-service companies and by financial institutions
Market intervention indicators
* Standard power-purchase agreement developed with non-negotiable power-purchase tariff* Number of independent power-production contracts signed* Number of renewable-energy service contracts signed (concessions for specific regions)* Ratings of understanding and acceptance by targeted firms, consumers, and/ or financiers of the
technical, economic, and commercial viability of technologies* Ratings of satisfaction of project participants (or targeted consumers) with technologies* Ratings of capabilities of targeted firms to design, produce, market, and service technologies* Ratings of capabilities of public agencies to promote technologies* Levels of higher product energy-efficiencies achieved by targeted firms* Volume of information disseminated and numbers of recipients* Number of people exposed to technical, institutional, and financial demonstration experience* Ratings of availability of specific technical information to interested producers or consumers* Revised or new technology standards issued* New regulatory mechanisms adopted* New energy programs or plans adopted* Technology testing/certification centers established* Technology intermediation/service centers established* Number of product certifications* Ratings of credit availability* Existence of operating pilot financing mechanisms and credit schemes
10 Environment Department Papers
Measuring Changes In Markets
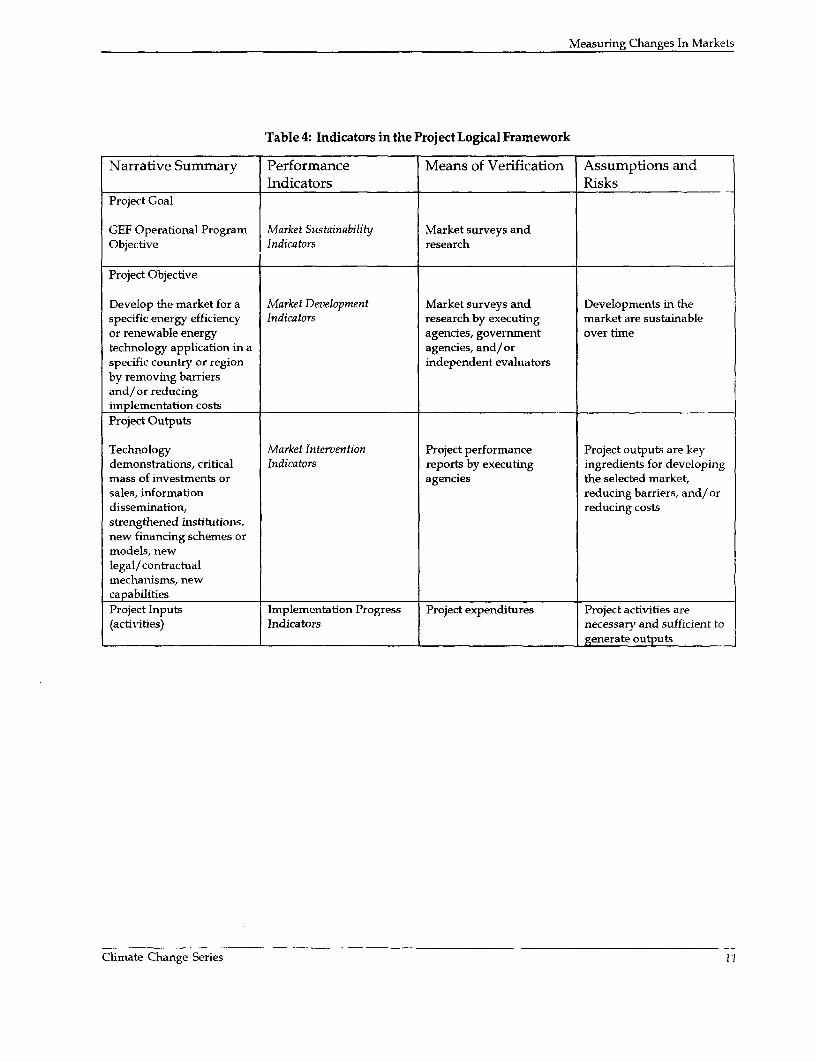
Table 4: Indicators in the Project Logical Framework
Narrative Summary Performance Means of Verification Assumptions andIndicators Risks
Project Goal
GEF Operational Program Market Sustainability Market surveys andObjective Indicators research
Project Objective
Develop the market for a Market Development Market surveys and Developments in thespecific energy efficiency Indicators research by executing market are sustainableor renewable energy agencies, government over timetechnology application in a agencies, and/orspecific country or region independent evaluatorsby removing barriersand/or reducingimplementation costsProject Outputs
Technology Market Intervention Project performance Project outputs are keydemonstrations, critical Indicators reports by executing ingredients for developingmass of investments or agencies the selected market,sales, information reducing barriers, and/ordissemination, reducing costsstrengthened institutions,new financing schemes ormodels, newlegal/contractualmechanisms, newcapabilitiesProject Inputs Implementation Progress Project expenditures Project activities are(activities) Indicators necessary and sufficient to
_ generate outputs
Climate Change Series 11

3 Market Development in theWorld Bank-GEF Project Cycle
Market development should be an integral part The completed Project Appraisal Document shouldof the entire project cycle, starting during project contain all of the above elements in both a narra-design and continuing past project completion. tive form and in a completed Project PlanningAttention to market development objectives and Framework.indicators during project design will result inwell-thought-out and well-designed projects that During project implementation, market interven-are consistent with GEF goals and thus easy to tion indicators should be continually monitoredjustify. Attention to monitoring market develop- and evaluated. Monitoring of market develop-ment during project implementation can help ment indicators during project implementationdetermine whether project outputs are having serves two purposes. The first purpose is to judgetheir intended impact and guide mid-course project effectiveness in meeting GEF goals (typi-corrections. Monitoring and evaluation of cally not necessary before project completion).market development and market sustainability at The second purpose is to assist in executing theproject completion and at some point two to four project effectively and in making mid-projectyears after completion will provide critical corrections. If indirect market changes areinformation for judging the success and effective- expected to occur before project completion andness of GEF resources and for improving future the project budget allows resources for annualproject designs. monitoring of market development indicators,
then project implementation could be enhanced.Table 5 suggests monitoring and evaluation However, it does no good to spend resources tcactivities and relevant indicators for various stages "watch the bread rise" when monitoring atof the project cycle. Activities during project project completion will suffice.preparation should define the market (includingspecific technology applications, geographic At project completion, the project executingregions, or institutions targeted) and the expected agency and ICR consultants should assess thetypes of direct and indirect impacts on that market. final states of market intervention indicators,Activities should also include defining determine avoided C02 emissions resulting fromsustainability, selecting indicators, establishing direct project outputs, and monitor and evaluatesources of data, measuring and establishing market development indicators. If market devel-baselines for all indicators, and assigning respon- opment indicators were not expected to changesibilities for monitoring and evaluation during the during project implementation and thus were notproject. The quality of these activities can be monitored prior to project completion, this may beimproved by involving clients directly in selecting the first time that data are collected for thesespecific indicators that are relevant but also cost- indicators since the baseline was established.effective given existing data sources and availabil-ity. Discussions with government counterparts Because post-project evaluation is necessary toshould also identify appropriate agencies for post- gain a full perspective on project impacts, a keyproject monitoring and evaluation activities and concern is the need for post-project evaluationstructure effective incentives for continued moni- (typically two to four years after project comple-toring and evaluation in the post-project phase. tion) to monitor and evaluate market development
Climate Change Series 13

Monitoring and Evaluation of Market Devlopment in World Bank-GEF Climate Change Projects
(outcome/impact) indicators and market separate line item, including project completionsustainability indicators. It is not yet clear how evaluations and even post-project evaluations.responsibility and resources should be allocated Initial monitoring and evaluation support in afor conducting systematic post-project evalua- project preparation facility (PPF), includingtions that measure changes in markets from training for the executing agency in formulatingWorld Bank/GEF projects. and carrying out the monitoring and evaluation
plan, may also help. Disincentives may also bePost-project evaluation is similar to the impact used. For example, for GEF projects blended withmonitoring program of the Operations Evalua- World Bank financing, the World Bank's normaltion Department (OED). However, the demon- covenant arrangement could be expanded tostration nature of GEF projects calls for increased include noncompliance with monitoring andimportance placed on specifying and guarantee- evaluation requirements as a conditional liabilitying post-project monitoring and evaluation in of borrowers. For stand-alone GEF projects, legalproject design and negotiations. For example, documents can reflect monitoring and evaluationproject implementors may leave after the project requirements as a condition of the grant.is completed, key industry contacts for marketsurveys may change and their replacements may World Bank/GEF staff involvement in projectbe unacquainted with the project or its person- design, preparation, and implementation cannel, or governmental agency restructuring may ensure that monitoring strategies and dataleave the project without a long-term "home" in collection are appropriate and adequate forthe government. Because changes in markets are evaluation of market development anda central concern, preproject baselines must be sustainability. In particular, staff can help ensureestablished and preserved for post-project that useful and appropriate indicators are used,evaluators, so that similar data sources, contacts, that adequate baselines are established before theand measurement methodologies can be em- project, and that data sources and methodologyployed for consistency. are preserved beyond the project life whether
through the executing agency or another party.During project preparation and negotiation,specific incentives and disincentives for executing In any monitoring and evaluation strategy,agencies should be considered to encourage post- several important needs must be balanced andproject monitoring and evaluation (for an ex- addressed: (a) the need for independent andample, see the China Energy Conservation Project unbiased evaluations; (b) the need for data andcase study). Post-project monitoring and evalua- experience that only the project executing agencyhon requirements for the executing agency or may possess; (c) the need for continuity ofclient agencies are probably inadequate if in- evaluation methods arid data sources from projectcluded simply as a disbursement covenant. Once preparation to post-completion phases; (d) theproject disbursements have been made, the Bank need for qualitative data based on surveys andand GEF will lose influence over the executing expert ratings that may be resource- and time-agency. Experience suggests that traditional intensive to obtain; (e) the need for simple andBank measures such as loan covenants are only low-cost monitoring and evaluation activities;partially successful in maintaining ongoing and (f) the need for a strategy that decisionleverage with executing agencies. Projects can makers can easily understand.budget monitoring and evaluation costs as a
14 Enviromnent Department Papers
Market Development in the World Bank-GEF Project Cycle
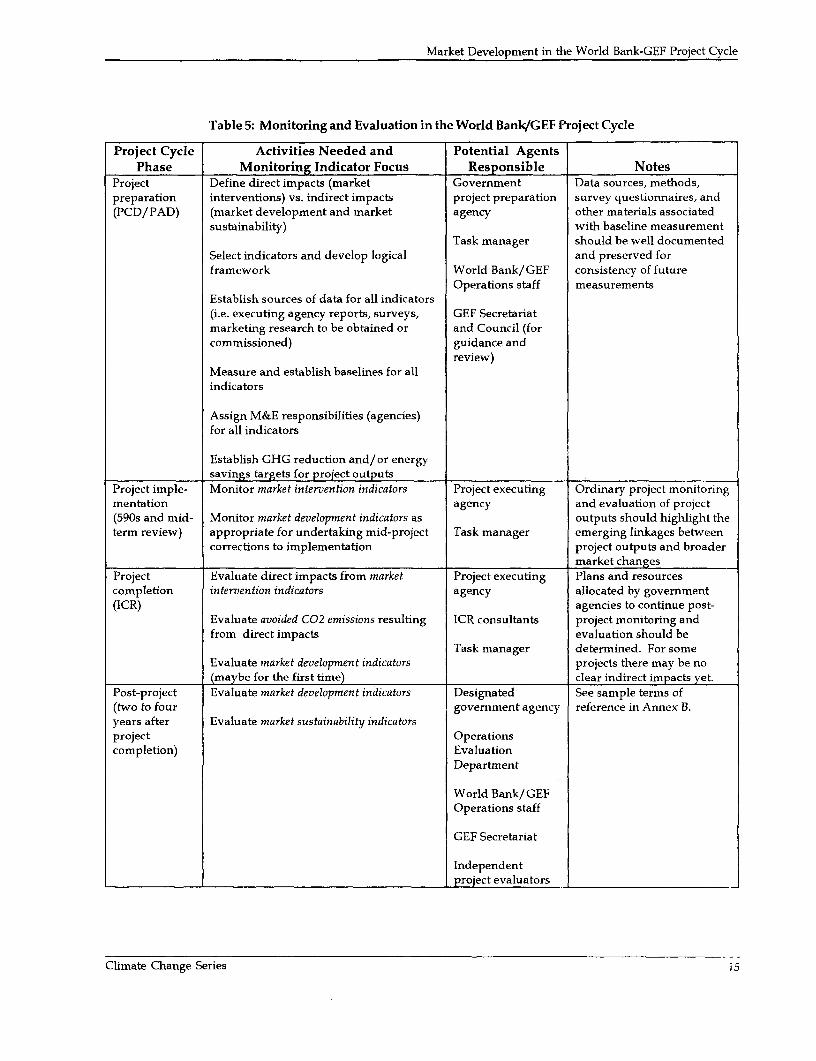
Table 5: Monitoring and Evaluation in the World Bank/GEF Project Cycle
Project Cycle Activities Needed and Potential AgentsPhase Monitoring Indicator Focus Responsible Notes
Project Define direct impacts (market Government Data sources, methods,preparation interventions) vs. indirect impacts project preparation survey questionnaires, and(PCD/PAD) (market development and market agency other materials associated
sustainability) with baseline measurementTask manager should be well documented
Select indicators and develop logical and preserved forframework World Bank/GEF consistency of future
Operations staff measurementsEstablish sources of data for all indicators(i.e. executing agency reports, surveys, GEF Secretariatmarketing research to be obtained or and Council (forcommissioned) guidance and
review)Measure and establish baselines for allindicators
Assign M&E responsibilities (agencies)for all indicators
Establish GHG reduction and/or energysavings targets for project outputs
Project imple- Monitor market intervention indicators Project executing Ordinary project monitoringmentation agency and evaluation of project(590s and mid- Monitor market development indicators as outputs should highlight theterm review) appropriate for undertaking mid-project Task manager emerging linkages between
corrections to implementation project outputs and broadermarket changes
Project Evaluate direct impacts from market Project executing Plans and resourcescompletion intervention indicators agency allocated by government(ICR) agencies to continue post-
Evaluate avoided C02 emissions resulting ICR consultants project monitoring andfrom direct impacts evaluation should be
Task manager determined. For someEvaluate market development indicators projects there may be no(maybe for the first time) clear indirect impacts yet.
Post-project Evaluate market development indicators Designated See sample terms of(two to four government agency reference in Annex B.years after Evaluate market sustainability indicatorsproject Operationscompletion) Evaluation
Department
World Bank/GEFOperations staff
GEF Secretariat
Independentproject evaluators
Climate Change Series i5


Monitoring and Evaluation4 Approaches and IssuesThe lesson so far from market transformation in measure the market response over time to athe United States is to use a four-part strategy to reduction in barriers and thus require measure-assess the impacts of market transformation ment over extended time frames. Marketprograms: (1) focus on indicators of market structure/ functien indicators, in contrast, maychanges and reductions in market barriers; be easier to obtain and are considered leading(2) provide a complete and credible story with indicators because they are precursors tosupporting evidence about what existed before changes in investments or sales. Many argueand what happened during the project to that market structure/function indicators arechange the situation; (3) use a systematic reasonable proxies for investments or sales if aframework for analysis before and after the strong case can be made that market structure/project; and (4) conduct in-depth retrospective function changes reflect a reduction in the keyanalyses for some initiatives. barriers that inhibit markets. Measuring market
structure/function changes also has the advan-There are six key issues associated with such a tage of being directly related to project activitiesstrategy: (1) whether to measure physical or (because these changes are sometimes directstructure/function changes in markets; project outputs or closely tied to project out-(2) whether and how to explicitly assess causal- puts) and thus more easily measurable atity; (3) how to establish a project baseline; (4) project completion. Indirect physical changeswhat sources of data to use; (5) how to assign may require measurement some years aftermonitoring and evaluation responsibilities; and project completion.(6) what costs to budget for retrospective analyses.These issues are elaborated below. If indicators measure physical energy consump-
tion or production, the monitoring and evaluationplan and project budget should consider the
Measuring Physical vs. Market issues associated with such measurements, such
Structure/Function Changes as: measurement technology; cost versus accu-racy of the approach; ability of local staff to
All of the indicators discussed in the previous conduct measurements and maintain and servicesection could be used to measure market measurement instruments; cost of spares andchanges, depending upon the market, sophisti- regular maintenance, including calibration costscation of approach desired, and the resources for equipment; and labor and institutionalavailable. Measuring physical changes, such support costs (see also World Bank 1994). Properas from sales data, may provide a more credible maintenance of monitoring equipment is one ofestimation of market changes than will be the primary problems in these types of monitoringprovided by measuring market structure/ programs. For dependable data from precisefunction changes. But sales data often lag by a monitoring equipment, maintenance and calibra-number of years and are sometimes difficult or tion must be carried out regularly, in many casesimpossible to get from producers or dealers who as often as every three months. Experienceconsider these data proprietary. Sales and suggests that problems often emerge that shouldinvestments are trailing indicators because they be anticipated in early supervision missions, such
Climate Change Series 17

Monitoring and Evaluation of Market Devlopment in World Bank-GEF Climate Change Projects
as specification of monitoring equipment, inter- other intervening factors can be identified andvals at which data should be collected, and the analyzed to account for or discount theirrecording medium to be used. contribution to changes in the indicators (e.g.,
bilateral technical assistance or multilateralfinancing, government policies or programs,
Causality private-sector marketing or sales campaigns,new product development and investment by
The problem of assessing causality - the degree to the private sector, and nongovernmentalwhich observed changes in indicators were due to organization activities).the project- is complex. The farther removed inspace, time, or institutions from the project the Without a requirement for causal attribution,observed changes are, the more difficult it is to market development indicators can simply beattribute them to the project. Although it may be compared to expected market trends or fore-relatively straightforward to relate measurements casts. These expectations might be formulatedof some market development indicators back to to include larger programmatic efforts thatthe project if there are clear linkages and no might involve multiple donors, governmentconfounding or competing influences, attribution policy changes, the private-sector, and NGOs.of other changes in market development indica- In this case, no credit may be attributed totors may be considerably less exact and subject to individual projects; instead, success would bechallenge. Nevertheless, causal attribution could attributed to the overall programmatic effortbe attempted on a selected basis as part of sophis- and the combination of contributions fromticated monitoring and evaluation strategies. multiple projects and factors.
The most sophisticated strategy is to establishcomparison groups. This has been attempted Establishing a Project Baselinewith some success in the United States by com-paring market changes in one state that imple- Market development indicators must be evaluatedments an energy-efficiency program against the against a baseline that describes what would bemarket in another state without such a program. expected to occur in the absence of a GEF project.But even in this case, the "spill-over" from one A baseline should be established for all indicatorsstate to another can be substantial, as experience prior the start of a project. This baseline shouldand ideas are disseminated through national include future projections for the "without-forums. U.S. states are similar in economic, social, project" scenario to the extent possible. Suchand political conditions, which eliminates some projections may come from existing marketsources of comparison bias; however, such surveys that measure expectations or plans ofcomparisons are more problematic among the market participants or from analyses conducteddeveloping countries and countries in transition by government, industry, or independent researchin which the GEF operates because of the wide groups. Indicators measured at project comple-variety of socio-economic conditions. tion and then two to four years after project
completion can be compared with the baseline.Surveys can also be taken of market partici- Consistent methods and sources must be used topants. Surveys can ask participants to rate the establish the baseline and to measure indicatorsdegree to which specific decisions they have later. Different approaches could apply tomade have been influenced by project outputs. different types of projects, such as projects forThis technique is called "self reporting." consumer markets (CFLs, solar home systems),Although the validity of self-reporting has industrial markets (boilers, wind turbines),been questioned, this strategy has been used innovative delivery mechanisms in target marketsextensively in utility demand-side manage- (private-sector ESCOs), and specific sectoralment (DSM) programs in the United States. applications (energy-efficiency measures in aOther evidence should be presented to support specific industry).self reporting and provide plausible argu-ments showing how changes in indicatorsresulted from the project outputs. Finally,
18 Environment Department Papers

Monitoring and Evaluation Approaches and Issues
Many aspects of the baseline may be described in experience, and manpower need to be quantified.the Project Appraisal Document (PAD) and other Three aspects of capacity are particularly imporsupporting documents, particularly in the tant to document: (i) the agency's human re-discussion about current barriers to the targeted sources, including the numbers of staff (fieldtechnology application. Significant project operations, engineering support, planning,documents that establish the baseline should be finance/administration etc.) by function as wellkept readily available for eventual project evalua- as academic qualifications, area of expertise, andtion. Task managers can facilitate the creation of years of experience; (ii) supporting agencies thatbaseline documentation by ensuring that impor- may be linked to the agency and provide addi-tant source documents are included as appendi- tional capabilities; and (iii) reporting channelsces to World Bank reports or are archived in within the agency. It also may be important knowproject files. Important forms of baseline docu- the interests of different agencies, both formally asmentation include: expressed in contractual documents or govern-
ment directives, ai d informally as determined* The legal, regulatory, and policy framework through personal interviews and other means.
* Price information that underlies economicanalyses Relationships among project stakeholders may
* Taxes and/or subsidies important to also be relevant to a baseline. These relationshipscould be documented by knowing which stake-
project design holder group orig&nally conceived a project;* Institutional capabilities of government which stakeholders are project advocates or
agencies opponents; whiclh stakeholders provide politic; Ie Market producer and consumer surveys backing for the project; the sizes of the potential- Market sales or investment volumes communities of stakeholders; and the results of* Number and nature of market participants efforts to convince stakeholders of the value of the
and their capabilites and limitations project. Stakeholder interests could also be* Current characteristics of technologies classified. For example, participants might have a
policy interest, a supervisory interest, a financial* Formal or informal relationships between or administrative interest, or an executing interest.
project participants and other marketactors.
Measurement SourcesTypical examples of important price consider-ations are: power tariff charges including kWh Gathering data on investments and sales isrates and any tariff blocks for demand-side relatively straightforward if published sourcesmanagement projects; energy-purchase agree- exist, for example from government agencies,ments including avoided cost arrangements for business associations, or retailers. Where datarenewable or cogeneration projects that generate sources do not exist, generating these dataelectricity; assumed firewood or wood offcut through surveys and direct contacts with indi-prices in biomass production (forestry) projects; vidual market participants may be prohibitivelyand the imputed values of any byproducts or co- costly for a project. If there are only a limitedproducts created in the course of the project (for number of sites where the technology is in use,example, the imputed value of methane captured then site inspection may be a viable method offrom landfills). Because private-sector activities data collection. Measurement of changes inin GEF projects will often involve special finan- market structure/function presents a greatercial incentives provided by government, the
docmetaio o tx rrngmetsca bva challenge than gathering sales and mnvestmentdocumentatio oftaxarangementscanbeadata because of the need for qualitative or survey-
important element in any post-project evaluation oriented data collection. Many types of measure-of project performance - including concessionary ments of market structure/function changes willrates, accelerated depreciation, and tax holidays. require ratings (for example, producers can be classi-
A detailed assessment of an agency's baselne fiedingniofexpediencesize,ormarketshare). Thecapacity prior to capacity-building activities can long-standing discipline of marketing research,be a formidable task; the agency's credibility,
Climate Change Series 19

Monitoring and Evaluation of Market Devlopment in World Bank-GEF Climate Change Projects
which attempts to understand characteristics of Assignment of Monitoring andparticular markets, offers insights into measuring Evaluation Responsibilitiesthe effects of information and persuasion cam-paigns (Aaker and Day 1986). A variety of Assignment of monitoring and evaluationresearch approaches can be used to analyze the responsibilities to one or more agencies should bemarket: collection of existing information (stud- carefully considered. Ordinarily, a third-partyies, journals, customer surveys), focus groups of should be assigned both monitoring and evalua-small numbers of market participants, and tion responsibilities. However, assignment ofsurveys of larger numbers of market participants. monitoring responsibility to the executing agency
may make sense if the agency has the best accessMarket intervention indicators can generally be to project participants and data. And it may alsomeasured using reports by executing agencies. be adequate for a third party to merely advise theHowever, care should be taken during project executing agency on good evaluation practice andpreparation and negotiation that executing certify the findings, similar to that of an externalagencies or private-sector firms participating in accountant who audits companies for share-the project be required to collect and compile the holder reporting purposes. However, this ar-necessary data (see the China Energy Conserva- rangement could easily be ineffective if theton project example for some examples of con- executing agency is hostile to the outside evalua-tractual agreements). Some market indicators tor or doesn't see the need for a third-partymay require compilaion of contractual data. For advisor. Because project implementors are oftenexample, the number of independent power concerned about outside parties second-guessingproducer contracts signed could probably be their decisions, there may be resistance to theobtained from an electric utility. appointment of third parties to participate in
evaluations. Neverthe.less, the separation ofSome indicators require market surveys, for evaluation activithes fom project operations isexample to measure awareness, understanding, desirable.capabilities, plans, decisions, investments, andsatisfaction among different categories of market Third-party evaluators should be objective,participants. Such surveys can address produc- experienced, and independent of project agencies.ers, dealers, financiers, and representative Evaluators might be from a nongovernmentalsamples of consumers. Surveys of dealers can organization, university, or research institute; anreveal market prices and sales patterns, and independent policymaking agency of the govern-surveys of producers can reveal production costs ment; or a semi-autonomous regulatory agency.and production patterns. In both cases, however, Historical credibility and reputation of thethe data may be considered proprietary. The evaluators is important. In circumstances whereproprietary nature of such data is an important no existing local evaluation expertise can beissue that may require institutional solutions (i.e., identified, international evaluators could bespecialized agencies or organizations that collect considered with an eye toward building localand aggregate such data with assurances that capacity during the evaluation process.data will never be revealed about individualfirms), or contractual solutions (requirementsassociated with participating in the project). Costs of Market Assessments
Measuring institutional capabilities often requires In the United States and Canada, traditional DSMexpert or subjective ratings. Capabilities areprobably best measured by having the same program monitoring and evaluaton typicallyexpert look at changes over time. If different ccounts for between 3 and 5 percent of program
peole sses cpailiiesove tie,a simple costs, and sometirnes Is as high as 10 percentpeople assess capabilities over time, asele (World Bank 1994). Assessing market develop-protocol, developed as part of the baselinea DSMmeasurement, could help provide consistency in pentis; more compe tha assesvsing menMinterpretation and rating. Relatively objective prorams; thus, costs for marketdevelopmentmeasures of capabilities could also be used, such eva could be even higher than these
. . . , 'demnstate figures. However, DSM and GEF evaluationsas, ability to enter into contracts (as emonstratediffer in one key way-the required accuracy ofby having done so), or the time it takes a utilty tocomplete a power-purchase agreement. vi m n
20 Environment Departrnent Papers

Monitoring and Evaluation Approaches and Issues
is much higher because the sponsoring utility's physical energy savings or production than arefinancial return is tied directly to these savings. required for DSM programs. Unfortunately, "toIn GEF projects, no financial mechanisms are tied date, no one has investigated how much it mayto energy savings or production figures, although cost to perform some of the methods suggested"some GEF projects have opted to include contrac- for measuring market transformation (Wirtshaftertual obligations for specific levels of energy and Sorrentino, 1994, p.10.263). Costs will alsosavings to foster attitudes of accountability vary greatly depending on the market, the avail-among project participants (see the China Energy ability of local expertise, and the number and typeConservation Project example in Section 5). So the of indicators selected. Only after more recent GEFhigher costs of assessing market changes may be climate-change projects are evaluated will costscompensated for by lower costs of measuring become better defined.
Climate Change Series 21


5 Project Indicator andEvaluation Examples
The following examples are intended to illustrate able market development as the primary objec-the logical framework structure for GEF climate tive. More recent projects, such as those inchange projects in terms of project objectives, China, Sri Lanka, and Argentina, represent aproject outputs, market intervention indicators, new generation of projects designed under themarket development indicators, and market 1996 GEF Operational Strategy, which targetssustainability indicators (see Section 2 for further market development; however, many of thesediscussion of these indicators). All the examples projects are just starting.reflect the concepts and approaches provided inthese guidelines and the evolving understanding Note that the logical framework presentation ofof the nature of monitoring and evaluation for indicators reads up; that is, project interventionssuch projects. In some cases indicator examples occur at the bottom and indirect effects occur atdiffer from existing project documentation to higher levels.better reflect this evolving understanding or toprovide clarity of illustration. Data for the examples come from GEF Project
Documents, the GEF Operational Report (mostA few of the project examples are of early pilot- recent, February 1998), Project Concept Documents,phase GEF projects that have recently been Project Appraisal Documents, internal World Bankcompleted or are close to completion (in supervision reports, communications with WorldMauritius, Poland, India, and Thailand). These Bank staff, and other unpublished material.' Seeexamples also contain narrative evaluations of also GEF (1997). For a published account of themarket changes. Evaluation information for projects in Mexico, Poland, and Thailand, seethese projects is limited, however, partly because Martinot and Borg (1999) and Granda (1997).the pilot phase did not explicitly target sustain-
1 Project Documents for all projects, the GEF Operational Report, and Project Appraisal Documents for projectsapproved since 1996 are available from the GEF Secretariat and the World Bank Environment Departnent.
Climate Change Series 23

Monitoring and Evaluation of Market Devlopment in World Bank-GEF Climate Change Projects
Project Example 1: Mauritius Sugar Bio-Energy (FY92)
The objectives of the Mauritius Sugar Bio-Energy project are to expand electricity generation frombagasse, to promote the efficient use of biomass fuels from the sugar industry for energy production, andto strengthen the management and coordination of the Bagasse Energy Development Program. Toachieve these objectives, the project sought to build a baseload power plant which would providecontinuous power to the utility, using bagasse during the crop season and coal in the off season. Theplant was to be the first in a series of regional plants, and its output was to depend in part on invest-ments in efficiency improvements of regional satellite sugar mills (financed under the project) to providesurplus bagasse for power generation. The project also included components for technical assistanceand technology demonstrations to promote private/public sector cooperation in power plant venturesand evaluate ways to decrease the transport costs for bagasse and optimize the use of sugar cane forpower generation.
Direct investments. The Mauritius Sugar Authority provided documentation and data on investments inbagasse and efficiency investments in sugar mills. A bagasse plant planned as part of the project wasnot completed, and the utility had to invest in additional diesel-fueled plant to m, ke up for the powersupply shortfall. Six million dollars were dispersed under the project for efficien-v investments insugar mills to provide surplus bagasse for power generation; these investments were not projected tooccur in the baseline.
Indirect investments. Electricity generation from bagasse in Mauritius increased from 70 GWh/yr in 1992to 118 GWh/yr by 1996. Several sugar mills have completed or embarked upon bagasse power plantinvestments on their own, independent of the GEF project, including the original mill that was targetedfor the bagasse power plant under the project. The European Investment Bank has agreed to finance abagasse/coal-fired power plant. There was no baseline projection of bagasse power plant development;thus, it is unknown how strongly linked these developments are to the project. The ICR says that"extensive dialogue between the public and private sector on design work, the least-cost power develop-ment plan, and power purchasing agreements have directly or indirectly led to the development of otherpower plants."
Market structure/function changes. Very little data are available in the ICR regarding market structure/function changes, possibly because there was no project completion mission and these types of changesare difficult to analyze from documents alone. The ICR states that there has been "demonstrationvalue" from the project and that the project led to establishment of a framework for independent-power-producer (IPP) development and an administrative focal point for private/ public sector partnership inIPP development. The ICR also states that "the project's major accomplishment was progress in helpingto establish an institutional and regulatory framework for private power generation in Mauritius andthe provision of technical studies and trials to support technologies for improved bagasse productionand improved environmental monitoring."
24 Environment Department Papers

Project Indicator and Evaluation Examples
Mauritius Sugar Bio-Energy Project
Narrative Summary Key Performance IndicatorsGEF Operational Program: Market Sustainability IndicatorsPromoting the Adoption ofRenewable Energy by Removing Continued viability of independent power producer contractsBarriers and ReducingImplementation Costs Utility plans enacted that depend upon power generation from bagasse
Sustainability of bagasse supplies from sugar millsDevelopment and Global Market Development IndicatorsObjectives
Expand use of biomass resources Electricity generated by bagasse power plants tGWh)in Mauritius. In particular, (a)expand electricity generation Capacity of bagasse power plants installed by project developersfrom bagasse; (b) promoteefficient use of biomass fuels Volume of efficiency investments in sugar mills by project developersfrom the sugar industry forenergy production; and (c) Institutional and regulatory framework enacted for private power generationstrengthen the management and from bagassecoordination of the BagasseEnergy Development Program Annual volume of waste bagasse available from sugar mills for bagasse power
generation
Ratings of capabilities of project developers to design, finance, contract, install,operate, and maintain bagasse power plants and sugar mill efficiencyimprovements
Outputs Market Intervention Indicators
1. Bagasse power plant 1.1 Capacity of bagasse power plant installed under project (MW)
2. Sugar mill investments 2.1 Volume of efficiency investments in sugar mills under project
3. Strengthened capabilities of 3.1 Ratings of capabilities of the Mauritius Sugar Authority and the Centralthe Mauritius Sugar Authority Electricity Board to develop the Bagasse Energy Development Program, toand the Central Electricity Board conduct feasibility studies, to develop and finance projects, and to promote
private independent power producers4. Policy advice anddevelopment 4.1 Government program for biomass energy development enacted
5. Biomass energy technologystudy
6. Bagasse transport study
Climate Change Series 25

Monitoring and Evaluation of Market Devlopment in World Bank-GEF Climate Change Projects
Project Example 2: India Alternative Energy (FY92)
The objectives of the India Alternate Energy project are to promote commercialization of wind power and solar PVtechnologies by strengthening the capacity of the India Renewable Energy Development Agency (IREDA) to promote andfinance private-sector investments. The project is designed to pioneer financing and market delivery mechanisms basedon private-sector intermediaries and suitable incentive schemes and policies for small independent power producers.Markets for these technologies are catalyzed through large-scale demonstration, increased consumer confidence, andenhanced willingness to pay. One component of the project directly finances wind farm installations by private-sectordevelopers through a policy framework that provides strong financial incentives. A second component provides for amarketing campaign, credit facilities, and subsidies to rural consumers for purchasing solar PV systems. The project hassupported policies that encourage small-scale independent power producers to invest in wind farms and mini-hydroinstallations.
Direct investments and sales. Data are available from IREDA, which has authority for approving installations. The projecttargeted 85MW of commercially operated private wind farms to be financed through the GEF and the InternationalDevelopment Association (IDA; a member of the World Bank Group), with co-financing from the Danish government andfrom other resources mobilized by IREDA. As of March 1998, over 270 MW had been financed by IREDA and commis-sioned, including 41 MW commissioned with GEF and IDA financing and 10 MW commissioned with Danish funds. Theproject targeted 2.5 to 3.0 MWp of solar PV. As of March 1998, about 0.3 MWp had been commissioned and an additional1.0 MWp was in the active pipeline. As of 1997,125 MW of hydro was in the pipeline.
Indirect investments and sales. Data are also available from IREDA. The baseline before the prnject for grid-connected windfarms was 38 MW of state-operated demonstration projects, largely a result of Danish goveminent assistance. As of March1998, a total of 968 MW of wind farms were installed and operating in India, of which 917 MWV were commercial andprivately operated. Promotion of private sector wind farns has thus been highly successfuL dithough installed capacitydoes not provide the full picture. These indirect commercial installations were strongly influenced by incentives providedto wind-farm developers in the form of highly favorable mvestment tax policies. These policies provided strong incen-tives for capacity installation but not for high capacity factors after installation, so average capacity factor is also animportant indicator. Before the project, 8,000 villages had solar PV lighting systemns and there were about 1200 solar PVwater pumps, about 5,000 domestic solar PV lighting units, and about 0.6 MWp of capacity among 50 vilage powersystems. As of March 1998,32 Mp solar I capacity had been installed in India (in more than 350,000 systems by 1996).
Market structure/function changes. The chief sources of information are IREDA and discussions with industry players andfinancial institutions. The GEF project helped to catalyze significant changes in market structure/function. For example,the project helped to raise awareness among investors and banking institutions on the viability of wind power technologyand helped to lobby for lower import tariffs for both wind and solar PV systems. Many more financial institutionsdecided to offer financing for wind farms and a wind-power loan portfolio among commercial banking institutionsemerged (this was a key project goal). New suppliers entered the wind power and solar PV markets. Before the projectthere were three major companies involved in the wind industry, including one state firm and two joint ventures withDanish partners. By 1998, as many as 26 companies were engaged in the wind turbme manufacturmg mdustry, many withforeign partners. High-technology wind turbine designs up to 600-kW with variable speed operation were produced by14 companies. Manufacturers had also achieved a high degree of domestic content Although wind turbine blades werestiU largely imported, domestic production of blades had begun and exports of blades and synchronous generators toEurope were underway. Wind turbine exports to other countries also began. The installed costs of wind turbines in Indiadeclined from around $1200/kW in 1991 to $815-1050/kW in 1998. The number of Indian consultants capable of develop-ing wind power investment projects increased dramatically, in part because of GEF-supported training and networkingactivities for consultants, technicians and private firms (a roster of consultants was available from IREDA for reference byinvestors).
Data on the solar PV industry is also available from the Ministry of Non-Conventional Energy and from an association ofsolar PV manufacturers. The application of solar PV became more diversified to include rural telecommunications (42%),PV water pumping (9%), streetlighting (9%), rural home lighting (8%), solar lanterns (5%), power plants (5%), and manyother applications. Promotional efforts and numerous business meetings organized by IREDA increased awareness ofvarious PV applications among potential users. Between 1992 and 1995, these meetings mushroomed from a handful ofattendees to large ballroom-size affairs. In 1991, domestic production capacity for solar modules was 3 MWp and annualproduction was 1 MWp, with 16 companies involved in the PV industry. By 1996-97, annual production was 4 MWp ofsolar cels and 8 MWp of PV modules. By 1998, fourteen companies were engaged in the manufacture of PV modules and60 companies in the manufacture of a variety of PV systems. Despite the industry growth, there have been problems inextending credit to potential rural PV consumers. Opinions gathered from financial institutions and industry players havesuggested that financial institutions perceive rural consumers as unwimling to repay loans and therefore have not extendedcredit. Suppliers have prioritized their marketing efforts first to government programs, secondly to consumers who canpay cash, thirdly to corporate purchases, and only last to consumers needing credit. (continued on next page)
26 Environment Department Papers
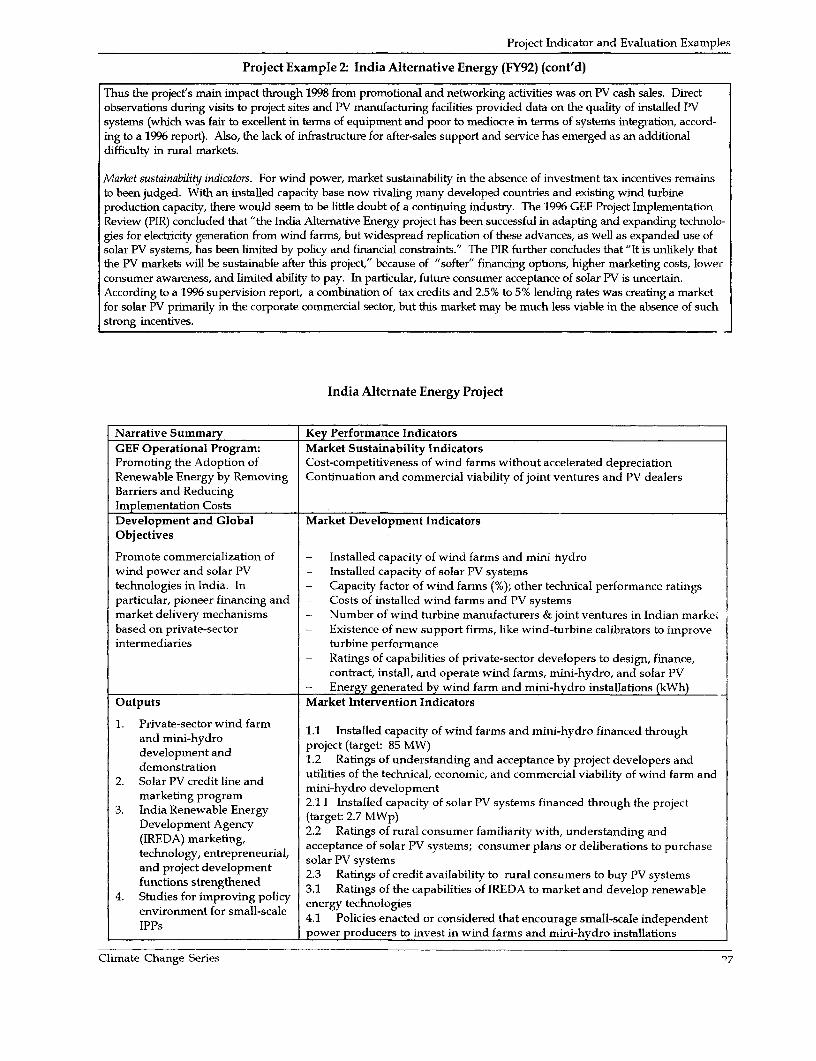
Project Indicator and Evaluation Examples
Project Example 2: India Alternative Energy (FY92) (cont'd)
Thus the project's main impact through 1998 from promotional and networking activities was on PV cash sales. Directobservations during visits to project sites and PV manufacturing facilities provided data on the quality of installed PVsystems (which was fair to excellent in terms of equipment and poor to mediocre in terms of systems integration, accord-ing to a 1996 report). Also, the lack of infrastructure for after-sales support and service has emerged as an additionaldifficulty in rural markets.
Market sustainability indicators. For wind power, market sustainability in the absence of investment tax incentives remainsto been judged. With an installed capacity base now rivaling many developed countries and existing wind turbineproduction capacity, there would seem to be little doubt of a continuing industry. The 1996 GEF Project ImplementationReview (PIR) concluded that "the India Alternative Energy project has been successful in adapting and expanding technolo-gies for electricity generation from wind farms, but widespread replication of these advances, as well as expanded use ofsolar PV systems, has been limited by policy and financial constraints." The PIR further concludes that 'It is unlikely thatthe PV markets will be sustainable after this project," because of "softer" financing options, higher marketing costs, lowerconsumer awareness, and limited ability to pay. In particular, future consumer acceptance of solar PV is uncertain.According to a 1996 supervision report, a combination of tax credits and 2.5% to 5% lending rates was creating a marketfor solar PV primarily in the corporate commercial sector, but this market may be much less viable in the absence of suchstrong incentives.
India Alternate Energy Project
Narrative Summary Key Performance IndicatorsGEF Operational Program: Market Sustainability IndicatorsPromoting the Adoption of Cost-competitiveness of wind farms without accelerated depreciationRenewable Energy by Removing Continuation and commercial viability of joint ventures and PV dealersBarriers and ReducingImplementation CostsDevelopment and Global Market Development IndicatorsObjectives
Promote commercialization of - Installed capacity of wind farms and mini hydrowind power and solar PV - Installed capacity of solar PV systemstechnologies in India. In - Capacity factor of wind farms (%); other technical performance ratingsparticular, pioneer financing and - Costs of installed wind farms and PV systemsmarket delivery mechanisms - Number of wind turbine manufacturers & joint ventures in Indian marke;based on private-sector - Existence of new support firms, like wind-turbine calibrators to improveintermediaries turbine performance
- Ratings of capabilities of private-sector developers to design, finance,contract, install, and operate wind farms, mini-hydro, and solar PV
- Energy generated by wind farm and mini-hydro installations (kWh)Outputs Market Intervention Indicators
1. Private-sector wind farm 1.1 Installed capacity of wind farms and mini-hydro financed through
and melo- ayro project (target: 85 MW)development and 1.2 Ratings of understanding and acceptance by project developers anddemonstration utilities of the technical, economic, and commercial viability of wind farm and
2. Sola PVcredt lnead mini-hydro developmentmarketing program 2.1 I Installed capacity of solar PV systems financed through the project
3. India Renewable Energy (target: 2.7 MWp)Development Agency 2.2 Ratings of rural consumer familiarity with, understanding and(IREDA) marketing, acceptance of solar PV systems; consumer plans or deliberations to purchasetechnology, entrepreneurial, solar PV systems
and project development 2.3 Ratings of credit availability to rural consumers to buy PV systemsfunctions strengthened 3.1 Ratings of the capabilities of IREDA to market and develop renewable
environment for small-scale energy technologiesIPPs 4.1 Policies enacted or considered that encourage small-scale independent
power producers to invest in wind farms and mini-hydro installations
Climate Change Series 27

Monitoring and Evaluation of Market Devlopment in World Bank-GEF Climate Change Projects
Project Example 3: Sri Lanka Energy Services Delivery (FY97)
The objectives of the Sri Lanka Energy Services Delivery project are to: (1) promote the provision by theprivate sector, NGOs and cooperatives of grid and off-grid energy services using renewable energy tech-nologies; (2) strengthen the environment for DSM implementation; and (3) improve public- and private-sector delivery of energy services through renewable energy and DSM. The main component of the projectprovides credit channeled through designated local financial institutions for medium-and long-termfinancing to private-sector firms, NGOs, and cooperatives for solar home systems, village-scale mini-hydro,grid-connected mini-hydro, and other renewable energy investments. Grant co-financing from the GEF isavailable for solar home systems and village mini-hydro subprojects. The project also finances a pilot grid-connected wind farm of approximately 3 MW. Technical assistance is offered to improve the capabilities ofutilities, private-sector developers, and NGOs to promote and deliver energy services using renewableenergy technologies, including: Small Power Purchase Agreements; generation planning models thatincorporate intermittent, nondispatchable renewable energy generating sources; aid feasibility studiesand business plans. Technical assistance also supports the development of an Enmrg,y Efficient Commer-cial Building Code of Practice.
Direct investments are renewable energy systems installed by private-sector developers, NGOs, and coopera-tives that are directly financed and/or subsidized by the project.
Indirect investments are installations not directly financed or subsidized by the project. Indirect investmentscan be measured through reports by the utility about power-purchase agreements and purchases ofelectricity from small power producers, utility wind farm reports, surveys of small power producers, andsurveys of households. Indirect installations can be attributed to the original project if surveys of renew-able-energy small power developers confirm that the developer's investment decision was influenced bythe project, or if the developer received technical assistance or training, directly or indirectly, through theproject. More loosely, all indirect market impacts that occur through the Standard Small Power PurchaseAgreement mechanism could be attributed to the project.
Direct market structure/function changes would measure whether the utility developed a Standard SmallPower Purchase Agreement; whether capabilities of the utility, private-sector developers, and NGOs thatparticipate in the project improve (including capabilities to prepare feasibility studies and business plans);whether renewable energy is accepted by consumers, project developers, and financial institutions;whether information and experience from the pilot wind farm is disseminated; whether the Energy Energy-Efficient Commercial Building Code of Practice is issued; and whether capabilities of public and privateagencies to incorporate the code into building designs are developed.
Indirect market structure/function changes can be measured through utility reports and surveys of consumers,project developers, and financial institutions about plans to purchase, develop, or finance renewableenergy technologies (including preparation of feasibility studies and business plans). The number ofprivate-sector developers in the market with plans to continue is also a key indicator.
28 Environment Department Papers
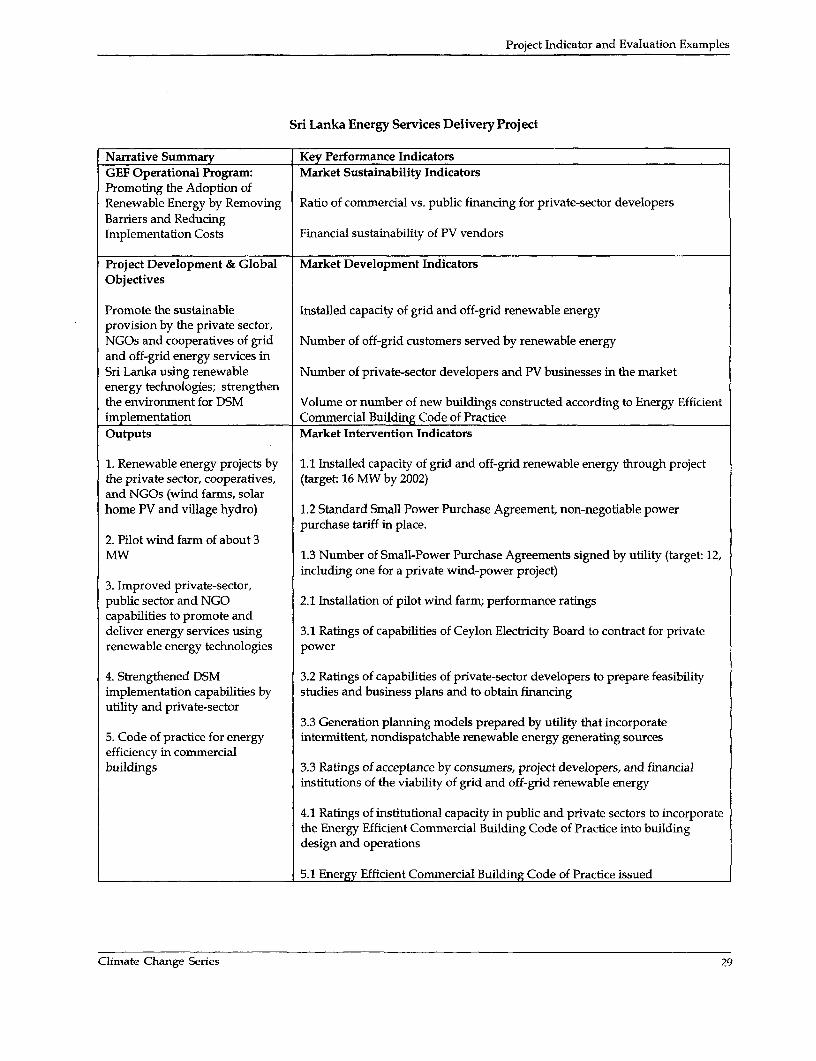
Project Indicator and Evaluation Examples
Sri Lanka Energy Services Delivery Project
Narrative Summary Key Performance IndicatorsGEF Operational Program: Market Sustainability IndicatorsPromoting the Adoption ofRenewable Energy by Removing Ratio of commercial vs. public financing for private-sector developersBarriers and ReducingImplementation Costs Financial sustainability of PV vendors
Project Development & Global Market Development IndicatorsObjectives
Promote the sustainable Installed capacity of grid and off-grid renewable energyprovision by the private sector,NGOs and cooperatives of grid Number of off-grid customers served by renewable energyand off-grid energy services inSri Lanka using renewable Number of private-sector developers and PV businesses in the marketenergy technologies; strengthenthe environment for DSM Volume or number of new buildings constructed according to Energy Efficientimplementation Commercial Building Code of PracticeOutputs Market Intervention Indicators
1. Renewable energy projects by 1.1 Installed capacity of grid and off-grid renewable energy through projectthe private sector, cooperatives, (target: 16 MW by 2002)and NGOs (wind farms, solarhome PV and village hydro) 1.2 Standard Small Power Purchase Agreement, non-negotiable power
purchase tariff in place.2. Pilot wind farm of about 3MW 1.3 Number of Small-Power Purchase Agreements signed by utility (target: 12,
including one for a private wind-power project)3. Improved private-sector,public sector and NGO 2.1 Installation of pilot wind farm; performance ratingscapabilities to promote anddeliver energy services using 3.1 Ratings of capabilities of Ceylon Electricity Board to contract for privaterenewable energy technologies power
4. Strengthened DSM 3.2 Ratings of capabilities of private-sector developers to prepare feasibilityimplementation capabilities by studies and business plans and to obtain financingutility and private-sector
3.3 Generation planning models prepared by utility that incorporate5. Code of practice for energy intermittent, nondispatchable renewable energy generating sourcesefficiency in commercialbuildings 3.3 Ratings of acceptance by consumers, project developers, and financial
institutions of the viability of grid and off-grid renewable energy
4.1 Ratings of institutional capacity in public and private sectors to incorporatethe Energy Efficient Commercial Building Code of Practice into buildingdesign and operations
5.1 Energy Efficient Commercial Building Code of Practice issued
Climate Change Series 29
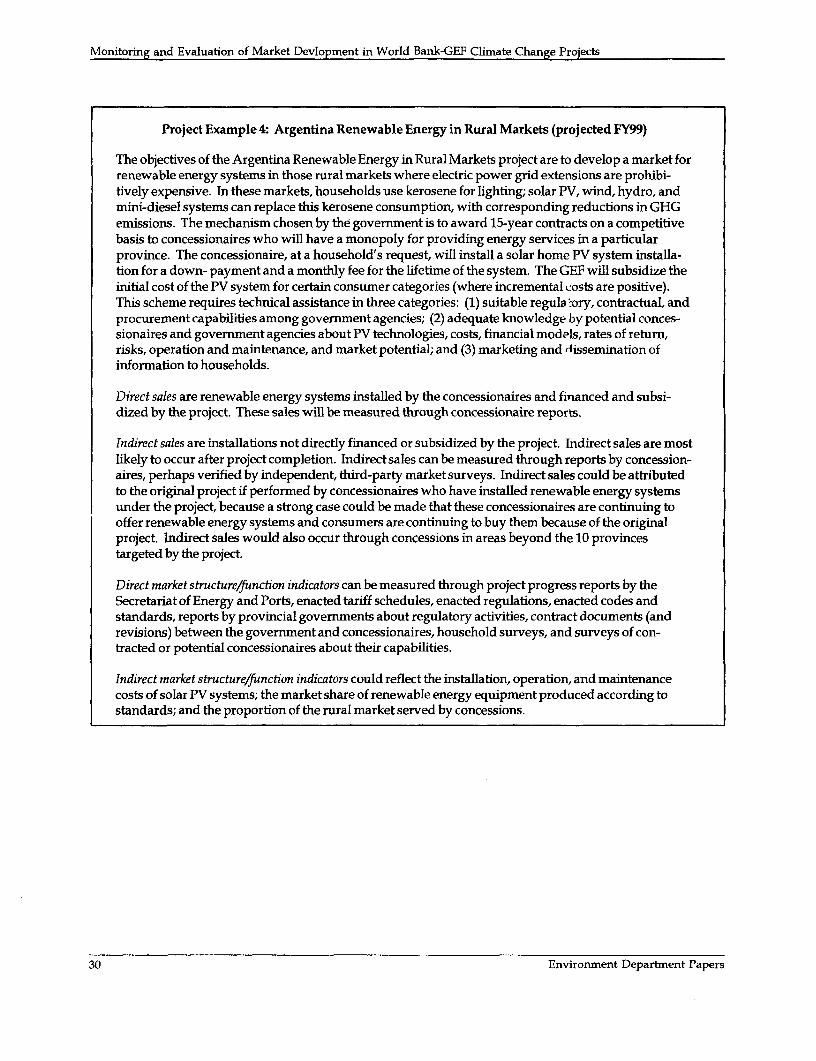
Monitoring and Evaluation of Market Devlopment in World Bank-GEF Climate Change Projects
Project Example 4: Argentina Renewable Energy in Rural Markets (projected FY99)
The objectives of the Argentina Renewable Energy in Rural Markets project are to develop a market forrenewable energy systems in those rural markets where electric power grid extensions are prohibi-tively expensive. In these markets, households use kerosene for lighting; solar PV, wind, hydro, andmini-diesel systems can replace this kerosene consumption, with corresponding reductions in GHGemissions. The mechanism chosen by the government is to award 15-year contracts on a competitivebasis to concessionaires who will have a monopoly for providing energy services in a particularprovince. The concessionaire, at a household's request, will install a solar home PV system installa-tion for a down- payment and a monthly fee for the lifetime of the system. The GEF will subsidize theinitial cost of the PV system for certain consumer categories (where incremental costs are positive).This scheme requires technical assistance in three categories: (1) suitable regula -ory, contractual, andprocurement capabilities among government agencies; (2) adequate knowledge by potential conces-sionaires and government agencies about PV technologies, costs, financial models, rates of return,risks, operation and maintenance, and market potential; and (3) marketing and dissemination ofinformation to households.
Direct sales are renewable energy systems installed by the concessionaires and financed and subsi-dized by the project. These sales will be measured through concessionaire reports.
Indirect sales are installations not directly financed or subsidized by the project. Indirect sales are mostlikely to occur after project completion. Indirect sales can be measured through reports by concession-aires, perhaps verified by independent, third-party market surveys. Indirect sales could be attributedto the original project if performed by concessionaires who have installed renewable energy systemsunder the project, because a strong case could be made that these concessionaires are continuing tooffer renewable energy systems and consumers are continuing to buy them because of the originalproject. Indirect sales would also occur through concessions in areas beyond the 10 provincestargeted by the project
Direct market structurelfunction indicators can be measured through project progress reports by theSecretariat of Energy and Ports, enacted tariff schedules, enacted regulations, enacted codes andstandards, reports by provincial governments about regulatory activities, contract documents (andrevisions) between the government and concessionaires, household surveys, and surveys of con-tracted or potential concessionaires about their capabilities.
Indirect market structure/function indicators could reflect the installation, operation, and maintenancecosts of solar PV systems; the market share of renewable energy equipment produced according tostandards; and the proportion of the rural market served by concessions.
30 Environment Department Papers
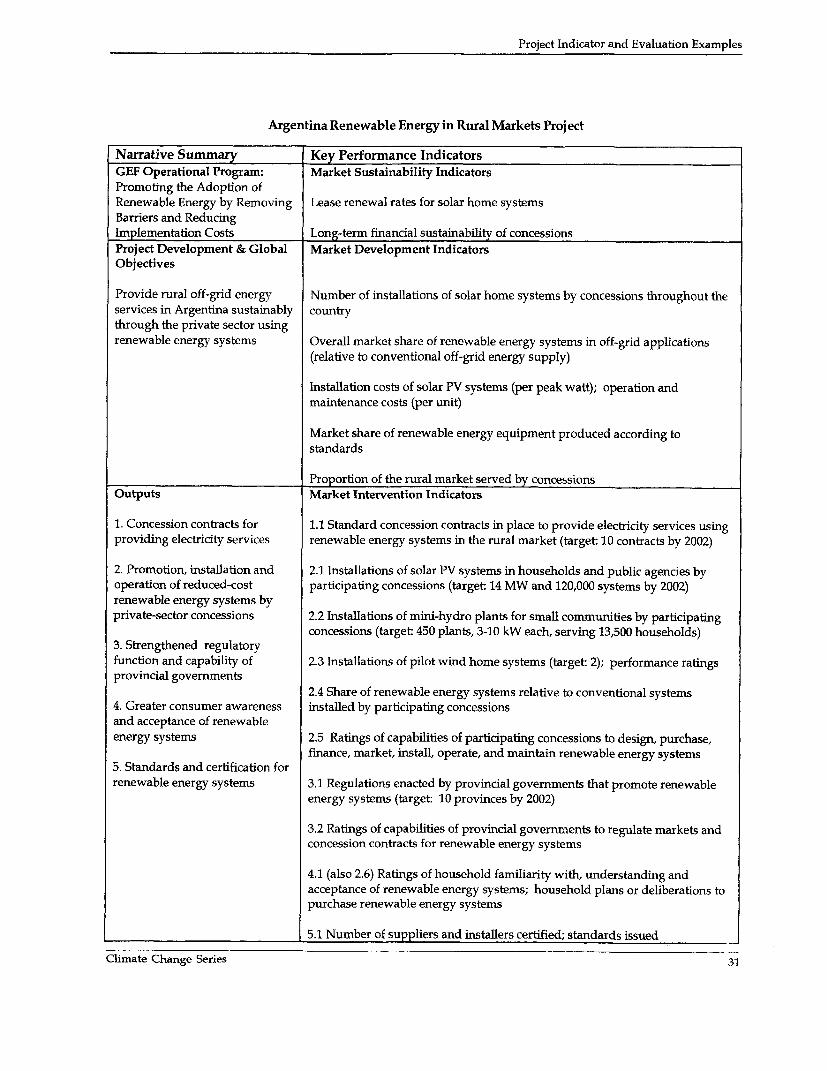
Project Indicator and Evaluation Examples
Argentina Renewable Energy in Rural Markets Project
Narrative Summary Key Performance IndicatorsGEF Operational Program: Market Sustainability IndicatorsPromoting the Adoption ofRenewable Energy by Removing Lease renewal rates for solar home systemsBarriers and ReducingImplementation Costs Long-term financial sustainability of concessionsProject Development & Global Market Development IndicatorsObjectives
Provide rural off-grid energy Number of installations of solar home systems by concessions throughout theservices in Argentina sustainably countrythrough the private sector usingrenewable energy systems Overall market share of renewable energy systems in off-grid applications
(relative to conventional off-grid energy supply)
Installation costs of solar PV systems (per peak watt); operation andmaintenance costs (per unit)
Market share of renewable energy equipment produced according tostandards
Proportion of the rural market served by concessionsOutputs Market Intervention Indicators
1. Concession contracts for 1.1 Standard concession contracts in place to provide electricity services usingproviding electricity services renewable energy systems in the rural market (target 10 contracts by 2002)
2. Promotion, installation and 2.1 Installations of solar PV systems in households and public agencies byoperation of reduced-cost participating concessions (target: 14 MW and 120,000 systems by 2002)renewable energy systems byprivate-sector concessions 2.2 hnstallations of mini-hydro plants for small communities by participating
concessions (target: 450 plants, 3-10 kW each, serving 13,500 households)3. Strengthened regulatoryfunction and capability of 2.3 Installations of pilot wind home systems (target: 2); performance ratingsprovincial governments
2.4 Share of renewable energy systems relative to conventional systems4. Greater consumer awareness installed by participating concessionsand acceptance of renewableenergy systems 2.5 Ratings of capabilities of participating concessions to design, purchase,
finance, market, install, operate, and maintain renewable energy systems5. Standards and certification forrenewable energy systems 3.1 Regulations enacted by provincial governments that promote renewable
energy systems (target: 10 provinces by 2002)
3.2 Ratings of capabilities of provincial governments to regulate markets andconcession contracts for renewable energy systems
4.1 (also 2.6) Ratings of household familiarity with, understanding andacceptance of renewable energy systems; household plans or deliberations topurchase renewable energy systems
5.1 Number of suppliers and installers certified; standards issued
Climate Change Series 31

Monitoring and Evaluation of Market Devlopment in World Bank-GEF Climate Change Projects
Project Example 5: China Renewable Energy Promotion (projected FY99)
The objective of the China Renewable Energy Promotion project is to build commercial markets forwind farms and PV systems. The project will support: (a) installation of wind farms; (b) supply ofPV/ wind hybrid systems to households and institutions in remote areas of four Northwesternprovinces; (c) technology innovation to reduce cost and improve performance of wind-farm and solarPV technologies in China; and (d) strengthening of institutional capacity and market infrastructurefor large-scale commercialization of wind farms and solar PV.
Direct sales and investments are 190 MW of wind farms in operation and PV systems providing electric-ity to 200,000 rural households. These indicators will be tracked by the executing agency.
Indirect sales and investments will be measured by the installed capacity of wind farms in China, theinstalled capacity of solar PV in China, and the number of PV systems sold in China. Governmentdata exist for these indicators. The project is conducting a PV market survey to help establish themarket baseline prior to project start-up.
Direct market structure/function changes related to PV systems include new payment mechanisms tomake PV systems more affordable to consumers, increased consumer awareness and improvedcredibility of PV technology, improved quality of equipment and after-sales service, improved com-mercial capabilities of PV dealers (especially with respect to accounting, financial management, andability to get loans), establishment of a PV technology testing center, national PV system standards,and a government PV industry strategy. Market structure/function changes related to wind farmsinclude improved technical, financial and operational capability of wind-farm companies; availabil-ity of legal and commercial documentation for wind farm development by the private sector; andincreased capacity to mobilize private investment in wind farm development. Other changes relate toquality improvements in locally produced technologies and lower equipment costs in those areaswhere Chinese firms have a competitive advantage. The direct sales and investments associated withthe project will also strengthen the capabilities of specific private-sector PV installers and wind farmdevelopers.
Indirect market structure/function changes will be reflected in the number of independent power produc-ers in China (available from government data), the number of PV vendors in the market, the availabil-ity of payment mechanism to improve affordability of PV systems, and the reduction of capital costs ofwind and PV systems in China.
32 Environment Department Papers
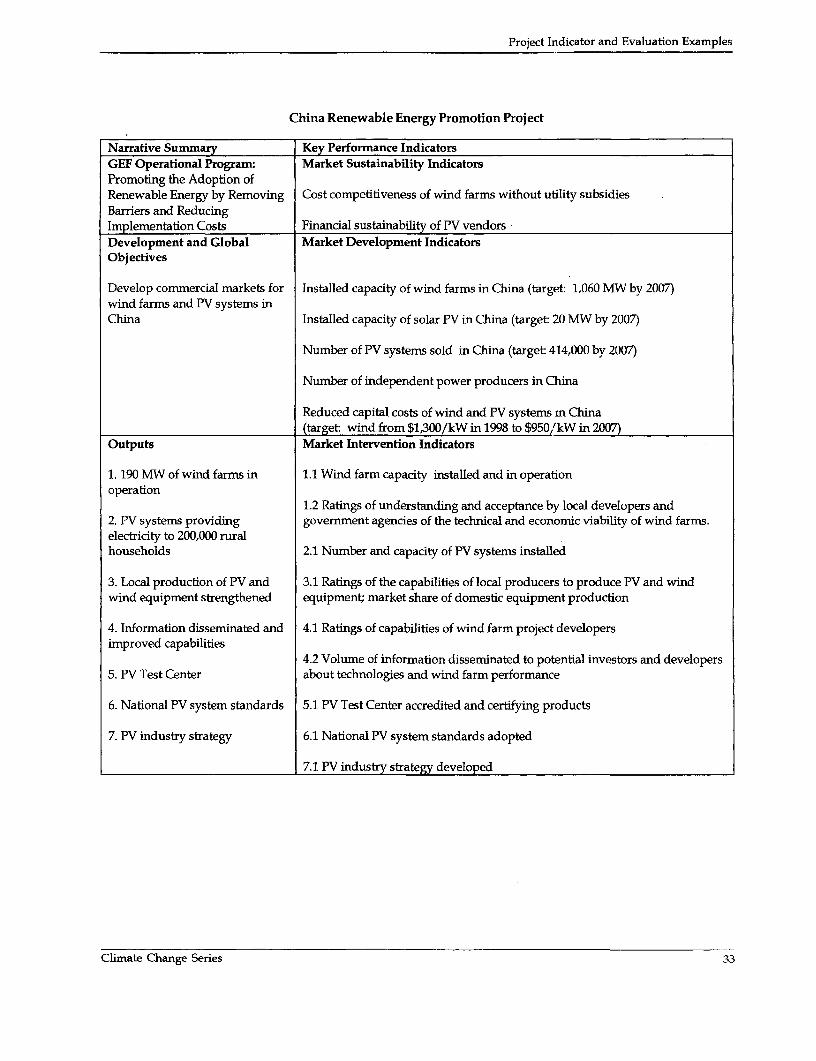
Project Indicator and Evaluation Examples
China Renewable Energy Promotion Project
Narrative Summary Key Performance IndicatorsGEF Operational Program: Market Sustainability IndicatorsPromoting the Adoption ofRenewable Energy by Removing Cost competitiveness of wind farms without utility subsidiesBarriers and ReducingImplementation Costs Financial sustainability of PV vendorsDevelopment and Global Market Development IndicatorsObjectives
Develop commercial markets for Installed capacity of wind farms in China (target: 1,060 MW by 2007)wind farms and PV systems inChina Installed capacity of solar PV in China (target: 20 MW by 2007)
Number of PV systems sold in China (target: 414,000 by 2007)
Number of independent power producers in China
Reduced capital costs of wind and PV systems m China(target: wind from $1,300/kW in 1998 to $950/kW in 2007)
Outputs Market Intervention Indicators
1. 190 MW of wind farms in 1.1 Wind farm capacity installed and in operationoperation
1.2 Ratings of understanding and acceptance by local developers and2. PV systems providing government agencies of the technical and economic viability of wind farms.electricity to 200,000 ruralhouseholds 2.1 Number and capacity of PV systems installed
3. Local production of PV and 3.1 Ratings of the capabilities of local producers to produce PV and windwind equipment strengthened equipment; market share of domestic equipment production
4. Information disseminated and 4.1 Ratings of capabilities of wind farm project developersimproved capabilities
4.2 Volume of information disseminated to potential investors and developers5. PV Test Center about technologies and wind farm performance
6. National PV system standards 5.1 PV Test Center accredited and certifying products
7. PV industry strategy 6.1 National PV system standards adopted
7.1 PV industry strategy developed
Climate Change Series 33

Monitoring and Evaluation of Market Devlopment in World Bank-GEF Climate Change Projects
Project Example 6: Brazil Biomass Power Commercial Demonstration Project (projected FY99)
The objectives of the Brazil Biomass Power Commercial Demonstration Project are to demonstratethe commercial viability of using wood as a feedstock for power generation through the BiomassIntegrated Gasification/Gas Turbine (BIG/GT) concept. Because this project is under GEF Opera-tional Program 7 ("reducing the long-term costs of low greenhouse-gas emitting technologies") andconcerns a technology which is not yet commercial (in contrast to the technologies in Project Ex-amples 1 to 5, which are already commercially viable), the direct project outputs consist only of theworking demonstration plant. The project does not include any "barrier removal" activities directedat specific national or regional markets. The demonstration is intended to spur further research,development, and commercialization of the technology worldwide. The indirect impacts of theproject can be measured by adoption of this technology worldwide as costs are reduced and percep-tions of its commercial feasibility change.
34 Environment Departmnent Papers

Project Jadicator and Evaluation Examples
Brazil Biomass Power Commercial Demonstration Project
NarTative Summary Key Performance IndicatorsGEF Operational Program: Market Sustainability IndicatorsReducing the Long-term Costs ofLow Greenhouse-gas Emitting Life-cycle costs of BIG/GT plants relative to conventional generating plantsTechnologies
Long-term sustainability of fuelwood supplies for BIG/GTDevelopment and Global Market Development IndicatorsObjectives
Demonstrate the commercial Capacity of BIG/GT plants constructed worldwide; financial commitments forviability of the BIG/GT concept new plants
Number of suppliers of BIG/GT plants worldwide; degree of localinvolvement and backwards integration
Private-sector investment in BIG/GT research. md development (R&D)
Diversity and innovativeness of technology av i table commerciallyOutputs Market Intervention Indkators
1. 30 MW demonstration plant 1.1 Demonstration plant operational; plant performance indicators
2. Plans for commercial 1.2 Demonstration plant life-cycle costsdissemnination
2.1 Number of engineers and managers worldwide exposed to demonstrationplant, dissemination literature, and project personnel
Climate Change Series 35
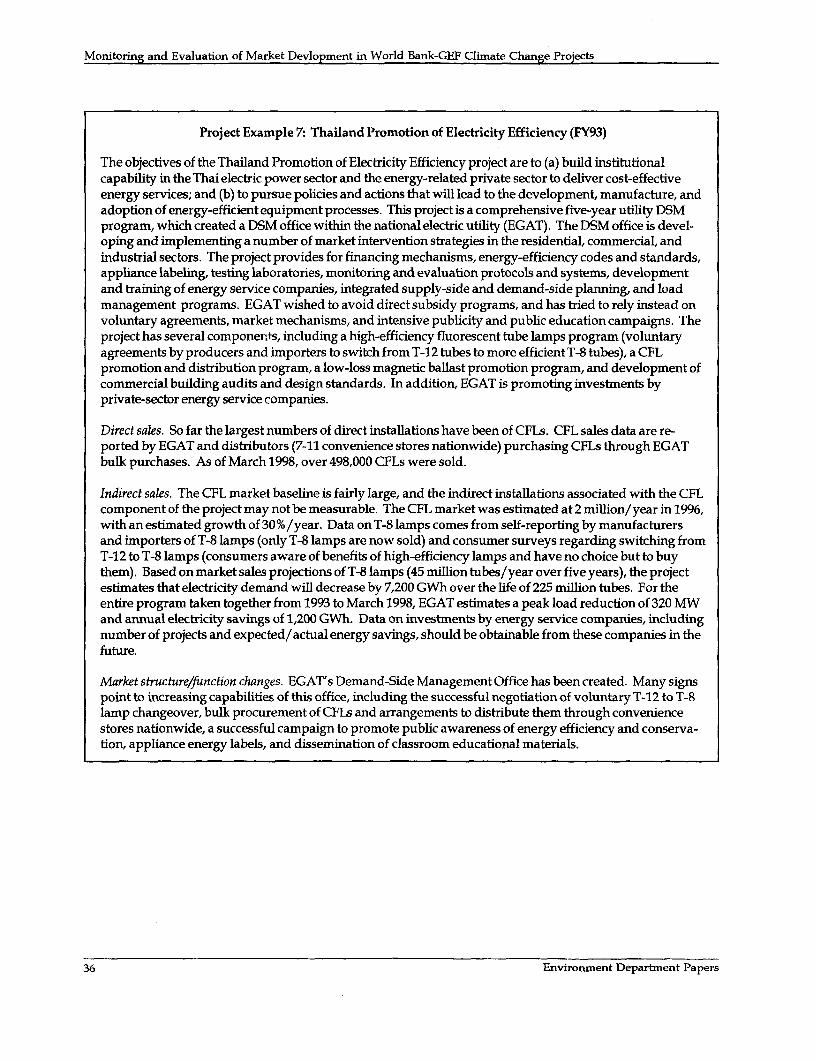
Monitoring and Evaluation of Market Devlopment in World Bank-GEF Climate Change Projects
Project Example 7: Thailand Promotion of Electricity Efficiency (FY93)
The objectives of the Thailand Promotion of Electricity Efficiency project are to (a) build institutionalcapability in the Thai electric power sector and the energy-related private sector to deliver cost-effectiveenergy services; and (b) to pursue policies and actions that will lead to the development, manufacture, andadoption of energy-efficient equipment processes. This project is a comprehensive five-year utility DSMprogram, which created a DSM office within the national electric utility (EGAT). The DSM office is devel-oping and implementing a number of market intervention strategies in the residential, commercial, andindustrial sectors. The project provides for financing mechanisms, energy-efficiency codes and standards,appliance labeling, testing laboratories, monitoring and evaluation protocols and systems, developmentand training of energy service companies, integrated supply-side and demand-side planning, and loadmanagement programs. EGAT wished to avoid direct subsidy programs, and has tried to rely instead onvoluntary agreements, market mechanisms, and intensive publicity and public education campaigns. Theproject has several components, including a high-efficiency fluorescent tube lamps program (voluntaryagreements by producers and importers to switch from T-12 tubes to more efficient T-8 tubes), a CFLpromotion and distribution program, a low-loss magnetic ballast promotion program, and development ofcommercial building audits and design standards. In addition, EGAT is promoting investments byprivate-sector energy service companies.
Direct sales. So far the largest numbers of direct installations have been of CFLs. CFL sales data are re-ported by EGAT and distributors (7-11 convenience stores nationwide) purchasing CFLs through EGATbulk purchases. As of March 1998, over 498,000 CFLs were sold.
Indirect sales. The CFL market baseline is fairly large, and the indirect installations associated with the CFLcomponent of the project may not be measurable. The CFL market was estimated at 2 million/ year in 1996,with an estimated growth of 30% /year. Data on T-8 lamps comes from self-reporting by manufacturersand importers of T-8 lamps (only T-8 lamps are now sold) and consumer surveys regarding switching fromT-12 to T-8 lamps (consumers aware of benefits of high-efficiency lamps and have no choice but to buythem). Based on market sales projections of T-8 lamps (45 million tubes/year over five years), the projectestimates that electricity demand will decrease by 7,200 GWh over the life of 225 million tubes. For theentire program taken together from 1993 to March 1998, EGAT estimates a peak load reduction of 320 MWand annual electricity savings of 1,200 GWh. Data on investments by energy service companies, includingnumber of projects and expected/actual energy savings, should be obtainable from these companies in thefuture.
Market structure/function changes. EGAT's Demand-Side Management Office has been created. Many signspoint to increasing capabilities of this office, including the successful negotiation of voluntary T-12 to T-8lamp changeover, bulk procurement of CFLs and arrangements to distribute them through conveniencestores nationwide, a successful campaign to promote public awareness of energy efficiency and conserva-tion, appliance energy labels, and dissemination of classroom educational materials.
36 Environment Department Papers
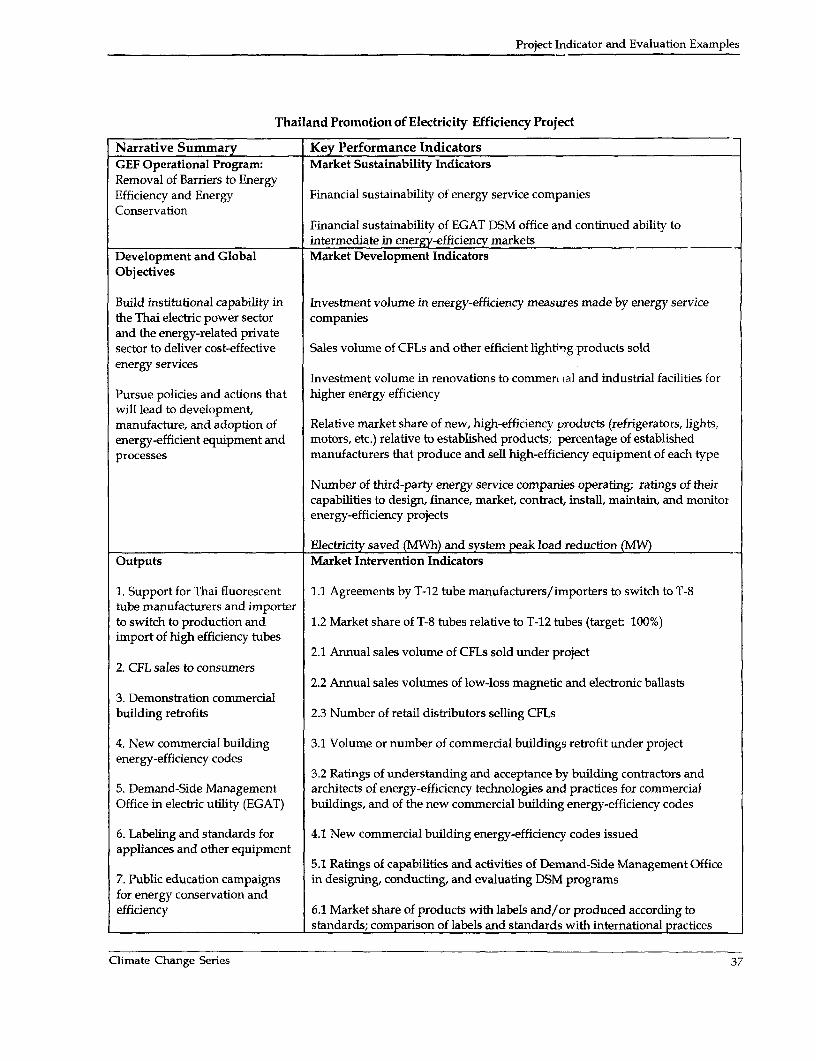
Project Indicator and Evaluation Examples
Thailand Promotion of Electricity Efficiency Project
Narrative Summary Key Performance IndicatorsGEF Operational Program: Market Sustainability IndicatorsRemoval of Barriers to EnergyEfficiency and Energy Financial sustainability of energy service companiesConservation
Financial sustainability of EGAT DSM office and continued ability tointermediate in energy-efficiency markets
Development and Global Market Development IndicatorsObjectives
Build institutional capability in Investment volume in energy-efficiency measures made by energy servicethe Thai electric power sector companiesand the energy-related privatesector to deliver cost-effective Sales volume of CFLs and other efficient lighti-g products soldenergy services
Investment volume in renovations to commert ial and industrial facilities forPursue policies and actions that higher energy efficiencywill lead to development,manufacture, and adoption of Relative market share of new, high-efficiency products (refrigerators, lights,energy-efficient equipment and motors, etc.) relative to established products; percentage of establishedprocesses manufacturers that produce and sell high-efficiency equipment of each type
Number of third-party energy service companies operating; ratings of theircapabilities to design, finance, market, contract, install, maintain, and monitorenergy-efficiency projects
Electricity saved (MWh) and system peak load reduction (MW)Outputs Market Intervention Indicators
1. Support for Thai fluorescent 1.1 Agreements by T-12 tube manufacturers/importers to switch to T-8tube manufacturers and importerto switch to production and 1.2 Market share of T-8 tubes relative to T-12 tubes (target: 100%)import of high efficiency tubes
2.1 Annual sales volume of CFLs sold under project2. CFL sales to consumers
2.2 Annual sales volumes of low-loss magnetic and electronic ballasts3. Demonstration commercialbuilding retrofits 2.3 Number of retail distributors selling CFLs
4. New commercial building 3.1 Volume or number of commercial buildings retrofit under projectenergy-efficiency codes
3.2 Ratings of understanding and acceptance by building contractors and5. Demand-Side Management architects of energy-efficiency technologies and practices for commercialOffice in electric utility (EGAT) buildings, and of the new commercial building energy-efficiency codes
6. Labeling and standards for 4.1 New commercial building energy-efficiency codes issuedappliances and other equipment
5.1 Ratings of capabilities and activities of Demand-Side Management Office7. Public education campaigns in designing, conducting, and evaluating DSM programsfor energy conservation andefficiency 6.1 Market share of products with labels and/or produced according to
Istandards; comparison of labels and standards with intemational practices
Climate Change Series 37
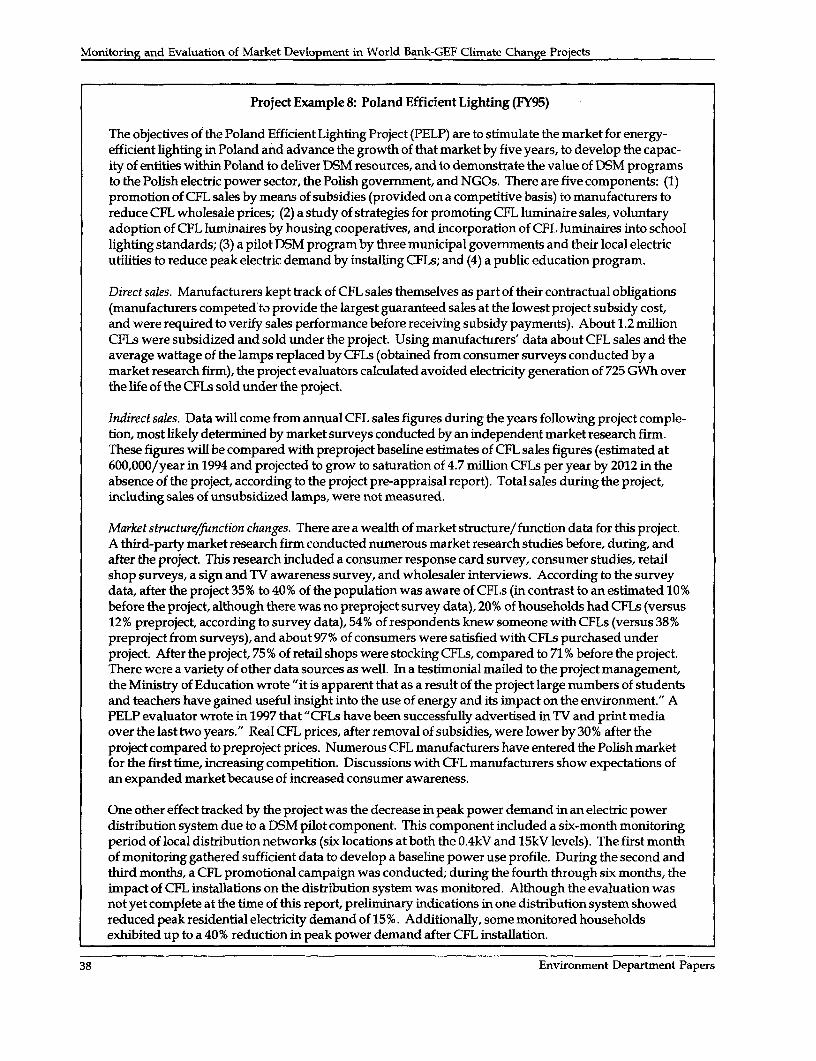
Monitoring and Evaluation of Market Devlopment in World Bank-GEF Clunate Change Projects
Project Example 8: Poland Efficient Lighting (FY95)
The objectives of the Poland Efficient Lighting Project (PELP) are to stimulate the market for energy-efficient lighting in Poland and advance the growth of that market by five years, to develop the capac-ity of entities within Poland to deliver DSM resources, and to demonstrate the value of DSM programsto the Polish electric power sector, the Polish government, and NGOs. There are five components: (1)promotion of CFL sales by means of subsidies (provided on a competitive basis) to manufacturers toreduce CFL wholesale prices; (2) a study of strategies for promoting CFL luminaire sales, voluntaryadoption of CFL luminaires by housing cooperatives, and incorporation of CFL luminaires into schoollighting standards; (3) a pilot DSM program by three municipal governments and their local electricutilities to reduce peak electric demand by installing CFLs; and (4) a public education program.
Direct sales. Manufacturers kept track of CFL sales themselves as part of their contractual obligations(manufacturers competed to provide the largest guaranteed sales at the lowest project subsidy cost,and were required to verify sales performance before receiving subsidy payments). About 1.2 millionCFLs were subsidized and sold under the project. Using manufacturers' data about CFL sales and theaverage wattage of the lamps replaced by CFLs (obtained from consumer surveys conducted by amarket research firm), the project evaluators calculated avoided electricity generation of 725 GWh overthe life of the CFLs sold under the project.
Indirect sales. Data will come from annual CFL sales figures during the years following project comple-tion, most likely determined by market surveys conducted by an independent market research firm.These figures will be compared with preproject baseline estimates of CFL sales figures (estimated at600,000/year in 1994 and projected to grow to saturation of 4.7 million CFLs per year by 2012 in theabsence of the project, according to the project pre-appraisal report). Total sales during the project,including sales of unsubsidized lamps, were not measured.
Market structure/fuinction changes. There are a wealth of market structure/function data for this project.A third-party market research firm conducted numerous market research studies before, during, andafter the project. This research included a consumer response card survey, consumer studies, retailshop surveys, a sign and TV awareness survey, and wholesaler interviews. According to the surveydata, after the project 35% to 40% of the population was aware of CFLs (in contrast to an estimated 10%before the project, although there was no preproject survey data), 20% of households had CFLs (versus12% preproject, according to survey data), 54% of respondents knew someone with CFLs (versus 38%preproject from surveys), and about 97% of consumers were satisfied with CFLs purchased underproject. After the project, 75 % of retail shops were stocking CFLs, compared to 71 % before the project.There were a variety of other data sources as well. In a testimonial mailed to the project management,the Ministry of Education wrote "it is apparent that as a result of the project large numbers of studentsand teachers have gained useful insight into the use of energy and its impact on the environment." APELP evaluator wrote in 1997 that "CFLs have been successfully advertised in TV and print mediaover the last two years." Real CFL prices, after removal of subsidies, were lower by 30 % after theproject compared to preproject prices. Numerous CFL manufacturers have entered the Polish marketfor the first time, increasing competition. Discussions with CFL manufacturers show expectations ofan expanded market because of increased consumer awareness.
One other effect tracked by the project was the decrease in peak power demand in an electric powerdistribution system due to a DSM pilot component. This component included a six-month monitoringperiod of local distribution networks (six locations at both the 0.4kV and 15kV levels). The first monthof monitoring gathered sufficient data to develop a baseline power use profile. During the second andthird months, a CFL promotional campaign was conducted; during the fourth through six months, theimpact of CFL installations on the distribution system was monitored. Although the evaluation wasnot yet complete at the time of this report, prelininary indications in one distribution system showedreduced peak residential electricity demand of 15%. Additionally, some monitored householdsexhibited up to a 40% reduction in peak power demand after CFL installation.
38 Environrment Department Papers

Project Indicator and Evaluation Examples
Poland Efficient Lighting Project
Narrative Summary Key Performance IndicatorsGEF Operational Program: Market Sustainability IndicatorsRemoval of Barriers to EnergyEfficiency and Energy Retention rate of CFLs (share of worn-out CFLs replaced with new CFLs)Conservation
Continuation rates of dealers stocking CFLsDevelopment and Global Market Development IndicatorsObjectives
Improve the energy efficiency of Quantity of unsubsidized CFLs sold in the Polish marketelectric power end-use in Poland.In particular, (a) stimulate the CFL retail pricesmarket for energy-efficientlighting; and (b) develop the Number of manufacturers actively selling CFR in Poland.capacity of entities within Polandto deliver DSM resources and Quantities of dedicated CFL lurninaires sold pyr yeardemonstrate the value of DSM
Electricity saved by CFLs (kWh) and reductions in electric power distributionsystem peak loads (%)
Outputs Market Intervention Indicators
1. CFL sales to residential 1.1 Quantity of subsidized CFLs sold through the project (target 1.2 million)consumers
1.2 Percentage of lighting distributors/dealers stocking CFLs2. Public education program
2.1 Ratings of consumer satisfaction and acceptance of CFLs; consumer plans3. Utility DSM pilot program or deliberations to purchase CFLs
3.1 Percentage of consumers in targeted geographic areas who respond toDSM promotional campaign
3.2 Ratings of capabilities, interest, and plans of municipal governments toimplement DSM programs with CFLs
Climate Change Series 39
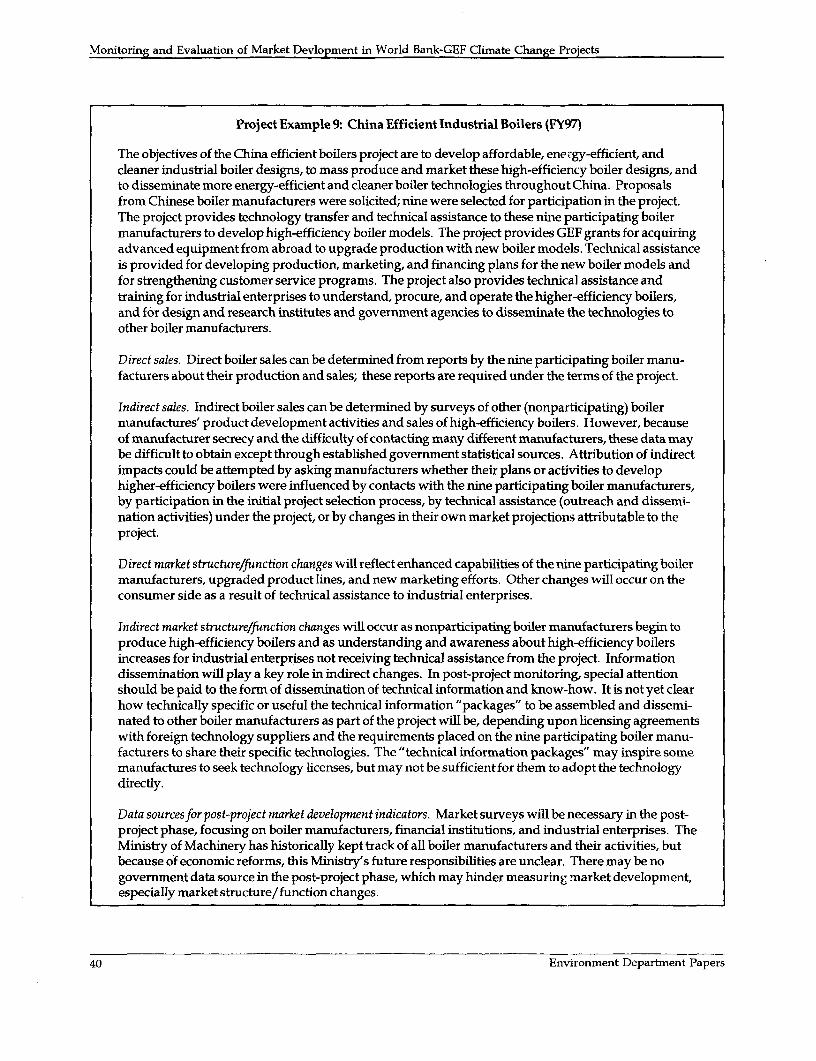
Monitoring and Evaluation of Market Devlopment in World Bank-GEF Climate Change Projects
Project Example 9: China Efficient Industrial Boilers (FY97)
The objectives of the China efficient boilers project are to develop affordable, ene rgy-efficient, andcleaner industrial boiler designs, to mass produce and market these high-efficiency boiler designs, andto disseminate more energy-efficient and cleaner boiler technologies throughout China. Proposalsfrom Chinese boiler manufacturers were solicited; nine were selected for participation in the project.The project provides technology transfer and technical assistance to these nine participating boilermanufacturers to develop high-efficiency boiler models. The project provides GEF grants for acquiringadvanced equipment from abroad to upgrade production with new boiler models. Technical assistanceis provided for developing production, marketing, and financing plans for the new boiler models andfor strengthening customer service programs. The project also provides technical assistance andtraining for industrial enterprises to understand, procure, and operate the higher-efficiency boilers,and for design and research institutes and government agencies to disseminate the technologies toother boiler manufacturers.
Direct sales. Direct boiler sales can be determined from reports by the nine participating boiler manu-facturers about their production and sales; these reports are required under the terms of the project.
Indirect sales. Indirect boiler sales can be determined by surveys of other (nonparticipating) boilermanufactures' product development activities and sales of high-efficiency boilers. However, becauseof manufacturer secrecy and the difficulty of contacting many different manufacturers, these data maybe difficult to obtain except through established government statistical sources. Attribution of indirectimpacts could be attempted by asking manufacturers whether their plans or activities to develophigher-efficiency boilers were influenced by contacts with the nine participating boiler manufacturers,by participation in the initial project selection process, by technical assistance (outreach and dissemi-nation activities) under the project, or by changes in their own market projections attributable to theproject.
Direct market structure/function changes will reflect enhanced capabilities of the nine participating boilermanufacturers, upgraded product lines, and new marketing efforts. Other changes will occur on theconsumer side as a result of technical assistance to industrial enterprises.
Indirect market structure/function changes will occur as nonparticipating boiler manufacturers begin toproduce high-efficiency boilers and as understanding and awareness about high-efficiency boilersincreases for industrial enterprises not receiving technical assistance from the project. Informationdissemination will play a key role in indirect changes. In post-project monitoring, special attentionshould be paid to the form of dissemination of technical information and know-how. It is not yet clearhow technically specific or useful the technical information "packages" to be assembled and dissemi-nated to other boiler manufacturers as part of the project will be, depending upon licensing agreementswith foreign technology suppliers and the requirements placed on the nine participating boiler manu-facturers to share their specific technologies. The "technical information packages" may inspire somemanufactures to seek technology licenses, but may not be sufficientfor them to adopt the technologydirectly.
Data sourcesfor post-project market development indicators. Market surveys will be necessary in the post-project phase, focusing on boiler manufacturers, financial institutions, and industrial enterprises. TheMinistry of Machinery has historically kept track of all boiler manufacturers and their activities, butbecause of economic reforms, this Ministry's future responsibilities are unclear. There may be nogovernment data source in the post-project phase, which may hinder measuring market development,especially market structure/function changes.
40 Environment Department Papers

Project Indicator and Evaluation Examples
China Efficient Industrial Boilers Project
Narrative Summary Key Performance IndicatorsGEF Operational Program: Market Sustainability IndicatorsRemoval of Barriers to EnergyEfficiency and Energy Continued financial and economic viability of high-efficiency boilerConservation production by manufacturers relative to conventional models
Development and Global Market Development IndicatorsObj ectives
Build the market for higher- Aggregate capacity of high-efficiency boilers produced and sold by all boilerefficiency industrial boilers in manufacturersChina. In particular, (a) developaffordable energy-efficient small- Sales share of high-efficiency boilers produceo .nd sold by all boilerand medium-scale coal-fired manufacturers, relative to total boiler sales (b- capacity; target 35% by 2002)industrial boiler designs; and (b)produce and market energy- Number of boiler manufacturers making improvements to the thermalefficient boiler designs efficiencies of their model boiler unitsthroughout China.
Outputs Market Intervention Indicators
1. Upgraded designs for existing 1.1 Aggregate capacity of high-efficiency boilers produced and sold by theChinese boiler models nine participating boiler manufacturers (target: 27,000 tph capacity by 2002,
two years after project completion)2. Nine participating boilermanufacturers have production 2.1 Sales share of high-efficiency boilers produced and sold by the nineequipment and capabilities to participating boiler manufacturers, relative to their total boiler sales (byproduce upgraded boiler models capacity totals)
3. Industrial enterprises and 2.2 Levels of higher thermal efficiencies achieved in model boiler units by thefinancial institutions nine participating boiler manufacturersknowledgeable about high-efficiency boilers 2.3 Ratings of capabilities of the nine participating boiler manufacturers to
design, produce, market, and service high-efficiency boilers4. Operators trained onupgraded boilers 3.1. Ratings of understanding and acceptance by industrial enterprises and
financial institutions of the technical, economic, and commercial viability of5. Boiler technology high-efficiency boilersdisseminated to manufacturersand design institutes. 4.1 Number of boiler operators trained and ratings of their capabilities to
operate high-efficiency boilers6. National boiler standards
5.1 Ratings of availability of high-efficiency boiler technology to boilermanufacturers and design and research institutes and their knowledge of thetechnology
6.1 Revised national boiler standards issued
Climate Change Series 41
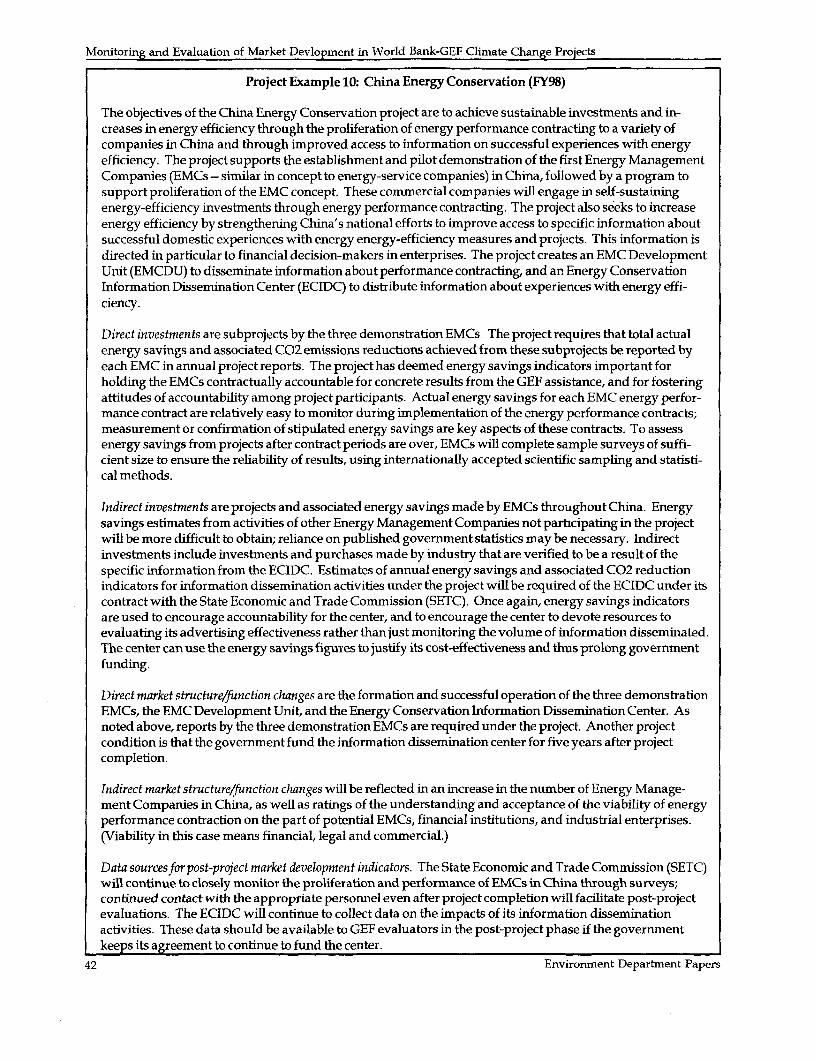
Monitoring and Evaluation of Market Devlopment in World Bank-GEF Climate Change Projects
Project Example 10: China Energy Conservation (FY98)
The objectives of the China Energy Conservation project are to achieve sustainable investments and in-creases in energy efficiency through the proliferation of energy performance contracting to a variety ofcompanies in China and through improved access to information on successful experiences with energyefficiency. The project supports the establishment and pilot demonstration of the first Energy ManagementCompanies (EMCs - similar im concept to energy-service companies) in China, followed by a program tosupport proliferation of the EMC concept. These commercial companies will engage in self-sustainingenergy-efficiency investments through energy performance contracting. The project also seeks to increaseenergy efficiency by strengthening China's national efforts to improve access to specific information aboutsuccessful domestic experiences with energy energy-efficiency measures and projects. This information isdirected in particular to financial decision-makers in enterprises. The project creates an EMC DevelopmentUnit (EMCDU) to disseminate information about performance contracting, and an Energy ConservationInformation Dissemination Center (ECIDC) to distribute information about experiences with energy effi-ciency.
Direct investments are subprojects by the three demonstration EMCs. The project requires that total actualenergy savings and associated C02 emissions reductions achieved from these subprojects be reported byeach EMC in annual project reports. The project has deemed energy savings indicators important forholding the EMCs contractually accountable for concrete results from the GEF assistance, and for fosteringattitudes of accountability among project participants. Actual energy savings for each EMC energy perfor-mance contract are relatively easy to monitor during implementation of the energy performance contracts;measurement or confirmation of stipulated energy savings are key aspects of these contracts. To assessenergy savings from projects after contract periods are over, EMCs will complete sample surveys of suffi-cient size to ensure the reliability of results, using internationally accepted scientific sampling and statisti-cal methods.
Indirect investments are projects and associated energy savings made by EMCs throughout China. Energysavings estimates from activities of other Energy Management Companies not participating in the projectwill be more difficult to obtain; reliance on published government statistics may be necessary. Indirectinvestments include investments and purchases made by industry that are verified to be a result of thespecific information from the ECIDC. Estimates of annual energy savings and associated C02 reductionindicators for information dissemination activities under the project will be required of the ECIDC under itscontract with the State Economic and Trade Commission (SETC). Once again, energy savings indicatorsare used to encourage accountability for the center, and to encourage the center to devote resources toevaluating its advertising effectiveness rather than just monitoring the volume of information disseminated.The center can use the energy savings figures to justify its cost-effectiveness and thus prolong governmentfunding.
Direct market structure/function changes are the formation and successful operation of the three demonstrationEMCs, the EMC Development Unit, and the Energy Conservation Information Dissemination Center. Asnoted above, reports by the three demonstration EMCs are required under the project. Another projectcondition is that the government fund the information dissemination center for five years after projectcompletion.
Indirect market structure/function changes will be reflected in an increase in the number of Energy Manage-ment Companies in China, as well as ratings of the understanding and acceptance of the viability of energyperformance contraction on the part of potential EMCs, financial institutions, and industrial enterprises.(Viability in this case means financial, legal and commercial.)
Data sourcesfor post-project market development indicators. The State Economic and Trade Commission (SETC)will continue to closely monitor the proliferation and performance of EMCs in China through surveys;continued contact with the appropriate personnel even after project completion will facilitate post-projectevaluations. The ECIDC will continue to collect data on the impacts of its information disseminationactivities. These data should be available to GEF evaluators in the post-project phase if the governmentkeeps its agreement to continue to fund the center.
42 Environment Department Papers
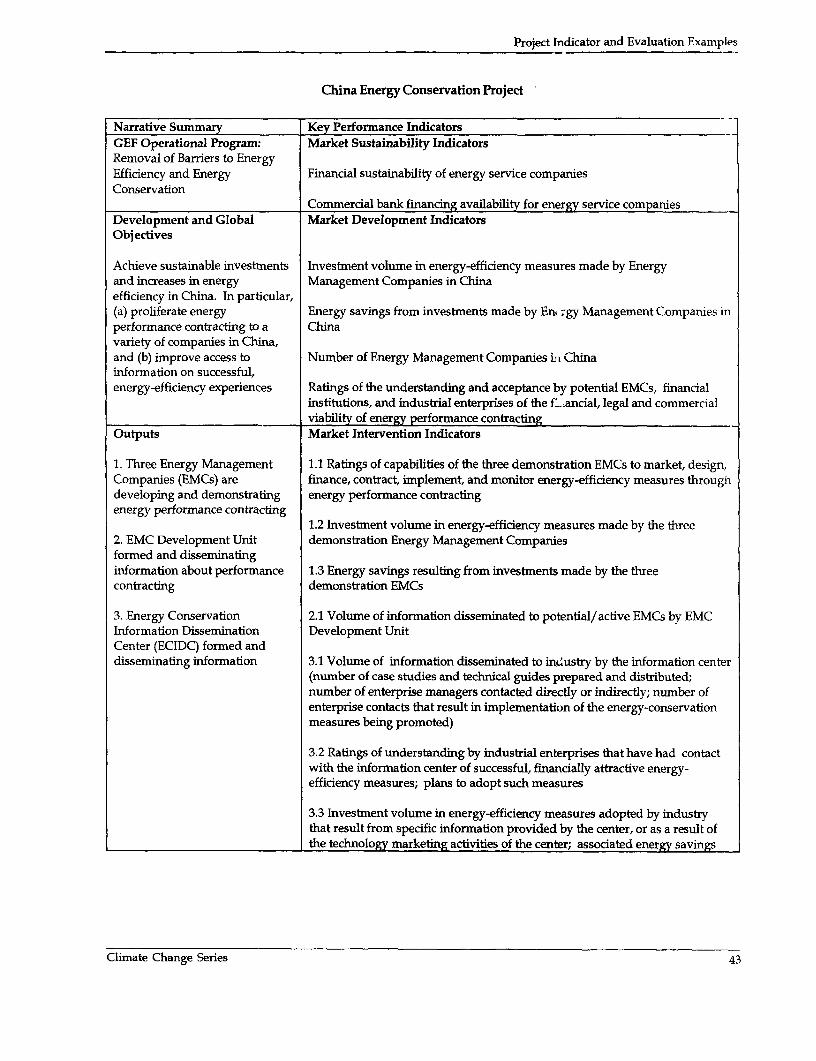
Project Indicator and Evaluation Examples
China Energy Conservation Project
Narrative Summary Key Performance IndicatorsGEF Operational Program: Market Sustainability IndicatorsRemoval of Barriers to EnergyEfficiency and Energy Financial sustainability of energy service companiesConservation
Commercial bank financing availability for energy service companiesDevelopment and Global Market Development IndicatorsObjectives
Achieve sustainable investtnents Investment volume in energy-efficiency measures made by Energyand increases in energy Management Companies in Chinaefficiency in China. In particular,(a) proliferate energy Energy savings from investments made by En . gy Management Companies inperformance contracting to a Chinavariety of companies in China,and (b) improve access to Number of Energy Management Companies i r Chinainformation on successful,energy-efficiency experiences Ratings of the understanding and acceptance by potential EMCs, financial
institutions, and industrial enterprises of the f ancial, legal and commercialviability of energy performance contracting
Outputs Market Intervention Indicators
1. Three Energy Management 1.1 Ratings of capabilities of the three demonstration EMCs to market, design,Companies (EMCs) are finance, contract, implement, and monitor energy-efficiency measures throughdeveloping and demonstrating energy performance contractingenergy performance contracting
1.2 Investment volume in energy-efficiency measures made by the three2. EMC Development Unit demonstration Energy Management Companiesformed and disseminatinginformation about performance 1.3 Energy savings resulting from investments made by the threecontracting demonstration EMCs
3. Energy Conservation 2.1 Volume of information disseminated to potential/active EMCs by EMCInformation Dissemination Development UnitCenter (ECIDC) formed anddisseminating information 3.1 Volume of information dissemmnated to industry by the information center
(number of case studies and technical guides prepared and distributed;number of enterprise managers contacted directly or indirectly; number ofenterprise contacts that result in implementation of the energy-conservationmeasures being promoted)
3.2 Ratings of understanding by industrial enterprises that have had contactwith the information center of successful, financially attractive energy-efficiency measures; plans to adopt such measures
3.3 Investment volume in energy-efficiency measures adopted by industrythat result from specific information provided by the center, or as a result ofthe technology marketing activities of the center; associated energy savings
Climate Change Series 43


Annex A: Determining AvoidedC02 Emissions
Climate change projects can measure avoided and power plant efficiencies. The simplestC02 emissions from direct project physical approach is to assume a particular fuel type andoutputs and can estimate avoided C02 emissions use standard or average emissions factors, powerfrom market development indicators if a suitable plant efficiencies, and transmission losses. Moremarket development baseline exists. The units in sophisticated approaches use generation dis-which to express,measurements of these avoided patch models to determine marginal fuel-typeC02 emissions should always be carefully displacement (which could also account for thespecified, because there are several different ways time-of-day of renewable energy production andto quantify avoided C02: annual avoided its coincidence with peaking generation plants)emissions for a specific year, total avoided and use measured emissions factors and genera-emissions over the equipment lifetime, cumulative tion and transmission efficiencies.avoided emissions from some base year, or totalavoided emissions over a specific target time For solar home PV systems, baseline surveys ofperiod. Measuring avoided C02 emissions kerosene consumption for different categories ofrequires technical methodologies related to end- households are necessary to accurately establishuse energy metering, take-back effects, capacity the baseline C02 emissions. Because no meteringfactors of renewable energy technologies, conven- data are available from typical solar home PVtional-fuel shares used in electricity production, installations, three approaches to measuringemissions factors of different fuels, transmission energy consumption and avoided C02 emissionsand distribution losses in electricity or district- can be used singly or in combination: (1) meter-heat supply systems, and marginal vs. average ing of kWh from solar PV of a statistical sample ofelectric power capacity displacement. Guidelines households, based on assumptions about avoidedfor measurement and evaluation of these indica- kerosene purchases; (2) surveys of householdstors are provided in two World Bank documents: regarding daily hours of operation of PV systemsGreenhouse GasAbatement Investment Project based on assumptions about kWh generation andMonitoring and Evaluation Guidelines (1994) and avoided kerosene purchases; and (3) surveys ofGreenhouse Gas Assessment Handbook (1998). households regarding avoided kerosene pur-Several other protocols developed for climate- chases.change mitigation projects also address measure-ment and evaluation approaches. See Vine and For energy-efficiency measures in power plants orSathaye (1997) for a survey of protocols and U.S. industrial processes with on-site fuel combustion,Department of Energy (1997) for a proposed energy-savings estimates may be availableinternational protocol. directly in the form of avoided fuel consumption,
in which case C02 emissions can be calculatedFor grid-connected renewable energy installa- using standard emissions factors. If energy-tions, electricity generation data should be readily savings estimates are in the form of avoidedavailable from utilities and/or project operators. electricity or heat consumption, then fuel andHowever, translating these figures into avoided power-plant types as well as distribution lossesGHG emissions requires information about the for electricity or heat generation must be known ormarginal displaced generation source of the estimated for the energy-supply system thatelectric power grid and about transmission losses
Climate Change Series 45

Monitoring and Evaluation of Market Devlopment in World Bank-GEF Climate Change Projects
serves each end-use site claiming energy savings. specify that avoided C02 will be determined fromFor end-use electricity-efficiency measures, published technical efficiencies at a point twodetermining avoided C02 emissions uses a years after project completion, and participatingprocess similar to that used for the grid-connected manufacturers could be required to submit theserenewable energy case above, given an estimate of data.the end-user's avoided kWh consumption.
Indirect avoided C02 emissions for both renew-For high-efficiency equipment production, for able energy and energy efficiency are much moreexample in the case of high-efficiency coal boilers difficult to estimate. Estimates require compari-supplanting low-efficiency ones, determining son of market development indicators against aavoided C02 is fairly straightforward. Avoided market-forecast baseline which shows where thecoal consumption can be determined from market was projected to be and attributes thepublished technical efficiencies of the energy- observed changes to the project itself (as dis-efficient boilers sold compared to consumption of cussed in Section 3). Observed changes in theordinary boilers of similar capacity available on market (in terms of sales or investments) mustthe market. Estimates must then be made of daily then be translated into equivalent energy produc-operating usage. Accuracy of estimates can be tion or energy savings estimates, to which theimproved through surveys of boiler operators to methodologies descrioed above can be applied.determine this daily usage. A project could
46 Environment Department Papers
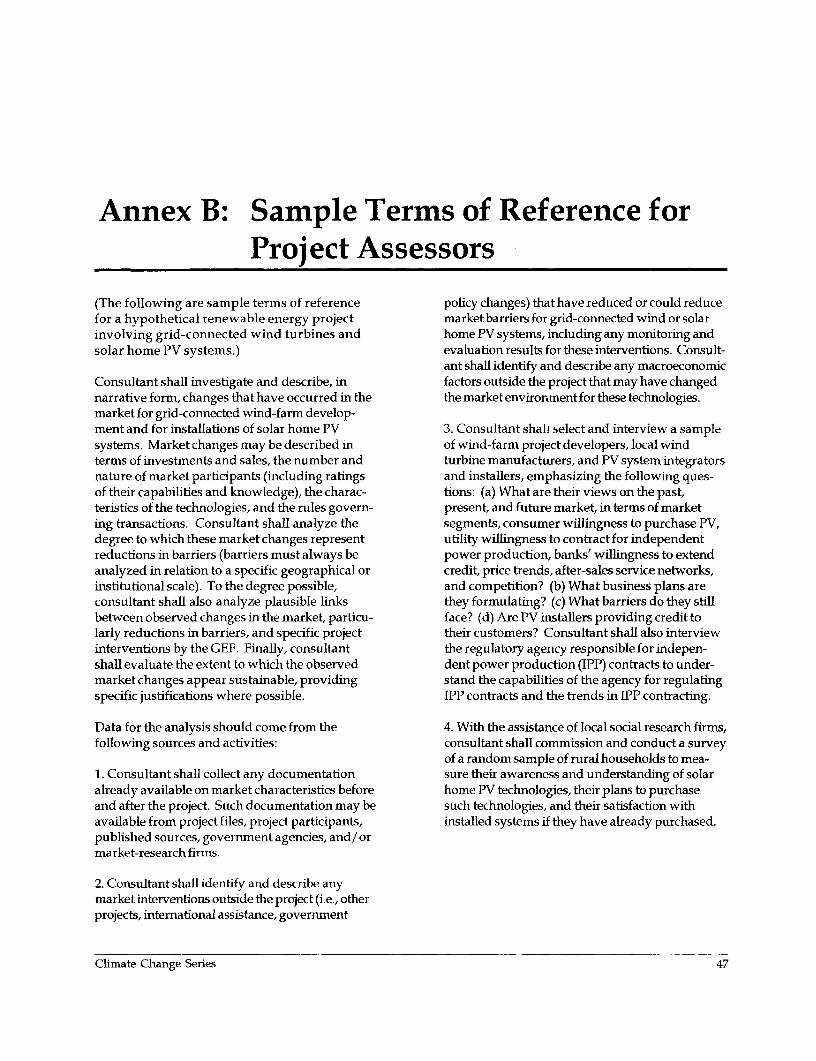
Annex B: Sample Terms of Reference forProject Assessors
(The following are sample terms of reference policy changes) that have reduced or could reducefor a hypothetical renewable energy project market barriers for grid-connected wind or solarinvolving grid-connected wind turbines and home PV systems, including any monitoring andsolar home PV systems.) evaluation results for these interventions. Consult-
ant shall identify and describe any macroeconomicConsultant shall investigate and describe, in factors outside the project that may have changednarrative form, changes that have occurred in the the market environment for these technologies.market for grid-connected wind-farm develop-ment and for installations of solar home PV 3. Consultant shall select and interview a samplesystems. Market changes may be described in of wind-farm project developers, local windterms of investments and sales, the number and turbine manufacturers, and PV system integratorsnature of market participants (including ratings and installers, emphasizing the following ques-of their capabilities and knowledge), the charac- tions: (a) What are their views on the past,teristics of the technologies, and the rules govern- present, and future market, in terms of marketing transactions. Consultant shall analyze the segments, consumer willingness to purchase PV,degree to which these market changes represent utility willingness to contract for independentreductions in barriers (barriers must always be power production, banks' willingness to extendanalyzed in relation to a specific geographical or credit, price trends, after-sales service networks,institutional scale). To the degree possible, and competition? (b) What business plans areconsultant shall also analyze plausible links they formulating? (c) What barriers do they stillbetween observed changes in the market, particu- face? (d) Are PV installers providing credit tolarly reductions in barriers, and specific project their customers? Consultant shall also interviewinterventions by the GEF. Finally, consultant the regulatory agency responsible for indepen-shall evaluate the extent to which the observed dent power production (IPP) contracts to under-market changes appear sustainable, providing stand the capabilities of the agency for regulatingspecific justifications where possible. IPP contracts and the trends in IPP contracting.
Data for the analysis should come from the 4. With the assistance of local social research firms,following sources and activities: consultant shall commission and conduct a survey
of a random sample of rural households to mea-1. Consultant shall collect any documentation sure their awareness and understanding of solaralready available on market characteristics before home PV technologies, their plans to purchaseand after the project. Such documentation may be such technologies, and their satisfaction withavailable from project files, project participants, installed systems if they have already purchased.published sources, government agencies, and/ormarket-research firms.
2. Consultant shall identify and describe anymarket interventions outside the project (i.e., otherprojects, international assistance, government
Climate Change Series 47


Annex C: Review of Literature on MarketTransformation Assessment
Literature on assessment of market transforma- with rebates and other DSM programs, a markettion for energy efficiency in the United States is transformation approach considers that utilitiesrelevant to the GEF because there is a strong should act to transform the broader market in aparallel between U.S. electric utility efforts to sustainable manner. Market transformationstimulate energy efficiency during the past two entails reducing market-barriers and expandingdecades and GEF climate-change operational the role of energy-efficient products and services.programs. At first, utilities were concerned with One theme of the market transformation literaturethe direct energy savings of their demand-side is the "spillover" effects of traditional DSMmanagement (DSM) programs, and a whole programs, "unintended impacts" on "nonpartici-industry and literature evolved to assess the pants" in the broader market (such as consumersdirect energy savings resulting from these pro- who install an energy-efficient technologygrams (Nadel 1992; Violette et al. 1998). This without the subsidy or incentive offered by thestage in utility DSM could be likened to the GEF's DSM program). Another theme of market trans-pilot phase, in which many projects directly formation literature concerns strategies andsubsidized (via incremental cost methodologies) regulatory approayhes to encourage utilities toenergy efficiency and renewable energy technolo- pursue market transformation. A small segmentgies, and success has been measured by direct of the literature focuses on measuring the impactsphysical changes and associated avoided GHG of market transformation programs; this segmentemissions. In the U.S. electric utility industry, as is the most relevant to GEF attempts to assess theawareness has grown regarding the potential to long-term impacts of operational programs #5alter markets for energy-efficiency efficient and #6.technologies, the new concept of market transfor-mation has emerged. One of the reasons that the literature on measur-
ing the impacts of market transformation hasThe objective of market transformation is similar remained small is that measuring market impactsto the objective of GEF programs to reduce barriers is even more problematic than measuring theto energy efficiency and renewable energy. The effects of traditional DSM programs. "MeasuringNational Association of Regulatory Utility market transformation will be a daunting chal-Commissioners defines market transformation as: lenge, requiring major changes in the focus and"changing the types of products or services that methodology of DSM evaluation," according toare offered in the market, the basis on which Prahl and Schlegel (1993). Wirtshafter andpurchase and behavioral decisions are made, the Sorrentino (1994) conclude that "closer examina-type or number of actors in the market, or in some tion of the data requirements [for measuringother way altering this set of interactions in a self- market transformation] indicates that majorsustaining way" (Hastie 1995, p.S-1). increases in the costs of evaluation [compared to
costs for DSM programs] are likely to be requiredThe literature on market transformation has its to evaluate market transformation programs"roots in utility demand-side-management (DSM) (p.10.262).approaches. Instead of targeting "participants"
Climate Change Series 49
Monitoring and Evaluation of Market Devlopment in World Bank-GEF Climate Change Projects
Dimensions and Nature of a Market Market Change Indicators
Feldman (1994) defines a market as "a system for Feldman (1995) provides a number of generalthe voluntary exchange of certain economic goods market-change indicators, such as:and services between individuals or groups,according to rules" (p.8.42). The three key * Market saturationdefining dimensions of a market are: * Market share
* Number and nature of participants Technology penetration rate* Variety and characteristics of the products * Number of dealers/distributors
and services available * Number of manufacturers* Rules governing exchanges that occur. * Distribution of market among different
size manufacturersThese dimensions must be included in any * Price levelsbaseline characterization of a market. Interven-tions that are designed to alter the market can be ret iesmentsassessed in terms of whether the number and * Market segments servednature of participants changes, whether the mix * Standardsof economic goods and services exchanged is * Irfrastructurealtered, and/or whether the rules of exchange are * New entrants, andreconstructed (see Box 1 for examples). Many * New product models.authors emphasize, however, that markets are farfrom static and market change is a very complex Most of the above indicators are sales related.process. Markets are dynamic, interactive, and Some ofvthe asuringicaersrresales costschange over time in response to combinations of Some involve measuring the transacton costs
mayfcos inherent in the current market. Feldman pointsmany factors.
Box 1: Examples of Changes in a Market (Feldman 1994)
Number and nature of participants
New buyers or sellers may enter the market; e.g., customers who previously could not afford efficienttechnologies or distributors who did not stock efficient units.
Entrepreneurs may enter the market to provide previously difficult-to-obtain services, such asensurmg the functional effectiveness of-building systems (commissioning).
Variety and characteristics of the products and services available
New technologies may be developed or inefficient production may be phased out as demandchanges or competing options are introduced.
Supplies of new products may increase and become more readily available.
Rules governing exchanges that occur
Customers may ask sup pliers about new technologies or features, such as the energy efficiency ofproducts offered for sale.
Sellers may promote energy efficiency as an expected attribute of their products or services.
Prices of energy-efficient products may decline.
50 Environment Department Papers

Annex C: Review of Literature on Market Transformation Assessment
out that sales data are often very difficult to * Dealer information on customeracquire and that measurement of prevailing awarenesstransaction costs may be a cheaper, more expedi- * Dealer training received from producersent "proxy" indicator of market changes than and distributions (as a measure ofmeasuring sales data. Further, sales data are producer commitment)trailing indicators because sales are the final * R prices of more-efficient and less-outcome of a whole range of market interactionsand dynamics. In general, Feldman advocates the efficientrefrigerator modelsuse of leading indicators. Changes in transaction * Public statements from the industrycosts and distribution networks could be consid- * Institutionalized organizational andered leading indicators (see section below on product-line changes by producers, andmarket barrier indicators) because, "increased * Producers' statements about the effectssales are simply indirect evidence that transaction of a program on their decisions andcosts have been reduced" and products.
The effectiveness of market transformation Weisbrod, Hub, and Kelleher (1994) give anprograms should not be judged only by savings indication of the difficulty but not impossibility ofachieved or by surrogate measures such as getting sales data, at least in a developed country.sales of efficient products and services. In- Producers of lighting, air conditioners, andstead, evaluation of market transformation motors in the U.S. were asked to report the shareprograms should also focus on the identifica- of sales that was for highly-energy-efficienttion and measurement of transaction costs. equipment in two separate years, before and afterAmong the transaction costs that can be interventions that were being evaluated. Of the 36identified are hassle, lack of information, and producers responding, 15 were willing to discloseavoidance of risk [e.g., concern over potential the information for the most recent year, and 12product failure or premature wear-out]. were willing to disclose it for both years.Marketers and analysts can readily specifyproximate indicators of each of these costs. Feldman (1995 and 1996) suggests applying theSample indicators might include, e.g., the following selection criteria to decide whichnumber and distribution of retail outlets (as a market change indicators to use. Feldmanmeasure of hassle imposed on the purchaser) recommends considering whether the indicatorsor the marginal expenditures required to make are:customers aware of a new technology and itsbenefits (as a measure of information costs * Meaningful (results can be communi-imposed on sellers). The monitoring and cated to executives or commissioners)analysis of changes in these gauges yield Theoreticall defensible results relate topartial estimates of the value added by market ytransformation programs. (Feldman, 1995, p.ii) an underlyig theory of market transfor-
Lee and Conger (1996) agree that leading indica- * Easy to apply (measurement rules can betors are more useful because there are likely to be readily learned and used)fewer confounding factors, so evaluators can have * Inexpensive (they require only limited,increased confidence in causal attribution. In readily available data)addition, leading indicators "are more likely to * Reliable (different evaluators can repeatprovide better insights into how well the program the measurement procedures)is working or if and how program elements * Sensitive (they change rapidly withshould be changed" (p.3.70). Some specific changes in marketing strategies)examples of leading indicators for the U.S. Super- . Actionable (results suggest whether toEfficient Refrigerator Program are: Actin, (rd,ultschugge pro
maintain, discard, or change program)
* Efficient refrigerator models on the floor and* Verifiable (alternative measurementof dealers
* Dealer in-store displays and sales techniques provide convergent results).
techniques
Climate Change Series 5

Monitoring and Evaluation of Market Devlopment in World Bank-GEF Climate Change Projects
Violette and Rosenberg (1995) suggest using * Local capacity for market diffusionequipment saturation surveys to measure market a Availability of local financingchanges and to develop time-series of the penetra- .Availability of publc-or private-sectortion of efficient equipment. Periodic interviews financilgand focus groups with trade ally panels can be financinganother source of market change information. Development of new institutions andQuestions can be asked about general market their characteristics and effectivenessconditions and stocking and sales patterns. * Dissemination of informationPeriodic interviews with stable panels of market * Changes in policy or regulatory frame-participants can increase data reliability and workvalidity. * Plans of utilities
Market change indicators should change over Development or number independenttime relative to a baseline. To establish baselne power sales contractsmarket data, some of the following indicators can * Commercial bank loans and programs forbe used in conjunction with the market change renewable ene r gy investmentsindicators above: * Investor confidence
* Consumer sat .ssfaction.
* Past market performance When market barriers are measured, many* Market projections for the future, and aspects of markets ma, be wrongly ignored* Underlying macroeconomic/institutional because of a focus on consumers and producers.
conditions. For example, dealer and distributor comfort witha new technology can be the critical determinant
An approach taken by Weisbrod, Hub, and of changes in a market in cases where consumersKelleher (1994) was to consider overall national have developed trust in dealers and distributorstrends as the baseline and to examine market and look to them for guidance and information.changes in particular regions of the country (or Feldman (1994) describes an example:electric utility service territories) relative to thenational trends. The problem with this approach, In Wisconsin, air conditioner dealers in somethey note, is that differences in energy prices or of our focus groups have described their effortsregulations in different regions can skew the data. to be perceived as trusted recommenders and
suppliers. They have also told us how they sellagainst high efficiency units, fearing that
Market Barrier Indicators customers will be disappointed with thepayback and blame them for encouraging
Measurement of market barriers can provide a overinvestment in the technology. (p.8.41)proxy, leading indicator of changes in a market. Inparticular, changes in transactions costs can reflect Measurement must account for all market partici-changes in market barriers. Some examples of pants, including producers, distributors, consum-barriers to energy-efficient technologies include: ers, financiers/intermediaries, regulators/
governments, media, and NGOs.* Knowledge and perceptions of market
participants and would-be participants* Skills of market participants and would- Proving Causality
be participantsbeD gre f ,pati The question of what constitutes evidence ofDegreeofparticipantsi(ban, poor coins pers, e. causality - how specific project interventionsparticipants (banks, poor consumers, etc.)casC0reutosbynthbslie-scause C02 reductions beyond the baseline -has
* Presence or absence of specific technologies been characterized as especially problematic inor technological practices the literature. One landmark study by Kushler,
* existence of institutional arrangements Schlegel, and Prahl (1996) measured differencesand legal frameworks between two states (Wisconsin and Michigan) in
* Presence of industry "standard prac-tices" codified or informal
52 Environment Department Papers

Annex C: Review of Literature on Market Transformation Assessment
the penetration of high-efficiency gas furnaces confirmed the importance of having a [efficient]and attempted to prove causality by using one model on the floor for consumers to see and askstate as a "control." They concluded that "a about.series of government and utility actions toencourage installations of high-efficiency The literature offers two divergent approaches tonatural gas furnaces in Wisconsin has almost causality: (a) attempt to establish and provecompletely transformed the market (90 percent of causal links to project interventions; or (b) ignorenew furnaces purchased ... were high efficiency), causal links and set overall market change targetswhereas a neighboring state (Michigan) that did that should be achieved (perhaps in partnershipnot pursue those initiatives has experienced a with other activities by the government or othermuch lower level of market penetration ( ... 37 parties) regardless of the extent to which thepercent ...)" (p.3.59). But such tailor-made interventions of a specific project contributed.situations are not common, especially in devel-oping countries, and thus such "controls" are A careful appraisal of the most suitable of theseusually unavailable. two approaches is critical for GEF projects; the
second approach could well be more cost-effectiveWirtshafter and Sorrentino (1994) acknowledge than the first. In either case, "regulators whothat "nothing as conclusive as 'fingerprints on want to take advantage of the substantial andthe murder weapon' exist for [market transforma- lasting impacts promised by market transforma-tion] programs" and that "any proof available tion programs will probably want to require thatwill be, at best, circumstantial" (p.10.262). Thus pre-implementation agreements be reached ... withany attempt to prove causality will rely on regard to what will constitute evidence of impactscircumstantial evidence and a credible "story" for specific programs" (Hastie 1995, p.S-8).(Herman et al 1997). Wirtshafter and Sorrentinogo on to say that "the circumstantial nature of theevidence means that regardless of the size of the The Time Dimension andinvestment in evaluation activities, utility cost Technology Diffusionrecovery [cost effectiveness of market interven-tions] remains uncertain" (p.10.2 6 3 ). The dimension of time is brought to the under-
standing of markets from the literature on technol-ne important aspetd of proving causality is ogy diffusion (Rogers 1995). Formally, Rogers
attempting to understand why consumers make defines technology diffusion as "the process bycertain purchase decisions. A consumer's decision which an innovation is communicated throughto accept a new product involves stages of transfor- certain channels over time among the members ofmation from awareness to positive identification to a social system" (p.10). There are three ways timeattempted purchase. Causality means showing is introduced. First, the S-shaped technologychanges in behavior anywhere along this con- diffusion curve represents the rate of adoption oftinuum. The process is dynamic: the consumer's a new technology over time (Figure 1). Secondly,opinion changes over time as do the availability, Rogers characterizes different stages of the curvecharacterisics, and price of products. Measuring as modeling the adoption of an innovation by fivechanges in consumer behavior requires tracking different adopter categories - innovators, earlyconsumer attitudes and awareness before and after adopters, early majority, late majority, and laggards.
Third, over time, individual adopters progressthrough five different stages with respect to
One clear example of causality related to con- adoption of a new technology. These five stagessumer purchase decisions is provided by Lee and are awareness (potential adopters are learningConger (1996, p.3.73): about an irmovation for the first time), persuasion
(potential adopters are actively seeking outDealers who mentioned that they had con- information about the innovation in order to makeducted more promotonal actvities tended to a decision), decision (potential adopters havesell a larger share of [efficient] units. Dealers decided to adopt the innovation), implementationwho did not stock [efficient] units consistently (adopters have carried out the decision), andsaid that they sold an almost negligible vernflcation (adopters have verified whether theamount. Although not surprising, this finding decision was a good one).
Climate Change Series 53

Monitoring and Evaluation of Market Devlopment in World Bank-GEF Climate Change Projects
Thus an understanding of how and when The concept of communication networks is alsodifferent groups of adopters progress through important to an understanding of markets. Howeach adoption stage can be an important source of do market actors learn about technologies andmarket change information. Too often projects decide to adopt them? According to Rogersmay promote awareness but stop there and do (1995):little to assist potential adopters in seekingtechnology-evaluation information in the persuasion ... mass media channels are more effective instage and in finally making a decision. Thus creating knowledge of innovations, whereasalthough project evaluations can start by measur- interpersonal channels are more effective ining awareness of a technology, they should go forming and changing attitudes toward a newfurther to ask whether potential adopters have idea, and thus in influencing the decision toactively sought more information about a technol- adopt or reject a new idea. Most individualsogy, whether they have initiated a discussion evaluate an innovation, not on the basis ofabout the technology with others, whether they scientific research by experts, but through thehave decided to purchase a technology, and if so subjective evaluation of near-peers who havewhen they plan to purchase. Those who have adopted the innova ion. (p.36)adopted can be asked to what extent they haveevaluated their decision and whether they believe In Rogers' conception there are two ways thatit was a good decision. Potential adopters are innovations are diffused. Early adopters learndefined broadly here - including consumers, about an innovation directly through changeindustrial enterprises, government agencies, and agents or media channels and decide to adoptelectric power utilities. based on these contacts. However, most adoption
of new innovations occurs through the exchangeFigure 1: Technology Diffusion Curve of subjective evaluations of the irnovation among
peers. Reed and Hall (1997), conclude that "asignificant factor affecting the rate of adoption of
ADOPTION innovations is the degree to which an innovationpenetrates social networks... a major key to bothimplementing a market transformation programand determining its effects is understanding thestructure of the market network" (pp.179,181).
TIME
54 Environment Department Papers

Bibliography
Aaker, David A. and G.S. Day. 1986. Marketing Research. Third Edition. New York: John Wiley & Sons.
Feldman, Shel.1994. "MarketTransformation: HotTopic or Hot Air?" In Proceeiings of the 1994 ACEEE SummerStudy on Energy Efficiency in Buildings. Washington, DC: American Cour cil for an Energy-EfficientEconomy.
Feldman, Shel. 1995. "How Do We Measure the Invisible Hand?" In Energy Program Evaluation: Uses, Methods,and Results, Proceedings of 1995 International Energy Program Conference, Chicago. Washington, DC:American Council for an Energy-Efficient Economy.
Feldman, Shel. 1996. On Estimating the Value Added Through Market Transformation. Oak Ridge, TN: Oak RidgeNational Laboratory.
Geller, Howard and Steven Nadel. 1994. "Market Transformation Strategies to Promote End-Use Efficiency."Annual Review of Energy and the Environment 19:301-346.
Global Environment Facility. 1996. Operational Strategy. Washington, DC.
Global Environment Facility. 1997. Operational Programs. Washington, DC.
Golove, W.H., and J.H. Eto. 1996. Market Barriers to Energy Efficiency: A Critical Reappraisal of the RationaleforPublic Policies to Promote Energy Efficiency. Berkeley, CA: Lawrence Berkeley National Laboratory.
Granda, Chris. 1997. "Case study: The IFC/GEF Poland Efficient Lighting Project." In Right Light 4.Proceedings of the 4th European Conference on Energy-Efficient Lighting. Stockholm: Association of DanishElectric Utilities and the International Association for Energy Efficient Lighting.
Hastie, Stephen M. 1995. Market Transformation in a Changing Utility Environment. Prepared for the NationalAssociation of Regulatory Utility Commissioners (NARUC). Bala Cynwyd, PA: Synergic ResourcesCorp.
Herman, Patricia, Shel Feldman, Shahana Samiullah, Kirsten Stacey Mounzih. 1997. "Measuring MarketTransformation: First You Need a Story..." In The Future of Energy Markets: Evaluation in a ChangingEnvironment., Proceedings of the International Energy Program Evaluation Conference, Chicago, pp.319-326. Washington, DC: American Council for an Energy-Efficient Economy.
Henriques, Derek G. 1993. "High Efficiency Motors - Success at Changing the Market in British Columbia." InProceedings of Second International Energy Efficiency & DSM Conference. Stockholm, Sweden.
Climate Change Series 55

Monitoring and Evaluation of Market Devlopment in World Bank-GEF Climate Change Projects
Hirst, E. and M. Brown. 1990. "Closing the Efficiency Gap: Barriers to the Efficient Use of Energy." Resources,Conservation and Recycling 3:267-281.
Kozloff, Keith and Olatokumbo Shobowale. 1994. Rethinking Development Assistancefor Renewable Electricity.Washington, DC: World Resources Institute.
Kushler, M., J. Schlegel and R. Prahl. 1996. "A Tale of Two States: A Case Study Analysis of the Effects ofMarket Transformation." In Proceedings of the 1996 ACEEE Summer Study on Energy Efficiency inBuildings. Washington, DC: American Council for an Energy-Efficient Economy.
Lee, Allen D. and R. Conger. 1996. "MarketTransformation: Does it Work? - The Super Efficient RefrigeratorProgram." In Proceedings of the 1996 ACEEE Summer Study on Energy Efficiency in Buildings.Washington, DC: American Council for an Energy-Efficient Economy.
Levine, Mark D., Eric Hirst, Jonathan G. Koomey, James E. McMahon, Alan H. Sanstad. 1994. Energy Efficiency,Market Failures, and Government Policy. Berkeley, CA: Lawrence Berkeley Laboratory.
Martinot, Eric and Nils Borg. (1999). "Energy-Efficient Lighting Programs: Experience and Lessons from EightCountries." Energy Policy, in press.
Mosse, Roberto and Leigh Ellen Sontheimer. 1997. Perfornance Monitoring Indicators Handbook. Technical PaperNo. 334. Washington, DC: World Bank.
Nadel, Steven. 1992. "Utility Demand-Side Management Experience and Potential - A Critical Review."Annual Review of Energy and the Environment 17:507-535.
Nadel, Steven and H. Geller. 1994. "Market Transformation Programs: Past Results, Future Directions." InProceedings of the 1994 ACEEE Summer Study on Energy Efficiency in Buildings. Washington, DC:American Council for an Energy-Efficient Economy.
Nadel, Steven and Linda Latham. 1994. The Role of Market Transformation Strategies in Achieving a MoreSustainable Energy Future. Washington, DC: American Council for an Energy-Efficient Economy.
Prahl R, Schlegel J. 1993. "Evaluating market transformation.' In Energy Program Evaluation: Uses, Methods, andResults. Proceedings of the National Energy Program Evaluation Conference, Chicago, pp. 469477.Washington, DC: American Council for an Energy-Efficient Economy.
Reddy, Amulya K.N. 1991. "Barriers to Improvements in Energy Efficiency." Energy Policy, December, pp. 953-961.
Reed, John H. and Nicholas P. Hall. 1997. "Methods for Measuring Market Transformation." In The Future ofEnergy Markets: Evaluation in a Changing Environment. Proceedings of the International Energy ProgramEvaluation Conference, Chicago, pp. 177-184. Washington, DC: American Council for an Energy-Efficient Economy.
Rogers, Everett M. 1995. Diffusion of Innovations. New York: Free Press.
Saxonis, William P. 1997. "Market Transformation: Real Problems, Real Answers." In The Future of EnergyMarkets: Evaluation in a Changing Environment. Proceedings of the International Energy ProgramEvaluation Conference, Chicago, pp. 171-176. Washington, DC: American Council for an Energy-Efficient Economy.
56 Environrnent Department Papers

Bibliography
Suozzo, Margaret and S. Nadel, 1996. "Learning the Lessons of Market Transformation Programs." Proceedingsof the 1996 ACEEE Summer Study on Energy Efficiency in Buildings. Washington, DC: American Councilfor an Energy-Efficient Economy.
U.S. Department of Energy. 1997. International Performance Measurement and Verification Protocol. DOE/ EE-0157.Washington, DC.
Vine, Edward, and Jayant Sathaye. 1997. The Monitoring, Evaluation, Reporting, and Verfication of Climate ChangeMitigation Projects: Discussion of Issues and Methodologies and Review of Existing Protocols and Guidelines.Berkeley, CA: Lawrence Berkeley National Laboratory.
Violette, Dan and M. Rosenberg, 1995. "Setting a Research Agenda for Assessing Market Transformation andSpillover." In Energy Program Evaluation: Uses, Methods, and Results. Proceedings of the 1995International Energy Program Evaluation Conference, Chicago. Washington, DC: American Council foran Energy-Efficient Economy.
Violette, Daniel, Shannon Ragland and Franklin Sterm. 1998. Evaluating Greenhouse Gas Mitigation ThroughDSM Projects: Lessons Learnedfrom DSM Evaluation in the United States. P.. epared for the World Bank.Washington, DC: Hagler-Bailly.
Weisbrod, Glen, A. Hub and M. Kelleher, 1994. "Separating DSM Impacts from Technology Trends: AComparison of National and State Surveys of Manufacturers and Distributors." In Proceedings of the1994 A CEEE Summer Study on Energy Efficiency in Buildings. Washington, DC: American Council for anEnergy-Efficient Economy.
Wirtshafter, Robert M. and A. Sorrentino, 1994. "Proving Causality in Market Transformation Programs: Issuesand Alternatives." In Proceedings of the 1994 ACEEE Summer Study on Energy Efficiency in Buildings.Washington, DC: American Council for an Energy-Efficient Economy.
World Bank. 1993. Energy Efficiency and Conservation in the Developing World. Washington, DC.
World Bank. 1994. Greenhouse Gas Abatement Investment Project Monitoring and Evaluation Guidelines.Enviromnent Department. Washington, DC
World Bank. 1996. "Designing Project Monitoring and Evaluation." Lessons and Practices No.8 (June).Operations Evaluation Department. Washington, DC.
World Bank. 1997a. "EvaluatingDevelopmentOperations: Methods forJudgingOutcomes andImpacts."Lessons and Practices No.10 (November). Operations Evaluation Department. Washington, DC.
World Bank. 1997b. Rural Energy and Development: Improving Energy Suppliesfo?2 Billion People. Washington,DC.
World Bank. 1998. Greenhouse Gas Assessment Handbook: A Practical Guidance Documentfor the Assessment ofProject-level Greenhouse Gas Emissions. April draft. Environment Department. Washington, DC.
Climate Change Series 57


Envi ronment DepartmentThe World Bank1 8 18 Hi Street, N.W.Washington, D.C. 20433202 473 3641 202 477 0565 FAx
@Printed on 1,00% post-consumer recycled paper