world bank documentdocuments.worldbank.org/curated/en/229921468244545762/pdf/multi0page.pdf · 6...
TRANSCRIPT

Document of
The World Bank
FOR OMCIAL USE ONLY
t
Report No. 8545-ASI
MRKtT PROSPECTS FOR FOREST
PRODUCTS FROM THE PACIFIC ISLANDS
VOLUME III STATISTICAL ANNEX
MAY 25. 1990
Agriculture Operations DivisionCountry Department V
'Asia Regional Office
This documentbas a restricted distribution and may be used by recipients only In the performance of'thir offcial duties. Its contents may not otherwise be disclosed without World Bank authorization.
Pub
lic D
iscl
osur
e A
utho
rized
Pub
lic D
iscl
osur
e A
utho
rized
Pub
lic D
iscl
osur
e A
utho
rized
Pub
lic D
iscl
osur
e A
utho
rized
Pub
lic D
iscl
osur
e A
utho
rized
Pub
lic D
iscl
osur
e A
utho
rized
Pub
lic D
iscl
osur
e A
utho
rized
Pub
lic D
iscl
osur
e A
utho
rized

Table 1: JAPANESE SOLIDWOOD CONSUMPTION
Lumber Plywood ReconstitutedPanels
2 2 2
Housing 78 10 5Commercial construction 3 35 10Industrial/packaging 9 5 0Furniture/fixtures 5 35 80Other 5 15 5
100 100 100
Source: Japan Lumber JournalMitsui Homes
Table 2: 1988 PRODUCT BALANCES, JAPAN(000 m3)
Domestic Exports Imports ApparentProduction Consumption
Lumber 29,836 200 6,78. 36,417Plywood 8,181 30 2,000 10,151
Reconstituted Panels- MDF 270 nominal 76 346- Particleboard 1,085 nominal 83 1,168
Source: Japan Lumber JournalResource Information Systems Inc.

Table 3: HOUSING STARTS, JAPAN(Units)
TOTAL StructureWood Non-wood
1965 842,596 646,536 196,0601970 1,484,556 1,035,500 449,0561972 1,807,581 1,111,846 695,7351973 1,905,112 1,120,484 784,6281974 1,316,100 869,637 446,4631979 1,492,926 909,582 583,3291981 1,151,695 653,643 498,0521982 1,146,144 666,960 479,1961983 1,136,794 590,848 545,9531985 1,236,072 591,911 644,1611987 1,674,300 741,552 932,7481988 1,684,644 697,267 987,377
Source: Real Estate Institute, February 1989.

Tabl 4: JAPANESE SAWMILL NUM8ERS A PRODUCTION VOLUMES(Units/'OO0 @3)
Unit 1982 1983 1984 1916 1988 1987
- Number 20,937 20,266 19,612 18,834 18,200 17,886. Production '000 m3 30,944 29,601 28,698 28,403 28,693 29,788-m31/.l 1,417 1,418 1,446 1,608 1,671 1864
Source: Ministry of Agriculture, Forestry and Fisheries
Table 6: JAPANESE SAWMILL LOG INTAKE 1960-1988('000 .3)
Year TOTAL Domestic Imported Lauan N. Americs RusiaJ NZ OthersSub-total Softwood Hardw0od Sub-totel
1960 37,657 33,817 28,417 5,400 3,761 2,399 822 5401904 45,36S 34,380 28,015 6,365 10,98S 4,186 3,841 1,786 1,1741985 46,969 34,124 28,243 5,881 11,845 4,401 4,191 2,139 1,11419S6 4s,768 34,460 28,533 5,917 14,318 4,997 6,119 2,798 - 1,4041970 58,060 27,362 22,230 6,132 30,688 8,947 13,608 6,670 3,8631972 81,154 26,433 21,789 4,844 34,721 8,387 14,813 7,133 2,084 2,3241973 63,713 26,112 21,429 4,683 37,601 9,147 16,489 7,701 1,968 3,3081976 62,377 20,961 17,810 3,361 31,416 7,438 13,834 6,870 876 2,5991978 64,97B 20,482 17,200 3,282 34,404: 7,449 16,497 7,836 1,132 2,5801979 58,013 21,481 18,147 3,314 34,S62 6,813 16,824 7,072 1,372 2,4711980 52,014 20,963 17,762 3,191 31,121 S,647 16,870 5,937 1,368 2,3991984 41,218 18,944 16,367 2,689 22,272 2,273 12,203 4,908 819 2,0712986 40,810 18,814 16,391 2,423 21,796 1,877 12,484 4,461 783 2,2111988 41,238 18,397 16,172 2,226 22,841 1,624 13,845 4,629 733 2,010I987 43,862 18,772 16,648. 2,126 24,680 1,456 15,437 4,895 800 1,9321988 18,097 722
Source: Min;stry of Agrculture, Forestry and Fisheries
Table 6: NUbBER OF JAPANESE PLYMILLS A PROOUCTION
Unit 1982 1963 1984 1986 19se
Numbers 804 606 681 664 5o5- Log Inputs 1000 m8 10,318 10,639 10,317 10,604 9,982- Production of general plywood 1000 .2 1,138,788 1,221,346 1,185,028 1,093,505 1,073,488- Production of speciality plywood 1000 .2 332,800 321,877 306,919 297,327 308,689
Source: Ministry of Agriculture, Forestry and Fisheries

Table 7: JAPANESE PAPER A PAPERBOARD PRODUCTION A EXPORT 1975-1987('000 tonne.)
1976 1900 1983 1984 1906 1986 1987
Paper 7,710,992 10,536,296 10,932,142 11,429,198 11,790,4S3 12,272,243 12,807,303Paperboard 5,889,887 7,651,S20 7,509,892 7,91S,388 8,878,876 8,789,902 9,729,994
Total ProauCtion 13,600,8b9 18,087,815 18,442,034 19,344,583 20,449,339 21,062,145 22,637,297
ExportPaper 355,904 307,435 364,931 399,190 441,810 367,641 387,806Paporboard 297,821 348,459 372,895 443,879 427,110 471,553 428,412
Total Exoort 853,525 S55,894 737,026 $82,889 U8,920 839,194 814,218
Sourc-: Ministry of International Trade and IndustryMinistry of Finane.
Table 8: PtULPWOOD SUPPLY, JAPAN, 1988('000 m3)
Hardwood Softwood TOTAL
Domestic 9,829 8,731 18,560Imported (90Z chips) 8,133 7,966 16,099
TOTAL 17,962 1.6,697 34,659
Source: Japan Paper Industry, Association

6
Tai* JAPANESE FOREST FROWCTS CBVM/SpJPLY sALE
O@WO ~~~~~~~~~~~~~~~SUPPLY0 Atic I ortedTOTAL Luer od th t Tibr Loge L r Plywood A Chipe Puip Others sr
Chips TOTAL Timber Wood TOTAL Veneer()
1000 6T.847 87.789 S.178 10.189 8,891 49.006 48,815 401 (1.543) 7.541 0.674 211 656 13.3
1065 69.6u 47.084 5.187 14.335 2.924 60.875 49.634 841 (4.8) 20.155, 1.U21 1.115 2 270 2.0J6 11 28.5
1967 88.947 88.898 7.476 19.786 8.898 62,741 51.813 928 (6.202) 8S.197 2S.21, 2.807 So 1.860 2.8s3 5 88 861970 102.879 62,009 13,059 24.807 2.724 46741 4.851 S00 (6.737) 56.438 48.201 S,967 s64 6.081 3.509 122 bi.01073 117,560 67,470 17.161 80.414 2.846 42.208 41.583 62 (7.797) 75.372 62.486 4,686 1.600 12.094 4,061 481 64.11976 96.869 58.341 11.178 27,298 2.,57 84.677 84.165 422 (6.440) .1:792 42,681 2.964 as5 11,340 8.60 784 64.1
1977 101,884 W6"4 12.717 29.841 2.732 34.281 33.798 438 (7.251) 67.62 44.661 4,125 l8 18,820 4,002 907 66.4
1979 109.708 60,814 18,918 82.137 3.420 38.784 SS.270 614 (7,721) 76.002 46.960 6.65 172 16.008 6.41 .0808 69.2
1980 108.964 56.713 1U,840 3586,8 8.543 34.887 84.051 06 (7.275) 74.407 42.395 6.1t6 19 15.936 7.670 2.071 60.31081 91.29 40.718 11.006 29,08 2.069, 81,682 A1.370 262 (6.440) 60,107 a.632 4.162 122 12,860 6.86}7 i,61 65 61082 0.W157 47.862 10,499 28.279 8.617 82,164 31,004 250 (6.788) 58.008 83.026 6.167 181 11.825 6.027 2.277 64.3
1903 09,161 48.9O0 10.649 80.864 3.788 32,818 s1.o 826 (6.736) 6B.844 82.687 4.618 210 11,402 7.4U 2.565 64.6
1934 91,61 44.518 10.664 82.433 s,746 32.874 82.511 863 (6.566) 68.487 31.606 4,863 347 12.166 7,403 2.623 64.0l988 92.n01 44.889 11,217 82.916 4.230 83.074 82.944 130 (.567) 69.W29 31.301 4,n6 613 11,812 7.892 3.125 64.4
1s66 94.600 44.918 10,942 8,6,68 6.078 31.913 31.820 93 (6.628) 62.81 31.798 4,867 060 12.293 8,943 4,030 56.5
1907 103.IN6 47.,s7 18.463 34.871 7.ul 30.9e4 30.898 91 (7.112) 72.12 34.844 6,112 2.887 14,026 9.174 6.188 70.0
1060 104.017 61.971 1U.028 38.588 1.268 80.106 5 0.115 60 (7,000) 74.632 8.890 11.361 2.648 16.121 10.u27 385 71.2
1909 102.00 48.800 12,320 40.700 1.180 29,880 29,750 00 (6.800) 72.670 31.110 10.400 2.410 17.6841 1O.a0 310 70.9
I Product. flur"e On ,IE basi*4 *Vst. oogd * from ill is not calcuiate in the basic fliurs.
8) Thb figures fOr 107 are provielonal "m thoe. for 190 rer estimate.
Source: 4AFF (FA)

Tiblo 10; JAPANESE IPORTS OF LOGS A SAWN TIMBER BY MAJOR EXPORTER('600 .3)
South.... American Russl HZ - Chile CT RANDLog S/t Sub-total Log S/t Sub-tot. I Los S/t sub-total E7r.jt Sub-total Log S/t TOTAL
1970 20,237 260 20,497. 9 019 2,460 12,869 6,941 88 7,029 1,676 74 1,750 as,na 2,072 41,6461971 20,269 236 20,495 7,524 i,556 9,000 0,540 90 6,038 1,701 91 1,794 36,028 1,981 38,0071972 21,725 167 21,912 10,080 1,021 11,909 7,178 102 7,276 1,806 104 1,910 40,792 2,214 43,0001978 26,789 367 27,156 1O,062 2,586 12,920 8,109 128 $,817 1,892 107 1,799 46,782 8,4u0 60,1921974 24,208 a86 24,573 6,696 2,777 11,478 7,160 106 7,256 1,090 99 1,189 41,144 8,347 44,4911975 17,833 141 17,474 9,297 2,282 11,629 7,206 88 7,294 444 77 621 84,280 2,638 36,8181976 22,173 105 22,8s 10,257 2,688 12,940 7,868 108 7,96 810 107 925 41,108 8,098 44,1991977 20,947 238 21,186 10,191 2,698 12,889 *,674 117 8,691 065 180 1,060 40,67? 3,238 43,8151970 21,799 287 22,08 1O,5U 2,054 18,890 8,728 120 8,040 814 222 1,036 41,877 3,438 45,3101979 22,002 876 22,468 12,836 8,089 16,174 7,848 127 7,970 075 277 1,252 48,286 4,619 47,8641940 10,968 452 19,408 10,443 a,040 14,28 6,119 181 6,260 769 818 1,082 36,287 4,736 41,0231981 14,728 812 15,040 7,444 2,684 10,128 6,763 22 6,8?6 604 267 761 20,429 8,315 31,8041982 16,121 637 15,060 8,231 8,412 1l,648 6,990 120 6,118 874 230 613 29,724 4,800 84,0321988 18,879 682 14,461 8,244 2,906 11,210 6,016 124 6iO42 817 266 682 28,868 8,937 82,2951984 12,94a 565 13,498 8,149 2,760 10,899 6,268 142 6,406 290 169 449 26,846 3,604 30,2491986 18,001 860 13,801 8,998 8,116 12,109 6,018 154 5,167 20 126 413 27,295 4,P46 31,6401906 12,131 648 12,774 9,632 8,381 12,968 6,761 161 6,902 694 269 080 28,048 4,894 32,44219807 13,808 991 14,679 11,406 4,441 15,907 5,636 177 5,713 662 342 1,004 81,862 6,961 87,3031988 11,866 1,184 12,039 10,248 4,949 16,196 4,997 228 6,226 664 430 1,094 27,6B2 6,791 84,3531989* 11,07 1,152 18,010 . 9,988 4,396 14,304 6,790 228 5,928 860 400 1,060 20,205 8,176 84,381
* Forecast
Source: MITI

Table .11: S. KOREAN SOLIDWOOD PRODUCTS TRADE & APPARENT CONSUMPTION('000 m3)
Domestic Exports Imports ApparentProduction Consumption
Lumber 4,079 negl. 661 4,740Plywood 2,200 130 160 2,230
Reconstituted panels- MDF 170 negl. 170 340- Particle board 500 negl. 220 720
Source: Office of Forestry, 1988
Table 12: SOUTH KOREAN SAWMILL LOG INTAKE & SAWN TIMBER PRODUCTION('000 m3)
DOMESTIC LOGS IMPORTED LOGS TOTAL SAWNYEAR Softwood Hardwood Softwood Hardwood LOG TIMBER
INPUT PRODUCED
1965 475 3451970 1,773 1,1481975 3,189 2,2421980 415 .1,807 72 1,917 4,211 2,9771985 498 146 2,201 1,307 4,152 2,9521986 481 115 3,108 1,282 4,986 3,4971987 500 95 3,428 1,528 5,551 4,079
Source: Korea Lumber Industries Association 1988.

Tfbl- 1.a SW1H KOREAN PAPER & PAPER8OARD PRODUCTION, TRADE, A CONSUWTION('000 MT)
YEAR PRODUCTWN IMPORTS EXPORTS D(MESTI^ CONStWTIONPaper Board Total Pap.r Board Total Paper Board Total Paper Board Total
A Other. Other Othor. * Others
1976 487.0 a80.0 847.0 .6 17.6 16.0 16.8 20.9 38.2 462.2 876.7 620.81977 609.0 831.0 1,440.0 .2 18.8 19.0 88.0 21.0 69.7 671. 0 28.0 1,399.21979 073.0 1,172.0 1,646.0 .7 29.8 80.1 74.1 80.1 164.2 609.0 1,121.2- 1,720.81980 916.0 1,162.0 2,087.0 .9 80.0 81.6 99.4 79.7 179.1 618.6 1,102.8 1,919.41988 1,023.0 1,165.0 2,179.0 1.6 60.8 62.1 49.8 49.7 99.0 976.2 1,165.9 2,132.11984 1,062.0 1,831.0 2,898.0 1.9 00.8 62.0 31.8 44.7 78.6 1,032.1 1,841.1 2,379.21986 1,096.0 1,409.0 2,604.0 1.0 99.6 91.2 61.0 68.6 109.6 1,046.7 1,440.1 2,485.71988 1,200.0 1,668.0 2,668.0 1.8 120.2 122.0 90.2 191.8 2B1.5 1,111.6 1,690.9 2,898.61987 1,250.0 1,608.0 s,060.0 2.6 168.4 166.9 92.4 806.8 898.3 1,100.1 1,066.6 2,815.01988 1,268.0 2,128.0 8,394.0
Source; Korean Paper Manufacturers Assoc)at)on, 1888
t 0 . I
t~~~~~~~
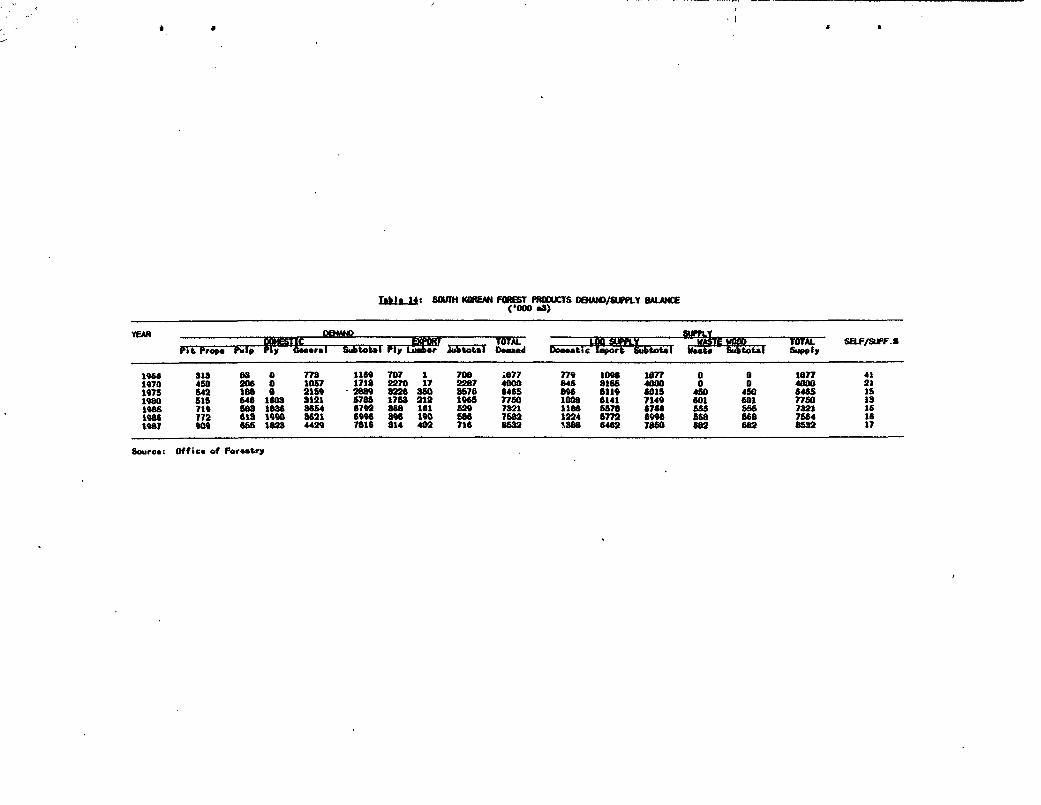
ITabl-U2 I11U1H tlREN Ft(ST PIWUCTS DEtOAN/SIfflY BLANCE(C000 3)
YEAR _ _ _T_T__ _w_ow TOTAL _ELF/SUFF._
Pit Prope Pulp lriy amoral Siiait-a16 rly LcN&F l-to-tol 00n0 Uobti e1 P lprt 61bubaol was b--tot l smn11pit r,~~~~~~~~~~~~~~~~~~~~~~~. ~~~~~~~~~~~ SU~~~~~~~~~~~~~t.O1I~~~~~~~~~~~~~~
199 818 8a 0 778 1169 707 1 708 .a77 n79 lo09 1u77 a a la 411970 450 206 0 1057 1718 2270 17 2287 4000 846 s8ss 4000 0 0 4000 21197s 542 18 0 215S 2gm8 a226 350 8576 6465 86 6119 6015 450 450 645 151900 f15 a46 I60S 8121 5786 1758 212 196s 7750 108 6141 7149 se0 601 7so Is198s 710 S8 1836 854 67T2 868 161 629 7821 ts8 5878 6768 5s5 555 7821 161986 772 61 1990 o 621 699 856 190 U 7582 1224 6m 69s 5S8 w68 7654 i61987 909 68 162 4429 7816 814 402 716 a892 88 6462 7?0 682 682 a852 17
Source: Office of Faci-try

Table 15: TAIWANESE PRODUCTION, TRADE, & APPARENT CONSUMPTION('000 013)
DOMESTIC EXPORTS IPORTS APPARENTPRODUCTION CONSMPTION
Lumber n.a. 33 995 n.a.Plywood 1050 499 333 884
n.a. - not available
Source: Taiwan Department of orestry 1989
Table 1O TAIWANESE LOG PDUCTION, TRADE, A APPART CONSUTION('000 me)
YEAR DOMESTTC SAWLOC DOMESIC ZMPCRTS APPARENTSoftwood Hardwood Sub-total PULPWOOD TOTAL Sowlogp Pulpwood CONSUMPTION
1973 480.0 847.6 1,107.5 1,101.5 3,8680.4 46.0 5,013.91974 430.7 652.3 983.0 988.0 3,563.6 127.0 4,688.81975 311.3 548.2 84.5 8f54.E 3,646.2 139.0 4,83S.71976 264.7 586.9 820.6 820.6 3,944.8 346.0 6,111.51977 276.0 414.4 889.4 889.4 5,465.7 346.0 6,501.11978 252.2 421.9 874.1 239.9 914.0 8,642.9 387.0 7,914.01979 241.6 411.9 653.5 328.2 981.7 8,290.8 583.0 7,865.41980 226.5 356.6 682.1 46-.6 1,042.7 4,966.3 430.0 6,441.11981 197.9 881.8 629.7 8 .1 911.8 5,205.7 1,183.0 7,260.61982 197.2 297.? 494.9 417.3 912.2 4,104.8 4983.0 6,710.01983 232.6 383.6 816.1 463.0 1,069.8 4,790.8 1,109.0 6,969.81964 219.6 348.2 682.6 446.8 1,008.4 4,196.4 824.0 6,988.61986 178.7 296.9 4?4.6 866.3 1,129.9 3,"6S.9 1,017.0 6,812.81984 200.3 298.3 496.7 847.2 1,345.8 3,676.4 1,390 0 8,412.2g1o? 169.1 283.5 422.6 728.7 1,151.3 3,949.7 1,431.0 8,632.01988 111.6 141.6 253.3 619.5 872.8 4,202.4 2,109.0 7,164.2
(Exports nagligible)
Source : Deportment of Forestry, Taiwan 1988

Tfbl 17: TAIWANESE ANNUAL PAPER & PAPERBOARO PRODUCTION, TRADE a CONSUMPTION('000 t)
YEAR PROOUCTION EXPORT IMPORT APPARENTPep.. Pap*rboard Total P a P P & P CONSUMPTION
1981 442 1,050 1,496 171 85 1,4121962 466 1,090 1,586 186 104 1,4921913 468 1,252 1,720 123 130 1,7271984 492 1,438 1,930 97 154 1,9871985 s30 1,487 2,017 93 t61 2,0061986 838 1,892 2,627 149 193 2,67119? 717 2,020 2,737 145 286 2,8801988 788 2,162 2,960 247 352 3,088
Sour@o. lsiwn Paper Industry Association, 2969

Table 18: SINGAPOREAN PRODUCT DEMAND('000 m3)
1985 1986
Sawn timber 674 784Plywood 560 491Veneer 24 37Mouldings 26 26
Source: Singapore Trade Development Board & Timber Newsletter, 1987
Table 19: SZNWAPORE TRAOE FIGURES('000 SS)
c.i.f. f.o.b. f.o.b. f.o.b.Import Domestic Re-export. Tota I
Exports Exports
Pu I pwood 1987 127 32 315 347i988 205 12 491 603
Wood In the rough 1987 29,019 1 9,253 9,2541988 36,428 22 18,329 18,351
Wood shaped or worked 1987 262,086 38,249 463,300 488,549I9 0 271,521 40,461 489,112 529,683
Veneer a plywood 1987 274,807 147,390 376,341 523,7311988 349,868 174,121 477,149 861,270
Wood Manufactures n.e.s. 198? 36,603 42,890 22,753 86,8431988 42,551 68,399 29,483 97,882
Furniture 1987 222,728 206,786 57,364 283,1501988 242,034 276,631 63,228 339,859
Sourco: Singapore Department of Trade Annual Statistics, 1939

Table 20: MAJOR TRADING PARTNERS OF SINGAPORE
Imports Exports
Plywood Taiwan
Wood in the rough Burma IndiaMalaysia TaiwanUSA Pakistan
Wood shaped or worked Malaysia JapanBurma TaiwanUSA Netherlands
Veneer & plywood Malaysia United KingdomTaiwan Hong KongBurma Belgium
Wood manufactures n.e.s. Malaysia United KingdomChina JapanThailand United Arab Emirates
Furniture Malaysia USAUSA JapanJapan Hong Kong
N.B. Countries in order of trading importance
Source: Singapore Department of Trade & Import/Export Statistics, 1989
Table 21: HONG KONG FOREST PRODUCTS TRADE - 1987
Type of Product Estimated/RecordedConsumption (m3)
Plywood 400,000Veneer 3,000Reconstituted Panels 2,600Blockboard 52,700Moulding 2,300Non-Coniferous Timber 86,480Non-Coniferous Logs 506,295
Source: Hong Kong Department of Trade. Manufacturing statistics, 1987.
N.B. Panels are reported in square meters, the remainder in actual cubic meters.Accuracy is thus impaired.

rak1I Z: 4CNC '(M TR74e PFSCWU (Jan - 0Dc 19q8)
SIports Do_otic Eusort Re-0a e taQuantiety Value Quantity Valu* Quantity Value
Pulpeeod in chloe or perticle l,C00 t6.000 22,180 *4,300T*eakood in rOugh or roughly squared 18.634 ",644,512 8,9SS 38,752.000Sandalwod in rough or oughly Squared 440.447 10, 84 291 437,248 15,198,000Oecorati,v wooda in the rough 7,608 33,19.,331 4,061 20,418,000failva 1 or Trumay oleepers 291 134,219
Lambor con ifer *imply worked 14,304 17,138,597 2,284 4,494,B43reakwood aonvers"ion. Sd suare. 17,074 691,262,69 9,41 " 57,647,698Sendalwood *imply worked 28,961 2,076.228 2,90 9a.8r0Oecorative wgood NES simply woked S33 3,068,560 5,511 24,923,201Veneer heet 9,02T,S5 33,607,973 4,690,031 17,492,949Plywood 66,395,499 1,315,326,963 38,59,s52 579,361,974Reconstitute wood 1,006,049 19,629,S316 522.020 17,448,378Blockboard lasinboord etc. 31. 64 776 363,612.934 16 M.3,744 273.621,231
Wood beadingw and couldings 14,072,478 1,202,B00 6,88a
Wood s.mply shaped worked NO 35,633,059 2.s94.161 17,092,514
Iooden boxes, crates, cam *tc. 1,02,00 1,39S,0O6 1,017,163
Article. of ood NeS 12.272,381 6s,409,loo 110,137,779fibreboord of woo o a denity > 0.86/cc 1,16,166 S.5s19,64 217.285 2,s7a,s79
flbreboard af wood of a density < 0.86/cc 1,382,817 28.266.416 483.84 S,9S0,W100
"heirs of wood 1,601,021 320.913,64 11.S9 5423.002 797,6U3 O.985.S10
pueniture tEs of wed 2.217,592 62.S64".SU 380,028 301,7?,091Purniturs end pats thereaf NMS of other eateriale S4.250,197 12,629.62
Pfrt NES of odn furniture 61,366,819 is.043,185
Wd Wase 10,336,69 7,524,532 8,195,703 4,137
Domestic or d ceortive article. of oood 114,e47,976 51,435,780 97,101.420
Table. of des. and table. of wood .28.697 24.175.341 46,22 24.7M.,810
B". and cribs of wood 6.379 3,946,656 S,741,906Si Idre Woodwork 170,386,792 28.396,494 44,502,452
Wooden victure fr a e1c. 12.786,115 32.449,100 12,217,226
Woodeo household utensila 33,674,85 6.262.310 27.712,871
Lacquered ware wooden 17,n 771, 12 60 S,M20,671
Tools, handles of wood 1,3t2,86 4,06,6"4 5,601,758Conifer loG in the rugh or roughly squarad 14,776 12. 19 162 3.314 39,00.000man coniftr lo[e in roh or rouehly -se d 593.351 379.254,7 45,696 S2.732.000No conifer lumber sisply n.*.&. worked 236,035 291,124,405 162. 6S 186,246,329
N.S. of re-eaport.. 95.9% of pacnls, escoet re-constituted one (746), are diepatched to China. The corresponding figur*s formouldings are 2911, no-oniferoue an timber 8S0, and non-coniferous logs 241. Th- other roe-port market for logs i- Macau (766).
Surce: Hong Kano Department of Trade 198

Tahb I tAJOiTIS IlTW BY IA "M CM[R al0
_ _ _ _ _ _ _ _ _ _ _ _ _ _ _ _ _ _ _ _ _ ~~~~~~~~~~~~~~~~~~~~~~~~Wood'Jos, w" Lunnffm ^y i *d s Li aiw Lawnh*,o~ Iaa I ~i.n MoudI ing.' U2 ait.Mw L Laun Hhoa9y 6; p 8 9 10 a 11 12 19 t 4 tS 15d 16
1970 I 708 6,771 8,237 14 031 35.394 20.805 124.634 7 ,80 1" 988 4.025.720 8 034 1.075.531 700 182 130 7031.000 81 06 1.283 1 424 6.314 6,204 25.076 2 477 24 981 151 eB7 1.124 52.731 290288 3.6351071' j 166 3.327 8.740 11 410 43.277 20.848 125 359 4.021 182 60 4.077.883 8.372 1.2655688 002 076 164.800
51.000 22 494 1 450 1,010 7.416 4.327 27 221 1 740 27 SOS 180,423 1:245 74,015 40,24J 4,114072 id 694 3,572, 7 949 13 "18 70,644 21 468 128 176 7. 38 230.297 6,151.099 10.070 1.615,710 1.568,544 272.661
IT,ooo 64 518 1,368 1.712 14,774 4B088 33.161 2,969 36.495 235.217 1.709 1,012 63,523 8,823
173 .3 191 2.000 1914 13 350 655.67 23.265 115 207 14,303 3so.028 6.0655220 7,731 1.285.401 1.381,501 222.074I,o000 22 8609 1296 1,257 14.760 6.1513 35027 6.491 65,366 284.371 1,676 106,727 73.064 8.307
1074 7d 882 3.426 12 254 14 414 68.460 28.616 "8.016 13.134 269 ,713 9446.065 8.108 962.515 053.196 206.41151,000 t119 901 1,618 1.924 20,564 11.897 28.286 8,e53 68o007 208,162 2,102 92,285 60,248 9,949
1975 3d 312 1,503 7,211 7 834 30.508 22 746 32 608 15,277 112.924 3,468.821 10 256 841,512 778.960 170,208,ooo0 47 474 1,030 1.000 0.622 8,893 17.123 8,025 286540 1617901. 7 700 7, 413 50.617 7.889
1976 Id 645 1.150 8 678 3,713 53.324 18 274 71 241 16,973 135 096 3,495 18o , 612 I.135.290 1,773 671 262.0371,000 106 494 1.224 8092 17.081 8, 07 23.200 12.846 37,022 210.05? 2.639 102.787 128,340 14.237
1477 Li 497 2.417 8,941 3.279 59 570 23 953 74 720 16 741 161,116 3,016 290 8,218 1.136,155 2,163.670 319,59761,000 1i7 670 1,240 e81 17,648 A0244 24,313 17.018 48,858 210,671 2,214 121,500 168,858 18,676
1978 " 3 1,474 4 ,08 7 220 67,174 27,936 78.538 18,290 197.028 2,005 014 10.680 1.'71,971 3,064,771 393,239t,ooo 1 509 1,250 16873 23.041 11, 98 28,769 13.200 88.348 161,158 2.680 149.678 271.029 28,08s
19079 / 315 1,063 7 403 5 000 48,086 43.09 50s271 8.141 151.265 1,270 ,47 5.601 020.637 1,481.053 197,48111,ooo 31 303 1.210 1.144 28.711 12.013 28,050 30.183 90.470 200.623 2,723 160,307 U15.058 32,661
19080 td 18 1.013 7 403 5 000 45,88 43.999 60,271 8.141 151.265 1.270 497 5 601 9290,37 1.481 953 197.481R. 000 12 509 1.074 1,119 25.656 24.437 23.537 10.497 65,385 148,861 2.293 138,354 183,877 17.435
108 it - 611 8 870 4 263 390353 42 730 44 410 14.118 156 w58 1.397 878 9,588 932 856 1. 51 1.531 228.09261,c'oo - 332 1 313 1 069 23,359 31 355 20 273 15.011 63 310 230 747 3.937 132.928 187,711 19.717
1982 Id00 1t 803 10.172 7,282 18,480 24,848 33,014 11,008 126.122 1,605,601 8.037 785.073 1.111.748 191.53419 ,000 f14 382 1,889 1,235 10.027 18,410 14,432 12.762 46.548 17,6 010 2°170 107 565 125.091 14,002
1983 I.0d0 283 201 3,987 16 803 39.470 27. 08 26 620 18.876 1240866 2,70 221 7.468 842.918 1,172.983 199,503as00 3 7 1 814 2.170 20.70 17, 298 11,730 1868 63 50,784 267.088 2,288 115.081 148.524 17,783
1984 Li00 280 509 3,789 23.557 43,298 45.261 31,205 21,838 162,676 2,223.183 SO800 880,425 1,160.802 172.so?51,000 20 287 791 3.110 20.730 20,510 13.962 10.332 74,976 210.248 390016 552.407 1$7.096 1811 586
a Spanish cedar, Maple, Birch. Burch. Wakal.
Lk Speci.e are unspecifiod.
L Riau end Teak.
Ld Logo and luuber en MP, plywood and veneer tn HSf, wood moulding in HLF.
Source: Dopartme.t. of Commerc.

Table 24: MAJOR IMPORTERS OF WOODCHIPS('COO m3)
Importer 1979 1980 1981 1982 1983 1984 1985 1986 1987
World 17,342 19,345 16,640 14,446 14,901 16,155 15,645 17,188 18,380
2 100 100 100 100 100 100 100 100 100
Japan 15,003 15,936 12,508 11,325 11,402 12,152 11,812 12,044 13,783
I 87 82 75 78 77 75 76 70 75
Sweden 269 1,161 1,748 680 411 495 743 1,047 1,1172 2 6 11 5 3 3 5 6 6
USA 899 981 980 814 1,087 737 642 849 615
Z 5 5 6 6 7 5 4 5 3
Norway 211 248 342 264 349 563 452 635 6972 1 - 2 2 2 3 3 4 4
Finland 98 58 206 579 776 674 334 176 222
t >1 >1 1 4 5 4 2 1 1
Taiwan 192 192 192 49 49 228 239 356 337z 1 1 1 <1 <1 1 2 2 2
Austria 380 475 616 545
3 2 3 4 3
source: FAO, Yearbook of Forest Products 1989 (Importers' reports)

Table 25: MAJOR EXPORTERS OF WOOD CHIPS('000 m3)
Exporter 1979 1980 1981 1982 1983 1984 1985 1986 1987
'World 14,791 17,469 15,574 13,824 13,640 14,437 14,358 14,686 16,8612 100 100 100 100 100 100 100 100 100
AustraLia 4,957 6,599 6,132 5.655 5,435 6,576 6,756 6,582 7,3642 . 34 38 39 41 40 46 47 45 44
USA 6,530 6,498 5,147 4,151 3,651 3,375 3,361 3,521 3,6922 44 37 33 30 27 23 23 24 22
Canada 1,291 1,488 1,450 1,254 1,537 1,312 1,238 1,121 1,0022 9 9 9 9 11 9 9 8 6
USSR 482 547 552 425 385 370 360 652 7703 3 4 3 3 3 3 4 5
New Zealand 350 400 487 546 650 750 600 tO0 7002 2 2 3 4 5 5 4 4 4
Indonesia* 3 38 282 306 663s >1 >1 2 2 4
Chile 184 6701 4
Sweden 111 319 298 259 396 485 399 389 4452 1 2 2 2 3 4 2 3 3
PNG 170 131 95 148 154 158 127 100 1002 1 1 1 1 1 1 1 1 1
N.B. Indonesia's export volumes surpassed Malaysia's in 1986, but Malaysia hasreturned; European trade.largely within Europe. Japan's imports of woodchips in1987 were 12,862,000 m3 of which 54Z were from Australia; 282 from the U.S.A.; 52from Sweden, 4Z from Canada, 4X from New Zealand, and 32 from Malaysia.
Source: FAO, Yearbook of Forest Products 1989 (Exporters' Reports).

TIc21t: US 1a711>TS OF WOW 1t1a AND PANIS TtVEOF BY AJIR SUPPLYH0 COURYIaI±.M ~~~~~(Million, of olr.)
Country 1on 1978 1979 1980 1081 1982 198S 1964 1065
Taiwan 48.6 78.1 318.6 100.0 184.1 161.0 224.0 290.6 396.0 69.0
Caunsa 2S.9 51.0 46.9 68.t 60.9 79.2 104.3 160.2 191.0 231.1
Italy 17.4 25.4 80.2 80.0 20.7 88.0 47.3 84.0 141.1 187.4
YVgoslovie 40.2 69.4 60.1 70.1 02.6 04.1 69.t 116.6 140.7 129.0
DOnnark 85.0 48.7 58.9 68.6 60.1 .5 S.6 a 0. 1 77.5 104.2Wbet C*rmany 4.1 10.6 14.9 12.8 16.S 19.4 27.7 42.6 70.4 103.7
UAnit0d Kinodoo 24.6 82.8 86.8 9S.2 36.4 84.9 42.6 46.0 56.9 54.1
RONico 7.0 18.2 15.7 19.2 28.6 39.2 E0.6
Singapore 16.6 20.1 25.8 80.4 40.7 44.1 S2.7 45.6
South Korna * 15.4 20.6 20.2 23.9 40.5
Otherr 117.4 145.2 210.0 279.8 309.7Total 286.7 400.7 600.1 66.4 601. 650.09 6S.6 l.189.0 1.S79.6 18116.1
Source; Compi led from officiel statistics of US Departent of Commerce.
I

Table 27: INDIAN SUBCONTINENT LAND AREA
India Subcontinent Area SM Sq Population
Bangladesh 144,800 109,500,000Bhutan 46,500 1,500,000India 3,288,000 816,800,000Nepal 147,100 18,300,000Pakistan 804,000 103,800,000Sri Lanka 65,400 16,600,000
India Subcontinent 4,495,800 1,066,500,000
World 150,142,300 5,112,000,000
India Subcontinent 3 21Z of World Total
Table 28: INDIAN SUBCONTINENT
Population Growth Rates by Decade(Percent Growth Per Annum)
65-75 75-85 84-90 90-95 95-2000
Bangladesh 2.75 2.82 2.64 2.49 2.27Bhutan 2.00 2.05 2.06 1.95 1.84India 2.29 2.03 1.74 1.63 1.46Nepal 2.31 2.40 2.30 2.29 2.15Pakistan 2.71 2.99 2.26 2.46 2.15Sri Lanka 2.00 1.77 1.49 1.24 1.11
Source: FAO, Forestry Paper 84, Forest Products World Outlook. Projections, 1988.

Table 29; INDIAN SUBCONTINENT ECONOMIC STATISTICS
Ch Per Capita Consumer Price Budget Surplus/ Trade Curt Acct For Roservos Public Debt87 USS Billion Incose 1997 USI Increose X 1i7 D teft X MDP Balance USS 1987 198o USS million Service Ratio X
Indian Subcontinent
Bangladosh 14.49 136.00 11.6 0.92 -1,169.0 827.9 24.2Bhutan 0.22 140.00 14.4 na -93.6 41.0 16.0India 182.61 200.00 1.5 n.s. -8,882.4 4,071.0 24.6mepal 8.07 176.00 13.3 -1.70 -234.0 222.1 8.2Pakstittn 84.48 890.00 8.0 -7.90 -719.0 800.0 28.4Sri Lnka 6.68 3860.00 7.7 -8.70 -343.0 281.0 23.0
India Subcontinent 246.45 234.88 9.7 -8,430.9 6,809.0 20.4
.- ~~I

*ra.. 3tOIAJ SUSCrrNINr Lr JSTRIAL Q0U'aO00 PROJUCr1ON AND TWAO1284-487
total tndueatrial SQundwaodV olw u me - - - _ _ _ _ _ _ _ _ _ _ _ _ _ _ _ _ _ _ :m ~Qcczwi'.etr1,000 Cubic4 Meters MA l 9 J' 19 ac 1987 1964 -9-5 191I i967
Indis Subcontinet
8fuslade 883 681 8GA7 SWshufta 278 278 Vs6 278tadia 226918 23,812 23,928 24,.04 20 20 39 60Nasal 66O 6O am0 S60Palgie*tn SII33 1,334 1,340 1,347 17 18 32 32Sri L"aka a7" 686 666 a76
tndia Subcontinent ~2.S501 27.8n, 27,61 27.70 37 38 431 622
world 1.8311.806 1.U13.72 1 76.609 1,633,06 107.290 109. US 112.939 120.Sta
tndia Subcontin.nt 2 2 2 2 0 0 0 16 at world Total
rotal !ndu,eIal 5oUndflod
1,000 Cubic Nate 1S84 1918 1965 16il1 1197
.'dla Subcontinent
Bnadesh S 84a 867 8 Sshfutm 7 7 7 7 271 271 271 271India 7 1 6l 61 2201 20,201 24.296 24,833Ne#aI1 126 126 126 126 434 A"4 A" 434Pal, i etan 1. 1i 1.3,3 1.372 1.379Sri Lanika en 686 668 676
India Subcontinent 140 134 194 194 26,328 27.492 27,8MG , ,-
World 10.,S 103.201 104.732 118.lS 1,8.LSfi02 1.512.443 1.884,483 1.68. 435
India Subcontinent 0 0 0 0 2 2 2 2
I World Total
Conifer Industrial Reundwaod lrAd.od Industrial Poundreo4Voluee rduction Pr ducticn1,000 Cubic iMt*ra 194 165 9116 1S7 1964 195197
India Subcontifnnt
Bangladesh 8am a8" 847 8a!Shutan ~~~~ ~~~~ ~~~~ ~~~~~~~~276 276 278 276
,IndDia2 2,82 2.78 2,7n0 2,761 20,326 21.124 21,198 21.273Pk** l 20 20 20 20 860 540 540 540Pakistan 215 2t0 250 250 916 1.084 1.090 1.097Sri Lanka 672 68S 6Su 678
India Subcontinent 2 77 3, 3,0S0 3,001 23,624 24,580 24.621 24,712
World 1,034.907 1.032.375 1.086$.37 13,3I,953 476.201 474.423 468,972 49, 137
India Subcontinent 0 0 0 0 S S S SS of World Total

-= VOIMU SUSCi N841 SAW AN 4SEM 100 PR0C OD=CN A*0 a e1984-47
_ _ aq/~~Seuoaa ard Ven-ee I,oc-Volume Poduec,on -~ olneOt1.000 Cubic *sero 1sw4 6 SWe4 - 9-- 91 1"93 1901'
India Subcontinent
sangI.delz A" 447 047 4t7Bhutan 230 244 240 240Indio 17,SJ.8 18,350 ta.350 1S,350 20 20 39C 340Nagai Ho0 "a0 860 8Pluletan SZ 1.013 1.013 1,013 17 17 31 31Sri I.anlth 18B 88 128 152
ndia Subcentinns 19,779 20.7as 20,7J8 20.786 37 37 30 $91
World 907,400 907. 73 960,614 1.00, 820 81,967 63.08 63.88 6.s 0
IndliSaubcowsInMnt 2 2 2 2 0 0 SY of World Toal
.~~~~~~~~~~810 .~ .~.e . .
Volum_ a aad V"-"e lNe.1.000 Cublo ,ater 8 1944 196i 1 1--7
India Subontianent
Sangib I &l4 4" 4t7 437 447S3ute 7 7 7 7 238 233 2S3 233India 7 1 61 6a 17,331 18.869 15.688 19.119N.,. I 12 128 12 1 76 434 4346 434 434Puik Iatn a80 1,00 104 S 1,044Sr; i nl.a 1i 18 128
India Subcontinent 140 134 194 194 19,t67 20,688 20,994 21.4b5
world 60.4al 82.6t7 61.88 98.364 906,868 989,220 eti2.933 1.000,86
ndia Subcnstinent 0 0 0 0 2 2 2 2s of WrId Tatel
_ _ *~~~~q~ onfa Saelftp *nd Venn, L4nVol urnI, Iveort1.000 Cubic Meter 19845 1457r---- 9 1985 1966 Iq
India Svbcon;inent
bngl ade"ShutenIndia 2,421 2.538 2.m31 2.C831NeasI 9S9 290 200 92SPul I tsn 19 230 13 0 3 Sri Looks
dia Subcontinent 3,609 3.75t 3,738 3,750 5 1 1 I
World 644,931 661.617 892,.I6 729,887 31.069 33.169 32,631 34,972
India Subcontinent 1 1 1 1 0 0 0 0f of Worl id TotaI
Volume (Ce,nip.fee Saleo" 2nd Veer Lana
1,000 Cubic Neter, 1964 . 6 16 *987 19a4 1965 6l6 19a7
d Subcotinent
Ia0l *deskShlunIndio 2.428 2,5S36 £.S3M 2.538iel 99O 990 990 990
POiCt.n- 201 231 231 231Sri Lanka
Indio Subcontinent 3,814 3,759 3,?79 3,789
world 30,88 32,t09 32,66 38,712 64,137 52,s177 692,334 778,847
Indi Subcontinent 0 0 0 0 1 1 1 1li of World tota I

1.000 C,jbic Mot M 8 1199 19 6 1987 4 - t 988 lOSe Igaa 1167
Inc Subconlinent
Sanglad.sh 486 48r 467 4878huteu 240 240 240 240 7 7 7 7tndia 5lOq0 15,812 15,812 15,812 20 20 309 "0 7 1 f6t 61Nepa 5 40 540 540 540Polli" 6 s 820 783 78 783 11 17 31 31Sri L,anks U15 U1t L28 to
Tndia Subomnsinent 17,140 I?,00? 17,070 17,t00 31 37 430 801 140 'A4 104 194
Weold 260,468 25,121 268,4A7 2m,033 308,87 29,8W 31,053 31,688 20,50 20,8 28,903 32,672
India Subamtin*nt 7 7 7 7 0 0 1 0 0 1 12 of Worid To Il
=It2 nd Vmnair Loas
1,000 Cubic motere 984 1 1986 1987
India Sub3mtinen'
flnan adceh 484 487 487 487oh.?;. 23i 2S3 223 233India 15,106 Lt,6311 8,1m 8,611Ne*l *14 414 414 414Pak iat" nSW 800 674 874Sri Lanka 1i 1Si 128 128
Indio Subcantin.nt 17,031 17,900 18,206 18,687
World 261.751 258,081 270,507 272,049
India Subeoatinmnt 7 7 7 7of world Total

-an-n 32: :MIAM SUKCgQVThW4 SAW A0 VY4M E.0O PROOUCrON AO0 rRsAE1964-87
,, for. Sawrn.eedVol uWC-P -tion _-._ _
1,000 Cu o;M 19864 1988 18 1167 1984 1988 1168 1987
rndia S114conzi nts
Sanglad.6
Sndia 2.160 2.374 2.374 2,374 1 2 2 2NmAI 10 10 10 t0Paai s n 40 40 40 40 8 10 1 2 12Sri Iank.
India Subcwtin64t 2.210 2,424 2.424 2.424 0 13 14 14
world 343,111 347,182 3d ,44? 377272 70.40 72,30 MM73.7 73. 60
?ndi Subcatsin.nt I 1 1 1 0 0 0 0I of wol§d Ye".I
Vol U. .1,000 Cubi c tar 18 196' 196 lse7 !,4e 19Notate6 116
India Subaontin.nt
Bangladesh 464 447 447 4C7bhustn 7 7 7 7 23I 29S3 23 233
ndina 7 A1 GI 17,531 18,369 18,d81 19.119Nol I26 12 412 2 '434 44 44 AU4Phi~n 6o 1,¢ 0 ." 1.044Sri Lanka 18 18 la 12 118
India Subcetinant 140 18 194 194 19.476 0.6688 20,994 21.4U
world 60.481 62.54? 61.586 68,364 906,U83 "9,228 942.933 1,000,8w
VWdi Subot8in.nt 0 0 0 2 2 2 2S of warld Tes I
1.000 Cibia Notate 1W84 3,9q3s38 1987 1*94 161 6 1987 1984 198 18 1987
India Subcontinent
sanaladah 144 93 73 73 S 11 5 5SMa tn 5 S S 8Ind41 13,498 14,884 14.834 4,864 4 1 3 6 2 2 2Naal 210 210 210 210Pal i stan 112 72 " 61Sri Lank, 19 19 1s 16 13 7
India Subcontinent 13,677 1S,l16 16,138 13.138 1V0 07 1 84 5 2 2 2
World 13,961 114,806 117.006 12.73A 12,380 12.316 12.S57 16.464 12,579 11,887 12.815 15,981
India Subcontinent 12 13 13 12 1 1 1 I 0 0 0 0
a of Woorld Tota
Volume1,000 Cubic "m 115 1 1988 1967
Sndi; Subcontinent
mnelId.ah 18 104 78 78lhn 0 a 5 SIndis 13.4S9 14,888 14,683 14,636Naipa 210 210 210 210PakIsuan 112 72 6 6Sri Lanka 26 32 23 23
India Subcontinent 14,002 15,258 15,217 15.220
World 113,702 115,232 11S,786 121,727
India Subcontinent 12 13 13 13S of wor ld Tot I

'slo#33: :OIA4 SiMcOMtNEW LW0oc 4OC0 Vei( SHEIrS ROUC'OrN AIo 'We:so'-a7
1,000 Cabic t.95 T39 1162.96 aO8
India subcotinent
India 360 360 360 360 2 2 6 6 6 64*00l9ag i outi 3 a 3Sri Lanka 14 13 7 7 9 9 8 8
India Subacntinnt 376 377 371 371 9 10 i1 11 6 6 a a
World ".010 4,66 47,749 46,969; 7,406 7,663 8,825 11,148 8,02 6,634 9,62S 11.231
Sodis Subcontinen t I I I I 0 0 0 0 a a 0 0S of Welrid Totai
1,000 Cuabi moorsIe6e ------ 1105 MY690
India Subcontinent
8hut~~~~~ 364 354 384 384IndiaNe.al 3 4 4 4pail i rt" c23 23 Is 1Sri L.nka 301 3S 374 378
Indi Subcontinent 43.336 43,692 44,94 46,904
mdis Suibcntinmnt 12 13 13 13s of Wrtld Tt1atl
1,000 Cubic e. 196 I'm I'm* 17 t9a4 t9e8 196 197 19M4 195 1 17
India Subcontinmnt
Bangladesh 1 1 1
India 4 4 4 4 3 3 17 4
Pak i I I Sri Let.
grdio Subentin nt S5 5 5 1 I 1 1 3 3 17 4
W'orld , 4 907 4, 03 4,792 5,134 1,900 1,347 1,62 2,024 2.008 1.79t 1.63q 1,962
Sndio Subem+in nt 0 0 0 0 0 0 0 0 0 0 1 02 of world Totl
v.,.. Shet _ _Vol .u _ __ _ _ _ __ _ _ _ __ _ _ _
1,000 Cubic eta$re t98- 1901 1980 1987
IM i* Subcontinent
Snglsdea 1 1 1 1
Sidi 1 1 13 0
Pieten 1 1 1 1* Sri L.anba
India Subcontinent 3 3 17 2
World 4,801 4,880 4,779 5,196
-dig Subcontinent 0 0 0 0t of World Total

Table 34: 'WOOD CONSUMPTION AND TRADE - INDLAN SUBCONTINENT
Actual Proiected1986 1987 1990 1995 2000
Total Roundwood (CT1M million)Consumption 327.4 333.9 349.2 280.0 410.7
Tndustrial Roundwood (CUM million)Consumption 27.6 28.4 29.6 34.0 38.6
Wood for Pulp (CUM million) 3.1 na 3.3 4.1 5.0
Sawnwood (CUM million)Production 17.8 17.8 17.8 20.0 22.1Consumption 18.0 17.9 18.9 21.9 25.4Net Imports 0.13 0.1 1.1 2.0 3.2
Wood Panel (CUM million)Production 529 529 675 856 1,083Consumption 532 534 700 905 1,172Net Imports 3 5 25 49 89
Pulp and Paper (mt '000)Consumption 2,878 3,168 3,735 4,423Wood Pulp Production 748 763 919 1,112Wood Pulp Consumption 842 842 990 1,173Net Wood Pulp Imports 94 79 71 61
Note: Tables may not add due to rounding.
Source: FAO, 1988.

Table 35: INDIAN SUBCONTINENT PROJECTIONS ROUNDWOOD CONSUMPTIONS1990 - 2000 WITH 1986 ACTUAL
Volume Total Roundwood Consumption1,000 Cubic Meters 1986 1990 1995 2000
India Subcontinent
Bangladesh 27,840 30,381 33.764 37,.167Bhutan 3,217 3,594 3,938 4,289India 250,267 265,814 287,844 309,659Nepal 16,001 17,229 19,006 20,875Pakistan 21,413 23,016 25,798 28,524Sri Lanka 8,654 9,138 9,695 10,232
India Subcontinent 327,392 349,172 380,045 410,746
Source: FAO, Forest.
Table 36: INDIAN SUBCONTINENT PROJECTIONS INDUSTRIAL ROUNDWOODCONSUMPTION 1990 - 2000 WITH 1986 ACTUAL
Volume Total Industrial Roundwood1,000 Cubic Meters 1986 1990 1995 2000
India Subcontinent
Bangladesh 906 847 1,099 1,231Bhutan 271 297 336 372India 23,976 25,733 29,493 33,542Nepal 434 456 480 505Pakistan 1,358 1,510 1,707 1,928Sri Lanka' 668 793 887 992
India Subcontinent 27,613 29,63C 34,002 38,570
Source: FAO, Forest.

Table 37: .INDIAN SUBCONTINENT PROJECTIONS CONSUMPTION OF WOODFOR PULP 1990-2000 WITH 1986 ACTUAL
Volume Total Wood for Pulp Consumption1,000 Cubic Meters 1986 1990 1995 2000
India Subcontinent
Bangladesh 35 43 46 50BhutanIndia 3,097 3,282 4,009 4,919NepalPakistanSri Lanka
India Subcontinent 3,132 3,325 4,005 4,969
Source: FAO, Forest.
Table 38: INDIAN SUBCONTINENT PROJECTIONS SAWNWOOD PRODUCTIONAND CONSUMPTION PULP 1990-2000 WITH 1986 ACTUAL
Volume Savnvood and Sleepers Production1,000 Cubic Meters 1986 1990 1995 2000
India Subcontinent
Bangladesh 84 195 227 264Bhutan 5 2 2 3India 17,460 18,099 20,942 24,231Nepal 220 253 293 339Pakistan 174 315 383 467Sri Lanka 28 46 55 66
India Subcontinent 17,971 18,910 21,902 25,370
Source: FAO, Forest.

Table 39: I.NDIAN SUBCONTINENT PROJECTIONS SAWNWOOD NET IMPORTS1990-2000 WITH 1986 ACTUAL
Volume Sawnwood and Sleepers Net Imports1.000 Cubic Meters 1986 1990 1995 2000
India Subcontinent
Bangladesh 5 25 37 51Bhutan 0 -4 -5 -6India 0 790 1,652 2,745Nepal 0 17 37 6dPakistan 119 239 295 366Sri Lanka 8 19 24 31
India Subcontinent 132 1,086 2,040 3,248
Sourcet FAO, Forest.

Table 40: INDIAN SUBCONTINENT PROJECTIONS WOOD PANEL PRODUCTIONCONSUMPTION AND NET IMPORTS 1990-2000 WITH 1986 ACTUAL
Volume Wood Based Panels Production1,000 Cubic Meters 1986 1990 1995 2000
India Subcontinent
Bangladesh 13 19 24 30BhutanIndia 442 525 659 825NepalPakistan 64 111 148 196Sri Lanka 10 20 25 32
India Subcontinent 529 675 856 1,083
Source: FAO, Forest.
Volume Wood Based Panels Consumption1,000 Cubic Meters 1986 1990 1995 2000
India Subcontinent
Bangladesh 13 14 17 22BhutanIndia 426 511 646 818NepalPakistan 75 154 214 296Sri Lanka 18 21 28 36
India Subcontinent 532 700 905 1,172
Source: FAO, Forest.
Volume Wood Based Panels Net Imports1,000 Cubic Meters 1986 1990 1995 2000
India Subcontinent
Bangladesh 0 -5 -7 -8BhutanIndia -16 1-4 -13 -7NepalPakistan 11 43 66 100Sri Lanka 8 1 3 4
India Subcontinent 3 25 49 89
Source: FAO, Forest.

Table 41: INDIAN SU3CONTINENT PROJECTIONS WOOD PULP PRODUCTION.CONSUMPTION AND IMLPORTS 1990-2000 WITE 1986 ACTUAL
Volume Wood Pulp for PaRer Pioduction1,000 Cubic Meters 1986 1990 1995 2000
India Subcontinent
Bangladesh 31 40 46 52BhutanIndia 717 723 873 1,060NepalPakistanSri Lanka
India Subcontinent 748 763 919 1,112
Source: FAQ, Forest.
Volume Wood Pulp for Paper Consumption1,000 Cubic Meters 1986 1990 1995 2000
India Subcontinent
Bangladesh 55 61. 69 79BhutanIndia 763 749 879 1,039NepalPakistan 19 26 34 45Sri Lanka 5 6 8 10
India Subcontinent 842 842 990 1,173
Source: FAO, Forest.
Volume Wood Pulp for Paper Net Imports1,000 Cubic Meters 1986 1990 1995 2000
India Subcontinent
Bangladesh 24 21 23 27Bhutan
* India 46 26 6 -21NepalPakistan 19 26 34 45Sri Lanka 5 6 8 10
India Subcontinent 94 79 71 61
Source: FAO, Forest.

Table 42: MALAYSIAN EXPORTS TO INDIAN SUBCONTINENT
March 1989 January-March 1989Vol me FOg Value /a Vol me FOB valuem MS m MS
PENINSULAR MALAYSIA
Logs 148 118.14 148 118.14
SawntimberSri LanXa 452 238.16 855 239.11Pakistan 131 459.19 579 396.72India - - -All-Average 319,907 463.39 781,927 466.33
Graded SawntimberSri Lanka - - - -All-Average 175,708 610.40 425,572 621.96Kiln Dried 57,375 856.48 132,553 361.98
Ungraded SawntimberSri Lanka - - 27 213.22All-Average 144,199 284.25 356,355 230.47
Pa kistan 32 72i.81 32 721.81India - - 116 825.04All-Average 4,631 711.79 11,361 .665.48
Pl=odAII;Average 53,843 753,08 140,170 780.40
BlockboardAli-Average 5,644 663.51 8,512 637.36
MouldinstsAll-Average 32,896 1,368.22 84,974 1,336.29
SABAH
I- a22,700 237.36 431,200 237.06Pakistan - -- -All-Average 685,800 266.80 8,247,600 261.76
SavnvoodIndia _ Pakistan - - - -
All-Average 103,800 535.35 1,033,200 503.36
SARAWAR
Inia 50,500 152.75 559,000 156.14Pakistan - - 2:900 138.28All-Average 1,146,700 158.81 12,293,200 150.47
SawntimberIndia ~~~~- --
All-Average 25,600 671,45 205,400 729.77
/a ?752.75 = US$1.00 April 1989.
Source: Maskayu, Malaysian Timber Industry Board, Ministry of primaryindustries, Vol 3, May 1989

Table 43
India Thousand of metric tonneo (UT) or cubic metors (CUM) Percent Annual Crowth Rate1975 1988 199o 1996 2000 1975 1984 1990 1996
-1986 -1990 -1995 -2000
Roundwood^ Consumption CUM 198,204 2S0,287 286,814 287,844 309,859 2.2 1.8 1.8 1.5
Fu*lwood and CharcoalConsumption CWU 181,923 226,291 239,881 2S8,362 276,117 2.0 1.6 1.5 1.3
Industrial RoundwoodConsumption CUM 10,281 23,978 25,983 29,493 33,S42 38. 2.1 2.6 2.8
Wood for PulpConsumption CUM 1,173 3,097 8,282 4,009 4,919 9.3 3.8 4.1 4.2
Sawnwood and Sleeper.Production CUM 8,804 17,480 17,309 19,290 21,488 9.7 1.8 2.2 2.2Consumption CUM 6,798 17,480 18,099 20,942 24,231 9.8 2.4 2.9 2.9
Wood-Basod PanelsProduction CUM 172 442 525 ag9 626 10.4 3.9 4.7 4.8Consumption CUM 163 428 511 640 81S 11.3 4.0 4.7 4.7
Total Flbre FurnishConsumption MT 973 3,093 3,3t7 4,021 4,814 12.5 3.1 3.8 3.7
Waste PaperConsumption MT 55 500 680 737 939 26.1 4.4 4.8 4.9
Pulp for PaperConsumption MT 918 2,593 2,796 3,284 3,874 11.1 2.9 3.3 3.4
Othor Fibre PulpConsumption UT 8so 1,830 2,048 2,406 2,838 11.4 3.0 3.2 3.3
Wood Pulp for PaperProduction MT 254 717 723 873 1,060 10.1 3.1 3.9 4.0Consumption MT 268 763 749 879 1,039 10.3 2.5 3.3 3.4
Mechanical Wood PulpProduction UT 20 1S0 130 144 1SO 21.6 1.7 2.1 2.1Consumption UT 21 174 144 1S2 169 23.8 0.5 0.9 0.9
Chemical Wood PulpProduction UT 234 587 593 729 900 R.4 3.4 4.2 4.3Consumption MT 246 689 603 727 680 8.3 2.9 3.7 3.8
Total Paper and PeperboardProduction UT 911 5689 803 727 880 8.3 2.9 3.7 3.8Consumption MT 1,026 2,029 2,297 2,87S 3,604 6.8 4.0 4.8 4.8
NewsprintProduction MT 62 2S0 231 267 368 14.9 4.1 4.6 4.4Consumption Tr 163 417 487 692 720 11.2 3.4 3.9 3.9
Printing and Writing PaperProduction UT 604 8SO 1,001 1,281 1,654 6.0 4.3 4.5 4.8Consumption UT 507 895 1,090 1,413 1,832 5.5 4.7 5.2 6.2
Other Paper and PaperboardProduction MT 35S 700 671 790 936 6.7 2.3 3.3 3.4Consumption MT 367 717 720 870 1,051 5.6 3.0 3.8 3.8
Source: FAO, World Outlook Projections, 1988.

Table 44:
Pckistan Thousand of metric tonnes (MT) or cubic meterv (CUM) Percent Annual Orowth Rate1976 1986 1990 1906 2000 197S 1984 1990 1995
-1986 -1990 -1996 -2000
RoundwoodConsumption CUM 16,090 21,413 23,106 26,798 2,862 3.3 2.2 2.3 2.0.
Fuetwond and CharcoalConoumption CUM 14,602 20,056 21,606 24,091 26,696 3.0 2.1 2.3 2.0
IndustrIaI RoundwoodConsumption CUM 481 1,358 1,510 1,70? 1,928 9.9 4.6 2.6 2.4
Sawnwood and Stoepr.Production CUM 79 65 76 88 101 -3.9 6.6 2.8 2.8Consumption CUM 110 174 316 383 467 6.3 8.4 3.9 3.9
Wood-sased PaneltProduction CUM 27 64 111 148 19t 8.7 11.4 6.9 6.8Consumption CUM 36 76 154 214 296 7.6 14.0 6.7 8.4
Total Fibre FurnishConsumption MT 87 137 230 24t 379 6.1 9.2 6.1 6.2
Wwete PaperConsumption MT 30 10 48 as 88 -0.9 9.2 8.0 6.1
Pulp for PaporConsumption MT 37 127 182 230 291 7.4 9.1 4.8 4.8
Other Fibre PulpConoumption MT 60 108 166 196 246 7.2 8.8 4.5 4.8
Mechanical Wood PulpProduction MT 2 2 2 2 2 -1.9 3.6 1.3 1.3Consumption MT
Chemical Wood PulpProduction MT 6 17 24 32 42 12.3 10.3 6.6 5.6Consumption MT
Total Paper and PaperboardProduction MT 6B 73 147 19 267 3.3 11.9 6.1 6.2Consumptlon MT 124 240 838 504 663 6.8 11.0 6.8 5.8
NewsprintConsumption MT 7 40 s8 74 94 19.9 8.8 4.8 4.8
Printing and Writing PaperProduction MT 17 2S es it 1s6 7.1 12.3 6.2 6.3Consumption MT 62 8S 139 189 2S7 2.3 10.1 8.1 8.1
Other Paper and PaperboardProduction MT 39 48 84 112 161 1.2 11.6 8.0 6.1Consumption MT 61 11 186 241 312 6.2 11.3 S.2 6.2
Sour'e: fAO, World Outlook Projoctions, 1988.

Table 46:
Bangladesh Thousand of metric tonnes (MT) or cubic metera (CUM) Percent Annual Growth Rate1975 1986 1990 1996 2000 1975 1984 1990 1995
-1986 -1990 -1995 -2000
RoundwoodConsumption CUM 20,817 27,840 30,381 33,764 37,167 2.7 2.3 2.1 1.9
Fuelwood and Charco*lConsumption CUM 19,911 28,998 29,283 32,633 36,791 2.8 2.2 2.1 1.9
Industrial RoundwoodConsumptlon CUM 908 847 1,099 1,231 1,378 0.0 3.3 2.3 2.2
Wood for PulpConsumption CUM 8 36 43 48 60 19.4 2.4 1.8 1.7
Sawnwood and SleepersProduction CUM 238 79 170 190 213 -6.7 3.4 2.3 2.2Consumption CUM 240 84 195 227 264 -5.5 5.1 3.0 3.0
Wood-OSsed PanolsProduction CUM 48 13 19 24 30 -13.4 7.2 4.8 4.7Consumption CUM 48 13 14 17 22 -13.4 1.5 4.7 4.7
Total Fibre FurnishConsumption MT 28 132 187 181 211 17.8 4.3 3.0 3.0
Pulp for PaperConsumption MT 29 132 167 181 211 17.8 4.3 3.0 3.0
Other Fibre PulpConsumption MT 16 77 95 112 132 18.1 4.8 3.2 3.3
Wood Pulp for PaperProduction MT 12 31 40 46 52 11.8 4.0 2.7 2.8Consumption UT 12 56 81 89 79 17.3 3.5 2.4 2.8
Mechanicsl Wood PulpProduction MT 3 14 17 18 20 19.4 2.4 1.8 1.7Consumption MT 3 17 19 19 20 21.6 1.2 0.4 0.5
Chomical Wood PulpProduction UT 9 17 23 27 32 7.7 6.4 3.6 3.6Consumption MT 9 38 43 SO SO 1S.8 4.6 3.2 3.3
Total Paper and PaperboardProduction MT 49 102 1683 194 232 10.4 6.3 3.8 3.6ConsumptIon MT 43 91 158 199 262 10.5 8.8 4.7 4.8
NewsprintProduction MT 20 46 81 88 77 10.6 3.8 2.4 2.4Consumption MT 1S 28 49 80 74 10.1 S.8 4.0 4.0
Printing and Writing PaperProduction MT 24 44 78 t8 123 8.8 7.3 4.7 4.7Consumptlon 4T 24 51 80 104 136 9.2 7.1 6.3 S.3
Other Paper and PaperboardProduction MT 5 12 24 28 32 18.1 4.0 2.8 2.9Consumption MT 5 12 29 36 43 18.1 6.7 3.9 3.9
Source: FAO, World Outlook Projections, 1988.

Tablo 48:
Sri Lanka Thousand of mstric tona-e (UT) or cubic meters (CUM) Porent Annual Orowth Rat,19?6 9886 l990 1995 2000 1976 1984 1990 1996
-1986 -1990 -1996 -2000
RoundwoodConsumption CUM 7,118 8,854 9,138 9,89S 10,232 1.9 1.4 1.2 1.1
Fuelwood and CharcoslConsumption CUM 8,599 7,986 8,346 8,801 9,240 1.S 1.3 1.1 1.0
Industrial RoundwoodConsumption CUM S17 G88 793 n7 992 3.2 2.4 2.3 2.2
Sawnwoed and SI-oprsProduction CUM 38 20 27 ai 3S -6.3 2.8 2.6 2.8Consumption CUYl 38 28 46 58 8 -0.5 4.1 3.8 3.8
Wood-eased PanoleIProduction CUM 28 10 20 25 32 -4.6 6.7 6.2 5.1Consumption CUM 38 16 2S 28 36 -4.0 -0.8 6.4 S.4
Total Fibre FurnishConsumption MT 21 17 29 38 48 -0.1 5.5 6.1 6.2
Wont PaperConsumption WT 9 8 11 1S 20 -1.9 8.1 5.8 5.8
Pulp for PaperConsumption MT 12 - 11 16 23 29 1.0 5.1 4.6 4.7
Othor Fibre PulpConsumption MT 8 6 12 1S 19 4.9 4.8 4.3 4.3
Wood Pulp for PaperConsumption MT 8 S 6 8 10 -4.4 5.5 5.2 5.3
Chemical Wood PulpConsumption MT 8 S 8 8 10 -4.4 6.4 5.1 5.2
Total Paper and PaperboerdProductlon MT 19 26 32 43 8 1.8 6.5 5.7 6.7Consumption MT 38 s0 8a 107 138 6.7 6.8 5.2 6.2
NewsprintConsumption MT 7 1s 20 25 31 9.8 6.0 4.5 4.5
Printing end Writing PaperProduction Mr 9 17 22 s0 39 5.9 6.6 5.8 6.8Consumption MT 1S 23 35 46 82 S.1 6.3 6.8 5.8
Other Paper and PaperboardProduction MT 10 8 10 13 17 -3.7 6.7 6.6 6.6ConUuuption MT 11 22 29 38 46 7.0 6.4 4.1 4.7
Source: FAO, World Outlook Projections, 1988.

Table 47:
Nepnl Thousand of metric tonnes (MT) or cubic moters (CUM) Percent Annual Crowth Rate1976 1986 1990 1996 2000 1975 1984 1990 1996
-1986 -1990 -1996 -2000
RoundwoodConsumption CUM 12,421 18,001 17,229 19,008 20,87S 2.4 2.0 2.0 1'.9
Fuelwood and CharcoalConsumption C0U 12,023 15,567 16,773 18,525 20,309 2.4 2.0 2.0 1.9
Industrial RoundwoodConsumption CUM 398 434 466 480 SOS 1.0 0.0 1.1 1.0
Sawnwood and SleepersProduction CUM 220 220 236 258 276 0.0 1.2 1.7 1.8Consumption CUM 216 220 263 293 339 0.2 2.4 2.9 2,9
Total Fibre FurnishConsumption uT 18 1S 16 17 18 0.0 1.0 1.2 1.2
Pulp for PaperConsumption MT 16 16 16 17 18 0.0 1.0 1.2 1.2
Other Fibre PulpConsumption WT 1S 1S 16 17 18 0.0 1.0 1.2 1.2
Total Paper end PaperboardProduction MT 2 2 2 2 3 -1.4 3.4 4.6 4.7Consumption MT 2 2 2 3 3 1.2 3.1 3.9 3.9
Other Paper and PaperboardProduction MT 2 2 2 2 3 -1.4 3.4 4.8 4.7Consumption MT 2 2 2 3 3 1.2 3.0 3.8 3.8
Source: FAO, World Outlook Projections, 1988.
Table 48:
Indas Thousand of metric tonnes (MT) or cubic meters (CUM) Percent Annual Growth Rate197s 1986 1990 1996 2000 1976 1984 1990 1996
-1986 -1990 -1996 -2000
RoundwoodC^nsumption CUM 2,810 3,217 3,694 3,938 4,289 1.6 1.9 1.8 1.7
Fuelwood and ChaYcoslConsumption CUM 2,672 2,948 3,296 3,602 3,918 1.6 1.9 1.8 1.7
Industrial RoundwoodConsumption CUM 238 271 297 338 372 1.4 1.6 2.4 2.0
Sawnwood and SleepersProduction CUM 0 6 6 7 9 - 2.7 4.4 3.8Consumption CUM 0 6 2 2 a - 3.0 4.8 3.8
Source: FAO, World Outlook Projections, 1988.

Tskis: 4 VAE Of IWPORTS OF PRNST PfM=TS SY HFX. EASTW COISRIES in lot1O*8'000 mill.)
based P 1 and based Pap. soMiddle East Countr i Total Rrudeod Sawnsood panels Woodpulp poaperrd Rouadaood Soon**od poanl woodp.lp Paperboard
OBarain 26.2 4.0 - 16.0 4.2 15.3 - 61.1 I 23.6Iran 179.8 21.6 17.0 85.1 17.9 8e.2 12.0 9.S 19.5 10.0 49.0Iraq 11.9 0.1 89.0 20.1 0.8 5S.8 - 33.8 14.2 0.1 4? )zeroal 221.7 80.6 84.5 8.8 22.1 126.2 13.0 15.6 3.7 10.0 56.9Jordan 60.4 2.8 8.8 34.4 - 87.1 8.8 10.9 23.6 - 61.4tWusait 102.4 2.8 17.0 48.4 - 87.2 2.8 16.6 44.8 - 6.SL.ebatowi 70.8 0.8 87.0 8.5 - 29.5 0.4 52.6 6.0 42.0man 87.6 0.6 1:7 15.1 - 20.2 1.6 4.5 40.2 5 82.7Qatar 16.7 0.2 6.5 - 10.0 1.2 - 88.9 - S9.9Saudi Arabia 265.0 88.* 47.0 103.5 - 70.7 12.8 21.4 39.1 - 26.7Syria 97.4 4.4 48.0 11.6 42.4 C.5 44.1 i1.9 - 43.5Yoe"n, IR.Rop. 3.4 0.8 0.9 1.5 - G.7 8.8 26.6 44.1 - 20.6TOTAL 1,196.2 97.0 253.? 281.0 40.0 52S.7 8.1 21.2 23.5 3.4 43.8
Womb 80,089.6 10,671.9 11.229.2 7.226.) 12.7S6.4 83,813.7 13.2 14.0 9.0 15.9 42.2
Source: FAD Yearbook of For4st Products 1989; 11P Annual Rport 1986.

Table 50: LAND AREA. POPULATION, & GNP OF MIDDLE-EASTERN COUTNTRIES
TotalLand Area Population Gross National Product('000 km2) (millions) US$ mill. USSlcpt.
Bahrain 1 0.40 4,200 10,510Iran 1,648 42.51 161,540 3,800Iraq 43J 14.66 41,780 2,850Israel 21 4.18 20,660 5.370Jordan 98 3.24 5,310 1,640Kuwait 18 1.70 21,330 17,880Lebanon 10 2.62 2,490 950Oman 300 1.18 7,460 6,250Qatar 11 0.28 5,940 21,210Saudi Arabia 2,150 10.44 127,680 12,230Syria 185 9.60 16,900 1,760Uziited Arab Emirates 84 1.21 27,670 22,870Yemen A.R. 195 7.60 4,180 550Yemen, Dem. Rep. 333 2.01 1,000 520
TOTAL 5,489 101.63 448,140 4,410
Source: FAO Yearbook of Forest Products 1984; UNDP Annual Report 1985.

Tabl 6A: VOUe OF {IfVfRTS OF FtlRT PIt014CS SY HNILI ASST CauMRIES IN 107
Stun Tiaber Wood-400d Penai. Paper mad Paeprboard
________ ------------------ _ _----------- - ----------- wood -- ---- ---------------------------- ---
Roundsoad Total Softwood Nardeod Total Pliyaod Prtcl./Bd Fibrjgd Pulp Totbl Neaprat PrrtiMrks OUh*rs
COOO as)…'--_-_--------- toi I$. t)-
fObrain 36 60 - 00 40. 40* - - - 4 _ 2. 2.
Iran 117 lot 10100 1* sea sEe 85 -- 86 125 10. Me 60.
tIr 210 200D 10 S6 S2. 2* 8 2 *4. 34. 27. 23*
Ilrael 21S 225 210 1s 25 1 9- - 48 204 68 to is
Jordan 17 47 45* 2 4 46 - - 47 9 9 29
Kuwait 61 100. 100. -t 126 118 6. 2 - 65. 20- 16. 19.
Le*bnon 16 100 100. -. 22 7T 14. -. - 61 4. 21. 26.
Oman 26 74 8* g6a 63 62* 1 - - 1S. I 5 S
Qatar 36 - - - l6. too - - 6. - 4* 2.
Saudi Arabi 221 638 2405 233 330 10 t1 - 112 28 51 33
Syria 22 265 230 55s3 9 14 -72 5 4
Yee.*. 0... Rep. 6 29. as 21. 2 2* - - - 1- -. -. -.
TOTAL 771 1,669 1,406 463 832 698 81 15 66 774 179 2#3 363
Source O YeArbook of Forest Product. 1209.
oUnafficj.l figure. or etiestes.
.~~~~~~~~~

Table 62: TRADE IN SAVO SOFTWOOD TO THE MIDDLE EAST IN 1984.('000 .3)
ExportersImporters Austria Finland Portugal Romania Spain Sweden Yugoslavia USSR Canada U.S.A. Volum X of total Total
Iran 119 8 8 - - - 112 - 289 97 277Iraq 10 163 - - 1 164 6 - - - 834 99 33UIsrael 2 109 80 - 2 28 44 - 17 10 240 go 261Jordan - - - 29 - - - 1 30 100 30Kuwait 9 - - - - - 7 - - - 18 94 17Lebanon 12 - - - - 2 6 - - 16 34 100 34Saudi Arabia 280 68 1 268 - 317 26 21 290 24 1,263 90 1,302Syria 4 20 - - - 10 20 - - - 64 100 64
TOTAL 416 878 81 265 8 860 106 21 807 60 2,230 782 2,801
N.B. The definition of "Middle East' unfortunately excludeo som substantial trade flows, some of which dwarf those noted here e.g. 140.000mg from Chile to Egypt (and from Chile to Turkey and othor parts of the *Middle East).
Source: FAO
The Middlo East accounts for only a tiny fraction of world Imports of sawn hardwood (1.95) and Saudi-Arabia accounts for most of this. In1987 she imported 63,000 d8 of saon hardwood from Malaysia and 84,000 o3 from Singapore. However, she also acquired substantiol volumes fromthe Ivory Coast and Brazil. In 1984 Oman was a significant buyer from Malaysia, Singapore and the Philippnes. For plywood, tho overallratio Is slailarly low. In this case Indonesian exports or. greatest, Saudi-Arabia Importing 317,000 *3 of tropical plywood in 1987, othersources being Malaysia, Taiwan, S. Korea, *nd Singapore. Kuwait and Egypt were also notable purchasers in recent yeors.

Table 53: TRADE IN SAWN HARDWOOD BETWEEN SELECTEDEAST AND SOUTHEAST ASIAN EXPORTERS AND
MIDDLE EASTERN IMPORTERS IN 1984
Total.(countries
Tmporters Malaysia Philippines Singapore shown)(1,000 m3)
Sawn hardwood
Oman 29 13 9 51Saudi Arabia 63 7 95 165
Total 92 20 104 216(2 countries)
Source: FAO Yearbook of Forest Products 1985.

Table 54: PATTERN OF TRADE IN PLYWOOD BETWEEN REGIONAL GROUPS IN ls984
ExportersWorld~' ~ North RKst ot-
Tmporters total Europe USSR America world /a(1000 m3 )
World 8,416 1,503 380 715 5,818Europe 3,029 1,262 300 553 914North America 1,412 23 12 78 1,299
8 Middle Eastern 287 23 - - 264
Rest of world 3,523 119 68 84 3,252
(I of world total)
World 100.0 17.9 4.5 8.5 69.1Europe 25.5 15.0 3.6 6.6 10.9North America 11.9 0.3 0.1 0.9 15.4
8 Middle Eastern 2.4 0.3 - - 3.1
Rest of world 44.8 1.4 0.8 1.0 38.6
Table 55: PATTERN OF TRADE IN PAPER AND PAPERBOARD OTHER THANNEWSPRINT BETWEEN REGIONAL GROUPS IN 1984
ExportersWorld North Rest of
Importers total Europe USSR America world /a(1,000 mt)
World 26,312 18,595 645 4,917 2,155Europe 15,885 14,207 492 947 239North America 2,974 1.011 - 1,821 142
8 Middle Eastern 382 234 - 148 -
Rest of world 6,771 2,990 153 1,944 1,774
(2 of world total)
World 100.0 70.7 2.5 18.7 8.2Europe 60.4 54.0 1.9 3.6 0.9North America 11.3 3.8 - 6.9 0.5
8 Middle Eastern 1.5 0.9 - 0.6 -
Rest of world 25.7 11.0 0.6 7.4 6.7
la Including unidentified trade flows.
Source: FAO
Note: Detail may not add to total, becasue of rounding.

Table 56: PATTERN OF-TRADE IN NEWSPRINT BETWEEN REGIONAL GROUPS IN 1984
ExportersWorld North Rest of
Importers total Europe USSR America world /a(1,000 mt)
World 13,272 4,015 341 8,411 505Europe 3,349 2,966 218 160 5North America 7,029 337 - 6,692 -
8 Middle Eastern 65 65 - - -
Rest of world 2,726 385 123 1,518 500
(Z of world total)
World 100.0 30.2 2.6 63.4 -Europe 25.2 22.3 1.6 1.2 -
North America 53.0 2.5 - 50.4 -
8 Middle Eastern 0.5 0.5 - - -
Rest of world 20.5 4.4 0.9 11.4 3.8
Table 57: TRADE IN NEWSPRINT AND OTHER PAPER AND PAPERBOARDBETWEEN REGIONAL GROUPS IN 1984
ExportersNewsprint Other paper and paperboard
Importers Finland Sweden Finland Sweden US(1,000 mt)
Iran 23.2 0.3 47.0 43.9 -
Iraq - - - - -
Israel 3.3 26.7 15.3 9.6 68.6Jordan - - - - 4.3Xuwait - - - - 1.9Lebanon 5.3 - 10.2 6.7 23.2Saudi Arabia - - - - 37.2Syria - - - -
Total 31.8 27.0 72.5 60.2 135.2

Table 58: EUROPEAN SOURCES OF SUPPLY OF FOREST PRODUCTS IN 1969-71AND 1979-81
Volume Change over(million m3 RVE) 10 years
1969-71 2 1979-81 Z
European removals 338 67 341 74 + 3 (+ 12)Indusrtail wood residues 29 9 44 6 + 15 (+ 522)Waste paper la 23 8 40 5 + 17 (+ 742)Imports from other regions 65 16 84 14 + 19 (+ 292)
Total Suply 455 100 590 100 + 53 (+ 12Zout of which:European market 435 95 483 96 + 48 (+ 112)Export to other regions 20 5 26 4 + 6 (+ 302)
Ia Converted from metric tons with the factor 2.5

Table 59: EUROPEAN CONSUMPTION SCENARIOS TO 2000
Scenario to 2000Units 1970 1980 Low High
Sawnwood m3 93 102 119 141Woodbased panels. m3 23 36 50 58Paper and paperboard m.t. 38 49 67 92Fuelvood m3 69 72 86 109Other indil wood m3 30 23 - 21 -

Table 60: EUROPEAN CONSUMPTION SCENARIOS FOR SAWNWOOD AND WOOD-BASED PANELS
1979-81 Low scenario High scenario Average annualX change
Avg. 1990 2000 1990 2000 Low High
SAWNWOODNordic countries 10.75 10.39 10.97 10.80 12.19 + 0.1 + 0.6EEC (9) 50.46 51.70 58.60 54.60 69.29 + 0.8 + 1.6Central Europe 5.04 5.26 5.72 5.52 6.65 + 0.7 + 1.4Southern Europe 14.32 16.30 20.79 17.91 26.83 + 1.9 + 3.2Eastern Europe 21.75 22.95 22.95 24.08 25.88 + 0.3 + 0.9
EUROPE 102.32 106.60 119.03 112.91 140.84 + 0.8 + 1.6of which:sawn softwood 78.15 80.52 86.94 85.25 102.47 + 0.5 + 1.4sawn hardwood 22.37 24.29 30.30 25.87 36.58 + 1.5 + 2.5sleepers 1.80 1.80 1.80 1.80 1.80 - -
WOOD-BASED PANELSNordic countries 2.57 2.68 3.08 2.92 3.78 + 0.9 + 1.9EEC (9) 20.78 21.99 .26.16 23.41 31.83 + 1.2 + 2.1Central Europe 1.35 1.45 1.73 1.55 2.15 + 1.2 + 2.3Southern Europe 4.02 4.65 6.28 4.94 7.52 + 2.3 + 3.2Eastern Europe 6.88 9.62 12.36 10.02 13.17 + 3.0 + 3.3
EUROPE 35.60 40.40 49.63 42.85 58.46 + 1.7 + 2.5of which:particle board 23.82 28.36 36.13 30.16 42.52 + 2.1 + 2.9plywood 5.44 5.61 6.61 6.02 8.20 + 1.0 + 2.1fibreboard 4.45 4.53 4.99 4.77 5.84 + 0.6 + 1.4veneer sheets 1.90 1.90 1.90 1.90 1.90 - -

Table 61: ANNUAL WORLD WMPORT ESTIMATE BY PRODUCT GROUP 1979-1981(mill. m3)
World Europe 2
Logs 139.9 46.2 33.0Sawnwood 76.3 33.8 44.3Panels 16.3 10.1 62.0Pulp 20.1 11.3 56.2Paper and Paperboards 33.2 16.4 49.3Total *(mill. m3 RWE) 506.4 231.7 45.7
Table 61a: WORLD IMPORT ESTIMATE, FOREST PRODUCTS 1980
mill. m3 RWE 2
Europe 225 47.4USSR 5 1.0Noth America 90 19.0Latin America 14 2.9Africa 9 1.9Japan 71 15.0Other Asia/Pacific 41 8.6Unidentified 20 4.2
Total World 475 100

.
Table 62: SHARES OF WORLD TROPICAL HARDWOOD IMPORT 1980mill. m3 RWE
World Europe 2
Logs 25.2 3.5 14Sawnwood 14.7 5.6 38Plywood & Veneer 17.5 2.8 16Total in million m3 RWE 57.4 11.9 21

Table 63: EUROPEAN IMPORTS OF TROPICAL HARDWOOD PRODUCTS, 1965, 1976 & 1986'000 m3 RWE
1965 X 1976 2 1986 S
ProductLogs 5,106 69.1 6,503 46.3 3,457 29.5Sawnwood 1,868 25.3 5,398 38.4 5,655 48.3Plywood 315 4.2 1,886 13.4 2,313 19.7Veneer sheets 105 1.4 263 1.9 290 2.5
Total. 7,394 100 14,050 100 11,715 100

Table 64: SUPPLY OF TROPICAL HARDWOOD LOGS TO SELECTED COUNTRIES,1982 AND 1986
'000 m3
To: France Italy F.R.G. Spain Neth' Greece Total Z TotalFrom: lands (six)
0,000
.1982 Africa 1,229 892 487 353 112 221 3,294 97Asia 38 1 24 - 4 20 87 3Latin 4 2 1 - 2 - 9 -America
Total 1,271 895 512 353 118 241 3,390 100
1986 Africa 1,000 508 413 400 119 200 2,640 97Asia 48 5 24 - 3 5 85 3Latin 2 1 1 - 1 2 7 -AmericaTotal 1,050 514 438 400 123 207 2,732 100
Source: UCBT

Table 65: EUROPEAN IMPORTS OF TROPICAL SAWN HARDWOOD BY ORIGIN'000 m3
Origin/Year 1966 2 1976 Z 1982 2 1986 2
Africa 411 38 450 15 393 17 580 20Asia 527 48 1,854 63 1,834 78 2,226 75Latin America - - 55 2 123 5 155 5others 152, 14 583 20 - -
Total 1,090 100 2,942 100 2,350 100 2,961 100Index 100 270 215 271

Table.66: SUPPLY OF TROPICAL SAWN HARDWOOD TO SELECTED EUROPEAN COUNTRIES'000 m3
To: Neth- U.K. F.R. France Belgium Spain Total Z oferlancs Germany Italy (Seven) Total
1982 Africa 43 59 54 127 26 20 64 393 16.7Asia 377 292 346 304 345 145 34 1,834 78.1Latin 2 89 13 4 5 1 9 123 5.2AmericaTotal 422 440 413 435 376 166 107 2,359 100
i986 Africa 51 71 52 159 100 32 115 580 19.6Asia 645 395 403 267 276 195 45 2,226 75.2Latin 11 110 8 1 1 4 20 155 5.2America
Total 707 576 463 427 377 231 180 2,961 100
Source: UCBT

Table 67: ORIGIN OF TROPICAL SAWN HARDWOOD IMPORTS FOR SEVENSELECTED COUNTRIES
Average 2 of Total Imports 1982-1986
Africa Asia Latin America Total
Netherlands 9.3 89.4 1.3 100United Kingdom 13.3 68.3 18.4 100Germany, Fed.Rep.of 12.7 84.8 0.4 100France 33.9 65.7 0.4 100Italy 18.0 81.6 0.4 100Belgium 11.7 87.1 1.2 100Spain 63.1 24.8 12.1 100
Average 18.6 76.0 5.4 100
.;

Table 68: MAIN SUPPLIERS OF TROPICAL SAWN HARDWOOD TO EUROPEANCOUNTRIES 1982-86
'000 m3 21982 1986 1982 1986
AFRICAIvory Coast 190 353 48.3 60.8Cameroon 104 83 26.5 14.3Ghana 28 65 7.1 11.2Others 71 79 18.9 13.6
Total 393 580 100.0 100.0
ASIAMalaysia 891 1,229 48.6 55.2Indonesia 469 525 25.6 23.5Philippines 276 244 15.0 11.0Singapore 173 182 9.4 8.2Others 25 47 1.4 2.1
Total 1,834 2,226 100.0 100.0
LATIN AMERICABrazil 104 133 84.5 85.8Others 19 22 15.5 14.2
Total 123 155 100.0 100.0

Table 69: SAWNWOOD EXPORTS FROM TROPICAL AFRICA BY SPECIES
X of total
15-20 Obeche10-15 Sapele Utile5-10 Iroko Makore
Mahogany2- 5 Afrormosia Agba
Azobe Framire1- 2 Afzelia Afara
Niangon TiamaGuarea TchitolaOkoume BetIlomba AburaAntiaris FromagerKosipo African walnutEkki Ozigo

Table 70: TROPICAL PLYWOOD IMPORTS BY MAIN EEC IMPORTERS 1976, 1980 & 1986('000 m3)
1976 2 1980 X 1986 Z
United Kingdom 412.9 50.4 234.5 40.2 488.9 48.6Netherlands 131.1 16.0 101.6 17.4 170.6 17.0Belgium 42.4 5.2 58.4 10.0 114.5 11.4P.R. Germany 56.5 6.9 57.1 9.8 81.0 8.1France 85.0 10:4 94.2 16.2 84.0 8.3Total 727.9 88.8 545.8 93.6 939.0 93.4

Table 71: TROPICAL PLYWOOD IMPORTS BY EEC (12) 1978 and 1986('000 m3)
Source 1978 1 1986 z
Indonesia 29.0 4.1 547.9 56.7Malaysia 110.2 15.6 112.6 11.6Singapore 141.9 20.1 50.8 5.2Philippines 60.1 8.5 74.6 7.7South Korea 216.6 30.6 18.6 1.9Taiwan 73.6 10.4 26.1 2.7
Sub-total 630.9 89.5 830.6 85.8
Gabon 33.0 4.7 26.9 2.8Cameroon 4.6 0.6 4.5 0.5Cfnte d'Ivoire 2.2 0.3 3.4 0.4Zaire - - 1.1 0.1
Sub-total 39.8 5.6 35.9 3.8
Brazil 21.4 3.0 85.4 8.8Others 12.9 1.8 15.6 1.6
Total 705.0 100.0 967.5 100.0

Table 72: EUROPEAN IMPORTS OF TROPICAL HARDWOOD VENEER SHEETSBY REGION, 1976 and 1986
('000 m3)
1976 2 1986 Z
Nordic countries 4.6 3.3 5.4 3.5EEC (9) 127.2 92.0 143.3 94.0Central Europe 0.7 0.4 3.0 2.0Southern Europe 5.9 4.3 1.0 0.5Eastern Europe 0.2 - - -
Total 138.6 100 152.7 100
TROPICAL VENEER IMPORTS BY SIX EE_ COUNTRIES, 1976 & 1986('000 m3)
1976 2 1986 2
F.R. Germany 35.8 29.7 49.1 36.0Italy 12.7 10.5 35.3. 25.9Belgium 5.9 4.8 16.8 12.3United Kingdom 19.9 16.4 14.0 10.3France . 37.0 30.6 12.7 9.3Netherlands 9.7 8.0 8.5 6.2Total 121.0 100 136.4 100

Table 73: TROPICAL VENEER IMPORTS INTO EEC BY SOURCE, 1976 and 1986'000 m3
1976 2 1986 X
Cote d'Ivoire } 38.5 27.0Ghana } 9.3 6.5Cameroon } 95.5 26.5 18.5Congo 19.9 13.9Zaire 13.6 2.5Gabon } 69.7 1.9 1.3
Brazil 10.7 9.8 14.1 9.8
Malaysia } 6.9 4.8Thailand } 10.9 3.3 2.3Philippines } 2.8 1.9Singapore } 10.0 1.4 1.0
Others 10.1 10.5 15.1 10.5
Total 127.2 100 143.3 100

Table 74: F.R. GERMANY, TROPICAL LOG IMPORTS BY SPECIES, 1970, 1983, 1988('000 m3)
1970 Z 1983 1 1988 Z
Obeche 444 32 128 23 21 5Sipo 179 13 84 15 35 8Limba 182 13 22 4 16 4Makore 95 7 8 1 3 1Okoume 221 16 30 5 12 3Others 284 19 288 52 334 79Total 1,405 100 560 100 421 100

Table 75: TROPICAL WOOD SPECIES IMPORT TRADE STATISTICS FOR LOGS(1,000 M3)
January-December 1987 -
IMPORTING COUNTRIESBelgium-Lu France Germany FR Italy Netherland UK Australia Japan Singapore USA
Afr. Mahogany 6.34 0.99Afrormosia 1.38Azone 6.92 71.63Ebony 0.11Iroro 1.60Kapur 1.99Keruing 1.86Kiri 30.01Kwarin 3.35Limba 1.35 0.41 17.56 10.36 0.15Makore 1.09 3.64 2.97 0.19 0.24 4.03Merant-Lauan 11,322.63 4.10 0.03Obeche 0.01 12.67 81.92 16.44 4.03 1.47Omoume 2.94 283.97 8.66 11.32 16.73Sifo 1.61 15.76 32.11 6.16 1.29 0.29Swieten. Mah. 0.25Teak 8.18 12.79Walnut Afr. 5.22Other Spec. 99.23 568.73 236.49 481.34 20.93 36.49 2,176.44 37.94 9.09
Total 73.34 885.40 379.71 926.24 115.00 57.99 13,762.72 98.68 4.37
Source: FAO 1987
4

Table 76: IMPORT OF SAWN TROPICAL HARDWOODBY F.R. GERMANY, 1988
'000 m3 2
Meranti 341 68Okoume 91 18Virola 5 ISipo 41Limba 1 1Others 57 11
Total 499 100

Table 77: EUROPE - ESTIKATE OF END-USES FOR TROPICAL SAWNHAEDWOOD IN 1986
End-Use Volume Z('000 m3)
Construction-carpentry and general joinery 1,183 30 )- industrial joinery 1,104 28 }
) 63- other construction 197 5 1Furniture 1,064 27others, transport, toys, gifts,household goods, miscellaneous 394 10
Total 3,942 100

Table 78: U.K.; END-USE ANALYSIS OF TROPICAL SAWNWOOD, 1972 and 1984
End-use 1972 1984'000 m3 (Z) '000 m3 2
Construction 227 42 345 59Furniture 216 40 192 32Transport 43 8 30 5Ships and Vehicles 27 5Others 7 5 23 4
Total 540 100 590 100
Sources 1972: Fowler, Richard W. 'Trends and Prospects for Tropical HardwoodConsumption in the UK". Thesis 1974, UCNW, Bangor. 1984: Estimatesbased upon unpublished studies.

Table 79: END-UISE ANALYSIS OF TROPICAL SAWNW OD IN FRANCE, 1984
'000 m3 z
Industrial joinery 262,500 35.5Carpentry/other construction 150,000 20.0Interior decoration 83,750 .11.5Furniture and mouldings 198,750 26.5Other, including exports 47,500 6.5
Total 742,000 100.0
Source: Febvre, Francois "Importations et Utilisation des Bois Tropicaux enFrance" Thesis 1988, University of Montpelier.

Table 80s EUROPEAN IMPORTS OF WOODEN ALDED-VALUE PRODUCTSFROM DEVELOPING COUNTRIES, 1986
Products '000 tonnes 2
Wooden household goods 99.1 52.6
Wooden beadings and mouldings 11.3 6.0Wooden doors 36.5 19.4Other construction components* 25.0 13.3
Sub-total construction components 72.8 38.7
Dining and living room furniture 8.4 4.5Chairs 3.3 1.8Furniture components 4.6 2.4
Sub-totvl furniture and components 16.3 8.7
TOTAL ADDED-VALUE PRODUCTS 188.2 100.0
* Planed, tongued, and grooved timber & beadings

Table 81: EEC(12) IMPORTS FROM ASIA OF WOODEN ADDED-VALVE PRODUCTSBY COUNTRY, 1982 & 1986
tonnes
1982 z 1986 Z
Taiwan 22,346 34.0 23,440 32.0Malaysia 20,066 30.5 23,218 31.7Singapore 13,298 20.2 9,824 13.4Philippines 2,961 4.5 8,809 12.0Indonesia 4,796 7.4 6,130 8.4P.R. China 1.776 2.7 1,210 1.6Thailand* 483 0.7 696 0.9Total 65,726 100.0 73,3271 100.0
N.B. Excludes wooden household goods
* Thailand exported almost 4000 t. of wooden household goods to Germanyin 1986
| This is 73Z of total EEC(12) imports from developing countries

Table 82: EEC (12) IMPORTS OF WOODEN BEADINGS AND MOULDINGSBY ORIGIN, 1978-1986
1978 1980 1982 1984 1986
Number of EEC countries covered 8 9 9 10 12
(mt)Malaysia 3,540 4,602 4,710 3,071 7,269Singapore 4,500 1,355 1,389 1,575 1,817Indonesia 4,500 1,355 1,389 1,575 1,817Brazil 1,142 - 884 1,542 611CameroonGhana - - 147 726 1,023Cote d'Ivoire
Sub-total of imports fromdeveloping countries 9,967 6,759 8,227 7,662 11,303
Intra-EEC trade 11,923 11,381 12,281 15,909 18,072
Total EEC imports 24,089 21,792 24,328 27,558 33,848
Share of EEC imports (2)Percent from EEC 49.5 52.2 5O.d 57.7 53.4Percent from developing countries 41.4 31.0 33.8. 27.8 33.4Percent from other 9.1 16.8 15.7 14.5 13.2

Table 83: ROUGH END-USE COMPARISONACTUAL IMPORTED AND POTENTIAL SWPI-SPECIES IN EUROPE
'000 m3 RWE
Main Species/ Import Z Potential Species fremGroup used Volume the Region with roughly Potentialin Europe in 1987 Comparable End-use Volume
1 Meranti/Lauan 1,827 41 Calophyllum (10), Terminalia (1), 1,818
Palaquium (4), Myristica (2),Pometia (22)
2 Ramin 652 17 Gonystylus (<I), (Gmelina) 63 Okoume 324 3 Octomeles (3), Campnosperma (1), 960
Calophyllum (10), Canarium (3),Terminalia (5), Myristica (1)
4 Mahogany(Swiet) 273 7 Calophyllum (10), Pometia (22), 1,534Canarium (3)
5 Keruing 230 6 Dillenia (3), Myristica (1), 291Syzygium (2)
6 Obeche 152 4 Pterocymbium (3), Endospermum (3), 403Octomeles (3), (Gmelina)
7 Sipo/Utile 128 3 Calophyllum (10), Pometia (22), 1,534Canarium (3)
8 Azobe 126 3 Homalium (5), Celtis (2) 3529 Iroko 79 2 Intsia (2) 9510 Limba 35 1 Terminalia (5), Gonystylus (<1) 22111 Sapelli 30 1 Calophyllum (10), Pometia (22), 1,534
Canarium (3)12 Afr. Mahogany 26 1 Calophyllum (10), Pometia (22) 1,534
Canarium (3)13 Mokore 12 - Dillenia (3), Calophyllum (10), 1,839
Canarium (3), Pometia (22),Palaquium (4)
14 Afrormosia 6 - Intsia (2) 95
TOTAL 3,900 100
Source: Gehr, 1989
N.B. Bracketed figures are the proposed harvest in the region.The potential volume is based on the results of the present study.

Table 84: IElM STATISTICS Of TROPICAL LOUS BY SPECiE OF 5fLrED 8 E CtIUuRIEJwmary-Je 1960
Specz nseeuO .Wx ... r. i tt . 1 31¶SL......r. 2~iI:jnL........1 9 N 3hselrndmzI. t Total Tottal Value Range Averag.
.000 ; i t"s0 3
III Rod ereftti 0.58 0.20 345 0.86 0.15 417 0.80 0.12 400 I.50 0.48 20 0.74 0.40 E41 3.46 1. as 320 .5411 38hito L, *, 0.04 400 0.11 0.04 368 0.20 0.06 250 0.25 0.05 0.41 0. 16 485 1.07 0.34 250 (439 3168Cutuing-_ Croup 0.. 0.28 481 2.60 1.26 481 2.02 1.40 693 1.30 0.88 762 0.65 0.46 782 1.S 0.69 444 8.66 4.94 (431) 444 671
Dl wood Grout 11.61 8.64 818 216.40 23.76 200 83.05 17.10 822 90.68 22.16 244 19.42 59.34 275 20.83 8.2S 290 419.6 100.26 202 322 2391.41 0.41 291 157.99 20.?7 182 6.00 1.09 218 9.56 1.73 101 9.78 2.29 294 0.00 0.04 103.02 34.32 181 291 1871.45 0.43 209 11.42 2.37 208 9.04 1.68 184 14.57 8.16 217 6.083 1.8 205 0.26 0.00 42.71 8.80 184 289 2086ipo 1.60 0.60 402 8.62 2.92 839 18.92 7.18 379 4.21 1.40 83U 0.50 0.22 440 2.52 0.03 329 86.40 18.23 329 402 363Acjmog 4.60 1.46 302 4.-6 1.45 440 ArcorJ 2.31 0.69 292 3.41 0.81 236 2.02 0.72 855 0.10 0.40 5.00O 1.31 262 12.$4 8.94 230 309 304Otirlr 0l Crcup 4.6? 1.45 80t 84.90 6.95 255 17.12 6.27 86 62.S4 15.87 255 4.01 1.40 i 14.67 4.54 290 I30.77 38144 255 366 277Liaka/AsobiWoup 10.03 3.25 S0 19.56 3.58 108 17.35 4.24 244 62.37 14.60 235 40.00 7.94 199 0.70 0.28 39s 150.91 33.95 1083 1359 225Limb. 0.63 0.20 317 0.65 0.14 244 6.25 2.32 201 11.08 2.22 187 0.04 0.01 21.42 4.91 187 281 229Aanbe 2.61 0.54 200 39.46 .. 00 190 42.W0 8.34 1 9806 198Other Lunan Croup 7.60 2.61 830 18.91 3.42 101 9.10 1.92 211 50.62 12.44 240 0.54 0.14 260 0.74 0.27 8.65 07.41 20.7 181 (3651 237Mor trwipcl logo 180.98 n7561 146.6rot.t coded as tropical 23.00 7.41 311 239.08 4.41 204 (211.901 22.91 314 154.00 37.84 245 *01.47 14.19 231 1(89171 9.60 300 [707.601 140.84 204 314 241
111 Volume '000 0 - Cif Voluv W milliion - Cif Volue USe *321 (Io bracket) -below 1.000
Source: FAO 19t0

Table 85:. PAPUA NEW GtTINEAN DOMESTIC SAWN TIMBER&PLYWOOD MARKET PROJECTION
('000 M.3)
period savn plywood
1991-1995 225 13.61996-2000 316 16.62001-2005 443 20.12006-2010 621 24.52010-2015 846 28.92016-2020 1,132 33.6
Source: Cameron

Table 86: FIJIAN DOMESTIC SAWN TIMBER & PLYWOODMARKET PROJECTION
(m3)
period savn plywood
1990-1995 90,000 4,5001996-2000 110,000 5,5002001-2005 135,000 6,8002006-2010 162,000 8,1002011-2015 181,000 9,4002016-2020 215,000 10,800
Source: Cameron

Table 87: SOLOMONS ISLANDS DOMESTIC SAWN TIMBER MARKET PROJECTION
year volume m3
1990 10,.9001995 13,6002000 17,0002005 20,8002010 25,6002015 31,4002020 38,600
Source: Cameron
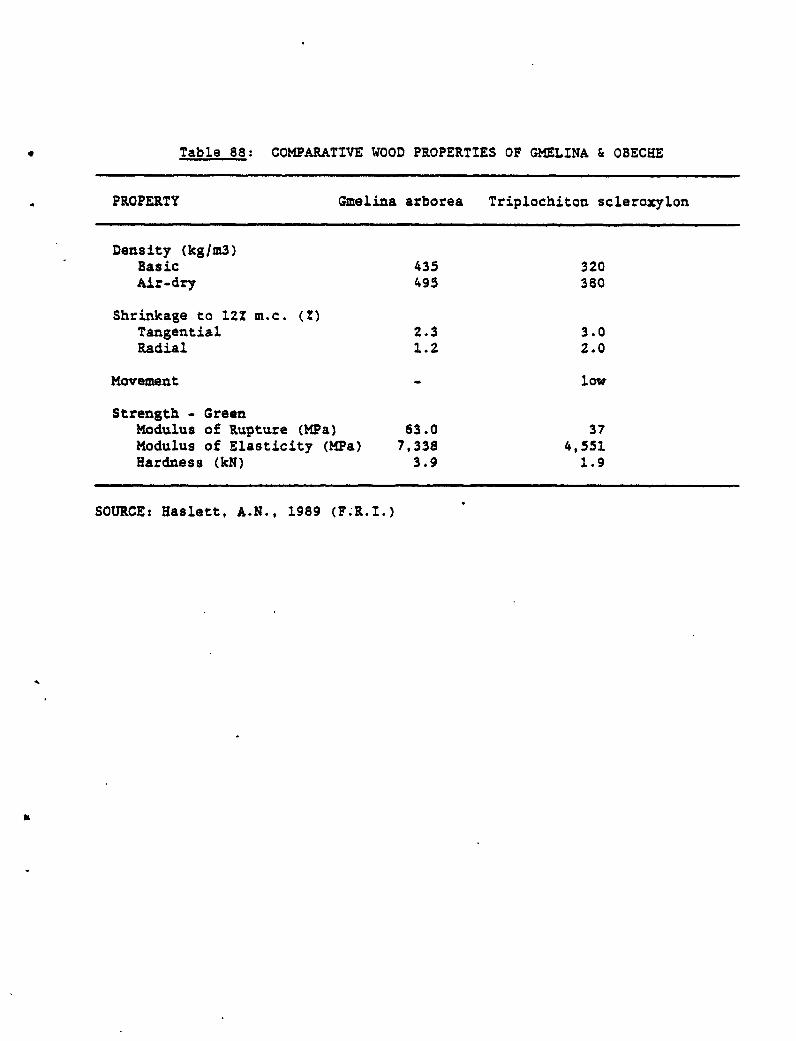
Table 88. COMPARATIVE WOOD PROPERTIES OF GMELINA & OBECHE
4 PROPERTY Gmelina arborea Triplochiton scleroxylon
Density (kgJm3)Basic 435 320Air-dry 495 380
Shrinkage to 122 m.c. (Z)Tangential 2.3 3.0Radial 1.2 2.0
Movement - low
Strength - GreenModulus of Rupture (MPa) 63.0 37Modulus of Elasticity (MPa) 7,338 4,551Hardness (kN) 3.9 1.9
SOURCE: Haslett, A.N., 1989 (F.R.I.)

Table 89: INDONESIAN SAWN TIMBER EXPORTS TO JAPAN BY SPECIES, 1987
Unit f.o.b.Species Volume-(m3) value USS/m3 Japan's Share Z
Teak 1,087 468 3Agathis 80,734 332 95Other Conifers 909 204 16Ramin 11,395 285 5Matoa group 216 257 80Meranti 160,511 245 23Kapur 5,888 209 16Keruing 52,192 167 32Pulai group 26,659 131 86Others 250,275 195 28
Source: Biro Pusat Statistik from Customs Statistics

Table 90: TROPICAL SAWN TIMBER WMPORTS BY AUSTRALIA 1987-88
Species Group Main Exporter Annualised Volume Unit c.i.f. Valuem3 (US$1m3)
Rough-Sawn:Kapur lKe ruing /
Merbau Malaysia 8,753 196Meranti Malaysia 35,034 250Nyatoh Malaysia 1,761 276Ramin Singapore 1,237 660
Malaysia 341 417Indonesia 633 543
Other Hardwoods 11,282 294
Dressed:Meranti Malaysia 11,954 562Other Hardwoods Malaysia 4,049 366
Source: ABARE. 1989
IL

Table 91: U.S.S.R. FORESTS PRODUCTS TRADE WITH EAST ASIA 1983
Commodity JAPAN CHINA VIETNAM N. KOREA MONGOLIA
Softwood Logs:(mill. m3)
Red/Korean Pine 1.2Spruce/fir 2.1Larch 2.0Mixed Sftwd Pulp/L 0.6Mixed Hdwd Pulp/L 0.5
Total Logs 6.4 0.86
Woodchips Sftwd. 0.146(mill. t) Hdwd. 0.025
Sawn Timber:Pine 0.009Spruce/Fir 0.079Larch 0.041
Total Sawn/timber 0.129 0.02
Paper ('000 t ) - 10.7 5.2 9.5
Source: Fenton & Maplesden (1986). Originals Soviet and Japanese.
;p
. .~~~~~~~~~~~

l
Table 92: TYPICAL PRICE RELATIVITIES FOR JAPANESE LOGS AND SAWNTIMBER IMPORTS, 1983
LOGS SAWN TIMBER CEIPSHemlock Pine Larch Hemlock SpruceIFir USSR USA NZU.S.A. USSR NZ USSR CANADA U.S.S.R.
100 78 67 47 133 88 86 100 89
N.B. For logs and savw timber, U.S. Hemlock Logs - 100 (Actual pricec.i.f. 25.800 yenlm3, note index for Douglas Fir logs = 88); forwoodchips U.S. - 100 (Actual price 12,300 yen/tonne).
Source: Fenton (1988)
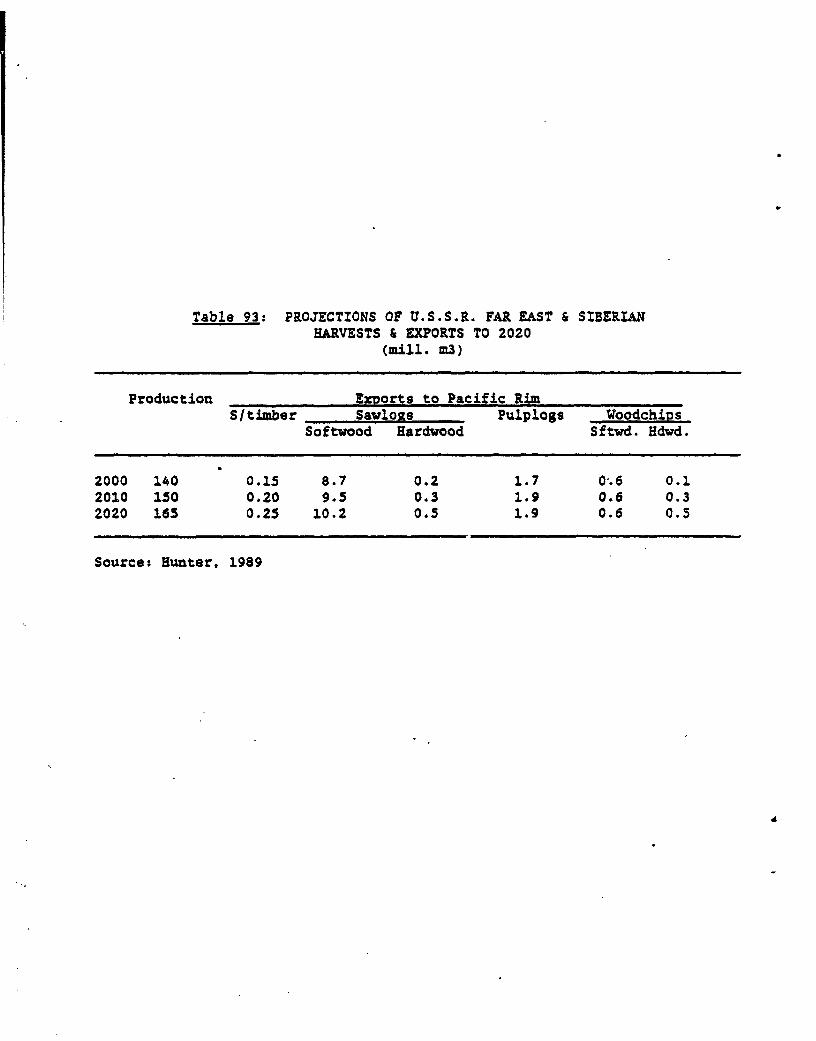
Table 93: PROJECTIONS OF US.SS.SR. FAR EAST & SIBERIANHARVESTS & EXPORTS TO 2020
(mill. m3)
Production Ex=orts to Pacific RimS/timber Sawlous Pulplogs WoodchiDs
softwood Hardwood Sftvd. Hdvd.
2000 140 0.15 8.7 0.2 1.7 0.6 0.12010 150 0.20 9.5 0.3 1.9 0.6 0.32020 165 0.25 10.2 0.5 1.9 0.6 0.5
Source: Hunter, 1989

Table 94: BRITLSH COLUMBIA PRODUCTION & EXPORTS 1986(mill. m3 lumber; mill. t others)
Destination: U.S.A. Domestic Japan Other CountriesProduction
Lumber:17.37* 9.60 2.17 2.33*
Pulp:0.88 0.27 1.00 1.851
Newsprint1.02 0.19 0.17 0.13
Other Paper0.32 0.43 0.08 0.34
N.B. Sources can differ sharply, as with lumber and pulp. This may bepartly explained by re-manufacturing and export of further processedproducts not re-classified by FAO. So (* & |) totals may not add due todifferences in production and shipments as defined by StatisticsCanada. The change to "Province of Origin' classification in 1984 hasbeen problematic, as many exporters were unable to report in thismanner.
Source: Statistics Canada, FAO 1986.

Table 95: SELECTED PRICE INDICES FOR CANADIAN FOREST PRODUCTS(1981 = 100)
Year Softwood S/Timber DF Plywood Sulphate Pulp Newsprint Paper/Hemlock W.R. Cedar P/Board
1979 125.4 n.a. 90.2 77.7 78.2 73.51982 99.0 105.3 90.3 93.6 104.7 101.91987 137.4 130.9 107.9 122.4 129.2 130.7
Source: Statistics Canada.

Table 96: U.S. PRODUCTION UNDER ALTERt4ATIVE STRATEGIES 1980 AND 2000
Activity, Product, Region Status Quo End Product StumpagePrice Stabilization
1980 2000 1980 2000 1980 2000
Production:Lumber (bill. bd. ft.)PNW 10.5 8.4 11.4 10.8 11.3 10.7Western Pine 8.5 9.4 8.9 17.6 8.6 16.3Southern Pine 7.3 14.7 6.5 6.8 6.7 7.8
Plywood (bill. ft.2)West -11.1 1Z.7 13.1 27.8 12.6 25.9Southern 8.6 14.3 8.5 13.1 8.5 13.3
Source: Adams, Haynes, & Darr, 1977
Table 97: PNW HARDWOOD RESOURCE ATTRIBUTES ca. 1985
Western Oregon Washington Total
Areas Z . 53 47 l.mill.ha.Private 66 83 74Public 34 17 - 26Species: Red alder 49 85 66
Bigleaf Maple 8 8 8Others 43 7 26
Growing Stock 49 51 338.5 mill. m3Net Annual Increment 43 57 11.5 mill. m3Harvest (industrial) 6.5 mill. m3 2.3 est.
Source: Buhler & Briggs, 1988

Table 98: STUMPAGE TRENDS OF MAJOR JAPANESE SPECIES(yen/m3)
Pine Sugi Hinoki(Pinus densiflora) (Cryptomeria japonica) (Chymaecyparis obtusa)
1980 11,200 22,700 42,9001985 7,900 15,200 31,000
N.B. These stumpages are associated with land prices of about860,000-900,000 yen/ha.
Source: Fenton (1988)

Table 99: FUTURE FOREST AREAS & GROWING STOCK(1986 Plan)
1995 2005 2015 Final*
Areas (mill. ha.):Plantation:Established 10.65 10.82 10.62 10.43Regenerating 0.19 0.53 0.88 1.04
(1980 Plan) 12.09 12.38 12.38 12.39
Natural ForestUnstocked: 0.96 1.73 2.49 3.20Productive: 12.74 11.47 10.56 9.85
(1980 Plan). 11.99 11.71 11.61 11.61
Non-Forest 0.80 0.80 0.80 0.80
Total 25.34 25.35 2S.S5 25.35
Volumes (mill.m3)3,232 3,663 3,810 3,900
(1980 Plan) 2,890 3,176 3,298 3,308
Average Stocking(m3lha.) 132 149 155 159
Source: Japanese Forestry Agency, 1986 & 1980.
N.B. 1980 Plan figures are writer's linear interpolations.*: Indicates ultimate "steady state"; note constancy of total area.

Table 100: INDIGENOUS LOG PRODUCTION FOR SAWMILLS & CHIPHILLS BYSPECIES, 1985
(mill .Zm3)
Softwoods Hardwoods TotalsPine Sugi Hnki AbTs Larx Hksf Othr Oaks Bech Othr Sfwd Hdwd Both
Saw/l 2.02 7.51 3.20 0.28 1.08 1.72 0.60 0.42 0.55 1.46 16.39 2.42 18.81Chp/l 0.99 0.16 - 0.06 0.51 0.19 0.06 0.20 0.20 8.56 01.97 8.95 10.93
Total 3.01 7.67 3.20 0.34 1.59 1.90 0.66 0.61 0.75 10.0 18.37 11.4 29.74
Totals may not add exactly due to rounding.
Abbreviations: Hnki - Hinoki; AbTs - Honshu Abies/Tsuga spp.; Larx -Larch; Hksf - Hokkaido Abies/Picea; Bech - Beech
N.B. Another 6.6 mill. m3 of chips are produced from sawmill andplymill residues, some of which is indigenous, so part of the first rowin Table 120 is destined for the second row.
Sourcez White Paper on Timber Supply 1986
Table 101: DOMESTIC HARVEST PROJECTION, SOUTH KOREA 1978-2010('000 m3/annum)
1978 1990 2000 2010
Poplar 70 1,450 4,416 4,500Other Species d1,200 1.500 2,000 2,400Total Domestic 1,270 2,950 6,416 6,900Imports 9,409 8,000 15,000 23,000
Source: Office of Forestry 1980; FAO 1988.

Table 102: DEMAND & SUPPLY OF TIMBER SOUTH KOREA, 1980-86(mill. m3)
1980 1983 1986
Total Demand 7.75 8.30 7.97
Domestic Usage:Construction/General 4.72 6.17Pulp furnish 0.55 0.53Pit-props 0.52 0.64
Exports:Plywood 1.75 2.50? 0.20Other wood 0.21 0.19
Total Supply 7.75 8.30 7.97
Domestic Removals 1.01 1.10 1.16Imports 6.14 6.52 6.09Recycled (Waste Paper) 0.60 0.68 0.72e
Source: Office of Forestry 1986; FAO 1988
a~~~~~~~~~~~~~~~~~~~~

Table 103: FOREST RESOURCES OF THE PEOPLE'S REPUBLIC OF CHINA
AREA '000 ha. CNCS I Land Area MOF, 1985 2 Land GS GS/ha.
(mill.m3)Timber Forests 98,000 10.1 80.630 8.4 6,881.9 85Protection 7,850 0.8 10,000 1.0 883.7 88Plantations 8,520 0.9 11,280 1.2 n.a.Bamboo 3,150 0.3 3,200 0.3 n.a.Fuelwood 3,670 0.4 3,690 0.4 69.6 19Special Use 670 n.s. 1,300 0.1 142.2 110
TOTAL 121,860 12.7 110,100 11.5 7,978.4
Volume by Forest Type (mill. m3):CNCS, 1976 MOF, 1985
Standing Volume Volume/ha.
Primary 7,125 189Secondary 2,185 39Man-made 190 7
Total 9,500Shelter 883.7 88Timber 6,881.9 85Fuelwood 69.6 19Special Use 143.2 110
Total 7,978.4
N.B. CNCS is "Chugoku Nogyo Chiri Soront, a Japanese survey of 1976.MOF is the Ministry of Forestry. "Plantations" includes only thecommercially harvestable area.

Table 104: AREAS OF MAN-MADE FORESTS IN CHINA 1957-1985('000 ha.)
Timber Forests Economic Crops Shelter Other Total
1957 1,733 1,350 993 279 4,3551975 3,651 532 428 363 4,9741985 (P) 4,000 500 1,000 500 6,000
Source: MOF. Rotations range from SO years e.g. Fraxinus mandshurica inHeilongjiang (m.a.i. 4m3/ha./ann) to 20 years e.g. Euc. citriodora(m.a.i. 15 m3fha./ann.) in south Guangdong.
Table 105: TAIWANESE PRODUCTION & IMPORTS('000 m3)
1973 1981 1988
Production:Sawlogs (softwoods): 647.6 331.8 141.5Grade 1 261.9 142.9 50.3Grade 2 385.7 188.8 91.2
(hardwoods): 460.0 197.3 111.8Pulplogs n.a. 382.1 619.5
Imports:Sawlogs: 3,860.4 5,205.9 4,202.4Sawn Timber: 8.7 359.6 995.3Pulpwood: 46.4 1,163.5 2,109.2
Source: J. Keating (pers. comm.). Primary sources are TaiwanDepartment of Forestry; Forestry Bureau; ROC ForestProducts Association; and perscomms. T. Liao (Council ofAgriculture) and C. Yu (Hua Pulp Corp.)
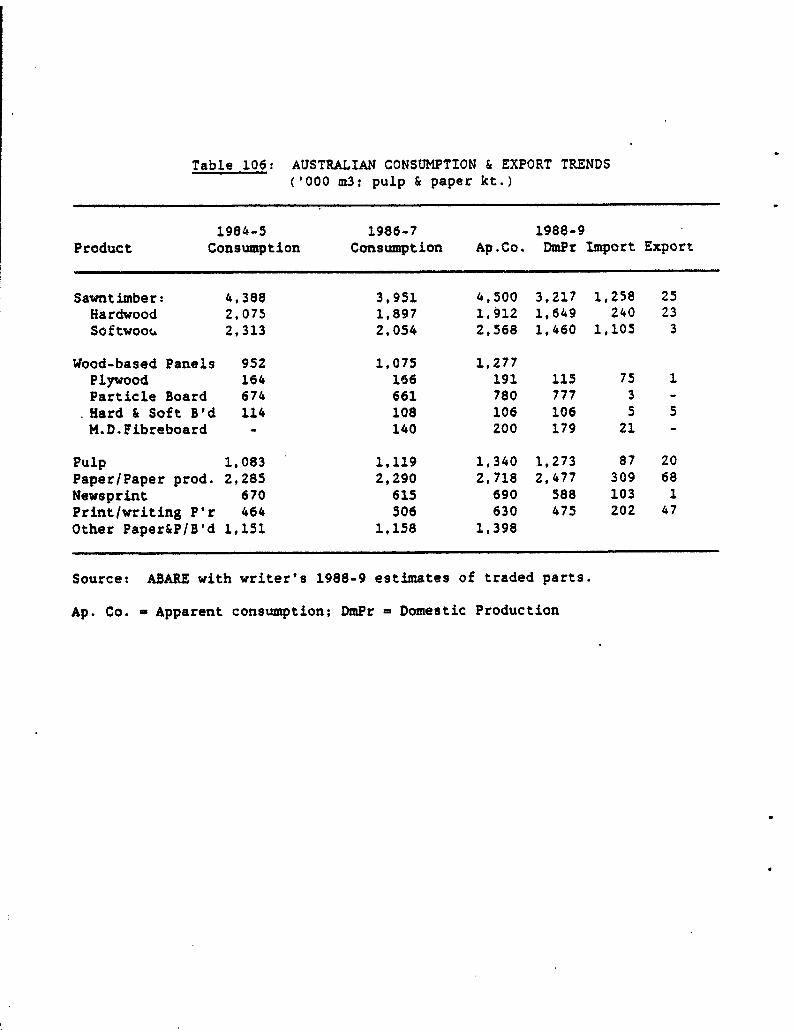
Table 106: AUSTRALIAN CONSUMPTION & EXPORT TRENDS('000 m3; pulp & paper kt.)
1984-5 1986-7 1988-9Product Consumption Consumption Ap.Co. DmPr Import Export
Sawntimber: 4,388 3,951 4,500 3,217 1,258 25Hardwood 2,075 1,897 1,912 1,649 240 23Softwoou 2,313 2,054 2,568 1,460 1,105 3
Wood-based Panels 952 1,075 1,277Plywood 164 166 191 115 75 1Particle Board 674 661 780 777 3 -Hard & Soft B'd 114 108 106 106 5 5M.D.Fibreboard - 140 200 179 21 -
Pulp 1,083 1.119 1,340 1,273 87 20Paper/Paper prod. 2,285 2,290 2,718 2,477 309 68Newsprint 670 615 690 588 103 1Print/writing P'r 464 506 630 475 202 47Other Paper&P/B'd 1,151 1,158 1,398
Source: ABARE with writer's 1988-9 estimates of traded parts.
Ap. Co. - Apparent consumption; DmPr = Domestic Production

Table 107: AUSTRALIAN FOREST RESOURCES 1987
('000 ha.)
Type NSW VIC QLD WA SA TAS NT ACT AUST.
Forest:Public 9,754 4,652 10,364 2,158 - 2,179 839 51 29,957
M/U 3,221 2,688 3,182 1,869 - 1,371 - - 12,331
OTH 4,551 447 6,412 51 - 484 524 9 12,478
NPK 1,982 1,517 710 238 - 324 315 42 5,128
Private 5,205 605 1.492 507 - 668 2,427 - 10,904
Total 14,959 5,257 11,796 2,665 - 2,847 3,266 51 40,841
Woodland 3,300 3,010 28,200 20,530 900 .1,051 7,000 5 63,996
Plantation:PublicConifer 166 100 158 63 65 38 - 14 605
Hardwood - 8 2 8 1 4 - - 23
PrivateConifer 61 97 25 14 24 27 4 - 253
Hardwood 3 6 - 1 - 14 - - 24
Total 230 210 185 87 91 83 4 14 905
M/U = Multiple Use including wood productionOTH = Crown or other vacant or leased land where wood production occurs
under Government control, but is not reserved for that purpose
NPK - National Parks and other areas with no wood production.
Source: Australian Forest Resources, 1987

Table 108: SELECTED AUSTRALIAN AGENCIES' WOOD AVAILABILITY FORECASTS(Mill. m3)
1990 2000 2010 2020S/Logs P/logs S/Logs P/logs S/Logs P/logs S/Logs P/logsNtv Pln Ntv Pln Ntv Pln Ntv PIn Ntv Pln Ntv Pln Ntv Pln Ntv Pln
FWD 5.4 4.8 8.6 4.1 4.6 9.2 8.4 3.7 4.4 13.2 8.3 5.1 - - - -
FD* 5.4 4.8 8.6 4.8 4.6 9.1 8.4 5.8 4.4 11.3 8.3 6.1 - - - -
BAE - 4.8 - - - 9.5 - - - 13.5 - - - 9.5 - -AFC 4.1 4.1 6.2 4.6 3.5 7.5 6.2 5.2 3.4 10.2 6.1 5.4 3.2 10.6 6.1 5.7S&M - 4.7 - 4.5 - 6.8 - 4.5 - 14.4 - 4.2 - 17.7 - 4.4SM* - 5.1 - 7.3 - 9.6 - 9.3 - 12.8 - 10.7 - 12.5 - 10.6TIS - 4.4 - - - 7.8 - - - 10.5 - - - 11.0 - -ACF - 3.9 - 4.9 - 8.5 - 5.5 - 13.5 - 5.1 - 14.3 - 4.7HYB 3.6 3.5 5.5 4.9 3.0 7.5 4.5 5.5 2.3 13.7 1.6 5.1 2.0 15.7 1.2 4.7
Source: Cameron.& Penna (1988); OHYB* = Hunter, 1989
Australian Conservation Foundation.
Table 109: TRADE-OFF BETWEEN HARVEST REVENUE & VALUE OF UNHARVESTED GROWTH(Profit-seeking Behavior of New Zealand Forestry Corporation)
Growth Harvested Growth Unharvested Growth
1987-88(mill.m3) 8.7 5.3 3.4Value(mill. US$) 232.8 74.51986-87(mill.m3) Not disclosed 4.5 4.2Value(mill. USS) 208.4 91.4
Sources 1987-88 Annual Reports of former N.Z. Forest Service; 1988-89 AnnualReport of N.Z. Forestry Corporation

Table 110: CURRENT STATE OF THE NEW ZEALAND EXOTIC FOREST ESTATE
Attribute 04/01/87 04/01188 Z change
Net stocked area (ha.) 1,154.226 1,214,303 + 5Growing Stock ('000 m3(total stem vol.inside bk) 208,772 Z10,925 + IAverage GS/ha. 181 174 - 4Current Ann.Incr.('000m3) 21,662 24,386 +13Average c.a.i./ha. 18.77 20.08 + 7Average c.a.i. Z 10.38 11.56 + 1Estimated RoundwoodRemovals ('000 m3) 8,600 7,700 -10Weighted average age 13 13 0Z radiata pine (area) 89 88 - 12 Int. Tend. - Prodn Thin 42 22 -48t Int. Tend + Prodn Thin 16 21 +31
Z Min. Tend. - Prodn Thin 35 34 v 3Z Min. Tend + Prodn Thin 7 23 +229
Age Class: 0 - 20 (ha.) 969,420 1,014,554 - 521 - 40 136,007 154,159 +13>40 48,799 45,590 - 7
Sourcet National Exotic Forest Description, 1989 (HOF)

Table 111: NEW ZEALAND EXOTIC FOREST YIELD FORECASTS TO 2020(estimated average annual recoverable yield - '000 m3)
C. Fell Thinning Total VolumeLustrum P1/P2 S1/S2 L1/L2 S31L3 R Yield Yield (1986) (1979)
1986-90 b44 3,024 1,260 1,860 2,229 8,817 1,556 10,373 9,4001991-95 884 3,158 1,360 2,451 1,711 9,564 1,821 11,385 12,6001995-00 1,253 3,855 1,751 3,412 2,303 12,754 1,626 14,200 17,7002001-05 2,402 5,466 3,388 4,586 3,162 19,004 1,303 20,307 24,3002006-10 3,287 6,300 4,507 4,887 3,50Z 22,483 1,187 23,670 33,5002011-15 3,880 6,470 5,515 4,420 3,331 23,616 1,204 24,82C 36,500p016-20 3,939 6,922 6,048 4,120 3,209 24,238 1,235 25,473 -
N.B. ASSUMES NO FURTHER AFFORESTATION
Log grade coding:
P1I/P2: Pruned logs, tinimum s.e.d. 30 cm.S1/52: Unpruned logs, a " , maximum largest single branch
diameter of 6 cm.LllL2: Unpruned logs, as S1IS2, but max. branch diameter 14 cm.S3/S3: Pruned or unpruned logs, min. s.e.d. 20 cm. and max s.e.d.29.9cm. Largest single branch not more than 14 cm. in diameterR: Pruned or unpruned logs with a minimum s.e.d. 6f 10 cm. with no branch
size restrictions. Roughly approximates pulplogs, but includes S4 and L4.
Source: Burrows, Levack, and Novis (NEFD), 1986; Levack, 1979

Table 112: PRODUCTION, EXPORT & IMPORTS OF FOREST PRODUCTS, NEW ZEALAND 1988('000 m3 (woodchips '000 BDU)(woodpulp '000 tonnes]; NZ$ mill.)
Roundwood Production Exports Imports ApparentRemovals Vol. Val. Vol. Val. Consumption
SawlogsExotic: 3,894 1,117 102.1 12 8.5Indigenous: 158
Woodchips 264 222 31.3Sawntimber: 1,487Exotic 1,845 456 141.9Indigenous 79 5 2.7Hardwood 11 7.9Softwood 13 9.7
Woodpulp: 3,195 1,249Chemical 237 173.1 13 12.8Mechanical 335 156.4 - -Newsprint 295 140 104.5 10 10.6Other Paper/P'b'rd 423 87 93.7 76 190.8Fibreboard, mainly MDF 274 190 84.0 1 0.4Plywood 172 61 10 6.9 3 2.9Veneer 77 2 2.6 1 2.6Particleb'rd 171 43 14.7 2 0.8Manufactured paper 35.0 61.3Wood furniture & parts 23.8Misc. 72.4 19.2
Source: Ministry of Forestry, 1989; INFOS database, Dep't of Statistics

Table 113: CHILEAN EXOTIC FOREST YIELDS(*000 m3)
1990 2000 2010 2020
Sawlogs 7.5 10.4 13.2 16.1Pulplogs 4.9 8.4 10.7 12.6Total 12.4 18.8 23.9 28.7
Source: Adapted by Hunter from INFOR (1987)
Table 114: MAJOR FOREST TYPES & ADMINISTRATIVE CATEGORIES, MALAYSIA(mill. ha.)
Forest Dipt'p Swamp Mang've P.F.E. Nat'l State-Area Prod. Prot. Park land
Peninsular 6.19 5.62 0.46 0.11 2.85 1.90 0.59 0.94Sabah 4.49 3.98 0.19 0.32 3.00 0.35 0.49 0.93Sarawak 9.42 7.78. 1.47 0.17 3.24 1.40 0.25 4.58Malaysia 20.10 17.38 2.12 0.60 9.09 3.65 1.33 6.45
Source: Ministry of Primary Indtstries (1988)

Table 115: ESTIMATED LOG SUPPLY, PENINSULAR MALAYSIA. 1990-2020(mill. m3/annum)
Natural Forests Compensatory Rubberwood TotalP.F.E. State-Lands Plantations
1990 2.83 3.40 1.00 7.231995 3.09 1.33 0.50 1.80 6.722000 3.37 - 1.05 1.20 5.622005 3.69 - 2.09 1.00 6.782010 4.02 - 2.60 1.00 7.622015 4.40 - 2.60 1.00 8.002020 4.80 - 2.60 1.00 8.40
Sources: (Writer's adaptation of MPI, FRIM, MTIB etc.)
Table 116: PRODUCTION & EXPORTS OF FOREST PRODUCTS, SARAWAK, 1987(mill. m3 & M$/m3)
Production Export Volumes f.o.b.Hill Swamp, Me/Ka/Ke Ramin All Main Spp* AllMKK Rest Rmn Rest
Logs 8.1 2.1 0.5 2.8 7.5 - 12.6 168 122SavnTimber 0.418 0.007 0.154 0.176 821 765Plywood& Lamboard 0.38 0.18 977**Mouldings Total& Dowels MS45mill.Woodchips 0.53 tonnes 0.53 70
* Main spp. means Meranti/Kapur/Keruing for logs, ramin for savmwood,and mangrove (to Taiwan) for chips.
**f.o.b. value for laminated boards, which are the major market.In 1987 USS - 2.50-2.55 Ringgit (M$)MKK and Me/Ka/Ke = Meranti/Kapur/KeruingN.B. About 7-9,000 m3 of sawn timber imported annually from Indonesia.
Source: Jabatan Hutan Sarawak

Tab'le 117: FUTURE HARVESTS OF SARAWAK(mill. m3)
Removals: Swamp Hill Plantation Log Exports* S/Timber & Re-man
1990 9.1 2.9 - 11.0 0.51995 6.5 2.1 - 7.1 0.72000 5.0 1.7 - 3.3 1.62010 4.8 1.6 0.5 2.0 2.12020 4.6 1.4 1.5 0.3 2.9
* Following the log export ban, these would almost entirely be exported toPeninsular Malaysia.
Source: Hunter, 1989
Table 118: PROJECTED PRODUCTION FROM SABAH NATURAL FORESTS(area ha./annum; production m3)
Year Commercial Reserve State Lands Total Production
1990 89,100 13,600 102,700 4,985,5001995 33,200 5,Q00 38,200. 1,669,0002000 23,600 5,000 28,600 1,237,0O0
Source: Ping & Awang, 1988

Table 119: PLANTATION AREAS IN SABAH AS OF 12/31/87
.
Owmer Species Area (ha.)
Sabah ForestDevelopment Authority(SAPODA) Acacia mangium 7,600
Sabah SoftwoodsSdn. Bhd. (SSSB) Eucalyptus deglupta 9,322
Paraserianthes falcataria 6,205Gmelina arborea 5,910Pinus caribaea 1,017A. mangium 2,142Others 937Research Plots 258
Sabah Forest Industries A. mangium 4,700
35,091
Sources: Golokin & Cassels, 1987; Klinajil, 1988; Miller.
Table 120: LONG-TERM EXPORT TRENDS IN SABAH(mill. m3; M$/m3)
Logs Savn Timber Veneer PlywoodVolume UnitValue Volume UnitValue Volume UnitValue Volume UnitValue
1979 9.78 210 0.80 337 0.02 630 0.01 8781983 9.46 179 0.94 373 0.15 345 0.02 8531988 8.25 262 1.03 503 0.14 545 0.13 825
Source: Timber Association of Sabah, 1989

Table 121: INDONESIAN FOREST PRODUCTS EXPORTS 1980-8,(A) - Volume/Weight mill. m3ltonnes
Logs Total Sawn Timber Total TotalMRTI RAMN OTHRS Logs MRTI RAMN TEAK OTHRS SIT Plywood Rattan RWE
1980 8.46 .002 6.13 14.58 N.a. N.a. N.a. N.a. 1.203 0.245 N.a. 17.331984 0.99 - 0.58 1.57 .739 .675 .035 .785 2.198 3.046 0.091 12.581987 - - 1.27 .298 .040 1.22 2.833 6.044 0.716 19.06
(B) - Unit Value US$Sm3 or Itonne
Logs Total Sawn Timber Total TotalMRTI RAHN OTHRS Logs MRTI RAMN TEAK OTHRS SIT Plywood Rattan RWE
1980 129 80 107 N.a..N.a. N.a. N.a. 215 227 N.a. 1101984 96 - 96 145 173 597 139 216 1,029 891987 - - - - 195 288 756 223 327 1,583 137
MRTI = Meranti; RAMN - Ramin.
Source: Direktorat Tertib Peredaran Hasil Hutan, 1988 (Adapted)
Table 122: EXPORT OF INDONESIAN PLYWOOD BY MARKET 1988('000 m3; US$ mill. c.&.f.)
Market Raw Plywood Block Board Veneer Special Item New Product TotalVol. Val. Vol. Val. Vol. Val. Vol. Val. Vol. Val. Vol. Val
N.America 864 318.0 10.9 3.4 12.8 4.0 78.2 35.4 32.0 16.4 998 377China 903 336.5 8.6 2.2 - - - - 0.0 0.2 912 339Japan 1,190 378 35.7 9.2 29.0 7.5 772 185.1 0.3 0.9 2,029 581Rest 2,271 777 332.5 83.1 3.2 1.0 66 25 255 118 2,926 1,003Total 5,228 1,809 387.7 97.9 45 12.5 917 246 288 135 6,865 2,300
Source: APKINDO, 1989

Table 123: PROJECTICNS OF INDONESIAN HARVESTS TO 2020(mill. m3)
Natural Forests Plantations Rubberwood Total
1990 34.8 2.0 0.2 37* 3.995 42.9* 5.7 0.4 492000 44.0* 13.3 0.7 582010 43.4* 24.6 1.0 692020 44.5* 29.8 1.7 76
Products: Plywood S/Timber Rest (RWE) (RWE)Total
1990 8.6 8.1 0.4 371995 11.0 10.5 1.8 492000 12.8 12.5 2.5 582010 14.1 15.8 3.6 692020 15.0 17.5 5.0 76
* The conversion forest will have to sustain much of this if REPELITAannual allowable cuts of around 31 mill. m3 are enforced. It simplycannot do so over this period of time.
Table 124: NATIONAL LAND-USE PATTERNS, PHILIPPINES, 1988
Forest . Non-ForestType: Area (ha.) Type: Area (ha.,
Virgin Dipterocarp 98e,300 Fishponds 205,000Logged Dipterocarp 3,412,800 Crops/plantations 19,873,000Pine, Closed Crown 129,610 Barren Areas. 81,400Pine, Open Crowns 109,230 Built-up Areas 131,400Mangrove 139,100 Lakes & Marshes 308,900Montane moss forest 1,137,400 Grassland 1,812.900Submarginal 544,200 Unclassified 546,200
Total Forest Area 8,985,700
N.B. Non-forest areas total nearly 2 mill. ha. more than residual offorest areas i.e. two inventories are not compatible.
Source: Forest Area GTZ/DENR NFRI; non-forest SPOT.

Table 125: ESTIMATED GROWING STOCK, PHILIPPINES 1988(mill. m3)
DipterocarpsEnd-Usel Old Growth Logged Over Pine Totals
>m15 >55 >=15 >-55 .15 >-SS >15 >i55
Common Hardwood 62.9 40.4 102.8 38.4 - - 165.7 78.8Construction &Furniture Woods 46.0 15.2 91.8 20.5 - - 137.8 35.7Softwoods 2.0 1.3 3.8 1.1 18.8 6.0 24.6 8.4Others 14.3 2.5 33.0 5.2 - - 47.3 7.7
Totals 125.2 59.4 231.4 65.2 18.8 6.0 375.4 130.6
>-15: Including all stems over 15cm. d.b.h.o.b.>-55- S: it a n 55
Source: Adapted from DNER pro rata from GTZ/DNER inventory.

Table 126: FOREST PRODUCTS EXPORTS, PHILIPPINES, 1987
Quantity '000 m3; waste:kg.; furniture:unitsUnit Value US$/m3/unit/kg. f.o.b.
Saw/V'logs Pulpw'd S/timber Plyw'd Ven'r Waste Frntre Total*
Quantity 6 199 645 243 64 854 4290 2,920UnitValue 53 43 239 280 231 570 24 381.28
Source: Forest Management Bureau & National Statistics Office:
(a) The total for "quantity" is the writer's estimate of RWE used =approx. 2.929 million m3, and includes blockboard, charcoal, pole,non-furniture wood manufactures etc. It accounts for sawmillingwaste transfers.
(b) The total for "Unit Value' is actually an estimate of the totalvalue of forest products exports, about $381 million (excludingpulp and paper because of the non-wood component), which makes thewhole sector the third largest earner after garments and.electronic goods. However, normally it is ranked 7th, as just"lumber", after coconut oil, copper goods, shrimps etc. Forestproducts imports, for comparison, cost $70.3 million in 1987; theyare largely papermill furnish, including waste paper, and paper.
(c) Furniture exports comprise 28Z of total export value, includingrattan.
(d) Only in 1987 did the 10g export restraint finally eliminate thespecially licensed 300 - 800,000 m3 exports which occurredannually since 1980. The pulpwood is falcata.
(e) The U.K. is the main importer of red laua- Japan of white.Nominal export prices have risen for all main products since 1970.Real ones, e3 :ept logs, have not.

Table 127: FILIPINO WOOD FLOWS TO 2020('OOOm3)
Saw/v'rlOg8s Pulplogs Lumber/Raw ply Re-man. TotalDmstic Imprts Export Export Import Export RWE
1990 2,500 800 1,000 150/210 110/ 600 6,3002000 3,000 1000 1,500 201160 850 860 5,8002010 9,500 - 800 120/100 500 1,400 12.4002020 12,500 _ - 520/ 60 - 2,800 12.500
Source: Hunzer, 1989
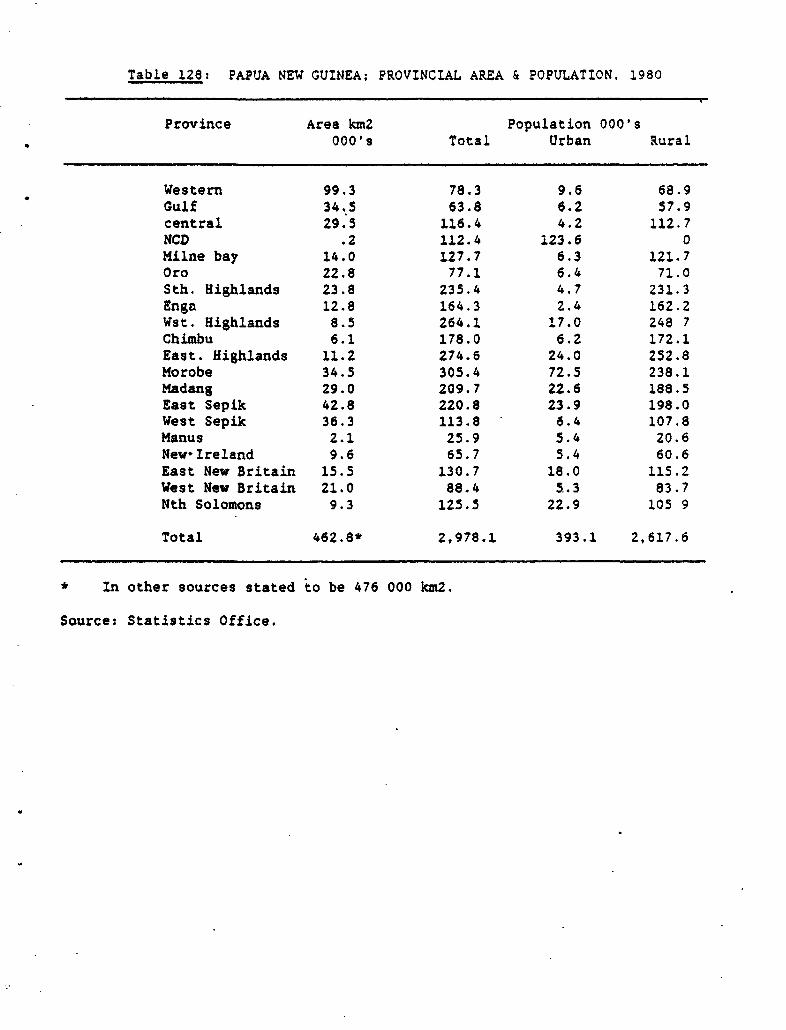
Table 128: PAPUA NEW GUINEA; PROVINCIAL AREA & POPULATION. 1980
Province Area km2 Population 000's000's Total Urban Rural
Western 99.3 78.3 9.6 68.9Gulf 34.5 63.8 6.2 57.9central 29. 116.4 4.2 112.7NCD .2 112.4 123.6 0Milne bay 14.0 127.7 6.3 121.7Oro 22.8 77.1 6.4 71.0Sth. Highlands 23.8 235.4 4.7 231.3Enga 12.8 164.3 2.4 162.2Wst. Highlands 8.5 264.1 17.0 248 7Chimbu 6.1 178.0 6.2 172.1East. Highlands 11.2 274.6 24.0 252.8Morobe 34.5 305.4 72.5 238.1Madang 29.0 209.7 22.6 188.5East Sepik 42.8 220.8 23.9 198.0West Sepik 36.3 113.8 6.4 107.8Manus 2.1 25.9 5.4 20.6New-Ireland 9.6 65.7 5.4 60.6East New Britain 15.5 130.7 18.0 115.2West New Britain 21.0 88.4 5.3 83.7Nth Solomons 9.3 125.5 22.9 105 9
Total 462.8* 2,978.1 393.1 2,617.6
i In other sources stated to be 476 000 km2.
Source: Statistics Office.

Table 129: PNG; POPULATION PROJECTION BY PROVINCE
Province 1980 1990 1995 2000 2005 2010 2015 2020
increase
Western 78.3 1.7 92.7 100.9 109.7 119.4 129.9 141.3 153.7
Gulf 63.8 1.0 70.5 74.1 77.9 81.9 86.1 90.4 95.1
Central(l) 228.8 3.8 332.2 400.3 482.4 581.3 700.4 844.0 1,017.0Mline Bay 127.7 1.8 152.7 166.9 182.5 199.5 218.1 238.5 260.7Oro 77.1 2.0 94.0 103.8 114.6 126.5 139.7 154.2 170.2S. Highlands 235.4 1.8 281.4 307.6 336.3 367.7 402.0 439.5 480.5Enga 164.3 2.8 216.5 248.6 285.4 327.6 376.1 431.8 495.8W. Highlands 264.1 2.8 348.1 399.6 458.8 526.7 604.7 694.3 797.1Chimbu(2) 178.0 0.5 187.1 191.8 196.7 201.6 206.7 211.9 217.3E.Highlands 274.6 2.2 341.4 380.6 424.3 473.1 527.5 588.1 655.7Morobe 305.4 2.9 406.5 468.9 541.0 624.1 720.0 830.6 958.3Madang 209.7 2.4 265.8 299.3 337.0 379.4 427.2 480.9 541.5East Sepik 220.8 2.5 282.6 319.8 361.8 409.4 463.1 524.0 592.9West Sepik 113.8 1.0 125.8 132.2 138.9 146.0 153.5 161.3 169.5Manus 25.9 1.7 30.6 33.3 36.2 39.4 42.9 46.6 50.8New Ireland 65.7 2.0 80.0 88.4 97.6 107.7 118.9 131.3 145.0E. New Brit. 130.7 1.6 153.2 165.9 179.6 194.4 210.5 227.9 246.7W. New Brit.(3) 88.4 5.1 145.4 186.5. 239.1 306.6 393.2 504.2 646.6Nth Solomons(4) 125.5 4.0 152.7 185.8 226.0 275.0 334.6 407.0 495.2
Total 2,978.1 2.3 3,738.5 4,188.6 4,693.0 5,258.3 5,841.3 6,600.6 7,395.5
NOTES (1) The NCD population is included in the Central total; 491 of the 1980 provincial total is residentin Port Moresby.
(2) The low growth rate results from emigration. The province has a high population density andemigration is likely to continue at a high rate.
(3) The high growth rate resulted from the development of the oil palm Industry and the associatedsmallholder land settlement scheme. The future growth rate will be well below the historicalfigure, hence will be well below that shown.
(4) The high growth rate was largely caused by the development of mining activities and will not besustained.
Source: Derived from 1980 National Population Census, Nat. Stats. Office.
* t

.
Table 130: PNG; LAND OWNERSHIP BY PROVINCE
Province Land AreaTotal Alienated 2 of Area allocated to PNGFDkm2 km2 total km2 2 of 2
alienated planted
Western 108,000 19 .2 0 0 0Gulf 35,090 25 .7 0 0 0Central 30,200 408 13.5 10.15 2.5 2.08Milne bay 14,500 94 6.5 0.05 - 0Oro 22,200 112 5.1 0.32 - 0.05Sth Highlands 21.900 a .4 1.18 14.8 0.13Eastern Highlands 11,140 16 1.5 5.68 35.5 4.52Chimbu 6.560 2 .3 0.08 4.0 0.01West highlandscl 24,260 64 2.6 3.30 5.2 1.90East sepik 37.300 9 .2 0.42 4.7 0East sepik 44,260 39 .9 0.32 .8 0.12Madang 28,940 48 1.7 0.19 .4 1.45Morobe 34,900 107 3.1 15.97 14.9 10.88West New Britain 20,450 136 6.7 6.08 4.5 0.13East New Britain 14,980 126 8.4 20.13 16.0 2.11New Ireland 9,800 54 5.5 - - oManus 2,120 21 5.6 - - -North Solomons 9.560 41 4.3 0 0 _
Total 47 616 1 323 2.8 63.90 4.8 23.38
Source; Aland 1977 as qpoted in INA 1989, and PNGFD data. Total areas do not conform withother sources.

Table 131: PNG; NATT'RAL FOREST RESOURCE AREA('O(0 km2)
Prov!nce Total Total Allocated Proposed BalanceForest as of to be by
Resource 2/28/89 allocatedby 1992
Western 99.3 36.89 3.17 4.26 29.46Gulf 34.5 1 .69 2.40 7.25 10.Q4
C.entral 29.5 3.93 3.02 .26 .65Milne Bay 14.0 4.25 2.45 1.00 .80Oro 22.8 7.57 2.00 4.10 1.47Sth Highlands 23.8 1.16 .43 .61 .12
East Highlands 11.2 .86 .02 .02 .82
Chimbu 6.1 1.68 0 0 .95West Highlands 8.5 2.11 .06 1.10 1.68
Enga 12.8 1.54 .01 .01 1.48West Sepik 36.3 9.35 3.27 1.50 4.58East Sepik 42.8 9.98 .40 2.20 7.38Hadang 29.0 6.12. 1.15 2.21 2.76Morobe 34.5 7.50 1.07 2.23 4.20'West New Britain 21.0 20.36 7.28 2.96 10.12
East New Britain 15.5 6.21 2.61 3.01 .59New Ireland 9.*6 4.92 2.76 1.07 1.09Manus 2.1 1.40 .51 0 .89
Nth Solomons 9.3 2 5 1.16 .84 .85
Total 148.33 33.77 34.63
Source: PNGFD

Table 132k PNG; SPECIES COMPOSITION OF EXPORT LOGS
Species - Representation 2 Ave. fobUSS /m3
Group 1Anisoptera (Mersawa) 1.97 89.04Calophyllum 7.76 96.71Palaquium (Pencil Cedar) 3.80 123.56Intsia (Kwila) 2.18 148.52Pometia (Taun) 23.03 94.30other (3 species) 3.23 13S.81
sub total 41.97 100.85
Group ZABurcke'la 1.84 78.60Terminalia 4.93 80.00
sub total 6.78 79.62
Group 23Endospermum (Basswood) 2.22 68.62Canarium, red 3.12 66.05other (11) 4.58 62.18
sub total 9.52 64.84
Group 2CCeltis, light 2.85 53.81Dillenia 3.04 55.54Homalium (Malas) 6.12 56.62Octomeles (Erima) 3.55 56.99Pterocymoium (Amberoi) 3.50 56.07Syzygium (Water Gur,) 2.50 57.02other 1.00 56.86
sub total 22.56 56.62
Group 3other (80) 18.96 54.25
Total 100.00 77.03
Source: Forest Industries Council.

Table 133: PNG; EXPORT LOG GRADES BY SPECIES GROUP, 1988
Species Group Log Grade Representation ZSSP SPi SP2 SS1 SS2 SS3 Total
group 1 1.60 4.43 5.62 16.98 11.15 1.99 41.79group 2A 0.36 0.71 1.24 3.02 1.33 0.14 6.78group 2B 0.22 1.01 1.34 3.66 2.42 1.27 9.92group ZC 0.72 2.92 3.81 9.76 4.74 0.63 22.55group 3 0.66 1.87 2.32 8.05 5.18 0.87 18.96
Total 3.54 10.94 14.33 41.46 24.83 4.91 100.00
Source: Forest Industries Council.

Table 134: PNG; GOVERNMENT FOREST PLANTATION ESTATE(ha.)
Province Location* Arauc. Pines Teak Euc. Balsa Other Total
Western 0 0* Gulf 0 0
Central 3 2 2,075 1 3 2,081Milne Bay 0 0Oro 3 36 11 47S. Highlands 8 67 31 35 133Enga 4 58 46 4 108W. Highlands 1 2 29 1,691 71 1.793Chimbu 2 5 3 3 11E Highlands 6 33 4,224 64 199 4,520Morobe 1 E2] 8,263 2,286 25 10,574
2 2 212 10 32 1 55 312Madang I1] 1 1,4151 34 1,450East Sepik 2 2 11 43 67 123west Sepik 1 5* 5Manus 0 0New Ireland 0 0E.New Brit. 1 2 947 694 139 144 1,924
2 150 29 179W. New Brit. (1] 15 95 9 7 126N4th Solomons 1 1 1 1 3
Total 8,302 6,884 3,059 4,151 300 688 23,384
Notes: * some grouping of locations has been done where it is knownthat the resource would logically be processed at a single location.I Approximately 1408 ha.of Euc. plantings are recorded. This includes aplanting of 146 ha. in 1985, which is doubted by some PNGFD staff. Thisaddition could in fact have been due to private planting.
Source: PNGFD, Compendium of Statistics 1986.

Table 135: PNG; PRIVATE FOREST PLANTATIONS AS OF 12131185(ha.)
Province Location Aruac. Pinus Eu:. Teak Other Total
W. Highlands 3 2 1 3Chimbu 3 3 64 67E. Highlands 3 3 83 1 1 88Madang 1 3,650(1) 3,650E. New Britain 1 91 16 107W. New Britain 1 1,386 31 486 1,902
2 550(2) 550
Total 6 147 5,130 31 504 6,367
Notes: (1) the figure recorded in the Compendium of Statistics is 33ha. but this appears to have excluded the major private planting by thejoint venture company Gogol Reforestation Company P/L in which theGovernment participates.
(2) a long standing program at Ulamona appears to have beenomitted. It is believed the major, if not only species used isEuc. deglupta.
Source: *Compendium of Statistics 1986,0 *Annual Report Statistics 1987"
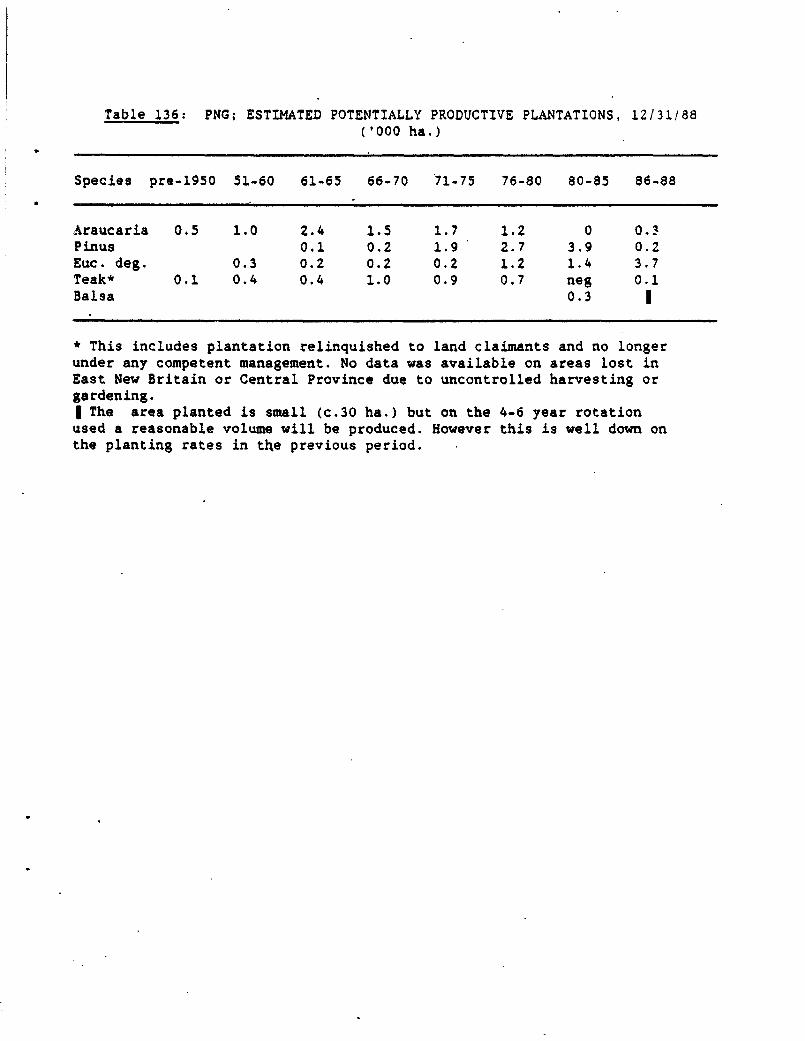
Table 136: PNG; ESTIMATED POTENTIALLY PRODUCTIVE PLANTATIONS, 12/31/88('000 ha.)
Species pre-1950 51-60 61-65 66-70 71-75 76-80 80-85 86-88
Araucaria 0.5 1.0 2.4 1.5 1.7 1.2 0 0.3Pinus 0.1 0.2 1.9 2.7 3.9 0.2Euc. deg. 0.3 0.2 0.2 0.2 1.2 1.4 3.7Teak* 0.1 0.4 0.4 1.0 0.9 0.7 neg 0.1Balsa 0.3 I
* This includes plantation relinquished to land claimants and no longerunder any competent management. No data was available on areas lost inEast New Britain or Central Province due to uncontrolled harvesting orgardening.I The area planted is small (c.30 ha.) but on the 4-6 year rotationused a reasonable volume will be produced. However this is well down onthe planting rates in the previous period.

Table 137: PNG; PLANTATION PROJECTED GROWTH & YIELD, PNGFD 1987 DATA
Species Rotation Age MAI m3lha. Thin.yield (m3) Final Crop
Araucaria 40 22 370 na(510) *
Pinus 25-35 16 150 na(250-410)Euc. spp. 16-20 25 250 na(150-25O)Teak 20 125 na( - )
* No final crop data was provided but using the MAI figures andthinning yield, the data in brackets was calculated for the indicatedrotations.
Source: B. Cuyno
Table 138: PNG; REVISED ROTATION & GROWTH RATES, 1989 ESTIMATE
Specites Yield m3/ha.
Rotation Age MAI m3/ha. Thin. Yield Final crop
Araucaria 20 13 .0 260Pinus 20 15 120 180Euc. deglupta (1) 10 Z0 0 200
(2) 16 25 150 250(3) 8 25 0 200
Teak 35 5* 80 170
(1).-Pulpwood crop, Madang.(2). Veneer/sawlog crop, West New Britain.(3). Pulpwood crop, East New Britain.* This is a figt-re for final crop only, thinnings are unlikely to besignificant except as a source of general purpose hardwood timber with.a high sapwood content.

Table 139: PNG; MAJOR PLANTATION LOG AVAILABILITY FORECASTS
period production per year, 000'm3Arauc. Pinus E. deglupta teak Misc.
pulp other* H/Wds.
90-95 61 55 65 40 20 1096-00 58 150 75 132 20 4001-05 64 116 420 132 neg 4006-10 65 194 520 230 neg 9011-15 91 94 620 230 60 9016-20 112 120 620 230 60 90
N.B. the numerous small .tands scattered throughout the country areignored in these figures, however they will be harvested to supplymainly local needs. The Western Highlands fuel wood plantations arealso excluded but they are now producing minor quantities of sawntimber.
* The future processing of this volume has not yet been determined andit will depend on the ultimate area available for planting. If the areacan be increased it is likely that much of this volume will be chipped,however at this stage it is expected that it will be sawn and possiblyveneered.

Table 140: PNG; TOTAL LOG HARVEST, EXPORT, & PROCESSING('000 m3)
Export ProcessedVolume Unit Value Volume*
Total Kfm3 US$/m3|
1978 894 445 K 26.82 4491979 909 472 K 43.97 4371980 1,218 642 K 48.59 5761981 1,304 743 K 42.07 5611982 1,487 1,063 K 46.63 4241983 1,872 1,019 K 43.23 853*1984 1,558 1,284 K 54.73 2741985 1,518 1,158 K 50.41 50.28 3601986 1,727 1,314 55.20 4131987 2,000 1,442 80.85 5581988 (11 mnths.) na 1,159 78.77 n.a.
* It is suspected that the 1983 total harvest is overstated (it mayinclude part of the 1984 harvest) producing the very high figurefor logs processed. The sawn timber production inferred afterdeduction of log volume to chip, chopstick and veneer productionwas certainly nothing like 210 000 nT3.
I Kina values taken from PNGFD data, USS from FIC data.
Source: PNGFD 'Compendium of Statistics* 1986; Annual reportstatistics 1987 FIC data.

Table 141: PNG; PROJECTED PLANTATION LOG HARVEST('000m3)
Period Arauc. Pinus Euc. deg. Teak Other.H/W totalpulp other
1991-95 62 50 65 40 10 10 2371996-2000 62 80 75 130 20 40 407.2001-15 62 120 420 130 25 40 7972006-10 62 140 520 230 30 90 1,0722011-15 90 ISO 620 230 30 90 1,2102016-20 110 150 620 230 30 90 1,230
Table 142: PNG; PROJECTED AVERAGE ANNUAL SAWNTIMBER PRODUCTION
('000 m3)
Period Natural forest Plantationconifer hardwood
1991-95 200 30 101996-2000 270 35 602001-15 380 50 602006-10 540 60 1002011-15 760 70 1002016-20 1,070 70 100

Table 143: PNG; PROJECTED VENEER PRODUCTION('000 m3)
Period Natural Forest Plantation Consumption*
1991-95 30 12 (14)1996-2000 60 40 (17)2001-05 60 40 (21)2006-10 60 65 (24)2011-15 60 75 (28)2016-20 30 90 (32)
* The domestic market for plywood is likely to be metexclusively from plantation material apart from a period inthe early 1990's. The volume that may be consumed is shown inbrackets.
Table 144: PNG; PROJECTED WOOD CHIP PRODUCTION
Period BDU 000's
1991-95 70i996-2000 752001-05 1852006-10 2402011-15 * 2802016-20 280

Table 145: ACTUAL & PR)JECTED HARVEST AND EXPORT VOLUMES FROM PNG'000 m3 (chips '000 BDU)
Log Harvest Export of:Nat'l Plant'n Total Logs S/timber Plywood W/chips
1978 894 n.a. 894 445 35.7 6.3 1151979 909 909 472 62.6 6.1 1071980 1,218 ff 1,218 642 45.2 6.5 1211981 1,304 " 1,304 743 23.8 7.8 1021982 1,487 n.a. 1,487 1,063 21.2 6.3 821983 1,872 n.a. 1,872 1,019 20.1 5.5 1171984 1,558 n.a. 1,558 1,284 17.8 5.1 1271985 1,518 n.a. 1,518 1,158 14.8 1.2 911986 1,727 n.a. 1,727 1,314 7.4 -(1) 811987 2,000 60(2) 40(2) 2,100 1,442 4.8 - 671988 1,800 60(2) 50(2) 1,910 1,264 1.5 _ n.a.
Pine + VeneerSftwd. Hdwd. N.F.P'n Total
1991-95 3,200 112 125 3,437 3,000 15 28 - _3 701996-2000 4,900 142 265 5,307 4,000 50 60 23 83 752001-05 5,100 182 615 5,897 4,000 50 60 19 79 1852006-10 5,500 202 870 6,572 4,000 80 60 41 101 2402011-15 5,000 240 970 6,210 2,000 80 60 47 107 2802016-20 4,700 260 970 5,930 1,000 110 30 58 88 280
N.B. Recent data for 11 months but extrapolated to 12 months(1) Export ceased in 1986 because of too high production costs(2) Gehr's estimation, based on plantation establishment data.

Table 146: PNG PROECESSED FOREST PRODUCTS EXPORTS
Year Sawn Plywood WoodchipsM3 000's unit value m3 000's unit value BDU 000'S Unit
ValueKina Kina Kina
1978 35.7 104 6.3 376 114.91979 62.6 127 6.1 404 106.71980 45.2 137 6.5 459 121.11981 23.8 152 7.8 393 101.6 53.71982 21.2 166 6.3 458 81.5 54.21983 20.1 157 5.5 448 116.9 54.61984 17.8 187 5.1 454 126.5 54.611985 14.8 203 1.2 437 90.7 52.31986 7.4 236 81.0 61.81987 4.8 262 66.9 101.31988 1.5 277 na na
Source: PNGFD, Stats Office.

Table 147: FIJI; POPULATION PROJECTIONS TO 2020
year total urban rural
1990 772.9 299.8 473.11995 853.3 331.0 522.32000 942.1 365.5 576.62005 1,030.0 399.6 630.42010 1,126.1 436.9 689.22015 1,231.1 477.6 753.52020 1,346.0 522.2 823.8
Source: Stats. Office, Suva (1986 data and population growthrates)

Table 148: FOREST AREAS OF FIJI (1986)
Area (ha.) Z Total Land
Natural Forest:Unlogged Commercial Forest 225,000 1}Exploited Commercial Forest 65,000 4Protected/Conservation 251,000 14Non-commercrial 248,000 14Unclassified 13,000 1Mangrove 18,000
Sub-total 820,000 45
Platations:Fiji Pine Commission pines 44,614Fiji Forestry Department pines 3,694 3Extension Scheme pines 10,803Fiji Forestry Department Mahogany etc. 25,654 1
Total 904,765 49
Notes:
1) The ultimate planned FPC estate is 48,000 ha. on Viti Levu and12,000 ha. on Vawaa Levu
2) Fiji has the only complete soil conservation legislation in the S.Pacific. The rainforest area has been reduced at only one-quarter ofthe global rate over the last two decades.

Table 149: FIJI: NATURAL FOREST AREAS BY TYPE & OWNERSHIP 12/31/89('000 km2)
Forest Type Land Ow,nershipPrivate State Forest Leased Communal Total
Reserve
Production forestun-harvested 16.02 6.11 .99 3.80 226.31 253.23harvested 4.22 1.27 2.27 .17 38.78 46.71Conservation forest 10.94 18.09 13.58 .07 208.02 250.70Non-commercial
forest 13.62 16.78 .72 .96 219.76 251.83Mangrove forest 18.40 18.40unclassified* 13.00
Total 44.81 60.64 17.56 j.00 692.86 833.88
* Unsurveyed forest on smaller islands.
Source: Yabaki 1985 and Drysdale 1988.

Table 150: FIJI; ESTIMATED GROWING STOCK IN PRODUCTION FOREST (1984)('OOOm3, trees >35 cm dbhob)
Species group Viti Levu Vanua Levu Kadavu Total
Conifer 400 730 10 1,140Light h *oods 2,290 1.640 120 4,050Medium h'woods 1,S20 1,000 20 2,540Heavy h'woods 1,480 1,060 90 2,630
Sub total 5,690 4,430 240 10,360
Non-commercialspecies 1,800 1,130 50 4,080
Total 7,490 6,660 290 14,440
Source: FFD
Table 151: FIJI: SPECIES COMPOSITION OF HARVEST & NATURAL FOREST
Harvest Forest
Kaudamu (Myristica) 19 8.6Kauvula (Endospermum) 19 10.8Dakua makadre ( Agathis) 18 6.7Damanu (Calophyllum spp) 11 9.9Dakua salusalu ((Decussocarpus) 5 2.0Yasiyasi (Syzygi=m) 4 9.2Bauvudi (Palaquium excl. hornei) 4 2.9Sacau (Palaquium hornei) 3 4.4Mavota (Gonystylus punctatus) 3 2.3Rosarosa (Heritiera) 2 3.1Yaka (Dacrydium) 2 0.3Vesi (Intsia) 2 1.4Laubu (Garcinia) 2 1.0Kaunicina (Canarium*) 2 3.3Tivi (Terminalia) 1 0.8Vaivai-ni-veikau (Serianthes) 0.5 0.8Rosawa (Gmelina vitiensis) 0.3 0.2Others 2.2 32.3
Source: FFD

Table 152: FIJI: PROJECTED NATURAL FOREST HARVEST
period m3
1991-95 240,0001996-2000 225,0002001-05 200,0002006-10 140,0002011-15 140,0002016-20 140,000
Table 153: FIJI: NATURAL FOREST INCREMENT- m3/ha/ann.
Status Trees/plot All trees >15 cm dbhob Trees >35 cm dbhob
Unlogged 426 1.06 0.40149 0.24 0.07404 0.63 0.32
Logged 82 1.44 0.1164 0.96 0.29
187 0.27 0.05
4~~~~~~~~~

Table 154: FIJI: PROPOSED TOTAL PLANTATION ESTATE
Authority and Type Area (ha.)
FPC Pine 60,000FPD Pine 6,000Extension Pine 34,000FED Hardwoods 100,000
Sub total 200,000
Undetermined Hardwood (pulp) 40,000
Total 240,000
Source: AIDAB 1986, FPC, E.D.Shield

Table 155: FIJI: PLANTATION AREAS BY AUTHORITY & TYPE(ha.)
FPFD Extension FPC TotalPeriod Conifer Hardwood Conifer Conifer Conifer Hardwood
Mahogany Other
pre-1950 2 251-55 204 16 22056-60 152 467 2 106 258 46961-65 241 2,515 - 367 608 2,51566-70 1,882 4,389 2 247 961 3,090 4,39171-75 557 743 538 1,324 8,393 10,274 1.28176-80 303 872 2,863 2,353 12,400 15,056 3,73581-84 457 5,402* 4,455* 2,347 12,661 15,465 9,8571985 102 2,1611 1,4401 500 4,118 4,720 3,6011986 109 1,2153 8103 900t 2,782 3,791 2,0251987 232 2,5781 1,7191 900# 2,203 3,335 4,2971988 160 1,6441 1,0961 9001 1,386 2,946 2,740
Total 4,195 22,192 12,941 9,471 41,428 55,623 35,133
There is conflicting data, the lower figure has been taken.Data for mahogany was not available. The total has been split 60:40between mahogany and others.Data was not available but based on an indicated program ofapproximately 1 000 ha./ann., a stated total current estate ofabout 10 000 ha. and an assumption that effectiveness will bevariable (as indicated by Drysdale who reduced published datafollowing a survey of extension plantings).
Source: FFD, Drysdale (1988), FPC (Dunn)

Table 156: FIJI: PROJECTED HARDWOOD PLANTATION ESTABLISHMENTBY SPECIES
(ha.)
Period Mahogany Cordia Cadamba Kauvula Maesopsis
-1960 6731961-65 2,5151966-70 4,3891971-75 743 ( ( C (1976-80 872 (3,700 (2,800 (400 (1,0001981-85 7,563 ( ( ( (1986-90 7,837 2,700 2,700 200 801991-95 12,000 3,200 3,200 600 1,0001996-2000 12,000 3,200 3,200 600 1,0002001-05 12,000 3,200 3,200 600 1,0002006-10 12,000 3,200 3,200 600 1,000
Table 157: FIJI: PINE PLANTATION AREAS & PROGRAM.
Period FFD FPC Extension Total
1956-60 152 106 2581961-65 241 367 6081966-70 1,882 961 247 3,0901971-75 557 8,393 1,324 10,2741976-80 303 12,400 2,353 15,0561981-85 559 16,779 2,847 20,1851986-90* 750 16,666 4,500 21,9161990-95 750 16,666 4,500 21,9161996-2000 750 16,666 4,500 21,916
* All figures from 1989 are estimates which include replantingof areas clear felled.

Table 158: FIJI: PROJECTED PLANTATION VOLUME PRODUCTION('000 m3lann.)
Period Pine HardwoodFPC(1) Extensn(2) FFD.(3) Total Mahogany Other Total
saw chip saw chip saw chip saw chip(5) (4)
91-95 85 150 8 2 28 27 121 213 18 8 2696-00 121 174 32 4 18 17 171 237 80 64 14401-05 240 260 45 4 18 17 303 358 80 127 20706-10 240 260 65 4 20 20 325 362 90 231 32111-15 390 410 105 4 20 20 515 557 90 261 35116-20 390 410 105 4 20 20 515 557 250 338 588
(1) data from FPC 1989(2) based on Drysdale (1988) for pulpwood(3) based on Drysdale (1988)(4) the 'other* hardwoods e:e mainly Anthocephalus cadamba and Cordia
alliodora, constituting over 90? of production.(5) this includes 301 of the FPC and FFD pine sawlog volume which would
be chipped.
*

Table 159: FIJI: PLANTATION COSTS, F$Iha.
Pine Hardwood
Rotation length, years 20 20 35 50
Year of operation
-2 15 15 l5-1 211 80 80 800 627 236 236 2361 311 52 52 522 47 51 51 513 47 40 40 404 47 30 30 305 47 14 14 146 47 7 7 7*
Annual throughout rotation 47 1 1 1*
17 1,85220 53935 (1,349) 55450 (1,893) 569
(2,436)
N.3. It should be noted that the FFD figures do make allowance foroverheads up to year 6 but not beyond. FPC acknowledge that theiroverheads are very high by international standards, and they do have aprogram for reducing these. To be fair, they do have some social costswhich elsewhere would be met by government. It is probably optimisticto suggest that FED overhead costs are much below the FPC level, but itis suspected that they are. If an annual charge for overhead of say 75Sof the FPC level were added ta the FFD costs, over the entire rotation,costs would be as shown in brackets under the totals.

Table 160: FIJI: LOG EXPORT VOLUMES('000 m3)
Year Total Harvest Export Processed
1983 167.0 18.0 149.01984 175.9 12 5 163.41985 193.9 12.0 181.91986 185.5 9.5 176.01987 221.8 31.3 190.5
Source: Bureau of Statistics July 1988.
Table 161: FIJI: SAWMILL NUMBER & SIZE
1983 1987 1988Mill output No. vol m3 Z of No. Vol m3 2 of No. Vol m3 Z of
m3 p.a. Total Total Total
* 5,000 5 53,957 61 12 60,840 78 9 na na1,000-5,000 12 18,927 22 8 4,680 6 3 na na
< 1,000 41 14,786 17 51 12,480 16 18 na na
Total 58 86,760 70 78,000 30 na
Source: Drysdale 1988

Table 162: FIJI: SAWN TIMBER PRODUCTION. TRADE. ANDAPPARENT CONSUMPTION
(m3)
Year Output Export Import App. Cons.
1978 74,892 7,137 1,.192 68,9471979 77,279 7,739 418 69,9581980 83,875 13,500 729 71,1041981 99,956 6,256 104 93,8041982 72,425 6,419 2 66,0081983 79,000 6,536 - 72,4641984 83,000 12,015 - 70,9851985 87,700 8,618 21 79,1031986 82,000 8,504 1,137 74,6331987 87,000 15,419 12,011 83,5921988 na na na na
Table 163: FIJI: PROJECTED SAWN OUTPUT, EXPORT AVAILABILITY AND DOMESTIC USE('000 m3)
Period Pine Mahogany other H'woods Natural Forestout exp dom out exp dom out exp dom out exp dom
1991-95 51 48 3 8 5 3 3 - 3 99 33 661996-2000 72 58 14 36 25 11 29 17 12 92 31 612001-05 127 108 19 36 25 11 57 40 17 81 32 492006-10 136 109 27 40 28 12 86 60 26 54 21 332011-15 212 168 44 45 34 13 110 82 28 54 24 302016-20 212 168 44 105 79 26 129 98 31 54 24 30
Source: Cameron, 1989

Table 164: FIJI: PANEL PRODUCTION & EXPORT('000 m3)
Veneer PlywoodExp. Unit Domqs. Exp. Unit Log
Price price inputUS$ 1m3
1980 1.68 477 3.00 neg - 10.91981 3.08 538 3.39 .49 na 15.91982 2.73 646 2.86 1.03 15.21983 3.66 595 3.75 .42 17.71984 4.01 717 2.65 .44 15.71985 4.01 695 2.70 1.90 19.51986 3.70 628 3.00 na na1987 3.98 772 3.48 2.81 712 23.7
* calculated from assumed recovery rates.
Source: Bureau of Stats., Suva.
Table 165: FIJIAN FOREST PRODUCT EXPORTS (1987)
Commodity Quantity Revenue f.o.b. Unit Value(m3 or t) (F$mill.) (F$/m3 or/t)
Logs 39,669 m3 2.0 50Sawn Timber 15,419 5.5 357Veneers 4,333 2.2 508Plywood 2,806 2.0 713Chips (pine) 37,156 t 1.9 51Poles 352Sandalwood 183 1.0 5.46/kg.
Notes:
1) Log export restrictions were relaxed in 1987.2) Sandalwood prices rose to $12.5/kg. the following year. The tree, a
parasite, is cultivated.

Table 166: FIJI: COMPOSITION & VOLUME OF SAWN TIMBERAVAILABLE FOR EXPORT
'000 m3
Period Pine Mahogany Other H'woods Natural
1990-95 33 5 - 331996-2000 46 25 17 312001-05 69 25 40 322006-10 45 28 60 212011-15 96 34 82 242016-20 84 79 98 24
Table 167: FIJI: VENEER & WOODCHIP EXPORT POTENTIAL(vir. m3; chips BDU)
Period Veneer Plywood* WoodchipsNative Plant'n Pine Hardwood
1990-95 4,400 - 1,000 84,000 -
1996-2000 3,100 1,000 93,000 -
2001-05 3,000 - 1,000 140,000 220,0002006-10 5,000 9,000 1,000 142,000 440,0002011-15 5,000 6,000 1,000 218,000 440,0002016-20 5,000 45,000 1,000 218,000 440,000
* assumes some specialty plywoods continue to be exported.

Table 158s ACTUAL & PROJECTED HARVEST & EXPORT VOLUMES FROM FIJI'000 m3 (woodchips '000 BDU)
L O G H A R V E S T E X P 0 R TNat. Plantions (2) (5)For. Pine Hdwd Totl Logs Sawn Timber Total Veneer Total Ply'd W'dchips Totl
1978 n.a. n.a. 7.1 -1979 n.a. n.a. 7.7 -1980 299* 34* 263 13* 13.5 1.7 negl -1981 n.a. n.a. 6.3 3.1 0.5 -1982 n.a. n.a. 6.4 2.7 1 -1983 107 n.a. 18 6.5 3.7 0.4 _1984 176 n.a. 12.5 12 4 0.41985 194 n.a. 12 8.26 4 1.9 -1986 186 17* 2* 205 9.5 8.5 3.7 n.a. -1987 222 80 2* 304 31.3 15.4 4 2.8 34* 431988 200* 245 5* 450 n.a. n.a. (4) n.a. n.a. n.a.
{3) Nat. Nat.Pl'tn.Pine Mahog.Oth. For. For. Pine Hdwd
1991-95 240 334 26 600 31 33 5 - 33 71 4.4 - 4.4 1 84 - 841996-2000 220 408 144 772 43 46 25 17 31 119 3.1 - 3.1 1 93 - 932001-05 200 661 207 1068 67 69 25 40 32 166 3 - 3 1 140 220 3602006-10 140 687 321 1148 68 45 28 60 21 154 5 6 11 1 142 440 5822011-15 140 1072 351 1563 59 96 34 82 24 236 5 6 11 1 218 440 6582016-20 140 1072 588 1800 77 84 79 98 24 285 5 45 50 1 218 440 658
Source: Cameron, Kehr, Hunter, 1989
(*) data taken from Hunter, 1989{2) assumes IOZ of harvest exported an logs (no command processing)(3) the other hardwoods are mainly Anthocephalus cadamba and Cordia alliadora (90Z). Due to shorter
rotation (35 vs. 20 years) the first will have a bigger share to 2020.(4) mainly Anthocephalus cadamba from 2006 to 2015. for the last 5 years also a big share of
mahogany and maybe Cordia.(5) there is one plywood plant in Fiji which is supposed to meet predominantly domestic
demand; only some speciality plywoods are likely to continue being exported.

Table 169: SOLOMON ISLANDSt AREA, POPULATION, & DENSITYBY PROVINCE, 1986
Province Area population populationbm2 '000 density
/km2
Western 9,313 55.2 5.9Isabel 4,136 14.6 3.5Central 1,286 18.5 14.4Guadalcanal 5,336 49.8 9.3Honiara 22 30.4 1.381.8Malaita 4,225 80.0 18.9Makira 3,188 21.8 6.8Temotu 865 14.8 17.1
Total 28,370 285.2 10.1
Source: Statistics Office, SIG, Honiara.
Table 170: SI: PROJECTED POPULATION TO 2020.('000's)
Province 1990 1995 2000 2005 2010 2015 2020
Western 63.4 75.3 89.4 104.7 122.4 143.3 167.8Central 21.9 26.0 30.9 36.1 42.3 49.5 57.9Guadalcanal 57.2 -67.9 80.7 94;4 110.5 129.4 151.4Honiara 34.9 41.4 49.2 57.6 67.5 79.0 92.4Malaita 91.8 109.1 129.5 151.6 177.5 207.8 243.2Makira 25.0 29.7 35.3 41.3 48.3 56.6 66.2Temotu 17.0 20.1 23.9 27.6 28.0 32.8 38.4
Total 326.1 387.3 460.0 538.5 630.3 737.8 863.7

Table 171: SI; LAND OWNERSHIP BY PROVINCE, 1987(kmZ)
Province Total Customarv land AlienatedArea Registered Un-regstrd Total Gov't Citizen other
Western 9,313 10.4 8,211.1 1,091.5 661.5 294.6 135.4Isabel 4,136 4.3 2,856.6 1,279.4 413.2 765.0 101.2Central 1,286 2.0 1,055.2 230.8 115.6 7.5 107.7G'canal 5,336 1.1 4,787.3 548.7 203.1 111.4 234.2Malaita 4,225 2.9 4,123.9 101.1 35.6 36.4 29.1Makira 3,188 0.4 3,127.9 60.1 17.7 31.9 10.5Temotu 865 neg. 723.9 141.1 125.7 7.5 7.9
Total 28,370 21.1 24,913.1 3,456.9 1,578.2 1,254.3 624.4
Source: Statistics Office, SIG.
Table 172: SI; DISTRIBUTION OF COMMERCIAL NATURAL FOREST BY OWNERSHIP(kmZ)
Province Total Government Customary
Western 1,923 828 1,095Isabel 629 279 350Central 39 0 39Guadalcanal 316 0 316Malaita 137 0 137Makira 730 0 730Temotu 85 85 0
Total 3,859 1,241 2,351
Source: FAO (1979) ANUTECH (1985)

Table 173: SI: LOG HARVEST & REMAINING LOG VOLUME BY ISLAND, 12/31/88('000 m3)
Initial Harvest Remainder Harvest RemainderRemainder end '85 end '85 86-88 end '88
Shortlands 500 500 0 na naNth Choiseul 195 S 190 - 190Mono Ovai 70 0 70 - 70Vella Lavella 520 0 520 - 520Rolombangara 1,713 1,710 0 - 0Nth New Georgia 4,212 1,360 2,852 na naSth New Georgia 1,544 1,1~35 409 na naVangunu 1,070 80 990 na naRendova 130 5 125 - 125Santa Isabel 4,795 201 4,594 - 4,594Russell Islands 170 10 160 - 160Guadalcanal 1,336 550 786 na naMalaita 665 165 500 na naMakira 2,920 210 2,710 na naSanta Cruz 95 60 35 - 35Vanikoro 146 140 6 - 6
Total 18,490 4,146 14,343 1,049 13,294
Source: based on UNIDO (1986) and more recent SIFD data.

Table 174: SI: SPECIES COMPOSITION OF FOREST HARVEST 1985-6('000 m3)
Volume 2 of TotalSpecies 1985 1986 Total 1985 1986 Mean
Calophyllum 80.1 83.4 163.5 19.1 19.3 19.2Pometia 133.1 109.2 242.3 31.7 25.3 28.5Vitex 3.0 3.4 6.4 0.7 0.7 0.1Palaquium 3.8 4.9 8.6 0.9 1.1 1.0Terminalia br. 18.2 23.7 41.9 4.3 5.5 4.9Gonystylus 1.8 4.6 6.3 0.4 1.1 0.7Schizomeria 6.2 5.0 11.2 1.5 1.2 1.3Canarium 3.6 4.1 7.7 0.8 1.0 0.9Parinari 9.9 8.1 18.0 2.4 1.9 2.1Campnosperma 41.7 51.2 92.9 9.9 11.9 10.9Dillenia 34.7 34.4 69.1 8.3 8.0 8.1Mix red 5.7 23.8 29.5 1.4 5.5 3.5Mix white 9.5 32.0 41.52 2.3 7.4 4.9Super small 17.1 0.0 17.1 4.1 0.0 2.0Other 51.5 43.7 95.2 12.3 10.1 11.2
Total 419.9 431.6 851.4
N.B. Figures do not balance because of rounding
Source: SIFD annual reports, 1985,1986

Table 175: SI: AREA PLANTED BY LOCATION
Year KOLO VIRU ALU STCR GIZO ALL Total
1967 47 471968 40 174 2141969 212 235 4471970 55 178 2331971 466 474 9411972 394 543 9371973 54 76 1301974 298 412 724 1,4341975 851 8511976 368 1,008 1,3961977 433 896 293 1,6221978 1,812 1,093 529 3,4341979 1,608 456 1,220 3,2841980 1,397 182 66 1,6451981 126 73 1991982 311 176 97 107 6911983 299 264 314 222 1,0991984 304. 353 187 164 1,0081985 300 315 383 192 1,1801986 336 273 370 9791987 217 20 303 206 7461988 208 241 158 122 729
Total 8,037 7,509 1,812 3,194 252 2,451 23,255
Source: SIFD records.
The locations are:
KOLO - Kolombangara, Western ProvinceVIRU - Viru harbour, New Georgia,Western ProvinceALU - Shortland Is., Western ProvinceSTCR - Santa Cruz, TemotuGIZO - Western ProvinceALL - Allardyce, Santa Isobel Is.

Table 176: SI: AREAS PLANTED BY SPECIES & YEAR
Ytar AGAM CAMB CEDO EUCD QMA SWIM TECG TERB TERCAL MINOR MIXED Total
1967 47 471968 63 151 2141969 388 59 4471970 178 55 2331971 474 442 24 9411972 543 394 9371973 76 14 40 1301974 724 83 72 554 1,4341975 598 160 94 8511976 515 69 105 707 1,3961977 117 412 20 9 30 1,034 1,6221978 529 381 559 58 1,908 3,4341979 994 634 302 29 64 1,261 3,2841980 66 160 325 71 1,023 1,0451981 73 36 15 74 1991982 18 193 65 176 26 7 30 5151983 129 192 62 303 89 56 8 171 1,0111984 175 66 374 18 93 133 30 29 9191985 140 173 101 481 51 167 34 43 38 1,2281986 36 120 46 62 271 78 232 160 17 1,0211987 32 19 70 130 403 139 207 9991988 86 15 326 127 176 25 44* 799
Total l,926 5,950 398 1,012 896 2,193 176 1,373 1,816 80 7,246 22,706
* 44 ha. of TECG and SWIM
AGAM - Agathis macrophyllaCAMB - Campnosperma brevipetifoliaCEDO - Cedrela odorataEUCD - Eucalyptus degluptaGMEA - Gmelina arboreaSWIM - Swietenia macrophyllaTECG - Tectona 8randisTERB - Terminalia brassiiTERCAL - Terminalia calamansani

Table 177: SI; PROJECTED YIELD/HA., HARDWOOD PLANTATIONS
SPECIES ROTATION DIAMETER GROSS VOLUME NET VOLUMEyears Cm. m3 m3
CAMB 20 45 80-140 70-120CEDOcl 20 45 80-140 70-120EUCD 20 55 300-400 250-340GMEA 16 55 260 220SWIM 35 55TECG 30 50 250-300 210-250TERB 20 45 120-150 100-130TERCAL 20 45- 100-140 85-120
N.B. It is emphasized that these estimates are very tentative.Recoverable volume will depend on the processing system to be used.
Table 178: SI: PLANTATION TIMBER AVAILABILITY('000 m3/ann.)
Period Recoverable VolumesCAMB CEDO EUCD GMEA SWIM TECG TERB TERCAL MIX
-1990 20 101991-95 46 4 2 22 131996-2000 40 51 9 8 5 1132001-05 4 3 0 42 10 4 52006-10 1 12 8 75 11 3 12011-15. 19 75 32016-20 19 75 60 3

Table 179: SI: UNIT LABOR COST ESTIMATES, 1988(SIS)
Basic daily wage 7.00Paid days 260Effective working days 200
Annual wage cost 1,820.00National Provident Fund 7.SZ 13.6.50Leave travel 100.00Total annual cost SIS 2,056.50
Cost per man day, general labor 10.28Chainsaw operator e 8.00 p.d. 11.68Supervisor e 9.00 p.d.
Labor cost incl supervision at 1 sup/12 lab
Labour per man day 11.37 (=US$ 6.25)Chainsaw operator per man day 12.77 (-USS 7.02)
Source: SIED, April 1988

Table 180: SI: SAWN TIMBER PRODUCTION, SALES & PRICES 1979-88
Log Sawn TimberInput Prod. Recovery Export Data Domestic Price
000-'8 Z sawn m3 000's Z m3 000'S US$/m3 m3 000's US$m3m3
1978 27.9 11.6 10.8 39 2.5 109 6.8 1211979 40.9 14.7 17.0 42 8.3 136 7.7. 1371980 40.9 15.0 19.5 48 5.8 172 8.5 1371981 49.4 15.2 20.1 41 5.1 205 11.7 2011982 58.6 17.9 23.5 40 7.1 199 7.9 na1983 49.5 14.1 19.8 40 5.8 197 9.6 na1984 33.0 7.2 12.0 36 6.2 216 7.1 na1985 55.6 14.7 20.8 37 2.9 263 14.0 2301986 38.4 8.9 14.9 39 3.9 335 11.0 2421987 39.8 12.9 17.0 42 3.5 537 9.8 2721988 29.0 9.4 13.0 45. na na 8.8 376
Source: SIFD and Stats. Office.
Table 181: SI: PROJECTED SAWN TIMBER PRODUCTION FROM PLANTATION SPECIES('000 m3/ann.)
Period AGAM CAMB CEDO EUCD GMEA SWIM TECG TERB TERCAL MIX Tot
1991-95 10 15 251996-2000 10 6 5 8 15 442001-05 19 10 9 19 5 8 15 852006-10 19 10 7 9 34 5 8 10 102
2011-15 19 10 8 9 34 10 1052016-20 8 34 27 neg 35 104

Table 182: SI; LOG HARVEST, USAGE & EXPORT PRICES SIS 1979-88('000 m3 & SI$Sm3)
Total Export Price Savw Vol. 2 Sawn
1978 238.9 220.6 27.7 27.9 11.61979 278.9 258.2 57.0 40.9 14.71980 272.6 252.4 57.3 40.9 15.01981 324.7 300.6 46.5 49.4 15.21982 363.2 336.3 65.1 58.6 17.91983 350.9 350.9 55.7 49.5 14.11984 457.8 415.4 74.0 33.0 7.21985 419.9 349.4 71.0 55.6 14.71986 431.5 378.7 80.0 38.4 8.91987 307.6 267.8 125.0 39.8 12.91988 310.1 281.1 132.0 29.0 9.4
Source-:SIFD
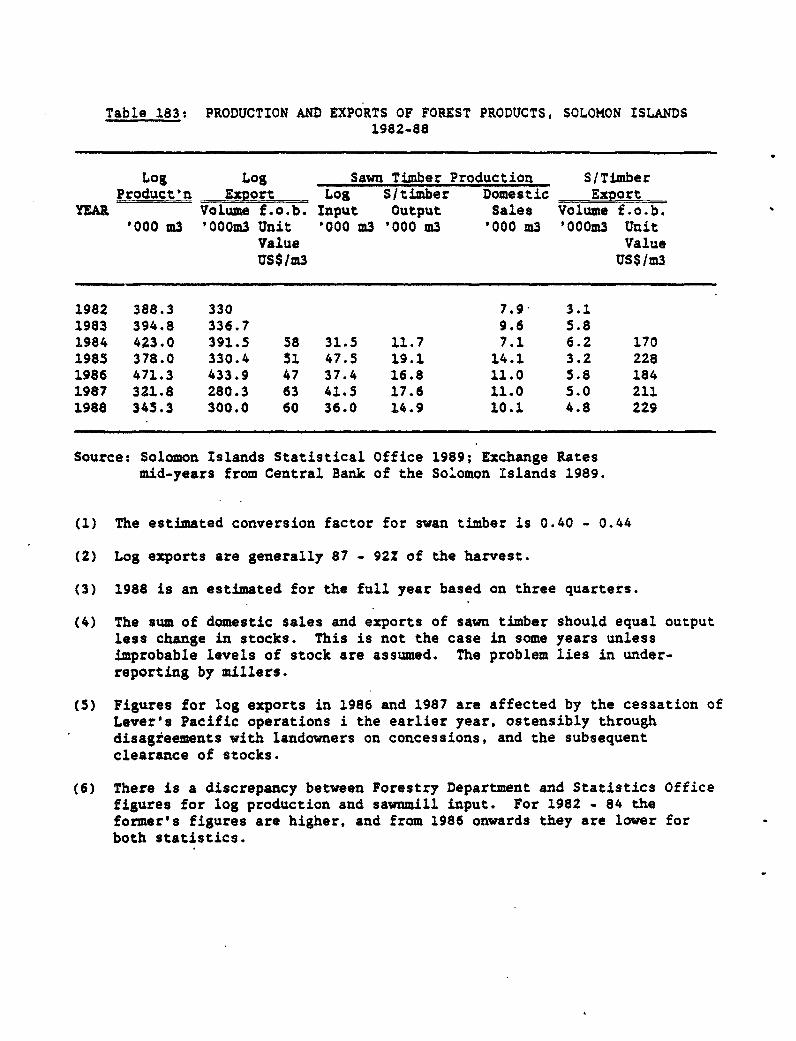
Table 183: PRODUCTION AND EXPORTS OF FOREST PRODUCTS, SOLOMON ISLANDS1982-88
Log Log Sawn Timber Production S/TimberProduct'n ExPort Log S/timber Domestic Export
YEAR Volume f.o.b. Input Output Sales Volume f.o.b.'000 m3 '000m3 Unit '000 m3 '000 m3 '000 m3 'OOOm3 Unit
Value ValueUS$/m3 US$/m3
1982 388.3 330 7.9 3.11983 394.8 336.7 9.6 5.81984 423.0 391.5 58 31.5 11.7 7.1 6.2 1701985 378.0 330.4 51 47.5 19.1 14.1 3.2 2281986 471.3 433.9 47 37.4 16.8 11.0 5.8 1841987 321.8 280.3 63 41.5 17.6 11.0 5.0 2111988 345.3 300.0 60 36.0 14.9 10.1 4.8 229
Source: Solomon Islands Statistical Office 1989; Exchange Ratesmid-years from Central Bank of the Solomon Islands 1989.
(1) The estimated conversion factor for swan timber is 0.40 - 0.44
(2) Log exports are generally 87 - 92? of the harvest.
(3) 1988 is an estimated for the full year based on three quarters.
(4) The sum of domestic sales and exports of sawn timber should equal outputless change in stocks. This is not the case in some years unlessimprobable levels of stock are assumed. The problem lies in under-reporting by millers.
(5) Figures for log exports in 1986 and 1987 are affected by the cessation ofLever's Pacific operations i the earlier year, ostensibly throughdisagreements with landowners on concessions, and the subsequentclearance of stocks.
(6) There is a discrepancy between Forestry Department and Statistics Officefigures for log production and sawnmill input. For 1982 - 84 theformer's figures are higher, and from 1986 onwards they are lower forboth statistics.

Table 184: SI: AVAILABILITY OF SAWN TIMBER FOR DOMESTICCONSUMPTION & EXPORT
('000 m3/ann.)
Period Native forest Plantations TotalAGAM GMEA Other
dom. export dom. exp. dom. exp. dom. exp. dom. exp.
1991-95 15 5 11 14 26 191996-2000 15 10 3 3 17 21 35 342001-05 15 20 4 15 7 12 19 28 45 752006-10 15 30 4 15 12 22 20 29 51 962011-15 18 42 4 7 10 24 1S 22 47 1032016-20 18 42 10 24 25 45 53 111
Table 185: SI: KOLOMBANGARA PROPOSED ROTATIONS
Species s /ha thinning clear fall MAI yield harvestL_Spacing m. age s/ha age s/ha m3/ha/a m3 loss 2 merch saw chip
Pulpwood
EUCD 3x3 1,111 2 667 8 667 37.5 300 15 255 255GMEA 4s3 833 2 667 8 667 35 280 15 238 48 190
Savlog
GMEA 4x3 833 3 500 12 500 24 288 12 253 177 76
Source: SIFD, Honiara, April 19.88

Table 186: St: FOREST CPERATIONS - COST INPUTS (1988 COST BASIS);OLOMBANGARA PROJECT
First Rotation Second RotationOperation Labor Materials Total Labor Materials Total
m.d. $ $ $ m.d. $ $ $
y 1Surveyl
Mapping 4 45 3 48 - - - -
y 0
Nursery 10 114 150 264 10 114 150 264Site Clearing 6 68 - 68 - - -
-Chainsaw 6 77 60 137Line Opening 18 205 - 205 18 205 205Planting
- Gmea 8- 91 91 8 91 91- Eucd 10 114 114 10 114 114
Blanking 2 23 23 2 23 23Weeding 50 569 569 50 569 569Fertilizer 2 23 110 133Sub-tot Gmea 100 1,145 210 1,355 90 1,023 260 1,283
Sub-tot Eucd 102 1,168 210 1,378 92 1,046 260 1,306
Weeding Gmea 10 114 114 114Eucd 20 227 227 227
y 2Weeding Gmea 3 34 34 34
Eucd 12 136 136 136Thinning 2 26 20 46 2 26 20 46
y 3weeding Eucd 8 91 91 91
y 4weeding Eucd 4 45 45 45
N.8.: Nursery cost of materials includes $50 per ha. for tools,chemicals and fertilizer plus $100 per ha. for seed; chainsaw cost at$10 per day includes fuel and spares; costs must be extended torotation length and overhead costs added.

Table 187: SI: PROJECTED EXPORT SAWN TIMBER & CHIP OUTPUTKOLOMBANGAM PROJECT
Period SAWN TIMBER i chips BDU/ann.m3 l ann.
2000- 77,0002007- 52,000 122,0002015- f1,000 129,0002023- 61,000 141,000
* This assumes 302 of sawmill log input is of exportable sawnoutput.

Table 188: ACTUAL & PROJECTED HARVEST & EXPORT VOLUMES FROM SOLOMON ISLANDS'000 m3 (woodchips '000 BDU)
LOG HARVEST EXPORTNat'L For't ~fChips
Nat'l For't Plantations Total Logs S/t'r Plantations Total V'n'r
1978 239 - 239 221 2.5 -1979 279 - 279 258 8.31980 273 - 273 252 5.8 - -1981 325 - 325 301 5.1 - -1982 363 - 363 336 7.1 - -1983 351 - 351 351- 5.8 - -1984 458 - 458 415 6.2 - -1985 420 - 420 349 2.9 - -1986 432 - 432 379 3.9 - -1987 308 - 308 268 3.5 - _1988 310 - 310 281 n.a. - -
(1) (2)Agam Gmea 0th. Agam Gmea 0th. (5)
'91-95 300 300 (41- - 55 355 300(81 5 - - 14 19 10 _ _'96-00 300(212 - 9 84 393 300(8)10 - 3 21 3418 I S'01.05 200(801 38 237 104 579 250(8}20 15 12(3) 28 75 31 - 77'06-10 - [601 38 479 109 626- - 30 15 74(3) 29 148 37 - 122'h--S - (45 38 504 85 627 - 42 15 85(3) 22 164 42 (9) 129'16-20 - (40 - 535 159 694 - 42 - 85(3) 45 172 58 ? 141
(11 Agam - Agathis macrophylla(2) Gmea - Gmelina arborea(3) incl. projected output from Kolomban*ara project(4) There is no national concept for actile management of natural forests. Mid-
to long-term wood demand for domestic and export use is supposed to be met byplantations. Data (in bracketsl are estimates from Hunter 1989, who isassuming a slower decline than Cameron in 1989.
{5) Data (in brackets] are from Hunter 1989, by multiplication with a conversionfactor of 0.44 to reduce RWE to sawn m3.
(6) Data for projected removals from plantations are gained from projected sawnproduction (Table 181) by using recovery factors of 0.50 for Agathis and 0.45for Hardwoods. Amounts from Kolombangara Project are estimated from Table187 by assuming: a) 30Z of sawmill log input is exportable, and b) 502 ofsawmill log input will be chipped (residues), c) 2.53 m3 wood are necessaryto produce 1 BDU of chips.
(7) The underlying assumptions are that chips only will be produced at theKolombangara Project (mainly Gmea and rest E. deglupta) and completelyexported.
(8) Cameron's assumptions of log export must be reduced if processing issuccessful.
(9) No veneer production is planned at present but could be undertaken whenplantations guarantee a steady supply of appropriate hardwoods.
Source: Cameron, Kehr, Hunter, 1989.
(1) All chips are assumed exported. All figures roundwood equivalents.
(2) The domestic indigenous sawnmilling industry is given up to 8 years to adjustitself to export quality marketing.
(3) After KFPL commences production, the domestic market begins to absorb someGmelina sawn timber, but some time is required for prices to match export
(4) Sawmill residues included with chips but transport losses ignored.

Table 189: VANUATU: ni-VANUATU POPULATIONPROJECTION TO 2019
PopulationUrban Rural Total
1979c 19,700 93,000 112,7001984 22,370 105,590 127,9601989 26,590 124,790 151,2201994 31,180 147,200 178,3801999 36,630 172,910 209,5402004 42,940 202,680 245,6202009 50,350 237,720 288,0702014 59,050 278,760 337,8102019 68,290 327,130 395,420
c Census data
Source: Total figures from 'The mid-term review of Vanuatu'sFirst National Development Plan" (RVNDP1) National Planningand Statistics Office. Dec 1984.

Table 190: VANUATU: LAND AREA & ESTIMATED POPULATIONDISTRIBUTION BY REGION 1984
Island group Area km2 Population Z of TotalArea Pop.
Santo/Malo 4,010 19,423 30.7 15.3Malekula 2,053 15,163 15.7 12.0Tafea 1,627 17,506 12.4 13.8Banks/Torres 1,527 4,955 11.7 3.9Efate 887 19,819 6.8 15.7Aoba/Maewo 699 9,576 5.3 7.6Ambrym 666 6,176 5.1 4.9Tanna 561 15,395 4.3 12.2Pentecost 499 9,361 3.8 7.4Epi 446 2,579 3.4 2.0Panna 60 2,228 0.5 1.8Shepherd 42 4,444 0.3 3.5
Total 13,086 126,625
N.B. This data does not exactly match that providedelsewhere for either land area or population. However, it issufficiently accurate to illustrate the fragmented nature ofthe potential market.
Source: Silviconsult 1984.

Table 191: VANUATU: SPECIES COMPOSITION OF FOREST HARVEST, 1985 AND 1986
Species Volume I Representation of
m3 Total Cut Excl. Milktree
Milktree (Antiaris toxicaria) 29,039 56.2Whitewood (Endospermum medulosum) 14,850 28.7 65.6Blackbean (Castanospermum australe) 1,445 6.2 14.2Namalous (Garuga floribunda) 3,205 2.8 6.4Natora (Intsia bijuga} 532 1.0 2.3Nakatambol (Dracontomelum vitiense) 552 1.1 2.4Bluewater (Pterocarpus indicus) 373 ... 1.6Nakavika (Syzygium spp.) 284 ... 1.3Kauri (Agathis obtusa) 262 ... 1.1Other 1,442 2.8 6.4

Table 192: VANUTATU: AREA OF FOREST PLANTED(ha.)
LSP IFP Trials Total Cumulative
1970-72 15.3 15.3 15.31973 11.0 11.0 26.31974 1.0 1.0 27.31975 20.5 20.5 47.81976 22.0 11.0 33.0 80.81977 14.0 14.0 94.81978 17.0 15.0 32.0 126.81979 55.0 24.0 79.0 205.81980 105.0 45.0 156.0 355.81981 101.0 78.0 179.0 534.81982 146.0 172.0 318.0 852.81983 230.7 160.8 0.8 392.3 1,245.11984 112.0 284.3 18.5 414.8 1,659.91985 117.0 179.0 3.5 299.0 1,958.91986 3.5 184.0 3.5 190.8 2,149.71987 139.0 4.0 143.0 2,292.7
Total 943.7 1,292.1 57.6 2,292.7
Source: VFD

Talle 193: VANUATU: LSP & IPP PLANTING BY YEAR & SPECIES
LSP ha. IFP ha. Total ha. Cum. Total ha.Cordia Pinus Cordia Pinus Cordia Pinus Cordia Pinus Total
1975 21 2 21 2 21 2 231976 11 11 32 2 341977 12 12 44 2 461978 27 10 27 10 71 12 831979 47 14 47 14 118 26 1441980 138 5 23 143 23 261 49 3101981 114 2 12 41 126 43 387 92 4791982 197 4 49 45 246 49 633 141 7741983 102 30 121 132 121 765 262 1,0271984 231 26 43 120 274 146 1.039 408 1,4471985 117 15 44 120 161 135 1,200 543 1,7431986 3 24 160 27 160 1,227 703 1,9301987 0 0 na na na na na na 2,0691988 0 0 na na na na na na na
Source: VFD

Table 194: VANUATU: PLANTATION LOG PRODUCTION PROJECTIONS TO 2008
Cordia PinusLSP IP LSP IFP
Area Vol m3 Area Vol m3. Area Vol m3 Area Vol m3
1996 21 6,300 0 0 0 0 2 S001997 11 3,300 0 0 0 0 0 01998 12 3,600 0 0 0 0 0 01999 27 8,100 0 0 0 0 10 2,6002000 47 14,100 0 0 0 0 14 3,6002001 138 41,400 5 1,500 0 0 23 6,0002002 114 34,200 12 3,600 2 500 41 10,7002003 197 .59,100 49 14,700 4 1.000 45 11,7002004 102 30,600 30 9,000 0 0 121 31,5002005 231 69,300 43 12,900 26 6,800 120 31,2002006 117 35,100 44 13,200 15 3,900 120 31,2002007 3 90e) 24 7,200 160 41,6002008 na na na na na na na na

Table 195: VANUATU: LOG HARVEST, TRADE; SAWN TIMBER PRODUCTION & TRADE,1980-8
Log Vol m3 Production M3 Sawn Trade m3Total Export Process Veneer Sawn Export Import Consump.
1980 2,513 13 2,500 - 1,000 55 1,197 2,1421981 9,305 - 9,305 - 3,722 713 384 3,3931982 6,766 15 6,751 - 2,700 637 402 2,4651983 12,017 4,030 7,987 - 3,195 643 543 3,0951984 36,477 27,184 9,293 - 3,717 234 521 4,0041985 32,491 22,146 10,795 - 4,318 800 700 4,2181986 19,517 6,637 12,962 - 5,901 820 380* 5,4611987 39,237 23,716 15,521 na 8,018 1.163 na. 7,200*1988 22,427 5,001 17,426 400 9,002 1,673 na. 7,709*
o Only value data is available from 1986. The import shown for 1986 is anestimate based on the assumption that prices had risen by 10Z and the productmix was constant. It is claimed ( D. Wood, pers.comm.) that import of oregon,radiata and caribbaea are continuing. On the basis that building approvalsfor the first half of 1988 were running at higher levels than any time since1983 it is probable that imports have not declined significantly. Theapparent consumption figures are calculated using this assumption.
Source: VFD records and Statistical Bulletin Q2, 1988, National Planning andStatistics Office.

Table 196: VANUATU: LOG EXPORT VOLUMES AND FOB PRICES 1987-1988
1987 1988Destination - No.< 1 m3 USD/m3 No. m3 USD/m3
Japan 6 13,148 73.8 2 3,857 79.5R.0.K. 4 6,298 76.0 1 2,050 61.4

Table 197: ACTUAL & PROJECTED HARVEST & EXPORT VOLUMES FROM VANUATU'000 m3 (woodchips '000 BDU)-
LOG HARVEST EXPORTNat. For. Plantation Logs Sawnwood Veneer Woodchips.
1980 2.5 negl. 0.05 - -1981 9.3 - 0.7 - -1982 6.8 negl. 0.6 - -1983 12.0 4 0.6 - -1984 36.5 27.2 0.2 - -1985 32.5 22.1 0.8 - -1986 19.5 6.6 0.8 - -1987 39.2 23.7 1.2 - -1988 22.4 5 1.7 - -
Cordia Pine91-95 300{2} - 300t2} - - -
96-00 100(1} 7.7 1.3 100(l} - - -'01-05 7 55.3 19.9 _ ?{3} 7(1.2] ?[1.2]'06-10 ? 28.2 36.8 - ? ?'11-15? 7 ? ? ? ?'16-20 ? 7 ? ? ?
(11 Projections are based on the actually established plantations withrotations of 20 years. Due to uncertainty about the future extentof plantation programmes no estimates beyond 2007 are possible.Scarcity of funds and availability of land is supposed to create ahiatus in timber availability beyond 2008; thus long term sawnwoodor veneer exports are doubtful
(2) A newly approved concession operation will probably allowunrestricted export. So the natural forest (gross stocked volume ofabout 2 mill. m3) could be entirely depleted within a few years.
(3) Cordia alliodora tests as a sliced veneer in New Zealand did notbring good results. Cameron (1989) expects it to fall into the lowto medium species price range, suitable for panelling or mouldings.

Table 198: INDIAN TARIFFS ON WOOD PRODUCTS*
Indian TariffProducts I (BTN)
Wood Chips 4A.01 0**
Logs 44.03 10**
Railway ties 44.06 69
Lumber 44.07 10**
Veneer 44.08 10**
Hardwood Flooring 44.09 60
Mouldings 44.09 - 60
Lumber 44.07 10**
Fibreboard (MDF; hardwood,insulating board 44.11 100
Mouldings 44.09 60
Particleboard 44.10 60**
Plywood(Softwood) 44.12 60(Hardwood) 44.12 60
* India also applies a 402 auxiliary duty and an additionalexcise duty on must products (not on chips, logs, lumber,or veneer) but enforcement is unclear. Also, the majorityof imports need to enter under specific import licenses.
** Tariffs reduced in May 1985; these products enter under'Open General License", i.e., no specific license isrequired and payments are made in foreign currency insteadof Rupees.
Source: Adapted from NFPA, June 1986 "Tariff Rates as of Mid-June, 1986.

T*AkI±.Iff: IUFEZGI COSTS (US$/ma)
Vtrket - SIGAPOE HOW KONG TArN S.KUEA JAPANSourc./ Lose Lumbr Panels Log Lumber anels Les Lumber ftaeie Chips Log Lumber Panels Chips LIog Lumber Proal- Chips
Sabah 18-21 S0 26-2S 2Si-S0 2833-35 40 1432-34
Sorowak 24 32 28-S0 36 36-39 4634-36
Pap.Noe 0C'a 30-35 60 66 80-35 66 65 29-31 66 33-95 6S 6 34-36 80 8065
Soloon l-lands 60 60 B6 66 35 65 65 34-36 0036-38
fiji 62 66 63 63 23
USA V*et Coast 32 40 66 35 80-0 17USA South East 26 28
Austrul I. 1S 17
tisinen Island 26-26
Now Zealand 29-81 65 22 31-33 60 70 82 60 26
Indone-ia 20 16 80 20-22 30 20-22 40 20-22 46 21-23
N.D. Freight rat" *re thJos ruling Harch-Juno 198.
Source: Caeron, 1O8e; Industry sources (per.coes.); Chandler Fraser Kestine dtabases.

Table 200: SAWN TIMBER & PLYWOOD FREIGHT RATESTO THE U.S.A., 1989
Sawn Timber USSIm3
From Asia to US West Coast 42-59From Asia to US Gulf 54From Asia to US West Coast (teak) 85From Africa to US West Coast 230From Latin America to US West Coast 95From Latin America to Gulf (from- Peru) 95
Plywood US$/MBF
To US Gulf from Taiwan 11.00To US Gulf from Hokkaido 13.55To US Gulf from Brazil 27.65To US.Gulf from Eastern Europe 9.00To US Gulf from Far East 10.50To US West Coast from Far East 11-12.00
Source: CINTRAFOR, 1989

Table 201: FtJI: OVERSEAS FREIGHT RATES
Destination Package Rates
Rotterdam/Hull/Hamburg FCL US$ 1,650LCL US$ 75/m3
US west coast FCL US$ 2,100LCL US$ 51.47/m3
Japan FCL US$ 900LCL US$ 62.5OIm3
Aust Masterpack F$ 1,450US$ 1,051
NZ Masterpack F$ 1,330USS 964
Mid east FCL US$ 3,500-3,800
N.B. Data for PNG indicates an additional port charge for theports mentioned which constitutes a cost of delivery to theport, but is in addition to the normal wharfage and handlingcharges. These rates are US$ 6.28/m3 for FCL and US$9.28/m3for breakbulk.
Volume of masterpacks varies but shippers in Fiji indicate20-22 m3/container. This is high, but is probably a reflectionof the lower average density of timber being handled fromFiji.

Table 202: PNG: SHIPPING COSTS
Coastal Freight Rates
Lae - Port Moresby K 38.50 + K 12 port rhargesWestern and Gulf Provinces - Pt. M'by X 44.00 + K 12 port chargesWest P.-Pt.M'by(no betth at loading point) K 60.00Vanimo - Lae K 32.00Vanimo - Pt. MHby (trans-shipped) K 90.00Rabaul - Pt. M'by K 44.00Kieta - Pt. M'by K 50.00Madang - Wewak K 45 00Madang - Lae ( delivered in-store Lae) K 22.00
Overseas freight rates
PNN - AustraliaSydney FCL/masterpack AS 1,900Melbourne A$ 1,700Burnie A$ 1,800
Kimbe - Brisbane K 72/m 3PNG - New Zealand FCL K 1,150-1200
33 K 63/m 3PNG - Japan FCL/BB US$ 80/m 3PNG - ROK FCL/BB USS 65/m 3PNG -USA PNW FCL USS 3,300
LCL USS 125/m 3PNG - Singapore/Hong Kong FCL USS 900
LCL USS 55/m 3PNG - Hull/Hamb./Rott. FCL USS 1.650
LCL USS 65/m 3
"Sydney" means discharged at Newcastle and carried to Sydney by road.N.B. The European ports apply a special charge, above normal discharge costsat a rate of USS 6.28/m3 for FCL and USS 9.28/m3 for breakbulk cargoes. Theseare payable by the consignee.
Wharfage on coastal cargoes are a standard K 1.45 per m3 in and out.
Wharfage on overseas cargoes are K 4.80 in and K2.90 cut.
Storage charges (Ports Authority) are:outward cargo 7 days free then K 0.50/m3/dayinward cargo 4 days free than K 0.75/m3/day

4~~~~~~~~~~
Tablo 203: EXCHANGE RATE MOVEMENTS 1970 - 198 (SUS B.*.)
FIJI PNO SOLOMONS VANUATU PHILIPPINES MALAYSIA INDONESIA KOREA SINGAPORE JAPAN TAIWAN
1970 .8709 .8929 .8929 100.99 6.9044 3.0B12 U82.83 310.66 3.0B12 380.00 -1971 .8586 .8S17 .8807 98.80 6.4317 3.0S23 591.88 847.16 3.0W0? $49.33 -1972 .8246 .8387 .8373 81.81 8.8748 2.6198 416.00 392.69 2.8126 303.17 -1973 .7937 .7029 .7041 72.04 6.7653 2.4433 416.00 398.32 2.4674 271.70 -0974 .8064 .8947 .6981 77.60 6.7879 2.4071 416.00 404.47 2.4389 292.08 -1976 .8210 .7832 .7839 89.21 7.2479 2.3938 416.00 484.00 2.3713 298.79 -1978 .8989 .7923 .8183 77.24 7.4403 2.6418 416.00 484.00 2.4708 296.66 -1977 .9170 .7911 .9018 79.41 7.4028 2.4613 416.00 484.00 2.4394 268.61 -1978 .8487 .7084 .8737 72.94 7.3868 2.3180 442.06 484.00 2.2740 210.44 3e.001979 .8368 .7118 .8880 I8.78 7.3778 2.1084 823.08 484.00 2.1748 219.14 38.001980 .8176 .8704 .6298 08.29 7.6114 . 2.1769 628.99 807.43 2.1412 228.74 38.001981 .8632 .8724 .8702 87.83 7.B997 2.3041 031.78 881.03 2.1127 220.64 38.001982 .9317 .7376 .9711 98.21 0.6400 2.3364 881.42 731.08 2.1400 249.08 38.001983 1.01B1 .8341 1.1488 99.37 11.1127 2.3213 909.28 776.76 2.1131 237.61 40.001984 1.0611 .8942 1.2737 99.23 188987 2.3438 1,026.94 806.98 2.1331 237.62 40.001986 1.1628 1.0000 1.4808 108.03 18.8073 2.4830 1,110.68 870.02 2.2002 238.64 40.001986 1.1320 .9713 1.7416 108.08 20.38N7 2.6814 1,282.56 881.45 2.1774 188.62 37.801987 1.223S .9081 2.0033 109.86 20.6877 2.6198 1,843.86 822.67 2.10B0 144.84 29.201986 1.4298 .8887 2.0826 104.43 21.0960 2.8188 1,886.70 731.47 2.0124 128.16 28.30
Source : International Monotary Fund International Financial Statistics 1989

TA Ia, 204: CN4R#M URICE IlCICES 1970-S
FIJI FM SOL006 VANUAW IL tIPpoS NALAYSIA PONESIA KIJA SI4MAPW JAPAN USAEnd.. I End.: * Index I lJde, I lode I lode. S .Index * End.. * Indd. x Index S R2Ind. s
1970 S8.80 25.60 a6.40 20.00 22.20 5S 50 42.S0 47.101971 40.00 6.53! 45.80 47.10 90 00 21.18 57.30 1.6 20.60 4.00 25.20 13.61J 64.40 1.68! 45.00 6.38S 49.10 4.2511972 44.50 9.071 48. 10 6.S1 50.40 7.01% 38.50 6.41! 59.20 8.825 22.0 6-78S 20.10 11.51 55.70 2.39S 47.20 4.09 50.80 eD S.41978 49.50 11.24X 52.10 .821 52.00 s.17n 89.00 16.425 65.40 10.47X 29.00 80.68 29.00 .201 66.50 10.391 62.70 11.655 53.90 6.1011974 66.70 14.65! 64.20 28.221 11.60 16.8s5 52.80 84.10 76.80 17.48S 40.90 41.081 86.10 24.401 61.40 22.415 65.00 23.345 s.e80 10.0611975 64.10 18.055 70.00 10.441 66.00 10.08X 65.90 6.661 80.20 4.48S 48.60 16.6S 45.20 25.21X 03.60 2.70! 72.60 11.691 65.80 9. 201976 71.40 1t.391 76.80 7.2 70.90 4.26X 76.70 61.00 9.12 82.80 2.621 56.80 1O.96 52.10 10.27! 62.30 -1.561 79.40 9.37S 69.10 5.811977 76.80 7.56! 79.70 4.46S 71.o00 C. 01.10 6.741 67.10 10.00o 86.20 4.741 64.70 IO.96S 57.40 10.1I1 64.60 2.79! ".690 0.191 78.60 6.51S1s7 81.40 8.99 64.40 6.01S 1.80 6.231 8.80 6.412 72.00

Table 205: EUROPE: REMOVALS BY COUNTRY GROUPmill. m3
1980 1988
Nordic countries 103.8ECC(9) 91.1Central Europe 16.6Southern Europe 59.6Eastern Europe 79.5
EUROPE 350.5 367.5of which:- Coniferous 227.9 240.7- Non-coniferous 121.8 126.8
Table 206: EUROPE: LAND AREA AND FOREST RESOURCES ca. 1980, BY REGIONmill. ha. & mill. m3 o.b. (GS), mill. m3 u.b./ann. (incr.)
Forest Exploitable closed forestLand & other Area Growing Net TotalArea wooded Stock Annual Removals*
areas Increment
Nordic countries 112.4 59.9 48.3 4,407 146 103EEC(9) 150.7 34.5 27.8 3,565 128 82Central Europe 12.2 4.9 4.0 1,109 25 19Southern Europe 179.8 66.6 27.1 2,582 93 60Eastern Europe 96.8 28.0 25.8 4,278 113 78
EUROPE 551.9 193.8 132.9 15,941 505 341
* Recorded removals from all sources (not only exploitable closedforest). Southern Europe includes Albania.

Table 207: EUROPEAN FORECASTS OF WOOD REMOVALS IN 2000BY REGION & SPECIES GROUP
mill. m3 u.b.
Base 2000(1980) Low Z increase High Z increase
Nordic countries 103.8 109.8 + 5.7 130.1 + 25.3ECC(9) 91.1 101.1 + 11.0 114.7 + 25.9Central Europe 16.6 19.9 + 19.9 21.8 + 31.3Southern Europe 59.6 77.1 + 29.4 82.3 + 38.1Eastern Europe 79.5 82.8 + 9.7 89.2 + 12.2
EUROPE 350.5 390.8 + 11.5 438.1 + 25.0of whichs-Coniferous 227.9 256.4 + 12.5 289.2 + 26.9-Non-coniferous 121.8 134.4 + 10.3 148.9 + 22.2
Source: ETTS IV, Table S.4
Table 208: YIELDS AND PRODUCTION COSTS FOR PULPWOODIN SELECTED COUNTRIES
Production Costs Average yieldsUSS/tonne m3Jyear/ha
Brazil (1) 245 25.0 (2)USA (South) 272 15.0Canada 295 5.0Portugal 305 10.0 (2)Finland 357 5.0Spain 368 10.0 (2)Sweden- 388 5.0France 426 7.0
(1) In some plantations (Aracruz, a.o. ) yields are coming up to50m3lyear/ha and more through the use of modern silviculturalmethods (cloning, etc.). As a result costs are reduced to about 200US$/t.
(2) Eucalypts
Source: Compiled by CMF

S * S
Table 209: INDIAN SUBCONTINENT FOREST STATISTICS
Forest Total Conifer Non Conifor Forest as X Ave. Annual Ave. Annual fat ChrngeThousand Ha Forest Area Closed Forest Closod Forest Other Total Land Arao Forost Lose Forest Renowl Forest
India Subcontinont
Bangladesh 2,207 B20 2,207 16.8 9 9 1Bhutan 2,210 4,937 1,684 47.0 2 1 -IIndia 77,914 433 07,684 6,39a 28.7 147 120 -27Nopal 2,308 1,326 1,696 180 16.4 84 2 -82Pakistan 4,080 68 2,480 296 6.1 7 7 0Sri Lanka 2,702 2,726 42.4 26 10 -16
India Subontinmnt 91,601 7,879 78,276 9n8 26.0 273 149 -124

Tab*210: ?II4 5UBCOTIOM R0U'M00 PR0OUTION PR0CUC. N AO TADE198447
T1ta I RudweodVoiul . .ruti..Znf1000 Cubic Weo,-r 1I'm I191 it T 1964 197M I986 1987
di ShCtin.ot
son lIda.b 26.401 V.I4 27,so840 2:18 20Ou. 3.224 3,224 3,224 3'Z14U44c 241.140 148,319 280, 28 254,263 2 27 408 8Y7Naeal 18,41 18,778s 16.127 18,479Ptai sun 20,1 8 20.94? 21,318 21.885 17 i8 32 32Sri Lani,. 8,86 8,890 8.667 8.814
India hcwtint0 315.024 322,000 327,829 333.197 44 45 438 8"
World 3,12,026 3,1,M277 3.254.392 3.312,447 111,214 113.2 116C,882 124,480
India Subcontin.nt 10 10 10 10 0 0 0 1s of World Total
Ttea I Ra,.ndu.d
Vel _ hx~~~~~E.ort Net1000 Cubic e .t.~r 1984 1911 lWS6 1987 1W4 lWe 198S 1W7
DIdia Subcont,ntnt
Bangladesh 2t,488 27,144 27,840 28.362am"".. 7 7 7 7 3,217 3.217 3.217 3,217India 22 16 76 76 241,143 248,330 280,56 255,084I4eaI i26 126 126 126 18,309 1S,680 16,001 16,353Paki ot*n 20.173 20.968 21,427 21.887Sri Lanka 190 48 33 33 8.306 8,844 8,684 8,781
India Subcontinent 345 191 242 314,723 321,880 327,725 333,414
World 103,249 100,264 106,84t 117.4tl 3, 15 991 3,16e,857 3.264,42S 3,359.494
ndia SubcOntinaot 0 0 0 0 10 10 10 10world Ttal
m100 Cubic mater* 1984 1983 1986 164 1968 1,988 1C87
India Subcotin.ot
h..glad.h 28,483 27,144 27 840 28,562Shutan 3.224 3,224 3.224 3,224India 8,894 9,132 9,245 9.359 221.974 226,717 230,361 234.088Nal 10 120 120 12 0 o is 171 1S.S12 1.857 16,209Pulat. 1.,169 1,233 1,255 1'278 18,487 19,714 20.140 20,S77Sri Lank* 8.394 8S.42 8s.69 8,766
India Subentin.nt 10,183 10.48 0 10,10 10,757 294.233 300,853 306,061 311.406
World 1,248,819 1,254,000 1,305,357 1,3511665 1,761.3t7 1,384,268 1,87.346 1,879,110

Table 211: AREA OF FOREST AND OTHER WOODED LAND IN MIDDLE EASTERN COUNTRIES
Total ForestS Other Wooded Land Closed Forest Other Wooded Land
Share of AreaTotal Land per of which: of which:
Area Area caput Area Conifer Area Conifer(1,000 ha) '000 ha. 000 ha.
Iran 12,400 7.5 0.35 1,900 20 10,500 2,500Iraq 1.910 4.4 0.12 30 20 1.880 80Israel 100 4.8 0.02 80 55 20 10Jordan 82 0.8 0.02 54 18 28 10Kuwait 15 0.8 0.01 - - 15 15Lebanon 85 8.2 0.03 35 10 50 15Saudi Arabia 1,200 0.6 0.10 - - 1,200 600Syria 420 2.3 0.04 90 40 330 10Utd. Arab. Emir. 3 - - 3 - - -Yemen A.Rep. 2,500 12.8 0.37 _ - 2,500 -
Yemen D.Rep. 1.600 .4.8 0.75 - - 1,600 -
TOTAL 20,315 3.9 0.19 2,192 163 18,123 3,240
Source: FAO World Forest Resources 1980.

Table 212: REPORTED ROUNDWOOD REMOVALS IN 1987 IN MIDDLEEASTERN COUNTRIES
Industrial Woodof which: Coniferous
Total ShareShare of total
Change of total industrialVolume on 1976 Volume removals Volume wood'000 m3 (2) '000 m3 (Z) '000 m3 (2)
Iran* 6,769 + 2 4,376 65 - 0Iraq* 143 +17 50 35 - 0Israel* 118 0 107 91 62 58Jordan* 10 - 1 4 40 - 0Lebanon 493 + 1 25 5 17 68Syria 48 +18 34 71 8 24Yemen. D. Rep.* 306 +25 - 0 - 0
TOTAL 7,887 + 3 4,596 59 87 2
Source: FAO Yearbook of Forest Products 1989.
*Ujnofficial figures or estimates.

Table 213: SELECTED f.o.b. PRICES OF AFRICAN TROPICAL LOGSIN EUROPE, 1981-87
US$/m3
Azobe Dibetou Makore Obeche Okoume Ozigo Sapele Sipo* Cameroon Ivory C't Congo Iv.C'st Gabon Gabon Cameroon Iv'y C'st
1981 71 136 149 98 178 122 212 2281982 61 116 128 95 147 95 175 1941983 72 104 113 84 127 78 161 1991984 66 99 104 79 112 69 175 2001985 82 97 116 80 127 85 173 1951986 110 152 154 141 166 105 224 2311987 126 175 180 167 190 113 250 266
Source: Marches Tropicaux et Mediterraneen. Paris/France
Table 214: SELECTED f.o.b. PRICES OF MALAYSIAN TROPICAL LOGSIN JAPAN, 1980-7
US$/m3
Meranti Seraya Keruing Keruing Seraya 2ndSarawak Sabah Sarawak Sabah Sabah
1980 - 165 - 140
1981 - 136 - 116
1982 112 112 - 951983 o0 97 - 791984 113 115 - 90
1985 75 86 64 69 891986 92 97 72 74 951987 130 - 111 101 119
Source: Marches Tropicaux et Mediterraneen, Paris/France

Table 215: TROPICAL iARDWOOD LOG PRICES FROM WEST AFRICA(c.i.f. European continental port, in USSIm3)
Species Price
Obeche/Wawa/Samba/Ayous 325 - 345Sipo/Utile 340 - 375Sapelli 380 - 405Moabi 340 - 370Iroko (free of sapwood) 275 - 305Azobe 175 - 195Tola 250 - 270Wenge 475 - 630Longhi 395 - 450
(1) Quality: FAQ resp. L M M (ex former French territories)

Table 216: FPO.B. PRICES a fREI@T ftATES. PACIFIC ISWOS
aport. Product-. Freight Rate toCountry ~a Sawnuod Veneer and Plywood ood-ips Rotterdam/Hlul/
U#Jds US1/m US6/d US6/t
Hamburg (7)
Fiji 1987:(1) 0 75.-- 19087 (4): 0 (260) 1907: 1987 (4): (7) FCL (): 11# 1650/cot.,980; Veneer: U62 (370) (4.6) (e. caribb.a) LCL (9) U. 75/mSHardwood to Australis. Plywood; 510 (519) (4)R/S XD dreaming grade 376 1989Pine (cii) to AuaLrnlina Veneer fac rad: 9W00-1000A/$S iD Scantling 751) 246-293 (minly Lo North America
Board (25) 232-326 l*ea to Australia.
INI1 1987: 0 8005 1986 (740S .3 0 248 Veneer no auports 1986 691988: 0 78.77 190? (4800. 0 290 Plywood: lost *eported 1087 106 FCL: U51650/cont.
Species (2) 11 S3.81-148.52 1908 (1500 a 0 a3n () itn 1986 432 (hardwood froe- Po_etin f(29.0) 94.80 natural foreot) LCL: uaSS 65/d
- *lpluN (7804 96 71- li 6 12) 56.62 Loa f!eih
- Teralalin (4.91) e0.00 rate-. 98 - 45/AS (10)
Solomon 19O8 0 49.10 1985 0 206Ialands 1987: 0 63.00 1987: 0 271 FCL: USS 165I/cont.
1988 0 64.00 4/80 (rough *nan ehipping)c1989 (3) for Posetia/Calop. to NZ 197-205 LCL. US 6S/mS- Poeti a (28.01) 120 Poatia/C.loph to Au. 244-261- Calophyllum(20.016)110 Tersinalia brown - Aus 239 fright rat*- Palaqulua (1.01) 150 Palaqulus to Au. 273-356 4S/dl (10)
Amors to Au- 299-300
Vanuatu 1987: 0 75 1980: 0 2441988: 0 73 (but wide ranga ot prices) FCL: USS 1650/cnt.
LCL 1U1S 65/c3
Source. Caeron, 1909
(I) O averae* valu, of all epecle. and grad.s2 cu- lIn tout
S Thnee estimate by Cameron (1989) could b too high copnard to fob pricen for logo In FMP 1980 and the fect that fob pricein Sl traditionall yarm lower than in PNO4
(4) oat t hg n from Huntoer 1909) in brachet-, converted to tS6 ucing historical * chang. rates. when necesary.(5) Thn;ncreas of sawncd pricna is maanly due to devaluation of the Kinn vs. LS. There hna ben a significant decline in**part vOiuIIF (especially to Jnpsn).
( There are confi ctin Jot& on * o b. prig*& 1987 from Hnter an4 Comran (1989) probil becaus- of diff/r nt sureon.lb* ThEuropen porto apply a apoeinl charg, above normal di chere costs at a rnt- sf" VS.*28/*9 for fCO and US11 0 28/a3 forhCL caoca.n a charge ar payable by the conaigns
(8) fCL - full container loads atoag rat" ry beteeen 10 and 22 3 per 20 - Standard container dApending on type anddienaion of product and attention paid to th etonage by ahippera.LCL * lee. than a container load.
0) Current lot freight rate. to Europe core not available but Ca-eron (1909) a*sunos the, Lo differ only a little from the ratesto Indin.
(11) Stewage rate. in Vanuatu arm suspected to be very peor (12 d3/20 container) which would make the ehipping at FCL rate, veryeapeneiv.

Table 217: SELECTED F.O.B. PRICES OF TROPICAL SAWNWOOD FROMSOUTH-EAST ASIA
US$ /m3
Increase1981 1982 1983 1984 1985 1986 1987 2
Dark Res MerantiGMS fob Singapore 234 241 244 232 289 311 329 40Ramin Sel + Upfob Singapore 251 291 267 271 263 195 402 60KapurGMS fob Singapore 170 172 167 172 161 162 168 -MerantiAv. fob Price Indonesia 161 150 151 144 144 157 182 13RaminAv. fob price Indonesia 103 189 192 177 144 168 220 112Dark Red Meranti GMSSel & Btr. fob Pen. Malaysia 212 222 238 224 182 215 238 12Merbau/Intsia GMS Sel & BtrPen. Malaysia 203 190 225 265 259 249 246 21Light Red MerantiGMS Sel & Btr Pen. Malaysia 170 163 177 194 166 173 189 11
Source: FAO 1987

Table 210: D IRT STATIStICS OF TROPICAL SADN 8t SPEClS OF SELECTiD 8A0PEX COtItRIESJanuvryJune 1900
Scn Fro Cra w *1i j2 t 1 Total Total Aver*agStec leS ...1J81.9111LLM15..3. 3..LL... I.ZU...j 2 vahue. Value value0010 m3 us ill Utss/s3
Sleeper. 0.16 3.02 297 2.18 0.6 257 - - 0.18 0.06 33 12.62 3.64 291Stumpd anod 0.92 0.41 446 1.74 1.86 366 8.12 2.79 0.94 10.18 7.67 747 2.65 1.40 604 6.24 5.04 800 24.72 10.99 162!uldine and ould 0.17 0.25 1,470 1.04 1.116 I,1S 0.12 0.23 1.38 0.71 534 8.03 2.67 8W1 5.69 5.02 022Sttipe_I __/ _ 0.92 0.41 446 1.67 1.43 911 2.00 1." 783 10.03 7.95 738 1.92 0.78 639 3.21 2.37 738 19.03 13.9? 734Sawnwood
Cded-e s tropical 123.93 43.00 352 183.70 87.89 389 198.69 78.00 397 201.53 91.93 456 268.80 00.10 320 293.36 140.46 475 1,270.12 510.82 402l"ornti so 114.49 39.5S 346 150.2S 55.00 986 182.60 71.88 391 188.17 76.61 456 23.71 78.C5 321 201.50 83.22 416 1.065 62 403.42 379U,hit. L,.IsII- - - - - - - - 33.40 7.02 210 33.4 7.02 210Raeuc - - - - - - - _ - - - - - - - 14.1S 6.58 465 14.16 8.58 465Toak - - - - - - - - 4.25 3.82 852 4.25 3.62 852Other eg - - - - - - -77.80 34.07 438 77.0 34.07 438Ok*ufe/Az4 .p 7.97 3.45 438 29.55 11.11 374 12.98 6.86 439 31.98 14.55 455 29.21 10.97 876 38.33 19.77 616 149.96 05 57 437Axoeb 1.78 0.75 434 - - _ _ _ _ _ - - 11.70 4.33 388 - - - 13.51 5.08 316Sepell. - - - - - - _ - - - - - - - 3.05 1.72 564 3.05 1.72 S84Sipo - - - - - - - - - - - -v - 4.50 2.89 642 4.5 2.09 642Iroko 8.86 3.73 421 8 86 3.73 421Ot6-r ok - - - - - - _ _ - - - - - - - 10.57 8.71 526 16 57 8.71 6268eboun/sahp 1.47 0.59 401 0.87 0.40 637 3.26 1.77 645 1.38 0.77 558 0.96 0.40 500 53.50 38.46 681 61.23 40 43 660Iaho"ny - - - 61.1S 84.86 601 51.15 34.85 6"1Other Oab 8p - - - -. - - - - - - - - - - 2.35 1.61 685 2 35 1.6t 686Naanen - - - 1.20 0.47 373 _ - _ _ _ _ - 1 26 0 47 373Frasiru - _ - 2.05 0.95 463 - - - - - - - - - - - 2 05 0 95 463
(13 Volume '000.* - Cit Valueo US$ illion 3 - Cit Value USU paer
Source: FAO 1988; ECL/FAO 1988
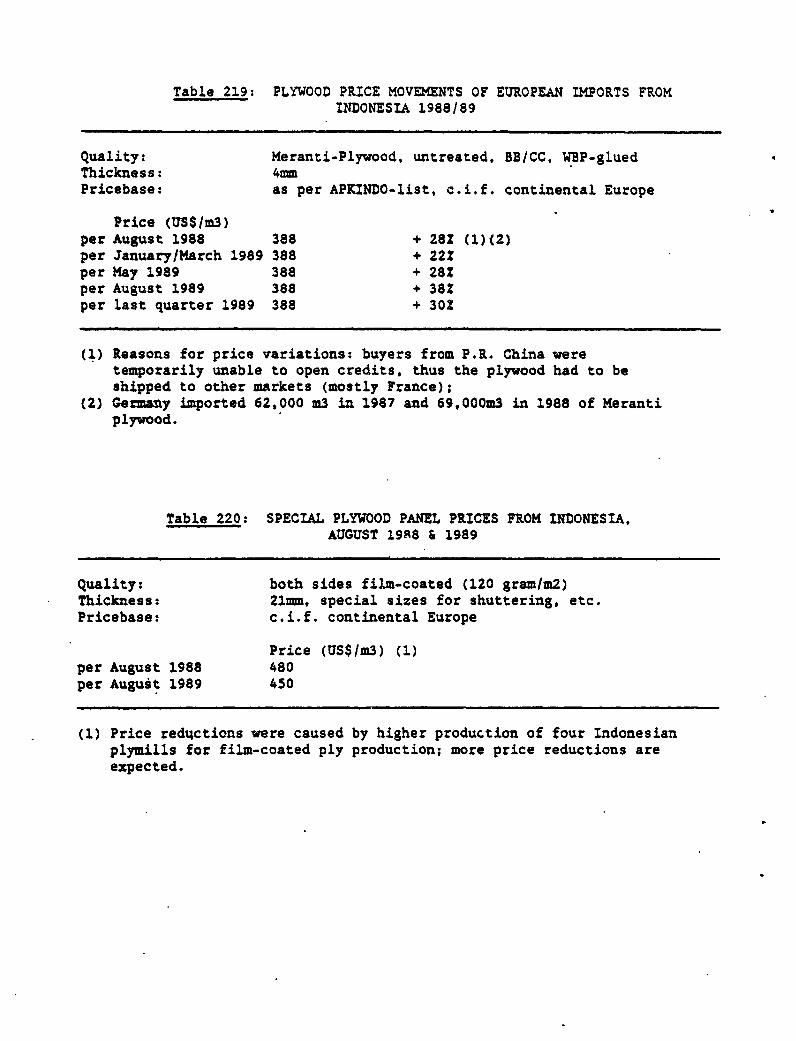
Table 219: PLYWOOD PRICE MOVEMENTS OF EUROPEAN IMPORTS FROMINDONESIA 1988/89
Quality: Meranti-Plywood, untreated, BB/CC, WBP-gluedThickness: 4mPricebase: as per APKINDO-List, c.i.f. continental Europe
Price (USS/m3)per August 1988 388 + 282 (l)(2)per January/March 1989 388 + 222per May 1989 388 + 282per August 1989 388 + 38?per last quarter 1989 388 + 302
(1) Reasons for price variations: buyers from P.R. China weretemporarily unable to open credits, thus the plywood had to beshipped to other markets (mostly France);
(2) Germany imported 62,000 m3 in 1987 and 69,000m3 in 1988 of Merantiplywood.
Table 220: SPECIAL PLYWOOD PANEL PRICES FROM D ONESIA,AUGUST 19A8 & 1989
Quality: both sides film-coated (120 gram/m2)Thickness: 21mm, special sizes for shuttering. etc.Pricebase: c.i.f. continental Europe
Price (USS/m3) (1)per August 1988 480per August 1989 450
(1) Price reductions were caused by higher production of four Indonesianplymills for film-coated ply production; more price reductions areexpected.

Table 221: SUMMARY OF WOODEN PRODUCTS IMPORTED BY GERMANY (FRG) IN 1986
Product Volume ValueGroup '000 m3 Z US$ mn. Z
1 Sawnwood 4,447 45.9 1.042 21.62 Veneer and Boards 2,092 21.6 987 20.43 Roundwood 1.486 14.3 279 5.84 Furniture 944 9.7 1,888 39.15 Profiles 332 3.4 97 2.06 Furniture Parts 102 1.0 164 3.47 Construction Elements 93 1.0 105 2.28 Other Semi-Finished Prod'ts 101 1.0 72 1.59 Doors 46 0.5 46 1.010 Interior Decoration Elem'ts 15 0.2 21 0.411 Parquet 16 0.2 21 0.412 Mouldings 9 0.1 20 0.413 Household Goods 11 0.1 16 0.314 Windows 4 - 22 0.515 Frames 3 - 14 0.3
Total 9,701 100.0 4,826 100.0

Table 222: SPECTRUM OF ASCENDING VALUE ADDED IN EUROPEAN IMPORTS
TUS$/m3 US$/m3 RWE
- roundwood 100 - 170 100 - 170- rough savnvood 280 - 300 155 - 165- plywood 400 - 450 160 - 180- construction elements 470 - 1,000 210 - 450- parquet 1,100 - 1,380 440 - 450- furniture parts 1,100 - 1,500 440 - 600- household goods 1,200 - 1,350 480 - 540- mouldiags 1,500 - 1,900 600 - 7.60- furniture 1,800 - 2,200 720 - 880- doors and windows 1,900 - 5,000 760 - 2,000
Source: Kehr, 1989

Table 223: C & F LOG PRICES JAPANUS$Sm3
Source f.o.b. C & FCountry Species Price Freight Price
Japan Cedar 187Cypress 474
Sabah Lauan FAQ 120-125 32-34 155Lauan SQT 130-135 32-34 165Keruing 117 32-34 150Albissia 23-37 32-34
Sarawak Lauan FAQ 120 34-36 155Keruing 120 34-36 155
USSR Larch N.A N.A 80Fir N.A N.A 123
New Zealand P. radiata 'A' 53 32 85
USA D.Fir No.3 101 32 133Hemlock No.3 88 32 120
Papua New Guinea Kwila 149 34-36 184Callophyllum 97 34-36 132Taun 94 34-36 129Basswood 69 34-36 104Mixed light hardwood 80-90 34-36 120
Solomon Islands Taun high grade 120 30-38 157Callophyllum high grade 110 36 38 147Mixed light hardwood 80-90 36-38 122
N.B. Some freight rates have been estimated to provide comparative C&F prices.Prices are those ruling out May-June 1989 unless otherwise stated. Prices wereobtained from a variety of sources, but predominantly through direct contactwith importers and consumers. C & F price points imply a range of about 1 5X.Log prices for Vanuatu and Fiji are not included as recent trading has beeninsignificant.
.

Table 224: C & F LOG PRICES - KOREAUS$/m3
Source FOB C & FCountry Species Price Freight Price
Korea Pine (pulp) 60
Sabah Lauan FAQ 120-125 26-28 150Lauan SQT 130-135 26-28 160Keruing 117 26-28 144Albissia 23-37 26 56
Sarawak Lauan 120 28-30 149Keruing 120 28-30 149
USSR Larch Not ImportedFir
New Zealand P. radiata 'B' 26 31-33 58
USA D.Fir No.3 101 32 133Hemlock No.3 88 32 120
PNG Kwila 149 33-35Callophyllum 97 33-35Taun 94 33-35Basswood 69 33-35Mixed light hardwood 80-90 33-35
Solomons Taun 94 36-38Callophyllum 97 36-38Mixed light hardwood 80-90 36-38
Source: Cameron, 1989; Numerous industry sources.

Table 225: C & F LOG PRICES - TAIWANUS$/m3
Source FOB C & FCountry Species Price Freight Price
Taiwan Yellow cypress N.A 1,020Red cypress N.A 754
Sabah Lauan FAQ 120-125 21 0LauanSQ+ 130-135 21 0Keruing 117 21 0Albissia 23-37 18-21 50
Sarawak Lauan FAQ 120 24 146Keruing 120 24 146
USSR Larch Not importedFir
New Zealand P. radiata "B' 26 29-31 56
USA D.Fir No.3 Limited volumes onlyHemlock No.3
Papua New Guinea Kwila 149 29-31Callophyllum 97 29-31Taun 94 29-31Basswood 69 29-31Mixed light hardwood 80-90 29-31
Solomon Islands Taun 94 35Callophyllum 97 35Mixed light hardwood 80-90 35
Source: Cameron, 1989; Numerous industry sources.

Table 226: C & F LUMBER PRICES - JAPANUS$/m3
Source Species Specification FOB Freight C & FCountry Price Price
Japan Cedar green squares 449Cypress green squares 897
USA Hemlock green cants 169 35 204D Fir green cants 212 35 247Oak green sawn 264 35 299
Indonesia Yellow Meranti AD sawn 170 45 215White Meranti AD sawn 200 45 245
Malaysia Rubberwood RD sawn 173 40 213Ra4in KD sawn 205 40 245Lauan AD sawn 230 40 270
New Zealand P. radiata green flitches 120 50 170KD sawn 225 55 280
W. Africa Mahogany green flitches 400 70 470
PNG Mixed Species AD sawn 305* 80 385
Solomons Taun AD sawn 230-240 80 315Callophyllum AD sawn 230-240 80 315Gmelina AD sawn 200 80 280
Fiji P caribaea KD sawn 185 63 248Kauvula AD sawn 250 63 313Dakua makadre AD sawn 407 63 470Mahogany AD sawn 429 63 492
* Based on domestic prices plus port charges and freight.
Source: Cameron, 1989: industry sources; Chandler Fraser Keating database.

Table 227: C & F LUMBER PRICES - KOREAUS $Im3
Source FOB C &FCountry Species Specification Price Freight Price
Korea Pine Green sawn 120
USA Hemlock green cants 169 40 209D.fir green cants 212 40 252Oak green sawn 264 40 304
Indonesia Yellow Meranti AD sawn 170 40 210White Meranti AD sawn 200 40 240
Halaysia Rubberwood KD sawn 173 30 203Ramin KD sawn 205 30 235Lauan AD sawn 230 30 260Sepetir KD sawn 180 30
New Zealand P. radiata green flitches 120 50 170KD sawn 225 55 280
W. Africa Hahogany green flitches 400 70 470
PNG Mixed Species AD sawn 305 65 370
Solomons Taun AD sawn 230-240 65 300Callophyllum AD sawn 230-240 65 300Gmelina AD sawn 200 65 265
Fiji P caribaea KD sawn 185 55 240Kauvula AD sawn 250 55 305Dakua makadre AD sawn 407 55 462Mahogany AD sawn 429 55 484
Source: Cameron, 1989; Numerous industry sources; Chandler Fraser Keatingdatabase.

Table Z28: C & F LUMBER PRICES - TAIWANUS $1m3
Source FOB C & FCountry Species Specification Price Freight Price
USA Semlock green cants N.A N.AD Fir green cants N.A N.AOak green sawn N.A N.A
Indonesia Yellow Meranti AD sawn 173 30 203White Meranti AD sawn 200 30 230
Malaysia Rubberwood RD sawn 173 30 203Ramin RD sawn 205 30 235Lauan AD sawn 230 30 260
New Zealand P. radiata green flitches 120 50 170KD sawn 225 55 280
W. Africa Mahogany green flitches 400 70 470
PNG Mixed Species AD sawn 305 65 370
Solomons Taun AD sawn 230-240 65 300Callophyllum AD sawn 230-240 65 300Gmelina AD sawn 200 65 265
Fiji P caribaea RD sawn 185 55 240Kauvula AD sawn 250 55 305Dakua makadre AD sawn 407 55 462Mahogany AD sawn 429 55 484
Source: Cameron, 1989; Numerous industry sources.

Table 229: C & F LUMBER PRICES - SINGAPOREUS$/m3
Source Species Specification FOB Freight C & FCountry Price Price
USA Hemlock green cants N.A N.AD Fir green cants N.A N.AOak green sawn N.A. N.A
Indonesia Yellow Meranti AD sawn 180 20 200White Meranti AD sawn 210 20 230
Malaysia Rubberwood KD sawn 173 20 193Ramin XD sawn 205 20 225Lauan AD sawn 230 20 250
New Zealand P. radiata KD sawn 225 55 280
W. Africa Mahogany green flitches 400 70 470
PNG Mixed Species AD sawn 305 60 365
Solomons Taun AD sawn 230-240 60 295Callophyllum AD sawn 230-240 60 295Gmelina AD sawn 200 60 260
Fiji P caribaea KD sawn 185 52 237Kauvula AD sawn 250 52 302Dakua makadre AD sawn 407 52 459Mahogany AD sawn 429 52 481
Source: Cameron, 1989; Numerous industry sources (pers.comm.)

Table 230: C & F LUMBER PRICES - HONG KONGUS Slm3
Source Species Specification FOB Freight C & FCountry Price Price
USA Hemlock green cants N.A N.AD Fir green cants N.A N.AOak green sawn N.A N.A
Indonesia Yellow Meranti AD sawn 180 30 210White Meranti AD sawn 210 30 240
Malaysia Rubberwood KD sawn 173 30 203Ramin KD sawn 205 30 235Lauan AD sawn 230 30 260
New Zealand P. radiata 1D sawn 225 60 285
W. Africa Mahogany green flitches 400 70 470
PNG Mixed Species AD sawn 305 55 360
Solomons Taun AD sawn 230-240 55 290Callophyllum AD sawn 230-240 55 290Gmelina AD sawn 200 55 255
Fiji P caribaea KD sawn 185 55 240Kauvula AD sawn 250 55 305Dakua makadre AD sawn 407 55 462Mahogany AD sawn 429 55 484
Source: Cameron,. 1989; numerous industry sources.

Table 231: C.& F PANEL PRICES TO N.E.ASIAUS$/m3
Source C & FCountry Species Specification FOB Freight Price
JAPAN
Japan Lauan Formply 285Indonesia Meranti Form ply 258 21-23 280
2.4mm ply 408 21-23 430Lumbercore 18= 248 21-23 270
USA Softwood 16mm Particle board 129 80 209
SOUTH KOREA
South Korea Lauan Formply 27018mm MDF 280
Tndonesia Meranti Form ply 249 20-22 2702.4mm ply 400 20-22 421Lumbercore 18mm 239 20-22 260
New Zealand P.radiata 3.2mm Bison board 263 70 333USA Softwood 12mm particle board *102 56 158
Softwood 18mm MDF 297 56 2635.Smm MDF 367 56 423
TAIWAN
Taiwan Lauan Formply 270Indonesia Meranti Form ply 239 20-22 260
2;4mm ply 400 20-22 421Lumbercore 18mm 219 20-22 240
HONG KONG
lhdonesia Meranti Form ply 239 20-22 2602.4mm ply 400 20-22 461Lumbercore 18mm 220 20-22 241
SINGAPORE
Indonesia Keranti Fnrm ply 239 15 2542.4mm ply 400 15 415Lumbercore 18mm 220 15 235
Source: Cameron, 1989; Industry sources.

Table 232: C & F WOOD CHIP PRICES TO N.E. ASIAUS$/BDU
Source Specification FOE Freight C & FCountry Price
JAPAN
Japan Hardwood 238Softwood 147
USA - W. Coast D.Fir 125 40 165- S.E. Mixed Oak 85 70 155
Alder 124 70 194
uSSR Figures not available
Australia Eucalypts 118 42 160
Fiji P.caribaea 90 50 140
New Zealand P. radiata 90 55 145
Indonesia Meranti 53 30 83 (1)
SOUTH KOREA
South Korea softwood 70
Virtually no wood chips imported - eitherpulp logs or pulp.
TAIWAN
Taiwan Hardwood 200 +
USA - W. Coast D.Fir 125 65 190- S.E. Mixed Oak 88 65 153
Alder 124 65 189
Australia Eucalypts 118 37 155
Fiji P.caribaea 90 45 135
New Zealand P. radiata 90 50 140
Indonesia Meranti 53 30 83*
* Price appears very low and could not be verified.
Source: Cameron, 1989; industry sources.

Table 233: RELATIVE PRICES OF INDIGENOUS & IMPORTED HARDWOOD CHIPS,JAPAN, 1984
('000 yen/tonne; indigenous undez chip silo, imported in store)
Domestic Imported
Prefecture (north to south) Exporter
Hokkaido 28.3 Australia 22.6Iwate 25.8 U.S.A. 28.6Miyagi 23.8 New Zealand 25.4Akita 25.0 P. New Guinea 20-.2Gifu 22.7 S. Africa 23.3Kochi 25.0Kagoshima 24.4
N.B. No connection between Prefecture and Exporter
Source : Fenton, 1988
,

Table 234: SELECTED PRICES FOR SAWLOGS & SAWN TIMBER, PENINSULAR MALAYSIA,JAN.1989(MS/m3)
East Coast Central West Coast Export
Sawlogs:Heavy -Chengal 357 355 360Merbau 295 300 295
Medium -Keruing 220 222 223Kapur 214 215 217
Light -
DRM 282 280 282LRM 235 236 237Sepetir 185 185 188Rubberwood 26 26 26
Sawntimber:Chengal 635 637 635 509Merbau 640 644 646 774Keruing 410 413 416 360Kapur 420 425 420 341DRM 450 460 470 864L2M 400 405 410 775Ramin 656Sepetir 345 346 350 376Rubberwood 489 403
Source: Malaysian Timber Industry Board (MTIB), 1989

4
Table 235: SELECTED U.S.A. IMPOt.T PRICES
Lumber RW/L 414 MBF KD(FOB Warehouse Boston)Latin America
BanakMahogany (Honduras) Plain USS2,000-2,1Q0
Asia FAS t1 cornDark Lauan USS1,550-1,600 US$960-970Light Lauan US$1,300-1,310
Africa FAS Ribbon FAS PlainUS$1,448-1,495 US$1,435-1,445
Asia MBF FOB Warehouse (New York)Teak US$2,800Mahogany US$1,062
Distribution Yards (Albuquerque)Macassar Ebony US$17,000 Prime quality AD
Rough 1lJelutong US$2,150 Select & better KR
Rou h 21Lauan US$1,420 FAS 1l XD RoughPadauk US$330 FAS 1' RD Rough
Plywood
Asia Distribution Yard (Albuquerque)NSF
Lauan 1/8' US$278 GIS114^ US$384 GIS
Teak 1/4' US$697 GIS
Veneer CIF California1/240 US$28 Backs1/6' US$120 Core Lauan1/6' US$90-95
Core Banak
Import PricesLumber US$/MBF
Brazilian Banak t1 Common & Btr 260 GulfBrazilian Banak t1 Common & Btr 150 FOB(Brazilian Banak 2 years ago 403 Gulf)Brazilian Mahogany #1 Common & Btr 732 Gulf(Brazilian Mahogany 2 years ago 944 Gulf)Brazilian Mahogany 650-700 East + GulfBrazil offering today Llc no interestFar east charge 6-7 percent interestCheaper FOB Brazil prices compensate for higher
freight ratesLauan 4/4 Select & Btr 1,100-1,200 West CoastLauan 4/4 Select & Btr 650-800 West CoastKeruing Floor Stock 1,600 GulfKapur 500 West CoastRamin 850-900 GulfTeak 2,550-3,200 West Coast
Plywood Importer C+F ($/MSF)Birch from Taiwan 175 Gulf
Birch from Canada .250 GulfLauan from Indonesia 145 West CoastLauan from Indonesia DBB 3mm 103-105 West CoastLauan from Indonesia DAB 3mm 110 West Coast
Source: CINTRAFOR, 1989

Table 236^ TAIWANESE DOMESTIC LOG PRICES
(NT$/m3)
1973 1981 1988
Yellow cypress 7,094 17,707 14,614Hemlock 2,211 5,338 4,057Taiwan Oak 1,736 4,427 3,130
Imports: Lauan 1,837 3,570 3,359Import Average USS/m3 48 100 116
Table 237: VANUATU: LOG EXPORT VOLUMES & F.o.b. PRICES, 1987-8
Destination 1987 1988
Japan 6 13,148 73.8 2 3,857 79.5Rep. of Korea 4 6,298 76.0 1 2,050 61.4
Table 238: VANUATU: NATURAL FOREST STUMPAGES, 1988.
Species (group) Range US$1m3 Ave US$/m3
Kauri 8.41 8.41Blackbean 6.07 14.02 8.61Natora 7.01 9.35 8.44Whitewood 1.67 7.48 6.29Milktree 3.74 6.54 4.50Hardwood 5.61 7.94 7.64other 2.80 2.80
Source: FD records.

Table 239: HYPOTHETICAL COUNTRY'S EXPORT PROFILE, VOLUMES & PRICES,1990 & 2020
1990 2020f.o.b. f.o.b.
Product VOLUME PRICE REVENUE VOLUME PRICE REVENUE'000m3 US$/m3 US$'000 '000m3 USSIm3 US$'000
NaturalForest:
Logs:Calophyllum 150 98 14,700 60 120 7,200Mixed LE 1,300 64 83,200 950 96 91,200Sawn Timber:Agathis 40 410 16,400 16 415 6,640
Plantation:P. caribbaea:Sawn Timber 33 190 6,270 85 266 22,610Woodchips* 92 149 13,708 219 103 22.557
Mahogany:Sawn Timber 6 430 2,580 80 458 36,640
Total Revenues 136,858 186,8472020 Revenues at 1990 prices: 156,421
Table 240: COMMERCIAL NATURAL FOREST AREAS & STOCKING
Country Area '000 km2 Stocking mill. m3- Gross Volume
Fiji 2.5 10Papua New Guinea 140 350Solomon Islands 3.5 13Vanuatu .5 2

Table 241: SPECIES COMPOSITION IN FOREST HARVESTS
Species* Percentage Representation in country & regionFiji PNG SI Region
Level of cut mill. .3 0.2 1.8 0.3 2.3
Agathis 19 1.6Deccusocarpus 5 0.4Dacrydium 2 0.2Caloplyllum 11 7.8 19.2 9.6Campnosperma - - 10.9 1.4Canarium 2 3.1 - 2.6Celtis - 2.8 - 2.2Dillenia 3.0 8.1 3.4Endospermum 19 2.2 - 3.5Garcinia 2 - - -
Grnystylus 3 _ _ _Heritiera 2 - - -Homalium - 6.1 - 4.8Intsia 2 2.2 - 1.9Myristica 19 - - 2.5Octomeles - 3.6 - 2.8Palaquium spp 4 3.8 1.0 3.4Palaquium hornei 3 - . _Parinari - - 2.1 -Pometia - 23.0 28.5 21.7Pterocymbium - 3.5 - 2.7Terminalia - 4.9 4.9 4.5Syzygium 4 2.5 - 2.3
* Only species constituting 22 of the total cut in any country isincluded in this list (Data for Vanuatu is not significant).

Table 242: PLANTATION AREAS BY PROBABLE PRODUCT TYPE
Period Area Planted ha. 000'sFiii PNG SI
Cabt. Ute. Pulp Cabt. Ute. Pulp Cabt.Ute.Pulp
1956-60 .7 .3 * .5 1.81961-65 2.5 .6 .4 2.71966-70 4.4 3.1 1.0 1.9 .91971-75 2.31 11.3 .9 3.8 4.31976-80 2.4 16.1 .7 3.9 1.2 1.7 9.11981-85 9.1 21.3 neg 3.9 2.4 1.8 2.11986-90 11.3 24.8 .2 2.0 8.5 3.4 2.1 .41991-95 16.2 25.7 6.0 4.0 15.0 5.0 4.3 3.61996-2000 16.2 25.7 20.0 4.0 15.0 5.0 4.1 4.0
* A high proportion of the pine, included here as a utility species,will be used for pulpI Data for species other than Mahogany in the period 1971-1985 isaveraged over the whole period, so may not be quite accurate.
Cbt. = Cabinet sp.; Ute. - Utility sp.

Table 243: PACIFIC ISLANDS & PACIFIC RIM COUNTRIES PROJECTEDPRODUCTION 1995-2020('000 m3 RWE/ann.)
NATION/PRODUCT 1995 2000 2005 2010 2015 2020
Pacific Islands:
Western Samoa 50 90 95 100 110 120Vanuatu: Natural Forest 300 100 ? 7 ? ?
Plantations (Pine) 1 20 37 ? 7Cordia 8 55 28 ?
Tonga 6 10 12 14 16 17New Caledonia 10 11 13 15 16 16Niue, Kiribati,Tuvalu, Micronesia... 5 5 5 5 5 5Fiji: Natural Forest 240 220 200 140 145 140
Pltn. Hdwds. 26 144 207 321 351 588FPC/FD Pines S/log 137 177 287 299 466 469FPCIFD Pines P/log 197 231 371 388 606 603
Solomon Islands: Nat'l 290 90 70 50 40 40Pulplogs KFPLIFD 2 230 264 268 291 320Sawlogs KPFL/FD - 64 117 120 130 160
Papua New Guinea:Natural Forbst 3,200 4,900 5,100 5,500 5,000 4,700Plantation: Pine+Oth 112 142 182 202 240 260
Hardwoods 125 . 265 615 870 970 970
Pacific Rim:
USSR Far East/Siberia:Total Production 135,000 140,000 145,000 150,000 158,000 165,000Export Sftwd.S/L/T 8,600 9,000 9,500 10,000 12,600 15,300Export Hdwd. S/L/T 240 250 290 340 820 1,200Export Sftwd.P/L/C 3,000 3,200 3,350 3,500 3,500 3,500Export Hdwd. P/L/T 220 230 470 700 940 1,150
USA (Whole Nation):Total Production 333,000 315,000 328,000 306,000 319,000 299,000Export Sftwd.S/L/T 34,000 27,000 21,000 24,000 27,000 20,000Export Hdwd. S/L/T 4,500 4,300 4,400 4,100 4,300 3,900Export Sftwd.P/L/C 3,800 3,700 3,800 3,700 3,750 3,450Export Hdwd. PIL/T 600 550 600 550 570 500
Canada:Production (B.C.) 72,500 69,000 76,000 69,500 70,000 62,500Exprt Sftwd. S/L/T 45,000 43,000 49,000 45,000 45,000 39,000Exprt P/L/C 1,100 800 1,200 1,000 1,000 700
Japan:Production 33,000 34,000 36,600 38,400 39,500 40,000Softwood S/Log 17,000 17,860 20,250 21,100 21,458 22,000Hardwood S/Log 2,000 1,900 1,750 1,600 1,550 1,500Softwood PlLog 4,400 5,240 5,800 6,700 8,000 8,600Hardwood P/Log 9,600 9,000 8,800 9,000 8,500 7,900
South Korea:Poplar 2,500 4,416 4,450 4,500 4,600 4,650Other Species 1,750 2,000 2,200 2,400 2,500 2,550

Table 243:cont.)
NATION/PRODUCT 1995 2000 2005 2010 2015 2020
China:Industrial.S/logs 50,000 52,000 54,000 55,000 57,000 61,000Pulplogs (& Fuel) 8.000 8,500 9,000 9,000 9,000 10,000
Taiwan Province:Softwood S/Logs 65 60 150 450 650 750Hardwood S/Logs 65 44 20 20 40 60Pulplogs 700 750 680 600 720 910
Australia:Native Sawlogs 3,300 3,000 2,600 2,300 2,100 2,000Native Pulplogs 5,000 4,500 3,000 1,600 1,400 1,200Pltn. Sawlogs 5,500 7,500 10,600 13,700 14,700 15,700Pltn. Pulplogs 5,200 5,500 5,300 5,100 4,900 4,700
New Zealand:Pltn. Sawlogs 4,722 5,978 9,562 11,840 13,107 13,885Pltn. Pulplogs 6,663 8,222 10,745 11,830 11,713 11,588Ntve.+Ndwd.Pltn.S/L 170 180 110 200 210 220Hdwd. Pulp/Chips 350 340 320 310 300 300
Chile:Pltn. Sawlogs 4,500 5,800 9,500 10,900 12,500 14,000Pltn. Pulplogs 9,000 10,900 12,500 15,800 15,500 16,000Native S/Logs 810 840 890 920 1,000 1,100Ntve.& Euc.PIwood 300 450 600 690 730 750
Peninsular Malaysia:Hdwd. Sawlogs 4,920 5,420 5,780 6,620 7,000 7,400Rubberwood 1,800 1,200 1,000 1,000 1,000 1,000
Sarawak:Swamp Hardwoods 6,500 5,000 4,900 4,800 4,700 4,600Hill Hardwoods 2,100 1,700 1,600 1,600 1,500 1,400Pi-antations - - - 500 1,000 1,500
Sabah:Hardwoods Sawlogs 6,700 1,237 1,100 1,000 1,000 1 000Plantations 1,600 1,900 2,400 3,000 4,600 -,000
Indonesia:Natural Hdwds. 32,900 26,400 21,000 17,400 13,800 12,500Plantations 5,700 13,300 17,500 24,600 26,800 29,800Rubberwood 400 700 850 1,000 1,300 1,700
Philippines:Natural Sawlogs 2,500 2,000 1,800 1,500 1,500 1,500Plantation S/Logs 500 1,000 3,500 4,600 5,500 6,500Plantation PJLogs 1,000 1,500 2,500 2,800 3,000 3,000
N.B. All in m3 roundwood equivalents, including S/LIT (Sawlogs + Sawntimber) and P/L/C (Pulplogs + chips).
Source: Cameron, 1989; Hunter, 1989

FIGURE I. . 6.
(a) PAP tOlt (b) PA A I
j | J11u. mtr. 60. 9t
Al St -lCAJW*ftftMdIPr4~~~ PAPOIry laO.Iry iIP IPttmlg tdur 9.1 %1 at * 1
4. | I I I-fta1a 81ost
I.S _Pr.Ok un"r so 81
-__/_________9t__-_____ (b)bt.41 l'lX"'r"Z *iIS,(V 3.=I | I
jltaa &.ja9Iy 1iOO.O f 0.Mig tA 1sk j ja*.4hI.Et1 indzu I I
Jpl.AlwctsOA (61 ". W I k. IX (a) 4.611 frap.w pro*c s I I I(b) SB.9 9t i*ab IItn _ imucry 4.4 aw S.D uu jyc
(b)13.22 I 1-0 i~~~~~~~~~~~~~~~~0.)t ~~~(O) 99.9t | ozx zs - t#oe J Xssw . aC.s.{ uws Al
|b) I |
(1*) 1.11 I I ttw ww b J&~#0ao fasI 1
(a) 3a I I I I
I etdlri,Paeir retail 0.d9 1 .n
(b) 1. n (b)19.4&
if- ~-ts5 it IX II pL* ts * I
( Paer
(ti Pa(gAreo d
SL1iNLL: uinuursty oU lnhuetiuAeb IiMi & lEiba.^hVy.
NlerbiI.h;a Aihests in* t0o1W* tatl <_talv 4.uWt)o|eq *t Li lstte ab IOZ.

FI(tM.E 2
BROAD OUTLINE OF JAPANESE PULP AND PAPER INDUSTRY'SACTIVITIES IN 1987
4 Pu4p'wood sf LSfttoV *og Ut Pwowod...............10. 0 cu*i meats
g 0,"4 97a g Plp. PPIOer andWaite Pp te,. .... 10O0 metric tons
Smit Pubpoad Recipts 32.166F
bmlU, Pupwod Consumior 32.41|1 -- 30%
Woeod Pulp Prduction 9.1 6 16 Wito P, & Othd w ' , > F~~~~~~~~~~ibre Supply
hS%417 S PapotPulo 9.542 r SChemn. 7.413
I O .. sje SmctSti-n. h 446M 16 00. Mitns Receipts 17t7
Cww. Meal. IB .M.h 1,0
Powe Wood Pulo Cosumotiow 11.615 Do. ConsumotiOn 11.740
Tot ComesticPao & Pawobord Production 2.537 96
61 Domestic Platt2w DomesticSuply 12. <7 hoPpboard
I Surp 9.130 426Not Domettte Paftper O P "Caita CaonumptionPowerboard Contufp .Jon 164.koS
Paw Cnsumtotion 13.075 Pgertod Consumptiotn 9.516
C|ltuse Us 9516 Industrid Us 1(42.X 1%9
Household Use 1.3SO t WM
t7t
It Al the ehu ee"tttwe. flgwqs El45 itlN ul'itni b i,rwp rA.qr±nt

FIGURE 3
.
European Apparent Sawnvood Consumption by Species Group in 1985
7 uiu. HrW.d (13.5)
T,vok-e 1 Xd(L) (Z.1*
L * iggy e*u* Cmoet.4 LogsS s u.:44 4WRUM
4 ~ ~ ~ ~ ~ ~ ~ 5.[e:d^$

FIGURE 4
S
European Plywood Consumption by Species and Sources in 1986
~~~~~~A f U -m
70 -t d--_I-
40 ? i a ti' 1
Z0
40
etota coo"ga a S.GZ u .t2dUoe e;l * 1400
.~~~~~~~~~~~~~~~~~~~~~~~~~~~~~~~~~~~~~~~~~~~~~~~~~~~~f

FIGt'E 5
Wiorld Tropical Hardwood Imports Shares (1986)
p I~~~~t
70
ITRE 6
European Imports of Tropical Hardwoods by Assortment (1976 and 1986)
7
.0
40
30
197E Aom t97
mC S ftrQC AWW E S LOU

7
European Plvwood Production and Import
120 -
& 1' 100
so . ; , 70
1973 1974 1975 1974 t977 1978 1979 t980 191I 1952 I983 t184 19U1 1986
a rr * 1.4
.~~~~
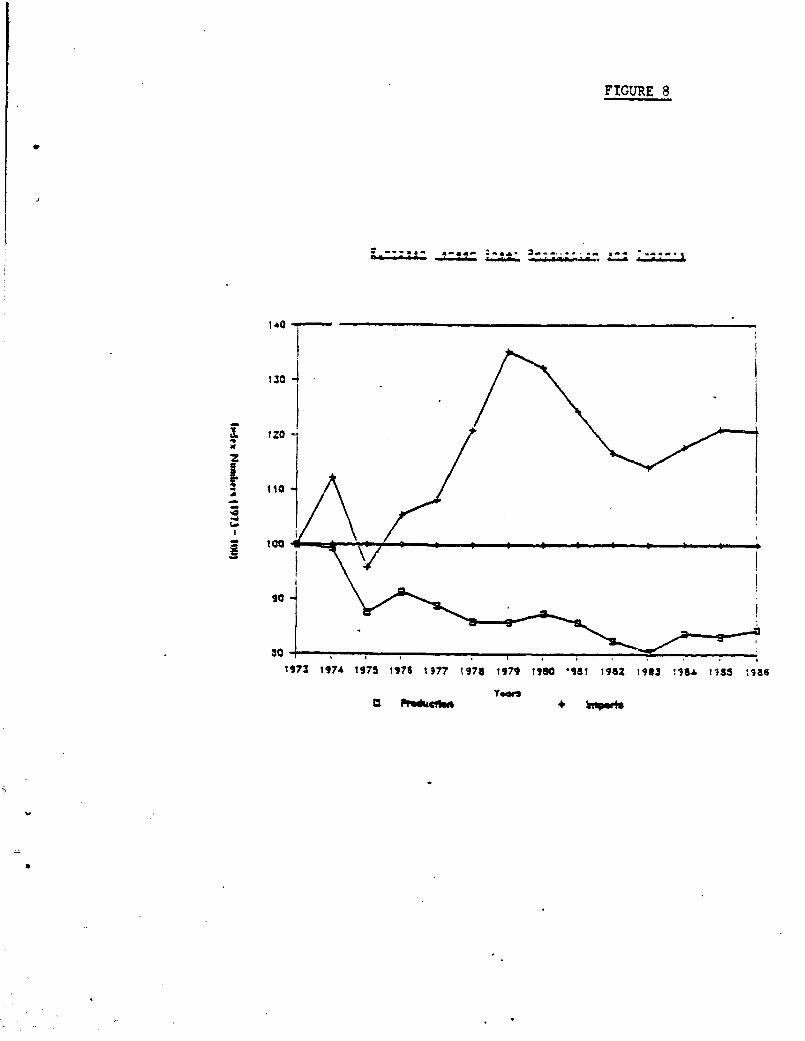
FIGURE 8
-a~ ~ ~~~~~~~ya
0: Pidmaa9A +
a~i,*

Flrj'RE 9
European Tropical Sawn Hardwood End-Uses Estimate for 1986
OMW \GrAtruete (S.)
rVWdW (27.03)\
OVr w_,,fUgffoA (a.as)

FISURE 1^
S.=-weranam MUWW I"e e-^!e n§;- 'st!e* :_,
;6u^-^:21 ;-'>-',o_____ _I _
naUUatU n.uaYl-_. tao
'D _ - t &_ ?s_
FI(URE 1 1
, -J. * . - . . - _. - . - .- ...... ... .._.
.f~~~~~~~~w,v ^z tl JU
A ~v_-e

Chilean Trade
VALUE OF FOREST PRODUCT EXPORTS BY COMMOOIT'Y 1986
24.34i I "t~~~~~~~~~~~~N 12.9SI 8>-AUAVI IR /
\(/ \1.3% ~~~PULP 32;S*J
^,N. * Re-mbautactutd 'J.C.P.L. * Woodctapa U
aoL&*ood products Pulploqs IN a 5.5%)P.P. Panl Products P.. * Papec P/80t4d h.I.P. a Non-wood Ptoducts -
fN: a 3%) {N2 * a..Sa boa hips, Soldo 1e4ves
QuWl.y ;4tk, p&ft ushroom0URCE: SNPOR; N23N01
EXPOR T C)ESJtNAT IONS B Y VAL UE 1985
Total Val" * $334.6 mll.
(1946 * $403.1 Mail.
NORmU ADtilICA 1G\ "' / /
\ / 9e\\^t / /AC9 ntznO SOUTH A(8XCA 32%
Restc of W. eUCe34L
ws sta :uot 4tYugoslaviaC \ 1956 \
8OtRCt lNlt1986 W ASL IA f PACIFIC U

EXCHANGE RATE MOVEMENTS - $US BASEJAPAN
Yen/$US400
350
300 \
250
200
150 -
loo~~~~~~~~~~~~~~~~~~~~~~~~~~~~~~~~~~~~~~~~~~~~~~~~~~~~~~~~~~~~~~~~~~~~-
100 .
0 I ' ' l' '} ' ' l_'
1970 1972 1974 1976 1978 1980 1982 1984 1986 1988
YearYen

CONSUMER PRICE INDEX MOVEMENTSJAPAN
Index No. (Base = 1980)150
125
.100
75 -
50
25
02 4 ' I '. I ' I I ...... I.I ',1970 1972 .1974 1976 1978 1980 1982 1984 1988 1988
Year
-> Japan

e~~~~~~~~~~~~~~~~~~~~~~~~~~~~~~~~~
I.~~~~~~~~~~~~~~~~~~~~~~~
5,: ..:4:
I, 4,
e
I i 5 iU _ .*
40~~~~~~~~~~
4w~~~~~.9
S...-~~~~~~~~~~~~~~6 ...

FIGLTRE 17
Oe8^!- ^^ ^ 'aaa..- 7 .... E.t*.^. _~- IA,'!.> a.j 's!>-
a a ex p) 0 .4
._~~~~~~- * /.
a . S~~
- * '.- ::_i
::~zte ..i J