world agroforestry centre science meeting 2008
TRANSCRIPT

World Agroforestry Centre Science Meeting 2008
Market Dynamics for Agroforestry Investmentsas influenced by
Property Rights and Incentives
Mike Norton-Griffiths D.Phil.Nairobi, [email protected] Site: mng5.com (well worth a visit!!)

HEALTH WARNING• These analyses are in progress and are by no means in
final form.• They are best used as illustrations of ideas rather than
as completed analyses.• If you really would like to use them in a publication then
best to seek my advice first as to their status.
• Contact me on [email protected]

TenurePrivate & Customary
Economic & Environmental aspects
IncentivesEndogenous, Social and Exogenous
InteractionsCreate investment opportunities for
agroforestry goods and servicesDifferential impacts on flows v. stocks Transformation of tenure from
Customary Private

100%7,809,733100%71,425Total
23%1,809,19541%29,275Customary Tenure
63%4,919,04030%21,350Private Tenure
9%671,93012%8,275Commercial Leasehold
5%409,56818%12,525Government and Trust Land
%Population%Km2Land Status
Tenure Status Of Agricultural Land In Kenya


Net Returns to Land ($/ha/yr) and Moisture Availability
A. Humid
B. Sub-Humid
C. Semi-H
umi
D. Trans.
E. Semi-A
ridF. A
rid
Moisture Availability
0
50
100
150
200
250
300
350
400
Net
Ret
urn s
to L
a nd
($/h
a/Y
r) $
$$
$
$
$
Total net returns to land (profits)$887 million from 50,000 km2 of agricultural land

Influence of Land Tenure on Net Returns to Land
A. Humid
B. Sub-Humid
C. Semi-H
umi
D. Trans.
E. Semi-A
ridF. A
rid
Zones of Moisture Availability
0
100
200
300
400
Net
Ret
urn s
to L
a nd
($/ h
a/yr
) Customary TenurePrivate Tenure
Tenure "gap" = $425 million

Influence of Land Tenure on Investment in Woodlots
A. Humid
B. Sub-Humid
C. Semi-H
umi
D. Trans.
E. Semi-A
ridF. A
rid
Zones of Moisture Availability
0.0
0.5
1.0
1.5
2.0
2.5
3.0
Are
a of
Woo
dlot
s (h
a /km
2)Customary TenurePrivate Tenure

0 10 20 30 40 50 60 70 80 90 100% Agricultural Land Adjudicated
10
20
30
40
50
60
70%
Hou
seho
lds
in E
con o
mic
Co-
Op e
ratio
n
Isiolo
Kwale
Nakuru
Kiambu
Kisii
Bungoma
Economic Impact of Secure Tenure

Tenure Effects: Economic and Environmental Indicators
21.20.061.27Woodlots
4.65.1423.55Hedgerows (km/km2)
18.00.244.31Woody crops
3.83.0111.45Privately managed woody veg
1.122.3224.33Total woody vegetation
Environmental indicators:
39.80.135.17Managed pastures (ha/km2)
2.9$8.62$25.20Livestock returns ($/ha/yr)
5.52.3312.90Cash crops (ha/km2)
3.6$ 83.00$301.80Net returns to land ($/ha/yr)
Economic Indicators:
Tenure EffectCustomary TenurePrivate TenureLand Use

INCENTIVES: to develop and improve land management
•Burgeoning markets, both domestic (rural and urban) and international
Exogenous(external markets)
•Family health•Property / field boundary markers•Other on-farm investment
Social(internal market)
•Population growth•In-migration
Endogenous(internal market)

Machakos – Kilima Hill -- 1937
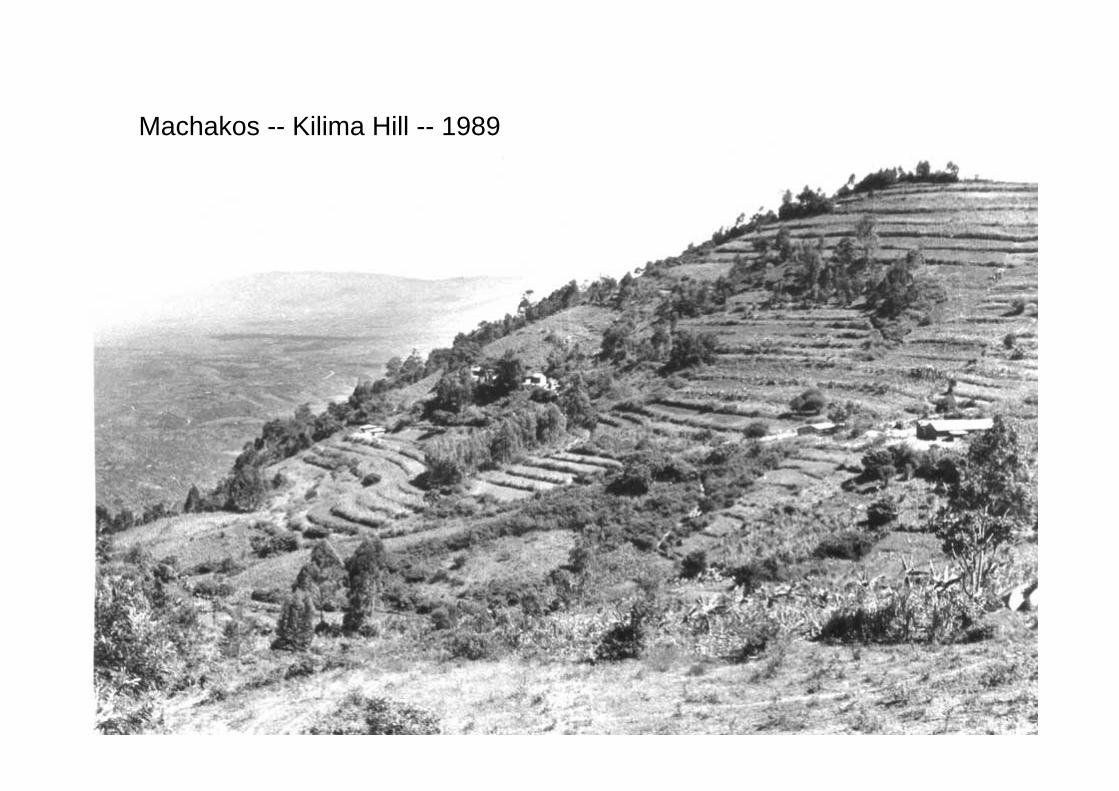
Machakos -- Kilima Hill -- 1989
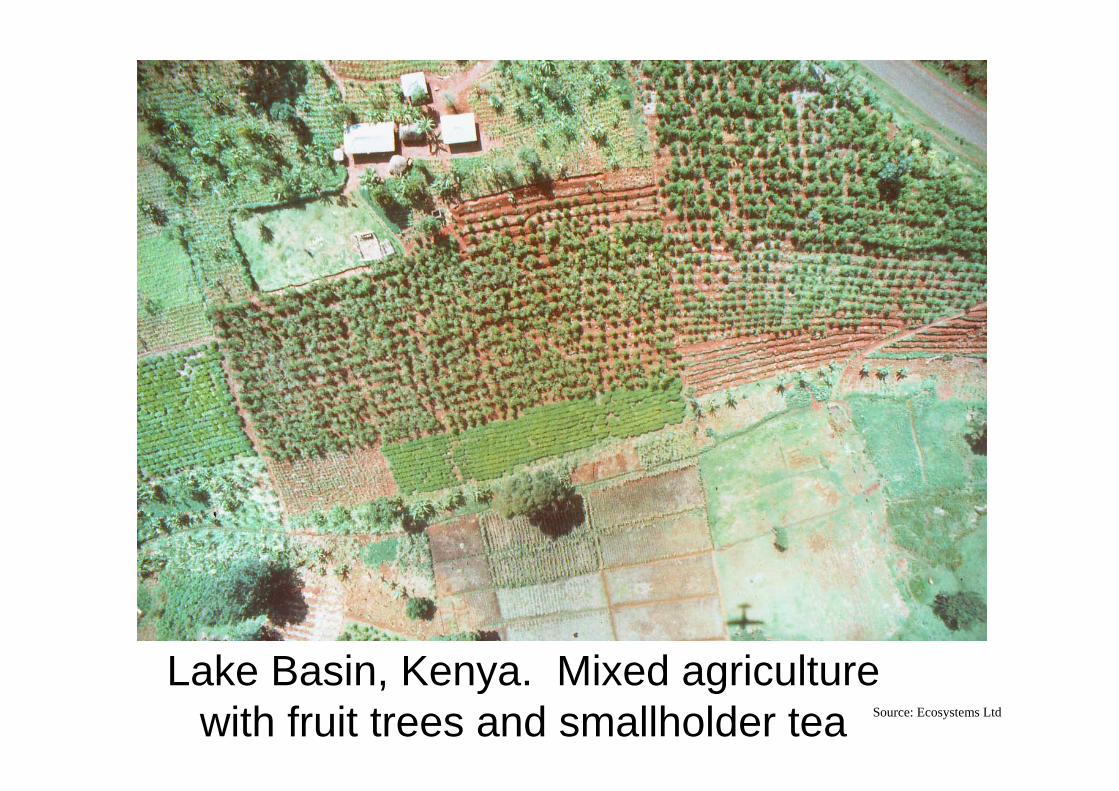
Lake Basin, Kenya. Mixed agriculture with fruit trees and smallholder tea Source: Ecosystems Ltd

Net Returns to Land as a function ofPopulation Density and Property Rights
-050-100
-150-200
-250-300
-350-400
-450-500
>500
Population Density (#/km2)
0
100
200
300
400
500
Net
Re t
urns
to L
and
($/h
a/yr
)Customary TenurePrivate Tenure

Influence of Distance to Market Centre and Tenureon Net Returns to Land
04km 06km 08km 10km 12km 14km 16km 18km 20km
Distance (km) from Market Centre
0
100
200
300
400
Net
Ret
urns
to L
and
( $/h
a/y r
)
Customary TenurePrivate Tenure

Influence of Distance to Market Centre and Tenureon Investment in Woodlots
04km 06km 08km 10km 12km 14km 16km 18km 20km
Distance (km) from Market Centre
0
2
4
6
8
10
12
14
16
Woo
dlot
d A
rea
( ha/
km2 )
Customary TenurePrivate Tenure

Influence of Distance to All Weather Roads and Tenureon Net Returns to Land
05km10km15km20km25km30km35km40km45km50km
Distance (km) fto All-Weather Road
0
50
100
150
200
250
300
350
400
Net
Ret
urns
to L
and
( $/h
a/y r
)
Customary TenurePrivate Tenure

Influence of Distance to All Weather Roads and Tenureon Investment in Woodlots
05km10km15km20km25km30km35km40km45km50km
Distance (km) fto All-Weather Road
0
2
4
6
8
10
12
Woo
dlot
d A
rea
( ha/
km2 )
Customary TenurePrivate Tenure

Other Interactions between Tenure and Incentives
Less land improvement & investment; less market involvement; shorter time perspectives
Weaker
Greater land improvement & investment; greater market involvement; longer time perspectives
Stronger
PropertyRights
WeakerStronger
IncentivesGeneral

Investment in Wildlife, and in Public Environment
- 70% where landowners can
capture no benefits
- 40%where
landusers capture some
benefits
Weaker
-100%eradication in agricultural
areas
+5% where landowners
impose property rights
and capture benefits
Stronger
PropertyRights
WeakerStronger
IncentivesWildlife Change over 30 years
KIBERA –0%
investment ($2bn annual
turnover)
Weaker
0.5%investment
from domestic budget
Stronger
PropertyRights
WeakerStronger
IncentivesPrivate Investmentin the Public Environment

Market Forces, Urbanisation, Land Values and Tenure
• Market Forces (on flows)increase the quantity and quality (and value) of production
increases the value of landIncreased willingness to invest in land management
• Urbanisation (on stocks)rising demand for land for domestic and commercial use
sharp increase in land valuesvalue of land becomes dislinked from any agro-ecological potential
• Both Processes force the transformation fromCustomary Private tenure regimes

Policy Implications
• Tenure– Private: wealth creation economic & environmental gains,
but potential for social losses– Customary: wealth dissipation economic & environmental losses
but potential social gains• Incentives
– Population growth more intensive land use– Market growth increased flows land values & investment– Urbanisation severs land values from agro-ecological potential– [[Incentives v. Regulations]]
• Interactions– Transform patterns of land use & land management– Creates a variety of investment opportunities for agroforestry– Transform tenure regimes from Customary Private