workshop su - electronic journal of management · in collaborazione con il network italiano...
TRANSCRIPT

n. 3 - 2016
Workshop su
LA MISURAZIONE E VALUTAZIONE DELLE PERFORMANCE
NELLE IMPRESE STATO DELL’ARTE E TENDENZE EVOLUTIVE IN ATTO
in collaborazione con Network Italiano Business Reporting
IL MODELLO DELL’INTELLECTUAL CAPITAL: ORIGINI, SVILUPPI, RIFLESSIONI
[slide presentate al workshop]
Stefano Zambon
Venerdì 15 luglio 2016 Università Cattolica del Sacro Cuore

1
Prof. Stefano Zambon University of Ferrara and WICI
Università Cattolica del S. Cuore Milano, 15 luglio 2016 (slides riviste il 18.10.2016)
in collaborazione con il Network Italiano Business Reporting (NIBR)
Workshop «La misurazione e valutazione delle performance nelle imprese.
Stato dell’arte e tendenze evolutive in atto»
IL MODELLO
DELL’INTELLECTUAL CAPITAL:
ORIGINI, SVILUPPI, RIFLESSIONI

“The substantial foundation of the
industrial corporation is its immaterial
assets”
“There may be peculiar difficulties in
the way of reducing this goodwill to
the form of a fund, expressing it in
terms of a standard unit”
Thorstein Veblen, 1904

AGENDA
1. Le origini e le motivazioni
2. Gli sviluppi
3. I casi Brembo e Despar Nordest
4. Riflessioni sul modello
5. Considerazione conclusiva
1. LE ORIGINI E
LE MOTIVAZIONI

Le origini Nel novembre 1987 in Svezia iniziò a riunirsi un
gruppo di 7 manager e consulenti, capitanati da Karl-
Erik Sveiby (editore di una rivista professionale), che
si diede il nome di Konrad Group, e che pubblicò nel
1988 un libro intitolato «The Invisible Balance Sheet»
L’obiettivo dichiarato del lavoro era quello di «to show the management
of knowhow companies practical methods and procedures for
presenting their company’s most important resource, its personnel, in a
more informative way than through pretty colour photographs”. Il libro
definisce e descrive più di 35 “key indicators” e li inquadra in un
contesto teorico
Il libro rappresenta il punto iniziale del movimento scandinavo sugli
intangibili in materia di accounting è di interesse notare che nel 1987
è apparsa anche la traduzione in inglese del noto testo del professore
giapponese H. Itami «Mobilizing Invisible Assets» (ed. or., 1980)
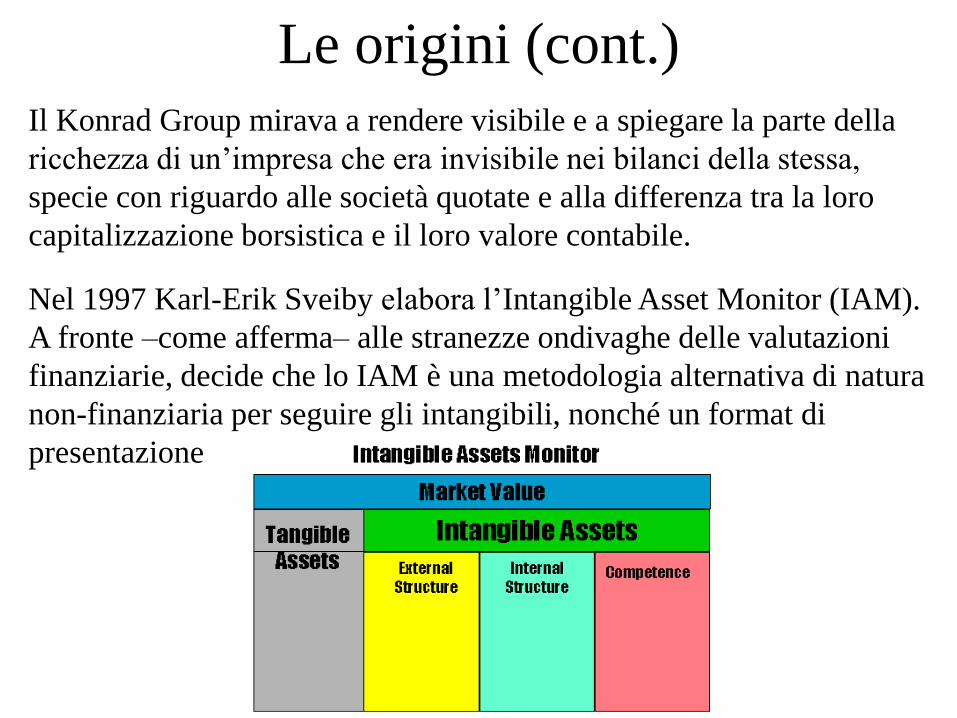
Le origini (cont.)
Il Konrad Group mirava a rendere visibile e a spiegare la parte della
ricchezza di un’impresa che era invisibile nei bilanci della stessa,
specie con riguardo alle società quotate e alla differenza tra la loro
capitalizzazione borsistica e il loro valore contabile.
Nel 1997 Karl-Erik Sveiby elabora l’Intangible Asset Monitor (IAM).
A fronte –come afferma– alle stranezze ondivaghe delle valutazioni
finanziarie, decide che lo IAM è una metodologia alternativa di natura
non-finanziaria per seguire gli intangibili, nonché un format di
presentazione
Primi riferimenti al concetto di
Capitale Intellettuale
Il primo utilizzo dell’espressione “Intellectual Capital” pare
essere nel libro di G.R. Feiwel “The Intellectual Capital of
Michael Kalecki” (1975), in cui viene attribuita a John Kenneth
Galbraith, il quale, in una lettera all’economista Michael Kalecki
del 1969, scrisse: “Mi meraviglierei se tu comprendessi quanti di
noi al mondo hanno posseduto il capitale intellettuale che hai
fornito nell’arco di questa passata decade”
Nel 1994 l’azienda leader svedese nel campo assicurativo-
finanziario, Skandia, quotata alla Borsa di Stoccolma e di New
York, inizia la pubblicazione di un documento denominato
«Intellectual Capital Statement». Tale pubblicazione si estende al
1998. Il Chief Knowledge Officer di Skandia, Leif Edvinsson, è
un adepto di Karl-Erik Sveiby.
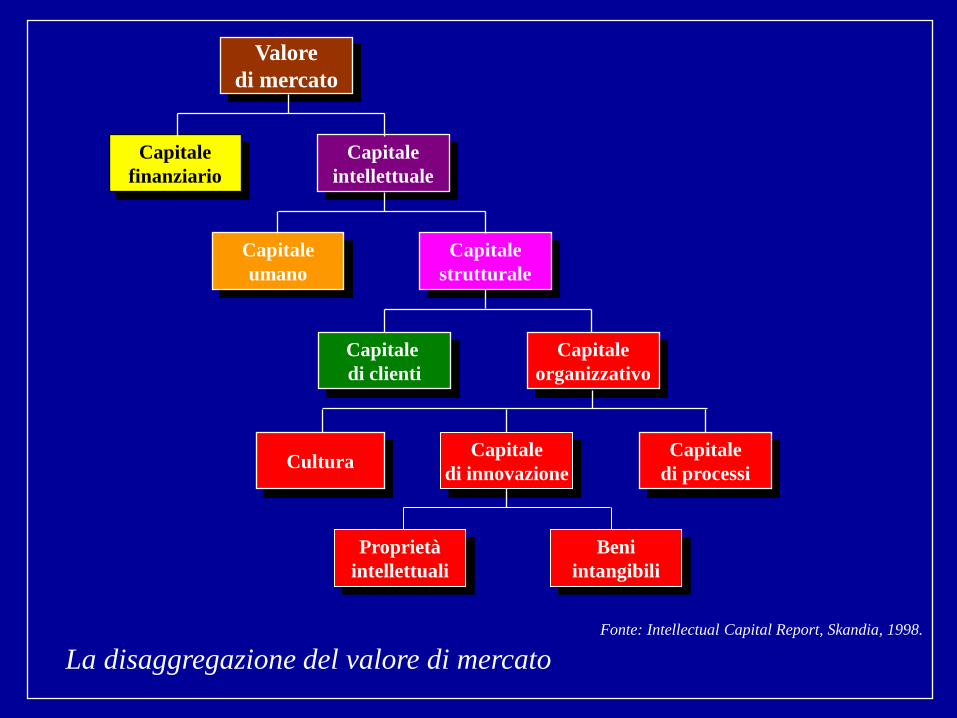
Valore
di mercato
Capitale
intellettuale
Capitale
finanziario
Capitale
umano
Capitale
strutturale
Capitale
di clienti
Capitale
organizzativo
Cultura Capitale
di processi
La disaggregazione del valore di mercato
Capitale
di innovazione
Proprietà
intellettuali
Beni
intangibili
Fonte: Intellectual Capital Report, Skandia, 1998.

Skandia Navigator, Edvinsson & Malone, 1998
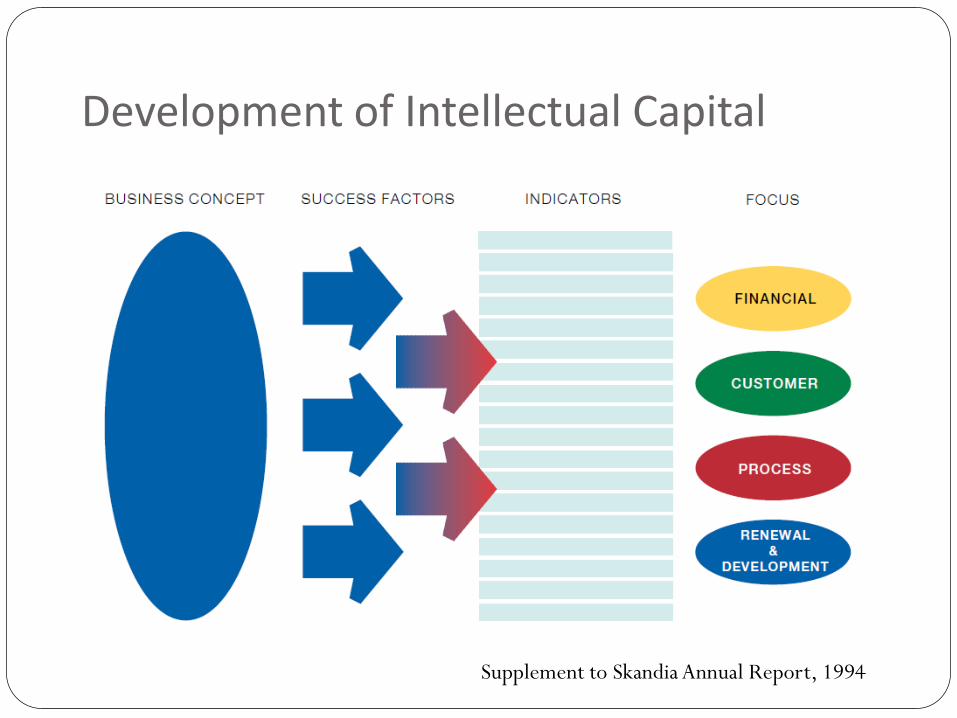
Development of Intellectual Capital
Supplement to Skandia Annual Report, 1994
11
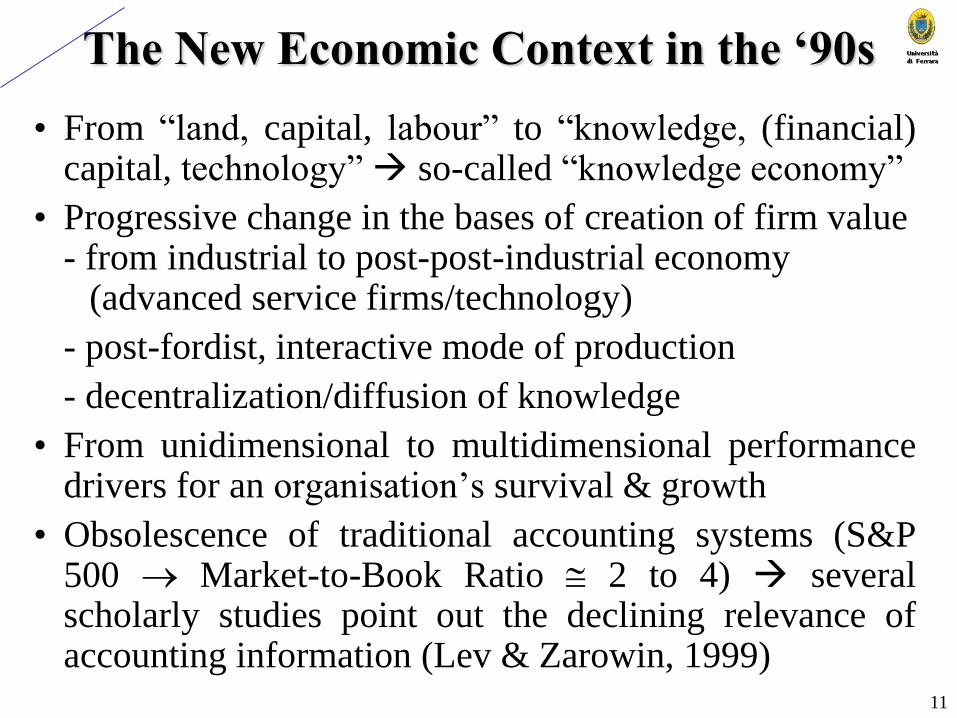
The New Economic Context in the ‘90s
• From “land, capital, labour” to “knowledge, (financial) capital, technology” so-called “knowledge economy”
• Progressive change in the bases of creation of firm value - from industrial to post-post-industrial economy (advanced service firms/technology)
- post-fordist, interactive mode of production
- decentralization/diffusion of knowledge
• From unidimensional to multidimensional performance drivers for an organisation’s survival & growth
• Obsolescence of traditional accounting systems (S&P 500 Market-to-Book Ratio 2 to 4) several scholarly studies point out the declining relevance of accounting information (Lev & Zarowin, 1999)
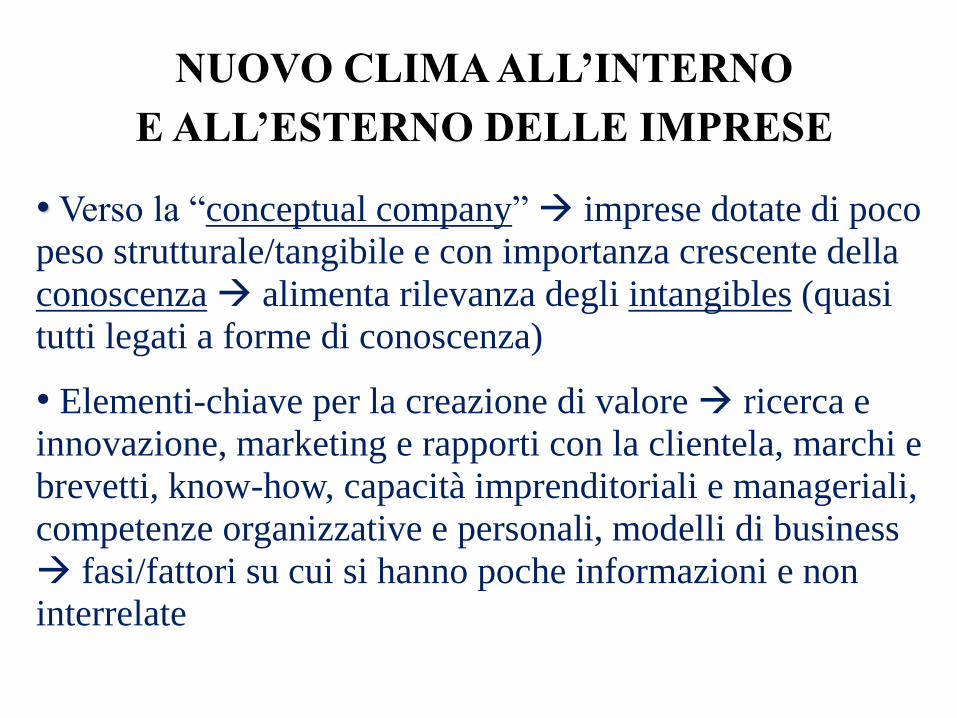
NUOVO CLIMA ALL’INTERNO
E ALL’ESTERNO DELLE IMPRESE
• Verso la “conceptual company” imprese dotate di poco
peso strutturale/tangibile e con importanza crescente della
conoscenza alimenta rilevanza degli intangibles (quasi
tutti legati a forme di conoscenza)
• Elementi-chiave per la creazione di valore ricerca e
innovazione, marketing e rapporti con la clientela, marchi e
brevetti, know-how, capacità imprenditoriali e manageriali,
competenze organizzative e personali, modelli di business
fasi/fattori su cui si hanno poche informazioni e non
interrelate

Allargamento dell’ambito di riferimento
degli intangibili
• Le attività intangibili vengono semplicemente
definite come una fonte di benefici futuri non dotata di
corporeità fisica:
• Proprietà intellettuale è un intangibile con diritti legali
• Nella definizione inclusi intangibili legati all’innovazione (brevetti), al mercato (marchi), alle risorse umane (capacità e competenze, addestramento e formazione), alle relazioni con la clientela, alla reputazione e all’organizzazione (sistemi di compensazione, procedure informatiche, routines, struttura)
• “Hard” intangibles (“tradable”) vs. “Soft” intangibles
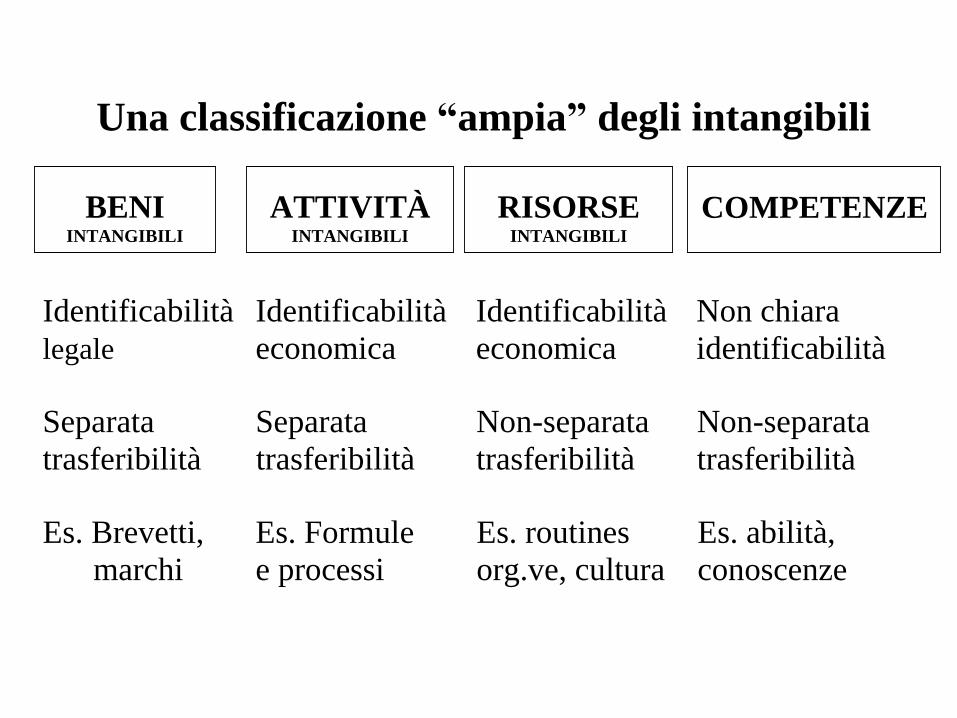
Una classificazione “ampia” degli intangibili
Identificabilità Identificabilità Identificabilità Non chiara
legale economica economica identificabilità
Separata Separata Non-separata Non-separata
trasferibilità trasferibilità trasferibilità trasferibilità
Es. Brevetti, Es. Formule Es. routines Es. abilità,
marchi e processi org.ve, cultura conoscenze
BENI INTANGIBILI
ATTIVITÀ INTANGIBILI
RISORSE INTANGIBILI
COMPETENZE
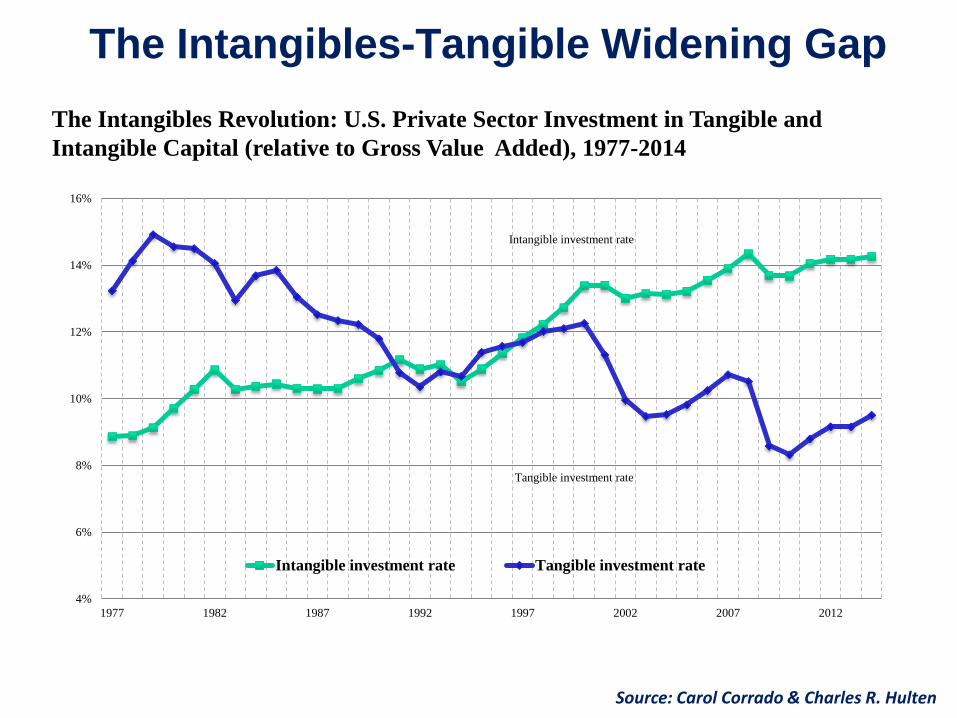
Source: Carol Corrado & Charles R. Hulten
The Intangibles-Tangible Widening Gap
Intangible investment rate
Tangible investment rate
4%
6%
8%
10%
12%
14%
16%
1977 1982 1987 1992 1997 2002 2007 2012
Intangible investment rate Tangible investment rate
The Intangibles Revolution: U.S. Private Sector Investment in Tangible and
Intangible Capital (relative to Gross Value Added), 1977-2014

0
50
100
150
200
250
1990 1995 2000 2005 2010 2011
Intangible
Tangible
Intangible investment dominates £ billion
nominal
Source; UK Investment in Intangible Assets and IPRs, Haskel et al., 2014
UK Market Sector investment
Knowledge investment by firms for future returns:
- Software, Creative works, R&D, Designs, Business organisation / processes, Workplace skills, Reputation / brands

“Tradizionale” misurazione
degli intangibili (ad es. IAS 38, 1999)
• In generale, sospetto e circospezione
• Tre criteri di riconoscimento: utilità futura,
misurabilità, separata trasferibilità se misura non
sufficientemente affidabile = nessun riconoscimento
• Criteri di misurazione prudenziali: - Principio generale: imputazione immediata a C.E. - Se riconosciuti come attività, allora valutazione al costo e a costo rivalutato (non a valori di mercato)
- Ammortamento in tempi brevi
• Asset internamente generati sono generalmente
esclusi dalla capitalizzazione/riconoscimento
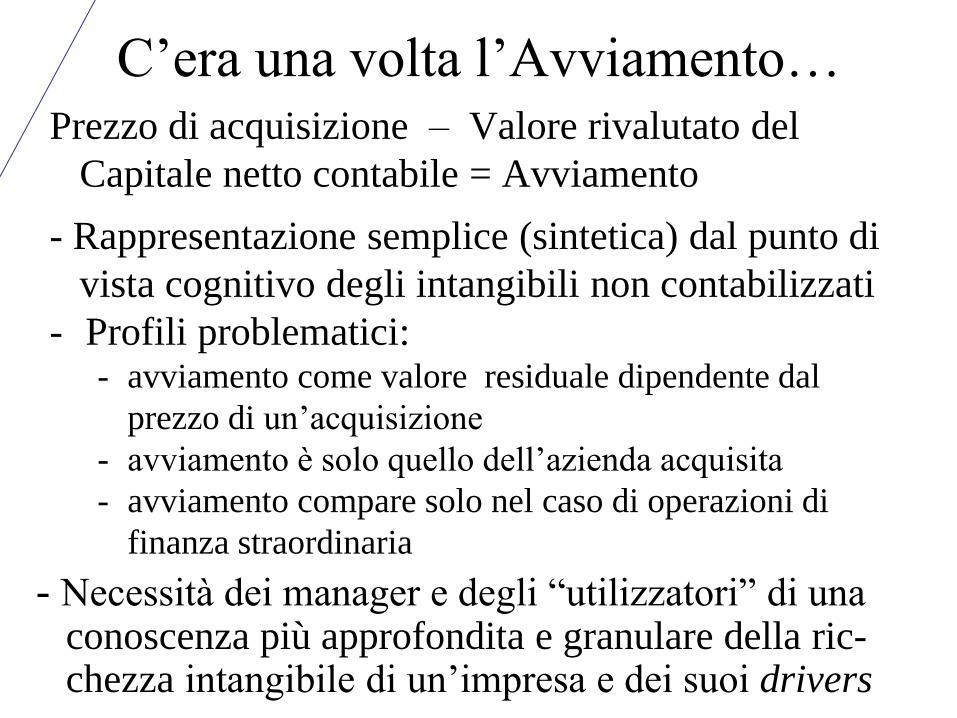
C’era una volta l’Avviamento… Prezzo di acquisizione – Valore rivalutato del
Capitale netto contabile = Avviamento
- Rappresentazione semplice (sintetica) dal punto di
vista cognitivo degli intangibili non contabilizzati
- Profili problematici: - avviamento come valore residuale dipendente dal
prezzo di un’acquisizione
- avviamento è solo quello dell’azienda acquisita
- avviamento compare solo nel caso di operazioni di
finanza straordinaria
- Necessità dei manager e degli “utilizzatori” di una conoscenza più approfondita e granulare della ric- chezza intangibile di un’impresa e dei suoi drivers
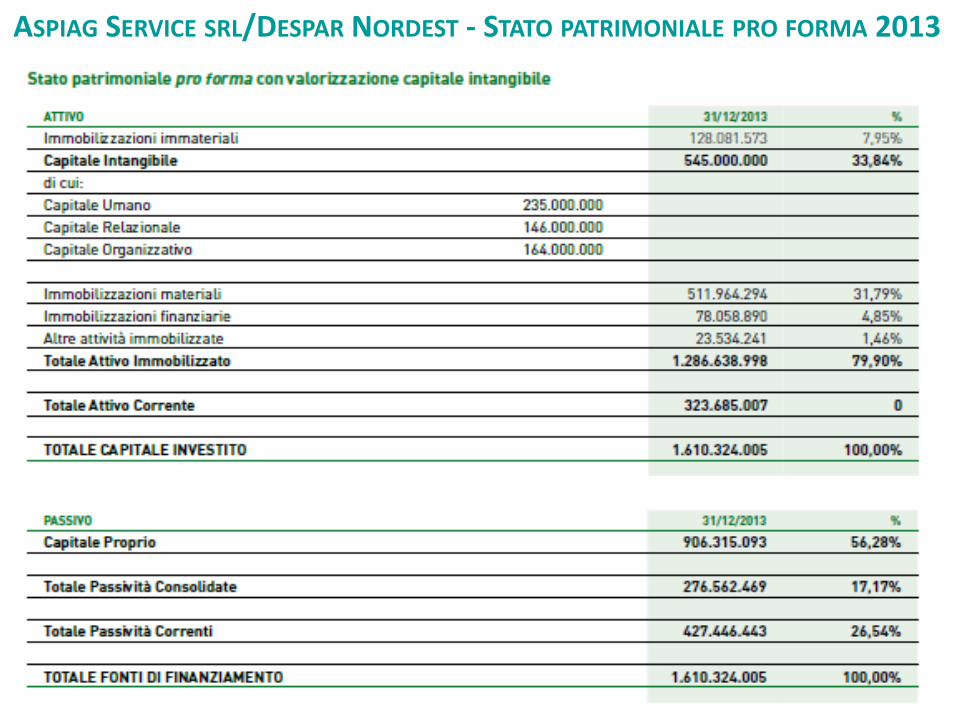
ASPIAG SERVICE SRL/DESPAR NORDEST - STATO PATRIMONIALE PRO FORMA 2013

Value is more than financial
Source: OCEAN TOMO LLC
January,1,2015

S&P 500 Average Market-to-Book
Ratio: 1977-2006
21
The S&P 500 Market-to-Book Ratio: 1977-2006
0
0.5
1
1.5
2
2.5
3
3.5
4
4.5
5
1977 1979 1981 1983 1985 1987 1989 1991 1993 1995 1997 1999 2001 2003 2005
Year
M/B
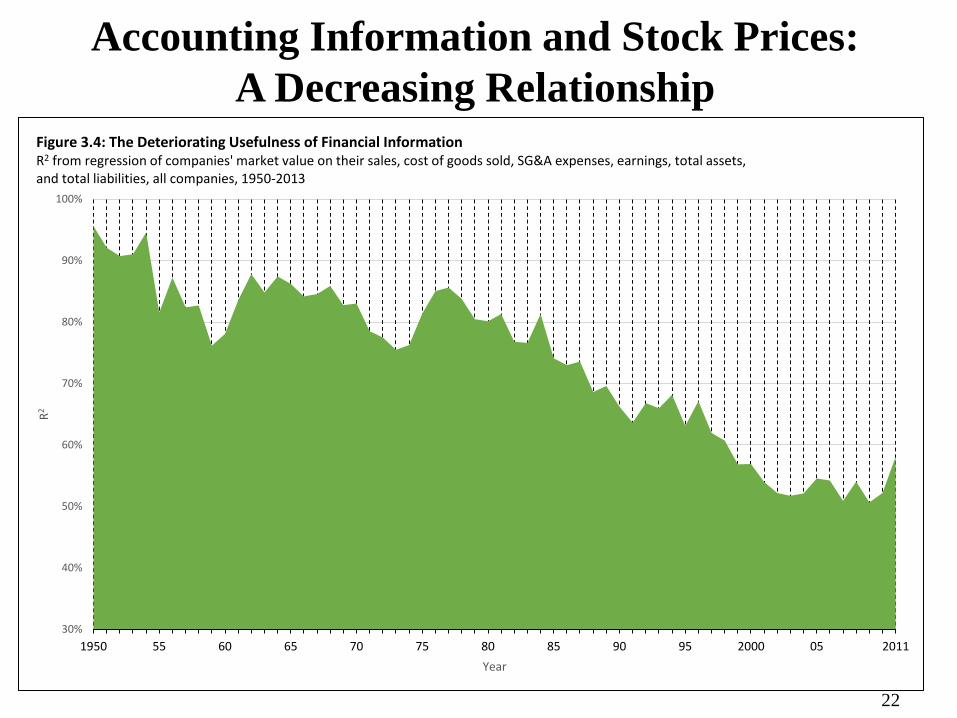
Accounting Information and Stock Prices:
A Decreasing Relationship
30%
40%
50%
60%
70%
80%
90%
100%
1950 55 60 65 70 75 80 85 90 95 2000 05 2011
R2
Year
Figure 3.4: The Deteriorating Usefulness of Financial Information R2 from regression of companies' market value on their sales, cost of goods sold, SG&A expenses, earnings, total assets, and total liabilities, all companies, 1950-2013
22

23
Information used by investors and relative weight
of accounting information
0%
10%
20%
30%
40%
50%
60%
1993 1997 2001 2005 2009 2012
Per
cent
of
all
inves
tors
' in
form
atio
n
Financial reports All company-related information
Financial reports
All company-related information
Figure 4.1: The Increasing Contribution to Investors of All Company-Related Information (Top Curve) and
the Decreasing Contribution of Financial Information (Bottom Curve) Percentage of all information used by investors jointly contributed by: analysts' and managers' forecasts, important non-
accounting events, and financial reports (top curve), and financial reports only information (bottom curve), all firms, years
1993-2012

• Serie conseguenze economiche per l’impresa derivanti dall’inadeguato trattamento contabile degli intangibili
Conseguenze micro-economiche
• Il “mis-measurement” degli intangibili a livello di impresa ha avversi effetti economici in termini di:
- Decisioni di investimento
- Livello di asimmetria informativa relativo a una
impresa (volatilità dei corsi azionari e insider
trading)
- Sistemi informativi interni/direzionali

2. GLI SVILUPPI

Nuovi modelli di misurazione della performance

Metodi monetari e olistici
1) Market-to-book value
2) Tobin’s Q
3) Economic Value Added (EVATM)
4) Knowledge Capital Earnings by Lev
Metodi non-monetari e atomistici
a) Skandia Navigator by Edvinsson & Malone
b) Intangible Assets Monitor by Sveiby
c) Balanced Scorecard by Norton & Kaplan
d) Value Chain Scoreboard by Lev
I metodi di misurazione più noti
associati agli intangibili

Visual EVA Calculation
MARKET
VALUE
EQUITY
DEBT
INTELLECTUAL
CAPITAL
HIDDEN
VALUES
CAPITAL
PRESENT VALUE
of current
Level of EVA
PRESENT
VALUE
of EVA
GROWTH
FUTURE
GROWTH
VALUE
CURRENT
OPERATIONS
VALUE
MARKET
VALUE
ADDED

Knowledge Capital Earnings (KCE) by Baruch Lev

KCE – Despar Nordest
Free Cash Flow Year ending 2012
WACC
Average Annual Earnings (normalised) 7,64,21,964
Financial Assets 66,66,597
Historical Rate of Return on Financial Assets 4.50%
Earnings explained by financial assets 2,99,997
Physical Assets 55,21,92,905
Average After tax return of physical assets 5.00%
Earnings explained by Physical Assets 2,76,09,645
Balance left=Knowledge Capital Earnings(IC) 4,85,12,322
Expected rate of return on KA (WACC) 8.00%
Intangible Asset=Knowledge Capital Knowledge capital discount rate
60,64,04,024

31
• However, investment in intangibles is
associated with high levels of uncertainty in terms
of outcomes and timing
• Hence, intangibles have also a negative side
recent history has shown that intangibles may
“evaporate” very fastly, giving rise to large losses
intangibles hide also a potential liability (e.g.
reputation)
• Fundamental lack of methodologies for
measuring and assessing intangibles-related risks
Intangibles and Risks

Composizione del Capitale
Intellettuale (IC) e del relativo Report
• Batterie di indicatori analitici utilizzate per cogliere i tre profili dell’IC, accompagnati da una «narrativa» manageriale che lega risultati alla strategia aziendale
• Capitale intellettuale dà vita a una nozione di
ricchezza composita e a un report articolato:
- Capitale Umano
- Capitale Organizzativo o Strutturale
- Capitale Relazionale o Clienti
• Elementi dell’IC non hanno proprietà additiva
(manca un minimo comune denominatore)

33
Report del Capitale Intellettuale: Composizione
Strutture Esterne Strutture
Interne
Capitale Relazionale
Capitale Organizzativo
Capitale Umano
Indicatori accompagnati da una “narrativa” che li leghi alla Strategia

34
Report del Capitale Intellettuale
• Clienti
• Fornitori
• Business Partners
• Immagine/Reputazione sul mercato
• Comunicazione
• Know-How
• Innovazione
• Organizzazione
• Controllo di Gestione
• R&D
• Skills e Competenze
• Staff Turnover
• Livello di scolarizzazione
• Leadership del Management
• Employee Satisfaction /Engagement
Capitale Relazionale
Capitale Organizzativo
Capitale Umano

35
Principal Guidelines on IC Reporting
- IFAC, Study no. 7 (1998)
- Danish Agency for Trade and Industry (DATI)
Guidelines (2000; latest edition 2003)
- Nordika Project Guidelines (2001)
- Meritum Project Guidelines (2002)
- German Ministry of Labour (2004, 2006, 2008)
- Japanese Ministry of Economy (METI) (2005-08)
- Australian IC Guidelines (2002 e 2005)
- Putting IC into Practice Guidelines (PIP) by
Nordic countries (2006)
- “Réferentiel français de mesure de la valeur extra-
financière du capital immatérie des entreprises” by
Observatoire de l’Immatériel (Oct. 2011)

WICI World Intellectual Capital/Assets Initiative Network
Global collaborative, non-profit Network,
officially born on 31 March 2008 with the signature of a Memorandum
of Understanding (MoU)
in Washington DC at the American Enterprise Institute (AEI)
W I C I World Intellectual Capital /Assets Initiative
The World’s Business Reporting Network
www.wici-global.com

INTERNATIONAL OVERVIEW of REPORTING SCENE
FINANCIAL REPORTING
A/C STANDARDS
IASB
VALUATION
IVSC / ISO
NON-FINANCIAL REPORTING
SUSTAINABILITY (ENVIRONMENTAL/SOCIAL)
GRI/UN GLOBAL COMPACT/
DJ & FT SUST. INDEX/
SASB
VALUE CREATION (INTANGIBLES/KEY VALUE
DRIVERS)
WICI
EFRAG/OIC/ANC/GASB/FRC
WICI EUROPE/FRANCE/ITALY/JAPAN/USA
IIRC X
B
R
L

38
WICI
(World Intellectual
Capital/Assets Initiative)
WICI Intangibles
Reporting Framework
Released on
22 September 2016
www.wici-global.com
WICI INTANGIBLES REPORTING FRAMEWORK
(WIRF)
• Aimed to fill in a today large “reporting gap” present today,
which is the guidance on measuring and disclosing an
organization’s intangible resources
• It essentially addresses the non-financial (or non-monetary
or extra-financial) information
on intangibles, insofar as financial
information on them is covered by
accounting and valuation standards and
rules
• Auditing issues have intentionally not
been covered 39

Financial report today does not reflect the real strengths of a
company. From current financial information we cannot see:
- the origin of company competitiveness
- its value creation as a combination of company-specific
Intangibles
- the sustainability of its strengths, and
- the company long term value creation capacity
In this situation, financial people cannot properly evaluate a
company.
Therefore, we need some reporting mechanism to describe the
origin of strengths and business sustainability of a company
WICI Framework’s Background

Towards the Concept of «Business Sustainability»
Intangibles and Intellectual Capital
Natural and Societal Capital
Business Model
BUSINESS
SUSTAINABILITY (including financial sustainability)
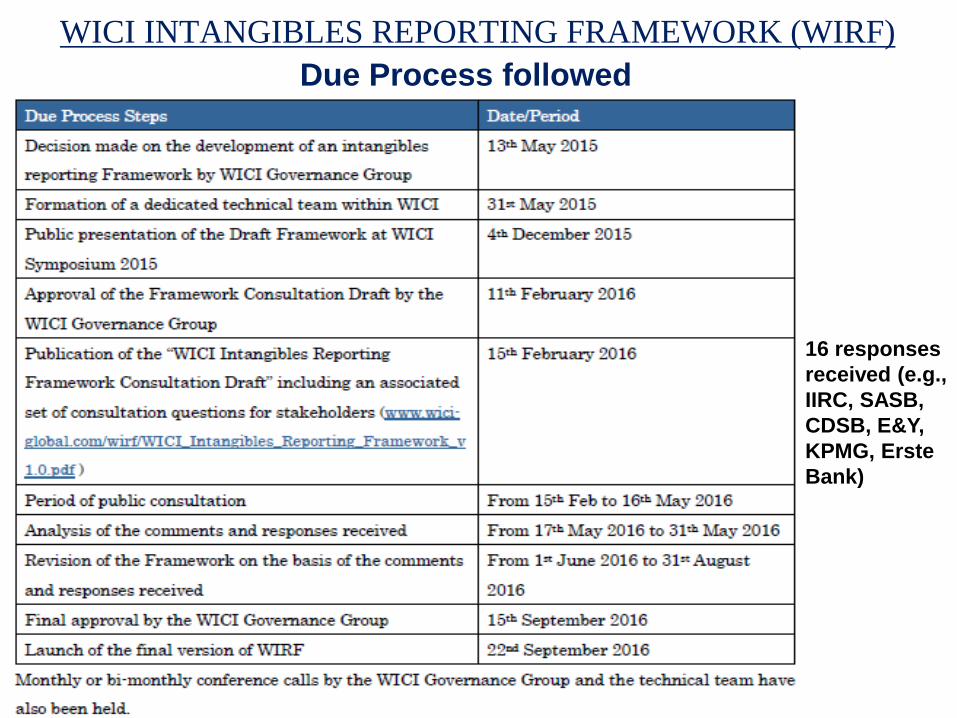
WICI INTANGIBLES REPORTING FRAMEWORK (WIRF)
42
Due Process followed
16 responses
received (e.g.,
IIRC, SASB,
CDSB, E&Y,
KPMG, Erste
Bank)
• WIRF crystallizes in one conceptually consistent
Framework the best practices and proposals that have
emerged in the field of intangibles reporting over the last
twenty years.
• It is important to underline that WIRF is largely based on
an evolutionary interpretation of the 2005 Japanese
Guidelines on “Intellectual Assets based Management”
(IAbM) and the 2008 “Principles for Effective
Communication of Intellectual Capital” by the EFFAS
Commission on “Intellectual Capital”, as well as the
IIRC’s <IR> Framework
43
WICI INTANGIBLES REPORTING FRAMEWORK

WICI INTANGIBLES REPORTING FRAMEWORK
44

Chapter 1 – Rationale and Objective
of the Framework • The purpose of the “WICI Intangibles Reporting Framework” is to
establish the principles, the contents and the structure for the
reporting of intangible resources which are material for an
organization’s value creation process and its communication to
stakeholders.
• The Framework is principles-based
• The primary target audience is all companies and other
organizations of the private, public and not-for-profit sectors.
• Reporting and communication on intangibles are intended to
provide useful information for decision making, and in particular
resource allocation decisions, primarily to the organization’s
management as well as providers of financial capital including
investors, creditors, and analysts. These are expected to be the
primary information users. 45

46
【Figure 1.1】 WICI’s Framework Focus within the corporate
reporting landscape
* Organisational Capital according to WICI Framework

Chapter 2 – Definition of Intangibles (WICI Framework, 2016)
• Intangibles are non-physical resources which, either alone or in
conjunction with other tangible or intangible resources, have a
positive or a negative impact on the value creation of an
organization in the short, medium and long term
• Intangibles may impact two distinct but inter-connected forms
of value:
– Strategic value is that related to the enhancement of the
competitive, market, product, reputation, and/or risk profile
of the organization;
– Financial value is that linked to the generation of net cash
inflows and outflows over time.
• It is not necessary that intangibles are owned or controlled by
an organization. They simply have to be available and/or
utilized by it to generate value new concept of capital
47

Chapter 2 - Definition of Intangibles
(cont’d) (WICI Framework, 2016)
Positive Intangible Resources
They are the drivers of long-term competitive differentiation and
advantage. They derive from a strategic utilization of intangibles
(including combinations of them) that is conducive to an
organization’s sustainable business value and/or sustainable
future stream of cash flows.
Negative Intangible Resources
• Intangibles that may have substantive negative impact on the
organizational business and/or financial value (e.g., bad
reputation of the organization; poor management quality and
leadership).
• Negative intangible resources are often linked to specific risks
of the organization.

Chapter 2 – Definition of Intangibles
(cont’d) (WICI Framework, 2016)
Intellectual Capital
• The above definition of intangible assets is fundamentally
equivalent to the concept of Intellectual Capital.
• Intellectual Capital encompasses the internal (competencies, skills,
leadership, procedures, know-how, etc.) and external (image,
brands, alliances, customer satisfaction, etc.) intangibles which are
dynamically inter-related and available to an organization, thereby
enabling it to transform a set of tangible, financial and human
resources into a system capable of pursuing sustainable value
creation
• Intellectual Capital is typically subdivided into three main
categories, which are 1) Human capital, 2) Relational capital, & 3)
Organizational capital. The boundaries of these categories are flexible
and they should not be interpreted/perceived in a static or rigid way. 49

Chapter 3 – Interpretations of the Principles for
Intangibles Reporting and Communication
- Principles and guidelines from existing corporate reporting
frameworks are well established.
- Rather than presenting new and different intangibles reporting
principles, the role of the WICI Framework is to identify the
most important Principles for intangibles reporting and
communication, and to provide an interpretation of each selected
principle in the context of reporting on intangibles.
Ad hoc references for these Reporting and Communication
Principles are:
- International <IR> Framework (2013)
- Principles for IC Communication by EFFAS Commission on
Intellectual Capital (2008) 50

Chapter 3 – Interpretations of the Principles for
Intangibles Reporting and Communication
Specific interpretations in the context of intangibles reporting
and communication are provided for the following basic
Principles:
- Materiality
- Connectivity
- Conciseness
- Comparability
- Future orientation
51

Chapter 4 – Structure of
Intangibles Reporting
Definition of Key Performance Indicators (KPIs):
“KPIs are numerical figures (metrics) related to
critical/material factors of value creation, and which should
provide objective evidence of performance trends by
tracking them over time.”
The role of KPIs in reporting is to support the narrative
explanation of the organizational strategy linking to past,
present or future financial and/or strategic performance
distinction between lagging and leading KPIs.
52
Chapter 4 – Structure of Intangibles Reporting
(cont’d)
According to their level of relevance, KPIs can be articulated
in three levels (cf. also slide no. 58):
• General KPIs are those that may be relevant for most
organizations across industries and sectors.
• Industry-specific KPIs are those specific to a certain
industry or sector
• Organization-specific KPIs are those specific to each
organization that should be reported in order to best
represent its unique value creation mechanism.
• Examples of industry-based KPIs are those proposed by
the WICI (www.wici-global.com/kpis)
53
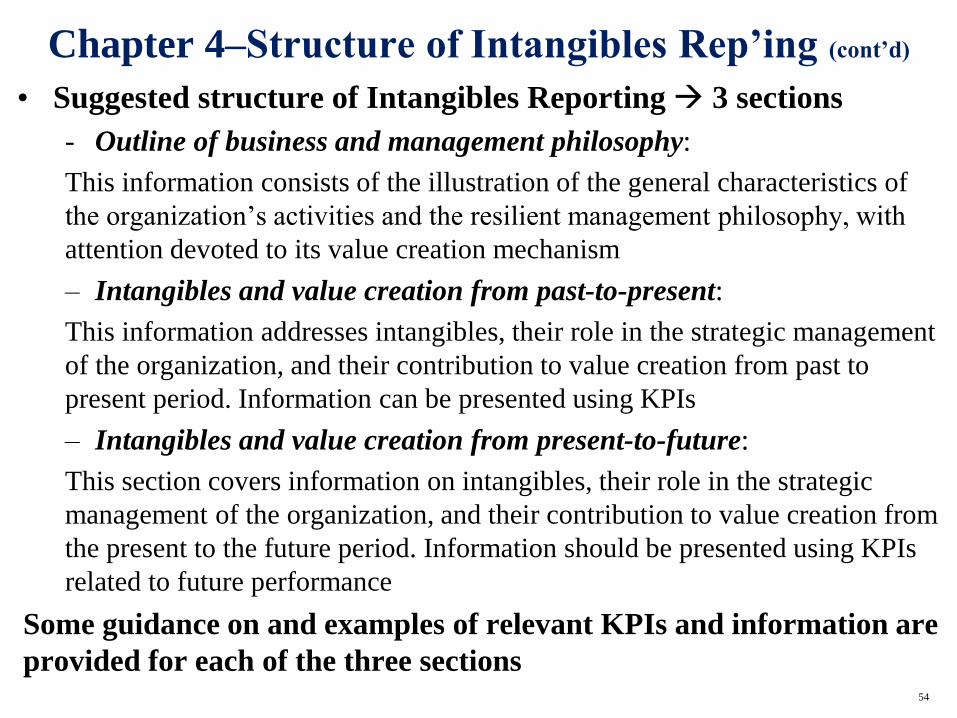
Chapter 4–Structure of Intangibles Rep’ing (cont’d)
• Suggested structure of Intangibles Reporting 3 sections
- Outline of business and management philosophy:
This information consists of the illustration of the general characteristics of
the organization’s activities and the resilient management philosophy, with
attention devoted to its value creation mechanism
– Intangibles and value creation from past-to-present:
This information addresses intangibles, their role in the strategic management
of the organization, and their contribution to value creation from past to
present period. Information can be presented using KPIs
– Intangibles and value creation from present-to-future:
This section covers information on intangibles, their role in the strategic
management of the organization, and their contribution to value creation from
the present to the future period. Information should be presented using KPIs
related to future performance
Some guidance on and examples of relevant KPIs and information are
provided for each of the three sections
54

L’ascesa del Reporting Integrato
• Un Report Integrato è una comunicazione sintetica che illustra come la strategia, la governance, le performance e le prospettive di un'organizzazione consentono di creare valore nel breve, medio e lungo periodo nel contesto in cui essa opera.
• L’azienda per produrre valore utilizza sei forme di capitale che vanno misurate e rappresentate nelle loro mutue connessioni all’interno del Report Integrato: – Capitale finanziario – Capitale infrastruttur.
– Capitale intellettuale/organizzativo – Capitale umano
– Capitale relazionale e sociale – Capitale naturale
• Si noti come tre dei «capitali» del Reporting Integrato abbiano natura intangibile e corrispondano in buona sostanza alla definizione di Capitale Intellettuale generalmente accettata (cfr. anche WICI Framework, 2016)

strategy, governance, performance, prospects
Financial
concise communication about value over time
Intangibles Sustainability
(presented by IIRC CEO, Paul Druckman, at the 9th Workshop on Intangibles and IC, Copenhagen, 26-27 Sept. 2013)

57
WICI KPIs
W I C I Europe
regional jurisdiction of the Global WICI Network
the world's business reporting network
www.wici-global.com

58
General
level
Sector
level
Enterprise
level
Basic Intangibles Indicators
(3-5 max.)
Industry-Specific
Intangibles Indicators
(10-20 max.)
Company-Specific
Intangibles Indicators
(no limit)
Reporting on Intangibles: combining comparability & specificity

THE KPIs PROJECT on
FASHION & LUXURY by the
Joint WICI Europe-EFFAS CIC KPI Task Force-
NIBR/WICI ITALY
W I C I World Intellectual Capital Initiative
The World’s Business Reporting Network
www.wici-global.com

Fashion industry core competencies & value chain
Nurturing talent
quality
Valuable customer
relations
Rapid and quality product innovation
Systematic and
trusted partnering
Organizational
flexibility and adaptability
Efficient and
reliable execution
1
2
3
4
5
6
Core Competencies
Operating processes
Brand
Management Style/Design Production Distribution
Services Partnering

Fashion’s KPIs per core competences
• Average employee’s age and seniority • Staff turnover • Training hours • HR education • Job rotation • MBO • Boutique sales staff training experience • Employee commitment index • High quality recruitment • Management/Employee share of ownership • Annual career review rate • Share of women in upper/top mgmt. • Share of employees in talent programs • Training costs (also per employee) • Access rate to training • Financial KPI forecast hit rate by management • Position in students’ annual employer ranking
survey • Formal mentorship • No. of CVs received • Proportion of staff covered by collective
bargaining agreements • Executive compensation on total revenues/net
income • Share of executive positions filled internally
• Brand value • Number of brands • Loyalty of clients to a specific brand • Customer satisfaction index • Brand awareness • Brand preference • Reputation index/External image • Internet community • Customer list • Behavior of customers on the list in relation
to loyalty activities • Elasticity of demand • Customer loyalty rate • Exhibition participation ratio • Items being bought by customers on the list • Longevity of customers on the list • Top of the line • Avg. breadth of information available on
customers • Advertising costs • % of total income generated from brand
• Number of meetings between purchasers and suppliers
• No. of new patents registered during the year • No. of new products developed • Local production rate • Internal communication • Competitors • Portion outsourced on total sales
• Suppliers by main raw material • Suppliers turnover rate • Dependence rate from key suppliers • Raw materials purchase cost • Raw materials purchase cost by main raw
material • Average distance from key suppliers • Shipment times • Outside contractors' number and saturation
level • External product development • Number of exclusive suppliers vs. total
suppliers • Number of second - tier suppliers that have
become first - tier • Weight of licensing
• Share of employees familiar with strategy • Average expenditure per capita • Employee Satisfaction Index • Child Labour
Rapid and quality product innovation
• Sales by geographic area, main products, lines, brands, distribution channels
• Gross margin by geographic area, main products, brands, distribution channels
• Market share by geographic area • Average number of sales people per 100 sq
meters of shop • Sale volume per square meter • Franchisee average sale • Outlets sales per square metre • DOS sales per square meter • Headcount • Headcount by contract's type • HR absenteeism • Headcount by Department • Number of staff in boutique • Revenue of sales to customers on the list • Number of franchisee • Break - even point of franchisees • Maintenance costs for franchisees • Number of outlets • DOS number of wholesale stores • Maintenance costs and break - even point for
DOS (direct operation stores) • Products selected that were out of stock • Delivery's delay • Delivery costs that were too high • Problems with connection to website • No confirmation or status report given (To be continued)
Valuable customer relationship Nurturing of talent quality 2 1 3
Efficient and reliable execution
Organizational flexibility and adaptability 5
6
4 Systematic and trusted partnering
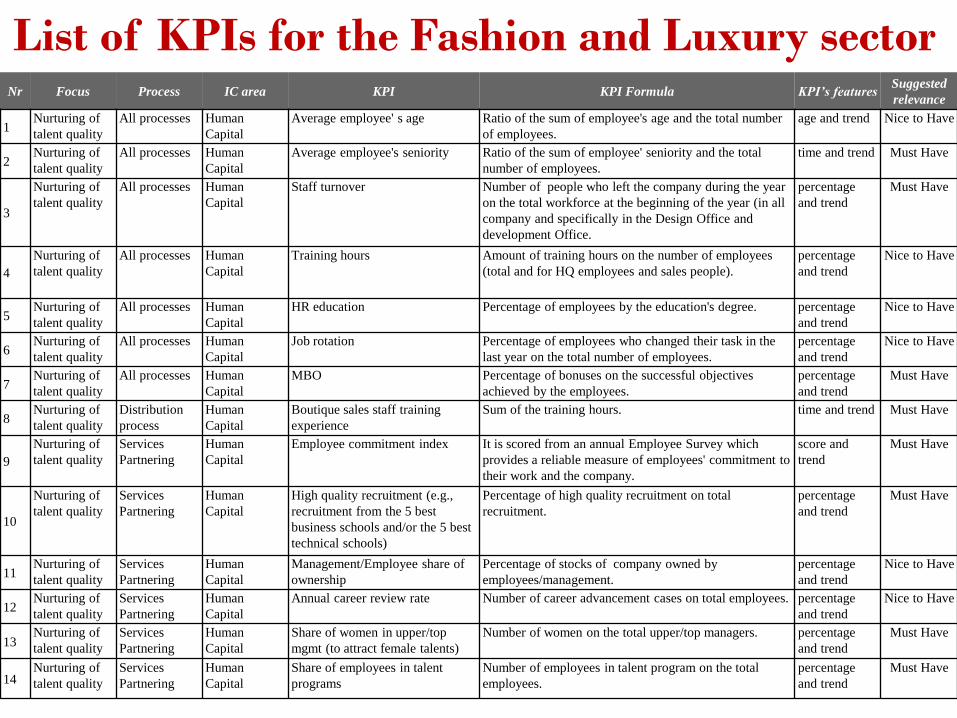
List of KPIs for the Fashion and Luxury sector Nr Focus Process IC area KPI KPI Formula KPI’s features
Suggested
relevance
1 Nurturing of
talent quality
All processes Human
Capital
Average employee' s age Ratio of the sum of employee's age and the total number
of employees.
age and trend Nice to Have
2 Nurturing of
talent quality
All processes Human
Capital
Average employee's seniority Ratio of the sum of employee' seniority and the total
number of employees.
time and trend Must Have
3
Nurturing of
talent quality
All processes Human
Capital
Staff turnover Number of people who left the company during the year
on the total workforce at the beginning of the year (in all
company and specifically in the Design Office and
development Office.
percentage
and trend
Must Have
4
Nurturing of
talent quality
All processes Human
Capital
Training hours Amount of training hours on the number of employees
(total and for HQ employees and sales people).
percentage
and trend
Nice to Have
5 Nurturing of
talent quality
All processes Human
Capital
HR education Percentage of employees by the education's degree. percentage
and trend
Nice to Have
6 Nurturing of
talent quality
All processes Human
Capital
Job rotation Percentage of employees who changed their task in the
last year on the total number of employees.
percentage
and trend
Nice to Have
7 Nurturing of
talent quality
All processes Human
Capital
MBO Percentage of bonuses on the successful objectives
achieved by the employees.
percentage
and trend
Must Have
8 Nurturing of
talent quality
Distribution
process
Human
Capital
Boutique sales staff training
experience
Sum of the training hours. time and trend Must Have
9
Nurturing of
talent quality
Services
Partnering
Human
Capital
Employee commitment index It is scored from an annual Employee Survey which
provides a reliable measure of employees' commitment to
their work and the company.
score and
trend
Must Have
10
Nurturing of
talent quality
Services
Partnering
Human
Capital
High quality recruitment (e.g.,
recruitment from the 5 best
business schools and/or the 5 best
technical schools)
Percentage of high quality recruitment on total
recruitment.
percentage
and trend
Must Have
11 Nurturing of
talent quality
Services
Partnering
Human
Capital
Management/Employee share of
ownership
Percentage of stocks of company owned by
employees/management.
percentage
and trend
Nice to Have
12 Nurturing of
talent quality
Services
Partnering
Human
Capital
Annual career review rate Number of career advancement cases on total employees. percentage
and trend
Nice to Have
13 Nurturing of
talent quality
Services
Partnering
Human
Capital
Share of women in upper/top
mgmt (to attract female talents)
Number of women on the total upper/top managers. percentage
and trend
Must Have
14 Nurturing of
talent quality
Services
Partnering
Human
Capital
Share of employees in talent
programs
Number of employees in talent program on the total
employees.
percentage
and trend
Must Have
3. I CASI BREMBO E
DESPAR NORDEST

BREMBO
“BILANCIO DEL VALORE»
2008
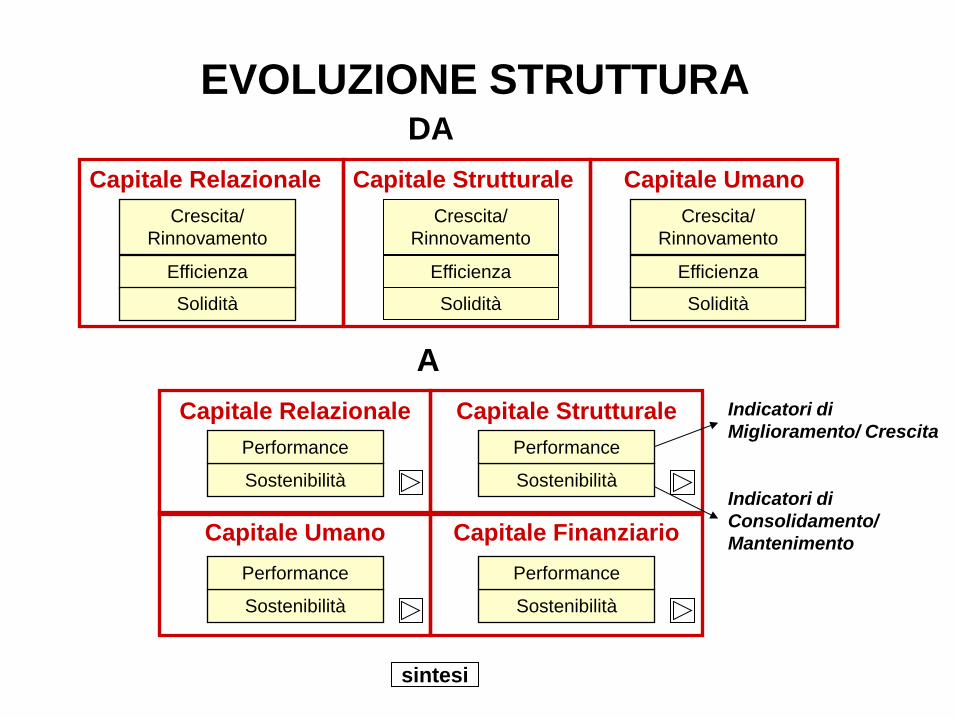
Capitale Relazionale
EVOLUZIONE STRUTTURA
Crescita/
Rinnovamento
Efficienza
Solidità
Capitale Strutturale
Capitale Umano
DA
Crescita/
Rinnovamento
Crescita/
Rinnovamento
Efficienza
Solidità
Efficienza
Solidità
Capitale Relazionale
Sostenibilità
Performance
Capitale Strutturale
Sostenibilità
Performance
Capitale Umano
Sostenibilità
Performance
Capitale Finanziario
Sostenibilità
Performance
A
sintesi
Indicatori di
Miglioramento/ Crescita
Indicatori di
Consolidamento/
Mantenimento

66
Performance • Indice acquisizione fatturato (Clienti esistenti)
• Indice acquisizione fatturato (Clienti nuovi)
• % fatturato prodotti sviluppati negli ultimi 5 anni
• Quota di mercato
• Customer satisfaction index
Sostenibilità • Corporate image (esterna)
• Indice di concentrazione fatturato
• Indice di penetrazione rispetto ai migliori clienti
• % fatturato investita in Marketing e Comunicazione
esterna
Capitale
Relazionale Brembo, 2008

67
Performance
• % copertura dei ruoli da parte dei dipendenti
• Indice di policompetenza
• Livello medio di leadership del management
• Livello di fiducia
• Età media del management
• Indice sintetico di scolarità delle Risorse Umane
Sostenibilità
• % fatturato investita in formazione
• Employee satisfaction index
• Indice di polivalenza
• % rappresentanza femminile nel management
• Turnover (management)
• Turnover (impiegati)
• Turnover (operai)
• Anzianità aziendale media del management
• Anzianità aziendale media del personale
Capitale
Umano
Brembo, 2008

68
Performance
• N° brevetti in produzione / brevetti depositati
• Progetti al gate 7 ok / Organico DT
• Produttività globale
• TRS globale
• Indice di gravità infortuni
• ppm clienti a km 0
• Scarti interni
• % costi non qualità/fatturato
Sostenibilità
• % fatturato investita in R&D
• Proposte di modifica / Progetti attivati
• Customer satisfaction (area tecnica)
• % conformità Audit interni
• Corporate Image (interna)
• Condivisione dei valori
• % fatturato investita in Comunicazione Interna
Capitale
Strutturale Brembo, 2008

IL REPORT INTEGRATO
ASPIAG SERVICE S.R.L.
2011
“above all, integrated reporting is about good business” Integrated Reporting <IR>
“Towards Integrated Reporting”
www.theiirc.org

REPORT INTEGRATO 2011
LA NOVITÀ
DOCUMENTO STRUTTURATO Visione ampia e trasparente dell’attività aziendale
PIANO OPERATIVO IN DUE FASI Fase del reporting combinato
Fase del reporting integrato
IDENTIFICAZIONE DELLE INFORMAZIONI ESISTENTI Organizzazione logica delle relazioni
MISURAZIONE DELLE PERFORMANCE FINANZIARIE E NON FINANZIARIE Selezione degli indicatori
INTEGRAZIONE DEL CAPITALE INTELLETTUALE/INTANGIBILE Rappresentazione di valori inespressi e capacità distintiva

IDENTITÀ DI ASPIAG SERVICE – DESPAR NORDEST
A) STRATEGIA, GOVERNANCE E SISTEMA DEI RISCHI
B) CAPITALE INTELLETTUALE
• Capitale Relazionale
• Capitale Strutturale
• Capitale Umano
C) CAPITALE SOCIALE ED AMBIENTALE
• Indicatori GRI G3.1
• Indicatori della commissione EFFAS CESG
D) CAPITALE ECONOMICO-FINANZIARIO
REPORT INTEGRATO 2011
LA STRUTTURA

a) Crescita e innovazione
1 Rete di vendita e distribuzione diretta
2 Fatturato, clienti, scontrino medio per insegna punti vendita diretti
3 Crescita interna vs crescita esterna
4 Fatturato da clienti aff iliati
5 Marginalità dei prodotti/servizi
6 Investimenti in marketing
7 Eventi sponsorizzati e relativi ammontari
8 Numero di accessi siti w eb
9 Livello di notorietà delle insegne
10 Previsioni di crescita nei prossimi 3 anni
b) Efficienza e qualità
11 Customer satisfaction (via interviste)
12 Qualità percepita dai clienti dei servizi erogati (via "mistery shopping")
13 Corporate Image presso clienti
14 Comunicazioni interne ed esterne
15 Numero e incidenza di resi/anno sulle vendite nette
16 Numero di contenziosi legali in corso
c) Solidità e stabilità
17 Determinazione e riparto del valore aggiunto (secondo GBS)
18 Valor medio dello scontrino nelle migliori fasce (5% e 10%) dei PV diretti
19 Valor medio del fatturato nelle migliori fasce (5% e 10%) dei clienti aff iliati
20 Concentrazione dei fornitori
21 Grado di diversif icazione e di copertura dell’offerta
22 Numero di nuovi prodotti private label lanciati e numero di restyling di grafica
23 Rapporti in essere con i Gruppi bancari
Capitale relazionale
REPORT INTEGRATO 2011
KPIS
a) Crescita e innovazione
1 Investimenti nello sviluppo dei punti vendita
2 Statistiche progetti di apertura nuovi punti vendita
3 Consumo energetico al metro quadrato
4 Percentuale del fatturato investito in infrastrutture IT
5 Investimenti in siti w eb
6 Numero di riunioni di gruppi di lavoro
7 Procedura di pianif icazione
8 Sistema di reporting
9 Importi stanziati per incentivi
b) Efficienza e qualità
10 Audit e verif iche di audit sui fornitori
11 Analisi sui prodotti / tamponi superficiali
12 Analisi acqua
13 Spese correnti per la qualità alimentare
14 Incidenza dei costi della non-eff icienza e qualità su fatturato
15 Attività rivolte al contenimento degli ammanchi inventariali
16 Costi in outsourcing dei sistemi informativi
17 Numero di interventi complessivi di help desk a supporto dei punti vendita
18 Statistiche area tecnica
19 Fatturato, reddito e valore aggiunto per dipendente
c) Solidità e stabilità
20 Rapporto tra personale presso i punti vendita e personale delle sedi
21 Costo complessivo dei dipendenti su fatturato
22 Personale di struttura e relativo costo su fatturato
23 Costo del management su fatturato
24 OPEX su fatturato
Capitale strutturale
a) Crescita e innovazione
1 Numero di dipendenti per categoria (teste medie)
2 Suddivisione dei dipendenti per genere (teste medie)
3 Ripartizione territoriale dei dipendenti (teste medie)
4 Ore di formazione per dipendente (teste)
5 Costi di formazione
6 Reclutamento e selezione
7 Numero di job description integrate relative posizioni professionali chiave
8 Livello di istruzione (teste)
9 Livello di specializzazione (FTE)
b) Efficienza e qualità
10 Numero dei dipendenti che ha percepito un premio (teste)
11 Numero dei dipendenti che ha ricevuto un aumento di merito (teste)
c) Solidità e stabilità
12 Età anagrafica media del management e del personale dipendente (anni)
13 Anzianità media di lavoro in Azienda (anni)
14 Percentuale dipendenti con anzianità aziendale inferiore ai 2 anni (teste)
15 Dipendenti con contratto a termine (teste medie)
16 Percentuale di turnover in uscita totale
17 Assenteismo del personale
18 Numero vertenze legali
19 Numero ore di sciopero
Capitale umano

4. RIFLESSIONI
SUL MODELLO
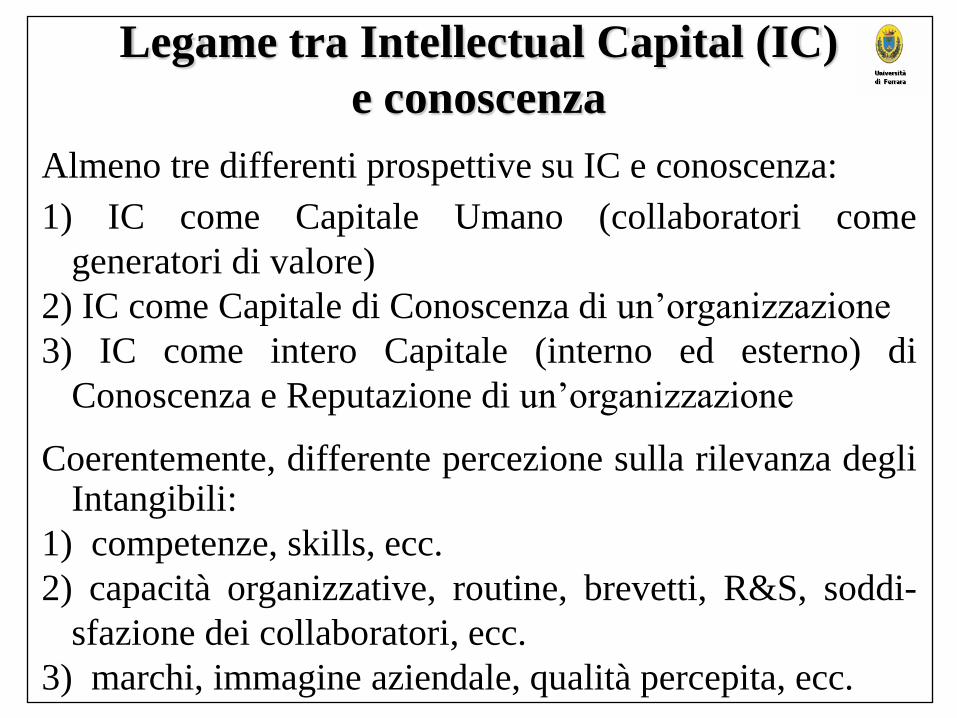
Legame tra Intellectual Capital (IC)
e conoscenza
Almeno tre differenti prospettive su IC e conoscenza:
1) IC come Capitale Umano (collaboratori come
generatori di valore)
2) IC come Capitale di Conoscenza di un’organizzazione
3) IC come intero Capitale (interno ed esterno) di
Conoscenza e Reputazione di un’organizzazione
Coerentemente, differente percezione sulla rilevanza degli Intangibili:
1) competenze, skills, ecc.
2) capacità organizzative, routine, brevetti, R&S, soddi-
sfazione dei collaboratori, ecc.
3) marchi, immagine aziendale, qualità percepita, ecc.
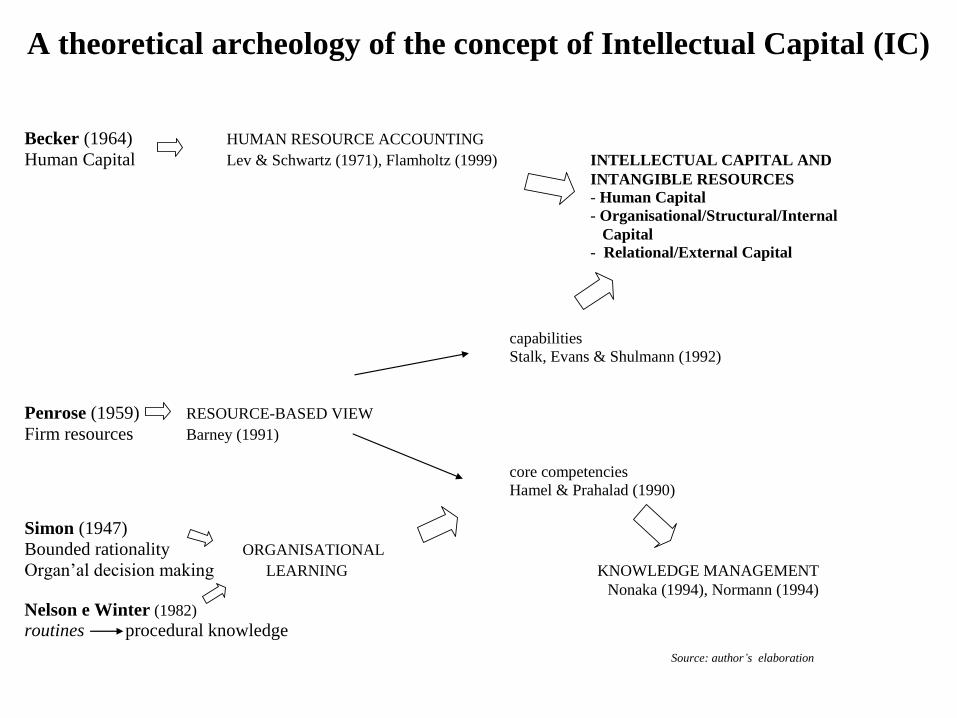
A theoretical archeology of the concept of Intellectual Capital (IC)
Becker (1964) HUMAN RESOURCE ACCOUNTING
Human Capital Lev & Schwartz (1971), Flamholtz (1999) INTELLECTUAL CAPITAL AND
INTANGIBLE RESOURCES
- Human Capital
- Organisational/Structural/Internal
Capital - Relational/External Capital
capabilities
Stalk, Evans & Shulmann (1992)
Penrose (1959) RESOURCE-BASED VIEW
Firm resources Barney (1991)
core competencies
Hamel & Prahalad (1990)
Simon (1947)
Bounded rationality ORGANISATIONAL
Organ’al decision making LEARNING KNOWLEDGE MANAGEMENT
Nonaka (1994), Normann (1994)
Nelson e Winter (1982)
routines procedural knowledge
Source: author’s elaboration
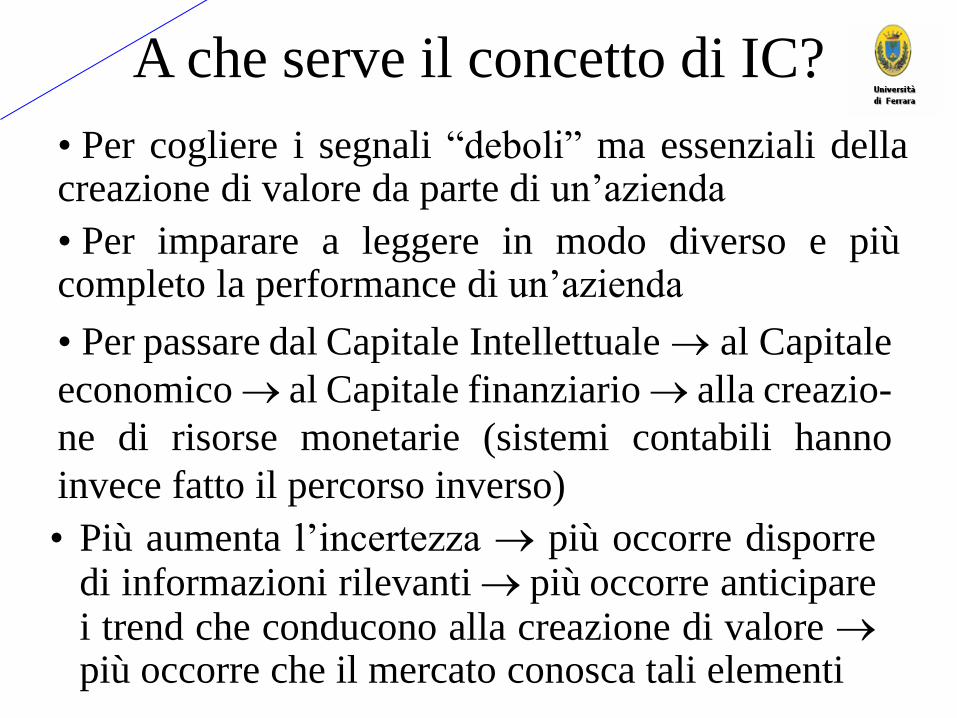
A che serve il concetto di IC?
• Più aumenta l’incertezza più occorre disporre di informazioni rilevanti più occorre anticipare i trend che conducono alla creazione di valore più occorre che il mercato conosca tali elementi
• Per cogliere i segnali “deboli” ma essenziali della creazione di valore da parte di un’azienda
• Per imparare a leggere in modo diverso e più completo la performance di un’azienda
• Per passare dal Capitale Intellettuale al Capitale
economico al Capitale finanziario alla creazio-
ne di risorse monetarie (sistemi contabili hanno
invece fatto il percorso inverso)
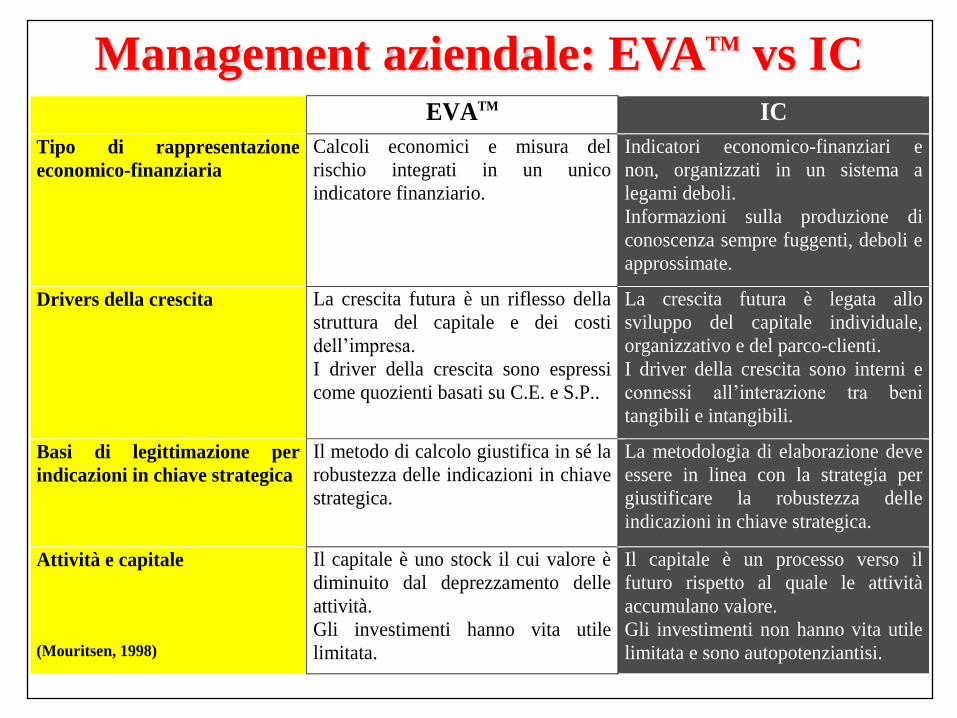
Management aziendale: EVATM vs IC EVATM IC
Tipo di rappresentazione
economico-finanziaria
Calcoli economici e misura del
rischio integrati in un unico
indicatore finanziario.
Indicatori economico-finanziari e
non, organizzati in un sistema a
legami deboli.
Informazioni sulla produzione di
conoscenza sempre fuggenti, deboli e
approssimate.
Drivers della crescita La crescita futura è un riflesso della
struttura del capitale e dei costi
dell’impresa.
I driver della crescita sono espressi
come quozienti basati su C.E. e S.P..
La crescita futura è legata allo
sviluppo del capitale individuale,
organizzativo e del parco-clienti.
I driver della crescita sono interni e
connessi all’interazione tra beni
tangibili e intangibili.
Basi di legittimazione per
indicazioni in chiave strategica
Il metodo di calcolo giustifica in sé la
robustezza delle indicazioni in chiave
strategica.
La metodologia di elaborazione deve
essere in linea con la strategia per
giustificare la robustezza delle
indicazioni in chiave strategica.
Attività e capitale
(Mouritsen, 1998)
Il capitale è uno stock il cui valore è
diminuito dal deprezzamento delle
attività.
Gli investimenti hanno vita utile
limitata.
Il capitale è un processo verso il
futuro rispetto al quale le attività
accumulano valore.
Gli investimenti non hanno vita utile
limitata e sono autopotenziantisi.
- Il concetto di capitale intellettuale è potenzialmente un rilevante strumento di catalizzazione/ mobilizzazione di attenzione e risorse aziendali
- Debole (fuzzy) però come strumento di misura delle performance.
- Studi gli attribuiscono comunque una value relevance in termini di mercato finanziario
- Liaison dangereuse con il management accounting (terminologie diverse: non-financial measures) e con la strategia?
Il Capitale Intellettuale come modello di valutazione della
performance aziendale

79
Alcune questioni aperte sulle
metriche non-finanziarie dell’IC
Despite their value and innovativeness, these measures
face some critical issues concerning their:
- consistency / comparability
- reliability (auditability)
- thoroughness / completeness
- meaningfulness:
a) subjectivity in the choice of the “useful” indicators
b) indicators do not possess additive properties
c) high company specificity of indicators

80
Alcune questioni teoriche aperte sul
modello di misura legato a Intangibles/IC
- Gli intangibili sono trasversali di per sé non producono valore,
ma devono essere collegati ad altri intangibili e/o ai tangibili
- Lo studio degli intangibili dovrebbe quindi essere largamente di
natura interdisciplinare problematico in un contesto teorico
fortemente frammentato. Ad es., nel campo dello strategic man’t la
resource-based view ha prodotto contributi rilevanti su ruolo compe-
titivo delle risorse di conoscenza (es. Barney, 1991; Nonaka, 1991;
Grant, 1997), mentre Teece (2015) propone teoria d’impresa basata su
intangibles ma poca connessione con studi su reporting/misuraz.
- «Ma non è accounting!» forte resistenza da parte della pratica
ma anche dell’accademia. Poche riviste specializzate, e scarsa
apertura da parte di riviste più blasonate
- Necessità di «fine tuning» concettuali. Ad es. che differenza c’è tra
intangibles e capitale intellettuale? Contributo del WICI Framework

UN’«INQUIETANTE»
DOMANDA FINALE
Ma se gli intangibili (e il capitale intellettuale) sono
così importanti, perché la loro misura/reporting non
si è diffusa nelle prassi delle imprese e nella
professione? Perché «intangibile» deve far rima con
«invisibile»?
A fronte di un’indiscutibile rilevanza teorica e
«sistemica», come mai questo modello non ha
trovato riscontro a livello micro, mentre a livello
macro (es. nuovo calcolo del PIL) si sono fatti passi
da gigante?

POSSIBILI RISPOSTE - Modello di misura e valutazione delle performance «difficile» e
sofisticato, non sufficientemente conosciuto e compreso
- Modello di reporting solo relativamente capace di rappresentare
quello che intende rappresentare come detto, di per sé intangibili
non creano valore se non assieme ad altri intangibili e ai tangibili e
collegati a una strategia/modello di business
- Forti impatti organizzativi, con visibilità non necessariamente
desiderata da parte del management (o di alcuni suoi componenti)
- Suscettibile di atteggiamenti opportunistici o scettici («non c’è
bisogno», «più che intangibile è inesistente», ecc.)
Tuttavia, quale «araba fenice», gli intangibili stanno riappaiono in altri
modelli di misurazione della performance reporting integrato, report
di sostenibilità, balanced scorecard
Prevedibile importanza crescente delle metriche sugli intangibles in Italia
a fronte della richiesta della nuova legge fallimentare della messa in
opera di sistemi di allerta aziendali (early warnings)

5. CONSIDERAZIONE
CONCLUSIVA

Siamo di fronte a una palese contraddizione:
- le imprese - come il sistema economico - sono
sempre più basate sugli intangibili, ma
contestualmente divengono sempre più vulnerabili
(cfr. intangibles-related risk) e sempre meno
“comprese” per la forte carenza e frammentarietà
delle informazioni sulle risorse intangibili, cruciali
in questo nuovo contesto
Considerazione conclusiva
La sfida che rimane aperta è quella di comprendere
e apprendere come misurare e rendicontare in questo
nuovo sistema economico “intangibles-based”

GRAZIE!
Prof. Stefano Zambon
Global Chairman, WICI
W I C I
Global WICI Network the world's business reporting network
www.wici-global.com