working%20 paper%20249
DESCRIPTION
TRANSCRIPT
Working Paper No. 249
The Service Sector as India’s Road to
Economic Growth?
Barry Eichengreen
INDIAN COUNCIL FOR RESEARCH ON INTERNATIONAL ECONOMIC RELATIONS
Working Paper No. 249
The Service Sector as India’s Road to
Economic Growth?
Barry Eichengreen Poonam Gupta
April 2010
INDIAN COUNCIL FOR RESEARCH ON INTERNATIONAL ECONOMIC RELATIONS
The Service Sector as India’s Road to
INDIAN COUNCIL FOR RESEARCH ON INTERNATIONAL ECONOMIC RELATIONS
Contents Foreword ......................................................................................................................... i
Abstract .......................................................................................................................... ii
1. Introduction ............................................................................................................... 1 2. Growth and Structural Transformation in International Perspective ........................ 2
3. Where is Service-Sector Growth Concentrated? ...................................................... 4
4. International Comparisons ........................................................................................ 5 5. Accounting for Service Sector Growth ..................................................................... 6 6. Proximate Determinants of Service Sector Growth .................................................. 9
7. Employment in Services ......................................................................................... 10 8. Conclusion .............................................................................................................. 11 References .................................................................................................................... 13 Appendix A: Issues Related to Measurement and Quality of the NAS Data ............. 15
Appendix B: Data Sources .......................................................................................... 21 Appendix C: Construction of Services Characteristics ............................................... 22
Appendix D: Correlation Between Growth Across Sectors ....................................... 23
List of Tables Table 1: Characteristics of Different Services ............................................................ 34 Table 2: Growth Rates and Sectoral Shares of Different Services in India ................ 35
Table 3: Service Input per unit of Output in Agriculture and Industry in India ......... 36
Table 4: Explaining the Growth in Services in India .................................................. 36
Table 5: Employment Elasticity in India using the data from the NSS ...................... 37
Table 6: Employment Elasticity of Growth in Different Service Activities in Cross Country Data ................................................................................................ 38
List of Figures Figure 1: Shares of Agriculture, Industry and Services in India................................. 24
Figure 2: Sectoral Growth Rates .................................................................................. 24 Figure 3: Services Sector Share in GDP and Log Per Capita Income ........................ 25
Figure 4: Industry’s Share in GDP and Per Capita Income ........................................ 25
Figure 5: Size of Specific Services in India ................................................................ 26 Figure 6: Size of Service Activities in Different Groups ............................................ 27
Figure 7: Contribution of Various Services to Total Services Growth ....................... 28
Figure 8: Size of Different Service Activities and Per Capita Income-Cross Country Experience and India ................................................................................... 29
Figure 9: Different Uses of Services as per cent of Total Services ............................ 30
Figure 10: Different Uses of Services as Per Cent of Total Services Value Added across Countries ........................................................................................... 30
Figure 11: Exports of Services .................................................................................... 31 Figure 12: Composition of Services Exports from India ............................................ 31
Figure 13: Composition of Exports of Miscellaneous Services.................................. 32
Figure 14: Services Growth in India Attributed to Growth in End Use ..................... 32
Figure 15: Share of Different Services groups in GDP and Employment .................. 33
India holds a reputation of cultivating a mostly on information and communications technology. of its services sector are nonetheless the rapid growth of service sector employmentactivities previously conduc In this paper, Barry Eichengreen and Poonam Gupta growth in the services sector and assess the employmentservices in India. They find that there is an increasingly similar mix of skilledunskilled labor in the services and manufacturing sectors. They ask whether India should continue exploiting its comparative advantage in services instead of following the usual route to economic growth in the process of economic development consists in building-up labourare in fact complementary strategies for enhancing economic growth and raising living standards in the country.
April 20, 2010
i
Foreword
India holds a reputation of cultivating a large and dynamic services mostly on information and communications technology. The quality and of its services sector are nonetheless questioned by some sceptics on the grounds that the rapid growth of service sector employment simply reflects a relabelling of activities previously conducted in house by manufacturing firms.
Barry Eichengreen and Poonam Gupta analyze the determinants of growth in the services sector and assess the employment-generating capacity of services in India. They find that there is an increasingly similar mix of skilled
labor in the services and manufacturing sectors. They ask whether India should continue exploiting its comparative advantage in services instead of following the usual route to economic growth in the process of economic development
up labour-intensive manufacturing–, or if these two approaches are in fact complementary strategies for enhancing economic growth and raising living standards in the country.
(Rajiv Kumar)Director and Chief Executive
sector centered quality and sustainability
on the grounds that simply reflects a relabelling of
analyze the determinants of generating capacity of
services in India. They find that there is an increasingly similar mix of skilled-labor in the services and manufacturing sectors. They ask whether India
should continue exploiting its comparative advantage in services instead of following the usual route to economic growth in the process of economic development –which
, or if these two approaches are in fact complementary strategies for enhancing economic growth and raising
(Rajiv Kumar)
Director and Chief Executive
ii
Abstract Among fast growing developing countries, India is distinctive for the role of the service sector. However, sceptics have raised doubts about both the quality and sustainability of the increase in service sector activity and its implications for economic development. Using National Accounts Statistics and cross-county data, we show that the growth of services has been broad-based. We show that the growth of service sector employment is not simply disguised manufacturing activity. We also find that the skilled-unskilled mix of labour in the two sectors is becoming increasingly similar. Hence, it is no longer obvious that manufacturing is the main destination for the vast majority of Indian labour moving into the modern sector and that modern services are only a viable destination for the highly skilled few. To the extent that the expansion of both modern manufacturing and modern services is constrained by the availability of skilled labour, this just underscores the importance for India of continuing to invest in labour skills. We conclude that sustaining economic growth and raising living standards will require shifting labour out of agriculture into both manufacturing and services and not just into one or the other. _______________________________
Keywords: Services, Growth, Structural change, India, Employment
JEL Classification: O10, O11, O14
1
The Service Sector as India’s Road to Economic Growth? 1
Barry Eichengreen and Poonam Gupta 1. Introduction Among fast growing developing countries, India is distinctive for the role of the service sector. Where earlier developers grew on the basis of exports of labour-intensive manufactures, India has concentrated on services. Although there are other emerging markets where the share of services in GDP exceeds the share of manufacturing, India stands out for the size and dynamism of its service sector. Sceptics have raised doubts about both the quality and sustainability of the increase in service sector activity. They have observed that employment in services is concentrated in the informal sector, personal services and public administration, activities with relatively little scope for productivity improvement and limited spillovers. They downplay information technology and communications-related employment on the grounds that these sectors are small and use little unskilled labour, the implication being that a labour-abundant economy cannot rely on them to move people out of low-productivity agriculture.2 They worry that the rapid growth of service sector employment simply reflects the outsourcing to service sector providers of activities previously conducted in house by manufacturing firms; in other words, it is little more than a relabelling of existing employment than new jobs. They thus question whether shifting labour from agriculture directly to services confers the same benefits, in terms of productivity growth and higher living standards, as the more conventional pattern of shifting labour from agriculture to manufacturing in the early stages of economic development. In this paper, we use National Accounts Statistics (NAS) and cross-country data from the World Development Indicators and EUKLEMS to address these issues.3 We estimate the relative importance of final consumption, intermediate consumption and exports as sources of demand for services. Drawing evidence from the experience of other countries, we attempt to infer the employment-generating capacity of services in India. We find that the growth of services in India has been broad-based, although it has been unusually rapid in modern services like communications, business services and financial services. In practice, services that are tradable internationally have grown fastest.4
1 University of California, Berkeley and Indian Council for Research on International Economic
Relations (ICRIER), Delhi, respectively. Comments are welcome at [email protected] and [email protected]
2 See e.g. Acharya (2003) and Panagariya (2008). 3 Gupta and Gordon (2001), Mattoo and Mishra (2001), Bosworth, Collins and Virmani (2007) have
raised doubts about the quality of the National Accounts Statistics (NAS) data used to compare the growth of the agricultural, industrial and service sectors. We discuss data related issues in detail in Appendix A and suggest ways to improve it.
4 Service-sector exports have also held up slightly better than merchandise exports in the crisis, reflecting lesser effects from the disruption of trade credit and the absence of sharp inventory adjustments like those affecting sectors involved in commodity trade. The resilience of services trade
2
We reject the claim that the growth of the service sector is simply disguised manufacturing activity. Only a small fraction of the growth of demand, in fact, derives from the outsourcing of activities from manufacturing to services. Rather, most production that does not go towards exports derives from the growth of final demand at home. The growth of service-sector employment does more to add to total employment outside agriculture than outsourcing arguments would lead one to expect. This suggests that policy makers should continue to encourage exports of IT, communications, financial and business services while also liberalising activities like education, health care and retail trade where regulation has inhibited the ability of producers to meet domestic demand. Finally, we observe that the skill content of labour employed in both manufacturing and in services is increasing and shows tendencies towards convergence. It is not as if manufacturing employs only low-skilled labour while modern services employ only high-skilled labour. Both sectors are moving towards the employment of skilled labour; the skilled-unskilled mix of labour in the two sectors is becoming increasingly alike. Hence, it is no longer obviously the case that manufacturing is the exclusive destination for the vast majority of Indian labour moving into the modern sector and that modern services are a viable destination only for the highly skilled few. To the extent that the expansion of both modern manufacturing and modern services is constrained by the availability of skilled labour, this just underscores the importance for India of continuing to invest in labour skills.5 We conclude that sustaining economic growth and raising living standards will require shifting labour out of agriculture into both manufacturing and services, not just into one or the other. The argument that India needs to build up labour-intensive manufacturing and the argument that it should exploit its comparative advantage in services are often posed in opposition to one another. We argue, in contrast, that these two routes to faster growth and higher incomes are complements, not incompatible alternatives. 2. Growth and Structural Transformation in Interna tional Perspective We start by viewing the evolution of sectoral shares in India from an international perspective. Figure 1 displays the shares of agriculture, industry and services in GDP. It shows how the share of agriculture (the dashed line) has fallen from 55 per cent in 1950-51 to less than 18 per cent in 2007-08.6 The steadiness of the decline is its most eye-catching feature. The rise of industry, in contrast, has been episodic. The share of manufacturing rose rapidly in the first 15 post-independence years, reflecting Nehru’s emphasis on heavy industry, but more modestly from the mid-1960s through to the
is not specific to India but seems to be present in other countries as well. Borchert and Mattoo (2009) show that services exports and imports have fallen less sharply in the US, OECD countries, and India and China in the current global slowdown. They also show that the trade of services, which are related closely with goods trade, such as transport and financial services, has declined more sharply than the trade of professional and business services (the latter even increasing in some instances).
5 Though manufacturing perhaps relies more on infrastructure and is affected more by labour laws than services.
6 CSO, the main source of data for GDP and sectoral growth rates, defines agriculture as including forestry and fishing; and industry as encompassing manufacturing, electricity, gas and water, mining and quarrying and construction. Year 2007-08 refers to April 2007-March 2008 in India or fiscal year 2008.
3
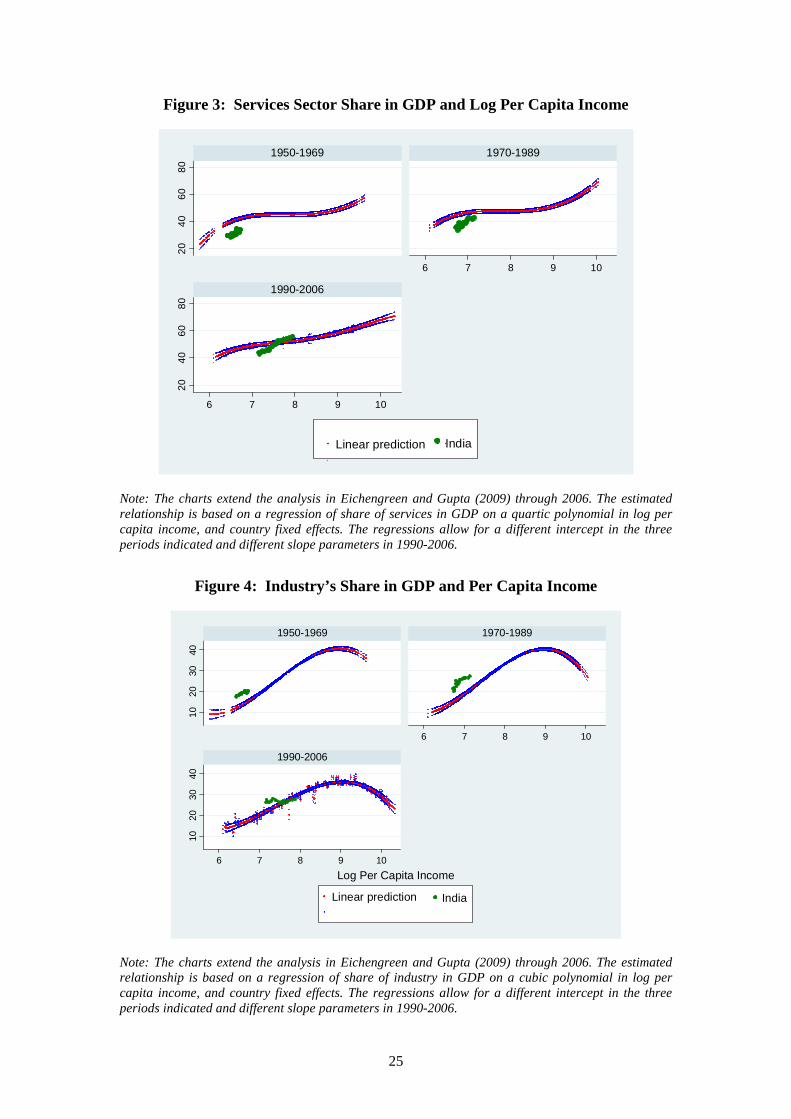
early 1990s. Following an increase at the outset of the 1990s, reflecting a wave of liberalisation, industry’s share then stagnated. Meanwhile, the share of the service sector increased from 30 per cent of GDP in 1950 to 55 per cent in 2007-08, rising at an accelerating pace as the period progressed. Figure 2 shows the average growth rates of agriculture, services, manufacturing and industry over these periods. It reveals even more clearly how the growth rate of services has accelerated while that of agriculture has declined.7 Next, we show the shares of services and industry in GDP at different levels of per capita income in different countries. We estimate the relationship between the share of services in GDP and per capita income as a quartic polynomial in log per capita income for a sample of some 80 countries for 1950-2006.8 We show the respective two standard deviation bands and distinguish the periods 1950-1969, 1970-1989, and 1990-2006. Based on these regressions, the service sector appears to grow in two waves (see Figure 3). In the first wave, its share of output rises but at a decelerating pace, levelling out at a per capita income of $1,800 in year 2000 US purchasing-power-parity dollars. In the second wave, the share of the service sector begins climbing again at a per capita income of roughly $4,000 before levelling off again. The evidence also suggests that the second wave starts at lower incomes after 1990 than before.9 Against this backdrop, we superimpose the observations for India (in dots). Evidently, the Indian service sector was stunted all through the 1950-1990 period with the gap widening after 1960. Although the share of services rose rapidly starting in the 1980s, India continued to lag the international norm. After 1990, there was then rapid convergence to the predicted level. By 2005, the share of India’s service sector increased to a level significantly above that predicted by the international cross section for a country with its level of per capita income. Figure 4 is the analogous relationship for industry.10 It shows that the share of industry rises rapidly at low incomes, peaking at around 40 per cent of GDP and an
7 Contrary to the perception of poor industrial sector performance, the growth of industry has in fact
averaged 6-7 per cent since 1990, and even higher since the turn of the century. Manufacturing (industry net of mining and quarrying, electricity, gas, water and construction) has grown by a robust 8 per cent a year during 2000-2007.
8 Regressions include country fixed effects, and allow for different intercepts in 1970-1989 and in 1990-2006; and a different slope in 1990-2006 (for details see Eichengreen and Gupta (2009)). The data are from the World Development Indicators, which defines, consistent with the CSO, agriculture as agriculture, forestry and fishing; and industry as manufacturing, electricity, gas and water, mining and quarrying and construction.
9 The evidence also shows that this two-wave pattern and specifically the greater importance of the second wave in medium-to-high-income countries is most evident in democracies, in countries that are close to major financial centres, and in economies that are relatively open to trade (and especially to trade in services). See Eichengreen and Gupta (2009).
10 The estimated size of share of industry in GDP is based on a cubic polynomial relationship between the industry share and log per capita income. As before, regressions include country fixed effects and allow for different intercepts in 1970-1989 and in 1990-2006; and a different slope in 1990-2006. The behaviour of agriculture’s share in GDP in India is unexceptional. It is right on top of the
4
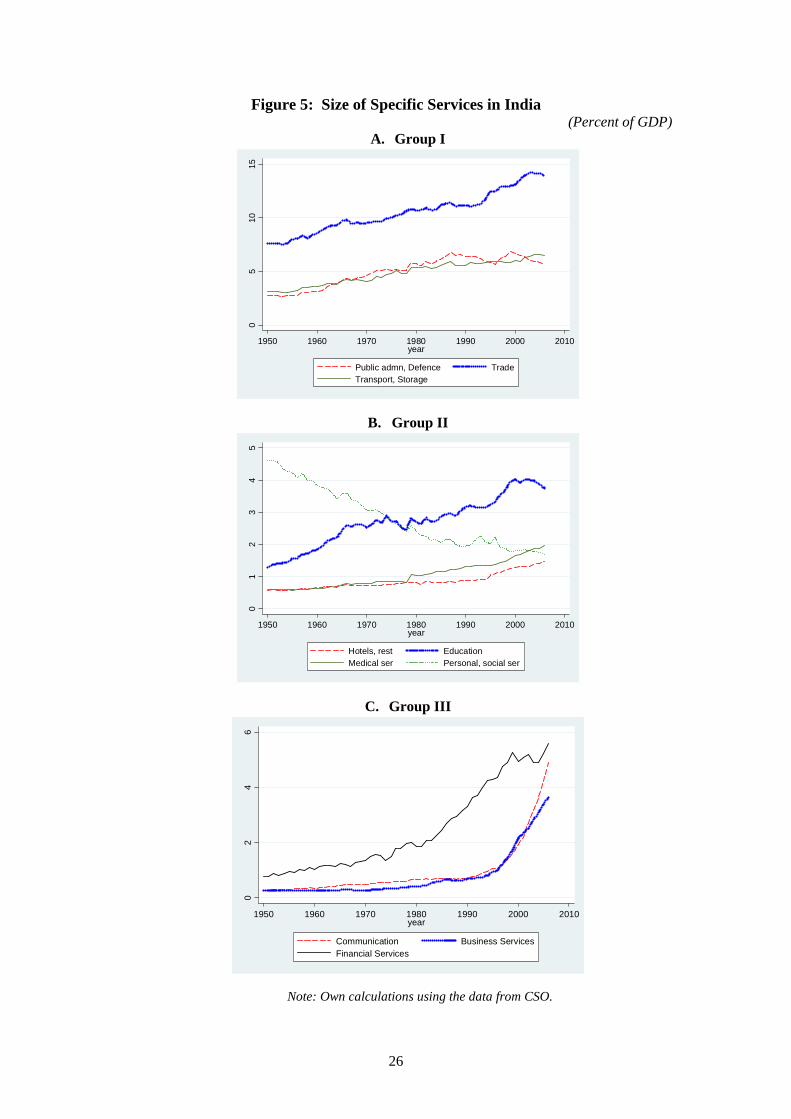
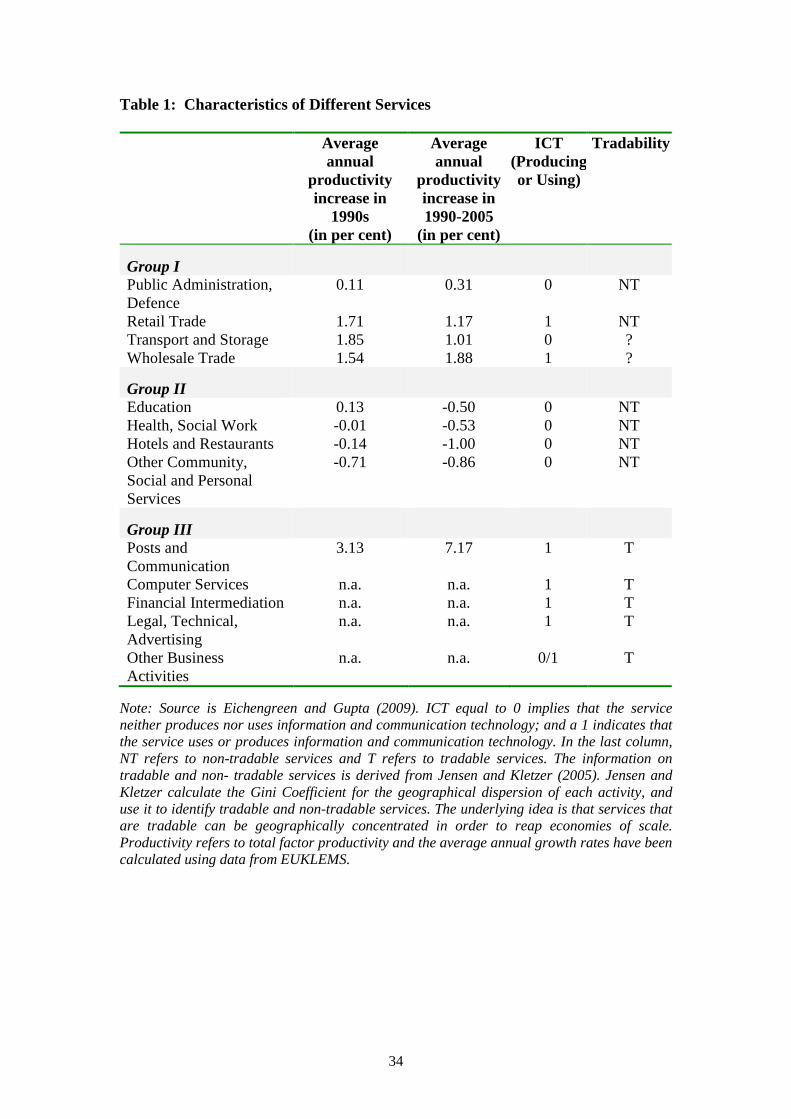
income level of $8,000 (in year 2000 US purchasing power parity dollars). Evidently, the share of the industrial sector has tended to peak at a lower level of per capita income over time. The observations for India suggest that until the mid-1990s, the industrial sector was larger than the international norm. Since then, the pace of growth in industry has been the same as that of overall GDP, thus keeping the share of industry stagnant. The relatively low share of manufacturing in India has been bemoaned for failing to provide an alternative to agriculture; these charts provide a hint that services have helped to pick up the slack. 3. Where is Service-Sector Growth Concentrated? Some observers worry that the growth of services is concentrated in the informal sector, personal services, and public administration, activities with little scope for productivity improvement and with limited spillovers. To shed further light on these patterns, we distinguish three groups of services according to whether their shares in GDP in the OECD countries have fallen, risen slowly, or risen rapidly.11 Group 1 is made up of traditional services – retail and wholesale trade, transport and storage, public administration and defence – whose share in GDP has fallen in the advanced countries. Group II is a hybrid of traditional and modern services consumed mainly by households – education, health and social work, hotels and restaurants, and other community, social and personal services – whose shares rise linearly with per capita income and slowly with time, and linearly with per capita income. Group III is made up of modern services consumed by the household and corporate sectors – financial intermediation, computer services, business services, communications, and legal and technical services – whose share in GDP in the OECD countries has risen rapidly.12 Productivity growth has been the highest, predictably, in Group III (Table 1). More surprisingly, productivity increases have also been relatively rapid in Group I, some of whose components such as retailing and wholesaling have made extensive use of IT.13 The presumption, then, is that the decline in the share of output accounted for by Group I reflects a relatively low income elasticity of demand. It is in Group II where the cost-disease problem (the low productivity growth sometimes thought to be characteristic of services) appears to be the most serious. Service-sector growth is widespread across activities (Figure 5). However, the fastest growing are business services, communication and banking, all of which belong to Group III. Business services, which include computer-related services, machinery rental, accounting, legal services, technical services, and research, of which computer services (which accounted for about four-fifths of business services in 2005-06) is the single fastest-growing segment. Financial services include banking and insurance, with banking being the largest and fastest growing. Other rapidly growing sectors
predicted downward sloping relationship with respect to income. To save space, we do not show the figure for the share of agriculture here.
11 Gordon and Gupta (2004) working on similar Indian data divided the services sector into two groups, the trend growers and the fast growers. The group of trend growers matched roughly with services included in group I here and fast growers included activities in groups II and III here.
12 For details on the growth and shares of different activities in OECD countries in these three groups, see Eichengreen and Gupta (2009).
13 Suggestively, Group II ranks lowest in terms of the application of information technology. It also has the least tradability, suggesting that limits on international competition and scope for specialisation may be further factors in its low productivity growth.
5
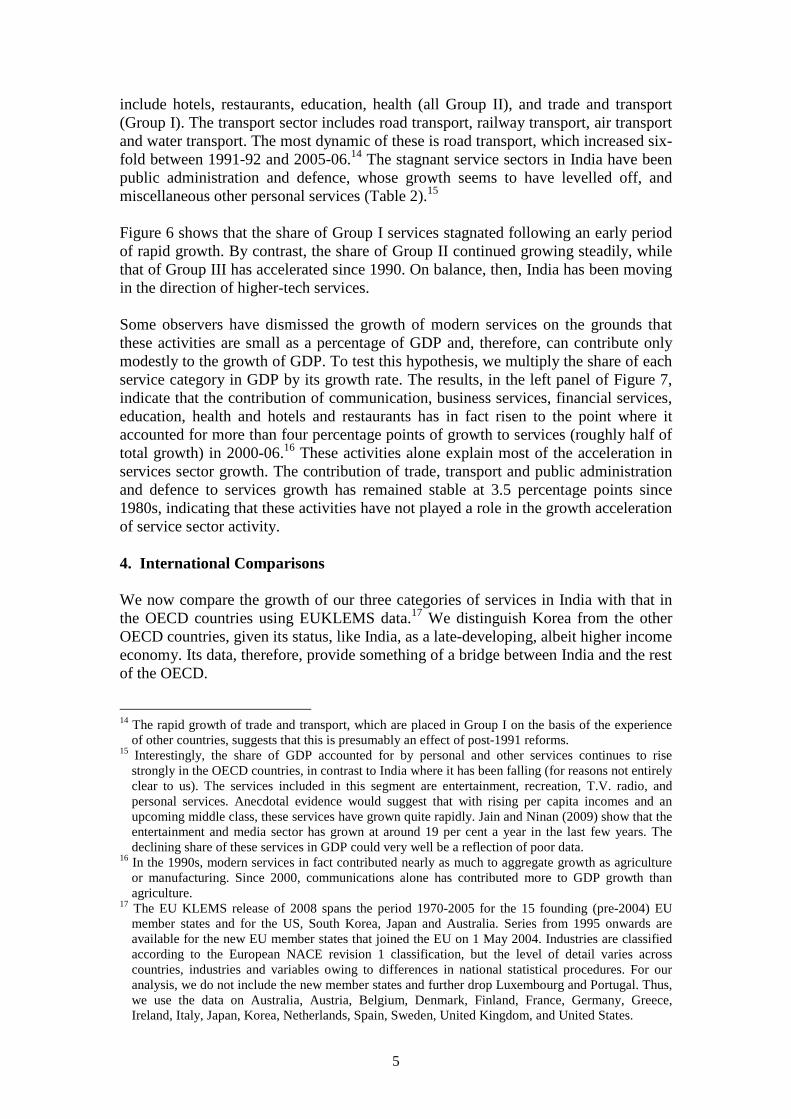
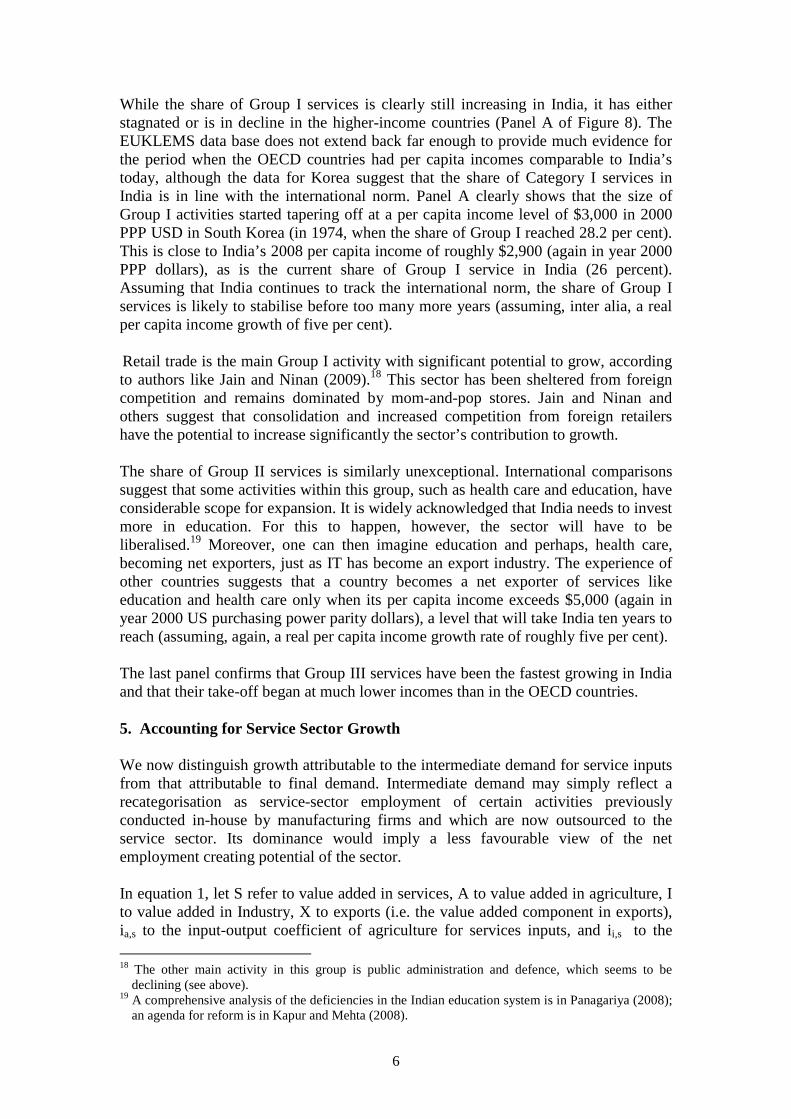
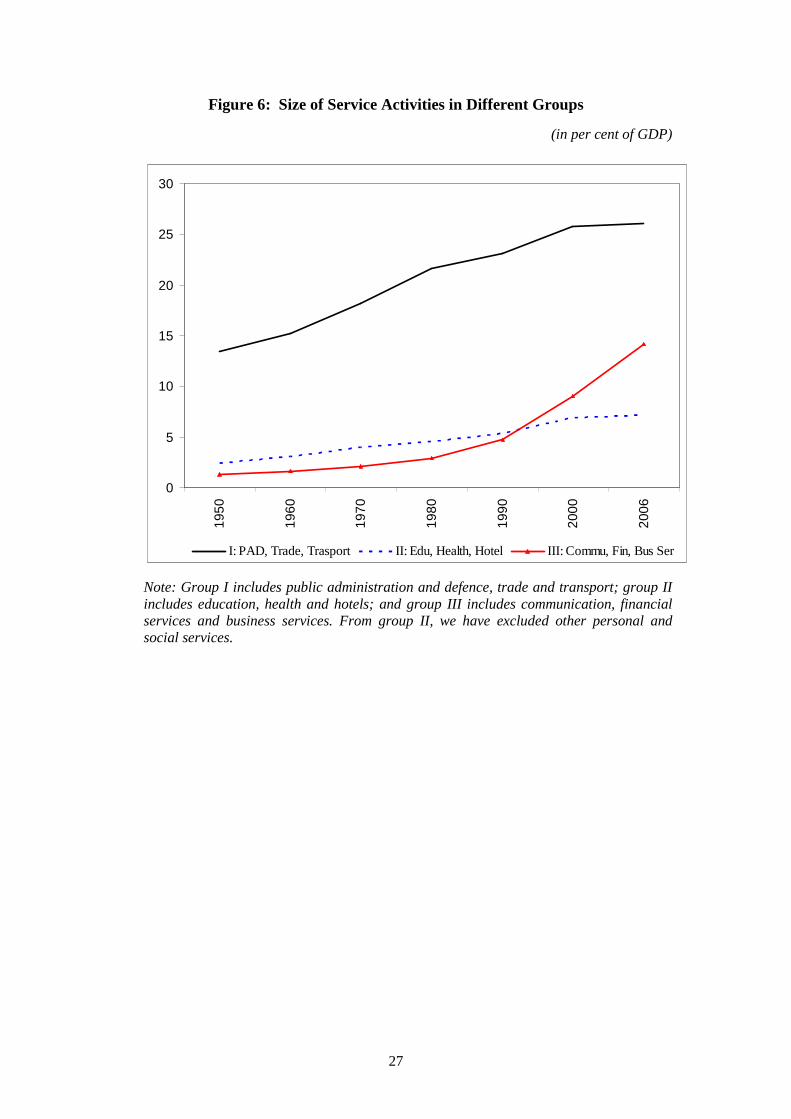
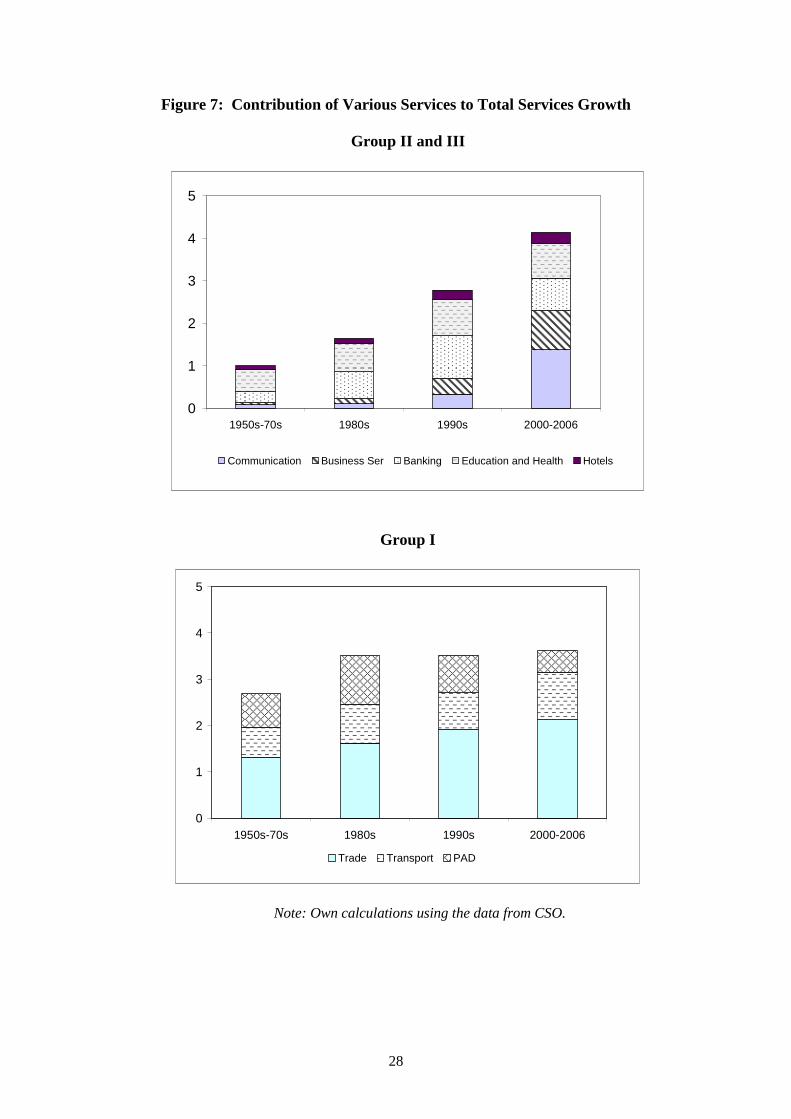
include hotels, restaurants, education, health (all Group II), and trade and transport (Group I). The transport sector includes road transport, railway transport, air transport and water transport. The most dynamic of these is road transport, which increased six-fold between 1991-92 and 2005-06.14 The stagnant service sectors in India have been public administration and defence, whose growth seems to have levelled off, and miscellaneous other personal services (Table 2).15 Figure 6 shows that the share of Group I services stagnated following an early period of rapid growth. By contrast, the share of Group II continued growing steadily, while that of Group III has accelerated since 1990. On balance, then, India has been moving in the direction of higher-tech services. Some observers have dismissed the growth of modern services on the grounds that these activities are small as a percentage of GDP and, therefore, can contribute only modestly to the growth of GDP. To test this hypothesis, we multiply the share of each service category in GDP by its growth rate. The results, in the left panel of Figure 7, indicate that the contribution of communication, business services, financial services, education, health and hotels and restaurants has in fact risen to the point where it accounted for more than four percentage points of growth to services (roughly half of total growth) in 2000-06.16 These activities alone explain most of the acceleration in services sector growth. The contribution of trade, transport and public administration and defence to services growth has remained stable at 3.5 percentage points since 1980s, indicating that these activities have not played a role in the growth acceleration of service sector activity. 4. International Comparisons We now compare the growth of our three categories of services in India with that in the OECD countries using EUKLEMS data.17 We distinguish Korea from the other OECD countries, given its status, like India, as a late-developing, albeit higher income economy. Its data, therefore, provide something of a bridge between India and the rest of the OECD.
14 The rapid growth of trade and transport, which are placed in Group I on the basis of the experience
of other countries, suggests that this is presumably an effect of post-1991 reforms. 15 Interestingly, the share of GDP accounted for by personal and other services continues to rise
strongly in the OECD countries, in contrast to India where it has been falling (for reasons not entirely clear to us). The services included in this segment are entertainment, recreation, T.V. radio, and personal services. Anecdotal evidence would suggest that with rising per capita incomes and an upcoming middle class, these services have grown quite rapidly. Jain and Ninan (2009) show that the entertainment and media sector has grown at around 19 per cent a year in the last few years. The declining share of these services in GDP could very well be a reflection of poor data.
16 In the 1990s, modern services in fact contributed nearly as much to aggregate growth as agriculture or manufacturing. Since 2000, communications alone has contributed more to GDP growth than agriculture.
17 The EU KLEMS release of 2008 spans the period 1970-2005 for the 15 founding (pre-2004) EU member states and for the US, South Korea, Japan and Australia. Series from 1995 onwards are available for the new EU member states that joined the EU on 1 May 2004. Industries are classified according to the European NACE revision 1 classification, but the level of detail varies across countries, industries and variables owing to differences in national statistical procedures. For our analysis, we do not include the new member states and further drop Luxembourg and Portugal. Thus, we use the data on Australia, Austria, Belgium, Denmark, Finland, France, Germany, Greece, Ireland, Italy, Japan, Korea, Netherlands, Spain, Sweden, United Kingdom, and United States.
6
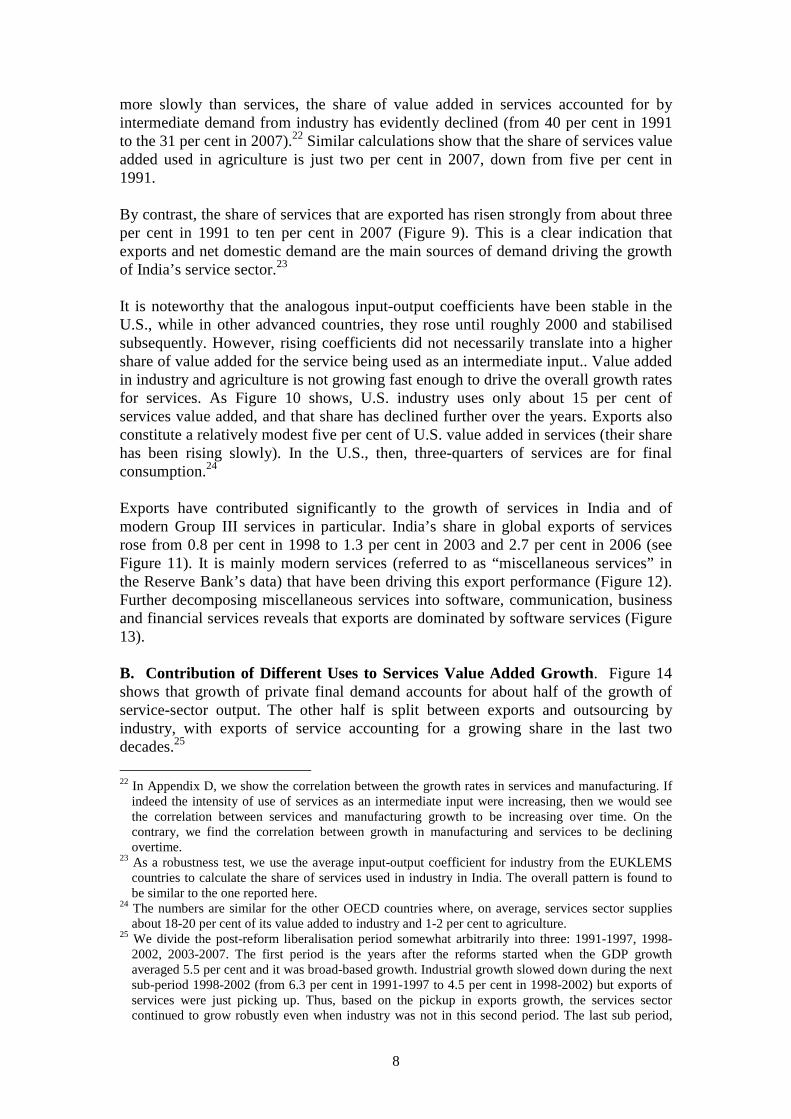
While the share of Group I services is clearly still increasing in India, it has either stagnated or is in decline in the higher-income countries (Panel A of Figure 8). The EUKLEMS data base does not extend back far enough to provide much evidence for the period when the OECD countries had per capita incomes comparable to India’s today, although the data for Korea suggest that the share of Category I services in India is in line with the international norm. Panel A clearly shows that the size of Group I activities started tapering off at a per capita income level of $3,000 in 2000 PPP USD in South Korea (in 1974, when the share of Group I reached 28.2 per cent). This is close to India’s 2008 per capita income of roughly $2,900 (again in year 2000 PPP dollars), as is the current share of Group I service in India (26 percent). Assuming that India continues to track the international norm, the share of Group I services is likely to stabilise before too many more years (assuming, inter alia, a real per capita income growth of five per cent). Retail trade is the main Group I activity with significant potential to grow, according to authors like Jain and Ninan (2009).18 This sector has been sheltered from foreign competition and remains dominated by mom-and-pop stores. Jain and Ninan and others suggest that consolidation and increased competition from foreign retailers have the potential to increase significantly the sector’s contribution to growth. The share of Group II services is similarly unexceptional. International comparisons suggest that some activities within this group, such as health care and education, have considerable scope for expansion. It is widely acknowledged that India needs to invest more in education. For this to happen, however, the sector will have to be liberalised.19 Moreover, one can then imagine education and perhaps, health care, becoming net exporters, just as IT has become an export industry. The experience of other countries suggests that a country becomes a net exporter of services like education and health care only when its per capita income exceeds $5,000 (again in year 2000 US purchasing power parity dollars), a level that will take India ten years to reach (assuming, again, a real per capita income growth rate of roughly five per cent). The last panel confirms that Group III services have been the fastest growing in India and that their take-off began at much lower incomes than in the OECD countries. 5. Accounting for Service Sector Growth We now distinguish growth attributable to the intermediate demand for service inputs from that attributable to final demand. Intermediate demand may simply reflect a recategorisation as service-sector employment of certain activities previously conducted in-house by manufacturing firms and which are now outsourced to the service sector. Its dominance would imply a less favourable view of the net employment creating potential of the sector. In equation 1, let S refer to value added in services, A to value added in agriculture, I to value added in Industry, X to exports (i.e. the value added component in exports), ia,s to the input-output coefficient of agriculture for services inputs, and ii,s to the
18 The other main activity in this group is public administration and defence, which seems to be
declining (see above). 19 A comprehensive analysis of the deficiencies in the Indian education system is in Panagariya (2008);
an agenda for reform is in Kapur and Mehta (2008).

7
input-output coefficient of industry for services inputs (both defined as the use of service input per unit of value added in agriculture and industry respectively) and C to consumption, which is the residual (the difference between value produced and other uses).20 Then:
(1)
(2)
(3) Equations 2 and 3 tell us that, for given input-output coefficients, the growth of services equals the weighted average of the growth in various sectors, the weights being the relative size of each sector relative to the size of the service sector as a whole. Beyond that, changes in input-output coefficients, whatever their cause, can also affect the demand for services. Operationalising this framework requires data on services used in industry and agriculture, on the growth rates of value added in agriculture, industry and exports, on the sizes of the respective sectors and on the growth of services themselves. We take input-output coefficients from the input-output matrices for India for 1993, 1998, and 2003. The size and growth rate of each sector are available from the CSO, while data for exports is available from the Reserve Bank of India. Final consumption is the residual.21 A. Intermediate Demand for Services. In Table 3, we calculate the use of services per unit of value added in agriculture and industry using input-output matrices for 1993, 1998 and 2003. These calculations do not suggest that the intensity with which services are used in industry has changed much over time. The implication is that growth in the intermediate demand for services from industry is due mainly to increasing output rather than increasing outsourcing of in-house manufacturing-sector activities to the service sector. Combining the coefficients in Table 3 with value added growth in industry, we see that intermediate demand from industry accounts for about a third of value added in services. Since the coefficients have not changed much and since industry has grown
20 Input-output coefficients are defined in terms of the use of domestically produced services per unit of
value added in agriculture and industry. Thus, we first convert the input-output coefficients for per unit of output available from different input-output matrices into the coefficients for per unit of value added. We assume that the same coefficient applies to services domestically produced and to imported services for industry. We further assume that in agriculture, only domestically produced services are used. Export data are usually available in terms of value of output; we assume that the ratio of value added to value of output for export of services is the same as that for total services.
21 We find that input-output coefficients are similar between 1993 and 2003 (the values are 0.68, 0.64, and 0.74 respectively in the years 1993-94, 1998-99, and 2003-04). We assume the value to be 0.70 during the sample period. The input-output coefficient for value added in agriculture changes little during these years and is assumed to be the same through the period at 0.07.
CXIiAiS sisa +++= ** ,,
S
C
S
X
S
Ii
S
Ai
S
S sisa ∆+∆+∆
+∆
=∆ )*()*( ,,
)*( )* ( ) *() *()*()* ( ,i,, ,, S
C
C
C
S
X
X
X
S
I
I
I i
S
Ii
S
A
A
A i
S
Ai
S
Ssissa sa
∆+∆ +∆+∆+∆+∆=∆
8
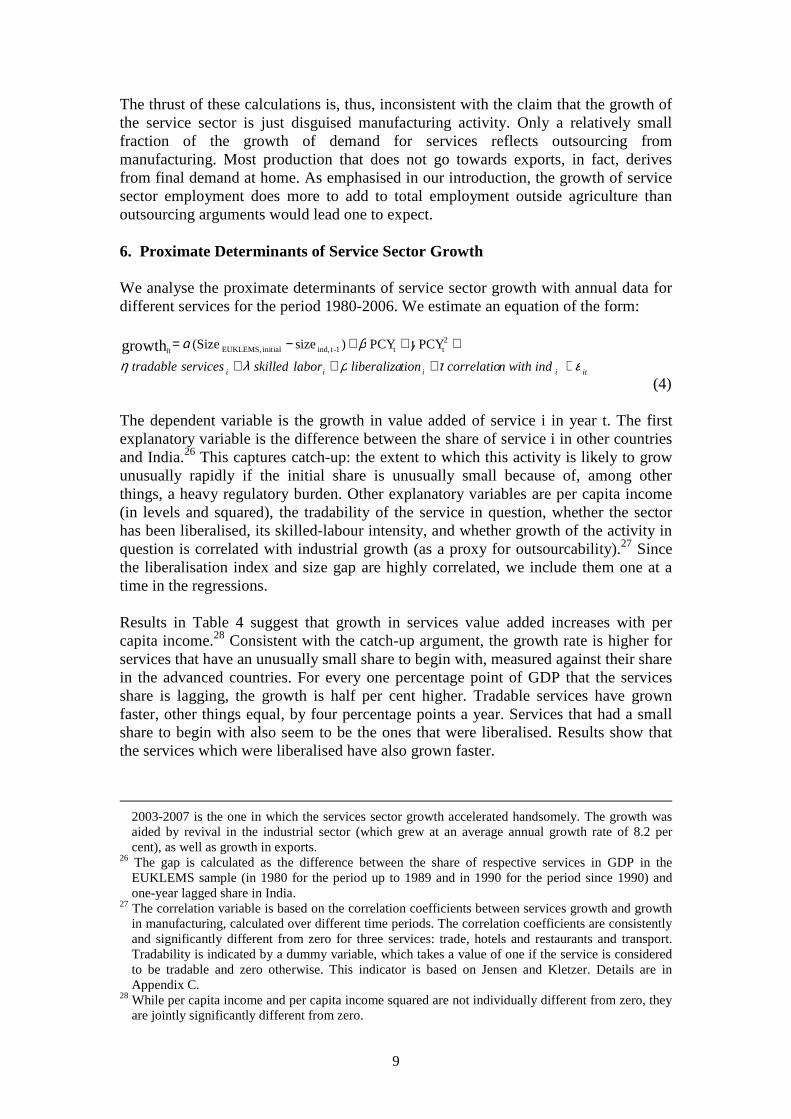
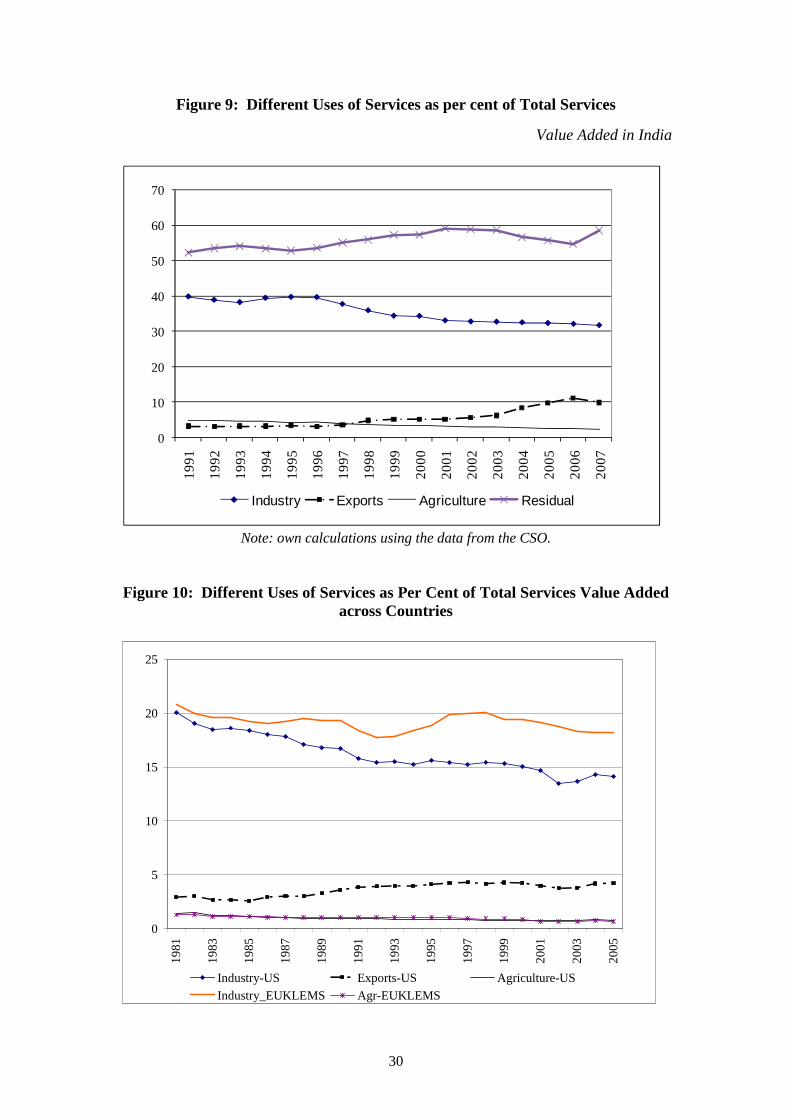
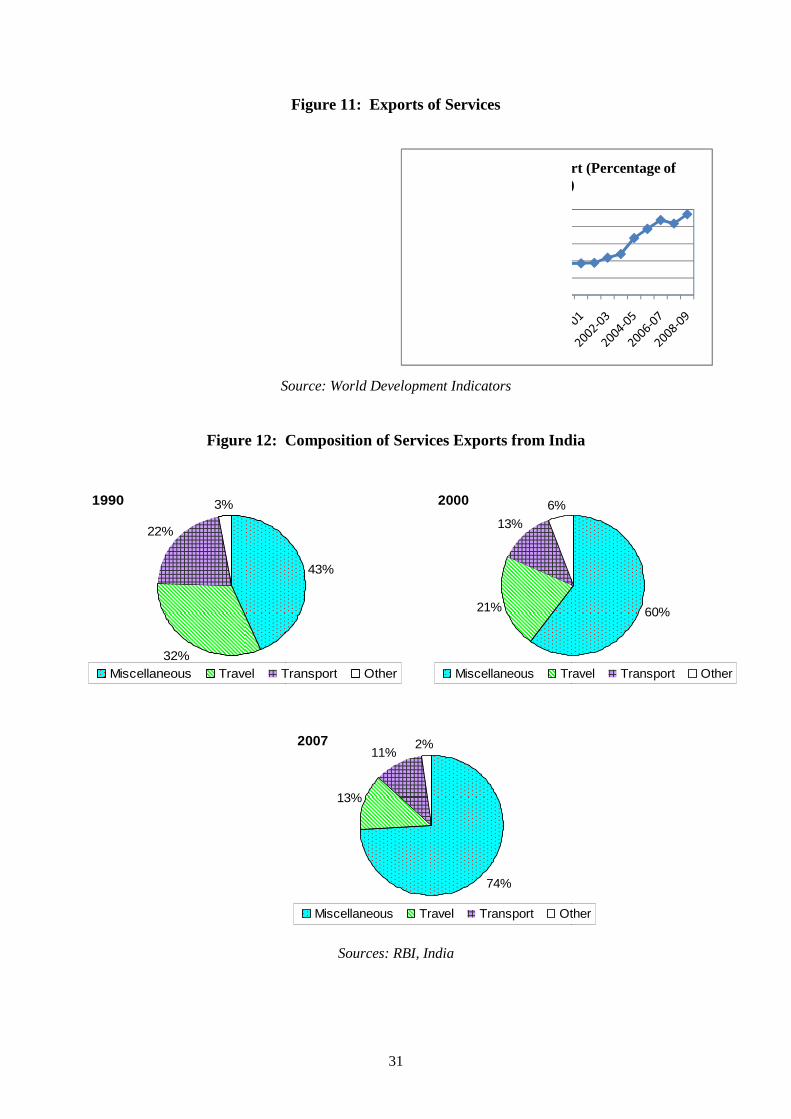
more slowly than services, the share of value added in services accounted for by intermediate demand from industry has evidently declined (from 40 per cent in 1991 to the 31 per cent in 2007).22 Similar calculations show that the share of services value added used in agriculture is just two per cent in 2007, down from five per cent in 1991. By contrast, the share of services that are exported has risen strongly from about three per cent in 1991 to ten per cent in 2007 (Figure 9). This is a clear indication that exports and net domestic demand are the main sources of demand driving the growth of India’s service sector.23 It is noteworthy that the analogous input-output coefficients have been stable in the U.S., while in other advanced countries, they rose until roughly 2000 and stabilised subsequently. However, rising coefficients did not necessarily translate into a higher share of value added for the service being used as an intermediate input.. Value added in industry and agriculture is not growing fast enough to drive the overall growth rates for services. As Figure 10 shows, U.S. industry uses only about 15 per cent of services value added, and that share has declined further over the years. Exports also constitute a relatively modest five per cent of U.S. value added in services (their share has been rising slowly). In the U.S., then, three-quarters of services are for final consumption.24 Exports have contributed significantly to the growth of services in India and of modern Group III services in particular. India’s share in global exports of services rose from 0.8 per cent in 1998 to 1.3 per cent in 2003 and 2.7 per cent in 2006 (see Figure 11). It is mainly modern services (referred to as “miscellaneous services” in the Reserve Bank’s data) that have been driving this export performance (Figure 12). Further decomposing miscellaneous services into software, communication, business and financial services reveals that exports are dominated by software services (Figure 13). B. Contribution of Different Uses to Services Value Added Growth. Figure 14 shows that growth of private final demand accounts for about half of the growth of service-sector output. The other half is split between exports and outsourcing by industry, with exports of service accounting for a growing share in the last two decades.25
22 In Appendix D, we show the correlation between the growth rates in services and manufacturing. If
indeed the intensity of use of services as an intermediate input were increasing, then we would see the correlation between services and manufacturing growth to be increasing over time. On the contrary, we find the correlation between growth in manufacturing and services to be declining overtime.
23 As a robustness test, we use the average input-output coefficient for industry from the EUKLEMS countries to calculate the share of services used in industry in India. The overall pattern is found to be similar to the one reported here.
24 The numbers are similar for the other OECD countries where, on average, services sector supplies about 18-20 per cent of its value added to industry and 1-2 per cent to agriculture.
25 We divide the post-reform liberalisation period somewhat arbitrarily into three: 1991-1997, 1998-2002, 2003-2007. The first period is the years after the reforms started when the GDP growth averaged 5.5 per cent and it was broad-based growth. Industrial growth slowed down during the next sub-period 1998-2002 (from 6.3 per cent in 1991-1997 to 4.5 per cent in 1998-2002) but exports of services were just picking up. Thus, based on the pickup in exports growth, the services sector continued to grow robustly even when industry was not in this second period. The last sub period,
9
The thrust of these calculations is, thus, inconsistent with the claim that the growth of the service sector is just disguised manufacturing activity. Only a relatively small fraction of the growth of demand for services reflects outsourcing from manufacturing. Most production that does not go towards exports, in fact, derives from final demand at home. As emphasised in our introduction, the growth of service sector employment does more to add to total employment outside agriculture than outsourcing arguments would lead one to expect. 6. Proximate Determinants of Service Sector Growth We analyse the proximate determinants of service sector growth with annual data for different services for the period 1980-2006. We estimate an equation of the form:
(4) The dependent variable is the growth in value added of service i in year t. The first explanatory variable is the difference between the share of service i in other countries and India.26 This captures catch-up: the extent to which this activity is likely to grow unusually rapidly if the initial share is unusually small because of, among other things, a heavy regulatory burden. Other explanatory variables are per capita income (in levels and squared), the tradability of the service in question, whether the sector has been liberalised, its skilled-labour intensity, and whether growth of the activity in question is correlated with industrial growth (as a proxy for outsourcability).27 Since the liberalisation index and size gap are highly correlated, we include them one at a time in the regressions. Results in Table 4 suggest that growth in services value added increases with per capita income.28 Consistent with the catch-up argument, the growth rate is higher for services that have an unusually small share to begin with, measured against their share in the advanced countries. For every one percentage point of GDP that the services share is lagging, the growth is half per cent higher. Tradable services have grown faster, other things equal, by four percentage points a year. Services that had a small share to begin with also seem to be the ones that were liberalised. Results show that the services which were liberalised have also grown faster.
2003-2007 is the one in which the services sector growth accelerated handsomely. The growth was aided by revival in the industrial sector (which grew at an average annual growth rate of 8.2 per cent), as well as growth in exports.
26 The gap is calculated as the difference between the share of respective services in GDP in the EUKLEMS sample (in 1980 for the period up to 1989 and in 1990 for the period since 1990) and one-year lagged share in India.
27 The correlation variable is based on the correlation coefficients between services growth and growth in manufacturing, calculated over different time periods. The correlation coefficients are consistently and significantly different from zero for three services: trade, hotels and restaurants and transport. Tradability is indicated by a dummy variable, which takes a value of one if the service is considered to be tradable and zero otherwise. This indicator is based on Jensen and Kletzer. Details are in Appendix C.
28 While per capita income and per capita income squared are not individually different from zero, they are jointly significantly different from zero.
itii ii n with ind correlatiotion liberalizalabor skilledservices tradable ετρλη
γ βα++++
+++−=
PCY PCY)size(Sizegrowth 2 t t1-tind, initial
EUKLEMS,it

10
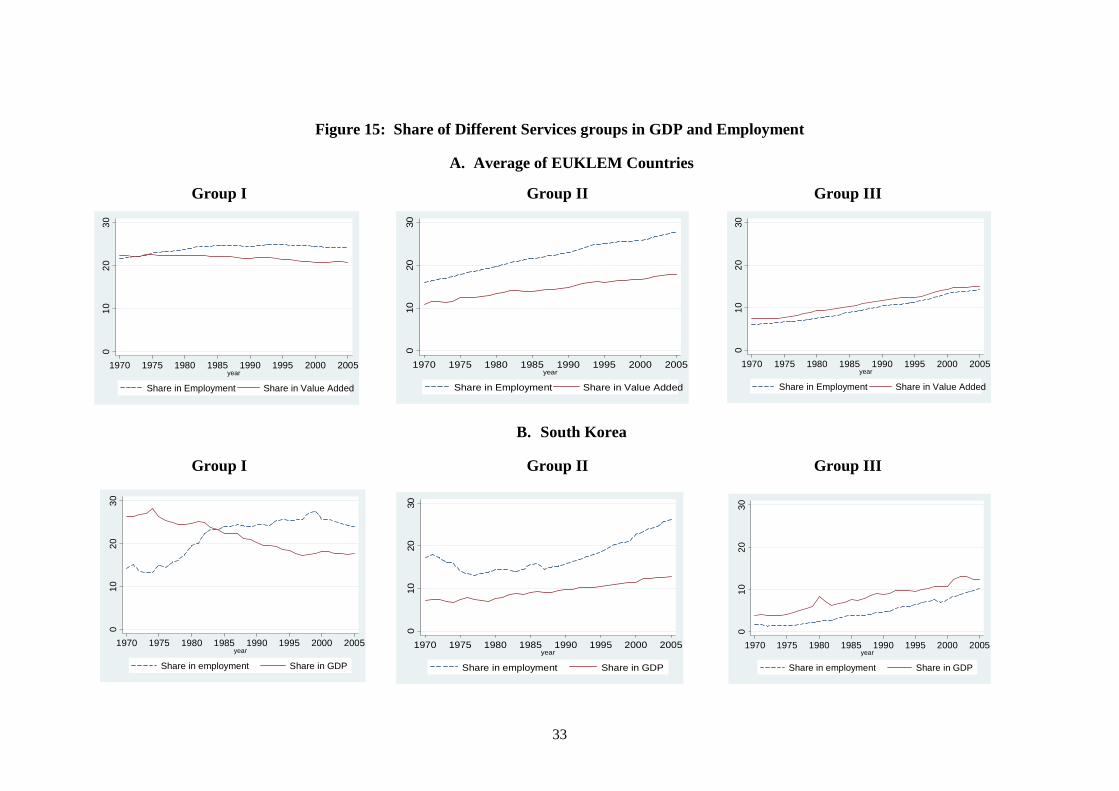
All this has implications for policy. It suggests that policy makers should continue to encourage exports of IT, communication, financial and business services while also liberalising activities like education, health care and retail trade, where regulation has inhibited the ability of producers to meet domestic demand. 7. Employment in Services One reason why some observers are unimpressed by the growth of the service sector is the presumption that modern services do not make significant use of unskilled and semi-skilled labour, the factor of production that India has in abundance. They downplay information technology and communications-related service sector employment on the grounds that these activities are small and use little unskilled labour, the implication being that a labour-abundant economy cannot rely on them to move people out of low-productivity agriculture. This hypothesis is untested, perhaps because little data is available for employment in services by skill. In Table 4, we report employment elasticities from Rangarajan et al (2008), who calculate these from the NSSO data.29 As is evident from the table, service sector growth has, been, in fact, quite labour intensive and, in certain segments, more so than manufacturing sector growth. Although these data do not allow us to say whether this is an increase in skilled or unskilled employment, evidence from other countries may shed light on this question (as does some anecdotal evidence described in the conclusion). Figure 15 plots the GDP share of different services for the 17 OECD countries.30 We again show Korea separately, as a middle-income OECD country that is in some sense intermediate between India and the high-income OECD countries. While the share of Group I (traditional services) in GDP has declined over time, its share in employment has not. Group II (hybrid) services have accounted for a growing share of GDP and an even more rapidly growing share of economy wide employment. Group III (modern) services have accounted for increased shares of both GDP and employment over time. Figure 16 looks at shares in hours worked by low skilled and high skilled workers separately. Movements here mirror movements in relative labour productivity. Notably, for modern high-tech services, labour productivity exceeds labour productivity economy-wide. This group of activities is similarly distinctive in that there is no sign of the gap relative to economy-wide labour productivity changing over time. We can estimate the elasticity of employment with respect to value added for 17 OECD countries in the period 1970-2005, separately for each activity. Specifically, we estimate:
Added Value LogEmployment Log itit iti εβα ++= (5)
29 NSSO data refer to the household survey data published by the National Sample Survey
Organisation. The numbers we report are drawn from Rangarajn et al (2008). 30 Again using the EUKLEMS data base.

11
where αi refers to country fixed effects and t to year. As dependent variables, we consider number of employees, number of hours worked and number of hours worked by skill levels – low-skilled workers, medium skilled workers or high-skilled workers (all in log terms). We calculate these elasticities with respect to value added in agriculture, manufacturing and different services by estimating different regressions for each sector separately. The results (Table 6) show that employment elasticities are highest in Group II and Group III services. While they are higher for high-skilled than low-skilled workers, they are also positive and significant for medium-skilled workers across a wide range of services. They are highest of all in modern business services. The employment elasticity for medium-skilled workers is in general about half the elasticity for high skilled labour and is positive for all service activities except agriculture. One might argue that India does not use the same technology as the advanced countries analysed here. Given the relative endowments of labour and capital, India presumably uses more labour and more unskilled labour, thus these elasticities calculated using the OECD countries would not be indicative. We, therefore, calculate these elasticities using data only through 1995, the assumption being that technology lags in India by a decade. We find that the overall elasticities of employment are similar. However, the elasticities reported in the table are somewhat lower for unskilled labour and somewhat higher for skilled labour than in the period before 1995.31 We also estimate the regressions for employment elasticity with interaction terms for Korea on the grounds that it differs less than the others from India. Elasticities are somewhat higher for Korea, in particular the elasticities for unskilled labour. This is consistent with the notion that there is an economically significant demand for unskilled labour associated with the growth of the service sector in less advanced economies. Overall, we observe that the skill content of the labour employed in manufacturing and services is showing tendencies toward convergence. Manufacturing, like most service activities, has negative employment elasticity for unskilled labour hours, a positive but modest elasticity for mediums skilled labour, and a large elasticity for skilled labour. Thus, the skill content of both the manufacturing and services sectors is increasing over time. It is not as if manufacturing employs only unskilled labour while modern services employ only highly-skilled labour. In fact, the skill mix of labour employed in the two sectors is becoming increasingly similar. As emphasised in the introduction, it is no longer obviously the case that manufacturing is the main destination for the vast majority of Indian labour moving into the modern sector and that modern services are a viable destination only for the highly-skilled few. 8. Conclusion India is distinctive for the rapid growth of its service sector – high-tech information technology, communication and business services in particular. However, whether the service sector provides a route out of poverty for the masses and thus a path to
31 Evidently, there has been some substitution away from unskilled labour over time.

12
economic development is disputed. Some say that the high skill and education requirements of modern service sector jobs make them an impractical destination for the rural masses. Others counter that as more skilled and educated workers “graduate” from manufacturing and traditional services, they open up economic space there for less educated workers capable of upgrading their skills. They argue that the skilled-unskilled mix of the manufacturing and service sectors, each taken as a whole, is not as different as commonly supposed. Some say that much non-traditional service sector employment is little more than the outsourcing (relabelling) of activities previously undertaken in-house by manufacturing firms. Others counter that much of the growth of service sector employment represents job creation as opposed to outsourcing. We find little evidence that the growth of the service sector simply disguised manufacturing activity. Although it is probably still the case that even the most rudimentary jobs in the modern service sector, like basic data entry, require some high-school education (something possessed by only a third of the relevant cohort) while much employment in manufacturing does not, the data suggest that the skilled-unskilled mix of labour in the two sectors is becoming increasingly alike. It is no longer so obviously the case that manufacturing is the exclusive destination for the vast majority of Indian labour moving into the modern sector and that modern services are a viable destination only for the highly skilled few. While our analysis has been statistical, there is anecdotal evidence consistent with these conclusions. Polgreen (2009) describes how modern service sector jobs are now migrating from India’s urban centres to its small towns and rural villages, creating employment for semi-skilled workers. While these workers may not have the mathematical training to work as computer programmers or the English fluency needed for employment in call centres, with some high school education, they are sufficiently numerate and have adequate facility in English to “do basic data entry, read forms, and even write simple e-mail messages.” The wages of these rural service sector workers are three to four times those available in agriculture but only half those of workers in Bangalore, where the competition for labour is more intense and living costs are higher. American trucking companies seeking to process their timesheets in India may not have the local knowledge to find rural workers to undertake the task but Indian companies like Rural Shores have been established to run service sector facilities in rural areas. These observations are consistent with the view that employment in modern service sector activity can be a route out of poverty not just for the few and not just for urban residents. They are also consistent with the conclusion that employment in modern services can be a useful supplement to employment in manufacturing as a route out of rural poverty. Sustaining economic growth and raising living standards, thus, will benefit from shifting labour out of agriculture into modern services as well as manufacturing and not just into the latter. To the extent that the expansion of both sectors continues to be constrained by the availability of skilled labour simply underscores the importance for India to continue to invest in labour skills.

13
References Acharya, Shankar, (2003), “Services not the Real Saviour?” in Shankar Acharya
edited, India’s Economy, Some Issues and Answers, Academic Foundation, New Delhi, pp.38-48.
Berchert, Ingo and Aaditya, Mattoo, (2009), “The Crises Resilience of Services
Trade”, World Bank Policy Research working paper 4917. Bhagwati, Jagdish, (1984), “Splintering and Disembodiment of Services and
Developing Nations,” World Economy, Vol. 7, No. 2, pp. 133–43. Bosworth, Barry, Susan M., Collins and Arvind, Virmani, (2007), “Sources of Growth
in the Indian Economy”, in, India Policy Forum 2006-07, Vol-3, pp. 1-50. Cain, J. Salcedo, Rana, Hasan, Rhoda, Magsombol, Rhoda and Ajay, Tandon, (2009),
“Accounting for Inequality in India: Evidence from Household Expenditures,” World Development, Vol. 38, Issue. 3, March 2010, pp. 282-297.
Central Statistical Organisation, (1989), National Accounts Statistics: Sources and
Methods, (New Delhi: Government of India). _____, (1999), New Series on National Accounts Statistics (Base Year 1993-94),
(New Delhi: Government of India). _____, (2004), Report of the Working Group on Workforce Estimation for
Compilation of National Accounts Statistics with Base Year 1999-2000, (New Delhi: Government of India)
_____, (2005), National Account Statistics, 2005, (New Delhi: Government of India) _____, (2006), New Series on National Accounts Statistics (Base Year 1999-2000),
(New Delhi: Government of India). Eichengreen, Barry and Poonam, Gupta, (2009), “Two Waves of Services Growth”,
NBER Working Paper no. w14968 May, 2009. EU KLEMS Database (2007), “EU LEMS Growth and Productivity Accounts”,
http://www.euklems.net. Goldar, B.N., and Rashmi, Banga, (2004), “Contribution of Services to Output
Growth and Productivity in Indian Manufacturing: Pre and Post Reforms,” ICRIER Working Paper 139, July 2004.
Gordon, Jim and Poonam, Gupta, (2004), “Understanding India’s Services
Revolution.” IMF Working paper WP/ 04/171 (September). Jain, Sunil, and T.N. Ninan, (2010), Servicing India’s GDP growth, in Shankar
Acharya and Rakesh Mohan edited, India’s Economy Performance and
14
Challenges, Essays in Honour of Montek Singh Ahluwalia, Oxford University Press, New Delhi, pp. 328-365.
Jensen, B. J., and L. G. Kletzer, (2005), “Tradable Services: Understanding the Scope
and Impact of Services Outsourcing”, Institute for International Economics Working Paper No. 05-09.
Kapur, Devesh and Pratap Bhanu, Mehta, (2004), “Indian Higher Education Reform:
From Half-Baked Socialism to Half-Baked Capitalism,” CID Working Paper No. 108, Cambridge, Mass.: Harvard University (September, 2004).
Kochhar, K., U. Kumar, R. Rajan, A. Subramanian, and I. Tokatlidis, (2006), “India’s
pattern of development: What happened, what follows?” Journal of Monetary Economics, Vol. 53, Issue. 5, pp. 981-1019.
Mattoo, Aaditya, Deepak Mishra and Anirudh Shinghal, (2003), “Trade in Services:
Access to Foreign Markets, Domestic Reform and International Negotiations”, World Bank.
Panagariya, Arvind, (2008), India the Emerging Giant, New York: Oxford University
Press. Polgreen, Lydia, (2009), “Rural India Gets Chance at Piece of Jobs Boom”, New York
Times (13 November), p.A4. Rangarajan, C., Padma Iyer Kaul, Seema, (2007), “Revisiting Employment and
Growth”, Money and Finance., Vol. 3, Issue. 2.
15
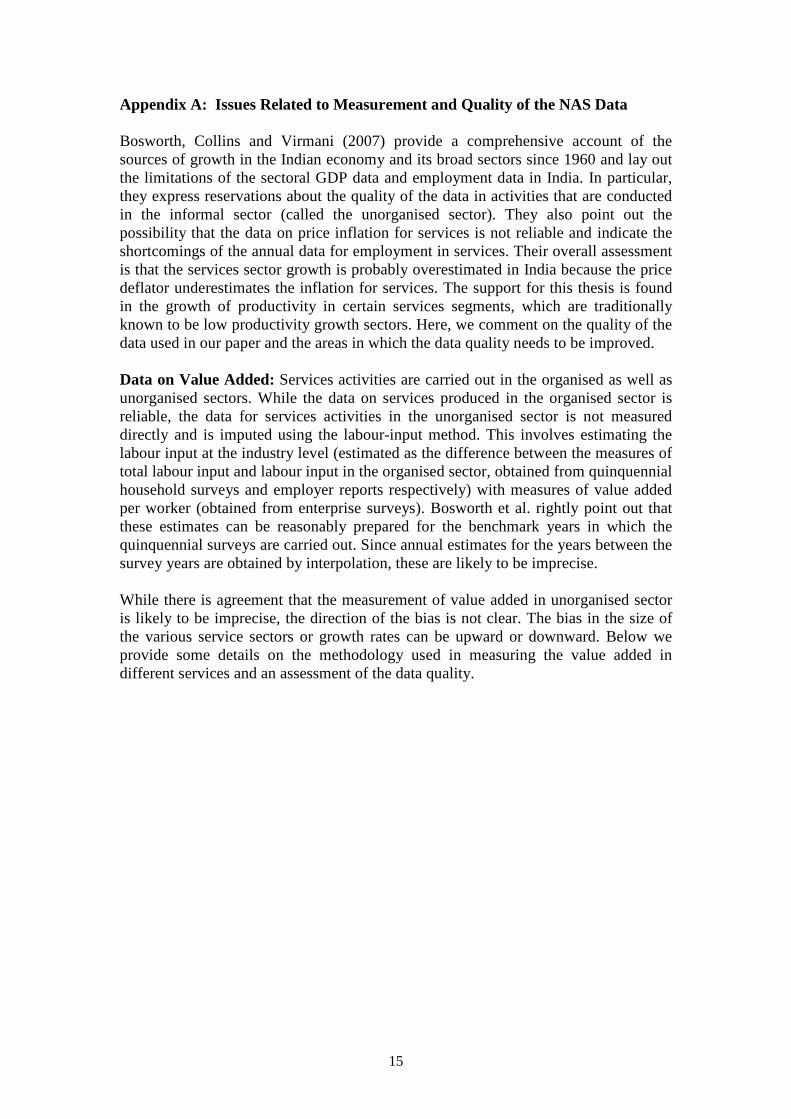
Appendix A: Issues Related to Measurement and Quality of the NAS Data Bosworth, Collins and Virmani (2007) provide a comprehensive account of the sources of growth in the Indian economy and its broad sectors since 1960 and lay out the limitations of the sectoral GDP data and employment data in India. In particular, they express reservations about the quality of the data in activities that are conducted in the informal sector (called the unorganised sector). They also point out the possibility that the data on price inflation for services is not reliable and indicate the shortcomings of the annual data for employment in services. Their overall assessment is that the services sector growth is probably overestimated in India because the price deflator underestimates the inflation for services. The support for this thesis is found in the growth of productivity in certain services segments, which are traditionally known to be low productivity growth sectors. Here, we comment on the quality of the data used in our paper and the areas in which the data quality needs to be improved. Data on Value Added: Services activities are carried out in the organised as well as unorganised sectors. While the data on services produced in the organised sector is reliable, the data for services activities in the unorganised sector is not measured directly and is imputed using the labour-input method. This involves estimating the labour input at the industry level (estimated as the difference between the measures of total labour input and labour input in the organised sector, obtained from quinquennial household surveys and employer reports respectively) with measures of value added per worker (obtained from enterprise surveys). Bosworth et al. rightly point out that these estimates can be reasonably prepared for the benchmark years in which the quinquennial surveys are carried out. Since annual estimates for the years between the survey years are obtained by interpolation, these are likely to be imprecise. While there is agreement that the measurement of value added in unorganised sector is likely to be imprecise, the direction of the bias is not clear. The bias in the size of the various service sectors or growth rates can be upward or downward. Below we provide some details on the methodology used in measuring the value added in different services and an assessment of the data quality.
16
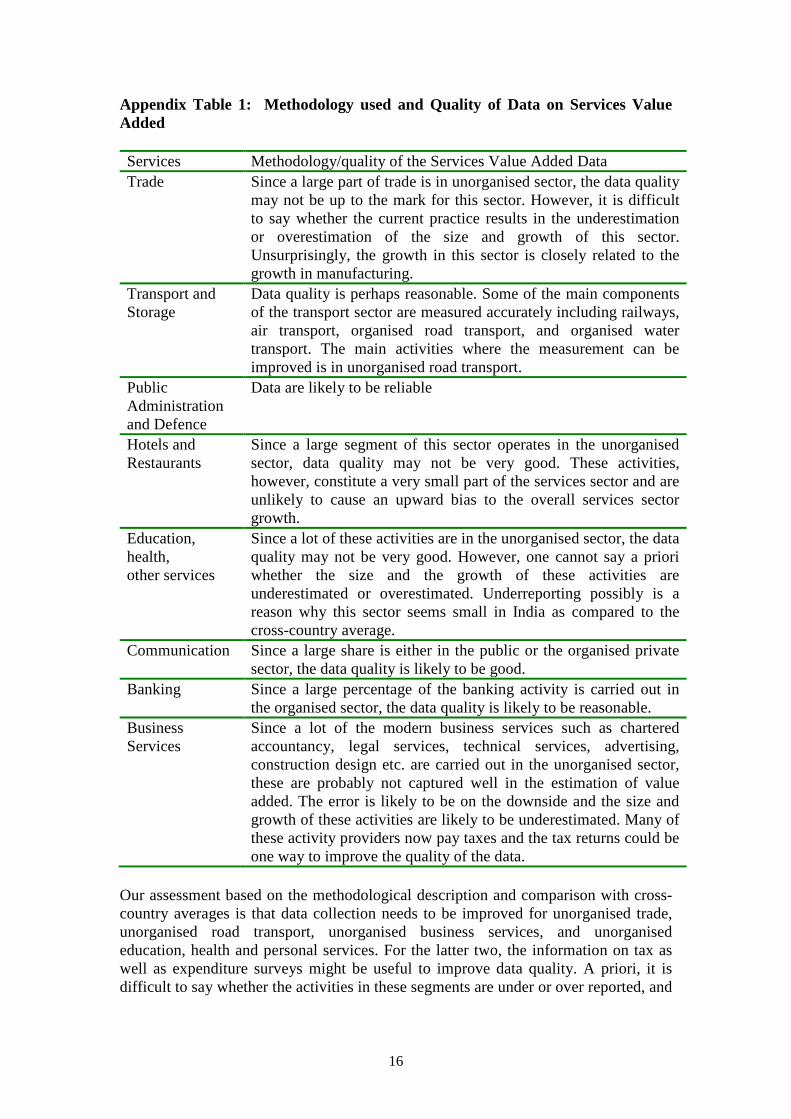
Appendix Table 1: Methodology used and Quality of Data on Services Value Added Services Methodology/quality of the Services Value Added Data Trade
Since a large part of trade is in unorganised sector, the data quality may not be up to the mark for this sector. However, it is difficult to say whether the current practice results in the underestimation or overestimation of the size and growth of this sector. Unsurprisingly, the growth in this sector is closely related to the growth in manufacturing.
Transport and Storage
Data quality is perhaps reasonable. Some of the main components of the transport sector are measured accurately including railways, air transport, organised road transport, and organised water transport. The main activities where the measurement can be improved is in unorganised road transport.
Public Administration and Defence
Data are likely to be reliable
Hotels and Restaurants
Since a large segment of this sector operates in the unorganised sector, data quality may not be very good. These activities, however, constitute a very small part of the services sector and are unlikely to cause an upward bias to the overall services sector growth.
Education, health, other services
Since a lot of these activities are in the unorganised sector, the data quality may not be very good. However, one cannot say a priori whether the size and the growth of these activities are underestimated or overestimated. Underreporting possibly is a reason why this sector seems small in India as compared to the cross-country average.
Communication Since a large share is either in the public or the organised private sector, the data quality is likely to be good.
Banking Since a large percentage of the banking activity is carried out in the organised sector, the data quality is likely to be reasonable.
Business Services
Since a lot of the modern business services such as chartered accountancy, legal services, technical services, advertising, construction design etc. are carried out in the unorganised sector, these are probably not captured well in the estimation of value added. The error is likely to be on the downside and the size and growth of these activities are likely to be underestimated. Many of these activity providers now pay taxes and the tax returns could be one way to improve the quality of the data.
Our assessment based on the methodological description and comparison with cross-country averages is that data collection needs to be improved for unorganised trade, unorganised road transport, unorganised business services, and unorganised education, health and personal services. For the latter two, the information on tax as well as expenditure surveys might be useful to improve data quality. A priori, it is difficult to say whether the activities in these segments are under or over reported, and

17
it is possible that the size and growth of education, health, personal services, business service and other services are currently being underestimated in India. Below, we compare the growth rates for selected services calculated using the CSO data with those calculated using the data from alternative sources (for the latter we rely on Jain and Ninan (2009)). The sectors include retail, entertainment, IT, transport, and education. The table below shows that the growth for the last few years or that projected for the coming few years using alternative data sources is at par or higher than that calculated using CSO data. Appendix Table 2: Comparison of Growth Rates of Services using the CSO Data and the Data From Other Sources (in per cent) CSO Other Sources Retail 7.7 (in 2006) 13 (a) (projected annual
growth rate in 2006-2011) 8 (b) (projected annual growth rate in 2008-2015, Technopak)
Media and entertainment
2.8 (average of radio, broadcasting, entertainment, recreation between 2004-2007)
18 (c)
IT Industry 19.4 (annual average growth rate of computer services between 2004-2007)
30 (d)
Education 7.2 (annual average between 2000-2006)
??
Sources: a. Projected growth of retail business, ICRIER’s retail study. b. based on the projected size of the Indian retail industry in US $ between 2008 and
2013, Technopak. c. Projected growth 18 per cent a year between 2008-2012. Source Jain and Ninan
(from FICCI Frames). d. Calculated using the data on the size of the IT industry between 2004-2007 in US $
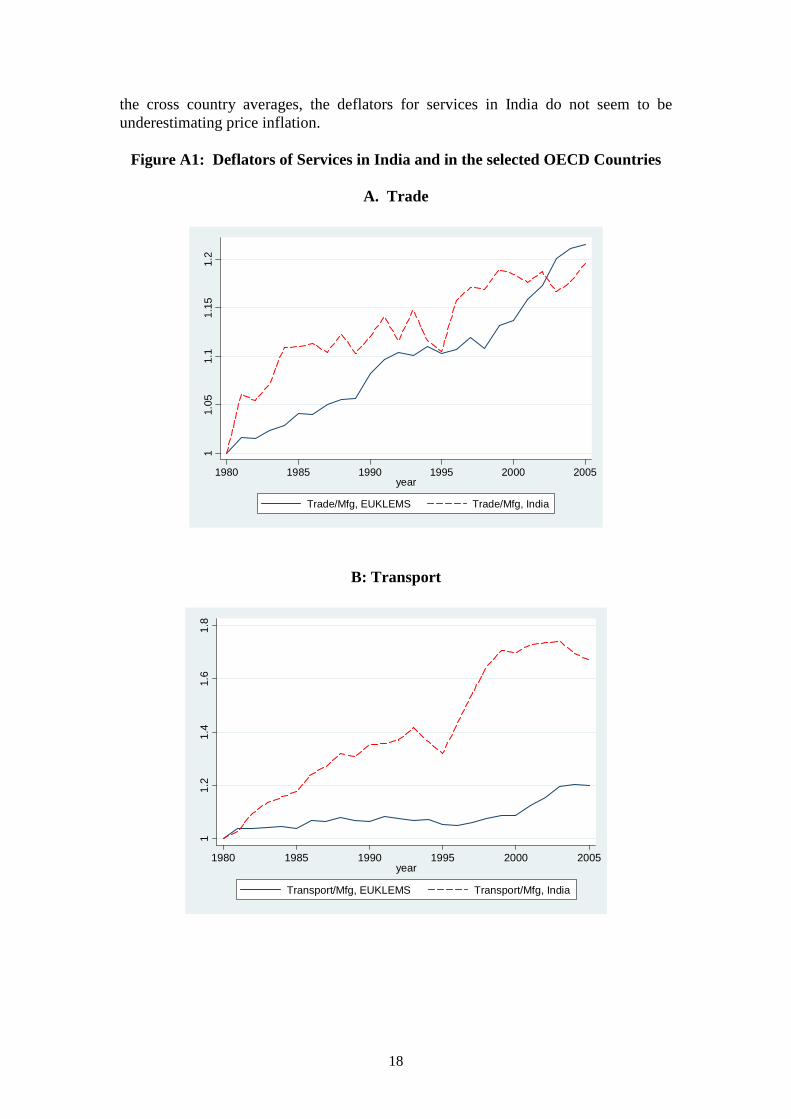
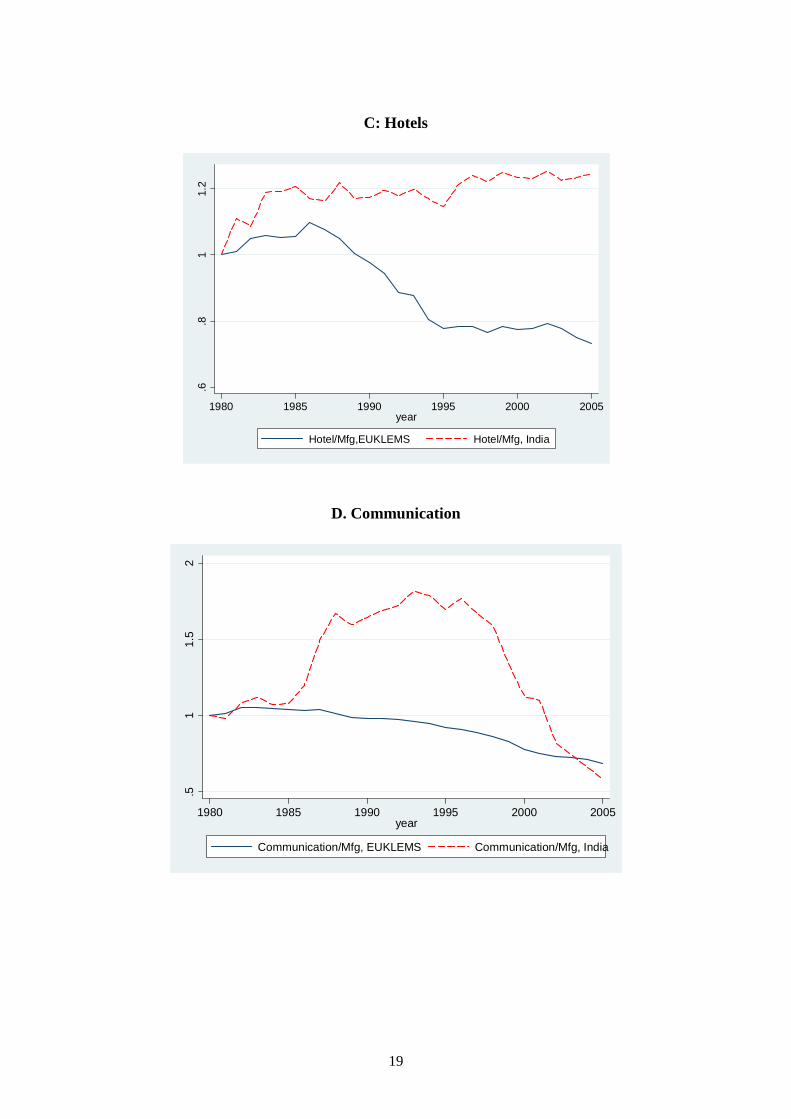
from Nasscom, reported in Jain and Ninan. Deflators: Bosworth et al (2007) raise the possibility that the inflation for certain services, especially traditional services, is currently underestimated in India. We compare the deflators used for services sub-sectors relative to the deflator for manufacturing for India (deflators for India are based on the 1999-00 data series provided by the CSO, calculated using current and constant prices values) with the average of the OECD countries for which the data are available in the EUKLEMS database. These are shown in Figure A1. The index of relative deflators takes a value 100 in 1980. For all the services (except banking), the deflator has grown either faster or at the same pace in India as in the OECD countries. On the basis of this comparison with
18
the cross country averages, the deflators for services in India do not seem to be underestimating price inflation.
Figure A1: Deflators of Services in India and in the selected OECD Countries
A. Trade
B: Transport
11.
051.
11.
151.
2
1980 1985 1990 1995 2000 2005year
Trade/Mfg, EUKLEMS Trade/Mfg, India
11.
21.
41.
61.
8
1980 1985 1990 1995 2000 2005year
Transport/Mfg, EUKLEMS Transport/Mfg, India
19
C: Hotels
D. Communication
.6.8
11.
2
1980 1985 1990 1995 2000 2005year
Hotel/Mfg,EUKLEMS Hotel/Mfg, India
.51
1.5
2
1980 1985 1990 1995 2000 2005year
Communication/Mfg, EUKLEMS Communication/Mfg, India

20
E: Banking
Note: Data for India is from CSO and for OECD countries from the EUKLEMS. Employment Data: Finally, the data for employment in services is not readily available even for organised activities. Researchers often use the National Sample Surveys (NSS) to get estimates of employment in services. These surveys are available every five years, data from which are interpolated to get the annual data series. But, as cautioned by Bosworth et al, these data are more reliable only for the years in which the surveys are carried out, but not in the other years. Some data on employment for India are available in the Economic Censuses, which have been conducted by the Ministry of Statistics and Programme Implementation, Government of India in 1977, 1980, 1990, 1998 and 2005. These cover non-agricultural enterprises, and use the enterprise as the unit of enumeration.
.8.9
11.
1
1980 1985 1990 1995 2000 2005year
Banking/Mfg, EUKLEMS Banking/Mfg, India

21
Appendix B: Data Sources Appendix Table 3: Sources of Data Variable Data source
Per Capita income Eichengreen and Gupta (2009) for data until 2004. We updated the data for 2005, 2006 using the latest version of the WDI and for India for 2005, 2006 and 2007 using the CSO.
Share of services in GDP Eichengreen and Gupta (2009) for data until 2004. We updated the data for 2005, 2006 using the latest version of the WDI and for India for 2005, 2006 and 2007 using the CSO.
Disaggregated services value added For India latest data from CSO, for cross country from the EUKLEMS data, downloaded from: www.euklems.net
Input output matrices CSO
Exports and imports of services World Development Indicators
Detailed data on Exports and imports of services for India
Reserve Bank of India’s website: www.rbi.org.in
Employment for OECD countries EUKLEMS’s website: www.euklems.net
Employment data for India Economic Censuses
Deflators for India Deflators for OECD countries
Calculated using the current and constant price series for value added from CSO EUKLEMS
22
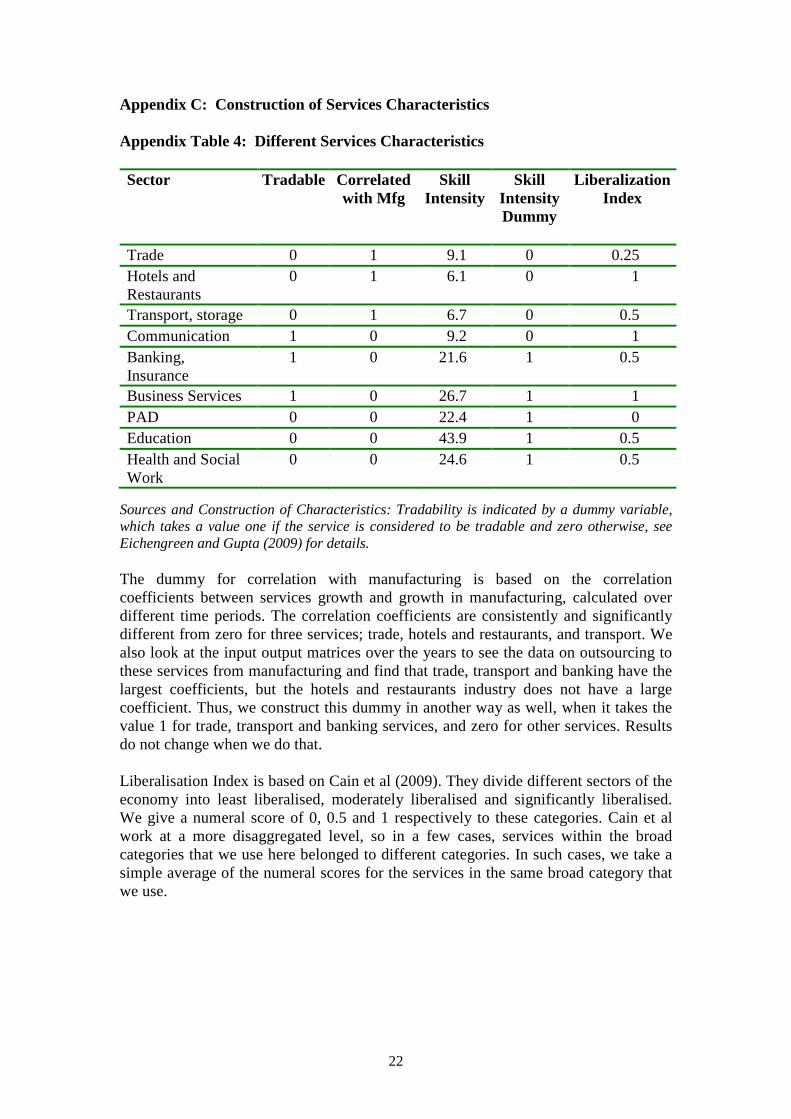
Appendix C: Construction of Services Characteristics Appendix Table 4: Different Services Characteristics Sector Tradable Correlated
with Mfg Skill
Intensity Skill
Intensity Dummy
Liberalization Index
Trade 0 1 9.1 0 0.25 Hotels and Restaurants
0 1 6.1 0 1
Transport, storage 0 1 6.7 0 0.5 Communication 1 0 9.2 0 1 Banking, Insurance
1 0 21.6 1 0.5
Business Services 1 0 26.7 1 1 PAD 0 0 22.4 1 0 Education 0 0 43.9 1 0.5 Health and Social Work
0 0 24.6 1 0.5
Sources and Construction of Characteristics: Tradability is indicated by a dummy variable, which takes a value one if the service is considered to be tradable and zero otherwise, see Eichengreen and Gupta (2009) for details. The dummy for correlation with manufacturing is based on the correlation coefficients between services growth and growth in manufacturing, calculated over different time periods. The correlation coefficients are consistently and significantly different from zero for three services; trade, hotels and restaurants, and transport. We also look at the input output matrices over the years to see the data on outsourcing to these services from manufacturing and find that trade, transport and banking have the largest coefficients, but the hotels and restaurants industry does not have a large coefficient. Thus, we construct this dummy in another way as well, when it takes the value 1 for trade, transport and banking services, and zero for other services. Results do not change when we do that. Liberalisation Index is based on Cain et al (2009). They divide different sectors of the economy into least liberalised, moderately liberalised and significantly liberalised. We give a numeral score of 0, 0.5 and 1 respectively to these categories. Cain et al work at a more disaggregated level, so in a few cases, services within the broad categories that we use here belonged to different categories. In such cases, we take a simple average of the numeral scores for the services in the same broad category that we use.
23
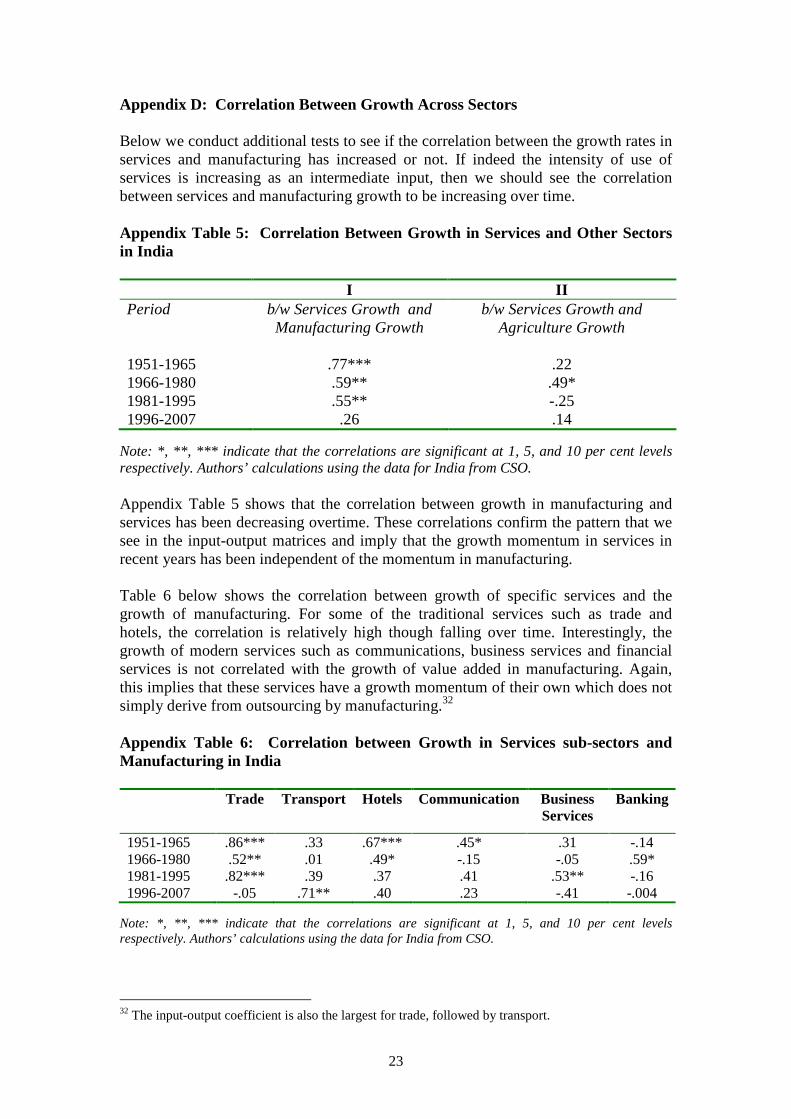
Appendix D: Correlation Between Growth Across Sectors Below we conduct additional tests to see if the correlation between the growth rates in services and manufacturing has increased or not. If indeed the intensity of use of services is increasing as an intermediate input, then we should see the correlation between services and manufacturing growth to be increasing over time. Appendix Table 5: Correlation Between Growth in Services and Other Sectors in India I II Period b/w Services Growth and
Manufacturing Growth b/w Services Growth and
Agriculture Growth
1951-1965 .77*** .22 1966-1980 .59** .49* 1981-1995 .55** -.25 1996-2007 .26 .14
Note: *, **, *** indicate that the correlations are significant at 1, 5, and 10 per cent levels respectively. Authors’ calculations using the data for India from CSO. Appendix Table 5 shows that the correlation between growth in manufacturing and services has been decreasing overtime. These correlations confirm the pattern that we see in the input-output matrices and imply that the growth momentum in services in recent years has been independent of the momentum in manufacturing. Table 6 below shows the correlation between growth of specific services and the growth of manufacturing. For some of the traditional services such as trade and hotels, the correlation is relatively high though falling over time. Interestingly, the growth of modern services such as communications, business services and financial services is not correlated with the growth of value added in manufacturing. Again, this implies that these services have a growth momentum of their own which does not simply derive from outsourcing by manufacturing.32 Appendix Table 6: Correlation between Growth in Services sub-sectors and Manufacturing in India Trade Transport Hotels Communication Business
Services
Banking
1951-1965 .86*** .33 .67*** .45* .31 -.14 1966-1980 .52** .01 .49* -.15 -.05 .59* 1981-1995 .82*** .39 .37 .41 .53** -.16 1996-2007 -.05 .71** .40 .23 -.41 -.004
Note: *, **, *** indicate that the correlations are significant at 1, 5, and 10 per cent levels respectively. Authors’ calculations using the data for India from CSO.
32 The input-output coefficient is also the largest for trade, followed by transport.

24
Figure 1: Shares of Agriculture, Industry and Services in India
Note: Data used is from the Central Statistical Organisation (CSO) from 1950-2007.
Figure 2: Sectoral Growth Rates
(Average Annual Growth Rates)
Note: Data used is from the Central Statistical Organisation (CSO) from 1950-2007
1020
3040
506
0
1950 1960 1970 1980 1990 2000 2010year
Agrculture IndustryServices
0
1
2
3
4
5
6
7
8
9
1951-79 1980-89 1990-99 2000-2007
Agriculture Industry Manufacturing Services
25
Figure 3: Services Sector Share in GDP and Log Per Capita Income
Note: The charts extend the analysis in Eichengreen and Gupta (2009) through 2006. The estimated relationship is based on a regression of share of services in GDP on a quartic polynomial in log per capita income, and country fixed effects. The regressions allow for a different intercept in the three periods indicated and different slope parameters in 1990-2006.
Figure 4: Industry’s Share in GDP and Per Capita Income
Note: The charts extend the analysis in Eichengreen and Gupta (2009) through 2006. The estimated relationship is based on a regression of share of industry in GDP on a cubic polynomial in log per capita income, and country fixed effects. The regressions allow for a different intercept in the three periods indicated and different slope parameters in 1990-2006.
2040
6080
2040
6080
6 7 8 9 10
6 7 8 9 10
1950-1969 1970-1989
1990-2006
Linear prediction India
1020
3040
1020
3040
6 7 8 9 10
6 7 8 9 10
1950-1969 1970-1989
1990-2006
Linear prediction India
Log Per Capita Income
26
Figure 5: Size of Specific Services in India (Percent of GDP)
A. Group I
B. Group II
C. Group III
Note: Own calculations using the data from CSO.
05
1015
1950 1960 1970 1980 1990 2000 2010year
Public admn, Defence TradeTransport, Storage
01
23
45
1950 1960 1970 1980 1990 2000 2010year
Hotels, rest EducationMedical ser Personal, social ser
02
46
1950 1960 1970 1980 1990 2000 2010year
Communication Business ServicesFinancial Services
27
Figure 6: Size of Service Activities in Different Groups
(in per cent of GDP)
Note: Group I includes public administration and defence, trade and transport; group II includes education, health and hotels; and group III includes communication, financial services and business services. From group II, we have excluded other personal and social services.
0
5
10
15
20
25
30
1950
1960
1970
1980
1990
2000
2006
I: PAD, Trade, Trasport II: Edu, Health, Hotel III: Commu, Fin, Bus Ser
28
Figure 7: Contribution of Various Services to Total Services Growth
Group II and III
Group I
Note: Own calculations using the data from CSO.
0
1
2
3
4
5
1950s-70s 1980s 1990s 2000-2006
Communication Business Ser Banking Education and Health Hotels
0
1
2
3
4
5
1950s-70s 1980s 1990s 2000-2006
Trade Transport PAD

29
Figure 8: Size of Different Service Activities and Per Capita Income-Cross Country Experience and India
A: Group I
B: Group II
C: Group III
Note: Cross-country data is from the EUKLEMS database, and the data for India is from the CSO.
010
2030
Sha
re o
f Se
rvic
es
in G
roup
I
6 7 8 9 10Log Per Capita Income
Share of Services in Group I Share of Group I in IndiaShare of Services in South Korea
010
2030
Sha
re o
f Ser
vice
s in
Gro
up II
6 7 8 9 10Log Per Capita Income
Share of Services in Group II Share of Group II in IndiaShare of Services in South Korea
010
2030
Sha
re o
f Ser
vice
s in
Gro
up II
I
6 7 8 9 10Log Per Capita Income
Share of Services in Group III Share of Group III in IndiaShare of Services in South Korea
30
Figure 9: Different Uses of Services as per cent of Total Services
Value Added in India
0
10
20
30
40
50
60
701
99
1
19
92
19
93
19
94
19
95
19
96
19
97
19
98
19
99
20
00
20
01
20
02
20
03
20
04
20
05
20
06
20
07
Industry Exports Agriculture Residual
Note: own calculations using the data from the CSO.
Figure 10: Different Uses of Services as Per Cent of Total Services Value Added
across Countries
0
5
10
15
20
25
19
81
19
83
19
85
19
87
19
89
19
91
19
93
19
95
19
97
19
99
20
01
20
03
20
05
Industry-US Exports-US Agriculture-USIndustry_EUKLEMS Agr-EUKLEMS
1990
32%
22%
3%
Miscellaneous Travel Transport
Source: World Development Indicators
Figure 12: Composition of Services Exports from India
31
43%
Transport Other
2000
21%
13%
6%
Miscellaneous Travel
2007
74%
13%
11%2%
Miscellaneous Travel Transport Other
Figure 11: Exports of Services
Source: World Development Indicators
Composition of Services Exports from India
Sources: RBI, India
0
2
4
6
8
10
India's Services Export (Percentage of GDP)
60%
Travel Transport Other
Other
Composition of Services Exports from India
India's Services Export (Percentage of GDP)

32
Figure 13: Composition of Exports of Miscellaneous Services
Source: RBI’s website.
Figure 14: Services Growth in India Attributed to Growth in End Use
Note: Calculated using Equation 4 and as described in the text.
2007
64%
27%
5% 4%
Software Business Financial Communication
0
2
4
6
8
10
12
1991-1997 1998-2002 2003-2007
Agriculture Industry Exports Domestic Consumption(Residual)
33
01
02
030
1970 1975 1980 1985 1990 1995 2000 2005year
Share in Employment Share in Value Added
010
2030
1970 1975 1980 1985 1990 1995 2000 2005year
Share in Employment Share in Value Added
010
2030
1970 1975 1980 1985 1990 1995 2000 2005year
Share in Employment Share in Value Added
010
2030
1970 1975 1980 1985 1990 1995 2000 2005year
Share in employment Share in GDP
010
2030
1970 1975 1980 1985 1990 1995 2000 2005year
Share in employment Share in GDP
010
2030
1970 1975 1980 1985 1990 1995 2000 2005year
Share in employment Share in GDP
Figure 15: Share of Different Services groups in GDP and Employment
A. Average of EUKLEM Countries
Group I Group II Group III
B. South Korea
Group I Group II Group III
34
Table 1: Characteristics of Different Services Average
annual productivity increase in
1990s (in per cent)
Average annual
productivity increase in 1990-2005
(in per cent)
ICT (Producing or Using)
Tradability
Group I
Public Administration, Defence
0.11 0.31 0 NT
Retail Trade 1.71 1.17 1 NT Transport and Storage 1.85 1.01 0 ? Wholesale Trade 1.54 1.88 1 ?
Group II
Education 0.13 -0.50 0 NT Health, Social Work -0.01 -0.53 0 NT Hotels and Restaurants -0.14 -1.00 0 NT Other Community, Social and Personal Services
-0.71 -0.86 0 NT
Group III
Posts and Communication
3.13 7.17 1 T
Computer Services n.a. n.a. 1 T Financial Intermediation n.a. n.a. 1 T Legal, Technical, Advertising
n.a. n.a. 1 T
Other Business Activities
n.a. n.a. 0/1 T
Note: Source is Eichengreen and Gupta (2009). ICT equal to 0 implies that the service neither produces nor uses information and communication technology; and a 1 indicates that the service uses or produces information and communication technology. In the last column, NT refers to non-tradable services and T refers to tradable services. The information on tradable and non- tradable services is derived from Jensen and Kletzer (2005). Jensen and Kletzer calculate the Gini Coefficient for the geographical dispersion of each activity, and use it to identify tradable and non-tradable services. The underlying idea is that services that are tradable can be geographically concentrated in order to reap economies of scale. Productivity refers to total factor productivity and the average annual growth rates have been calculated using data from EUKLEMS.

35
Table 2: Growth Rates and Sectoral Shares of Different Services in India
Sector Activities Included
Avg. Growth Rate in 1950–79 (Share in
1980)
Avg. Growth Rate in 1980–89 (Share in
1990)
Avg. Growth Rate in 1990–99 (Share in
2000)
Avg. Growth Rate in 2000-06
(Share in 2006)
Trade (distribution services): Wholesale and retail trade in commodities both produced at home and imported, purchase and selling agents, brokers and auctioneers
4.8 (10.6)
5.7 (11.2)
7.0 (13.1)
7.7 (13.9)
Hotels & Restaurants: Services rendered by hotels and other lodging places, restaurants, cafes and other eating and drinking places
4.8 (0.81)
5.9 (0.89)
9.1 (1.3)
9.2 (1.5)
Railways
4.2 (1.6)
4.1 (1.5)
3.3 (1.2)
6.7 (1.2)
Transport by other means: Road, water, air transport, services incidental to transport
6.3 (3.6)
6.7 (4.0)
6.9 (4.6)
8.7 (5.3)
Storage
5.5 (0.14)
2.6 (0.11)
2 (0.1)
3.1 (0.1)
Communication: Postal, money orders, telegrams, telephones, overseas communication services, miscellaneous
6.7 (0.66)
5.8 (0.7)
13.8 (2.0)
22.8 (4.9)
Banking: Banks, banking department of RBI, post office saving bank, non-bank financial institution, co-operative credit societies, employees provident fund
7.2 (1.9)
10.0 (3.3)
10.6 (5.0)
7.6 (5.6)
Insurance Life, postal life, non-life
7.1 (0.55)
9.6 (0.62)
2.2 (0.61)
14.3 (1.1)
Dwellings, real estate
2.6 (4.5)
7.2 (5.8)
4.8 (5.2)
2.5 (3.9)
Business services: Renting of machinery, computer related services, accounting, research etc.
4.2 (0.42)
9.1 (0.7)
15.9 (2.1)
17.3 (3.6)
Legal services
2.6 (0.13)
8.1 (0.2)
5.6 (0.2)
3.6 (0.14)
Public administration, defence 6.1 (5.7)
6.7 (6.4)
5.9 (6.7)
4.0 (5.6)
Personal and Other services: Domestic, laundry, barber, beauty shops, tailoring, recreation, entertainment, radio, TV, broadcast, sanitary services
1.4 (2.4)
2.5 (1.9)
4.7 (1.8)
5.9 (1.7)
Community services Education, research, scientific, medical, health, religious and other community
4.8 (4.6)
7.5 (5.1)
7.5 (6.3)
6.9 (6.2)
Note: Own calculations using the data from CSO

36
Table 3: Service Input per unit of Output in Agriculture and Industry in India 1993 1998 2003 Agriculture 0.07 0.06 0.08 Industry Weighted
0.84
0.55
0.72 Unweighted 0.79 0.55 0.73
Note: Authors’ own calculations using the data on input-output matrices from CSO. The data that we get from the CSO is for input use per unit of value of output. We transform these in terms of per unit of value added. The data is available for individual industries, which we average across industries. We calculate these averages by taking a simple average across various industries; and as a weighted average (with weights equal to the share of value added of each industry in total industry value added). Table 4: Explaining the Growth in Services in India
Dependent variable: Growth in Value Added of Different Services I II III IV V VI
Size gap 0.57** 0.53*** 0.64*** 0.38 0.63
[2.57] [2.65] [2.85] [1.44] [1.47]
Log Per Capita Income 29.04 30.56 26.57 36.29 26.96 50.62
[0.39] [0.46] [0.41] [0.57] [0.43] [0.79]
Log Per Capita Income sq -1.51 -1.62 -1.34 -2.03 -1.37 -3.04
[0.29] [0.36] [0.30] [0.46] [0.31] [0.69]
Tradable (Dummy) 4.91*** 4.92*** 4.17*** 5.56*** 3.72***
[6.50] [6.54] [4.69] [3.14] [3.29]
Skilled labour Intensity -0.04 -0.01 0.02 0.01
[1.53] [0.52] [0.42] [0.34]
Liberalisation (Index) 2.04 0.68 3.35***
[1.51] [0.34] [2.86]
Correlated with Industrial Growth, dummy 1.85 0.05
[0.97] [0.05]
Observations 225 225 225 225 225 225
R-squared 0.13 0.32 0.32 0.33 0.33 0.32
Note: Robust t statistics are in parentheses. *, **, *** indicate the coefficients are significant at 1, 5, and 10 per cent significance levels respectively. Regression equation estimated is in Equation 4.
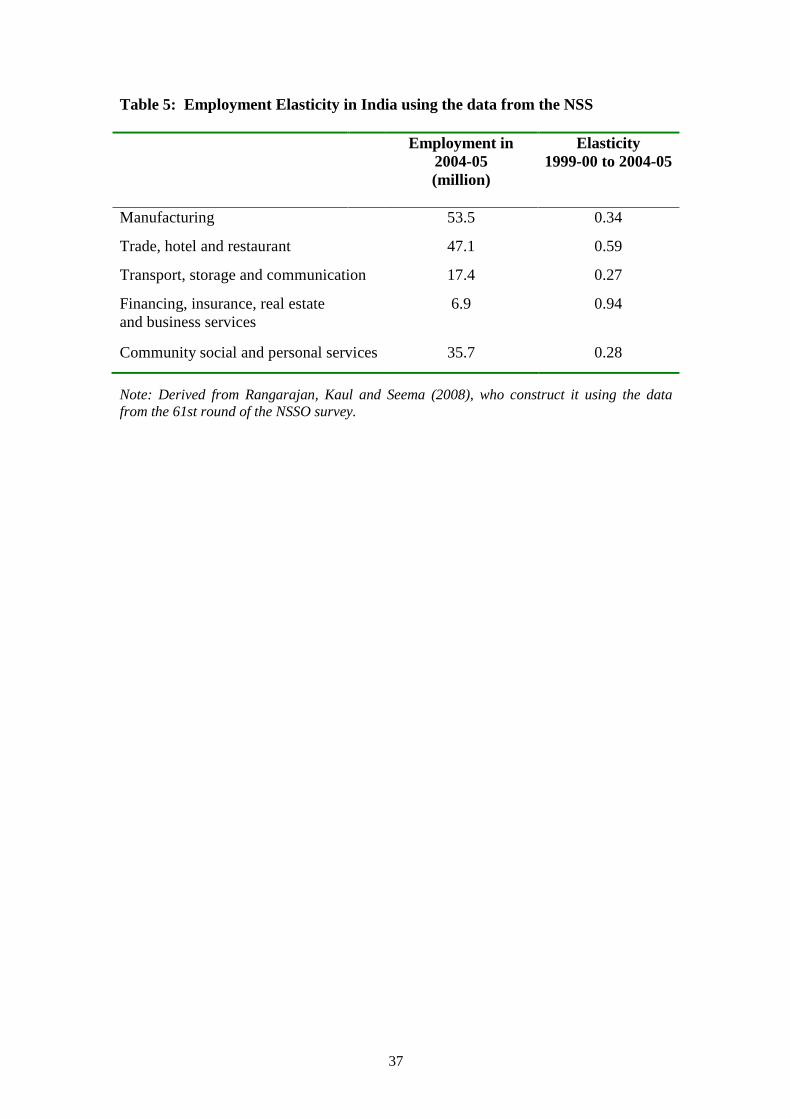
37
Table 5: Employment Elasticity in India using the data from the NSS Employment in
2004-05 (million)
Elasticity 1999-00 to 2004-05
Manufacturing 53.5 0.34
Trade, hotel and restaurant 47.1 0.59
Transport, storage and communication 17.4 0.27
Financing, insurance, real estate and business services
6.9 0.94
Community social and personal services 35.7 0.28
Note: Derived from Rangarajan, Kaul and Seema (2008), who construct it using the data from the 61st round of the NSSO survey.
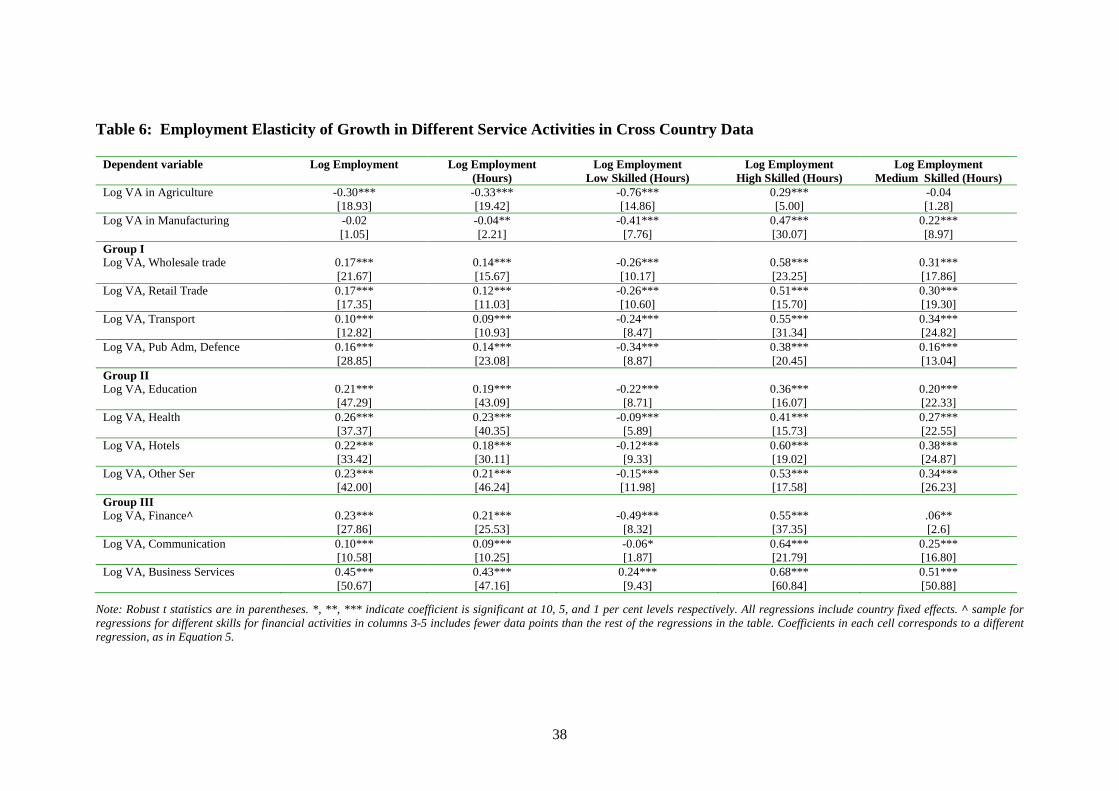
38
Table 6: Employment Elasticity of Growth in Different Service Activities in Cross Country Data
Dependent variable Log Employment Log Employment (Hours)
Log Employment Low Skilled (Hours)
Log Employment High Skilled (Hours)
Log Employment Medium Skilled (Hours)
Log VA in Agriculture -0.30*** -0.33*** -0.76*** 0.29*** -0.04 [18.93] [19.42] [14.86] [5.00] [1.28] Log VA in Manufacturing -0.02 -0.04** -0.41*** 0.47*** 0.22*** [1.05] [2.21] [7.76] [30.07] [8.97] Group I Log VA, Wholesale trade 0.17*** 0.14*** -0.26*** 0.58*** 0.31*** [21.67] [15.67] [10.17] [23.25] [17.86] Log VA, Retail Trade 0.17*** 0.12*** -0.26*** 0.51*** 0.30*** [17.35] [11.03] [10.60] [15.70] [19.30] Log VA, Transport 0.10*** 0.09*** -0.24*** 0.55*** 0.34*** [12.82] [10.93] [8.47] [31.34] [24.82] Log VA, Pub Adm, Defence 0.16*** 0.14*** -0.34*** 0.38*** 0.16*** [28.85] [23.08] [8.87] [20.45] [13.04] Group II Log VA, Education 0.21*** 0.19*** -0.22*** 0.36*** 0.20*** [47.29] [43.09] [8.71] [16.07] [22.33] Log VA, Health 0.26*** 0.23*** -0.09*** 0.41*** 0.27*** [37.37] [40.35] [5.89] [15.73] [22.55] Log VA, Hotels 0.22*** 0.18*** -0.12*** 0.60*** 0.38*** [33.42] [30.11] [9.33] [19.02] [24.87] Log VA, Other Ser 0.23*** 0.21*** -0.15*** 0.53*** 0.34*** [42.00] [46.24] [11.98] [17.58] [26.23] Group III Log VA, Finance 0.23*** 0.21*** -0.49*** 0.55*** .06** [27.86] [25.53] [8.32] [37.35] [2.6] Log VA, Communication 0.10*** 0.09*** -0.06* 0.64*** 0.25*** [10.58] [10.25] [1.87] [21.79] [16.80] Log VA, Business Services 0.45*** 0.43*** 0.24*** 0.68*** 0.51*** [50.67] [47.16] [9.43] [60.84] [50.88]
Note: Robust t statistics are in parentheses. *, **, *** indicate coefficient is significant at 10, 5, and 1 per cent levels respectively. All regressions include country fixed effects. ^ sample for regressions for different skills for financial activities in columns 3-5 includes fewer data points than the rest of the regressions in the table. Coefficients in each cell corresponds to a different regression, as in Equation 5.

LATEST ICRIER’S WORKING PAPERS
NO.
TITLE
AUTHOR YEAR
248
OTC DERIVATIVES MARKET IN INDIA: RECENT REGULATORY INITIATIVES AND OPEN ISSUES FOR MARKET STABILITY AND DEVELOPMENT
DAYANAND ARORA FRANCIS XAVIER RATHINAM
APRIL 2010
247
DRIVERS OF ACADEMIC RESEARCH AND PATENTING IN INDIA: ECONOMETRIC ESTIMATION OF THE RESEARCH PRODUCTION FUNCTION
AMIT SHOVON RAY SABYASACHI SAHA
APRIL 2010
246
SOCIO-ECONOMIC IMPACT OF MOBILE PHONES ON INDIAN AGRICULTURE
SURABHI MITTAL SANJAY GANDHI GAURAV TRIPATHI
FEBRUARY 2010
245
INDIA-JAPAN INVESTMENT RELATIONS: TRENDS & PROSPECTS
GEETHANJALI NATARAJ
JANUARY 2010
244
PATENTING PUBLIC-FUNDED RESEARCH FOR TECHNOLOGY TRANSFER: A CONCEPTUAL-EMPIRICAL SYNTHESIS OF US EVIDENCE AND LESSONS FOR INDIA
AMIT SHOVON RAY SABYASACHI SAHA
JANUARY 2010
243
JAPAN’S FOREIGN DIRECT INVESTMENT EXPERIENCES IN INDIA: LESSONS LEARNT FROM FIRM LEVEL SURVEYS
SRABANI ROY CHOUDHURY
DECEMBER 2009
242
INDIA-KOREA TRADE AND INVESTMENT RELATIONS
PRAVAKAR SAHOO DURGESH KUMAR RAI RAJIV KUMAR
DECEMBER 2009
241
THE STATE OF THE INDIAN ECONOMY 2009-10
MATHEW JOSEPH KARAN SINGH PANKAJ VASHISHT DONY ALEX ALAMURU SOUMYA RITIKA TEWARI RITWIK BANERJEE
OCTOBER 2009
240
FOOD SECURITY IN SOUTH ASIA: ISSUES AND OPPORTUNITIES
SURABHI MITTAL DEEPTI SETHI
SEPTEMBER 2009
239
AGGREGATE PRODUCTIVITY GROWTH IN INDIAN MANUFACTURING: AN APPLICATION OF DOMAR AGGREGATION
DEB KUSUM DAS GUNAJIT KALITA
JULY 2009
About ICRIER
ICRIER – established in August 1981 – is an autonomous, policy-oriented, not-for-
profit, economic policy think tank. ICRIER’s main focus is to enhance the knowledge
content of policy making by undertaking analytical research that is targeted at
improving India’s interface with the global economy. We have nurtured our autonomy
by establishing an endowment fund, income from which enables us to pursue our
priority research agenda. ICRIER receives other financial support from a number of
sources including grants from the Government of India, multilateral international
institutions, bilateral agencies and the private sector.
A medium-term strategy that spells out ICRIER’s vision and focus areas can be found
on its website www.icrier.org. ICRIER has its own code of conduct for undertaking
research.
To effectively disseminate its research findings, ICRIER organises workshops/
seminars/ conferences to bring together political leaders, policy makers,
academicians, industry representatives and media persons to try and generate a more
informed understanding on issues of major policy interest. ICRIER invites
distinguished scholars and policy makers from around the world to deliver public
lectures on economic themes of interest to contemporary India.
ICRIER’s founding Chairman was Dr. K.B. Lall who led the organisation since its
inception till 1992 when he handed over the Chairmanship to Mr. R.N. Malhotra
(1992-1996). He was followed by Dr. I.G. Patel who remained Chairman from 1997
until his demise in July 2005. Amongst ICRIER’s founding members are Dr.
Manmohan Singh, Dr. C. Rangarajan, Dr. M.S. Swaminathan, Dr. Jagdish Bhagwati,
Dr. R. J. Chelliah, Mr. Muchkund Dubey, Prof. Deepak Nayyar etc. ICRIER’s current
Chairperson is Dr. Isher Judge Ahluwalia.
ICRIER’s highly qualified in-house team of about 50 researchers is led by Dr. Rajiv
Kumar, D.Phil in Economics from Oxford University and Ph.D from Lucknow
University. The team includes several Ph.Ds from reputed Indian and foreign
universities. In addition, we have around 25 external consultants working on specific
projects. ICRIER’s office is located in the prime institutional complex of India
Habitat Centre, New Delhi.