working with multidimensional scientific data using python · 2020. 4. 30. · can be used to...
TRANSCRIPT

Nawajish Noman, Sarmistha Chatterjee
Working with Multidimensional Scientific Data Using Python
Outline
• Scientific multidimensional data in ArcGIS• Reading, managing, visualizing and exploring• Performing analysis• Extending analytical capabilities using Python• Sharing as services and consuming• Resources

Scientific Multidimensional Data in ArcGIS

Scientific Multidimensional Data in ArcGIS
• Multidimensional Data• Observed data
Monitoring stations, other platformsRemotely sensed
• Reconstructed data• Simulation Model results
• Examples• Ocean data
Sea temperature, salinity, ocean current
• Weather dataTemperature, humidity, wind
• LandSoil moisture, NDVI, land cover
• Formats• NetCDF, GRIB, and HDF • Esri Mosaic dataset and Cloud Raster Format (CRF)

ArcGIS
direct ingest
data management
visualizationanalysis
share
Scientific Multidimensional Data in ArcGIS: Vision

• Spatial, temporal, and vertical dimensions
• Contains one or multiple variables in one file- A variable is cube or cubes- A variable has a time and/or depth- Each slice is a 2D array
• Multidimensional Raster- A Mosaic Dataset- Or a Raster Dataset
Multidimensional Raster
141 241 341 441
131 231 331 431
121 221 321 421
111 211 311 411
142 242 342 442
132 232 332 432
122 222 322 422
112 212 312 412
143 243 343 443
133 233 333 433
123 223 323 423
113 213 313 413
t = 1t = 2
t = 3
time
longitude

Climate and Forecast (CF) Conventionhttp://cfconventions.org/
Initially developed for• Climate and forecast data• Atmosphere, surface and ocean model-generated data• Also for observational datasets
• CF is now the most widely used conventions for geospatial netCDFdata. It has the best coordinate system handling.
• Current version 1.8
• You can use Compliance checker utility to check a netCDF file. http://cfconventions.org/compliance-checker.html
CF Convention

Reading, Managing and Exploring

Working with Multidimensional Data in ArcGIS Pro

• Directly reads netCDF, HDF and GRIB file using - Multidimensional Raster Layer option from Add Data- Multidimensional tools
- Make Multidimensional Raster Layer- Make NetCDF Raster Layer (netCDF)- Make NetCDF Feature Layer (netCDF)- Make NetCDF Table View (netCDF)
• Reads OPeNDAP Service- Make OPeNDAP Raster Layer- Output dynamic multidimensional raster- Support Sub-setting
• NetCDF, HDF and GRIB formats are supported in mosaic dataset
Reading Scientific data in ArcGIS

Multidimensional Ribbon in ArcGIS Pro
Slice/AnimateAnalysis Subset Explore Analysis Data Management

• Creates a seamless multi-dimensional cube from- Performs spatial and temporal aggregation - Files representing different regions- Files representing different time steps/slices
• Mosaic Dataset- Dynamic mosaic of imagery collection- Supports multiple files and variables, normalize time and depth - Table of records- Lives in Geodatabase- A Raster Dataset- Supports On-the-fly analysis- Supports sharing as servicesCreateMosaicDataset(in_workspace, in_mosaicdataset_name, coordinate_system, {num_bands}, {pixel_type}, {product_definition}, {product_band_definitions})AddRastersToMosaicDataset(in_mosaic_dataset, raster_type, input_path, {update_cellsize_ranges}, {update_boundary}, {update_overviews}, {maximum_pyramid_levels}, {maximum_cell_size}, {minimum_dimension}, {spatial_reference}, {filter}, {sub_folder}, {duplicate_items_action}, {build_pyramids}, {calculate_statistics}, {build_thumbnails}, {operation_description}, {force_spatial_reference}, {estimate_statistics}, {aux_inputs}, {enable_pixel_cache}, {cache_location})
Multidimensional Raster Data Management using Mosaic Dataset
Table
Mosaic
Raster
Mosaic Dataset
Raster Datasets
Raster Datasets

• Slicing• Multidimensional Ribbon in Pro• Select By Dimension Tool• Layer Property dialog in ArcMap
• Temporal animation using Time Slider• Dimensional animation using Range Slider
• Predefined renderer• Vector Field to display wind speed or ocean current
• Adding a custom Scientific Color Scheme to your ArcGIS Pro Project
Visualizing Multidimensional Data

• Temporal Profile• Visualize the distribution of a variable over time
• Summary Statistics• Compute summary statistics of a variable
Exploring Multidimensional Raster

Methods
PropertiesRaster Object
RasterObject
• properties• catalogPath• path • name • isTemporary• readOnly
• isInteger• hasRAT• isMultidimensional• bandCount• bandNames
• extent • width• height • meanCellWidth• meanCellHeight• spatialReference
• maximum• mean• minimum • standardDeviation• noDataValue• noDataValues
• mdinfo• variableNames• variables • slices
• format• pixelType• compressionType• uncompressedSize• blockSize
• save• exportImage
• getProperty• setProperty• getRasterInfo• getRasterBands
• getVariableAttributes• renameVariable• removeVariables
• getDimensionNames• getDimensionAttributes• getDimensionValues• addDimension
• read• write
Create from a raster dataset
Create an empty raster from rasterInfo
Output from a map algebra expression Raster (inRaster, {is_Multidmensional})

Multidimensional Raster Properties and Methods
Properties• mdinfo• variableNames• variables • slices
Methods: Variable• getVariableAttributes• renameVariable• removeVariables
Methods: Dimension• getDimensionNames• getDimensionAttributes• getDimensionValues• addDimension
Methods: Variable• getVariableAttributes (variable_name)• renameVariable (current_variable_name, new_variable_name)• removeVariables (variable_names)
Methods: Dimension• getDimensionNames (variable_name)• getDimensionAttributes (variable_name, dimension_name)• getDimensionValues (variable_name, dimension_name)• addDimension (variable, new_dimension_name, dimension_value, {dimension_attributes})
time
longitude

ReadingManagingVisualizing

Performing Analysis

Analysis in ArcGIS
ArcG
IS
API
ArcP
y

ArcPy – Over 1300+ Comprehensive GIS ToolsData Management
• Convert between formats, 2D <-> 3D, build topology, data reviewer, linear referencing,
• data comparison, manage spatial databases, distributed editing, servers & services
• Specialized datasets –parcels, utility networks, address locators, network datasets
Raster Analysis• Extraction, overlay, proximity,
distance, hydrology, multivariate, map algebra, neighborhood, fuzzy overlays
Spatial Machine Learning
• Interpolations, spatial sampling, simulations,
• Stats – enrich, density, hot spot, clustering, autocorrelations, balanced zones, outliers, similarity search, local bivariate relationships
• Prediction – random forests, GLR, OLS, GWR, validation
• Pattern mining – emerging hot spot, time series clustering,
• Big Data – GeoAnalyticsdesktop tools
• Deep Learning – classify objects, classify pixels, detect objects, export training data, train model
3D• LAS classification, extraction,
terrain, TIN, DEM, DSM, volume analysis
• Surface analysis – aspect, contour, cut fill, hillshade, slope, line of sight, sun shadow, viewshed, hydrology
Location analytics
• business intelligence –market penetration, Huff model, suitability analysis, territory design,
• Network – routing, OD cost matrix, service area, location allocation
• Geocoding – batch, reverse, composite
Cartography• annotations, generalization,
map series, masks• 100+ projections and
transformations• editing tools – conflation,
densify, cartographic refinement
• Layouts, printing, map series
Imagery analysis
• management – mosaic datasets, raster algebra,
• ortho mapping – point cloud, stereo model, photogrammetry, surface creation, ortho rectification
• information extraction –classification, object detection, segmentation, spectral analysis, statistics
• Full motion imagery, multidimensional rasters, solar radiation
• Hundreds of math and stat tools
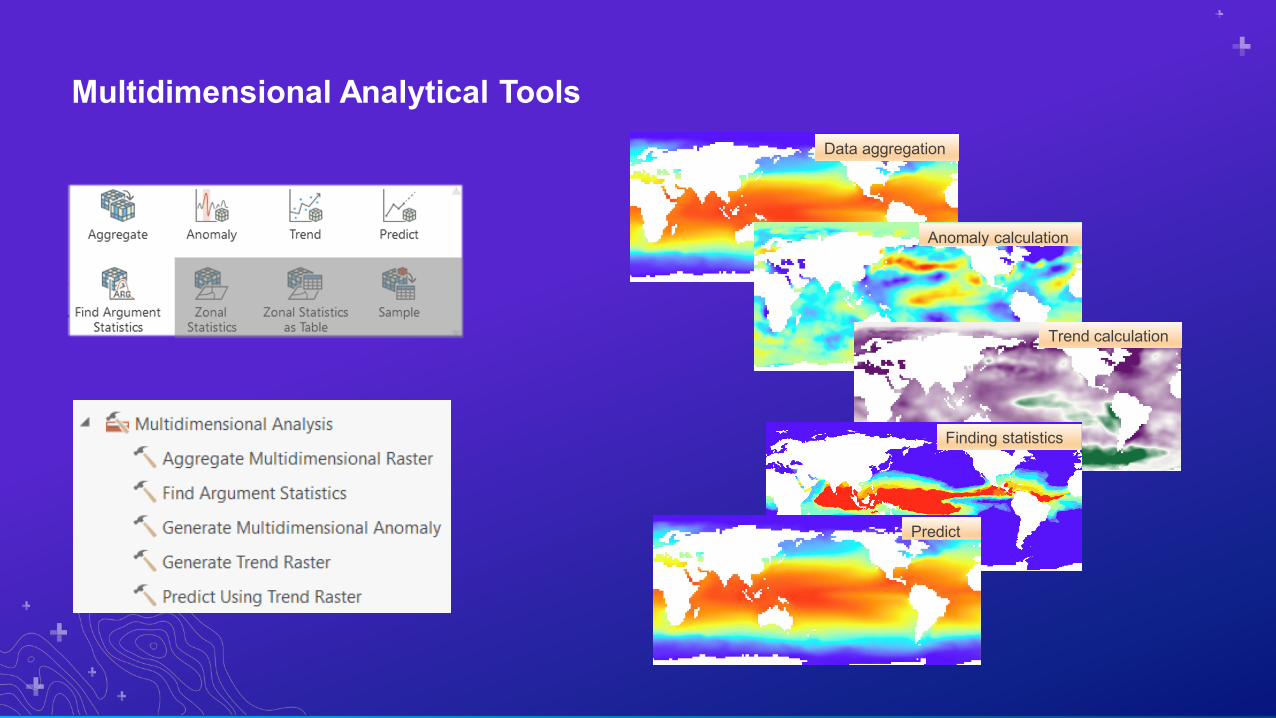
Multidimensional Analytical Tools Data aggregation
Anomaly calculation
Trend calculation
Finding statistics
Predict

Enhancement to Process Multidimensional Raster

• Several analytical functions are available out of the box• Functions are chained together to create complex model• Used to perform on-the-fly analysis• Extend analytical capability using Python Raster Function• Can be saved as a Raster Function Template (RFT)
On-the-Fly Analysis using Raster Functions

• You can execute all analysis tools, functions and operators in arcpy• You can perform multidimensional raster algebra using functions and operators
• Subset, RasterCollection, etc. functions allow to manage MD Raster- RasterCollection (rasters, {attribute_dict})
• You can use for each and apply to perform analysis on each slice of a multidimensional raster using any raster function or a function chain
- Apply (in_raster, raster_function, {raster_function_arguments})- Foreach (in_raster, raster_function, {raster_function_arguments})
• You can use arcpy.env.matchMultidimensionalVariable to control analysis
Data Management and Analysis with Multidimensional Raster in ArcPy

• Defines the group of input rasters and attributes to include in a collection, which will be used for processing.
RasterCollection (rasters, {attribute_dict})
Raster Collection
Properties• fields• count
Methods• filter • filterByAttribute• filterByCalendarRange• filterByGeometry• filterByRasterProperty• filterByTime• getFieldValues
• majority • map• max • mean • median • min
• mosaic • qualityMosaic• selectBands• sort • sum • toMultidimensionalRaster
NumPy
• Can be used to extend raster analysis capabilities by creating- custom functions- custom tools
• An extension package to Python- Adds support for large, multi-dimensional arrays- Provides a large library of high-level mathematical functions
• Access the wealth of free functions built by the scientific community - Clustering- Filtering- Linear algebra- Optimization- Fourier transformation- Morphology

NumPy Arrays
• Two functions to work with rasterRasterToNumPyArray(in_raster, {lower_left_corner}, {ncols}, {nrows}, {nodata_to_value})NumPyArrayToRaster (in_array, {lower_left_corner}, {x_cell_size}, {y_cell_size}, {value_to_nodata})
• Raster object Read and Write methods read ({upper_left_corner}, {origin_coordinate}, {ncols}, {nrows}, {nodata_to_value}, {cell_size})
write (array, {upper_left_corner}, {origin_coordinate}, {value_to_nodata})
12 4
343
12 4
343
Numpy Array
Raster

• The PixelBlock object defines a block of pixels within a raster to use for processing. It is used in conjunction with the PixelBlockCollection object to iterate through one or more large rasters for processing.
• getData () method returns a NumPy array within the extentPixelBlock (data, extent)
• The PixelBlockCollection object is an iterator of all PixelBlock objects in a raster or a list of rasters. It can be used to perform customized raster processing on a block-by-block basis, when otherwise the processed rasters would be too large to load into memory.
PixelBlockCollection (in_rasters, pixel_block_size, stride, overlay_type, nodata_to_values)
PixelBlock and PixelBlockCollection

Raster Cell Iterator (RCI)• Visit each cell in a Raster object by row/column
indices and read/write cell values
• Support iterating multiple raster datasets and perform analysis at the same location
• Access to cell values at each location and neighboring locations is efficient
• Available through the Spatial Analyst module
arcpy.sa.RasterCellIterator(*args),
*args is a dictionary that defines rasters and padding in the following format:
{'rasters': [in_rasterobj1, in_rasterobj2, ...], 'padding': padding_factor}
0 1 2 3 4
14 23 32 42 50
14 24 33 43 51
14 23 32 42 51
14 23 32 43 51
14 23 30 39 48
0 1 2 3 4

Community Developed Tools

Multidimensional Analysis

Sharing Multidimensional Data

ArcGIS Platform: Disseminating
Access / Identity
Apps
Services
Desktop Web Device
Online Content and
Services
Server
multivariate multidimensional mosaic dataset
professionalgeospatial analysts

Sharing Scientific Data
• Mosaic Dataset/CRF ≻ Right click from the Catalog and click on ‘Share As Web Layer’
• Map Service (supports WMS)- Makes maps available to the web.
• Image Service (supports WMS)- Provides access to raster data through a web
service.
Enable access to a dynamic representation of your information product as an image service

HRRR Data Sharing Workflow
CreateMosaic Dataset
PublishMosaic Dataset
Ingest:MetadataReferences to Source
Approx 30 records/Sec
ServerAccessible
HRRR Dataset(GRIB)
ArcGISImage Server
DownloadHRRRDataset(GRIB)
ModelGeneration
Time t
High Resolution Rapid Refresh Weather Model3 km resolutionHourly update

Consuming Multidimensional Data Services
• In any ArcGIS application or any WMS client
• In a web map• Identify web services driven by maps or datasets• Bring service layers into a web map
• In a map-based application• Configurable apps• Story Maps• Web AppBuilder• Custom web apps using ArcGIS API for JavaScript

Industry solutions
Workflow apps
App buildersApp templates
Python API Story Maps
Presenting your Actionable Information | Customizing and Extending ArcGIS

Customizing and Extending ArcGIS
Use raster analytics and Python API to monitor coral bleaching in Dashboard to show alert levels and coral stress over time.https://www.esri.com/arcgis-blog/products/image-server/imagery/dev-summit-2020-use-raster-analytics-and-the-python-api-to-monitor-coral-bleaching/
Operations Dashboard for ArcGIS

The Living Atlas

The Living Atlas: Apps

The Living Atlas: Story Maps

ArcGIS is a Scientific Collaboration Platform
Con
sum
e
Contribute
Discover
Remote Sensing & Scientific Data
Analysis
Rich Information Products
Dissemination with Choices
FilesServices
CapabilityChoices
FormatChoices
ArcGIS Online or on-premise Portal

Sharing Multidimensional Data as a Service
Consuming

Resources
• ArcGIS Pro Help Document- Tutorials in ArcGIS Imagery Workflows - ArcPy classes, functions- ArcPy Image Analyst module- ArcPy Spatial Analyst module- Tool Reference: Multidimension toolbox- Tool Reference: Image Analyst toolbox- Tool Reference: Spatial Analyst toolbox
• Learn ArcGIS Lessons • ArcGIS blogs

Summary
• ArcGIS Platform provides a rich set of functionality to work with multidimensional scientific data
• Multidimensional ribbon, new and enhanced tools makes it easier to visualize, explore and analyze multidimensional raster
• ArcPy Raster object has been enhanced to represent multidimensional raster
• Mosaic Dataset is a robust data model that allows you to manage your large collections of scientific multidimensional data
• Raster function(s) can help with your efficient on the fly computing that saves time and resources
• ArcPy and NumPy is a powerful way to extend analytical capabilities using Python
• Multidimensional data can be shared as a service, it can be consumed in many applications
• ArcGIS is a platform for scientific collaboration
