working qualitative un-verifiable papers in · università cattolica del sacro cuore ... padova....
TRANSCRIPT

Working
Papers in
Responsible
Banking &
Finance
Qualitative Un-Verifiable
Disclosures to Inform or
Mislead: Insights from
Insider Trading Activity
By Elena Beccalli, Saverio
Bozzolan, Enrico Laghi and
Marco Mattei
Abstract: Existing literature has extensively investigated if un-
verifiable narrative disclosure (qualitative disclosure) gives
incremental information or increases the opacity to investors.
Empirical studies consistently provide evidence that qualitative
disclosure is perceived useful as it has significant effects on
analyst forecast revision and share prices. But these results
leave unanswered the question whether managers come up with
qualitative disclosure to inform or mislead investors. To
disentangle this issue, we investigate whether qualitative
disclosure truthfully represents the rational expectations of the
manager responsible for the disclosure. Grounding on signaling
theory, we consider two signals coming from the same manager:
one (the insider trading) is the costly signal whilst the other (the
qualitative disclosure) is the cheap signal and we verify if they
are coherent. Our results suggest that the cheap signal is not
aligned with the costly signal suggesting that qualitative
disclosure is used to mislead investors and not to offer
incremental information, irrespective on how this disclosure is
considered by market participants.
WP Nº 14-013
4th Quarter 2014

1
Qualitative un-verifiable disclosures
to inform or mislead:
insights from insider trading activity
Elena Beccalli Università Cattolica del Sacro Cuore (Milan) and
London School of Economics and Political Science (London)
Saverio Bozzolan (*) LUISS University (Rome)
Enrico Laghi University of Rome, La Sapienza
Marco Mattei University of Rome, La Sapienza
This version: November 2014
(*) Corresponding Author
Saverio Bozzolan
Department of Business and Management
LUISS University
Viale Romania, 32
00198 Roma
e-mail: [email protected]
Acknowledgement
The authors are grateful to Giovanna Michelon, Michele Fabrizi, Claudia Imperatore for their helpful comments
and suggestions. This research has been partially conducted when Saverio Bozzolan was at the University of
Padova. Saverio Bozzolan gratefully acknowledges the financial contribution from the University of Padova
(project ex60% 2011). Enrico Laghi and Marco Mattei gratefully acknowledge the financial contribution from
University of Rome, La Sapienza (Project 2013 no. C26A13NW2N)
2
Qualitative un-verifiable disclosures to inform or mislead:
Insights from insider trading activity
Abstract
Existing literature has extensively investigated if un-verifiable narrative disclosure (qualitative disclosure) gives
incremental information or increases the opacity to investors. Empirical studies consistently provide evidence
that qualitative disclosure is perceived useful as it has significant effects on analyst forecast revision and share
prices. But these results leave unanswered the question whether managers come up with qualitative disclosure to
inform or mislead investors. To disentangle this issue, we investigate whether qualitative disclosure truthfully
represents the rational expectations of the manager responsible for the disclosure. Grounding on signaling
theory, we consider two signals coming from the same manager: one (the insider trading) is the costly signal
whilst the other (the qualitative disclosure) is the cheap signal and we verify if they are coherent. Our results
suggest that the cheap signal is not aligned with the costly signal suggesting that qualitative disclosure is used to
mislead investors and not to offer incremental information, irrespective on how this disclosure is considered by
market participants.
Keywords: Signaling theory, Impression management, Insider trading, Letter to Shareholder, Ethics
JEL codes: G11, G14, G30, M41

3
1. INTRODUCTION
In recent years we have observed the increasing importance of un-verifiable narrative
disclosure (hereafter: qualitative disclosure) within the firm reporting package, as remarked
by the call for more narrative and descriptive disclosures by regulatory bodies (i.e. AICPA,
1994). Studies have analysed qualitative disclosure in Annual Reports or in SEC mandatory
filings (Davis and Tama-Sweet, 2012; Li, 2010; Feldman et al., 2010; Smith and Taffler,
1995), and in other voluntary disclosure such as managerial earnings forecasts (Kravet,
Muslu, 2013; Baginski et al., 2012), earnings announcements (Davis et al., 2012) or
conference calls (Davis et al., 2014; Larcker and Zakolyukina, 2012). In general, empirical
evidence has consistently shown that qualitative disclosure is value relevant over and above
quantitative – verifiable disclosure. This result has been obtained looking at the effects of
qualitative disclosure on analyst forecast revision or share prices.
In order to disentangle whether managers use qualitative disclosure to increase
transparency (informative disclosure) or to strategically make the firm more opaque to exploit
information asymmetries for achieving personal advantage (misleading disclosure), we adopt
a different perspective. We investigate whether qualitative disclosure truthfully represents the
rational expectations on the firm outlook that the manager responsible for the disclosure has,
instead of studying the effects of qualitative disclosure on market participant and on share
price as in previous literature. We focus on qualitative disclosure in the Letter to Shareholders
(hereafter: LTS), and our evidence shows that the author of the LTS (hereafter: Author) uses
qualitative disclosure to mislead investors since her insider trading activity is not aligned with
the content of the information sent through qualitative disclosure. We also find that not all

4
insiders benefit from these information advantages, since it is limited to the Author and not
extended to other board members.
We ground our study on signalling theory and cheap talk models. We argue that
qualitative disclosure (the cheap signal of the insiders’ expectations about firm performance)
truthfully represents insiders’ expectations only when the characteristics of qualitative
disclosure are aligned with how the insiders trade firm share (the costly signal of the insiders’
expectations). We contend that there is the willingness to inform (mislead) investors through
qualitative disclosure when insiders trade firm shares in the same (opposite) direction
suggested by the information sent through qualitative disclosure. In the first case insiders buy
(sell) shares before showing positive (negative) expectations in the disclosure and, in the
other, they buy (sell) shares before showing negative (positive) expectations in qualitative
disclosure.
We analyse this relationship looking at the association between qualitative disclosure
in the LTS of Italian listed companies for the years 2008 - 2010 and insider trading of the
Author. Italy is a good setting for this research design because in Italy qualitative disclosure is
not subjected to any regulation and it is completely voluntary. Litigation costs are also low in
Italy (La Porta et al., 1999) and, consequently, qualitative disclosure in the LTS can be seen
as “a real” cheap talk, so being significantly different from other costly signals as insider
trading. We find that before the release of the LTS the insider trading made by the Author is
not coherent with the qualitative disclosure in the LTS. We interpret this result as the
evidence that qualitative disclosure is conducted to mislead investors. In order to test further
our main result, we investigate the association between the insider trading of the Author after

5
the release of the LTS (when the qualitative disclosure becomes public) and insider trading by
board members other than Author and her family members (hereafter: Directors) both before
and after the release of the LTS. We find that insider trading of the Author significantly
changes after the release of the LTS, being no more associated with qualitative disclosure. We
also find no significant association between insider trading of Directors before the release of
the LTS and qualitative disclosure in the LTS. This result implies that their insider trading, if
any, depends on their own interpretation of private information that is different from the
information sent through the LTS with qualitative disclosure. After the release of the LTS,
when qualitative disclosure becomes public, the insider trading of the Directors is still not
aligned with the qualitative disclosure in the LTS but with the insider trading of the Author
before the release of the LTS. We argue that Directors, who have access to firm private
information, follow the indication of the costly signal coming from the Author through insider
trading instead of the cheap signal from qualitative disclosure in the LTS.
To our knowledge, this paper is the first to explicitly assess the informativeness of
qualitative disclosure directly disentangling if it truthfully represents expectations of the
Author or it is made to mislead investors. This issue is of extreme importance because
qualitative disclosure tends to be un-regulated and un-audited leaving room to its misuse with
a low risk to be detected. Our paper differs from existing literature as we establish a direct
link between the cheap (the disclosure) and the costly (the insider trading) signal sent by the
insiders. We contribute to the literature about the role of qualitative disclosure showing that
what matters is not its effects on analyst forecast or on share price but its coherence with the
costly signal sent. Our evidence of the missing alignment between the cheap and the costly

6
has a very negative implication for the relevance of qualitative disclosure. Our study also
contributes to the impression management literature to separate value relevant from
misleading qualitative disclosure. Previous literature (Patelli and Pedrini, 2014) argues that
impression management is found when the qualitative disclosure is not aligned with firm
future performance. We contend that this is neither a sufficient nor a necessary condition.
There is not a necessary condition because future performance can be managed as well,
through accrual or real earnings management significantly reducing the significance of the
association. There is not a sufficient condition because at the time of the disclosure the Author
can have indeed positive expectations about firm performance and she represents this outlook
in qualitative disclosure, but it does not automatically imply that expectations effectively
become good performance. Therefore, qualitative disclosure can be conducted with the
truthfully aim to inform investors, since Author’s expectations are sincere, even when
observed future performance is not coherent with qualitative disclosure.
The paper proceeds as follows. The next section provides literature review and
hypothesis development. Section 3 presents the research design and section 4 contains results
and additional analyses. Section 5 presents some robustness checks. Section 6 discusses the
results and concludes the paper.
2. LITERATURE REVIEW AND HYPOTHESIS DEVELOPMENT
It is well known that insiders are able to exploit their superior knowledge to
expropriate wealth from less informed market participants and that insiders can strategically
manipulate disclosures to their own advantages (Clatworthy and Jones, 2001). In this vein,

7
there are two perspectives on the role of qualitative disclosure (Merkl-Davies and Brennan,
2007). The information perspective holds that managers use qualitative disclosures to reveal
their private expectations about the firm performance (Baginski et al., 2000). The impression
management perspective holds that managers misreport information and that such
opportunistic behaviour is driven by private incentives proposed by agency theory (Ramanna
and Watts, 2012). The preparers of disclosures may seek private benefit by taking advantage
of the information asymmetry. Since managers decide the information to be disclosed (Merkl-
Davies and Brennan, 2007), they may “cook the books” (earnings management) or manipulate
the disclosure to enhance the perception of performance or minimize the repercussions of
negative news (Schleicher and Walker, 2010). The Letter to Shareholders allows its author
discretion regarding what information to include (Smith and Taffler, 2000). Even if it is
partially subject to regulation or auditing, as its content must be consistent with the financial
statements, the Letter to Shareholders has considerable potential as a tool for impression
management (Kohut and Segars, 1992) since the author decides on both the content (what is
included) and the narrative (how the content is presented).
When the user of the disclosure is not able to evaluate whether it is believable or not,
an insider can take advantages of information asymmetry and might have incentives to
disclose misleading information. We rely on the signalling literature to disentangle whether
qualitative disclosure truthfully represent the expectations of the Author, thus being
informative, or are conducted to mislead investors. Signalling theory predicts that a signal is
credible when it is costly, but not when it is a cheap talk. Therefore a manager is credible in
revealing unverifiable private information about the firm when sending a signal is costly.

8
Spence (1973) proposes that high-ability workers signal their characteristics by investing in
education. The implicit assumption is that having a high-level education represents high
ability and it is costly to achieve. Leland and Pyle (1977) show that the percentage of
ownership retained by owners in a security offering increases the credibility particularly when
the firm’s expected profitability is lower. Filatotchev and Bishop (2002) find that leaders of a
young firm in an IPO choose prestigious directors for the Board to send a message to potential
investors about the firm’s legitimacy. Zhang and Wiersema (2009) show that the CEO might
signal the unobservable quality of their firm through the observable quality of the financial
statements. In a related context, Beneish and Vargus (2002) argue that earnings management
(interpreted as the not costly signal) is informative when the direction of the earnings
management is consistent with the direction of insider trading (the costly signal) and show
that abnormal accruals are more persistent when accompanied by insider buying. Jaggi and
Tsui (2007) show document positive association between earnings management and insider
selling.
Provided that the annual report is published near the end of the first quarter of the
following year, the Author has a wealth of information concerning first quarter performance
by when the annual report comes out (Yuthas et al., 2002). Insiders (the Author and the
Directors) are the only ones with access to this information about the outlook of future
performance and it can be diffused in the LTS to increasing firm transparency or could be
managed to making the firm more opaque.
Referring to signaling theory, we identify (i) the qualitative disclosure in the LTS as
the cheap signal because it is un-regulated and un-audited, leaving room to its misuse with a

9
low risk to be detected and (ii) the insider trading of the Author before the release of the LTS
(which is based on the same set of information available when the LTS is written) as the
costly signal. Because a signal is credible only when it is costly, we argue that insider trading
represents the Author sincere view about the firm. When a signal is not costly, in order to
become credible, the signal should be transmitted through a reliable communication channel,
but this is not the case for qualitative disclosure. Qualitative disclosure is neither audited nor
revised by third parts, and this implies that there is not an assurance that a reliable
communication channel is set. We argue that insiders might be using qualitative disclosure
(the cheap signal) to offer a bias view of the firm outlook and that the Author engages in
ethical discourse with shareholders when the view shown in the LTS through qualitative
disclosure is aligned with how she operates over firm shares. If there is not coherence
between the two signals, then we can sustain that the cheap signal (qualitative disclosure) is
not aligned with the costly signal (insider trading). This would suggest that the Author is not
engaging in ethical discourse with shareholders because she is trying to divert the perception
of market participants about the firm.
For these reasons, we contend that the Author is involved in activity aimed to cheat
investors: (i) if, before the release of the LTS, her insider trading activity is not aligned with
the qualitative disclosure in the LTS; and (ii) if, after the release of the LTS, her insider
trading is not associated with the qualitative disclosure in the LTS. Our hypothesis is as
follows:
H1: Qualitative disclosure in the LTS is made up to misleading when:

10
H1a: Before the release of the LTS, the insider trading activity of the Author is
not aligned with the message sent through qualitative disclosure;
and
H1b: After the release of the LTS, the insider trading activity of the Author is
not associated with the message sent through qualitative disclosure.
3. RESEARCH STRATEGY
Sample selection
Our study is based on 253 LTS from 78 unique firms listed on the Milan Stock
Exchange over the years 2008 - 2010. This setting is reasonable for our purposes because of
ownership concentration and insider domination of the boards in Italian listed firms.
CONSOB (2013) reports that the largest shareholder owns on average 46.8% of the shares
whilst the other relevant shareholders own about 16.6%. Families are the ultimate controlling
agent for the 60% of Italian listed companies (26% of market capitalization) while the State
controls the 8.9% of listed companies (41.7% of market capitalization). Italy is one of the
countries with the highest levels of private benefit of control (Dyck and Zingales, 2004), and
this situation does not ameliorate in the last years since corporate governance reforms still
have not had significant effects. Directors typically represent the dominant shareholders, and
dominant stakeholders are paying little attention to the interests of minority shareholders
(Barker, 2010). The level of monitoring is also weak: a survey fielded by Spencer Stuart
(2011) reports that, in 2010, even in the thirty-eight larges Italian listed firms, independent
directors are not in the majority among board members. The same survey reports that, in the
11
US and the UK, the percentage of independent directors is 84 percent and 94 percent,
respectively.
One issue of single-country studies is the generalizability of the results. Italy
represents a good setting for several reasons. First, litigation costs and investor protection are
lower in Italy than in other countries (LaPorta et al., 1999), so insiders can use other
mechanisms different from insider trading to extract rents. Long-term family ties, that
characterize most of the Italian firms, reduce the room for speculative insider trading since
they are expected to look at long-term shareholder value (see among others Berrone et al.,
2010). Since Italian listed firms are mostly family controlled, executives are less exposed to
the risk to be fired when firms do not perform well (Gómez-Mejía et al., 2003). As a
consequence, the incentives of an Author to engage in misleading disclosure tend to be lower
in Italy than in other countries. All these elements reduce the incentives of misleading
disclosure and of insider trading. If we find evidence of misleading disclosure in such a
setting, we contend that these results might be extended to other settings where the incentives
are higher.
Firms included in the analysis met four requirements: (i) firms should be listed on the
Milano Stock Exchange in 2008 - 2010; (ii) firms have prepared a formally addressed
communication to shareholders with the explicit reference Letter to Shareholders; (iii) the
LTS is signed by a single person; (iv) insider trading, financial and governance data is
available. Sample selection is described in Table 1.
INSERT TABLE 1 ABOUT HERE

12
Measurement of qualitative disclosure
As qualitative disclosure, we consider the tone of disclosure because it is considered
an impression management technique (Brennan et al., 2009). Merkl-Davies and Brennan,
2007). It consists of positive (rather than neutral or negative) language, keywords, and
statements to convey a positive view of performance (Brennan and Merkl-Davies, 2011;
Garcia-Osma and Guillarmon Saorin, 2011). We measure disclosure tone through a manual
coding in order to obtain a full understanding of the meaning of the information. We coded
keywords that had positive or negative connotations: a phrase is relevant if it contains a
keyword that had either a positive or a negative tone. The tone is determined on the basis of
the phrase meaning: the phrase containing “decrease of loss” is classified as positive, although
each word alone would be associated to a negative sentiment.
To address the issue of coding reliability, we started defining a coding procedure and
ran a pilot test to a sub-sample of fourteen LTS chosen to include firms of different size and
industry. The results of the pilot test were compared; misalignments identified and solved by
revising the coding rules. Then we conducted another round of test resulting in more than
95% of agreement that suggests reliable coding procedure.
Our measure of disclosure tone is labeled OPT and computed as follows:
OPTt=PositivePhrases
t
TotalPhrasest
We also considered the use of pessimistic tone, calculated as follows:

13
PESSt=NegativePhrases
t
TotalPhrasest
Then, we determined the net optimism by subtracting the pessimistic tone from the optimistic
tone:
(5)
Measurement of insider trading
We have obtained the ownership and governance data (i.e. board composition and
board functioning) from the CONSOB (Italian Financial Market Regulator). Information
about the biography of the Author is drawn from the Annual Report to which the LTS refers.
We have obtained the raw data about insider trading using the Factset data-base that reports
the share trading activity of each company. Then we have matched this data with the share
trade activity conducted by the Author and the Directors to find out the exact amount of
insider trading. We have also checked for insider trading conducted by the Author and
Directors through their family members (spouse and relatives) and through firms they directly
control in order to find out whether they were involved in insider trading in an indirect way.
We consider a firm as “under the direct control” of an insider when she explicitly is a
controlling shareholder or an executive director.
Following prior research (Beneish et al., 2012; Beneish and Vargus, 2002) we
construct a person-firm-specific measure of insider trading (the Absolute Net Shares Traded -
ANST) that is the percentage change of the trading activity normalized by shares outstanding
to control for cross-sectional variation in the level of shares outstanding:
NETOPTt=OPT
t-PESS
t

14
(6)
where:
NOSH the number of shares outstanding at the beginning of the period.
As an indicator of insider trading we also calculate the percentage change of the
trading activity by dividing the trading activity by share outstanding owned by the insiders on
the beginning of the period (the Relative Net Shares Traded - RNST):
(7)
where: I_NOSH the number of shares outstanding owned by insiders at the beginning of the period.
Our research design focuses on firm’s share trading made by the Author and the
Directors before and after the release of the LTS. Consequently, we define the following
variables:
ANST_au_1q
Absolute Net Share Trading by the Author of the LTS before the release of the LTS
RNST_au_1q Relative Net Share Trading by the Author of the LTS before the release of the LTS
ANST_au_2q Absolute Net Share Trading by the Author of the LTS after the release of the LTS
RNST_au_2q Relative Net Share Trading by the Author of the LTS after the release of the LTS
ANST_dir_1q Absolute Net Share Trading by Directors before the release of the LTS
RNST_dir_1q Relative Net Share Trading by Directors before the release of the LTS
ANST_dir_2q Absolute Net Share Trading by Directors after the release of the LTS
RNST_dir_2q Relative Net Share Trading by Directors after the release of the LTS
Research design
We focus on the Author studying the relationship between her insider trading and
qualitative disclosure to disentangle whether qualitative disclosure, measured as the disclosure
ANST =Sharepurchased
NOSH-å
Sharesold
NOSHå
RNST =Sharepurchased
I_NOSH-å
Sharesold
I_NOSHå

15
tone, is made to inform or mislead investors. We expect that if insider trading, conducted
before when the cheap signal becomes public, is aligned with disclosure tone then qualitative
disclosure is conducted to truthfully inform investors. When disclosure tone represents the
rational expectations of the managers, it should be associated with a buy/hold position of the
insiders, while a low level of optimism should be associated with a sell position. We contend
that if the Author has a positive (negative) outlook about firm performance, then disclosure
tone should be optimistic (pessimistic) and the Author is expected to buy (sell) shares. The
Author should use an optimistic tone when she buys shares, and a pessimistic tone when she
sells shares. When this is the case, we can sustain that the Author engages in ethical discourse
with investors. On the contrary, when the coherence between disclosure and insider trading
does not exist, signalling theory suggests that the cheap signal is not credible while the costly
is. Therefore, the qualitative disclosure seems to be unfounded. We also argue that Author
aims to cheat investors when an unfounded qualitative disclosure is not associated with
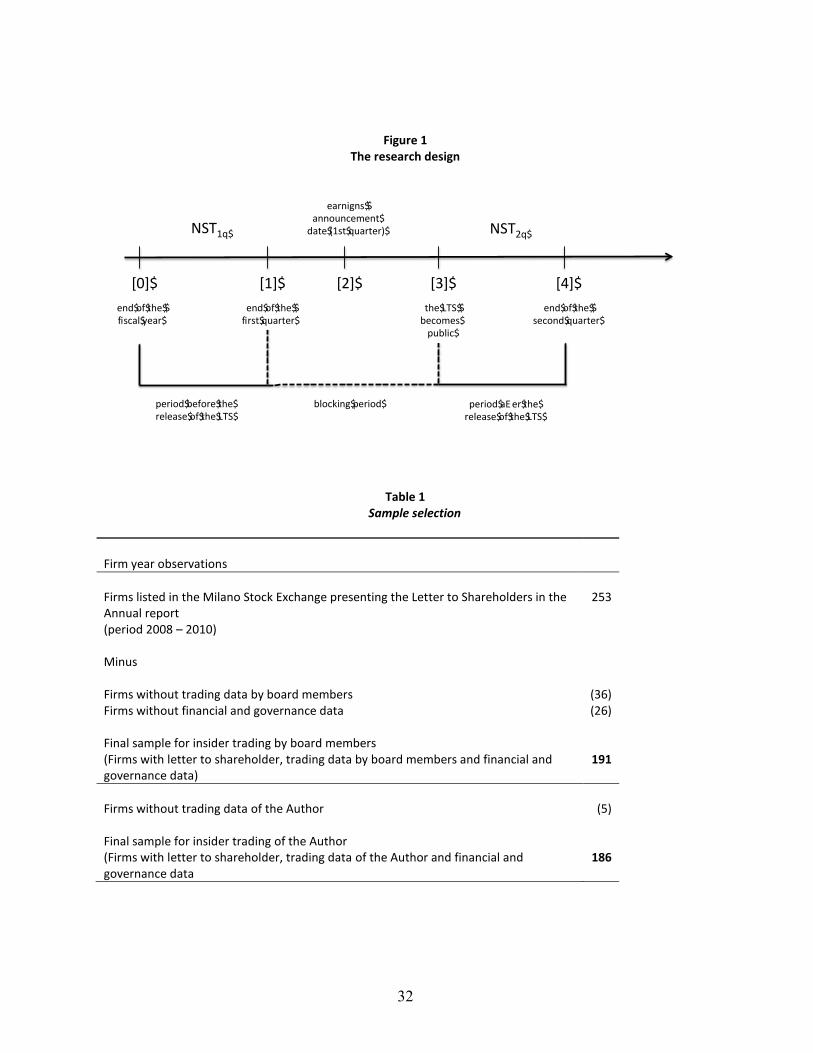
insider trading activity when this disclosure has been already made public. Figure 1 presents
our research design.
INSERT FIGURE 1 ABOUT HERE
The LTS becomes public in [3], few days before the Shareholder Annual General
Meeting when the Annual Report is made available in the corporate website. A sound
research design should consider the insider trading by the Author between a starting date [1]
and [3] for the period before the release of the LTS; and between [3] and a final date [4] for

16
the period after the release of the LTS. This research design is theoretically correct but not
fully applicable. The existing Italian regulation on financial markets establishes a period of
time (blocking period) before the release of quarterly or annual financial statements during
which all persons (and their relatives) having access to private information are not allowed to
sell or buy firm shares (the only exception is for the exercise of stock options). The time
window of the blocking period varies from 15 days before the publication of quarterly data to
30 days for the Annual Report and it is defined in the internal dealing procedure of each listed
company. Moreover, the date in which the Annual Report (that includes the LTS) is uploaded
in the corporate website is not available making impossible to know exactly when the
blocking period starts. Listed companies set the date of the shareholder annual general
meeting in [3] around four months after the end of the fiscal year. If we consider the days
before the availability of the LTS to the public (three weeks as requested by the Italian law)
and the blocking period usually set between 15 and 30 days, insiders cannot operate on
trading firm shares since 36 – 51 days before the date of the shareholder annual general
meeting. It means that a reasonable proxy for the final date of the trading period is three
months after the end of the fiscal year. For these reasons, the first quarter ([0] – [1]) is the
time-window in which we consider the insider trading before the release of the LTS. For the
similar reason, we consider the second quarter ([3] – [4]) as the time-window to consider
insider trading after the release of the LTS since in the period ([1] – [3]) insiders are not
allowed to operate (blocking period).
Data Analysis

17
In our main analyses, we estimate two panel data regression models1: one considering
the insider trading before the release of the LTS (Equation [1]) and the other after the release
of the LTS (Equation [2]).
Equation [1]
NETOPT = b0+b
1INS_TR
1q+b
2shareh+b
3ros+b
4ear _man+b
5lbsize+b
6indper+
b7d _ceo+b
8a_meet+ b
9b_meet +b
10age+b
11skill +b
12locks+b
13lcomp+
b14delta_prof +e
Equation [2]
NETOPT = b0+b
1INS_TR
2q+b
2aut_ shareh+b
3ros+b
4ear _man+b
5lbsize+b
6indper +
b7d _ceo+b
8a_meet+ b
9b_meet +b
10age+b
11skill +b
12locks+b
13lcomp+
b14delta_prof +e
where:
NETOPT Qualitative disclosure: Net-optimistic tone in the LTS;
INS_TRt Insider trading during period t;
aut_shareh Ownership: dummy equal to 1 if the Author is one of the controlling shareholders ; 0
otherwise;
ros Profitability: Return on Sales (in case of financial institutions, replaced by intermediation
margin) of the same fiscal year of the LTS;
ear_man Earnings management: abnormal working capital accruals (DeFond and Park, 2001);
lb_size Board size: logarithm of the number of directors;
ind_per Board independence board: percentage of independent directors on the board;
d_ceo CEO duality: dummy equal to 1 if the board chairperson is also the CEO, 0 otherwise;
a_meet Intensity of the board monitoring: number of board meetings;
b_meet intensity of the audit committee monitoring: number of audit committee meetings;
age Reputation: age of the Author;
skill Experience: dummy equal to 1 if the Author holds an MBA, a legal degree or has
financial expertise;
interlocks Successful Director: number of interlocking directorship of the Author;
lcomp Compensation: natural logarithm of the total cash compensation (salary, performance
bonuses and benefits) of the Author;
1 We do not control for firm size since firm size is strictly correlated with the compensation of the Author and
with the number of interlocking directorships of the Author.

18
delta_prof Future Performance: change in Return on Sales over the first two quarters after the end of
the fiscal year to which the letter refers divided by the share price at the beginning of the
period.
Standard errors of the coefficient estimates are adjusted for panel-level
heteroscedasticity (White’s t-statistic).
Control variables
We include four groups of controls to take into account financial, governance, and future
performance characteristics of the firm, and personal characteristics of the Author. Prior
literature (Merkl-Davies and Brennan, 2007) finds that profitability is associated with
impression management, therefore we control for the profitability of the firm (ros). We
control for the ownership of the controlling shareholder (aut_shareh) because it represents an
incentive to be involved in impression management activity. Firms that have incentives to
engage in earnings management (ear_man) in order to present better financial results might
have similar incentives to engage in impression management to offer a better image of the
firm (Godfrey et al., 2003). There are several measures proposed for capturing earnings
management. We use abnormal working capital accruals (DeFond and Park, 2001) because
prior studies consider it more appropriate than the signed value of earnings management in
tax-oriented reporting regimes as Italy (Prencipe and Bar-Yosef, 2011).
Garcia-Osma and Guillamon-Saorin (2011) document a relationship between impression
management and corporate governance. We control for corporate governance characteristics
that are related to monitoring. We consider board size (lb_size): oversized boards are less

19
efficient than smaller boards in performing their duties (Yermack, 1996); independence of the
board (ind_per): independent directors tend to limit the incidence of fraudulent (Beasley,
1996) and aggressive reporting (Peasnell et al., 2005); CEO duality (d_ceo): when CEO
duality is present it is easier for the CEO to assert control of the board and consequently make
it more difficult for independent directors to monitor and discipline the management (Mather
and Ramsay, 2007); and the intensity of the monitoring activity of the board (b_meet) and
audit committee (a_meet) considering the number of their meetings.
Previous literature provides evidence suggesting that personal characteristics affect firm
accounting and disclosure choices. We control for the age of the Author (age): age is
considered a proxy for the Author’s reputation, as older directors tend to be better known and
reputed than younger directors (Bamber et al., 2010); the degree or expertise in the financial
area (skill): directors with MBAs or financial expertise are more likely to perceive voluntary
disclosure as an opportunity to enhance firm reputation than are those who do not hold these
degrees (Lewis et al., 2014); the number of interlocking positions (interlocks): it reflects
social ties, has a reputation effect, and represents indirect remuneration for a successful
director (Mizruchi,1996); the compensation (lcomp): it is an indication of Author’s worth as a
corporate leader and, by extension, the reputation in the executive job market (Zajac and
Westphal, 1996).
Finally, we consider whether the disclosure tone in the LTS is driven by the expectations
of the Author about short-term future performance and therefore it is not related to the
willingness to mislead the readers. Starting from the assumption that there is not impression
management unless the optimism is unfounded, we should take out the possibility that the

20
optimism sincerely represents the expectations of the Author. It might happen that optimism
is explained by the privately observed incoming performance and not by the performance
reported in the annual report of the closing fiscal year. We should be aware that when the LTS
is written the Author has private information about firm short-term performance since they
have a good outlook about the results of the first semester. For this reason, we use the change
in accounting performance as a control in our regression model (Patelli and Pedrini 2014). By
controlling for future performance, we consider the variability in disclosure tone not
explained by this information available to insiders (delta_prof).
4. RESULTS
Descriptive analysis
Table 2 focuses on the Author and shows descriptive statistics for ownership data
(Panel A), and insider trading (Panel B). Table 2 Panel A shows that the Author owns,
directly or indirectly, the 32.70% of the shares (au_1q), ranging from a minimum of 0% to a
maximum of 75.30%. The corresponding value (v_au_1q) has an average of 276 million
(median 27 million) Euro. Table 2, Panel B shows that the average absolute net share traded
by the Author before the release of the LTS (ANST_au_1q) corresponds to the 0.39% of the
shares and ranges from a minimum of -0.20% (the Author has sold during the quarter the
0.20% of firm’s shares) to a maximum of 5.87% (the Author has bought during the quarter the
5.87% of firm’s shares). The relative variation of shares owned by the Author before the
release of the LTS (RNST_au_1q) ranges -2.19% to a maximum of 209% (the average value
is 3.49%) where a negative (positive) value means that the Author has sold (bought) more

21
shares than those bought (sold). This percentage change is weakly different from 0
(directional t-test RNST_au_1q > 0; p-value = 0.09).
INSERT TABLE 2 ABOUT HERE
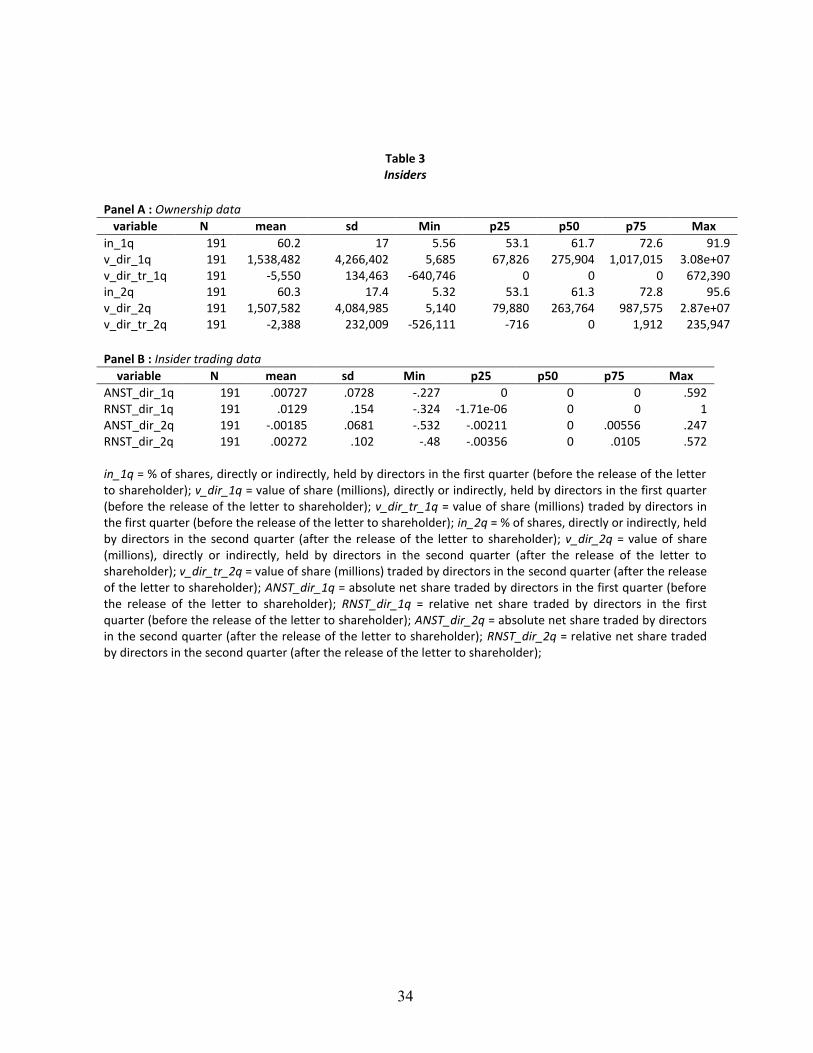
Table 3 focuses on Directors (board members other than the Author) and shows
descriptive statistics for ownership data for Directors (Panel A), for insider trading in the
period after and before the release of the LTS (Panel B). Table 3, Panel A shows that
Directors own, directly or indirectly, the 60.20% of the shares (in_1q), ranging from a
minimum of 5.56% to a maximum of 91.90%. The corresponding value (v_dir_1q) ranges
from a minimum of 5.6 million Euro to a maximum of 30,800 million Euro, with an average
value of 1,538 million Euro (median 275 million). Table 2, Panel B shows that the average
absolute net share traded by Directors before the release of the LTS (ANST_dir_1q)
corresponds to the 0.6% of the shares and ranges from a minimum of -22.70% (Directors have
sold during the quarter the 23% of firm’s shares) to a maximum of 59.20% (Directors have
bought during the quarter the 59% of firm’s shares). The relative variation of shares owned by
Directors before the release of the LTS (RNST_dir_1q) ranges from -32.40% to a maximum
of 100% (the average value is 1.29%): a negative (positive) value means that Directors have
sold (bought) more shares than those bought (sold). This change is not statistically different
from 0 (non-directional t-test RNST_dir_1q = 0; p-value = 0.37). The average value of trading
activity by Directors (Table 3: Panel A v_dir_tr_1q) corresponds to a net sell of 5.55 million
Euro.

22
INSERT TABLE 3 ABOUT HERE
Table 4 Panel A shows descriptive statistics for disclosure tone. On average, the LTSs
contain about 9 sentences with an optimistic tone (opt) and only 3 sentences with a
pessimistic tone resulting in a net optimism of an average value of 6.49. Table 4 Panel B
presents descriptive statistics for the control variables.
[INSERT TABLE 4 ABOUT HERE]
Multivariate analysis2
Table 5 presents the results of multivariate regressions before and after the release of
the LTS for the Author. Models [1] and [2] show a strong negative association between
insider trading of the Author before the release of the LTS and the net optimism in the LTS.
On the one side, this negative association means that if the Author has already sold shares
before the release of the LTS, then a more optimistic LTS (high NETOPT) is likely to be
written (low RNST_au_1q or ANST_au_1q). On the other side, this result suggests that when
the Author has already bought shares before the release the LTS (high RNST_au_1q or
ANST_au_1q), a more pessimistic LTS (low NETOPT) is likely to be written. This negative
relationships hold after controlling for the monitoring activity conducted by the board or by
2 All of our regression models are estimated using years and industry fixed effects and with robust standard errors clustered
by firm and year. To avoid the effect of extreme value we winsorize our observations at 99%.

23
dedicated board committees, earnings management, actual results and unexpected optimism in
the LTS due to future performance.
The negative relationship observed for the Author reveals that insider trading is not
coherent with qualitative disclosure. Specifically, a sell of firm shares by the Author, before
the private information about the future outlook of the firm becomes public, appears to
suggest that she expects that future outlook will be not positive in the future. At the same time
the Author emphases the LTS with an optimistic writing suggesting the opposite. Because
insider trading is a more costly signal about the expectations over the future than writing the
un-audited LTS, we have significant evidence that such a non-coherent behavior might reveal
the presence of impression management in the LTS. The negative relationship between insider
trading and disclosure tone also exists when Authors bought firm shares before the release of
the LTS and use a pessimistic tone in the LTS. The costly signal of insider trading represents
the Author expectations that the firm will perform better in the future, while the cheap
disclosure shows a pessimistic tone about the outlook of the firm, suggesting the opposite.
The use of a less optimistic tone when the Author has previously bought firm shares suggests
that she knows that past performance was negative and she would not be able to make it look
better in the LTS. Why do not Authors align the cheap signal with the more costly signal
insider trading in this case? One possible explanation is in the monitoring activity conducted
by independent board members. Even if the monitoring activity in Italian listed firms tends to
be low, regression models in Table 5 show that the level of net optimism in the LTS is
negatively associated with the presence of independent directors in the board (Ind_per) and
with the intensity of monitoring activity by the audit committee (a_meet). Therefore being

24
forced to use a pessimistic tone, the Author uses insider trading to send a signal to outside
market participants as the insider trading can smooth the negative consequence of the tone
Author is forced to use in the LTS.
Models [3] and [4] do not show any significant association between insider trading of
the Author after the release of the LTS and the net optimism in the LTS. This result reflects
that the Author does not consider what she has previously written in the LTS and bases her
trading activity on information other than qualitative disclosure.
[INSERT TABLE 5 ABOUT HERE]
Table 6 presents the results of multivariate regressions before and after the release of
the LTS for Directors. Models [1] and [2] do not evidence any statistical significant
association between insider trading of Directors and net optimism in the LTS. The non-
statistical significance of this association might reflect that they have no control on the
content and the tone of the LTS, thus none of the two behaviors can be put in place for board
member before the release of the LTS. When we focus on the period after the release of the
LTS, Models [3] and [4] show a statistical significant association between firm’s share trading
by Directors and the level of net optimism in the LTS. This negative association means that
Directors sell shares (low RNST_dir_2q or ANST_dir_2q) after a release of a more optimistic
letter (high NETOPT) or, on the other side, insiders are more likely to buy shares (high
RNST_dir_2q or ANST_dir_2q) when the LTS has a less optimistic tone (low NETOPT). As
in the previous analyses, this relationships hold also controlling for the monitoring activity

25
conducted by the board or by dedicated board committees, earnings management practices,
actual results and for unexpected optimism in the LTS due to future performance. Therefore
we can sustain that, after the release of the LTS, insider trading by Directors in not aligned
with the disclosure tone of the LTS but with insider trading by the Author of the LTS during
the period before the release of the LTS. For insiders, the costly signal of insider trading
dominates the cheap signal of the LTS.
[INSERT TABLE 6 ABOUT HERE]
5. ROBUSTNESS TESTS3
We conduct some tests to check for the robustness of our results. First we use an
alternative measure for qualitative disclosure. Following Garcia-Osma and Guillamon-Saorin
(2011), we argue that Author may manipulate qualitative disclosure in three ways other than
disclosure tone by: (i) emphasizing positive information (emphasis); (ii) repeating positive
information in the LTS (repetition); and (iii) reinforcing positive information (reinforcement).
We develop other measures for qualitative disclosure considering the emphasis dimension (we
classify information contained only in the phrases of the first two paragraphs of the LTS), the
repetition dimension (we calculate the weighted optimism and weighted net optimism
weighting more the same information if it is repeated throughout the LTS), and the
reinforcement dimension (we calculate the weighted optimism and weighted net optimism
considering any qualifier - such as superlatives, adjectives and/or adverbs - added to a
3 Results of the robustness tests are available from the Authors upon request.

26
relevant keyword to emphasize / reinforce its connotation such as very positive, big success,
significant increase). We replicate our regression analyses using different measures for
qualitative disclosure and the main relationship between disclosure and insider trading was
not affected. Finally, instead of using Panel regression models, we run OLS regression model
with time dummies and standard errors clustered at the firm level. Results are substantially
unchanged.
6. DISCUSSION AND CONCLUSIONS
Existing literature extensively investigates if narrative un-verifiable disclosure
(qualitative disclosure) provides incremental information or increases the opacity to investors.
Empirical studies consistently provide evidence that qualitative disclosure is perceived useful
by market participants as it has a significant effect in analyst forecast revision and on share
prices. But these results leave unanswered the question whether managers come up with
qualitative disclosure to inform or mislead investors. To deal with this issue, it is necessary a
research design able to disentangle whether qualitative disclosure truthfully represents the
expectations about the outlook of the disclosing firm that managers or directors have.
Grounding on signaling theory, we consider two different signals coming from the same
person: the first signal is costly (insider trading) while the second signal is a cheap talk
(qualitative disclosure). We conduct our analysis in an empirical setting where it is clearly
identifiable the link between qualitative disclosure and the single person and where the cheap
talk is “really cheap”. Our results suggest that even when incentives to being involved in

27
insider trading are low and when narrative un-verifiable disclosure is a cheap talk, the persons
responsible for the disclosure use qualitative disclosure to mislead investors and not to offer
incremental information, irrespective on how this disclosure is considered by market
participants.
If we consider the results of regression models, we have evidence that LTS with
higher (lower) net optimistic tone are more likely to be written when the Author is selling
(buying) firm shares. Authors are sending two signals with different content: in the first case
(buying shares and low net optimism) the costly signal implies that the Author is expecting
better future outlook because she is buying shares while the cheap public signal shows that
she is not in a position to be optimistic in the LTS. Because disclosure tone is positively
related to past performance and negatively related to the monitoring activity by independent
and board committee (audit committee), we explain this not coherent behavior with the
impossibility to be optimistic due to pat results and the monitoring activity. Therefore being
forced to use a pessimistic tone, the Author uses insider trading to send a signal to outside
market participants as insider trading can smooth the negative consequence of the not
optimistic tone that the Author is forced to use in the LTS. In the second case (selling shares
and high net optimism) the costly signal implies that the Author is expecting a worsening in
the future outlook because she is selling shares while the cheap signal she wants to offer to
investors a good image of the firm. This second behavior presents an ethical issue since the
Author is using the public signal to cheat investors sending a message not-related with her
truthfully expectations about the future. The results of the insider trading of the Author after
the release of the LTS strengthen these results since insider trading is no more associated with

28
the content of the LTS and therefore with the information became public. We also find the
Directors (board members other than Author and her family members) are involved in insider
trading in a way different from the Author. Before the release of the LTS, we find that insider
trading of Directors is not associated with the disclosure tone in the LTS, showing that they
do not follow the insider trading of the Author. The results for the period after the release of
the LTS are more interesting since our models show that Directors do not make insider
trading following the disclosure in the LTS but the replicate the insider trading that Authors
had put in place before the release of the LTS. Directors follow the costly instead of the cheap
signal of the Author.
Our results raise significant concerns about the informative role of the qualitative
disclosure in the LTS and, therefore, about the role of the LTS inside the reporting package of
a firm. Existing results also question the informativeness of qualitative disclosure since it is
found not coherent with the costly signal sent from the same person having the same set of
information.
29
References Baginski, S., Hassell J., Hillison, W. (2000). “Voluntary causal disclosures: Tendencies and capital market
reaction”, Review of Quantitative Accounting and Finance 15:4, 371-389.
Baginski, S., Demers, E., Wang, C., Yu, J. (2012). “Understanding the Role of Language in Management Forecast Press Releases”, Working Paper.
Bamber, L.S., Jiang, J., Wang, I.Y. (2010). “What’s my style? The influence of top managers on voluntary corporate financial disclosure”, The Accounting Review 85:4, 1131-1162.
Barker, R.M. (2010), Corporate governance, competition, and political parties, Oxford UP, Oxford
Beasley, M. (1996). “An empirical analysis of the relation between the board of director composition and financial statement fraud”, The Accounting Review 71:2, 443–466.
Beneish, M, Press, E., Vargus, M. (2012). “Insider Trading and Earnings Management in Distressed Firms”, Contemporary Accounting Research 29:1, 191–220.
Beneish, M. D., Vargus, M. (2002). “Insider trading, earnings quality, and accrual mispricing”, The Accounting Review 77:4, 755–91.
Berrone, P., Cruz, C., Gomez-Mejia, L., Larraza-Kintana, M. (2010). “Socioemotional wealth and corporate responses to institutional pressures: Do family-controlled firms pollute less?”, Administrative Science Quarterly 55, 82-113
Brennan, N.M., Guillamon-Saorin, E., Pierce, A. (2009). “Impression management: Developing and illustrating a scheme of analysis for narrative disclosures – A methodological note”, Accounting, Auditing & Accountability Journal 22:5, 789–832.
Brennan, N.M., Merkl-Davies, D.M. (2011). “A conceptual framework of impression management: new insights from psychology, sociology and critical perspectives”, Accounting and Business Research 41:5, 415-437.
Clatworthy, M., Jones, M. (2001). “The effect of thematic structure on the variability of annual report reliability”, Accounting, Auditing and Accountability Journal, 14:3, 311–326.
CONSOB (2013), 2013 Report on Corporate Governance of Italian Listed Companies, 18 November, Rome
Davis, A. K., Ge, W., Matsumoto, D., & Zhang, J. L. (2014), “The effect of manager-specific optimism on the tone of earnings conference calls”, Review of Accounting Studies, 1-35.
Davis, A. K., Piger, J., and Sedor, L. (2012), “Beyond the numbers: measuring the information content of earnings press release language”, Contemporary Accounting Research 20:10, 1–24.
Davis, A., Tama Sweet, I. (2012), “Managers’ use of language across alternative disclosure outlets: earnings press releases versus MD&A”, Contemporary Accounting Research 29(3), 804–837.
DeFond, M.L., Park, C.W. (2001). “The reversal of abnormal accruals and the Market valuation of Earnings surprises”, The Accounting Review 76:3, 375-404.
Dyck, A., Zingales, L. (2004). “Private benefits of control: An international comparison”, Journal of Finance, 59, 537-600.
Feldman, R., Suresh, G., Joshua, L., Benjamin, S. (2010). “Management’s tone change, post earnings announcement drift and accruals”. Review of Accounting Studies 15, 915-953.

30
Filatotchev, I., Bishop, K. (2002). “Board composition, share ownership and ‘underpricing’ of U.K. IPO firms”, Strategic Management Journal 23, 941-955.
Garcia Osma, B., Guillamon-Saorin, E. (2011), “Corporate governance and impression management in annual results press releases”, Accounting, Organizations and Society, 1-22.
Godfrey, J., Mather, P., Ramsay, A. (2003). “Earnings and Impression Management in Financial Reports: the case of CEO change”, Abacus 39:1, 95 – 123.
Gomez-Mejia, L.R., Larraza-Kintana, M., Makri, M. (2003). “The determinants of executive compensation in family-controlled public corporations”, Academy of Management Journal 46 (2), 226-237.
Jaggi, B., Tsui, J. (2007). “Insider Trading, Earnings Management and Corporate Governance: Empirical Evidence Based on Hong Kong Firms”, Journal of International Financial Management and Accounting 18:3 2007.
Kohut, G.F., Segars, A.H. (1992). “The president’s letter to stockholders: an examination of corporate communication strategy”, Journal of Business Communication 29:1), 7-21.
Kravet, T., Muslu, V. (2013). “Textual risk disclosures and investors’ risk perceptions”, Review of Accounting Studies 18, 1088–1122
LaPorta, R., Lopez-de-Silanes, F., Shleifer, A. (1999). “Corporate ownership around the world”, The Journal of Finance, 54:2, 471-517
Larcker, D. F. Zakolyukina, A. A. (2012). “Detecting Deceptive Discussions in Conference Calls”, Journal of Accounting Research 50: 495–540.
Leland, H. , Pyle, D. (1977). “Informational asymmetries, financial structure, and financial intermediation”, Journal of Finance 32, 371-388.
Lewis, B.W., Walls, J.L., Dowell, W.S. (2014). “Difference in degrees: Ceo characteristics and firm environmental disclosure”, Strategic Management Journal, 35: 5, 712–722.
Li, F. (2010). “The Information Content of Forward-Looking Statements in Corporate Filings: A Naive Bayesian Machine Learning Approach”, Journal of Accounting Research 48:5, 1049– 1102.
Mather, P., Ramsay. A. (2007). “Do Board Characteristics Influence Impression Management through Graph Selectivity Around CEO Changes?”, Australian Accounting Review 17:42, 84-95.
Merkl-Davies, D., Brennan, N. (2007). “Discretionary disclosure strategies in corporate narratives: Incremental information or impression management?”, Journal of Accounting Literature 26, 116–194.
Mizruchi, M.S., (1996). “What interlocks do? An analysis, critique and assessment of research on interlocking directorates”, Annual Review of Sociology 22, 271-298.
Patelli, L., Pedrini, M. (2014). “Is the Optimism in CEO’s Letters to Shareholders Sincere? Impression Management Versus Communicative Action During the Economic Crisis”, Journal of Business Ethics, 124-19-34.
Peasnell, K.V., Pope, P.F., Young, S. (2005). “Board monitoring and earnings management: Do outside directors influence abnormal accruals?”, Journal of Business Finance and Accounting 32, 1311–1346.
Prencipe, A., Bar-Yosef, S. (2011). “Corporate Governance and Earnings Management in Family-Controlled Companies”, Journal of Accounting, Auditing and Finance 26:2, 199-227
Ramanna, K., Watts, R. L. (2012). “Evidence on the use of unverifiable estimates in required goodwill impairment”, Review of Accounting Studies 17:4, 749-780

31
Schleicher, T., Walker, M. (2010). “Bias in the tone of forward-looking narratives”, Accounting and Business Research 40:4, 371-390
Smith, M., Taffler, R. (1995). “The incremental effect of narrative accounting information in corporate annual reports”, Journal of Business Finance & Accounting 22:8, 1195–1210
Smith, M., Taffler, R.J. (2000). “The chairman's statement: A content analysis of discretionary narrative disclosures”, Accounting, Auditing & Accountability Journal 13:5, 624-646.
Spence, M. (1973). “Job Market Signalling”, Quarterly Journal of Economics 87, 355–374.
Spencer Stuart (2011), Spencer Stuart board index, http://www.spencerstuart.com//global
Yermack, D. (1996). “Higher market valuation of companies with a small board of directors”, Journal of Financial Economics 40:2, 185-211.
Yuthas, K., Rogers, R., Dillard, J.F. (2002). “Communicative Action and Corporate Annual Reports”, Journal of Business Ethics 41: 141–157.
Zajac, E.J., Westphal, J.D. (1996). “Director Reputation, CEO board power, and the dynamics of board interlocks”, Administrative Science Quarterly 41, 507-529.
Zhang, Y, Wiersema, M. (2009), “Stock market reaction to CEO certification: the signalling role of CEO background”, Strategic Management Journal 30, 693 - 710
32
Figure 1 The research design
Table 1 Sample selection
[0]$
end$of$the$$fiscal$year$
[1]$ [2]$
earnigns$$announcement$date$(1st$quarter)$
[3]$ [4]$
end$of$the$$second$quarter$
end$of$the$$first$quarter$
the$LTS$$becomes$public$
blocking$period$
NST1q$ NST2q$
period$before$the$release$of$the$LTS$
period$aEer$the$release$of$the$LTS$
Firm year observations
Firms listed in the Milano Stock Exchange presenting the Letter to Shareholders in the Annual report (period 2008 – 2010)
253
Minus
Firms without trading data by board members (36) Firms without financial and governance data (26) Final sample for insider trading by board members (Firms with letter to shareholder, trading data by board members and financial and governance data)
191
Firms without trading data of the Author (5) Final sample for insider trading of the Author (Firms with letter to shareholder, trading data of the Author and financial and governance data
186

33
Table 2 Authors
Panel A : Ownership data
variable N mean sd Min p25 p50 p75 Max
au_1q 186 32.7 29.8 0 .0219 43 60.3 75.3 v_au_1q 186 276,397 776,943 0 856 27,117 219,855 6,291,338 v_au_tr_1q 186 4,157 52,860 -21,888 0 0 0 32,884 au_2q 186 32.8 29.8 0 .0219 43 61.3 75.3 v_au_2q 186 278,285 765,664 0 769 28,374 229,176 6,342,934 v_au_tr_2q 186 244 2,590 -5,183 0 0 0 10,764
Panel B : Insider trading data
variable N mean sd Min p25 p50 p75 Max
ANST_au_1q 186 .00386 .0438 -.00204 0 0 0 .0587 RNST_au_1q 186 .0349 .362 -.0219 0 0 0 2.09 ANST_au_2q 186 .000534 .00482 -.0101 0 0 0 .0338 RNST_au_2q 186 .000609 .0139 -.0292 0 0 0 .0515
au_1q = % of shares, directly or indirectly, held by authors in the first quarter (before the release of the letter to shareholder); v_au_1q = value of shares (000), directly or indirectly, held by authors in the first quarter (before the release of the letter to shareholder); v_au_tr_1q = value of share (000) traded by authors in the first quarter (before the release of the letter to shareholder); au_2q = % of shares, directly or indirectly, held by authors in the second quarter (after the release of the letter to shareholder); v_au_2q = value of shares (000), directly or indirectly, held by authors in the second quarter (after the release of the letter to shareholder); v_au_tr_2q = value of share (000) traded by authors in the second quarter (after the release of the letter to shareholder); ANST_au_1q = absolute net share traded by authors in the first quarter (before the release of the letter to shareholder); RNST_au_1q = relative net share traded by authors in the first quarter (before the release of the letter to shareholder); ANST_au_2q = absolute net share traded by authors in the second quarter (after the release of the letter to shareholder); RNST_au_2q = relative net share traded by authors in the second quarter (after the release of the letter to shareholder).
34
Table 3 Insiders
Panel A : Ownership data
variable N mean sd Min p25 p50 p75 Max
in_1q 191 60.2 17 5.56 53.1 61.7 72.6 91.9 v_dir_1q 191 1,538,482 4,266,402 5,685 67,826 275,904 1,017,015 3.08e+07 v_dir_tr_1q 191 -5,550 134,463 -640,746 0 0 0 672,390 in_2q 191 60.3 17.4 5.32 53.1 61.3 72.8 95.6 v_dir_2q 191 1,507,582 4,084,985 5,140 79,880 263,764 987,575 2.87e+07 v_dir_tr_2q 191 -2,388 232,009 -526,111 -716 0 1,912 235,947
Panel B : Insider trading data
variable N mean sd Min p25 p50 p75 Max
ANST_dir_1q 191 .00727 .0728 -.227 0 0 0 .592 RNST_dir_1q 191 .0129 .154 -.324 -1.71e-06 0 0 1 ANST_dir_2q 191 -.00185 .0681 -.532 -.00211 0 .00556 .247 RNST_dir_2q 191 .00272 .102 -.48 -.00356 0 .0105 .572 in_1q = % of shares, directly or indirectly, held by directors in the first quarter (before the release of the letter to shareholder); v_dir_1q = value of share (millions), directly or indirectly, held by directors in the first quarter (before the release of the letter to shareholder); v_dir_tr_1q = value of share (millions) traded by directors in the first quarter (before the release of the letter to shareholder); in_2q = % of shares, directly or indirectly, held by directors in the second quarter (after the release of the letter to shareholder); v_dir_2q = value of share (millions), directly or indirectly, held by directors in the second quarter (after the release of the letter to shareholder); v_dir_tr_2q = value of share (millions) traded by directors in the second quarter (after the release of the letter to shareholder); ANST_dir_1q = absolute net share traded by directors in the first quarter (before the release of the letter to shareholder); RNST_dir_1q = relative net share traded by directors in the first quarter (before the release of the letter to shareholder); ANST_dir_2q = absolute net share traded by directors in the second quarter (after the release of the letter to shareholder); RNST_dir_2q = relative net share traded by directors in the second quarter (after the release of the letter to shareholder);

35
Table 4
Disclosure and control variables Panel A : Disclosure variables
variable N mean sd Min p25 p50 p75 Max
opt 191 9.25 6.5 0 5 8 11 34 netopt 191 6.49 6.67 -9 2 6 9 33
Panel B : Control variables
variable N mean sd Min p25 p50 p75 Max
aut_shareh 191 .581 .495 0 0 1 1 1 ros 191 -.0415 1.01 -7.85 .0195 .0793 .128 .546 ear_man 191 .118 1.2 -1.65 -.0282 .00705 .0436 9.53 lb_size 191 2.39 .3 1.61 2.2 2.3 2.64 3.09 ind_per 191 .424 .163 .111 .3 .429 .545 .889 d_ceo 191 .277 .449 0 0 0 1 1 a_meet 191 5.88 3.54 0 4 5 8 20 b_meet 191 9.08 3.3 2.48 7 9 11 20 age 191 59.2 8.81 38 53 61 66 78 skill 191 .304 .461 0 0 0 1 1 interlocks 191 1.21 1.67 0 0 1 2 8 lcomp 191 6.53 1.08 3.95 5.69 6.71 7.29 8.69 delta_prof 191 3.42 41.9 -3.4 -.335 -.0399 .146 61.9
opt = ratio between the total number of sentences with optimistic tone and total sentences of the letter to shareholder; netopt = total number of sentences with optimistic tone on the total sentences in the letter to shareholder minus the total number of sentences with pessimistic tone on the total sentences in the letter to shareholder; aut_shareh = 1 when the author is one of the controlling shareholders, 0 otherwise; ros = return on sale (in case of financial institutions, replaced by intermediation margin) of the same fiscal year of the letter to shareholder; ear_man = earnings management (abnormal working capital accruals); lb_size = logarithm of the number of directors; ind_per = % of independent directors on the board; d_ceo = 1 when the board chairperson is also the CEO, 0 otherwise; a_meet = number of board meeting; b_meet = number of audit committee meetings; age = age of the author; skill = 1 when the author holds an MBA, a legal degree or has financial expertise; interlocks = number of interlocking directorship of the author; lcomp = natural logarithm of the total cash compensation (salary, performance bonuses and benefits) of the author; delta_prof = change in return on sale over the first two quarters after the end of the fiscal years to which the letter refers divided by the share price at the beginning of the period.

36
Table 5 Regression Results: insider trading of the Author
NET OPTIMISM
Model [1] Model [2] Model [3] Model [4]
ANST_au_1q -10.54*** [0.001]
RNST_au_1q -1.052** [0.014]
ANST_au_2q -27.07 [0.651] RNST_au_2q 20.20 [0.227]
aut_shareh -3.240** -3.228** -3.262** -3.297** [0.018] [0.018] [0.016] [0.015]
ros 1.416*** 1.441*** 1.444*** 1.464*** [0.000] [0.000] [0.000] [0.000]
ear_man 0.727** 0.755*** 0.746*** 0.775*** [0.010] [0.007] [0.006] [0.003]
lb_size -2.506 -2.569 -2.789 -2.711 [0.260] [0.246] [0.205] [0.219]
ind_per -5.813** -5.733** -5.387** -5.538** [0.024] [0.026] [0.034] [0.030]
d_ceo 1.436 1.421 1.600 1.438 [0.252] [0.256] [0.227] [0.274]
a_meet -0.603*** -0.608*** 0.643*** 0.649*** [0.002] [0.002] [0.001] [0.001]
b_meet 0.143 0.141 0.113 0.109 [0.490] [0.502] [0.585] [0.597]
age 0.0368 0.0372 0.0382 0.0419 [0.564] [0.562] [0.550] [0.511]
skill -0.051 -0.0238 -0.162 -0.0899 [0.967] [0.985] [0.893] [0.940]
interlocks 0.442 0.431 0.403 0.389 [0.274] [0.286] [0.297] [0.317]
lcomp 1.233*** 1.232*** 1.222*** 1.229*** [0.009] [0.009] [0.010] [0.010]
delta_prof -0.0003 -0.0005 -0.0003 -0.0009 [0.870] [0.827] [0.890] [0.664]
constant 1.037 1.115 1.577 1.227 [0.883] [0.876] [0.825] [0.862]
Observations 186 186 186 186 Wald chi(2) 255.14 174.24 39.36 39.38 p-value 0.000 9.52e-30 0.000320 0.000318
p-values in brackets * p < 0.10, ** p < 0.05, *** p < 0.01 Year dummy = YES Net optimism = total number of sentences with optimistic tone on the total sentences in the letter to shareholder minus the total number of sentences with pessimistic tone on the total sentences in the letter to shareholder; ANST_au_1q = absolute net share traded by authors in the first quarter (before the release of the letter to shareholder); RNST_au_1q = relative net share traded by authors in the first quarter (before the release of the letter to shareholder); ANST_au_2q = absolute net share traded by authors in the second quarter (after the release of the letter to shareholder); RNST_au_2q = relative net share traded by authors in the second quarter (after the release of the letter to shareholder); aut_shareh = 1 when the author is one of the controlling shareholders, 0 otherwise; ros = return on sale (in case of financial institutions, replaced by intermediation margin) of the same fiscal year of the letter to shareholder; ear_man = earnings management (abnormal working capital accruals); lb_size = logarithm of the number of directors; ind_per = % of independent directors on the board; d_ceo = 1 when the board chairperson is also the CEO, 0 otherwise; a_meet = number of board meeting;

37
b_meet = number of audit committee meetings; age = age of the author; skill = 1 when the author holds an MBA, a legal degree or has financial expertise; interlocks = number of interlocking directorship of the author; lcomp = natural logarithm of the total cash compensation (salary, performance bonuses and benefits) of the author; delta_prof = change in return on sale over the first two quarters after the end of the fiscal years to which the letter refers divided by the share price at the beginning of the period.

38
Table 6
Regression Results: insider trading of Directors
NET OPTIMISM
Model [1] Model [2] Model [3] Model [4]
ANST_dir_1q 0.147 [0.982]
RNST_dir_1q 1.322 [0.573]
ANST_dir_2q -12.71** [0.013] RNST_dir_2q -7.478** [0.017]
aut_shareh -3.044** -3.118** -3.147** -3.115** [0.027] [0.023] [0.019] [0.019]
ros 1.290*** 1.300*** 2.393*** 1.911*** [0.007] [0.008] [0.003] [0.002]
ear_man 0.654** 0.661** 1.667*** 1.196*** [0.042] [0.043] [0.009] [0.007]
lb_size -2.105 -2.132 -2.238 -2.112 [0.313] [0.307] [0.271] [0.294]
ind_per -5.277** -5.371** -4.996* -4.874* [0.049] [0.046] [0.060] [0.067]
d_ceo 1.667 1.624 1.310 1.472 [0.190] [0.193] [0.280] [0.223]
a_meet 0.557*** 0.557*** 0.551*** 0.539*** [0.007] [0.006] [0.005] [0.007]
b_meet 0.0910 0.0879 0.0840 0.0999 [0.664] [0.672] [0.687] [0.631]
age 0.0370 0.0327 0.0166 0.0267 [0.557] [0.609] [0.793] [0.668]
skill 0.553 0.569 0.596 0.613 [0.635] [0.626] [0.600] [0.585]
interlocks 0.293 0.291 0.356 0.301 [0.416] [0.402] [0.271] [0.365]
lcomp 1.010** 1.055** 0.883* 0.890* [0.050] [0.038] [0.075] [0.069]
delta_prof -0.000312 -0.000465 -0.000594 -0.000133 [0.888] [0.828] [0.799] [0.962]
constant 1.657 1.793 3.974 2.988 [0.818] [0.804] [0.579] [0.671]
Observations 191 191 191 191 Wald Chi2 30.92 30.18 32.74 33.52 p-value 0.00569 0.00721 0.00314 0.00242
p-values in brackets * p < 0.10, ** p < 0.05, *** p < 0.01 Year dummy = YES Net optimism = total number of sentences with optimistic tone on the total sentences in the letter to shareholder minus the total number of sentences with pessimistic tone on the total sentences in the letter to shareholder; ANST_dir_1q = absolute net share traded by directors in the first quarter (before the release of the letter to shareholder); RNST_dir_1q = relative net share traded by directors in the first quarter (before the release of the letter to shareholder); ANST_dir_2q = absolute net share traded by directors in the second quarter (after the release of the letter to shareholder); RNST_dir_2q = relative net share traded by directors in the second quarter (after the release of the letter to shareholder); aut_shareh = 1 when the author is one of the controlling shareholders, 0 otherwise; ros = return on sale (in case of financial institutions, replaced by intermediation margin) of the same fiscal year of the letter to shareholder; ear_man = earnings

39
management (abnormal working capital accruals); lb_size = logarithm of the number of directors; ind_per = % of independent directors on the board; d_ceo = 1 when the board chairperson is also the CEO, 0 otherwise; a_meet = number of board meeting; b_meet = number of audit committee meetings; age = age of the author; skill = 1 when the author holds an MBA, a legal degree or has financial expertise; interlocks = number of interlocking directorship of the author; lcomp = natural logarithm of the total cash compensation (salary, performance bonuses and benefits) of the author; delta_prof = change in return on sale over the first two quarters after the end of the fiscal years to which the letter refers divided by the share price at the beginning of the period.

Recent RBF Working papers published in this Series
Fourth Quarter | 2014
14-012 Declan French and Donal McKillop: Financial Literacy and Over-Indebtedness
in Low-Income Households.
Third Quarter | 2014
14-011 Walter Briec and Laurence Lasselle: On Farrell Technical Efficiencies in
Simple Solow Models - A Luenberger-type Approach.
14-010 Philip Molyneux, Linh H. Nguyen and Xiaoxiang Zhang: Executive
Compensation, Board Independence and Bank Efficiency in China: The Effects of the
Financial Crisis.
Second Quarter | 2014
14-009 Maya Clayton, José Liñares-Zegarra and John O. S. Wilson: Can Debt Affect
Your Health? Cross Country Evidence on the Debt-Health Nexus.
14-008 Charles M. Kahn and José M. Liñares-Zegarra: Identity Theft and Consumer
Payment Choice: Does Security Really Matter?
14-007 John K. Ashton and Andros Gregoriou: The Role of Implicit Costs and Product
Quality in Determining the Customer Costs of Using Personal Current Accounts.
14-006 John Goddard, Hong Liu and John O.S. Wilson: Entry, Exit and Growth of US
Commercial Banks.
The Centre for Responsible Banking and
Finance
RBF Working Paper Series
School of Management, University of St Andrews
The Gateway, North Haugh,
St Andrews, Fife,
KY16 9RJ.
Scotland, United Kingdom
http://www.st-andrews.ac.uk/business/rbf/