working party on climate, investment and development
TRANSCRIPT

Unclassified ENV/EPOC/WPCID(2012)3 Organisation de Coopération et de Développement Économiques Organisation for Economic Co-operation and Development 06-Jul-2012 ___________________________________________________________________________________________
English - Or. English ENVIRONMENT DIRECTORATE ENVIRONMENT POLICY COMMITTEE
Working Party on Climate, Investment and Development
MOBILISING PRIVATE INVESTMENT IN LOW-CARBON, CLIMATE-RESILIENT INFRASTRUCTURE
This paper is planned as one in a series of analytical working papers exploring low-carbon, climate-resilient development, green finance and infrastructure; it relates to the project originally outlined in COM-DAF-INV-ENV-EPOC(2011)2. It provides an in-depth review of key trends and technical issues that support the proposed elements of the green investment policy framework, as outlined in the accompanying document: COM-DAF-INV-ENV-EPOC(2011)4/REV1). It is authored by Christopher Kennedy and Jan Corfee-Morlot (OECD Environment Directorate Staff). Following a round of comment from WPCID delegates, OECD and external experts, the paper will be revised and issued as an OECD working paper. WPCID delegates are invited to provide comments by 31 July 2012. Comments should be posted to WPCID clearspace.
Any further questions can be directed to Jan Corfee-Morlot ([email protected]).
JT03324569
Complete document available on OLIS in its original format This document and any map included herein are without prejudice to the status of or sovereignty over any territory, to the delimitation of international frontiers and boundaries and to the name of any territory, city or area.
ENV
/EPOC
/WPC
ID(2012)3
Unclassified
English - O
r. English

ENV/EPOC/WPCID(2012)3
2
ACKNOWLEDGEMENTS
The authors would like to acknowledge comments received on earlier drafts from Fiona Stewart (OECD-DAF), Virginie Marchal, Elisa Lanzi and Marie-Christine Tremblay (OECD–ENV), Ian Hawkesworth (OECD-GOV) and Ceclia Tam (IEA).
ENV/EPOC/WPCID(2012)3
3
TABLE OF CONTENTS
EXECUTIVE SUMMARY ............................................................................................................................ 6
Low-Carbon, Climate-Resilient Infrastructure ............................................................................................ 6 Risks to Private Sector Investment in LCR Infrastructure .......................................................................... 7 Financing LCR Infrastructure in Low to High Income Countries ............................................................... 8 Governance and Public-Private Partnerships .............................................................................................. 9
CHAPTER 1. INTRODUCTION ............................................................................................................ 10
1.1 Objective......................................................................................................................................... 10 1.2 Context for Private Investment in LCR Infrastructure ................................................................... 11 1.3 Planning and Design of Low-Carbon, Climate-Resilient Infrastructure ........................................ 15 1.4 Interdependencies Between Infrastructure Systems ....................................................................... 17 1.5 Synergies and Differences between Adaptation and Mitigation .................................................... 20
CHAPTER 2. PAST PERFORMANCE AND FUTURE NEEDS FOR LCR INFRASTRUCTURE ..... 21
2.1 Trends in Gross Fixed Capital Formation, OECD.......................................................................... 23 2.2 Analysis of Low-carbon Growth in Gross Fixed Capital Formation.............................................. 27 2.3 Infrastructure Needs ....................................................................................................................... 33
CHAPTER 3. INFRASTRUCTURE RISK AND FINANCE ................................................................. 40 3.1 Risks of Investing in LCR Infrastructure ..................................................................................... 41 3.2 Financing Mechanisms in High and Low Income Countries. ........................................................ 46 3.3 Green Bonds ................................................................................................................................... 48 3.4 Institutional Investors ..................................................................................................................... 49 3.5 Summary: Tipping the Playing Field Towards LCR Infrastructure Investment ...................... 51
CHAPTER 4. GOVERNANCE FOR ACHIEVING LCR INFRASTRUCTURE .................................. 52
4.1 Towards a Green Investment Policy Framework ........................................................................... 52 4.2 Greening Public Private Partnerships ............................................................................................. 53
CHAPTER 5. CONCLUSIONS ............................................................................................................... 64
BIBLIOGRAPHY ......................................................................................................................................... 65

ENV/EPOC/WPCID(2012)3
4
APPENDIX 1. DEFINING LOW-CARBON, CLIMATE-RESILIENT INFRASTRUCTURE SYSTEMS ...................................................................................................................................................................... 70
APPENDIX 2. OECD PRINCIPLES FOR PRIVATE SECTOR PARTICIPATION IN INFRASTRUCTURE ................................................................................................................................... 76
APPENDIX 3. DEFINITIONS OF GROSS FIXED CAPITAL FORMATION ...................................... 79
APPENDIX 4. ESTIMATES OF FUTURE INFRASTRUCTURE COSTS ............................................. 81
APPENDIX 5. POLICIES FOR ENCOURAGING PENSION FUNDS TO INVEST IN INFRASTRUCTURE ................................................................................................................................... 83
APPENDIX 6. OECD RECOMMENDATIONS FOR PUBLIC GOVERNANCE OF PPPS .................. 85
Tables
Table 1.1 The public / private nature of infrastructure service and main business models in five example sectors (based on OECD, 2007) .......................................................................................... 14
Table 1.2. Illustrative matrix of interdependencies among infrastructures ............................................ 18 Table 2.1 Comparative annual global infrastructure investments under business-as-usual and
low-carbon scenarios, 2015 to 2020 (USD Bn/ yr) ............................................................. 34 Table 2.2 Annual global cost of adapting to climate change in a limited number of sectors ................ 36 Table 2.3 Top 20 cities ranked in terms of assets exposed to coastal flooding in the 2070s
(including both climate change and socioeconomic change) and showing present-day exposure .............................................................................................................................. 37
Table 3.1 Factors used to establish debt ratings for infrastructure project finance ............................... 42 Table 3.2 Differences in the Maturity of Financial Sector Development in Low, Middle and
High Income Countries ....................................................................................................... 46 Table 3.3 Financial mechanisms for increasing investment in the water sector ................................... 47 Table 3.4. Barriers to Pension fund investment in infrastructure ........................................................... 50 Table 4.1. Checklist for LCR investment policy framework and interface with investors .................... 53 Table 4.2 Objectives of Public-Private Partnerships ............................................................................. 58 Table 4.3 PPP projects in developing countries, 1990-2007, including projects cancelled or
under stress .......................................................................................................................... 60 Table 4.4 Global Loans to project finance (USD million) .................................................................... 62 Table A1.1. Life-cycle greenhouse gas emissions from power supply infrastructure ............................ 70 Table A1.2. Broad classification of high, medium and low-carbon buildings based on energy use and
GHG intensity of external energy supply ............................................................................ 71 Table A1.3. Broad classification of high, medium and low-carbon passenger transportation
systems based on life-cycle GHG emissions per passenger kilometre (PKT) .................... 71 Table A1.4. Broad classification of high, medium and low-carbon freight transportation systems based
on tonne-kilometres-travelled (TKT) .................................................................................. 72 Table A1.5 Life-cycle greenhouse gas emissions from waste disposal practices .................................. 72 Table A4.1. Estimated average annual world infrastructure expenditure (additions and renewal) ......... 81 Table A4.2. Estimated average annual global expenditures for strategic transport infrastructure,
2009-30, in USD Bn ............................................................................................................ 81 Table A4.3. Estimated average annual global expenditures under a 6 degrees-C climate change
scenario, 2010-50, in USD Bn ............................................................................................ 81 Table A4.4. Estimated average annual global expenditures required to limit climate change to 2
degrees-C, 2010-50, in USD Bn .......................................................................................... 82 Table A5.1 Policies for Encouraging Pension Funds to Invest in Infrastructure ................................... 83

ENV/EPOC/WPCID(2012)3
5
Figures
Figure 1.1 The challenge of attracting private investment in low-carbon climate resilient infrastructure ...................................................................................................... 12
Figure 1.2 Interdependencies between infrastructure systems with focus on relationships for encouraging private investment in low-carbon infrastructure .......................................... 19
Figure 1.3 Examples of positive and negative interactions between adaptation and mitigation strategies ........................................................................................................................... 20
Figure 2.1 OECD gross fixed capital formation (USD million US 2005 constant PPP). ................... 23 Figure 2.2 Relative measures of gross fixed capital formation, by government, and total, ............... 24 Figure 2.3 General government gross fixed capital formation (GFCF) ............................................. 25 Figure 2.4 Changes in the components of OECD gross fixed capital formation 1980 to 2010 ......... 26 Figure 2.5 US gross fixed capital formation, 1980 to 2010 (USD million US 2005) ........................ 26 Figure 2.6 Low-carbon Growth Analysis of Gross Fixed Capital Formation, Residential
Buildings Sector, .............................................................................................................. 28 Figure 2.7 Changes in Residential GHG Emissions and Gross Fixed Capital Formation for
Sweden, 1990-2009 .......................................................................................................... 29 Figure 2.8 Low-carbon Growth Analysis of Gross Fixed Capital Formation, Transport Sector,
1997 to 2007 ..................................................................................................................... 30 Figure 2.9 Changes in Transport GHG Emissions and Gross Fixed Capital Formation for
Germany, 1990-2009. ....................................................................................................... 31 Figure 2.10 Low-carbon Growth Analysis of Gross Fixed Capital Formation, Power & Industry
Sectors, and 1997 to 2007 ................................................................................................. 32 Figure 2.11 Changes in Power and Industry GHG Emissions and Gross Fixed Capital Formation
for Denmark, 1990-2009 .................................................................................................. 33 Figure 2.12 Interdependence of Infrastructure Systems in Virtuous Cycles of Low-carbon Growth .. 39 Figure 3.1 Global Assets under management in 2010 (USD trillion US) .......................................... 41 Figure 3.2 Ranking of risks inherent in climate change finance based on roundtable hosted by
Standard & Poor’s ............................................................................................................ 44 Figure 3.3 Average severity and probability of climate change financing risks ................................ 45 Figure 4.1 Global PPP Market Volume by Region, 2009 -2011 ........................................................ 63
Boxes
Box 1. Infrastructure and Economic Growth ........................................................................................... 12 Box 2. UK Clean Energy Policy: Restructuring Government, Markets and Investment ......................... 15 Box 3. Components of Gross Fixed Capital Formation: Example of Canada, Year 2000 ....................... 22 Box 4. Risks in Securing Climate Change Finance .................................................................................. 45 Box 5. Definition of Public Private Partnerships ..................................................................................... 54 Box 6. Public-Private Partnerships and LCR investments ....................................................................... 54 Box 7. China’s Experience with Public–private partnerships for metropolitan subways ........................ 60
ENV/EPOC/WPCID(2012)3
6
EXECUTIVE SUMMARY
1. This is the second paper in a series of OECD working papers on mobilising private investment in low-carbon, climate-resilient (LCR) infrastructure. The first paper Towards a Green Investment Policy Framework: the Case of Low-Carbon, Climate-Resilient (LCR) Infrastructure integrates best-practices in climate and investment policies to propose a comprehensive framework for boosting LCR investment. In the third paper, the proposed policy framework is applied to the transportation sector, examining how private-sector participation can be scaled up.
2. The current paper builds upon the first by going into more depth on key issues for encouraging greater private sector investment in LCR infrastructure. The objective is to identify and assess tangible actions that governments can pursue to engage the private sector, both in developed and developing country contexts. The content broadly covers issues of infrastructure development, finance, governance and environment, with particular focus on key topics, such as strategic infrastructure planning, financial mechanisms, investment risks and public-private-partnerships (PPPs). Drawing upon previous OECD work such as Principles for Private Sector Participation in Infrastructure, and Recommendations for Public Governance of PPPs, amongst others, the paper addresses the following six questions:
1. What is low-carbon climate-resilient infrastructure?
2. What progress have OECD countries made in decarbonising capital investment?
3. What are the future global demands for LCR infrastructure?
4. What risks does the private sector face when investing in LCR infrastructure?
5. What financing mechanisms for LCR infrastructure are available in low to high income countries?
6. What direct role can governments take in mobilising private sector LCR investment through public-private-partnerships?
Low-Carbon, Climate-Resilient Infrastructure
3. The development of LCR infrastructure entails constructing, or renovating, infrastructure systems (power, road, rail, water, buildings, etc.) to substantially reduce global GHG emissions, while simultaneously making these systems, and the societies they serve, more adaptable to extreme weather conditions and rising sea levels. The need to invest in infrastructure that is both low-carbon and climate-resilient comes at a time when government budgets, the traditional sources of infrastructure funding, are under significant pressure, yet infrastructure investment is important for stimulating economies and growing jobs. Governments face the challenge of enacting policies and leveraging public spending to both: i) attract private capital to invest in infrastructure; and ii) ensure that the infrastructure is consistent with a green and climate-resilient economy. To enable LCR growth, governments can develop comprehensive strategic infrastructure plans, strongly coupled with national climate change goals. Long-term

ENV/EPOC/WPCID(2012)3
7
infrastructure planning recognises: i) that interdependency between different infrastructure systems can have impacts on overall resilience, with no one infrastructure system being more fundamental than any of the others; ii) there are opportunities to simultaneously address both climate change adaptation and mitigation in infrastructure planning and design.
Decarbonisation of Capital Formation in OECD Countries
4. Analysis shows the performance of OECD countries in reducing GHG emissions corresponding to three categories of gross fixed capital formation (GFCF): dwellings, transportation vehicles, and other machinery and equipment (which broadly corresponds to emissions from power generation and industry). GFCF is the net value of acquisitions of fixed assets in an economy; it is counted as part of gross domestic product (GDP) under the expenditure approach. The analysis shows percentage changes in GHG emissions and GFCF over a ten year period from 1997 to 2007; it provides an assessment of performance in the greening of capital stock, but without showing causation. Over half of the OECD countries analysed achieve full decoupling of emissions from growth in the dwellings sector, with Sweden and Iceland as stand-out performers. A further five countries reduced their residential GHG emissions, but with declining capital investment. Only two countries, Germany and Japan, achieve full decoupling of emissions from capital investment in the transportation vehicles sector; all countries except one had growth in GFCF. All 25 countries assessed experience growth in GFCF in other machinery and equipment, but only nine did so with a reduction in GHG emissions from power and industry sources. The nine nations achieving green growth in this sector included both western and eastern European countries.
Global Infrastructure Needs
5. Future global infrastructure needs under low-carbon (2 deg C) and business-as–usual (6 deg C) global warming scenarios are assessed, based on estimates from the OECD’s Infrastructure 2030 studies and the IEA’s 2012 Energy Technology Perspectives. The greatest incremental costs of low-carbon development occur in the buildings and transportation vehicles sectors, where much of the costs would be borne by the private sector. Additional investment is required to green the power sector, but the costs could be offset by reduced investment in roads, airports, and oil & natural infrastructure under low-carbon growth. Projected demands for rail infrastructure investment could be higher due to switching of freight from road vehicles, but lower due to decreasing demands for transporting large quantities of coal. Port infrastructure investment is expected to increase, but under low-carbon growth this might support increased global trade in components of low-carbon transport, building, energy and industrial products, with a decreased demand for the shipping of coal and oil. Although cost estimates are incomplete, the technical interdependency and financial tradeoffs between infrastructure systems suggests the potential to generate virtuous cycles of low-carbon growth. Most central to this growth are three interactions: i) increased generation of low-carbon electricity technically enables greening of buildings and transportation vehicles; ii) decreased demand for oil and natural gas reduces the capital requirements for new infrastructure in these sectors; iii) this capital can alternatively be invested in greening of the electricity sector, which decreases demands for coal.
Risks to Private Sector Investment in LCR Infrastructure
6. Climate change poses a double set of additional risks to infrastructure investment: i) heightened environmental risk due to more extreme weather; and ii) financial risk broadly associated with uncertainty in the process of transitioning to low-carbon infrastructure. Government actions that reduce these risks can encourage private investment in LCR infrastructure by improving the risk-return profile of projects.
7. This paper undertakes a ranking of the most significant risks in financing LCR projects based on the results of an expert roundtable conducted by Standard & Poor’s (2010) . Policy (or sovereign) risks are

ENV/EPOC/WPCID(2012)3
8
amongst the highest ranked risks, including longevity risk (rank #1), risks from policy changes (#5 and #8), and risks that rules are not fully binding or difficult to enforce (#9). Three transactional risks are highly ranked: transaction cost risk (#2), economic/price volatility risk (#4), and liquidity risk (#10). Capacity risks are also of concern, including risks from lack of a well-trained workforce (#3), lack of capacity to understand and develop policy (#6), poor supporting infrastructure (#7), and others. Project-level risks, including fraud, technology risk and natural hazards, were of the lowest concern to participants of the roundtable.
Financing LCR Infrastructure in Low to High Income Countries
8. Mechanisms for financing LCR infrastructure significantly differ from high to low income countries. High and upper middle income countries have universal banks, and mature non-bank financial services including government and corporate bonds, market equity, and alternative services such as private equity and venture capital. With fully market based interest rates are and robust risk management there is full access to the long term funding usually required for infrastructure investments. By contrast, low income countries typically have basic banking services, and lack non-bank financial services. The capacity to undertake risk management is weak and the availability of long term funding is limited.
9. Based on OECD’s work on the water sector (OECD, 2010), financing mechanisms that help to increase access to commercial banks, bond finance, project finance and equity finance in developing countries include:
1. Blending commercial grants and repayable financing.
2. Extending the range of potential borrowers via micro-finance.
3. Alleviating affordability constraints with output-based aid.
4. Mitigating risks with guarantees and insurance.
5. Creating grouped financing vehicles to increase access to finance.
6. Increasing lending to sub-sovereigns via innovation.
7. Strengthening the balance sheet via equity injections.
8. Increasing transparency in the sector via credit ratings.
9. Developing “bankable” projects through project preparation facilities.
10. Developing local equity markets.
10. In developed countries, green bonds are an example of a financing mechanism with strong potential for LCR infrastructure, but supportive government policies such as tax-exempt green infrastructure bonds and green standards may be required to grow the market. Institutional investors are a potential source of funds with interests that align well with the long-life spans of infrastructure. Barriers would need to be addressed to encourage institutional investors to invest either directly, or indirectly (e.g. through green bonds) in LCR infrastructure.
ENV/EPOC/WPCID(2012)3
9
Governance and Public-Private Partnerships
11. Amongst the opportunities for governments to encourage private investment in LCR infrastructure is through public private partnerships (PPPs). Given the additional risks and complexity that may occur with some LCR projects, governments may be cautious in procuring infrastructure services through PPP contracts, especially when new technologies are involved. Ideally, the policy to develop LCR infrastructure would come before the choice of the financing mechanism (PPP or otherwise), and attributes of LCR infrastructure would be embodied within infrastructure design codes and standards. The choice of business models (public, private or mixed) for the provision of LCR infrastructure should be driven by efficiency and value for money. Infrastructure often requires public subsidy or other forms of public financial support, and LCR infrastructure may justify more financial support. The tendering and negotiation processes used in PPPs may help governments make more efficient use of public funds, except on smaller projects. As government PPP units have the capacity and skills to effectively manage complex infrastructure projects, they may be the ideal administrative units for managing the delivery of LCR infrastructure.

ENV/EPOC/WPCID(2012)3
10
CHAPTER 1. INTRODUCTION
12. Infrastructure lies at the heart of economies. Buildings, water and waste systems provide the basic services that households and businesses require, while transportation and communications infrastructure link consumers to producers to suppliers, enabling markets to function. Clean, efficient, well-maintained infrastructure supports a high quality of life in OECD countries; and provision of such infrastructure in developing countries is critical to raising living standards.
13. Global emissions of greenhouse gases (GHGs) are also to a large extent dependent on the choice and design of infrastructure systems. In 2009, power generation, building energy use, transportation systems and waste management infrastructure accounted for 74% of net GHG emissions for Annex 1 countries.1 Moreover, these infrastructure systems are generally composed of long-term capital assets, which without re-investment provide lock-in to future emissions paths. Transformation of infrastructure both in OECD and non-OECD countries is necessary to address climate change goals.
14. Decisions on infrastructure investment are also critical for adapting to the continuing changes in climate. New infrastructure built in the coming decades will have to be designed for changes in mean climate conditions (e.g. temperature and precipitation) and to withstand more extreme weather conditions. Some existing infrastructure may have to be adapted, and other infrastructure may be purpose built to protect from flooding of rivers or coastal areas. Infrastructure needs for adaptation to climate change will be particularly high in developing countries where lack of basic infrastructure erodes resilience.
15. The need to invest in infrastructure that is both low-carbon and climate-resilient (LCR) comes at a time when the traditional sources of infrastructure funding, i.e. government budgets, are under significant pressure. This is not just a matter of the current economic malaise. Government spending on gross fixed capital formation in OECD countries fell from 9.5% in 1990, to 8% in the mid-90s to around 7% in 2005, relative to total government outlay (OECD 2007). This is in part due to competing demands from health, education and other social spending, ageing populations and security concerns. Since the 1980s, private investment in infrastructure has grown to somewhat address the infrastructure gap. There is significant private ownership of telecommunications infrastructure, and to a lesser extent power generation and railways (OECD 2007). Some of the funding gap can be addressed through using infrastructure more efficiently, incorporating intelligent technology, demand management and improved planning. Increased private investment is nonetheless essential to achieve the pace of transformation to LCR infrastructure required.
1.1 Objective
16. The objective of this paper is to identify tangible actions that governments can pursue to encourage greater private sector engagement for investment in LCR infrastructure, both in an OECD and non-OECD context. The paper provides a synthesis of work by the OECD and others that addresses relevant aspects of infrastructure development, finance, governance and environment, with particular focus
1 OECD analysis using the UNFCCC database. Net GHG emissions from public electricity and heat production, transport, commercial/institutional, residential and waste are 73.9% of total net emissions, including LULUCF/LUCF.

ENV/EPOC/WPCID(2012)3
11
on key topics, such as strategic infrastructure planning, financial mechanisms, investment risks and public-private-partnerships.
17. The rest of this chapter provides context and depth to the concept of LCR infrastructure. The business and economic context for private investment in LCR infrastructure is briefly presented. LCR infrastructure is then described, recognising both the interdependencies between infrastructure systems, and the potential for infrastructure to offer synergies in climate change adaptation and mitigation. Appendix 1 provides further definition of LCR infrastructure.
18. The next chapter provides an analysis of gross fixed capital formation, reviewing the performance of OECD countries in reducing GHG emissions associated with capital formation in residential, transport and energy/industry sectors. Estimates of future global infrastructure needs are then reviewed, showing interactions between infrastructure systems that are consistent with low-carbon growth.
19. Chapter 3 looks at potential sources and mechanisms for financing LCR infrastructure. Of importance here is understanding the financial risks associated with investing in LCR infrastructure. A ranking of investor risks is developed based on roundtable hosted by Standard and Poor’s. The availability of financing mechanisms significantly differ between low income and high income countries. Several approaches to increase access to finances in developing countries are reviewed, drawing upon OECD work in the water sector. Where markets are suitably developed, green bonds and pension funds have strong potential as an investment mechanism and a source of funds for LCR infrastructure. The closing discussion emphasises that financial incentives are required to encourage investment in LCR infrastructure, as well as policies to reduce investor risks.
20. Chapter 4 considers the broader context of governance for achieving LCR infrastructure, beginning with a review of a policy framework for LCR investment. The greening of public-private-partnerships is discussed, noting the potential for government PPP units to be key administrative centres for managing the transformation to green infrastructure.
1.2 Context for Private Investment in LCR Infrastructure
21. The challenge for governments is to enact policies and leverage public spending to attract more private investment in LCR infrastructure. This involves both: i) attracting private capital to invest in infrastructure; and ii) ensuring that the infrastructure is consistent with a green economy. Meeting this challenge means boosting returns and/or reducing the risks of LCR infrastructure projects not only to meet investors’ expectations, but also to offer better risk-return profile than conventional “brown“ infrastructure investments (Figure 1.1). With the incentive measures in place today, some LCR investments already offer better risk-return profiles than conventional investments. Electricity generation from renewable resources, for example, can be competitive, avoiding risks associated with uncertainty in the future prices of fossil fuel feedstocks. Through supportive government policy, private investment in clean energy infrastructure is estimated at USD 260 billion for 2011 (Bloomberg New Energy Finance). The challenge is scale up this LCR investment across many infrastructure sectors.

ENV/EPOC/WPCID(2012)3
12
Figure 1.1 The challenge of attracting private investment in low-carbon, climate-resilient infrastructure
Note: (Schematic shows how a combination of climate and investment polices may make investment in LCR infrastructure more attractive than conventional ‘brown’ infrastructure).
22. There are several reasons why private investors may be interested in infrastructure as an asset class (OECD, 2011a). Infrastructure assets typically provide steady-returns to long-term investors, provided that initial construction risks are appropriately priced. Infrastructure assets are generally thought to have weak correlation to traditional asset classes, thereby making them attractive for portfolio diversification (although at least one study by Bitsch et al, 2010, has conflicting findings). Also, where revenues from infrastructure assets are contractually adjusted for inflation, they provide a potential hedge against increasing inflation. There are, however, a wide range of different types of infrastructure projects, with varying degrees of risk.
23. Economic arguments for greater private sector ownership of infrastructure are: i) that it increases the financial resources available; and ii) that the public sector often creates conditions contributing to inefficient investment. In some cases public managers may overinvest in order to maintain or strengthen political support. In other cases underinvestment may occur, if long-term benefits are neglected due to short-term fiscal pressures. Political processes can lead to a misallocation of resources to particular regions or sectors, at the expense of others that have potentially higher economic returns. OECD analysis by Sutherland et al (2009) provides some evidence of past over- and underinvestment by the public sector in infrastructure (Box 1).
Box 1. Infrastructure and Economic Growth
Following the works of Aschauer (1989) and Munnel (1992) many studies have shown a positive relationship between public investment in infrastructure and economic growth. Although the relationship is statistically significant, early studies had different findings on the strength of the relationship (the elasticity of output) and lacked explanation of causality. A recent study by Arslanalp et al. (2011) has shown the importance of focussing on the stock of capital, rather than the infrastructure investment rate; the relationship between economic growth and increases in annual capital stock is much stronger than that with infrastructure investment as a percentage of GDP. By including capital stock as a separate growth factor, the model of Sutherland et al.(2009) is also able to show how infrastructure investment compares to other forms of investment, and can identify cases of over or under-investment in infrastructure.
24. Infrastructure investments inherently involve greater social responsibility than in most other areas of private sector investment. Private sector participation in the delivery and operation of infrastructure is

ENV/EPOC/WPCID(2012)3
13
not a panacea. Care must be taken to meet user needs and address broader social and environmental objectives, while ensuring financial sustainability. The existence of network externalties warrants a strong public role, including regulation of monopolies. Given that infrastructure investments are also typically of long duration and often complex, then the public sector needs to be diligent in engaging the private sector. As guidance, Appendix 2 outlines twenty-four Principles for Private Sector Participation in Infrastructure developed by the OECD.
25. The complexity of investment in infrastructure systems is apparent from the often mixed public-private nature of the ownership and services provided and some of the business models that are used (Table 1.1). Depending on the sector, infrastructure services range from having relatively modest public good dimensions (e.g. freight rail) to having strong public good dimensions (e.g. urban public transit). Even when the service provided may be perceived as a private good, e.g. electricity, water or sanitation, issues such as security, equitable social access, and environmental externalities exist. The model of large, vertically-integrated and often monopolistic companies (i.e. the monolith business model) is used in many sectors, whether public or private, with regulation. It is typically strong in terms of vertical co-ordination and long-term planning, but may be more vulnerable to public or regulatory failures, leading to inefficiency and poor asset management. Unbundled or decentralised models are generally less vulnerable to public failure, but co-ordination of activities over the value chain is more difficult in some sectors.
26. Many actors are involved in transforming the infrastructure sector to meet LCR objectives. At one end there has to be demand for LCR infrastructure, whether stemming from consumers, service providers, or government regulation; and these demands have to be translated into suitable revenues. At the opposite end are investors who may require new financial guarantees, or standards to provide confidence that their investments in relatively newer technologies or high risk systems are financially competitive, providing stable income streams. In between is a whole range of planners, designers, project managers, engineers and manufacturers who must have suitable skills and capacities to deploy LCR infrastructure, including the resources for innovation. Governments can have a supporting and enabling role across all of these areas, whether it is through the design of markets and institutions (see for example Box 2), setting targets and standards, or through ensuring that public investments in infrastructure are significantly green.

ENV/EPOC/WPCID(2012)3
14
Table 1.1 The public / private nature of infrastructure services and main business models in five example
sectors (based on OECD, 2007)
Sector Electricity Water Freight Rail Urban mass transit Roads
Public / private nature of services
Generally viewed as a private good, however it is an essential service from a security and social perspective, and often creates negative environmental externalities (e.g. air pollution, GHGs).
Partly a private good, but it has strong public good characteristics (social, health, environmental) justifying extensive public scrutiny at multiple levels of government, especially if competition for water supply between urban and rural users.
A private good in many respects, hence economic considerations often dominate the policy agenda, although the environmental advantage of rail over road transport also important.
Natural local monopolies having a strong “public good” dimension.
Road services do not meet all criteria for private goods; while they are rivalrous, they are not excludable in the business model that prevails in most countries. Road space is allocated to traffic on a first-come, first-served basis, and is free at the point of demand
Main business models
A broad range of models exist including: the monolith or regulated monopoly model; partially regulated monopolies; and the unbundled model with privatised or partially privatised elements.
The public monolith model organised at the local level largely dominates, although private concession models play an important role in some countries
Three main models: i) the public monolith model is still dominant worldwide; ii) the separated model ( introduced in the UK; expanding to the rest of Europe); iii) owner-tenant model prevails in North America
Most systems are run as public monopolies. However, private sector participation occurs in some cases, e.g. for operations, maintenance. and upgrading of infrastructure.
Most roads in the world are owned and operated by the state. However, there is scope for private sector participation as concessionaires of motorways or, in some cases, as owners and operators of private roads

ENV/EPOC/WPCID(2012)3
15
Box 2. UK Clean Energy Policy: Restructuring Government, Markets and Investment
In order to meet its climate change goals, the UK government has recognised the need for fundamental changes. There is a difficult balance to achieve between the risks of not meeting climate change targets versus maintaining the principles of liberalised markets, including delivery of value to consumers. Recent UK policies for resolving this balance have involved reorganisation within government, reform of energy markets, and the formation of a national Green Investment Bank.
The first of these three elements is a bi-partisan agreement to make the on-going carbon budget of the UK (currently to mid 2020s) a legal responsibility of parliament. This is essentially a constitutional amendment. As implemented, a new committee reports to government, informing it as to what the national carbon budget should be. The government then has to come up with a program to meet the carbon budget, or provide good reason on why it should reject the budget, which is hard to do. This agreement has made a strong signal of the UK’s intent to deliver on its climate change targets.
This agreement within government has helped to provide a very clear strategy for the power sector. The UK’s carbon budget led to a roadmap which showed that it was strategically important to get carbon out of the power sector by 2030, in part due to the age of UK power stations. Nonetheless, studies showed that decarbonisation would be impossible under the existing commodity based liberalised power market, which the UK had developed in the mid-1990s. Hence the UK is now in the process of reforming its power market into a long-term contract based market. With its market reforms, the UK expects to establish a portfolio of different power generating facilities, including nuclear, combined capture & storage, and several types of renewable energy to achieve a carbon intensity of around 50 g CO2e / kWh by 2030. Nonetheless, even with the power sector market reforms, analysis suggest that current utility companies will not raise investment on the scale required for 2030. This shortfall will be resolved through the establishment of a Green Investment Bank.
The UK has historically resisted establishing a national development bank since it was first suggested 80 years ago during the Great Depression, but is now planning to establish a Green Investment Bank with £3 billion of equity. The objectives of the Bank will potentially include growing a green bond market, managing risk around off-shore wind, and establishing a domestic energy efficiency market for low interest loans. Beyond just providing low interest loans, the UK is looking to establish much stronger markets for energy efficiency through a new system of “Green Deal” loans tied to consumer energy bills and potentially a feed-in-tariff for energy efficiency. UK electricity market reform will also look to minimise consumer bills by ensuring optimal levels of demand side investment. Though detailed mechanisms have yet to be designed the principles being considered for long-term contracts in the power sector include an equal value principle which optimises the overall system, including demand reduction and infrastructure, rather than just supply. In principle this means that efforts to reduce energy on the demand side should get equal support to those on the supply side. So for example, financial support to off-shore wind should be met with equivalent support for demand reduction, with an active focus on building demand side industries and markets.
Source: Nick Mabey, E3G (presentation at OECD workshop on Catalysing Investment in Low-Carbon, Climate-Resilient Growth, 7 November 2011).
1.3 Planning and Design of Low-Carbon, Climate-Resilient Infrastructure
27. Choice of infrastructure or selected features of infrastructure will affect the GHG emission-intensity of service provision (e.g. water, mobility, shelter, goods exchange, sanitation services) and also the exposure and vulnerability of businesses and people to climate change itself. Physical infrastructure has long operational lifetimes ranging from one decade to several, if not a century in some instances (e.g. buildings, highways). In a context of uncertain but potentially significant climate change impacts, governments and private sector infrastructure asset owners in exposed areas have the opportunity to design robust infrastructure adaptation strategies, in the short term to medium term, to limit damages from increasingly severe extreme weather events, and in the longer term to enhance viability and resilience of infrastructure. To be climate-resilient, such infrastructure will need to be designed to take account of location-specific climate change risks (e.g. increased flood risk or risk of water shortage, thermal water

ENV/EPOC/WPCID(2012)3
16
pollution). Further, some infrastructure may be specifically dedicated to improving climate-resilience, notably including sea-walls, levees and barrages for flood protection; drainage systems designed for extreme rainfall, raised buildings, bridges and other structures capable of handling extreme heat or more frequent and extreme flooding; water capture and storage systems that will withstand drought and deal with increased water stress where this is exacerbated by climate change.
28. The development of LCR infrastructure entails constructing (and re-constructing) buildings, energy, transportation, waste and water systems to substantially reduce global GHG emissions, while simultaneously making these systems, and the societies they serve, more adaptable to extreme weather conditions and rising sea levels. Low-carbon infrastructure is conceived not just as structures built from low-carbon materials, but as the essential physical infrastructure systems that underpin development of a low-carbon society. Examples of low-carbon infrastructure include renewable energy power plants and/or distributed renewable energy systems, waste-to-energy facilities, low-energy buildings, transportation systems supporting low-emission vehicles and modes of transport.
29. As infrastructure assets have long operational lifetimes they are sensitive not only to the climate existing at the time of their construction, but also to climate variations over the decades of their use. A substantial proportion of infrastructure built in the next five years, will still be in use long after 2030. As a result, to increase the resilience of both new and existing infrastructure, planning ahead and managing the impacts of climate change over their lifetimes will be critical.
30. As a result of the long lifetimes of physical infrastructure, choices made today about types of and features of new infrastructure provision or renovation of existing systems, will lock-in emission “commitments” as well as and vulnerability or resilience to climate change in a given location for decades to come. Infrastructure decisions are of course not irreversible, however infrastructure investment typically has high capital expenditure requirements and altering infrastructure post-construction can be difficult and more costly than if it were designed to integrate climate change consideration from the start. Given uncertainty in climate change predictions, it may nevertheless be a cost-effective decision not to “over-invest” to boost resilience into an infrastructure system today, given the uncertainty of certain climatic conditions in the future (e.g. to withstand heavy precipitation events or windstorms). However that decision is better taken on the basis of full information than due to ignorance about predicted climate change for a given location (IFC 2010a,b, IPCC – SREX forthcoming, Hallegatte et al. 2010). Recent studies do nevertheless point to the “self-interest” of the private sector to invest in adaptation (Agrawala et al. 2011). However, this assumes that private actors have sufficient information to make the right decisions and this may often not be the case.
31. In order for both the private sector and public sector to make improved decisions on infrastructure planning and investment in light of climate change, a clearer definition of LCR infrastructure is necessary. A common understanding of LCR infrastructure has several potential applications including a basis for defining eligible assets for green bond certification, or other green investment vehicles, and as an input to agreements on green trade. Appendix 1 provides a series of tables for quantitatively defining low-carbon infrastructure, based on physical units such as emissions per unit of energy generated, or passenger kilometres travelled. Climate-resilient infrastructure is also defined in Appendix 1, using qualitative attributes. These definitions provide a starting point for understanding LCR infrastructure, but there is additional complexity due to the interdependency between infrastructure systems, and contextual factors. Moreover, there can be both synergies and tradeoffs when aiming to develop infrastructure that is both low-carbon and climate-resilient, as discussed further below.

ENV/EPOC/WPCID(2012)3
17
1.4 Interdependencies Between Infrastructure Systems
32. In assessing the resilience of infrastructure to climate-induced or other shocks, the interdependency between infrastructure systems should be recognised. As Table 1.2 illustrates the interdependencies are typically bi-directional. Electricity supply, for example, is clearly a necessary input for telecommunications equipment, for electric trains, and to operate water and wastewater systems, but there are also converse relationships. Telecommunications can be used to establish more efficient electricity infrastructure; railways are used to transport fuels (coal) for electricity generation; and water is also used for cooling in nuclear power plants. No one infrastructure system is more fundamental than any of the others. In emergencies, land transport can be used to carry drinking water to disaster-affected locations, but poor water infrastructure, such as drainage systems, also pose risks to road and rail infrastructure when flooding occurs. Thus, the resilience of infrastructure to climate change is typically dependent on the overall combination of infrastructure systems and their interconnections (Hallegatte et al, 2008, Kirshen et al., 2008, Nelson et al., 2007).
33. Interdependency between infrastructure systems is also important when designing strategies for reducing GHG emissions. Greening of electricity supply, for example, is a useful strategy because it lowers the carbon footprints of buildings, especially when combined with demand side management, and potentially may help to establish electric vehicles as a low-carbon form of transportation. The interdependency of systems also has a bearing on the potential for public sector spending to leverage private sector investment on low-carbon infrastructure (Fig 1.2). For example, electrically powered public transit systems are typically low-carbon, but often require substantial public subsidies both for initial investment and on-going operation, thus making them less financially attractive. Transit infrastructure, however, will typically spur private sector land-development, which governments can influence through greening of building codes, while collecting revenues through land-value capture. An integrated approach in designing infrastructure systems helps enable low-carbon development (Engel Yan et al, 2005).

ENV/EPOC/WPCID(2012)3
18
Table 1.2. Illustrative matrix of interdependencies among infrastructures
Infrastructure Tele-communications
Electricity Land transport Water
Tele-communications
Intelligent electricity networks, including remote metering (better demand management). Greater efficiency in spot and futures markets for electricity. More dispersed electricity consumption patterns.
Telework, teleshopping, videoconferencing, telemedicine – leads in some cases to reduced commuting and other travel. More effective vehicle fleet management. Intelligent highway systems – greater security, less congestion, more sophisticated road network pricing. Faster emergency response to accidents. JIT management and longer supply chains – generating more traffic.
With ICT and sensors – better monitoring and control of pollutants, degraded drainage systems etc., and potential for remote metering (better demand management). Possibly greater vulnerability of installations, requiring back-up and fail-safe mechanisms.
Electricity
Dependence on electricity, vulnerable to outages and voltage fluctuation. Electricity network can be used for transmission of information.
Source of power for trains. Progress in battery technology – greater use of electric and hybrid cars – may mean more charging stations. Wider coverage of household electricity – more dispersed habitat – more travel. Cost factor where road construction crosses underground electricity cables.
Dependence of water and wastewater systems on electricity, vulnerable to power failures. Hydropower plants. More widespread pumping and high-energy treatment of wastewater. Cross-subsidisation between electricity and water – depletion of aquifers and other natural water resources.
Land transport
Increases demand for mobile communications, location-based services, navigation systems, emergency services. May stimulate demand for video conferences. Provides telecoms with right of way to lay communications cable.
Use of trains to transport fuel for energy generation (coal, oil). Modal split in favour of rail results in net increase in use of electricity (consequences for sustainability objectives).
Impact on water infrastructure since this is often built alongside or under major highways. Where transport improves accessibility, new settlements will increase demand for water services. In emergencies, drinking water can be transported to disaster-affected locations.
Water
Extension of water infrastructure to new locations and new housing engenders increased demand for telecommunications.
Extension of water infrastructure to new locations and new housing engenders increased demand for electricity services. Use of waste for energy generation. Required to cool nuclear power plants.
Waterways as alternative to road and rail. Poor water infrastructure poses risks to road and rail infrastructures though flooding, pipe breakages, etc. Cost factor where road construction crosses drainage/ water pipes.
Source: Table 1.2 in OECD, 2006b.

ENV/EPOC/WPCID(2012)3
19
Figure 1.2 Interdependencies between infrastructure systems with focus on relationships for encouraging private investment in low-carbon infrastructure
Water / wastewater infrastructure leads transport infrastructure in urban land development (developed
BUILDINGS
TRANSPORT POWER SUPPLY
ICT
WATER & WASTE
Private sector dominates investment in new buildings
Government has influence over carbon emissions
through building codes and
Public incentives leverage private
investment in building retrofits
Investment in transport infrastructure typically spurs
private sector land development
Public transit systems are typically lower carbon, but often cannot compete with automobiles for
convenience, or level of service. Private sector investment often
requires subsidies.
Greening of electricity supply
lowers carbon footprint of buildings.
Private sector investment in renewables with public
incentives, e.g., FITs
Water-Energy Nexus.
Pumping/ transport of water requires significant energy in
stressed regions.
Electric autos offer large reductions in carbon
emissions (where power sector is green), but initial
subsidies required
Solid waste infrastructure provides low cost GHG reductions
Some private sector funding of water /
wastewater infrastructure
Private sector funding of ICT infrastructure may enable carbon
reductions through demand response and load shedding

ENV/EPOC/WPCID(2012)3
20
1.5 Synergies and Differences between Adaptation and Mitigation
34. Potentially greater economic efficiency can be achieved by designing infrastructure that is simultaneously low-carbon and climate-resilient, but sometimes there may be tradeoffs (Klein et al. 2007, Moser 2012). Some infrastructure strategies for mitigating GHG emissions will also help in adapting to climate change (Fig. 1.3). For example, at the building scale, increased insulation and use of white (or, to a lesser extent, green) roofs may both save energy and make buildings more resilient to extreme temperatures during heat waves, or temporary losses of energy supply.2 Similar synergies may occur for water efficiency measures, water storage, distributed renewable energy supply and multi-modal transportation systems, but with details highly dependent on context. Nonetheless, some adaptation strategies may be undesirable for mitigation, e.g. conventional air conditioning makes buildings liveable in extreme heat, but often with increased emissions. Desalination can be an important source of supply in water scarce regions, increasing their adaptive capacity, but requiring substantial energy consumption. An opposite case is very high urban density, which supports the financial viability of sustainable modes of public transportation, lowering GHG emissions, but generally involves prevalence of impermeable surfaces, greater heat island effects,3 and increased climate change risks through higher concentrations of people in urban areas. This may increase exposure, while also complicating disaster management and evacuation processes in the case of an extreme weather event. Similarly, where competing with scarce water supplies, hydro power can be a positive mitigation measure, but unhelpful towards adaptation.
35. Although such tradeoffs between mitigation and adaptation may be apparent for individual policies, sometimes policies can be combined to achieve win-win strategies. Viguié and Hallegatte (2012) demonstrate, for example, how greenbelt policies, flood zoning and transportation policies can be combined synergistically, even though individually each policy involves trade-offs between adaptation and mitigation.
Figure 1.3 Examples of positive and negative interactions between adaptation and mitigation strategies
2 There are some differing studies on this; see Jacobsen and Hoeve (2011) for example. 3 Where urban paved and built infrastructure absorb and re-radiates heat into the atmosphere, thus increasing the temperature change in urban areas that will be associated with a given global average temperature change. Depending upon the location, urban heat islands can lead to temperatures that are significantly higher than surrounding rural areas (e.g. Stewart 2011; Oke, 1995; Landsberg, 1981).
Adaptation (+)
(increase resilience)
air-conditioning (conventional)
desalination of water
urban greenery building insulation
water efficiency & storage distributed and centralised renewable energy
systems multi-modal transportation
Adaptation (-)
(decrease resilience)
very high urban
population density
hydropower (where competing with scarce water supplies)
Mitigation (-)
(increase GHG)
Mitigation (+)
(decrease GHG)
ENV/EPOC/WPCID(2012)3
21
CHAPTER 2. PAST PERFORMANCE AND FUTURE NEEDS FOR LCR INFRASTRUCTURE
36. This chapter provides an analysis of past contributions of infrastructure to low-carbon growth for OECD countries, and an assessment of future global needs for LCR infrastructure. Assessing the role of infrastructure in low-carbon growth is challenging for several reasons:
1. Infrastructure can be defined in different ways, from narrow to broad, depending on which components of fixed capital are included.
2. Data on investment in each of the many types of the infrastructure is not easily available.
3. Infrastructure systems are interdependent (as discussed in Section 1.4).
4. Typically the use of infrastructure contributes more GHG emissions than the construction of infrastructure. For example, transportation vehicles produce more emissions than the construction of road surfaces. (Hence from a systems perspective, vehicles can be included as part of the infrastructure).
37. As a consequence of these challenges, the methodology in this chapter will focus on assessing the greening of gross fixed capital formation (GFCF) in OECD countries. GFCF is the total value of acquisitions of fixed assets in an economy, less disposals, plus certain additions to the value of non- produced assets (such as subsoil assets) over a time period (see Appendix 3 for a more detailed definition). GFCF is inherently counted as part of gross domestic product (GDP), as calculated using the expenditure approach. The analysis that follows (in Section 2.2) will seek to identify OECD countries in which low-carbon investment has occurred under various categories of GFCF. , This is a simple accounting exercise on the decarbonising of GFCF, without any statistical analysis of the contribution of green capital to GDP. The scatter plots produced will show the progress, or not, of countries in greening their capital stock, but without showing the causation.
38. In a broad sense, infrastructure can include four categories of GFCF:
• Dwellings (all residential properties, as well as associated structures, such as garages, and all permanent fixtures installed in residences)
• Other buildings and structures (all non-residential buildings, plus civil engineering works, such as bridges, tunnels, roads, sewers, ports, etc.)
• Transport equipment (i.e. vehicles such as planes, trains and automobiles)
• Other machinery and equipment (including industrial machinery, electrical machinery, steam generators, computers, office equipment, telecommunications equipment, agricultural machinery and furniture)
39. The only two components of GFCF not included above are cultivated assets, and intangible fixed assets, such as mineral rights and computer software. There are, however, some components within the broad category of ‘Other machinery and equipment’ that would not typically be considered as

ENV/EPOC/WPCID(2012)3
22
infrastructure, such as furniture and office equipment. Box 3 provides a more detailed example of GFCF for Canada in year 2000, but note that only the coarse level data on GFCF is recorded with the OECD, and even then not by all member states.
Box 3. Components of Gross Fixed Capital Formation: Example of Canada, Year 2000
Gross fixed capital formation Private Government Total
millions of dollars
Dwellings 48,842
Value of new housing construction Not given Not given 23,676
Renovations Not given Not given 17,549
Ownership transfer costs Not given Not given 7,617
Other buildings and structures 65,346*
Building (non-residential) 15,528 7,397 22,925
Engineering 34,298 8,123 42,421
Transport equipment 23,289
Automobiles 8,120 144 8,264
Trucks 8,466 257 8,723
Other transportation equipment 6,061 241 6,302
Other machinery and equipment 56,567
Furniture 3,471 550 4,021
Agricultural machinery 3,045 7 3,052
Industrial machinery 20,992 394 21,386
Computers and other office equipment 9,755 2,219 11,974
Telecommunications equipment 7,727 519 8,246
Other machinery and equipment 6,294 1,594 7,888
Intangible fixed assets 12,228*
Software 9,419 2,809 12,228
* Note: Total for Other buildings and structures is recorded as USD 60,313 million in OECD statistics (a difference of -USD 5,033 million). Total for Intangible fixed assets is recorded as USD 17,261 (a difference of + USD 5,033 million).
Source: Adapted from Chapter 9 of Statistics Canada - Catalogue no. 13-017 Guide to the Income and Expenditure Accounts (June 30, 2008).
40. In a narrow sense, only the civil engineered works within the second category of fixed capital might be considered infrastructure. This primarily consists of networked infrastructure such as roads, highways, railways, water and sewage systems, power lines and street lighting, but also including nodal elements such as water treatment plants, airports, marine ports, and dams, as well as bridges and tunnels. Many, but not all, of these civil engineered works have traditionally been seen as essential public infrastructure, often provided by the state. In the context of climate change, however, focus on the civil

ENV/EPOC/WPCID(2012)3
23
engineered works is too narrow, as it leaves out critical interconnected components: transportation vehicles, energy supply equipment, and buildings, to which GHG emissions are more readily related.
41. Power sector infrastructure appears in several categories of GFCF, but the GHG emitting components of this infrastructure will generally be included as in the ‘Other machinery and equipment’ category. This category includes expenditures on nuclear reactors and steam generators at fossil-fuelled power plants. Structural components of power infrastructure such as dams and power lines come under the ‘Other buildings and structures’ category. The ‘Dwellings’ category includes integral components of residential buildings, such as central heating boilers.
2.1 Trends in Gross Fixed Capital Formation, OECD
42. Total GFCF for OECD countries grew from about USD 3 trillion in 1980, and peaked at just over USD 7.8 trillion in 2007 (in 2005 dollars; Figure 2.1). As a percentage of total GDP, GFCF grew from around 18% of total GDP in the early 1980s, reaching 21% in 2006, before falling back to around 18.5% in 2009 and 2010.
Figure 2.1 OECD gross fixed capital formation (USD million US 2005 constant PPP).
Note: Upper line includes total current OECD member states.
43. There is significant variation between OECD countries in the relative size of GFCF (Fig 2.2). As a percentage of GDP, GFCF in 2007 varied between 18.1% in the UK to 36.4% in Estonia, with most countries falling in the range of 20 to 25%. The trend line in Figure 2.2 suggests that countries in which a higher percent of government spending goes on GFCF tend to have higher GFCF relative to total GDP. Again there is considerable variation; a group of countries ranging from Austria, with 2.2% government expenditure on GFCF, to Poland, with 9.9% government expenditure on GFCF, all have similar ratios of GFCF to GDP. Broadly speaking the countries going through economic transition tend to have higher relative levels of GFCF; this would likely apply to emerging economies too.

ENV/EPOC/WPCID(2012)3
24
Figure 2.2 Relative measures of gross fixed capital formation, by government, and total, for a selection of OECD countries in 2007
Note: Government spending on GFCF in national accounts is not included for all countries in OECD statistics.
44. In OECD countries, government spending on GFCF has declined on a relative basis in recent decades. For OECD overall, government GFCF declined from around 4.5% of GDP in 1980 to about 3% of GDP in 2006 (Sutherland et al., 2009). Relative to total government outlays, GFCF declined from 9.5% in 1990 to about 7% in 2005 (Figure 2.3). These statistics reflect a concern that OECD countries may be under investing in core infrastructure. As the example in Box 3 shows, most government expenditure on GFCF tends to be in the category of ‘Other building and structures’, on civil engineered works and non-residential buildings.

ENV/EPOC/WPCID(2012)3
25
Figure 2.3 General government gross fixed capital formation (GFCF) as a percentage of total government expenditure, 1990-2005
Note: 1) Weighted average using government total outlays converted to USD using 2000 purchasing power parities for GDP.
Source: OECD (2006a), Economic Outlook No. 80 database, November, OECD, Paris.
45. In broader terms, the declining role of government in GFCF has been replaced by growing private capital formation, but primarily in machinery and equipment rather than civil engineered infrastructure. From 1980, there has been a doubling of the percentage capital formation in the ‘Other machinery and equipment’ category, which notably includes computers, office equipment, telecommunications equipment and industrial machinery (Figure 2.4). Intangible fixed assets, such as computer software, have grown to be equivalent in size to transport equipment, which has remained steady at around 8% of total GFCF. Relative investment in dwellings has fluctuated, but with a general downward trend from around 30% GFCF in 1980, falling to 22% in 2010. The most substantial drop in share of GFCF is with the non-residential buildings and structures, which declined from close to 45% in the early 1980s down to 28% in 2005, with a small increase since. Overall, the declining role of government in GFCF reflects considerable changes in the type of capital investment that had been made over the past three decades.

ENV/EPOC/WPCID(2012)3
26
Figure 2.4 Changes in the components of OECD gross fixed capital formation 1980 to 2010
46. The quite dramatic change in the composition of GFCF can also be seen from dollar investment values for the United States (Figure 2.5). Investment in other machinery and equipment rose rapidly from 1990, reaching over USD 700 billion by 2006. Investment in intangible fixed assets surpassed transportation equipment in 2001. The rise and fall in residential construction were particularly sharp, while investment in other buildings and structures grew modestly up until 2008, before declining back to a level of the 1980s.
Figure 2.5 US gross fixed capital formation, 1980 to 2010 (USD million US 2005)

ENV/EPOC/WPCID(2012)3
27
2.2 Analysis of Low-carbon Growth in Gross Fixed Capital Formation
47. Mobilising investment in low-carbon infrastructure is critical to achieving green growth.4 Decisions made today on what type of capital to invest in can either lock-in GHG emissions for decades to come, or can help with transitioning to a low-carbon economy. Progress in reducing a country’s GHG emission relative to GDP is one way of assessing low-carbon growth (see for example OECD, 2012a). This section aims to add granularity, by identifying GHG emissions associated with certain components of GDP – specifically those of GFCF.
48. To assess the progress of OECD countries in establishing low-carbon infrastructure, three broad categories of GFCF are considered: dwellings, transport equipment, and other machinery and equipment.5 For each of these categories of capital it is possible to assess relevant GHG emissions from the sector or sectors impacted by the capital investment. The analysis is conducted over a decade, 1997 to 2007, since with the lock-in effect it can take many years to turnaround the GHG emissions profile of a sector.6 Three-year moving averaged data for both GFCF and GHG emissions is used, in order to smooth out annual variations, e.g. due to factors such as extra cold winters, short-term economic fluctuations, election years.
49. Many OECD countries achieved full decoupling of emissions from growth in the residential buildings sector from 1997 to 2007 (Figure 2.6). Over half of the countries for which data was available, recorded reductions in GHG emissions for residential buildings (fuel combustion only, i.e. excluding electricity use), while growing capital investment in the sector over the 10 year period. A further five countries, also reduced their residential GHG emissions, but with declining capital investment (i.e. they achieved the greening, but not the growth in investment).
50. Note that Figure 2.6 does not show causality of changes in GHG emissions. The scatter of results shows that some countries have grown capital formation in green ways, others have done so with increased emissions, and some countries had no capital growth in the sector shown. A statistical relationship between changes in GFCF and changes in GHG emissions is not expected. These comparisons also do not take in to account the level of economic development or GHG emissions at the start of the period. Some patterns can be seen that may be dependent on starting conditions. For example, transitioning Eastern European countries, such as Poland, Slovenia, Hungary and Estonia (off the chart) have grown with reduced emissions, while other rapidly growing economies, such as Ireland, Greece and Turkey have increased emissions in the residential sector.
4 Other measures of green growth consider further environmental challenge such as biodiversity loss, water, health and environment, and more broadly natural capital (OECD, 2009) 5 Analysis of the “Other buildings and structures” category is not attempted due to the mixing of non-residential buildings and a wide-varietyof engineering works in this category. 6 The GHG emissions resulting from capital investment can be locked in for the life of the asset, but there is not typically a lag in the response to new investment. E.g. building emissions begin to decrease as soon as a building energy retrofit is completed. Low-carbon investments in one sector may entail short-term increases in emissions in another sector such as manufacturing or construction.

ENV/EPOC/WPCID(2012)3
28
Figure 2.6 Low-carbon Growth Analysis of Gross Fixed Capital Formation, Residential Buildings Sector, 1997 to 2007
Note: Figure shows percent changes from 1997 to 2007 in 3-year averaged gross fixed capital formation for dwellings (calculated using national currencies with constant prices) and 3-year averaged residential GHG emissions (aggregate emissions in CO2 equivalents). Data on capital formation is from OECD Statistics; data on GHG emissions is for Annex 1 countries from UNFCCC. One outlier omitted from graph: Estonia increased gross capital investment by 371%, while reducing GHG emissions by 39%.
51. The importance of growing capital investment to reduce emissions can be seen from time-series data for Sweden (Fig. 2.7). Between 1997 and 2007, Sweden reduced residential emissions by 72% while growing capital investment in the sector by 138%. Much of this success was due to homes switching to biomass furnaces and from fuel switching or other investments in district heating systems. The time period highlighted in green in Figure 2.7 is a period during which there is both an upward trend in capital formation and a downward trend in GHG emissions. The time-series data shows that the rate of reduction of emissions rose as the rate of capital formation increased. As capital investment declined after 2008, the rate of GHG emissions reduction also declined.

ENV/EPOC/WPCID(2012)3
29
Figure 2.7 Changes in Residential GHG Emissions and Gross Fixed Capital Formation for Sweden, 1990-2009
52. Reducing GHG emissions in the transport sector is more challenging, and only two of the OECD countries analysed, Germany and Japan, were able to achieve full decoupling of emissions during the period 1997 to 2007 (Figure 2.8). The analysis in this case only includes capital investment in the transport vehicles, but not the fixed infrastructure. Roads, rails, airports etc. are included under the category of ‘Other buildings and structures’ and it is not possible to isolate the relevant data on capital formation. GFCF formation in transport vehicles grew in all countries analysed from 1997 to 2007, with the exception of Portugal where there was a decline of 1%. Growth was particularly high in Eastern European countries.

ENV/EPOC/WPCID(2012)3
30
Figure 2.8 Low-carbon Growth Analysis of Gross Fixed Capital Formation, Transport Sector, 1997 to 2007
Note: Figure shows percent changes from 1997 to 2007 in 3-year averaged gross fixed capital formation for transport vehicles (calculated using national currencies with constant prices) and 3-year averaged transport GHG emissions (aggregate emissions in CO2 equivalents). Data on capital formation is from OECD Statistics; data on GHG emissions is for Annex 1 countries from UNFCCC.
53. In the leading case of low-carbon growth in the transport sector, Germany’s GHG emissions have declined since peaking in 1999 with investment generally increasing (Figure 2.9). GFCF grew throughout the period up to 2007, other than years 2001 and 2002. There was increasing transportation activity during the period, but higher fuel prices and introduction of an eco-tax encouraged a shift towards diesel powered cars and purchases of more fuel efficient vehicles for both passenger and freight transport (OECD, 2012b). Higher use of diesel vehicles helps to reduce GHG emissions, but with negative impacts on local air pollution, which further raises the challenge of green growth. Other factors contributing to reduced GHG emissions included increased use of biofuels, low emission zones in cities and tolls for freight vehicles on the autobahn. During the period of GHG reductions highlighted in Figure 2.9 there were a couple of years with decreases in capital formation, but these are against an overall upward trend. The rate of decrease in GHG emissions from Germany’s transport sector began to slow after 2007 with the decline in gross capital formation.
Austria
Canada
Czech. Rep.
Denmark
Estonia
Finland
Germany
Greece
Hungary
Iceland
Ireland
Italy
Japan
Lux.
Netherlands
NZ
Poland
Portugal
Slovenia
Sweden
Switz.UK USA
-50%
0%
50%
100%
150%
200%
250%
300%
350%
400%
-20% 0% 20% 40% 60% 80% 100%
Chan
ge in
Gro
ss F
ixed
Cap
ital
For
mat
ion
in T
rans
port
Equ
ipm
ent
Change in Transport GHG Emissions (over 10 years)

ENV/EPOC/WPCID(2012)3
31
Figure 2.9 Changes in Transport GHG Emissions and Gross Fixed Capital Formation for Germany, 1990-2009
54. A mix of GHG emission sectors,7 which can broadly be labelled as Power and Industry, are impacted by investments in the ‘Other machinery and equipment’ category of gross fixed capital formation. The GHG emissions included are for: energy industries (i.e. power and heat generation); manufacturing industries and construction; and industrial processes. These correspond to capital formation in the ‘Other machinery and equipment’ category from both supply and demand perspectives. The capital investments include machinery and equipment that are used to generate electricity, and a variety of industrial machinery, computers and office equipment, telecommunications equipment and other equipment that consume electricity. Thus both the type of power generating technology and the energy efficiency of machinery and equipment are captured in this analysis. Similarly, where capital investments are made in industrial and agricultural equipment and facilities requiring heat (typically via combustion), or involving chemical reactions, the success at reducing or eliminating the associated GHG emissions is also reflected in this analysis.
55. Just under 40% of the OECD countries analysed achieved decoupling of emissions in the Power & Industry sector during 1997 to 2007 (Figure 2.10). All 25 countries assessed experienced growth in capital formation in ‘Other machinery and equipment’ category, but only nine did so with a reduction in GHG emissions.8 The nine nations achieving this included both western European countries and eastern European countries with transitioning economies.
7 Reporting of national GHG emissions is given for various sectors as defined under the UNFCCC. 8 These difference between countries potentially have a bearing on the wider debate on trends in the carbon and energy intensities of economies (se e.g. Raupach et al., 2007; van Vuuren and Riahi, 2008).

ENV/EPOC/WPCID(2012)3
32
Figure 2.10 Low-carbon Growth Analysis of Gross Fixed Capital Formation, Power & Industry Sectors, and 1997 to 2007
Note: Figure shows percent changes from 1997 to 2007 in 3-year averaged gross fixed capital formation for ‘other machinery and equipment’ (calculated using national currencies with constant prices) and 3-year averaged GHG emissions summed for energy industries, manufacturing industries and construction and industrial processes (aggregate emissions in CO2 equivalents). Data on capital formation is from OECD Statistics; data on GHG emissions is for Annex 1 countries from UNFCCC. One outlier omitted from graph: Iceland increased gross capital investment by 85%, while increasing GHG emissions by 89%.
56. The leading example in the Power and Industry sector was Denmark, which decreased GHG emissions by 25% between 1997 and 2007, with an increase in GFCF of 49%. Denmark’s capital investments in other machinery and equipment followed a general upwards trend to 2007, but with occasional years of decline (Figure 2.11). Emissions for energy industries peaked in 1996, and then generally trended downwards. Emissions from industrial processes and manufacturing industries and construction were relatively stable, though both gradually declined from around year 2000.

ENV/EPOC/WPCID(2012)3
33
Figure 2.11 Changes in Power and Industry GHG Emissions and Gross Fixed Capital Formation for Denmark, 1990-2009
2.3 Infrastructure Needs
57. The rest of this chapter draws upon existing OECD and IEA studies of infrastructure demands to assess future infrastructure needs under LCR and Business-as-Usual (BAU) trajectories. Many OECD countries have made progress in lowering GHG emissions from the residential buildings sector, and to a lesser extent from power and industry, but increased efforts are required, especially in the transportation sector.9 A number of studies have estimated future investment needs for infrastructure (see for example Table 1 in Della Croce et al., 2011). This chapter draws primarily upon estimates from the OECD’s Infrastructure 2030 studies and the IEA’s 2012 Energy Technology Perspectives.
58. A number of factors can influence future infrastructure demands, including population growth, economic growth, changing demographics, age of infrastructure, environmental stresses and changes in the price of resources. Some of these factors will vary between countries. Strategies for infrastructure provision in the UK, for example, note both the ageing of the national infrastructure and the ageing of the population (Hall et al. 2012). Much emphasis will be on renewing or replacing old infrastructure systems and providing services to an elderly population, while addressing concerns over environmental quality, rising energy prices and long-term resilience to climate change. For developing countries with rapid economic growth, more emphasis is given to providing new ‘greenfield’ infrastructure to a growing younger population, but the other factors are still present.
59. Several evolving cross-cutting issues and policy challenges will also influence what infrastructure actually gets built or maintained, including globalisation, and urbanisation among others
9 Challenges of attracting private investment to LCR transportation infrastructure are discussed in the companion paper “Financing Sustainable Transport” led by Geraldine Ang and Virginie Marchal.

ENV/EPOC/WPCID(2012)3
34
(OECD, 2006a). The growing internationalisation of the global economy places greater demands at countries’ entry and exit points, such as ports, airports, and frontier crossings. Urbanisation trends provide both massive challenges and opportunities to infrastructure development; decisions on what types of urban form are encouraged will greatly influence the types and amounts of infrastructure constructed. There is increasing interdependence across infrastructure, with services from one infrastructure system providing important input to the operation of other infrastructure (as discussed in Chapter 1); this interdependence has consequences for the security, reliability, resilience and market competition for infrastructure services. Also, potentially impacting the economic structure of infrastructure services is possible evolution away from large infrastructure systems towards smaller scale decentralised systems, with characteristics of local autonomy, self-reliance and mobility. Technological capability for creating more intelligent infrastructure (e.g. smart grid technologies) continues to evolve, with uptake largely depending on socioeconomic concerns over costs, environment, security and public acceptance of risks. As well as the challenges of meeting financial needs for infrastructure and addressing critical environmental concerns, there are further issues with appropriate pricing of infrastructure services, and managing future change to ensure that infrastructure remains functional.
Table 2.1 Comparative annual global infrastructure investments under business-as-usual and low-carbon scenarios, 2015 to 2020 (USD Bn/ yr)10
Business-as-
usual (6 deg C) scenario
Low-carbon(2 deg C) scenario
Incremental cost of low-carbon
scenario Notes on author’s estimates
Power Generation 1 320 380 60 Electricity T&D1 270 260 -10
*Buildings 1 320 620 300 Industry 1 280 310 30
Water 772 2 7724 0 Telecoms 646 2 646 0
Road 245 2 < 2454 <0 Sequenced with transformation in vehicle technology
Transportation vehicles1 3,300 3,370 70
Rail 120 3 120? 4 0? Decrease in demand for coal replaced by shifting of freight from road
Airports 120 3 < 1204 <0
Ports 40 3 40? 4 0? Decrease in demand for oil and coal replaced by increased trade in green products
Oil & Gas distribution 155 3 < 1554 <0 Lower demand for oil and gas Total 6,590 ~ 6500 to 7000 ~ 0 to +400
Total (excl. buildings & vehicles) 3,000 ~ 2500 to 3000 ~ - 500 to 0
Sources: 1: IEA (2012); 2: OECD (2006a); 3: OECD (2012c); 4: author’s estimate.
Notes: * IEA building cost estimates only cover energy using equipment and retrofits to building envelopes; question marks denote cases where the direction of the change in cost between BAU and the low-carbon case is uncertain; totals for low-carbon and incremental columns are uncertain, so ranges have been given by summing upper and lower bounds of uncertain costs.
60. Table 2.1 shows expected infrastructure investment requirements from 2015 to 2020, for low-carbon (2 deg C) and BAU (6 deg C) global warming scenarios, combining the IEA and OECD analyses. The greatest incremental expenditure (USD 300 Bn/yr) is required in the building sector, including both retrofitting and new building to high energy efficient standards.11 Approximately USD 60 Bn of extra 10 Note that Table 2.1 shows estimated capital costs, but does not address overall economic gains or losses from infrastructure investments. Reductions in operating costs can be expected for more efficient buildings and vehicles. 11 E.g. the EU 2020 target aims for all new buildings to be nearly-zero energy by the end of 2020.

ENV/EPOC/WPCID(2012)3
35
investment in power generation is necessary. The toughest decisions come in the transportation sector. Investments in roads will be necessary both to maintain current systems and to support economic growth, but such investment should be sequenced with and moderated by spending required to transform road vehicle technology. Demand for investment in rail infrastructure could be driven up by switching of freight from road vehicles, but driven down by decreasing demands for transporting large quantities of coal. Policies to encourage low-carbon growth might entail increased global trade in components of low-carbon transport, building, energy and industrial products, necessitating some increase in port infrastructure capacity, but again this should be moderated by a decreased demand for the shipping of coal and oil.
General Infrastructure Needs under Business as Usual (BAU)
61. From 2005 to 2007, the OECD International Futures Programme conducted an extensive project on “Global Infrastructure Needs: Prospects and Implications for Public and Private Actors.” The project covered four sectors: power (transmission and distribution only), surface transport (excluding vehicles), water and telecommunications infrastructure with a focus on OECD countries, but including some BRIIC countries (Brazil, China, India, Indonesia and Russia). The work included: assessment of future demand for infrastructure investment; identification of critical emerging infrastructure issues; analysis of the future viability of current business models; and assessment of institutional and framework conditions.
62. Order of magnitude estimates for infrastructure expenditure up to 2030 are about USD 2 trillion US per year, or about 2.5% of global GDP annually, for the four sectors studied by the International Futures Programme. When power generation is added the estimate goes up to 3.5% of GDP (OECD, 2007); and becomes higher when other sectors such as airports, ports, transportation vehicles and buildings are included. These estimates are clearly approximate, made subject to assumptions about future GDP growth, demographics and technology change. Nonetheless, general trends suggest that investment needs in land transport and telecommunications are likely to decline (as a percentage of GDP), whereas demand for electricity and water infrastructure will remain steady or slightly increase (Appendix 4). These estimates include spending on maintenance, repair or replacement of infrastructure, which is particularly significant for water and road infrastructure in Europe and North America, compared to elsewhere.
63. A follow-up report has projected large increases in infrastructure investments required for strategic transportation gateways, hubs and key connections (OECD, 2012c). Under the expectation that world GDP might double by 2030, the outlook for international transportation demand is:
• Doubling of air passenger traffic in 15 years
• Tripling of air freight in 20 years
• Quadrupling of port handling of maritime containers by 2030
64. To accommodate such growth requires increased capacity in airports and port infrastructure. Also including revised estimates for new rail construction, and oil and gas pipelines, global strategic transportation needs are projected to be about USD 388 billion /yr. to 2015, and USD 585 billion/yr from 2015 to 2030 (Appendix 4). These infrastructure projections should be considered cautiously though as they could change with policies that are directed towards green growth, as discussed next.
LCR Infrastructure Needs
65. Under the IEA’s scenario for limiting global climate change to 2-degrees, both coal and oil demand will decrease by 2035 to lower than 1990 levels, while natural gas demand would grow, but at a slower rate (IEA, 2011). Hence, infrastructure investment needs for oil and gas transport and distribution may be lower than projected under BAU. Low-carbon growth policies may also impact investments in rail and port infrastructure, since fossil fuels currently represent large fractions of the commodities transported.

ENV/EPOC/WPCID(2012)3
36
In the US, for example, coal accounted for 44% of rail tonnage (21% of rail revenue) in 2007 (Association of American Railroads, 2008). Implementation of low-carbon growth policies, globally, might involve a reduction in coal transportation, and a shifting of higher-value freight from road to rail. For marine transport, fuels represented 15.8% of the total value of merchandise transported globally in 2010 (WTO, 2010); while in 2009, transport of oil and coal accounted for an estimated 44% of the tonnage of maritime trade (based on estimated tonnages in UNCTAD, 2010). While future investments in port infrastructure may be driven by increases in container vessel size, the projected quadrupling of maritime trade by 2030 may be lessened if the demand for shipping fossil fuels is decreased.
66. The projected growth in air freight transportation is challenging for low-carbon growth. Unless low-carbon alternatives can replace a large fraction of conventional jet fuels, then a tripling of air freight in 20 years, on top of a doubling of air passengers in 20 years, would cause substantial increases in global GHG emissions. GHG emissions per tone-km for air freight are one or two orders of magnitude higher than those from marine transportation and rail (Appendix 1).
67. Further capital investments in other sectors shown in Table 2.1 are required for climate change mitigation. Under the IEA’s blue scenario, limiting climate change to 2 degrees Celsius, will require annual investments rising from USD 4.95 trillion US/year for this decade, to USD 9.54 trillion US/year for 2031-50 (Appendix 4). The majority of these investments are required to be in transportation vehicles, which along with those in buildings may largely be by the private sector.
68. The impacts of climate change should also factor into infrastructure planning, both in the short-term and long-term. In some cases, existing infrastructure may be sufficiently resilient to climate change in the short-term, and adaptation can occur over the long-term as infrastructure is replaced due to obsolescence. In other cases, where infrastructure is already highly vulnerable or there is a high degree of irreversibility, then more immediate action may be required. Table 2.2 provides some example estimates of global costs of adapting to climate change in a limited number of sectors: coastal protection, climate proofing settlements, water infrastructure and space heating/cooling. Note that some of the costs shown in Table 2.2 are not additional to the infrastructure costs given in Table 2.1 Some of the costs of climate proofing settlements may also involve GHG mitigation measures as shown in Figure 1.3. The water infrastructure costs of USD 720 USD Bn/yr. includes both climatic and socio-economic demands. The value is of similar order to the USD 772 USD Bn/yr shown for water infrastructure in Table 2.1; these values are not additive.
Table 2.2 Annual global cost of adapting to climate change in a limited number of sectors
(USD Bn/ yr. up to 2060)
Sector Annual cost (Billion USD)
Coastal protection for a 2.5 deg-C temperature rise 33.6
Climate proofing settlements 154
Water infrastructure to meet climatic and socio-economic demands 720
Water infrastructure for agriculture for a 2.5 deg-C temperature rise 122.4 – 203.4
Increased expenditure for space heating and cooling for a 2.5 deg-C temperature rise 148
Source: Agrawala S. et al., 2010 – Annex 5.
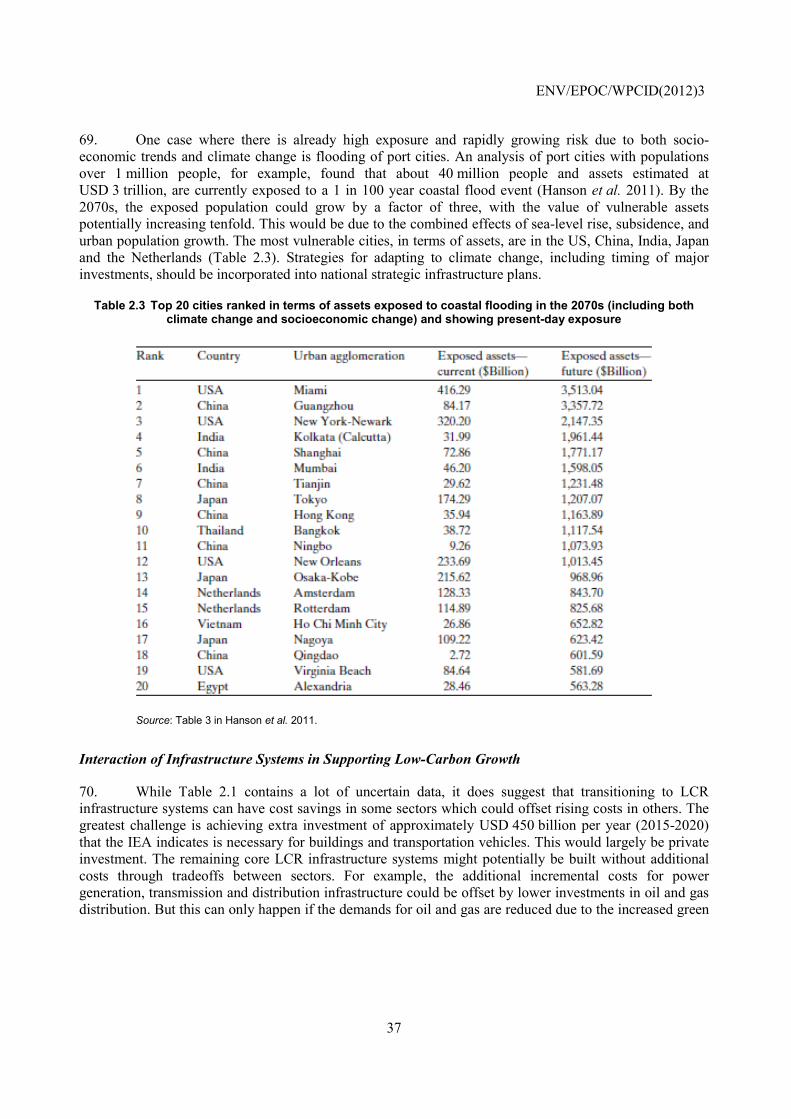
ENV/EPOC/WPCID(2012)3
37
69. One case where there is already high exposure and rapidly growing risk due to both socio-economic trends and climate change is flooding of port cities. An analysis of port cities with populations over 1 million people, for example, found that about 40 million people and assets estimated at USD 3 trillion, are currently exposed to a 1 in 100 year coastal flood event (Hanson et al. 2011). By the 2070s, the exposed population could grow by a factor of three, with the value of vulnerable assets potentially increasing tenfold. This would be due to the combined effects of sea-level rise, subsidence, and urban population growth. The most vulnerable cities, in terms of assets, are in the US, China, India, Japan and the Netherlands (Table 2.3). Strategies for adapting to climate change, including timing of major investments, should be incorporated into national strategic infrastructure plans.
Table 2.3 Top 20 cities ranked in terms of assets exposed to coastal flooding in the 2070s (including both climate change and socioeconomic change) and showing present-day exposure
Source: Table 3 in Hanson et al. 2011.
Interaction of Infrastructure Systems in Supporting Low-Carbon Growth
70. While Table 2.1 contains a lot of uncertain data, it does suggest that transitioning to LCR infrastructure systems can have cost savings in some sectors which could offset rising costs in others. The greatest challenge is achieving extra investment of approximately USD 450 billion per year (2015-2020) that the IEA indicates is necessary for buildings and transportation vehicles. This would largely be private investment. The remaining core LCR infrastructure systems might potentially be built without additional costs through tradeoffs between sectors. For example, the additional incremental costs for power generation, transmission and distribution infrastructure could be offset by lower investments in oil and gas distribution. But this can only happen if the demands for oil and gas are reduced due to the increased green

ENV/EPOC/WPCID(2012)3
38
investments in buildings and transportation vehicles, including energy efficiency and demand management.12
71. The interdependency between infrastructure systems, both technically and in terms of financial tradeoffs, shows the potential to generate virtuous cycles of low-carbon growth (Fig. 2.12). Most central to this growth are three interactions: i) increased generation of low-carbon electricity technically enables greening of buildings and transportation vehicles; ii) decreased demand for oil and natural gas reduces the capital requirements for new infrastructure in these sectors; iii) this capital can alternatively be invested in greening of the electricity sector, which decreases demands for coal. The consequence of decreased demands for oil and coal is a freeing up of rail and port capacity. The port capacity would ideally be used to support growing global trade in components of green buildings, vehicles and energy supply systems, which would reduce prices through competition. The rail capacity could be utilised through a switching of freight from road to rail. Along with demand management measures, this could reduce the demand for future road infrastructure, freeing up capital that might alternatively be directed to low-carbon vehicles. These growth cycles can be further supported by policies to restrict growth in air freight, and maintain freight transport by rail and marine transport. The above is a tentative broad-brush description of how infrastructure systems could support low-carbon growth. There are still many technical challenge, e.g. with electricity storage and low-carbon vehicle design. The feasibility of the low-carbon virtuous cycles warrants further study, including economic modelling.
72. To enable growth that is both low-carbon and climate-resilient, governments should consider developing comprehensive strategic infrastructure plans, strongly coupled with national climate change goals. Strategic infrastructure planning strongly aligned with other policy goals is a critical element for attracting private investment (see 4.1). The key points on strategic infrastructure planning from this chapter and Chapter 1 are that:
• Long-term infrastructure plans should recognise that interdependency between different infrastructure systems can have impacts on overall resilience.
• There are opportunities to simultaneously address both climate change adaptation and mitigation in infrastructure planning and design.
• Economic analysis of infrastructure plans should recognise the cost savings of not investing in brown infrastructure, and not just the costs of green infrastructure.
12 Energy efficiency measures can produce large savings in energy consumption. For example, it is estimated that constructing energy efficient buildings in China could reduce energy use and costs by more than 50%, with an increase in construction costs of only 10% (World Bank, 2012a).

ENV/EPOC/WPCID(2012)3
39
Figure 2.12 Interdependence of Infrastructure Systems in Virtuous Cycles of Low-carbon Growth
POWERGENERATION BUILDINGS &
VEHICLES
OIL & NAT. GAS INFRASTRUCTURE
ROAD
RAIL
PORTS
AIRPORTS
Low-carbon electricity enables
greening of buildings & vehicles
Switching of freight from road to rail to replace
transport of coal
Lower investment in oil & nat. gas infra. frees up
capital for green energy generation
Decreased demand for oil & natural gas, and
their infrastructure
Decreased demand for coal & oil frees up rail
and port capacity
Growing use of port capacity for global trade in components of green buildings, vehicles and energy supply systems
Policies to restrict growth in air freight, and maintain
freight transport by rail and marine transport
Demand management & switching of freight to rail
decreases demand for road infra. freeing up capital for
low-carbon vehicles
Policies to promote energy efficiency and low-carbon
technologies for buildings & vehicles
Changing demand

ENV/EPOC/WPCID(2012)3
40
CHAPTER 3. INFRASTRUCTURE RISK AND FINANCE
73. This chapter examines the financing of LCR infrastructure and the risks involved. Understanding the risks of investing in LCR infrastructure is important since, as described in Chapter 1, attracting private sector investment requires changing the risk-return profile of projects. This chapter synthesises work on infrastructure finance by OECD and others, with additional deeper insights on the role of risk management. Differences in the financing mechanisms available in high income and low income countries are broadly discussed. Innovative ways for increasing access to commercial banks, bond finance, project finance and equity finance in developing countries are reviewed, drawing upon OECD work in the water sector. Green bonds are highlighted as an example of a financing mechanism for LCR infrastructure; while institutional investors are a potential source of funds with interests that align well with the typically long-life spans of infrastructure. In all cases, attracting greater private investment will require supportive government policies that lower investors risks
74. There are a variety of potential sources of funding for LCR infrastructure. The value of the world’s capital markets at the end of 2010 was USD 212 trillion, including stock market capitalisation, public debt securities, bonds from financial institutions, corporate bonds, securitised loans and non-securitised loans (Source McKinsey in IEA, 2012). An estimated USD 124 trillion of the total market capital was held by the global fund management industry, including both conventional and unconventional fund assets. Amongst the conventional funds under management were USD 22.4 trillion in insurance funds, USD 28.0 trillion in investment funds and USD 19.3 trillion in pension funds (Figure 3.1). The unconventional funds include sovereign wealth funds, hedge funds and private wealth. Other sources of funding include venture capital (which is small), development banks and export credit agencies. Also noteworthy are green investment banks (see Box 2, in Chapter 1), which typically use public sector balance sheets to reduce some of the risks of developing LCR assets (Della Croce et al. 2011).

ENV/EPOC/WPCID(2012)3
41
Figure 3.1 Global Assets under management in 2010 (USD trillion US) 13
Source: OECD 2012d, The City UK, 2011.
3.1 Risks of Investing in LCR Infrastructure
75. Attracting private investment in LCR infrastructure requires improving the risk-return profile of green infrastructure projects relative to both business-as-usual “brown’’ infrastructure projects and all other competing investment alternatives (Figure 1.1). Two questions are addressed here:
• What types of risks are associated with investing in LCR infrastructure?
• Which risks most significantly impact investors?
76. Climate change poses a double set of risks to infrastructure investment: (1) environmental risk; (2) financial risk (Corfee-Morlot et al., 2012). First there is the increased vulnerability of new and existing infrastructure to more extreme weather, giving rise to heightened environmental risk. Second, the development low-carbon infrastructure entails additional risks broadly associated with uncertainty in the transitioning process. Some of these additional risks related to climate change are political, policy or regulatory risks, including for example lack of political certainty over the stability of support for green investment, instability on the price of carbon, social opposition to some forms of LCR infrastructure. Other risks related to climate change are commercial or technical. Where new technologies are employed to lower carbon emissions this may raise technological risk. Lack of expertise can also impact construction risk and operational risk.
77. To gain a sense of which of these risks require most attention, it is useful to frame the risks in terms of categories used by debt rating agencies at the project financing level. The factors used in detailed systematic rating of project finance risks by Standard & Poor’s (2007), for example, are shown in Table 3.1. These are the factors that are used to calculate the debt rating of a project, which is an expression of the level of certainty that lenders will receive full and timely repayment of expected returns from investing in the project.
13 Other forms of institutional savings include foundations and endowment funds, non-pension fund money managed by banks, private investment partnership and other forms of institutional investors.

ENV/EPOC/WPCID(2012)3
42
Table 3.1 Factors used to establish debt ratings for infrastructure project finance
Project-level Risks
Contractual foundation, including operational and financing contracts Technology, construction and operations Resource availability, e.g. natural gas, wind Competitive-market exposure Counterparty risk Financial performance, including cash-flow risk, debt repayment structure, liquidity
Transactional Structure
Special-purpose entities vs. multi-purpose entities Cash management Risk to cash flow of insolvency of related entities
Sovereign Risk Willingness and ability of sovereign governments to service its obligations Local currency risk
Business and Legal Institutional Risk
Commercial laws Property rights risk
Credit Enhancement Extent of coverage provided by insurance programs Insurers demonstrated history of timely payment on claims
Source: (based on Standard & Poor’s, 2007).

ENV/EPOC/WPCID(2012)3
43
78. Many of the relevant risks are at the project level. Contractual details assessed include alignment between project management and the interests of lenders, as well as exposure to force majeure risks, such as floods, earthquakes, civil disturbances or changes in law. Considerable emphasis is given to technology risks, both during and post-construction. Assessment of resource availability will consider supply risks of feedstocks such as natural gas, or natural resources such as wind, as is appropriate. Competitive-market exposure is a principal determinant of risk, including demand for the project’s output, e.g. electricity demand or transportation demand, which are usually difficult to predict. Counterparty exposure is also important, and usually a project will not be rated higher than the low-rated outside party upon which the project depends.14 Lastly, assessment of financial performance at the project level considers numerous potential risks to cash-flow risks, as well as debt repayment structure, and liquidity.
79. The transactional structure of a project is assessed as a separate principal factor under Standard & Poor’s rating scheme. Higher ratings are given to projects structured as single-purpose entities, since these have more clearly defined, less changeable, activities and obligations. Precise details on cash management, usually controlled by an independent trustee, and cash flow risks associated with other entities are also assessed.
80. Sovereign risk can be particularly important in emerging markets. Generally, a project will not be rated higher than the rating that is given to the currency of the host country. Business and legal institutional risks are also typically of most concern in emerging markets if property rights, commercial laws, and legal institutions are poorly developed.
81. Some of the risks above, including sovereign risk and currency risk, can be addressed through credit enhancement products, but the adequacy of these products will also have a bearing on the debt rating. Various insurance products covering political and commercial risks can be provided by development banks and specialised agencies such as the Multilateral Investment Guarantee Agency, the International Finance Corporation, the Overseas Private Investment Corporation, and others. These products are generally not comprehensive; they only cover specific risks, and there may be no guarantee of full or timely payments when a claim is made. Hence risks associated with the credit enhancement mechanisms are also considered for infrastructure projects.
82. A ranking of the most significant risks in financing LCR projects based on the results of an expert roundtable conducted by Standard & Poor’s is shown in Figure 3.2 (see also Box 4). Policy (or sovereign) risks are amongst the highest ranked risks, including longevity risk (rank #1), risks from policy changes, whether legitimate (#5) or illegitimate (#8), and risks that rules are not fully binding or difficult to enforce (#9). Three transactional risks are highly ranked: transaction cost risk (#2), economic/price volatility risk (#4) and liquidity risk (#10), but other transactional risks (fungibility, currency, complexity, branding) are ranked lower. Capacity risks are also of concern, including risks from lack of a well-trained workforce (#3), lack of capacity to understand and develop policy (#6), poor supporting infrastructure (#7), ability to manage the aggregation of individual transactions (#11); lack of property rights (#13) and the capacity of regulators (#14). Project-level risks, including fraud, technology risk and natural hazard, were of the lowest concern to participants of the roundtable.
14 In this context counterparty exposure is the risk from relying on contractual participation of outside parties that that can impact the success of the project, e.g. are suppliers, construction companies, customers.

ENV/EPOC/WPCID(2012)3
44
Figure 3.2 Ranking of risks inherent in climate change finance based on roundtable hosted by Standard & Poor’s
: Policy Risks; : Transactional Risks; : Capacity Risks; : Project-level Risks
Notes:
Author calculated the level of risk by multiplying average values of probability and severity determined in the S&P roundtable; analysis excludes three possible barriers (risk/reward imbalance, private sector funding shortage, and unattractive project size) identified by participants.
See also Box 4.
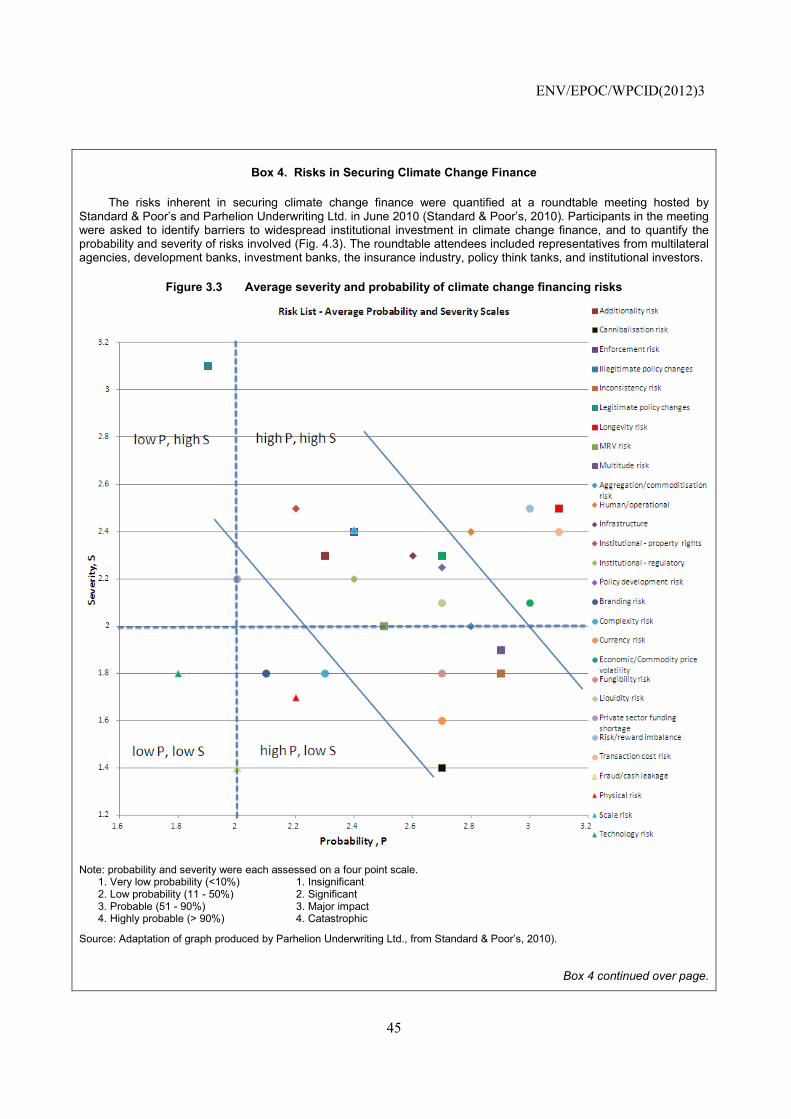
ENV/EPOC/WPCID(2012)3
45
Box 4. Risks in Securing Climate Change Finance
The risks inherent in securing climate change finance were quantified at a roundtable meeting hosted by Standard & Poor’s and Parhelion Underwriting Ltd. in June 2010 (Standard & Poor’s, 2010). Participants in the meeting were asked to identify barriers to widespread institutional investment in climate change finance, and to quantify the probability and severity of risks involved (Fig. 4.3). The roundtable attendees included representatives from multilateral agencies, development banks, investment banks, the insurance industry, policy think tanks, and institutional investors.
Figure 3.3 Average severity and probability of climate change financing risks
Note: probability and severity were each assessed on a four point scale. 1. Very low probability (<10%) 1. Insignificant 2. Low probability (11 - 50%) 2. Significant 3. Probable (51 - 90%) 3. Major impact 4. Highly probable (> 90%) 4. Catastrophic
Source: Adaptation of graph produced by Parhelion Underwriting Ltd., from Standard & Poor’s, 2010).
Box 4 continued over page.

ENV/EPOC/WPCID(2012)3
46
Box 4. Risks in Securing Climate Change Finance (continued)
The most important risks are those that have both high probability and high severity. Greatest of these is longevity risk; investors are concerned about the relatively short time frame of climate change regulations or policies (e.g. incentive measures), compared to the long-term commitment periods required for capital investment. Risks of facing high transaction costs, including compliance with reporting and verification procedures were also considered high. Risk/reward imbalance was shown to be of high concern by the workshop participants (although technically this should be regarded as a barrier, rather than a risk). The next two highest risks are: human/operational risks reflecting concerns over lack of well-trained workforce to implement projects; and risks of fluctuations in economic conditions and commodity prices.
3.2 Financing Mechanisms in High and Low Income Countries.
83. The ability to access finance for LCR infrastructure differs greatly between low and high income countries. Accessing such capital in high income countries is aided by the maturity of bank and non-bank financial services, as well as broader legal, regulatory and institutional capacity. High and upper middle income countries have universal banks; and non-bank financial services include government and corporate bonds, market equity, and alternative services such as private equity and venture capital (Table 3.2). Interest rates are fully market based and risk management is robust. There is full availability of long term funding, as is typically necessary for infrastructure investments.
Table 3.2 Differences in the Maturity of Financial Sector Development in Low, Middle and High Income Countries
Level of Financial Sector Development Low Medium High
Low Income Countries Middle Income Countries Upper Middle Income and High Income Countries
Banking Services Basic Banks Full Range Banks Universal Banks
Non-Bank Financial Services None Government Bonds
Equity
Government and Corporate Bonds Equity Alternatives (Private equity, venture capital)
Interest Rate Administrative Setting Largely Market Based Fully Market Based
Access to Finance for SMEs Limited Partial Readily Available
Availability of Long-Term Funding
Limited (up to 1 year)
Partial (up to 7 years)
Full (up to 15 years)
Risk Management Weak Adequate Robust
Clean Energy Financing Instruments
Lines of Credit (liquidity support) Concessional Financing Dedicated Debt Funds
Lines of Credit (demonstration) Partial Risk Guarantee
Lines of Credit (demonstration) Partial Risk Guarantee Equity Funds Consumer Financing
Source: World Bank. Forthcoming 2012b.

ENV/EPOC/WPCID(2012)3
47
84. Low income countries, by contrast, typically have basic banking services, and lack non-bank financial services. The capacity to undertake risk management is weak. The availability of long term funding is typically limited up to a year. Better access to long-term funding may be available in medium income countries, through full range banks, government bonds and equity, meaning that long term financing may be partially achieved.
85. Innovative financing mechanisms to increase infrastructure investment in developing countries are apparent from the OECD’s work on the water sector. The global demands for water infrastructure are around 1% of world GDP and should require capital expenditures of over USD 1 trillion per year by 2020 (Appendix 4). The needs are particularly high in developing countries, where lack of adequate water infrastructure hinders economic development and renders inhabitants particularly vulnerable to the impacts of climate change. Several major studies in the past decade have suggested using repayable market-based finance to finance water infrastructure, i.e. financing provided by private actors through markets, including private loans, bonds and equity. Following changes to the market for water services, and the financial crisis of 2008, OECD (2010) re-examined the financing mechanisms required to increase access to commercial banks, bond finance, project finance and equity finance for the water sector (Table 3.3). These mechanisms are summarised below.
Table 3.3 Financial mechanisms for increasing investment in the water sector
Financial mechanism or supporting action
Required for increased access to financing from
Commercial banks
Bond markets
Project finance
Equity finance
1. Blending commercial grants and repayable financing X
2. Extending the range of potential borrowers via micro-finance X X
3. Alleviating affordability constraints with output-based aid X X
4. Mitigating risks with guarantees and insurance X X X
5. Creating grouped financing vehicles to increase access to finance X X
6. Increasing lending to sub-sovereigns via innovation X X 7. Strengthening the balance sheet via equity injections X 8. Increasing transparency in the sector via credit
ratings X X X
9. Developing “bankable” projects through project preparation facilities X X
10. Developing local equity markets X
Source: author based on OECD (2010)
86. Many different mechanisms may be necessary to encourage commercial banks to offer long-term loans for water infrastructure. Commercial banks generally perceive the water sector in developing countries to be high risk due to difficulties in full-cost recovery through tariff setting, inefficient management and wide-spread corruption. These challenges may be overcome by blending bank financing with concessionary finance, e.g. overseas development assistance (#1 in Table 3.3), use of risk mitigation measures (#4), and strengthening borrowers through debt-equity swaps (#7). Sometimes water companies are too small to provide reliable financial statements or lack clear legal status. Financing of these smaller companies may be achieved using micro finance (#2), targeted subsidies (#3), and use of grouped lending

ENV/EPOC/WPCID(2012)3
48
instruments (#5), including lending at the sub-sovereign level (#6). Better understanding of the sector by commercial banks can be achieved by use of credit ratings and project preparation facilities to develop “bankable” projects.
87. Bond financing of the water sector is common in developed countries, but financial innovation is needed to increase access to bond markets in the developing world. Between 2000 and 2006, bonds were issued in 21 countries for financing water and sanitation infrastructure, 86% of which was in France, the UK and the US. A few bond issues have occurred in developing countries including India and the Philippines. Measures required to increase access of the water sector to bond markets include: improved credit ratings using risk mitigation instruments (#4); grouping of water service providers to achieve critical mass, including use of revolving funds (#5); and increased transparency through the development of credit ratings (#8).
88. The project finance approach to infrastructure investment typically involves financing of a special purpose entity through a combination of debt and equity tied specifically to the project. Much of this type of financing is currently occurring in Chinese markets, through public-private partnerships. Desalination and treatment plants in the Middle East and elsewhere have also been developed through project finance. A key barrier to this form of investment is the exchange rate risk borne by the project developer. Mechanisms to reduce this risk include the availability and use of guarantees (#4), as well as greater use of local currency financing, especially by sub-sovereign borrowers (#6). Other supporting measures for project finance include provision of output-based payments, e.g. as a means for disbursing concessionary funds (#3) and facilities for developing bankable projects (#9).
89. Due to the need for high expected rates of return, private equity is typically not used for capital investments in the water sector, except when used as collateral for other forms of financing. There were an estimated 94 water companies listed on worldwide stock exchange in 2005; and a further 32 unlisted private water companies (Lloyd-Owen, 2006). Most of the listed water companies are in Europe, North America and China, with other examples in Brazil, Morocco and the Philippines. Financial markets in some middle-income countries are considered to be mature enough to provide water companies access to medium or long term funds, in local currency, at reasonable rates. Development of local equity markets would be necessary in low-income countries (#10), although this goes beyond just the needs of the water sector. Access to equity capital can otherwise be provided through micro-finance (#2) and potentially enhanced through increased transparency such as the development of credit ratings (#8).
90. Further details and example applications for water infrastructure projects of the financial mechanisms listed in Table 3.3 are given in OECD (2010).
3.3 Green Bonds
91. Green bonds are an example of a specific financing mechanism with potential to attract investors to green infrastructure projects on a large scale. The potential for this debt instrument primarily lies in high income countries where bond markets are well established.
92. Currently, the global green bond market of USD 16 billion is tiny compared to the overall bond market of USD 95 trillion, and it is smaller than a necessary market size of USD 200 to USD 300 billion required to create a sufficiently liquid asset class for institutional investors to access (Della Croce et al., 2011). The largest issuances of green bonds so far have come from the World Bank (USD 2.3 billion), the European Investment Bank (USD 1.6 billion) and the US government (USD 2.4 billion clean renewable energy bonds). Corporations can also issue green bonds, in addition to multilateral banks and governments. The bonds can be asset-backed securities funding a particular infrastructure project, or they can be linked to multiple projects through treasury-style bonds.

ENV/EPOC/WPCID(2012)3
49
93. The development of standards for defining when an investment is green may help to attract greater investment in green bonds.15 The Climate Bonds Initiative (CBI), for example, is developing standards for assuring the integrity of green investments in the low-carbon economy, including the legal/accounting procedure required for certification. Such standardisation is important for investors seeking to reduce their exposure to carbon assets. The CBI uses a simple, binary means of determining whether an investment is low-carbon or not, based on the type of product.16 The standards are expected to lower the cost of capital, especially if adopted with international agreement.
94. The key challenge for greater use of green bonds is to improve the risk-return value proposition for investors.17 Investors have sufficient cash holdings, and are looking for opportunities with A and AA rated bonds, including opportunities in emerging nations. Although costs of some low-carbon technologies continue to fall, most climate-related investments still require some support from governments or development banks in order to be commercially viable. This public sector support might be:
1. as guarantee pools to lower investment risk for private sector finance (e.g. with the UK Green Deal financing model for residential and commercial energy efficiency schemes); or
2. regulatory measures to enable the securitisation of clean energy/climate friendly assets (i.e. by pooling assets into packaged financial instruments to diversify the risk of underlying assets). Indeed, large institutional investors would require a securitisation of climate change portfolios such as equity assets.
3.4 Institutional Investors
95. Institutional investors are a strong potential source of funding for green infrastructure since their investment horizons typically align well with the long-life spans of infrastructure. OECD (2012d) notes the formation of several climate change related institutional investor groups and gives examples of investments in clean energy projects by pension fund and insurance companies. Due to their demand for stable, long-term cash flows, often with modest risk, pension funds have been noted as a potentially good source of financing for clean energy and infrastructure more generally (Della Croce et al., 2011).
96. There are two means by which pension funds and other institutional investors can invest in LCR infrastructure:
1. Indirectly through intermediary vehicles such as green bonds. Bonds already constitute around 50% of the holdings of institutional investors, so one way to attract pension funds etc. to invest in LCR infrastructure is through encouraging the uptake of green bonds.
2. Direct investment, e.g. through project finance
97. Direct investment in infrastructure by pension funds is currently limited, although data on pension fund investment in infrastructure is relatively poor (OECD, 2011b). One survey of worldwide investors by Russel Investments found that only 0.3% of pension fund holdings were directly invested in infrastructure, although the percentage was expected to rise to 1.4% by 2012. Another survey by Tower
15 OECD (2012e) reviews the concepts and definitions of ‘green’ investments that are currently used in the market place. 16 The Climate bonds were launched in November 2011 with wind power as the sole qualifying low-carbon product; further products are expected to be added. 17 Based on discussion with Sean Kidney, Executive Chair of the Climate bonds initiative.

ENV/EPOC/WPCID(2012)3
50
Watson showed that infrastructure investments in the alternative asset class for pension funds were smaller than those for real estate, private equity and hedge funds.
98. There are differences between countries in levels of infrastructure investment by pension funds. Australian and Canadian pension fund companies have been active in the infrastructure sector for a decade or more, with some holding more than 10% of their equity in the sector. US pension funds have invested relatively little in the infrastructure sector in the past, while European funds have only started to build up allocations to infrastructure in the past five years (Della Croce, 2011).
99. The barriers to pension fund investment in infrastructure were identified through an OECD (2011a) survey, including interviews with 60 firms (Table 3.4). The barriers include problems in identifying investment opportunities, lack of investor capacity and poor conditions for investment. (Appendix 5 outlines potential policies for overcoming these barriers)
Table 3.4. Barriers to Pension fund investment in infrastructure
Category
1. The Investment Opportunities • Lack of political commitments over the long term
• Regulatory instability
• Fragmentation of the market among different levels of governments
• No clarity on investment opportunities
• High bidding costs
• Infrastructure investment opportunities in the market are perceived as too risky
2. The Investor Capability • Lack of investor expertise in the infrastructure sector
• Problem of scale of pension funds
• Mis-alignment of interests between infrastructure funds and pension funds
• Regulatory barriers
• Short term perspective of investors
3. The Conditions for Investment • Negative perception of the infrastructure value
• Lack of transparency in the Infrastructure sector
• Shortage of data on financial performance of infrastructure projects, lack of benchmark
Source: Della Croce (2011), OECD (2011b).
100. Increased institutional investment in infrastructure could be achieved if policies to overcome the barriers are pursued, but this does not guarantee that green infrastructure is built. Currently, pension funds have estimated holdings in traditional energy companies of 5%-8% (IEA, 2012). Pension funds may be a potential source for filling the gap in infrastructure financing, but the policies taken need to be tied to climate change goals, otherwise attraction of private investment to LCR infrastructure may continue to be overshadowed by private investments in brown infrastructure.

ENV/EPOC/WPCID(2012)3
51
3.5 Summary: Tipping the Playing Field Towards LCR Infrastructure Investment
101. There is potential for private capital and finance to fund investment in LCR infrastructure, but to make the large transition that is necessary will require some tipping of the playing field. For example: with support, the pension fund industry could develop the appropriate structure and expertise to increase investment in infrastructure, but that does not mean that green infrastructure will be favoured over brown infrastructure. Green bonds may grow to become a well branded investment vehicle, which provides investors with the confidence that they are holding low-carbon assets, but if risk adjusted returns on such green bonds are lower than brown bonds, then investor uptake will be muted. Supportive government policy is required to attract broader private investment in LCR infrastructure.
102. The mechanism for supporting green investment needs to be simple, or otherwise it may be undermined by increased risks. The risk of incurring high transaction costs is ranked as one of the most significant risks in climate change finance in part because of the complexity of compliance with GHG reporting and verification procedures, e.g. in the CDM market (Fig. 3.2). Complex mechanisms also inevitably stretch human capacity, which is a reoccurring barrier both for public and private sector actors, and hence also carries a risk–premium. A simple mechanism for supporting LCR infrastructure might, for example, be more widespread use of green infrastructure bonds and in particular the use of tax-exempt infrastructure bonds to favour green investments over brown.18 If countries were to develop clear, simple standards for green infrastructure bonds, then tax exemption or concessions could be used to attract investors. Moreover, if such standards were developed to be consistent internationally (e.g. building upon definitions of LCR infrastructure in Appendix 1), then this may help create a large enough market for green bonds with sufficient liquidity to attract institutional investors.
103. The need to reduce investors’ risks is particularly important in a developing world context. Guarantees and insurance can be used to directly reduce risks, though subject to the adequacy of the products used (Section 3.1). Increasing transparency through credit ratings should lower risks associated with uncertainty of information. An emphasis on using simple mechanisms is also relevant.
18 The US treasury has previously issued tax-favoured green bonds to support green construction, following the American Jobs Creation Act of 2004. The US Government also provides tax credits for clean energy bonds (Della Croce et al., 2011).

ENV/EPOC/WPCID(2012)3
52
CHAPTER 4. GOVERNANCE FOR ACHIEVING LCR INFRASTRUCTURE
104. The previous chapters have shown there is an important role for governments in mobilising private investment in LCR infrastructure. This includes long-term strategic infrastructure planning, designing green policy into financial regulation, and capacity building, amongst other measures. The key government activities can be made part of a broader, comprehensive policy framework for LCR investment. Governments also partner with the private sector in the provision of infrastructure, adding knowledge, reducing risks and providing financial subsidy where necessary. These public-private-partnerships (PPPs) have the potential to be catalysts for the accelerated development of LCR infrastructure.
4.1 Towards a Green Investment Policy Framework
105. Corfee-Morlot et al (2012) have proposed elements of a “green investment policy framework” to help governments mobilise private LCR investment (Table 4.1). The framework is an integration of the OECD’s Policy framework for Investment (2006b) and emerging best practices in climate change policy. The objective of the framework is to promote economic development through increased private investment flows, while limiting long term, global mean temperature change to 2°C and preserving human well-being in the face of climate change. As well as indicating policies for increasing returns on private investment and reducing risks, the framework also recognises potential to boost opportunities for on-going private sector provision of public goods.
106. The first main element of the framework is setting strategic policy goals for the green economy. Of primary importance is the setting of long-term climate change goals and strategies. Where clearly communicated and backed up with legislation, long-term climate change strategy helps to reduce the longevity risk, and other policy risks that are ranked as high impediments by investors (as discussed in Section 3.1). Long-term strategic policy should also include planning of infrastructure for a green economy, wrestling with the tough infrastructure challenges raised in Chapters 1 and 2. Infrastructure plans and climate change strategy clearly have to align both between government departments and across different levels of government. Stakeholder engagement in the policy process is important for reducing risks and boosting opportunities for investment.
107. Policies for ensuring that markets for green infrastructure are open and competitive form the second element of the framework. These include regulation that provides transparency, investment and IP protection, as well as clear rules about market structure and competition in connected markets (energy, electricity, infrastructure sectors). Putting a price on carbon across one or more markets is an open, competitive means to reduce emissions, as highlighted by the success of Sweden’s residential buildings sector (Fig. 2.7). Further emission reductions in infrastructure sectors such as buildings and transportation can be encouraged through norms and regulations, such as building standards and land-use zoning.
108. Several of the financial policies needed for greening investment (#3 in Table 4.1) have been discussed in Chapter 3, including supportive regulation for pension funds, green bonds and risk reduction measures. These have to be supported by well functioning banking systems and capital markets, and adequate financial sector regulations, the absences of which is often a barrier to investment in low income countries. Further policies to finance green investment include targeted direct transfers, tax exemptions and credits to accelerate deployment of new, green technologies, feed-in tariffs, and land value capture.
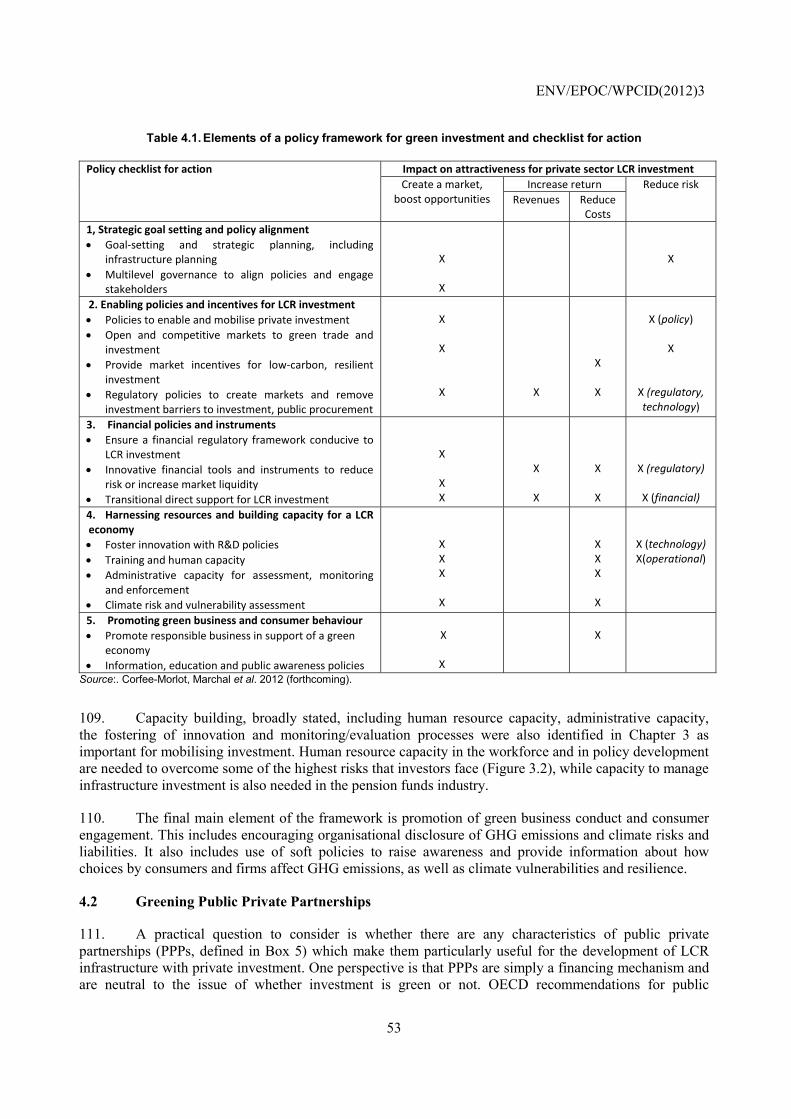
ENV/EPOC/WPCID(2012)3
53
Table 4.1. Elements of a policy framework for green investment and checklist for action
Policy checklist for action Impact on attractiveness for private sector LCR investment Create a market,
boost opportunities Increase return Reduce risk
Revenues Reduce Costs
1, Strategic goal setting and policy alignment • Goal-setting and strategic planning, including
infrastructure planning • Multilevel governance to align policies and engage
stakeholders
X
X
X
2. Enabling policies and incentives for LCR investment • Policies to enable and mobilise private investment • Open and competitive markets to green trade and
investment • Provide market incentives for low-carbon, resilient
investment • Regulatory policies to create markets and remove
investment barriers to investment, public procurement
X
X
X
X
X
X
X (policy)
X
X (regulatory, technology)
3. Financial policies and instruments • Ensure a financial regulatory framework conducive to
LCR investment • Innovative financial tools and instruments to reduce
risk or increase market liquidity • Transitional direct support for LCR investment
X
X X
X
X
X
X
X (regulatory)
X (financial)
4. Harnessing resources and building capacity for a LCR economy • Foster innovation with R&D policies • Training and human capacity • Administrative capacity for assessment, monitoring
and enforcement • Climate risk and vulnerability assessment
X X X
X
X X X
X
X (technology) X(operational)
5. Promoting green business and consumer behaviour • Promote responsible business in support of a green
economy • Information, education and public awareness policies
X
X
X
Source:. Corfee-Morlot, Marchal et al. 2012 (forthcoming).
109. Capacity building, broadly stated, including human resource capacity, administrative capacity, the fostering of innovation and monitoring/evaluation processes were also identified in Chapter 3 as important for mobilising investment. Human resource capacity in the workforce and in policy development are needed to overcome some of the highest risks that investors face (Figure 3.2), while capacity to manage infrastructure investment is also needed in the pension funds industry.
110. The final main element of the framework is promotion of green business conduct and consumer engagement. This includes encouraging organisational disclosure of GHG emissions and climate risks and liabilities. It also includes use of soft policies to raise awareness and provide information about how choices by consumers and firms affect GHG emissions, as well as climate vulnerabilities and resilience.
4.2 Greening Public Private Partnerships
111. A practical question to consider is whether there are any characteristics of public private partnerships (PPPs, defined in Box 5) which make them particularly useful for the development of LCR infrastructure with private investment. One perspective is that PPPs are simply a financing mechanism and are neutral to the issue of whether investment is green or not. OECD recommendations for public

ENV/EPOC/WPCID(2012)3
54
governance of PPPs indicate that there should be no institutional or procedural bias either in favour or against PPPs (Appendix 6, #5). The policy to develop LCR infrastructure could come before the decision of which financing mechanism, PPP or otherwise, to use. Ideally attributes of LCR infrastructure should become mainstreamed in regulations and sufficiently embodied within infrastructure design codes and standards that no special consideration of the financing mechanism is required. This, however, is not currently the case. .
Box 5. Definition of Public Private Partnerships
The OECD (2008) defines a public-private partnership as “an agreement between the government and one or more private partners (which may include the operators and the financers) according to which the private partners deliver the service in such a manner that the service delivery objectives of the government are aligned with the profit objectives of the private partners and where the effectiveness of the alignment depends on a sufficient transfer of risk to the private partners.”
PPPs for infrastructure projects can involve private sector participation in all stages of project development and operation, that is : the development, financing, construction, operation, maintenance and transfer / deconstruction / redesignation of public infrastructure.
112. The alternative perspective is that PPPs could be a possible strategic financing mechanism to mobilise large scale investment in LCR infrastructure, at least at the current time. Infrastructure requires public subsidy or other public financial support, and LCR infrastructure may justify more financial support. The tendering and negotiation processes used in PPPs perhaps help governments make more efficient use of public funds than would be the case for conventional options. This argument might not hold for smaller projects, as there is some administrative cost to the PPP process. Provision of LCR infrastructure should be driven by efficiency and value for money, drawing upon the partnering and risk-sharing approaches of PPPs when they are favourable. Where LCR infrastructure projects involve new technologies PPPs may be too risky and should be avoided, except possibly in the form of R&D joint ventures . More broadly, though, since PPP units have developed the capacity and skills to effectively manage often complex infrastructure projects, then this may make them the ideal administrative units for managing the additionally complex issues of LCR infrastructure.
113. Box 6 further discusses the use of PPPs for LCR investments, including a possible decision table that accounts for the strength of the business case, adequacy of regulatory frameworks, and maturity of technology.
Box 6. Public-Private Partnerships and LCR investments
Extracts from paper written in the context of the expert meeting on Mobilising Private Investment in Low-Carbon, Climate-Resilient Infrastructure, held on 6 February 2012 at OECD Headquarters in Paris, by Prof. Dr. J.F.M. Koppenjan, Professor of Public Administration, Erasmus University Rotterdam
Introduction
In looking for ways to stimulate the realisation of low-carbon, climate-resilient (LCR) infrastructure, the question arises as to how public-private partnership (PPP) might contribute to this aim. Private partnership might be a way to entice private investment in situations when public funds fall short. On the other hand, experiences with PPP are diverse, and institutional frameworks for PPPs are still underdeveloped in many countries and sectors. Linking LCR infrastructure to these practices may also introduce certain risks, which jeopardise rather than strengthen attempts at realising LCR strategies.

ENV/EPOC/WPCID(2012)3
55
Public-Private Partnerships
Public-private partnership differs from traditional relationships in two ways (Akintoye and Beck, 2003; Hodge and Greve, 2005; Hodge, Greve and Boardman, 2010):
1. Private sectors bear financial risks. As a result, they will be motivated to perform effectively and efficiently in order to recover investments, in particular if payments are related to performance.
2. Contracts often have an integral nature: they combine development, construction, operation and/or maintenance, while in traditional contracts these activities are contracted separately. This encourages contractors to manage interfaces and look for optimisations in design. These optimisations involve innovations regarding the physical infrastructure build and the processes of design, construction, operation, maintenance and transfer/deconstruction/redesignation. From a LCR perspective this may be attractive, since it allows for a life cycle approach. If contractors are rewarded for their LCR performance, they are provided with an incentive to invest in various ways of optimisation during the design phase that improve the contribution of the infrastructure to LCR objectives.
Considerations for deciding on PPP in LCR infrastructure
The decision table below lists four important considerations when contemplating PPP to realise LCR infrastructure. These relate to: 1) the nature of technologies involved (proven or innovative); 2) the LCR impact of projects (supportive to LCR objectives, acknowledging that LC and CR impacts may not always be aligned or even be conflicting); 3) the perspectives on cost recovery (by user payments, government payments and/or value capturing); and 4) the presence of an adequate PPP regulatory framework (including management and regulatory capacities and capabilities). The table suggests alternative behavioral options (strategies) regarding the choice of projects, PPP arrangements and the way these are applied.
The table below is not exhaustive; also, it is not intended to provide ready-for-use strategies in a mechanical manner. It is meant as a conceptual tool, to provide decision makers with an overview of the considerations that they may want to pay attention to when contemplating PPP in order to realise LCR infrastructure.
Box 6 continued over page.

ENV/EPOC/WPCID(2012)3
56
Box 6 continued Decision table regarding LCR projects and PPP
Proven technology Unproven technology
LCR projects Non LCR projects LCR projects Non LCR projects
Good business case
Adequate PPP regulatory framework
Choose PPP Discourage project or try to upgrade or redefine it
Stimulate private parties to engage in R&D. Consider participation in R&D joint venture
Discourage development or try to upgrade or redefine it
Underdeveloped regulatory framework
PPP might be considered but risky. Compensating measures needed
Discourage project or try to upgrade or redefine it. Risky in 2 ways: from a PPP and an LCR point of view
PPP might be considered but risky. Compensating measures needed
Discourage development or try to upgrade or redefine it
Insufficient return on investment
Adequate PPP regulatory framework
Consider public realisation or find government subsidies.
Discourage project or try to upgrade or redefine it
Consider subsidies Discourage development or try to upgrade or redefine it
Underdeveloped regulatory framework
Consider public realisation.
Discourage project or try to upgrade or redefine it
Consider subsidies Discourage development or try to upgrade or redefine it
PPP and technology Realising PPP in LCR infrastructure includes lock-in and given the risk adverse attitude of financial institutions
and private parties, the decision to engage in PPP may result in a choice for proven technology rather than for innovative solutions that might be preferable from an LCR point of view (Koppenjan and Leitjen, 2005).
This requires a conscious decision within LCR policies whether objectives are best served with the realisation of categories of projects with proven technology using PPP, or whether it is more sensible to choose innovative technologies for which PPP is far less sure. The balance may be tipped by the outcomes of cost-benefit analyses or the expected lead times of new technologies. Perhaps both strategies can be selected at the same time, using proven technologies for the short term, but investing in development at the same time.
Choosing proven technology that perhaps is not optimal, but certain, can sometimes be a good alternative. Many failures in infrastructure development and ICT projects are caused by preferences for sophisticated new technologies that promise a lot, but result in a piling up of requirements and complications that make the project uncontrollable and eventually cause it to fail.
PPP and new technologies
But proven technology is not always available or desirable. If governments do not have the expertise to know which technologies are needed, they may ask the market to come up with proposals. Procurement processes regarding infrastructure projects may be focused on inviting and challenging private parties to come up with innovative solutions to enhance the LCR performance of existing or newly designed infrastructure. This requires early involvement of market parties in project development. In order to prevent elimination of competition, procurement procedures like competitive dialogues have been developed. In these procedures, competing consortia are asked to come up with innovative designs. These procedures have to protect the intellectual ownership of the designs. In many cases, design fees are paid. Experiences with comparative dialogues are available in Europe (Lenferink and Hoesen, 2011). Since requirements may refer to a wide set of public values that the designs have to do justice to, it is possible to include LCR requirements. Obviously selection of bits cannot be done on the basis of price, but should include a weighted set of qualitative criteria. Tendering rules do not always allow this. Granting the contract on the basis of performance instead of detailed reference designs allows private firms to keep looking for LCR optimisations during the entire project life cycle. This practice requires innovative and advanced procurement, monitoring and contract management skills, with high demands placed on the commissioning government.
Box 6 continued over page.

ENV/EPOC/WPCID(2012)3
57
Box 6 continued
Aiming at new technologies might also involve government initiating, facilitating and subsidising research and development trajectories aimed at the development of new LCR technologies. These innovative triple helix governance networks are a form of joint venture that can be seen as a distinct form of PPP, requiring its own specific design and management (Leydesdorff, L. and H. Etzkowitz , 1998; Meijer et al., 2010; Koppenjan et al. 2012).
PPP and flexibility: flexible contracts and real options
Build, Operate and Invest contracts are long-term contracts: they have concession periods of 15, 20 of 30 years, sometimes even longer. These periods show the backside of infrastructure investments: in the short term, a lock-in may be realised of current LCR technologies, but communities may subsequently get stuck with these technologies while new developments or insights make these technologies outdated. Long-term PPP obligations may make it hard to update infrastructure. Also, the temptation to try to accomplish LCR projects as soon as possible, involves risks. Quick realisation of projects may imply that old technologies are selected while new ones are on the brink of becoming available. Within the decision-making process, technology assessment may help to prevent these decision-making risks. Furthermore, it turns out to be important to include LCR performance rewards that create incentives to keep agents investing in upgrading chosen technologies. In some cases, provisions for renegotiating contracts should be part of the contracts, incorporating flexibility that makes it possible to review contracts in between and to update agreements in order to do justice to new technological findings and new insights. Contract design may also build upon ‘real option’ theory, which implies not simply choosing the cheapest or economically most beneficial proposal, but bids that leave open options for future alternatives (Wijnia and Herder, 2005). In public transport, for instance, this might involve investment in separate lanes, tunnels and viaducts for bus transport that make it possible to upgrade the bus system to light rail (van Gestel et al., 2008). Overall PPP contracts should be flexible enough to allow parties to make best use of available technologies, but without excessive expense relative to traditional procurement mechanisms.
The importance of a positive business case; PPP as a financing mechanism
Since private parties have to recover their investments, affordability, willingness to pay or governments’ subsidies or guarantees are important. Some projects with positive business cases may be LCR by themselves. In those cases, PPP is the logical choice. If LCR leads to higher costs that jeopardise the return on investments, these need to be compensated by either additional government contributions, contributions by other institutions, or value capturing resulting in a positive cash flow.
The need for adequate management and regulatory capacities
In order to improve the functioning of new or existing infrastructure, regulation is necessary: programs of requirements and contracts should address LCR performance. Next, during the construction, operation and the other phases of the project cycle, regulation should be aimed at monitoring this performance. Governments should be committed to these objectives, and have the expertise to make judgments regarding the performance and to engage in debates on how to improve this. LCR should be a part of the design and the regulation. One requirement is the availability of LCR standards and indicators that can be used as ingredients for procurement documents and contracts. LCR policies should be aimed at making these available. As far as they are supported by PPP units or international advisors, the latter should be committed to these objectives, going beyond economic regulation. This requires a transition in regulatory contexts that in many countries and sectors is not yet underway.
Objectives in Pursuing PPPs
114. There is a wide range of PPP type arrangements for infrastructure, and practices differ considerably between countries.19 The focus here is on the more narrowly defined area of infrastructure PPPs, although there are broader areas of PPP application such as urban regeneration (used in the US since
19 OECD (2008) reviews definitions of PPPs and trends in different countries. Experiences in various countries and regions post-2008 are given in Chapter 14 to 20 of Hodge et al. (2010).

ENV/EPOC/WPCID(2012)3
58
the 1930s) that potentially also provide opportunity for implementing climate change policy. In the context of this work, PPPs are contractual tools that can take different forms, e.g. build-operate-transfer (BOT), and are designed to attract private sector investment, mitigate investor risk and guarantee some level of required returns.
115. Governments may pursue PPP projects for a range of different reasons (Table 4.2), although there are arguably two primary circumstances under which PPP projects are beneficial:
1. where PPPs offer better value for money than sole public sector investment. (Better value for money results from appropriate risk sharing, on-time and on-budget service delivery, improved accountability, full life-cycle costing, and other objectives listed in Table 4.2);
2. where use of PPPs allows governments to fund infrastructure projects that are otherwise unattainable due to tight budgetary constraints. (i.e. there are increased sources of capital to invest in infrastructure.)
Table 4.2 Objectives of Public-Private Partnerships
Government Objective
1. Enables provision of infrastructure without increased public sector borrowing 2. Reduces pressure on public sector budgets 3. Provides better value for money for taxpayers (i.e. efficiency gains) 4. Reduces risks to government from infrastructure projects 5. Improves accountability 6. Provides better on-time delivery 7. Provides better on-budget delivery 8. Allows greater infrastructure (project) innovation 9. Encourages a more innovative public sector 10. Improves business confidence 11 Improves political feasibility to impose user fees 12. Enables the full life-cycle costs of infrastructure to be provided (i.e. considers costs of infrastructure
maintenance as well as upfront capita costs) 13. Boosts sales of professional PPP services abroad 14. Supports businesses in difficult global market conditions (business assistance / subsidy) 15. Provides a crucial tool to underpin the broad societal objective of economic development (including
development of LCR infrastructure)
Source: Adapted from Table 5.1 in Hodge, 2010.
116. Some studies have reported mixed experience with the success of infrastructure projects conducted under PPPs. Hodge and Greeve (2009), for example, summarise findings from 25 studies that evaluated PPPs in several countries between 1998 and 2007. Approximately half of the studies suggest that PPP projects provide better value for money than public sector funding alone, with the other half finding the converse. Where estimated, the value added by PPPs ranged from cost-savings of around 20% to cost-overruns of 20%.
117. There are some important counter-points to these findings, however. First is recognition by Hodge and Greene that there has been virtually no use of control groups in these comparative studies, so results are statistically unreliable. Moreover, some results are also dependent on assumed discount rates, i.e. whether or not PPPs are more efficient may depend on whether high or low social discount rates are selected by the analyst.
118. Second, is the questionable track record of costing traditional public sector infrastructure works projects, which provide the benchmarks to PPP projects. In a review of 258 transportation projects in

ENV/EPOC/WPCID(2012)3
59
20 nations, Flyvbjerg et al. (2002) noted a systemic underestimation of costs for public projects. The projects dated from 1910 to 1998, without any evidence of improvements in cost estimation over time. Average cost overruns were 20% for road projects; 34% for bridges and tunnels; and 45% for rail projects. When the private sector places its own funds at risk, bringing in its own advisers, the potential for such underestimation of costs should be reduced (Flyvbjerg 2009).
119. Third, even if on average PPP projects provided no additional value for money relative to sole public sector funding, they may still allow the public sector to leverage its limited funds to achieve projects that would otherwise be unattainable. In other words, PPPs can be used as a means for the public sector to do more at a given point in time, in part by tapping into private capital markets. Government commitments to make future payments to private sector partners under PPP contracts are financially equivalent to public sector debt. Nonetheless, use of PPPs may be important for stimulating economies under adverse macroeconomic conditions and for making timely, critical investments in infrastructure to address economic development and climate change objectives.
120. Nonetheless, there are recognised challenges for policy makers in undertaking infrastructure projects using PPPs (OECD, 2007). Infrastructure projects are typically complex, of long duration and must meet both financial and social objectives. There are further challenges when governments partner with international investors who are particularly sensitive to risks involved when working in new environments where they may be exposed to public opinion and political scrutiny. There are cases of failed projects, and other cases where PPP projects were delayed, have changing partners, or required renegotiation of contracts. Such problems are more likely to happen in countries with less experience of PPPs. Box 7, for example, describes China’s experience of funding new subways since the early 1990s; it suggests that there have been improvements over time in tendering processes and contractual arrangements using PPPs; projects were successfully completed for the Beijing Olympics, although delays with other projects persist. Essentially there is a learning process that countries go through to establish capacity and experience in conducting PPPs.
Experience with PPPs in Developing Countries
121. The World Bank has gained many lessons from its experiences with PPPs in developing countries (Noumba-Um, 2010). After periods of emphasising both strongly public and then strongly private development of infrastructure, the World Bank recognises that “neither the public nor the private sector alone can meet the access, quality, financing and policy infrastructure gaps.” PPPs are advocated in the Bank’s Sustainable Infrastructure Action Plan (2008), although they are not a panacea for infrastructure development. Summarising from Noumba-Um (2010), the obstacles to PPPs in developing countries include:
• Weak policy and legal frameworks for PPPs
• Challenges in developing a pipeline of realistic PPP projects
• Over-optimistic expectations from governments (not all infrastructure projects should be undertaken with PPPs; screening mechanism required to identify most appropriate projects; consistency with capital development projects is required; budgetary resources are required to cover the cost of preparing PPP projects; and realistic time schedules should be used)
• Weak capacity of public institutions to deal with PPP specifications
• Lack of maturity of domestic capital and financial markets (with the exception of a few developing countries). Although domestic banks may have sufficient liquidity, they are often unable to appraise complex PPP projects and price the associated risks accordingly.

ENV/EPOC/WPCID(2012)3
60
122. Despite these challenges, the large majority of PPP projects in developing countries, as recorded in the World Banks’ PPI database, are successfully completed (Table 5.3). Of 4 364 projects recorded between 1990 and 2007, 4 111 reached financial closure (94.4% of projects, or 93.3% of investment). Some of the cancelled or stressed projects were the result of macroeconomic shocks, impacting for example, toll roads in Mexico, water projects in Argentina, and power sector project in Indonesia (Pessoa, 2010). The Asian financial crisis of the late 1990s caused 71% of PPP contracts in East Asia to be renegotiated (Reside, Jr., 2008). There was a concern, however, over an increasing trend in cancellations between 2001 and 2007, with a doubling of the rate of private sector exits (Pessoa, 2010). Note also that the data in Table 5.3 measures success at the time of financial closure; it does not reflect success rates at the end of the contracting period, nor potential projects for which PPP contracts were unachieved. Many developing countries still need assistance in conducting PPPs.
Table 4.3 PPP projects in developing countries, 1990-2007, including projects cancelled or under stress
Region Number of
countries with private
participation
Projects reaching financial closure Projects cancelled or under stress
Number Total
investment (USD million)
Number Total
investment (USD million)
EAP ECA LAC MENA SA SSA Total
18 26 29 13 8 46 140
1253 703 1254 122 414 365 4111
277,368 231,331 479,844 66,858 127,577 72,635 1,255,613
70 21 118 6 7 31 253
30,663 3,788 48,955 1,017 3,930 1,890 90,243
Note: EAP: East Asia and Pacific; ECA: Europe and Central Asia; LAC: Latin America and the Caribbean; MENA: Middle East and North Africa; SA: South Asia; SSA: Sub-Saharan Africa.
Source: Table 25.8 in Pessoa, 2010; based on World Bank’s PPI database.
Box 7. China’s Experience with Public–private partnerships for metropolitan subways
China has placed high priority on constructing new subway lines, with an estimated 70 billion Euros to be spent in 30 cities over the next 15 years. De Jong et al (2010) reviewed the Chinese experience with financing seven subway projects using PPPs, starting from the early 1990s (summarised below). The PPP approach has been adopted to fit Chinese circumstances, with state owned enterprises (SOEs) often involved as quasi private companies. The review suggests that a learning process has been undertaken with improvements in the tendering process and contractual arrangements over time. The more successful PPPs for subways in China have generally been in the larger east coast cities (Beijing and Shanghai), which perhaps have greater management capacity within government, construction skills and competition.
Box 7 continued over page.

ENV/EPOC/WPCID(2012)3
61
Box 7. China’s Experience with Public–private partnerships for metropolitan subways (continued)
Project, PPP Model and
Estimated Cost Experience
Line 1 in Chongqing (BOT)
12.5 Bn. Yuan
BOT contract signed with Hong Kong construction firm in 1992, without competitive tendering; terminated in 1997 due to problems with constructor’s capital structure. Second BOT contract approved in 2007 with an SOE. Private investment share comes from the constructor itself, small subcontractors and bank loans. Project costs have increased after 3-km ground-level section was moved underground; government assumed extra costs.
Line 1 in Harbin (BOT)
38.4 Bn. Yuan
BOT contract signed with Harbin Inst. of Technology Group (HITG) after a closed invitation in 2005; but HITG were unable to raise funds. Second choice, an SOE, could not raise funds either (after talks with the Industrial and Commercial Bank of China and the China Development Bank). Concerns that a high level of corruption in Harbin Province detracts interest in investment from banks and contractors.
Extension of Line 4 in Shenzen
(BDOT, 5+30 year) 5.9 Bn. Yuan
BDOT model used in which the private partner uses profits from real estate management to contribute towards both construction and operating costs. Hong Kong Metro Traffic Ltd (MTR) won contract, after competitive tendering process, with 5-year construction process and 30-year rights to operate line. Shenzen government responsible for acquiring land and selling to MTR at 60% of market value. MTR is to finance, construct and operate the subway, and has rights to develop real estate along the line. Construction was supposed to take place from 2004 to 2008, but had not begun in 2009. Public is critical because MTR is making profits from real estate, but subway construction keeps getting postponed.
Line 3 in Shanghai (Joint venture + SPV)
9 Bn. Yuan
Technically line 3 is an elevated light rail part of the Shanghai metro; it was completed in 2000. The project was not a conventional PPP, as all partners were public entities. The Shanghai government set up an SPV to separate project-specific risks from risks to the investment enterprises. The SPV raised 1.37 B Yuan through public finance, bank loans, issuing stocks and bonds; and drawing upon existing assets. Another public entity, the Shanghai Railway Bureau Corp., was chosen to design and construct the line after a bidding process. It invested 1.33 billion Yuan, with the remainder coming from domestic and foreign banks.
Olympic Games lateral in Beijing
(BT, 3 years) 1.09 Bn. Yuan
This was a successful build transfer project in which the contractor was selected through a competitive tendering process. The winning party was a consortium of three SOEs. It was responsible for constructing the subway and for project financing, with the assistance of government guarantees which helped lower the cost of bank loans. Construction of the 6 km subway line was completed on time for the Olympics at a saving of 0.34 billion Yuan relative to project estimates.
Line 4 in Beijing (Joint Venture + SPV, 30
years) 15.3 Yuan
Beijing’s fourth subway line was a joint venture between the government and three private companies, established after a competitive bidding process, with a small number of pre-qualified bidders. The government paid for all of the hard infrastructure (tunnels, stations etc.), which was 70% of construction phase expenses; with the private consortium paying for the equipment (vehicles, power and signalling systems, ticket machines, elevators etc.) at 30% of expenses. The project was near to completion at the time of appraisal by de Jong et al.
Line 5 in Beijing (Joint Venture + SPV
intended, public finance with service contract for
25 years realised) 12.3 Bn. Yuan
Construction on the 28km subway line began in December 2002, and was completed in October 2007. After a competitive tender, a consortium including SNC-Lavalin (a Canadian corporation) and three Chinese companies (one a SOE) won the project under a BOT agreement. After negotiations on government contributions to the project, one of the domestic partners withdrew from the project, eventually followed by SNC-Lavalin. Construction was completed on time with public loans from the China Construction Bank and the HSBC bank/
Notes on contractual models: BOT = build, operate, transfer; BDOT = build, develop, operate, transfer; SPV= special project vehicle; BT= build transfer.
Source: This box is based on a study published by de Jong et al, 2010.

ENV/EPOC/WPCID(2012)3
62
Status of PPPs since the Financial Crisis
123. The financial crisis of 2008 has impacted the PPP markets causing some countries to re-evaluate the use of these financing mechanisms.20 The total value of global PPP contracts rebounded during 2009 and 2010, before flattening out over 2011. The performance is varied by sectors and regions. There has been strong growth in power, oil and gas projects, as well as a 71% growth of transportation project finance between 2009 and 2011 (Table 4.4). The water sector has done less well. Western Europe still has the highest use of PPPs, although there was a decline in both the number and value of deals from 2010 to 2011 (Fig. 4.1). There has been a slow growth in the number of deals n North America, but no growth in volumes. High rates of growth in deal volumes have occurred in India and the Asia Pacific. Banks still face uncertainty and liquidity constraints, which is keeping the cost of debt for PPP contracts high. This has created some opportunities for new lenders particularly from Canada, Australia and Japan. There is also significant ongoing reliance on MDBs and foreign donors, e.g. EIB in Europe, Banobras in Mexico, BNDES in Brazil, to bring the liquidity to these markets. Although the long-term prospects for PPP transactions remain strong, driven by demands for infrastructure, some restructuring of PPP arrangements may occur. Governments may need to take on more risk and be more flexible, e.g. with regard to refinancing. Some countries have stopped using PPPs since the financial crisis, while others are re-evaluating their use. Such re-evaluation provides a good opportunity to consider increased greening of PPP projects.
Table 4.4 Global Loans to project finance (USD million)
Sector 2009 2010 2011 2009-2011 growth Power 56,289 73,300 80,499 43% Oil & Gas 25,640 25,951 38,835 51% Transportation 25,451 52,315 43,607 71% Telecommunications 8,118 13,383 5,314 -35% Leisure and Property 7,474 13,824 15,439 107% Water & Sewerage 4,699 1,578 997 -79% Mining 4,071 8,858 10,823 166% Industry 3,454 6,306 12,154 252% Petrochemicals 2,797 11,306 4,614 65% Waste & Recycling 1,194 1,267 724 -39% Other n/a 86 479 n/a Total 139,186 208,174 213,487 53%
Source: Charles Lloyd from Project Finance International.
20 Charles Lloyd, Partner, PWC, "World overview of the PPP market" 5th ANNUAL MEETING OF SENIOR PPP OFFICIALS, OECD Conference Centre, Paris, 26-27 March 2012.

ENV/EPOC/WPCID(2012)3
63
Figure 4.1 Global PPP Market Volume by Region, 2009 -2011
Source: Infrastructure Journal.
0
2,000
4,000
6,000
8,000
10,000
12,000
14,000
16,000
18,000
20,000
9 10 11 9 10 11 9 10 11 9 10 11 9 10 11 9 10 11 9 10 11
Africa & Middle East Asia Pacific Eastern Europe Latin America North America Indian Subcontinent Western Europe
Total value (US $m)
Debt (US $m)

ENV/EPOC/WPCID(2012)3
64
CHAPTER 5. CONCLUSIONS
124. An evolving green economy can be envisaged in which the consumption and the transportation of heavy fossil fuels has been replaced by increasing global trade in green, light-weight, low-carbon products. These products include components of LCR buildings, transportation vehicles, water and energy supply technologies, which are in themselves part of the new green infrastructure.
125. To accelerate the growth of this green economy, governments should be encouraged to develop bold strategic infrastructure plans, highly coupled with national climate change goals (Corfee-Morlot et al. 2012 forthcoming; World Bank 2012). Undertaking such integrated, yet detailed, national infrastructure planning is advantageous to governments as they prepare to negotiate legal agreements on climate change by 2015, under the UNFCCC process. In the shorter term, there are other actions that governments can undertake to build confidence in their ability to undertake the transition to green economies. In addition to strengthening markets these include: developing financial mechanisms to enhance green private investment, greening PPP units, undertaking detailed feasibility studies of potential LCR infrastructure; and raising green performance standards on immediate public infrastructure projects. A critical analysis of how public sector funding could be better used to green economies may be warranted. All of these actions have the additional important benefit of growing capacity to plan, finance, design, construct and manage green infrastructure.
126. Reducing investors’ risks is important for mobilising private investment in LCR infrastructure at times of tight fiscal constraints. Key here is reducing longevity risk by extending the time frame of climate change goals and policies to correspond with the long-term commitment periods required for capital investment. Governments might consider establishing GHG emissions reduction targets or goals to beyond 2020, or setting long-term targets for specific sectors.
127. In developing countries, guarantees and insurance products are important for reducing sovereign and currency risks for investments in infrastructure projects. A variety of products are provided by different institutions, notably development finance units, with differing degrees of coverage. A more focussed review of these products is warranted, with a view to both improving and expanding their application. A variety of other mechanisms can also help with attracting investment including increasing transparency through credit ratings, information provision and creation of standards, e.g. for green bonds.
128. Mobilising large scale private investment in green infrastructure, in both OECD and non-OECD countries does also require public financial incentives. Simple mechanisms such as widespread use of tax exemptions for green infrastructure bonds help to avoid risk-premiums associated with complex procedures. Where public subsidy is required, PPPs have some advantages in that the tendering, negotiation and risk-sharing processes used can help to ensure most efficient use of public funds. PPP units could be key actors within government for championing the development of LCR infrastructure.

ENV/EPOC/WPCID(2012)3
65
BIBLIOGRAPHY
Agrawala, S. et al. (2010), “Plan or React? Analysis of Adaptation Costs and Benefits Using Integrated Assessment Models”, OECD Environment Working Papers, No. 23, OECD Publishing, Paris. http://dx.doi.org/10.1787/5km975m3d5hb-en
Agrawala et al. (2011) Private Sector Engagement in Adaptation to Climate Change, OECD Environment Working Papers, No. 39, OECD Publishing, Paris.Akintoye, A., M. Beck (eds.) (2003) Public Private Partnerships: Managing Risks and Opportunities, London: Blackwell Publishers.
Arslanalp, S., Bornhorst, F. and Gupta, S. (2011). Investing in growth. Finance & Development, International Monetary Fund 48.
Aschauer, D. A. (1989). Is public expenditure productive? Journal of Monetary Economics 23(2): 177–200.
Association of American Railroads (2008) Overview of America’s Freight Railroads.
Bitsch, F., Buchner, A., and Kaserer, C. (2010) Risk, Return and Cash Flow Characteristics of Infrastructure Fund Investments, November 17 2010.
Chester, M., and A. Horvath (2009) Environmental assessment of passenger transportation should include infrastructure and supply chains, Environmental Research Letters, 4(2), 024008.
Cleary, J. (2009) Life cycle assessments of municipal solid waste management systems: A comparative analysis of selected peer-reviewed literature Environment International 35, 1256–1266
Corfee-Morlot, J., I. Cochran, S. Hallegatte, P.-J. Teasdale (2011), Multilevel risk governance and urban adaptation policy, Climatic Change (2011) 104:169–197
Corfee-Morlot, J., V. Marchal, C. Kauffmann, C. Kennedy, F. Stewart, C. Kaminker, C. Kennedy, and G. Ang ( 2012 forthcoming) Towards a Green Investment Policy Framework: The Case of Low-Carbon, Climate-Resilient Infrastructure. OECD Working Paper, OECD Publishing: Paris.
de Jong, Martin, Mu Rui, Dominic Stead, Ma Yongchi, Xi Bao (2010) Introducing public–private partnerships for metropolitan subways in China: what is the evidence? Journal of Transport Geography 18,. p. 301-313
Della Croce, R. (2011) Pension Funds Investment in Infrastructure: Policy Analysis, OECD Working Papers on Finance, Insurance and Private Pensions, No. 12.
Della Croce, R., C. Kamiker, and F. Stewart (2011) The Role of Pension Funds in Financing Green Growth Initiatives, OECD Publishing, Paris.
Engel Yan, J., C.A. Kennedy, S. Saiz, and K. Pressnail (2005) Towards sustainable neighbourhoods: The need to consider infrastructure interactions, Canadian Journal for Civil Engineering, 32(1), 45-57.

ENV/EPOC/WPCID(2012)3
66
European Community Shipowners' Associations (ECSA, 2008). Climate Change and shipping. ECSA position paper. Network for transport and environment. http://www.ntm.a.se.
Eichhorst, Urda (2009) Adapting Urban Transport to Climate Change, Module 5f of Sustainable Transport: A Sourcebook for Policy-makers in Developing Cities, Deutsche Gesellschaft für Technische Zusammenarbeit (GTZ) GmbH, available at http://www.gtz.de/
Environment Canada (2010) Canada’s National Inventory Report 1990-2008, Part 1.
Flyvbjerg, B. (2009) Survival of the unfittest: why the worst infrastructure gets built—and what we can do about it. Oxford Review of Economic Policy, Volume 25, Number 3, pp. 344–367
Flyvbjerg, B., Skamris Holm, M. K., and Buhl, S. L. (2002), ‘Underestimating Costs in Public Works Projects: Error or Lie? Journal of the American Planning Association, 68(3), 279–95.
Guy R. Newsham, G.R., S. Mancini, B.J. Birt (2009) Do LEED-certified buildings save energy? Yes, but. Energy and Buildings, 41(8), p 897-905
Hall, J.W., Henriques, J.J., Hickford, A.J. & Nicholls, R.J. eds., (2012). A Fast Track Analysis of strategies for infrastructure provision in Great Britain: Technical report. Environmental Change Institute, University of Oxford.
Hallegatte, Stéphane , Nicola Patmore, Olivier Mestre, Patrice Dumas, J. Corfee-Morlot, Celine Herweijer, Robert Muir Wood (2008) Assessing Climate Change Impacts, Sea Level Rise and Storm Surge Risk in Port Cities: A Case Study on Copenhagen, OECD, Environment Directorate, OECD Environment Working Papers. 01/2008.
Hallegatte, S., Ranger, N., Bhattacharya, S., Bachu, M., Priya, S., Dhore, K., Rafique, F., Mathur, P., Naville, N., Henriet, F., Patwardhan, A., Narayanan, K., Ghosh, S., Karmakar, S., Patnaik, U., Abhayankar, A., Pohit, S., Corfee-Morlot, J. & Herweijer, C. (2010) Flood Risks, Climate Change Impacts and Adaptation Benefits in Mumbai, OECD Environment Working Papers, OECD Publishing
Hanson, S., R. Nicholls, N. Ranger, S. Hallegatte,· J. Corfee-Morlot, C. Herweijer, and J. Chateau (2011) A global ranking of port cities with high exposure to climate extremes, Climatic Change (2011) 104:89–111
Helio International (2009) Climate-proofing energy systems
Hodge, G., C. Greve (2005) The Challenge of Public Private Partnerships. Learning from International Experience, Cheltenham: Edward Elgar.
Hodge, G.A., and C. Greve. (2009) PPPs: The Passage of Time Permits A Sober Reflection, Economic Affairs, 29(1) 33-39.
Hodge, G.A., C. Greve, A.E. Boardmann (2010) International Handbook of Public Private Partnerships, Cheltenham UK: Edward Elgar Publishing.
Hodge, G.A. (2010) Reviewing public-private partnerships: some thoughts on evaluation, Chapter 5 in International Handbook on Public-Private Partnerships, G.A., Hodge, C. Greve and A.E. Boardmann, eds., Edward Elgar, Cheltenham, UK.

ENV/EPOC/WPCID(2012)3
67
IEA (2011) World Energy Outlook 2011.
IEA (2012) Energy Technology Perspectives.
IFC (2010a) Climate Risk and Business: Practical Methods for Assessing Risk, International Finance Corporation.
IFC (2010b) Climate risk and financial institutions: challenges and opportunities, International Finance Corporation.
Jacobson, M.Z., and J. E.T. Hoeve (2011) Effects of Urban Surfaces and White Roofs on Global and Regional Climate. Journal of Climate
Kaminker, C. and F. Stewart (2012 forthcoming)
Kirshen, P. , Ruth, M., Anderson, W. (2008) Interdependencies of urban climate change impacts and adaptation strategies: A case study of Metropolitan Boston USA. Climatic Change 86 (1-2), 105-122
Klein, R.J.T., et al. (2007) “Inter-relationships between adaptation and mitigation.” Climate Change 2007: Impacts, Adaptation and Vulnerability, Contribution of Working Group II to the Fourth Assessment Report of the Intergovernmental Panel on Climate Change, M.L. Parry et al. Eds., Cambridge University Press, Cambridge UK, 745-777.
Koppenjan, J.F.M., M. Leijten (2005) Privatising Railroads: The problematic Involvement of the Private Sector in Two Dutch Railway Projects, The Asia Pacific Journal of Public Administration, vol 27, no.: 181-2000.
Koppenjan, J.F.M, N. Frantzeskaki, D. Loorbach & N. Ryan, (eds.) (2012) Governing Systems Transitions towards Sustainability: theoretical and Empirical Explorations, Special Issue, Int. J. Sustainable Development, 15 (1/2): 1-186.
Landsberg, H. E. (1981) The Urban Climate. New York: Academic Press.
Leydesdorff, L. and H. Etzkowitz (1998) The Triple Helix as a Model for Innovation Studies in: Science & Public Policy Vol. 25(3): 195-203
Lloyd-Owen (2006) Financing Water and Wastewater to 2025: From Necessity to Sustainability, Thomspn Financial, London.
Meijer, I.S.M., Pruyt, E., Negro, S.O, J.F.M. Koppenjan & Hekkert, M.P. (2010). The influence of perceived uncertainty on entrepreneurial action in the transition to a low-emission energy infrastructure: The case of biomass combustion in the Netherlands. Technological Forecasting and Social Change, 77, 1222-1236.
Mohareb, E.A, C.A. Kennedy, L.D.D. Harvey and K.D. Pressnail (2011) “Decoupling of building energy use and climate” in Energy and Buildings, 43 (10), 2961-2963.
Moser, S.C. (2012) Adaptation, mitigation, and their disharmonious discontents: an essay. Climatic Change, Vol. 111, No. 2., pp. 165-175
Munnell, A. H. (1992). Policy watch: infrastructure investment and economic growth. The Journal of Economic Perspectives 6(4): 189–198.

ENV/EPOC/WPCID(2012)3
68
Nelson, D.R., Adger, W.N. , Brown, K. (2007) Adaptation to environmental change: contributions of a resilience framework, Annual Review of Environment and Resources, 32, 395-419.
Noumba-Um, P. (2010) Empirical evidence of infrastructure public-private partnerships: lessons from the World Bank experience, Chapter 19 in International Handbook on Public-Private Partnerships, G.A., Hodge, C. Greve and A.E. Boardmann, eds., Edward Elgar, Cheltenham, UK.
OECD (2006a), Infrastructure to 2030: Telecom, Land Transport, Water and Electricity
OECD (2006a), Policy Framework for InvestmentOECD (2007a) Infrastructure to 2030, Volume 2: Mapping Policy for Electricity, Water and Transport
OECD (2007b) OECD Principles for Private Sector Participation in Infrastructure
OECD (2008) Public-Private Partnerships: In Pursuit of Risk Sharing and Value for Money.
OECD (2009) Green Growth : Overcoming the Crisis and Beyond.
OECD (2010) Innovative Financing Mechanisms for the Water Sector
OECD (2011a) Pension Funds Investment in Infrastructure: A Survey
OECD (2011b) Pension Funds Investment in Infrastructure: Policy Actions, OECD Working Papers on Finance, Insurance and Private Pensions, No. 12.
OECD (2012a) Making Green Growth Deliver: Meeting of the Environment Policy Committee (EPOC) at Ministerial Level, Agenda / Issues Paper, 29-30 March.
OECD (2012b) Environmental Performance Review of Germany
OECD (2012c) Strategic Transport Infrastructure Needs to 2030
OECD (2012d) The Role of Institutional Investors in Financing Clean Energy, Consultation Draft Working Paper prepared for the Clean Energy Ministerial, Lancaster House, London, UK, 25-26 April 2012
OECD (2012e) Defining and Measuring Green Investments: Implications for Institutional Investors Asset Allocations
Oke, T. R. (1995) The heat island of the urban boundary layer: characteristics, causes and effects, in Cermack, J. E. (ed), Wind Climate in Cities, Dordrecht, the Netherlands: Kluwer Academic.
Pessoa, A. (2010) Reviewing public-private partnership performance in developing economies, Chapter 25 in International Handbook on Public-Private Partnerships, G.A., Hodge, C. Greve and A.E. Boardmann, eds., Edward Elgar, Cheltenham, UK.
Raupach et al. (2007) Global and regional drivers of accelerating CO2 emissions, PNAS 104(24): 10288-10293
Reside, Jr., (2008) Global Determinants of Stress and Risks in Public-Private Partnerships (PPP) in Infrastructure, Tokyo: Asian Development Bank Institute.

ENV/EPOC/WPCID(2012)3
69
Sartori, I., A.G. Hestnes (2007) Energy use in the life cycle of conventional and low-energy buildings: A review article Energy and Buildings 39, 249–257.
Standard & Poor’s (2007) Updated Project Finance Summary Debt Rating Criteria
Standard & Poor’s (2010) Can Capital Markets Bridge The Climate Change Financing Gap?
Stewart I.D. (2011) “A systematic review and scientific critique of methodology in modern urban heat island literature”, in International Journal of Climatology. Volume 31, Issue 2, pages 200–217.
Sutherland, D. et al. (2009), “Infrastructure Investment: Links to Growth and the Role of Public Policies”, OECD Economics Department Working Papers, No. 686, OECD Publishing. doi: 10.1787/225678178357
UNCTAD (2010), Review of Maritime Transport 2010, United Nations, Geneva
van Gestel J.F.M. Koppenjan, I. Schrijver, A. van de Ven & W.W. Veeneman (2008), Managing Public Values in Public-Private Networks: A Comparative Study of Innovative Public Infrastructure Projects, Public Money and Management 28(3): 139-145.
van Vuuren, D.P., and K. Riahi K. (2008) Do recent emission trends imply higher emissions forever? Climatic Change 91(3-4): 237-248
Viguié, V., and S. Hallegatte (2012) Trade-offs and synergies in urban climate policies, Nature Climate Change DOI:10.1038/nclimate1434
Weisser (2007) A guide to life-cycle greenhouse gas (GHG) emissions from electric supply technologies Energy, vol. 32, no. 9, pp. 1543-1559.
Wijnia, Y.C. and P.M. Herder: Options for real options - Dealing with uncertainty in investment decisions for electricity networks, pp. 3682-3688. In: Proceedings of the IEEE 2005 International Conference on Systems, Man and Cybernetics, Oct. 10-12, 2005.At: Waikoloa, Hawaii, USA. [s.l.]: IEEE, 2005. Eds.: Mark Johnson. ISBN: 0-7803-9298-X. International Proceedings (refereed)
World Bank (2012a). Inclusive Green Growth: The Pathway to Sustainable Development, Washington, DC: World Bank.
World Bank (2012b’, forthcoming). Maximizing Leverage of Public Funds to Unlock Commercial Financing for Clean Energy in East Asia. Washington, DC: World Bank
World Health Organization (2009) Vision 2030: The Resilience of Water Supply and Sanitation in the Face of Climate Change
WTO (2010) World Trade Report 2010: Trade in Natural Resources

ENV/EPOC/WPCID(2012)3
70
APPENDIX 1. DEFINING LOW-CARBON, CLIMATE-RESILIENT INFRASTRUCTURE SYSTEMS
A1.1. Defining Low-carbon Infrastructure
The following tables (A1.1 to A1.5) provide a general quantitative basis for assessing to what extent infrastructure systems can be considered “low-carbon.” Relative GHG emissions associated with infrastructure are expressed in different functional units depending on the type of infrastructure. For power supply, life-cycle emissions of CO2 equivalent per unit of electricity generated are shown in Table A1.1. The ranges shown for different types of power plants are from a review of international literature conducted by Weisser (2007). Within any one category of power generation, emissions can vary depending on the age, type of technology and upstream contributions. So, for example, oil based electricity generation can have higher life-cycle emissions than coal-based generation, or in other cases lower emissions than natural gas.
Table A1.1. Life-cycle greenhouse gas emissions from power supply infrastructure
Power Plant Life-cycle GHG emissions gCO2eq/kWhe
Low-carbon
Hydro Nuclear
Wind Solar PV Biomass
1-34 3-24 8-30
43-73 35 – 99
Medium Carbon CCS Natural Gas
90-250 440-780
High Carbon Oil
Coal Lignite
500-1200 800-1250 800-1700
Source: Ranges for GHG emissions are based on Weisser (2007).
Emissions from the operation of buildings depend on both the energy consumption21 (kWh / m2 /yr) and the GHG intensity of external energy supply, including electricity and heating fuels (Table A1.2)22. The energy requirements for conventional buildings are generally climate dependent, with higher consumption for heating in cold climates or cooling in hot climates. For high performance sustainable buildings, however, there is some evidence of a decoupling of building energy consumption and climate (Mohareb et al. 2011). The threshold of 100 kWh / m2 / yr to define a low energy building is quite
21 This refers to all operational end-use energy in a building, including electricity and fuels used for heating, cooling and appliances. 22 Embodied energy in building materials is typically of the order 20 kWh/m2/yr, but can be as high as 100 kWh/m2/yr in some cases reviewed by Sartori and Hestnes (2007).
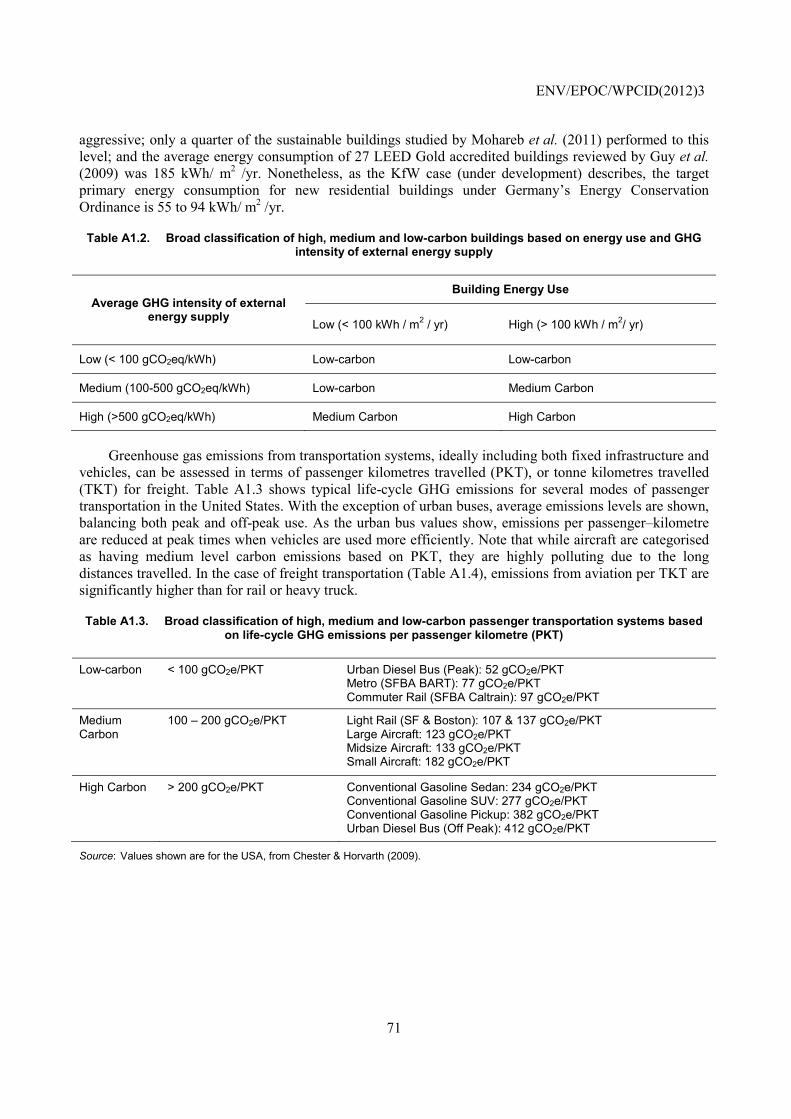
ENV/EPOC/WPCID(2012)3
71
aggressive; only a quarter of the sustainable buildings studied by Mohareb et al. (2011) performed to this level; and the average energy consumption of 27 LEED Gold accredited buildings reviewed by Guy et al. (2009) was 185 kWh/ m2 /yr. Nonetheless, as the KfW case (under development) describes, the target primary energy consumption for new residential buildings under Germany’s Energy Conservation Ordinance is 55 to 94 kWh/ m2 /yr.
Table A1.2. Broad classification of high, medium and low-carbon buildings based on energy use and GHG intensity of external energy supply
Average GHG intensity of external energy supply
Building Energy Use
Low (< 100 kWh / m2 / yr) High (> 100 kWh / m2/ yr)
Low (< 100 gCO2eq/kWh) Low-carbon Low-carbon
Medium (100-500 gCO2eq/kWh) Low-carbon Medium Carbon
High (>500 gCO2eq/kWh) Medium Carbon High Carbon
Greenhouse gas emissions from transportation systems, ideally including both fixed infrastructure and vehicles, can be assessed in terms of passenger kilometres travelled (PKT), or tonne kilometres travelled (TKT) for freight. Table A1.3 shows typical life-cycle GHG emissions for several modes of passenger transportation in the United States. With the exception of urban buses, average emissions levels are shown, balancing both peak and off-peak use. As the urban bus values show, emissions per passenger–kilometre are reduced at peak times when vehicles are used more efficiently. Note that while aircraft are categorised as having medium level carbon emissions based on PKT, they are highly polluting due to the long distances travelled. In the case of freight transportation (Table A1.4), emissions from aviation per TKT are significantly higher than for rail or heavy truck.
Table A1.3. Broad classification of high, medium and low-carbon passenger transportation systems based on life-cycle GHG emissions per passenger kilometre (PKT)
Low-carbon < 100 gCO2e/PKT Urban Diesel Bus (Peak): 52 gCO2e/PKT Metro (SFBA BART): 77 gCO2e/PKT Commuter Rail (SFBA Caltrain): 97 gCO2e/PKT
Medium Carbon
100 – 200 gCO2e/PKT Light Rail (SF & Boston): 107 & 137 gCO2e/PKT Large Aircraft: 123 gCO2e/PKT Midsize Aircraft: 133 gCO2e/PKT Small Aircraft: 182 gCO2e/PKT
High Carbon > 200 gCO2e/PKT Conventional Gasoline Sedan: 234 gCO2e/PKT Conventional Gasoline SUV: 277 gCO2e/PKT Conventional Gasoline Pickup: 382 gCO2e/PKT Urban Diesel Bus (Off Peak): 412 gCO2e/PKT
Source: Values shown are for the USA, from Chester & Horvarth (2009).
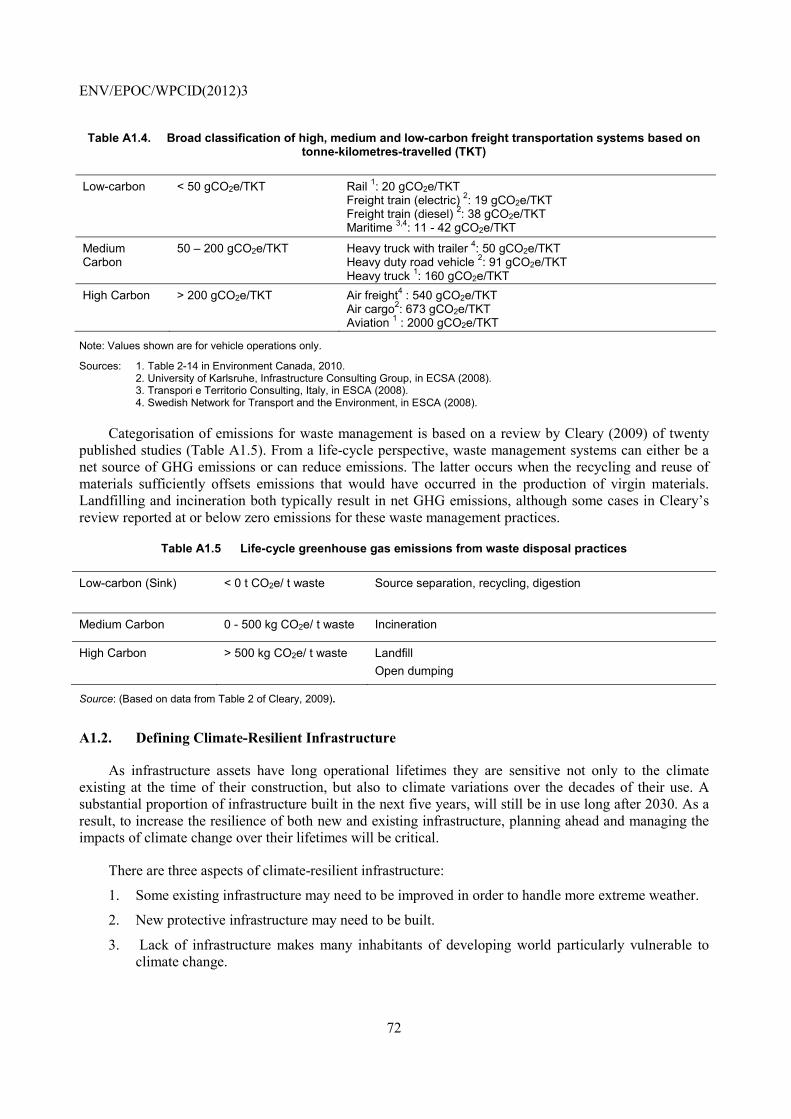
ENV/EPOC/WPCID(2012)3
72
Table A1.4. Broad classification of high, medium and low-carbon freight transportation systems based on tonne-kilometres-travelled (TKT)
Low-carbon < 50 gCO2e/TKT Rail 1: 20 gCO2e/TKT Freight train (electric) 2: 19 gCO2e/TKT Freight train (diesel) 2: 38 gCO2e/TKT Maritime 3,4: 11 - 42 gCO2e/TKT
Medium Carbon
50 – 200 gCO2e/TKT Heavy truck with trailer 4: 50 gCO2e/TKT Heavy duty road vehicle 2: 91 gCO2e/TKT Heavy truck 1: 160 gCO2e/TKT
High Carbon > 200 gCO2e/TKT Air freight4 : 540 gCO2e/TKT Air cargo2: 673 gCO2e/TKT Aviation 1 : 2000 gCO2e/TKT
Note: Values shown are for vehicle operations only.
Sources: 1. Table 2-14 in Environment Canada, 2010. 2. University of Karlsruhe, Infrastructure Consulting Group, in ECSA (2008). 3. Transpori e Territorio Consulting, Italy, in ESCA (2008). 4. Swedish Network for Transport and the Environment, in ESCA (2008).
Categorisation of emissions for waste management is based on a review by Cleary (2009) of twenty published studies (Table A1.5). From a life-cycle perspective, waste management systems can either be a net source of GHG emissions or can reduce emissions. The latter occurs when the recycling and reuse of materials sufficiently offsets emissions that would have occurred in the production of virgin materials. Landfilling and incineration both typically result in net GHG emissions, although some cases in Cleary’s review reported at or below zero emissions for these waste management practices.
Table A1.5 Life-cycle greenhouse gas emissions from waste disposal practices
Low-carbon (Sink) < 0 t CO2e/ t waste Source separation, recycling, digestion
Medium Carbon 0 - 500 kg CO2e/ t waste Incineration
High Carbon > 500 kg CO2e/ t waste Landfill Open dumping
Source: (Based on data from Table 2 of Cleary, 2009).
A1.2. Defining Climate-Resilient Infrastructure
As infrastructure assets have long operational lifetimes they are sensitive not only to the climate existing at the time of their construction, but also to climate variations over the decades of their use. A substantial proportion of infrastructure built in the next five years, will still be in use long after 2030. As a result, to increase the resilience of both new and existing infrastructure, planning ahead and managing the impacts of climate change over their lifetimes will be critical.
There are three aspects of climate-resilient infrastructure:
1. Some existing infrastructure may need to be improved in order to handle more extreme weather.
2. New protective infrastructure may need to be built.
3. Lack of infrastructure makes many inhabitants of developing world particularly vulnerable to climate change.

ENV/EPOC/WPCID(2012)3
73
Sector specific examples of climate-resilient infrastructure can be given for buildings, water, energy supply, and some components of transportation systems:
Attributes of climate-resilient buildings include:
• High performance building envelopes, typically with high levels of insulation, permitting extended maintenance of internal comfort during loss of power, heating or cooling source.
• Reflective roofs, such as white or green roofs, which absorb less heat during periods of extremely hot temperatures.
• Roofs and sidings designed with suitable safety factors for weather loadings, such as wind or snow where applicable based on expected future climatic conditions.
• Location outside of designated flood zone based on expected future climatic conditions.
• Drainage systems and basement protection sufficient to handle more extreme precipitation events.
Climate-resilient water systems include features such as (World Health Organization, 2009):
• Sufficient extra water storage capacity to cope with long droughts.
• Efficient water infrastructure, such as low leakage rates for pipe networks, water conserving fixtures, or grey water systems, so as to maximise use of scarce water resources.
• Rooftop capture and storage.
• Design of water intakes for varying water levels and strengthening to withstand turbulent flows; construction of overflows for reservoirs to avoid failure.
• Greater use of groundwater resources for more stable supply.
Examples of adaptation measures for energy supply infrastructure are (Helio International, 2009):
• Construction of wind turbines to operate at and withstand higher wind speeds.
• Strengthening the mounting of solar panels for more extreme storms.
• Production of biofuel crops with higher tolerance to heat and water stress; increased irrigation of biofuel crops or protection against flooding.
• Increased dam heights, enlarged floodgates, desilting gates and expanded installation capacity to accommodate increased river flows at hydroelectric power plants; upstream land management to reduce possible erosion and siltation.
• Improved robustness at mining installations, including off-shore structures and underground and opencast mining sites.
• Location of power plants in less flood or storm prone areas.
ENV/EPOC/WPCID(2012)3
74
• Structural strengthening of electrical transmission and distribution systems; burying of wires underground.
Climate-resilient characteristics of four types of transportation infrastructure: roads, rail, public transportation vehicles and waterways, are summarised below. These follow from more detailed description of adaptation measures for transport by Eichhorst (2009).
Attributes of climate-resilient road infrastructure include:
• Roadside vegetation, parks or water landscapes, which decreases the exposure of roads to heat.
• Construction from rut-resistant asphalt or concrete to avoid rutting during exposure to severe heat.
• Higher standards of design and maintenance to accommodate greater thermal expansion on bridge expansion joints and paved surfaces, and to prevent material degradation of bridge structures.
• Monitoring of soil conditions to avoid degradation of road foundation, landslides and subsidence.
• Increased cleaning and maintenance to avoid safety hazards of dust or sands on roadways.
• Location outside of future expected flood-risk areas, or construction of roadway on elevated structure.
• Improved drainage and increased pumping capacity to accommodate more intense rainfall events.
• All weather roads used in place of dirt roads, or other roads with limited foundations and poor drainage.
• Design of bridges, flyovers, street lighting, signs, service stations and other roadside infrastructure to accommodate higher winds and potential flooding.
Some of the attributes of climate-resilient road infrastructure, such as drainage and location with respect to flooding, equally apply to climate-resilient rail infrastructure. Additional characteristics for rail include:
• Rails designed to provide for increased thermal expansion, and adapted maintenance procedures, warning systems and management procedures where buckling of rails and rail track movements might occur.
• Improved air conditioning, cooling systems or natural ventilation for underground tunnels, vehicles and metro stations, including temperature monitoring, and adequate power supply.
• Improved maintenance and enhanced monitoring of earthworks, and subgrade material to ensure stability after intense precipitation.
• Enhanced design standards for stations, bridges, flyovers, electrified tracks with overhead cables, train platforms, street lighting and signs and other rail-side infrastructure for expected increases of wind speeds and heavy rains.

ENV/EPOC/WPCID(2012)3
75
• Wind fences for open rail infrastructure.
• Circuit breaker protection for overhead lines.
• Signalling equipment and other electronic systems designed for increased occurrence of lightning strikes.
Public transportation vehicles operating on roads or rails become climate-resilient through features such as:
• Measures to deal with increased temperatures and heat waves such as large, but safe, opening windows, tinted windows to protect from the sun, white painted roofs, improved thermal insulation; cooling systems and air conditioning (ideally without F-gases).
• Vehicles with overhead power supply designed for higher electrical demand (for air conditioning) and with capacity to withstand higher wind speeds.
• New design standards to withstand higher temperatures and prevent wearing off or melting of tires, and overheating of equipment, such as diesel engines.
• Drivers trained for extreme weather conditions, e.g. following managed speed limits in bad weather, and familiar with emergency planning procedures.
Climate-resilient waterways have:
• Port facilities and coastal waterways protected by enhanced food defences such as sea walls, and coastal wetland buffers.
• Regularly maintained waterways, prevented from clogging by increased aquatic vegetation related to higher temperature or more frequent heat waves; and dredged of silt deposits that may occur after extreme rainfall.
• Changes to navigation routes or augmented water flows on waterways where droughts decrease water availability.
• Bridges designed to give adequate clearance with higher levels of flooding.
• Increased structural monitoring and maintenance of waterways to alleviate higher frequency of storm damage.

ENV/EPOC/WPCID(2012)3
76
APPENDIX 2. OECD PRINCIPLES FOR PRIVATE SECTOR PARTICIPATION IN INFRASTRUCTURE
1. Deciding on public or private provision of infrastructure services
Principle 1: The choice by public authorities between public and private provision should be based on cost-benefit analysis taking into account all alternative modes of delivery, the full system of infrastructure provision, and the projected financial and non-financial costs and benefits over the project lifecycle.
Principle 2: No infrastructure project – regardless of the degree of private involvement – should be embarked upon without assessing the degree to which its costs can be recovered from end-users and, in case of shortfalls, what other sources of finance can be mobilised.
Principle 3: The allocation of risk between private parties and the public sector will be largely determined by the chosen model of private sector involvement, including the allocation of responsibilities. The selection of a particular model and an associated allocation of risk should be based upon an assessment of the public interest.
Principle 4: Fiscal discipline and transparency must be safeguarded, and the potential public finance implications of sharing responsibilities for infrastructure with the private sector fully understood.
2. Enhancing the enabling institutional environment
Principle 5: A sound enabling environment for infrastructure investment, which implies high standards of public and corporate governance, transparency and the rule of law, including protection of property and contractual rights, is essential to attract the participation of the private sector.
Principle 6: Infrastructure projects should be free from corruption at all levels and in all project phases. Public authorities should take effective measures to ensure public and private sector integrity and accountability and establish appropriate procedures to deter, detect and sanction corruption.
Principle 7: The benefits of private sector participation in infrastructure are enhanced by efforts to create a competitive environment, including by subjecting activities to appropriate commercial pressures, dismantling unnecessary barriers to entry and implementing and enforcing adequate competition laws.
Principle 8: Access to capital markets to fund operations is essential to private sector participants. Restrictions in access to local markets and obstacles to international capital movements should, taking into account macroeconomic policy considerations, be phased out.

ENV/EPOC/WPCID(2012)3
77
3. Goals, strategies and capacities at all levels
Principle 9: Public authorities should ensure adequate consultation with end-users and other stakeholders including prior to the initiation of an infrastructure project.
Principle 10: Authorities responsible for privately-operated infrastructure projects should have the capacity to manage the commercial processes involved and to partner on an equal basis with their private sector counterparts
Principle 11: Strategies for private sector participation in infrastructure need to be understood, and objectives shared, throughout all levels of government and in all relevant parts of the public administration.
Principle 12: Mechanisms for cross-jurisdictional co-operation, including at the regional level, may have to be established.
4. Making the public-private co-operation work
Principle 13: To optimise the involvement of the private sector, public authorities should communicate clearly the objectives of their infrastructure policies and they should put in place mechanisms for consultations between the public and private partners regarding these objectives as well as individual projects.
Principle 14: There should be full disclosure of all project-relevant information between public authorities and their private partners, including the state of pre-existing infrastructure, performance standards and penalties in the case of non-compliance. The principle of due diligence must be upheld.
Principle 15: The awarding of infrastructure contracts or concessions should be designed to guarantee procedural fairness, non-discrimination and transparency.
Principle 16: The formal agreement between authorities and private sector participants should be specified in terms of verifiable infrastructure services to be provided to the public on the basis of output or performance based specifications. It should contain provisions regarding responsibilities and risk allocation in the case of unforeseen events.
Principle 17: Regulation of infrastructure services needs to be entrusted to specialised public authorities that are competent, well-resourced and shielded from undue influence by the parties to infrastructure contracts.
Principle 18: Occasional renegotiations are inevitable in long-term partnerships, but they should be conducted in good faith, in a transparent and non-discriminatory manner.
Principle 19: Dispute resolution mechanisms should be in place through which disputes arising at any point in the lifetime of an infrastructure project can be handled in a timely and impartial manner.

ENV/EPOC/WPCID(2012)3
78
5. Encouraging responsible business conduct
Principle 20: Private sector participants in infrastructure should observe commonly agreed principles and standards for responsible business conduct.
Principle 21: Private enterprises should participate in infrastructure projects in good faith and with a commitment to fulfill their commitments.
Principle 22: Private sector participants, their subcontractors and representatives should not resort to bribery and other irregular practices to obtain contracts, gain control over assets or win favors, nor should they accept to be party to such practices in the course of their infrastructure operations.
Principle 23: Private sector participants should contribute to strategies for communicating and consulting with the general public, including vis-à-vis consumers, affected communities and corporate stakeholders, with a view to developing mutual acceptance and understanding of the objectives of the parties involved.
Principle 24: Private sector participants in the provision of vital services to communities need to be mindful of the consequences of their actions for those communities and work, together with public authorities, to avoid and mitigate socially unacceptable outcomes.

ENV/EPOC/WPCID(2012)3
79
APPENDIX 3. DEFINITIONS OF GROSS FIXED CAPITAL FORMATION
(Descriptions from the System of National Accounts, 1993)
Gross fixed capital formation is measured by the total value of a producer’s acquisitions, less disposals, of fixed assets during the accounting period plus certain additions to the value of non- produced assets (such as subsoil assets or major improvements in the quantity, quality or productivity of land) realised by the productive activity of institutional units.
Dwellings (AN.1111)
Buildings that are used entirely or primarily as residences, including any associated structures, such as garages, and all permanent fixtures customarily installed in residences. Houseboats, barges, mobile homes and caravans used as principal residences of households are also included, as are historic monuments identified primarily as dwellings. Costs of site clearance and preparation are also included. Examples include products included in Central Product Classification (CPC) class 5211, residential buildings and CPC group 387, prefabricated buildings, such as one- and two-dwelling buildings and other residential buildings intended for nontransient occupancy. Uncompleted dwellings are included to the extent that the ultimate user is deemed to have taken ownership, either because the construction is on own-account or as evidenced by the existence of a contract of sale/purchase. Dwellings acquired for military personnel are included because they are used, as are dwellings acquired by civilian units, for the production of housing services.
Other buildings and structures (AN.1112)
Non-residential buildings and other structures, as defined below. Uncompleted buildings and structures are included to the extent that the ultimate user is deemed to have taken ownership, either because the construction is for own use or as evidenced by the existence of a contract of sale/purchase. Buildings and structures acquired for military purposes are included to the extent that they resemble civilian buildings acquired for purposes of production and are used in the same way.
Non-residential buildings (AN.11121)
Buildings other than dwellings, including fixtures, facilities and equipment that are integral parts of the structures and costs of site clearance and preparation. Historic monuments identified primarily as non-residential buildings are also included. Examples include products included in CPC class 5212, non-residential buildings, such as warehouse and industrial buildings, commercial buildings, buildings for public entertainment, hotels, restaurants, educational buildings, health buildings, etc.
Other structures (AN.11122)
Structures other than buildings, including the cost of the streets, sewers and site clearance and preparation other than for residential or non- residential buildings. Also included are historic monuments for which identification as dwellings or non-residential buildings is not possible and shafts, tunnels and other structures associated with mining subsoil assets. (Major improvements to land, such as dams and dykes for

ENV/EPOC/WPCID(2012)3
80
flood control, are included in the value of land.) Examples include products included in CPC group 522, civil engineering works, such as highways, streets, roads, railways and airfield runways; bridges, elevated highways, tunnels and subways; waterways, harbours, dams and other waterworks; long-distance pipelines, communication and power lines; local pipelines and cables, ancillary works; constructions for mining and manufacture; and constructions for sport and recreation
Transport equipment (AN.11131)
Equipment for moving people and objects. Examples include products other than parts included in CPC division 49, transport equipment, such as motor vehicles, trailers and semitrailers; ships; railway and tramway locomotives and rolling stock; aircraft and spacecraft; and motorcycles, bicycles, etc.
Other machinery and equipment (AN.11132)
Machinery and equipment not elsewhere classified. Examples include products other than parts included in CPC divisions 43, general purpose machinery; 44, special purpose machinery; 45, office, accounting and computing equipment, 46, electrical machinery and apparatus, 47, radio, television and communication equipment and apparatus; and 48, medical appliances, precision and optical instruments, watches and clocks. Other examples are products other than parts included in CPC groups 337, fuel elements (cartridges) for nuclear reactors; 381, furniture; 383, musical instruments; 384, sports goods; and 423, steam generators except central heating boilers.
Cultivated assets are livestock for breeding (including fish and poultry), dairy, draught, etc and vineyards, orchards and other plantations of trees yielding repeat products that are under the direct control, responsibility and management of institutional units.
Intangible fixed assets are non-financial produced fixed assets that mainly consist of mineral exploration, computer software, entertainment, literary or artistic originals intended to be used for more than one year

ENV/EPOC/WPCID(2012)3
81
APPENDIX 4. ESTIMATES OF FUTURE INFRASTRUCTURE COSTS
Table A4.1. Estimated average annual world infrastructure expenditure (additions and renewal) for selected sectors, 2000-30, in USD Bn and as a percentage of world GDP
Type of infrastructure 2000-10
Approximate % of world GDP
2010-20 Approximate % of world GDP
2020-30 Approximate % of world GDP
Road Rails Telecoms1 Electricity2 Water1,3
220 49 654 127 576
0.38 0.09 1.14 0.22 1.01
245 54 646 180 772
0.32 0.07 0.85 0.24 1.01
292 58 171 241 1037
0.29 0.06 0.17 0.24 1.03
Total 1626 2.84 1897 2.49 1799 1.79
Notes: 1. Estimates apply to the years 2005, 2015, and 2025 2. Transmission and distribution only 3. Only includes OECD countries, Russia, China, India and Brazil.
Source: Table 1.1 from OECD 2006b.
Table A4.2. Estimated average annual global expenditures for strategic transport infrastructure, 2009-30, in USD Bn
Average Annual Investment (USD billion)
2009-2015 2015-2030 Airports capital expenditure 70 120 Port infrastructure facilites capital expenditure 33 40 Rail ‘new construction’ (incl. maintenance) 130 270 Oil and Gas – transport & distribution 155 155 Total 388 585
Source: Adapted from Table 2.1 of OECD, 2012.
Table A4.3. Estimated average annual global expenditures under a 6 degrees-C climate change scenario, 2010-50, in USD Bn
2010-2020 2021-2030 2031-50 Power 590 650 795 Buildings 320 390 455 Industry 280 230 220 Transport (total vehicle) 3,300 4,480 6,865 Total investment 4,490 5,750 8,335
Source: Adapted from IEA, Energy Technology Perspectives 2012 publication, (forthcoming).

ENV/EPOC/WPCID(2012)3
82
Table A4.4. Estimated average annual global expenditures required to limit climate change to 2 degrees-C, 2010-50, in USD Bn
2010-2020 2021-2030 2031-50
Power Generation 650 870 1,035 Buildings 620 690 735 Industry 310 270 270 Transport (total vehicle) 3,370 4,730 7,495 Total investment 4,950 6,560 9,535
Source: Adapted from IEA, Energy Technology Perspectives 2012 publication, (forthcoming).

ENV/EPOC/WPCID(2012)3
83
APPENDIX 5. POLICIES FOR ENCOURAGING PENSION FUNDS TO INVEST IN INFRASTRUCTURE
To increase direct investment by pension funds in infrastructure, policy actions should address the three categories of barriers discussed in Chapter 3 (Della Croce, 2011): 1) Increased investment opportunities will be aided by establishing stable, long-term infrastructure programmes, with projects structured to be more attractive for pension funds, with use of risk transfer mechanisms and financial incentives (e.g. tax incentives or other transfers) where necessary and justified. 2) Investor capability can be enhanced by establishing appropriate regulatory, supervisory and tax frameworks; improved knowledge by fund trustees; and greater collaborative and resource pooling, for smaller fund companies. Greater transparency in business models and offerings of long-term investment vehicles will also help to better align the interests of pension funds and the infrastructure industry. The prudential regulatory frameworks need to be adjusted towards long term investment. 3) Further improvements in the conditions for investment would be achieved by independent data collection, fostering of expertise at universities and other learning institutions; and improving conditions for international investors to compete in local markets; and increased dialogue between governments, investors and the infrastructure industry.
Table A5.1 Policies for Encouraging Pension Funds to Invest in Infrastructure
Objective Policy Action
1. The Investment Opportunities
Support stable and accessible programme of infrastructure projects
• Development of national, long-term policy frameworks for key individual infrastructure sectors to provide greater transparency and investor certainty.
• Improve integration of the different levels of government in the design, planning and delivery of infrastructures through the creation of infrastructure agency/bank.
• Creation of a national infrastructure pipeline. • Ensure regulation stability.
Structure projects as attractive investment opportunities for pension funds
• Appropriate transfer of risk (e.g. through new financial instruments). • Establishing equity funds to finance Infrastructure projects (e.g. Marguerite
Fund). • Development of debt capital markets to finance infrastructure.
2. The Investor Capability
Create the necessary preconditions for the development of institutional investors
• Governments need to establish the appropriate regulatory, supervisory and tax frameworks for institutional investors to develop.
Better Pension Fund Governance
• Improve trustee composition and knowledge (see for example OECD Guidelines for Pension Fund Governance).
Table A5.1 continued over page.

ENV/EPOC/WPCID(2012)3
84
Table A5.1 continued
Foster collaborative strategies and resource pooling
• Support consolidation of smaller funds, pooling of funds.
Better alignment of interests between pension funds and the infrastructure industry
• Regulatory frameworks and OECD guidelines to favour transparency in business models and alignment of interests.
Adjust the prudential regulatory framework towards long term investment
• Reform of funding regulation for defined benefit schemes to make them more counter-cyclical.
• Change in pension accounting rules. • Ease quantitative investment restrictions, e.g. remove upper limits on
investments in specific asset classes that apply in some countries.
3. The Conditions for Investment
Enhance the Investment Environment
• Independent data collection and common performance measures. • Support of universities or other institutions to provide the right expertise to
investors. • Ensure a level playing field for competition with international investors.
Dialogue among parties
• Association of infrastructure investors able to bring forward institutional investors interests.
• Create a platform for dialogue between investors, financial industry and governments.
Source: Adapted from Della Croce, 2011.

ENV/EPOC/WPCID(2012)3
85
APPENDIX 6. OECD RECOMMENDATIONS FOR PUBLIC GOVERNANCE OF PPPS
A. Establish a clear, predictable and legitimate institutional framework supported by competent and well-resourced authorities
1. PPPs need to be addressed at the highest level of policymaking and citizens need to be consulted to ensure a consistent and legitimate framework for PPPs. The political leadership should ensure public awareness of the relative costs, benefits and risks of PPPs and conventional procurement. Popular understanding of PPPs requires active consultation and engagement with stakeholders as well as involving end-users in defining the project and subsequently in monitoring service quality.
2. Entrust the procurement and audit of PPPs, as well as relevant regulation, to competent authorities. Procuring authorities, the Supreme Audit Institution and sector regulators have to be entrusted with clear mandates with regards to PPPs.
3. Ensure that the necessary resources and capacities are present in the public sector to assist the competent authorities. Given the complexity of PPPs and their infrequent use, critical skills to ensure value for money may need to be concentrated in a PPP Unit that is made available to the relevant authorities.
4. Ensure that all significant regulation affecting the operation of PPPs is clear, transparent and enforced. Red tape should be minimised and new and existing regulation should be carefully evaluated.
B. Ground the selection of PPPs in Value for Money
5. All investment projects should be prioritised at the political level. The decision to invest should be based on a whole of government perspective and be separate from how to procure and finance the project. There should be no institutional, procedural or accounting bias either in favour of or against PPPs.
6. Carefully investigate which investment method is likely to yield most value for money. Key risk factors and characteristics of specific projects should be evaluated by conducting a procurement option pre-test. A procurement option pre-test should enable the government to decide on whether it is prudent to investigate a PPP option further.
7. Transfer the risks to those that manage them best. Risk should be defined, identified and measured and carried by the party for whom it costs the least to prevent the risk from realising or for whom realised risk cost the least.
8. Value for money should be maintained during operation, renegotiation and exit. Events that may undermine the project need to be examined carefully to establish whether they are unforeseen or realisation of risk. Any re-negotiation should be made transparently and subject to the ordinary procedures of PPP approval.

ENV/EPOC/WPCID(2012)3
86
9. Value for money requires sufficient competition. Government should ensure there is sufficient competition in the market by a competitive tender process and by possibly structuring the PPP program so that there is an ongoing functional market. Where competition is absent, once the contract has been awarded, the market should at least be contestable.
C. Use the budgetary process transparently in order to minimise fiscal risks and ensure the integrity of the procurement process
10. In line with the government’s fiscal policy the Central Budget Authority should ensure that the project is affordable and the overall investment envelope is sustainable.
11. The project should be treated transparently in the budget process. The budget documentation must disclose all costs and contingent liabilities. Special care should be taken to ensure budget transparency of PPPs covers the whole public sector.
12. Guard against waste and corruption by ensuring the integrity of the procurement process. The necessary procurement skills and powers must be made available to the relevant authorities.