working paper series · ecineq 2016 - 389 january 2016 what do germans think and know about income...
TRANSCRIPT

ECINEQ WP 2016 - 389
Working Paper Series
What do Germans think and know about
income inequality? A survey experiment
Carina Engelhardt
Andreas Wagener

ECINEQ 2016 - 389January 2016
www.ecineq.org
What do Germans think and know about
income inequality? A survey experiment
Carina Engelhardt†
Andreas Wagener
University of Hannover, Germany
Abstract
Germans are unable to assess their own position in the income distribution of their countryand do not know much about income inequality and stratification. They are well aware oftheir ignorance. Germans would prefer society to be more egalitarian than they perceive it.Providing accurate information about the income distribution does not change this preferencefor more redistribution – except among those who learn that they are net contributors in theGerman tax-transfer system.
Keywords: Biased perceptions, preferences for redistribution, Germany.
JEL Classification: H53, D72, D31.
†Contact details: Leibniz University of Hannover, School of Economics and Management,Koenigsworther Platz 1, 30167 Hannover, Germany. E-mail addresses: [email protected];[email protected].
1 Introduction
What do Germans know and think about income inequality in their country? In a nutshell:they do not know much. In particular, they do not know their own position in the incomedistribution. They know that they do not know much – but across all income groups theythink that inequality should be reduced. They do not change their minds when they learnmore about inequality – only those who learn that they are net contributors to the tax transfersystem become less supportive of more redistribution.
These are the main observations from a survey experiment on the perceptions and preferencesof Germans with respect to income inequality and redistribution that we conducted in early2015 and that we report in this paper. While there is some international evidence (surveyed inSection 2) that perceived inequality does not coincide with measured, “objective” inequality,a detailed analysis for Germany has, to our knowledge, not been available so far.
We conducted a survey in a representative sample of 1,100 German households that includedtwo randomized information treatments (see Section 3). Participants were asked for the in-come of their household, for their perceived own rank in the German income distribution, fortheir opinions on the current level of inequality and about their perceptions and preferencesof social stratification.
Our first observation is that survey respondents systematically fail to locate their own posi-tion in the income scale even roughly. Relatively poor respondents tend to overestimate theirown rank while relatively rich respondents tend to underestimate their relative income. Thissuggests that the income distribution is perceived to be far more equalized than it actually is.When respondents were asked which of several stylized shapes best describes the Germansociety today, they were right only slightly more often than by chance.
An unexpected second observation is that respondents across all income groups asked formore redistribution. Not only was this preference omnipresent – its strength is fairly constantacross income deciles. Moreover, asked for their most-preferred pattern of stratification,respondents selected the most egalitarian ones out of the choices we gave them.
In two information treatments we checked how far redistributive preference are driven bybiased perceptions. The treatment group was informed about their true position in the in-come distribution. This information did not alter preferences for redistribution, though. Ina second step, members of the (first) treatment group were informed whether they were netcontributors to, or net beneficiaries from, the tax-transfer system in Germany. Respondentswho learned that they were losing from redistribution asked for less redistribution afterwards.
The rest of this paper is organized as follows: Section 2 embeds our survey experimentand its findings into the extant literature. Section 3 describes the survey and our sample.Section 4 documents the biases in the self-assessment of income positions. Section 5 turnsto the strong preferences for redistribution, both before and after informational treatment.Perceptions of and preferences for social stratification are discussed in Section 6. Section 7shows that pocketbook attenuate preferences for redistribution. Some conclusions are offeredin Section 8. Additional material is collected in an Appendix.
1
ECINEQ WP 2016 - 389 January 2016

2 Related literature
Our survey experiment on the correlations between (mis-)perceptions of inequality and viewson redistribution is related to a number of contributions in the literature.
Similar surveys: To the best of our knowledge, studies similar to ours so far only exist forSweden and Argentina. Cruces et al. (2013) collected data on household incomes and on theself-assessments of income ranks in the Argentine income distribution. Their study finds thatthe relatively poor tend to overestimate their relative positions while the relatively rich tendto underestimate theirs. When biased subjects were confronted with accurate information,(only) the preferences of the relatively poor changed in the direction of calling for moreredistribution. Karadja et al. (2014) ran a similar survey experiment for Sweden. Roughlythree quarters of their respondents missed their relative position by more than 10 percentagepoints, and 92 % of this group underestimated their position. An information treatment waslargely ineffective; only conservative respondents who learnt that they were richer than theythought demanded less redistribution.
Apart from transferring the setting to Germany, our study differs from Cruces et al. (2013)and Karadja et al. (2014) by including assessments of social stratification (for a motivation,see below) and pocketbook concerns. The gist of our results – the poor think they are richerand vice versa, and better information does not change minds – is, however, in line withprevious observations.
Misperceptions of inequality: Our survey respondents substantially misperceive the in-come distribution in Germany: they systematically fail to locate their own position on theincome scale and they get the assessment of the (stylized) social stratification in Germanyright only slightly more often than by mere chance. Such misperceptions on income in-equality are not uncommon, irrespective of how (perceived) inequality is measured.1 Usingperceived wage differences between various occupations, Osberg and Smeeding (2006) finda massive underestimation of wage inequality in the US. Kenworthy and McCall (2008)calculate perceived relative wage levels for different countries and show that perceived andactual time trends of inequality are inconsistent. Norton and Ariely (2011) exhibit a dramaticunderestimation of weatlh inequality in the US population. Engelhardt and Wagener (2014)construct hypothetical perceived income distributions for 26 OECD countries by aggregatingthe self-positioning among ISSP respondents; they find that the inequality in these perceiveddistributions is considerably below actual inequality.
Not all studies find that populations underestimate inequality in their societies. Using theISSP question which type of society, visualized by rhomb- or pyramid-shaped graphs, best
1Popular misperceptions also prevail with other issues (inflation, corruption, risks etc.). See Stevensonand Duch (2013) for a discussion. A potential common root is that individuals make inferences about objectivereality from the limited sample of their own experiences and observations. For example, their reference group –relatives, friends, neighbours and colleagues – is typically not a cross-section of society but less heterogenous.This biased and limited availability of social comparison leads to biased inferences (e.g. Evans and Kelley,2004; Runciman, 1966).
2
ECINEQ WP 2016 - 389 January 2016

describes the society respondents were living in, Niehues (2014) and Gimpelson and Treis-man (2015) show that knowledge of social stratification is low, but involves an overestimationof inequality. This suggests that studies based on individual incomes, wages or wealth andthe attending self-positioning biases observe an underestimation of inequality while studiesusing perceived social stratification detect an overestimation of inequality. Both approaches,labelled the “comparative” and the “normative” view in D’Ambrosio and Clark (2015), dif-fer conceptually: the first presupposes that the perceived structure of the society (or at leastof its income distribution) is derived from one’s own position, relative to some referencegroup. By contrast, the second approach operates with the structure of society as a wholeand does not require that individuals position themselves in the perceived or desired society.We combine both approaches in our survey – and indeed confirm for Germany that biases gointo different directions.
Information treatments: Methodologically, our survey design follows a strand of litera-ture that uses information as an experimental treatment in a field setting. Some studies sup-port the knowledge gap theory proposed by Tichenor et al. (1970), arguing that differencesin decision quality are, to some degree, based on different levels of knowledge. For example,Duflo and Saez (2003) shows this with regard to retirement plans and Jensen (2010) withregard to educational decisions. Other studies provide evidence for the knowledge-behaviorgap theory, due to Hornik (1989), positing that additional information will only affect deci-sions and actions if it successfully changes the underlying beliefs, habits, emotions etc. onwhich decisions are based.
Our results indicate – in line with knowledge-behavior gap theory – that information doesnot suffice to change minds; what matters is whether beliefs or constraints are addressed bythe information treatment.
3 Survey and sample
3.1 The survey
The online survey was conducted in February 2015 and interviewed a random sample of1,100 households in Germany. Data collection was performed by Norstat company.2 Allparticipants were asked for their incomes, for a set of individual and household characteris-tics and general political attitudes as well as for their their views and knowledge on incomeinequality in Germany. Two informational treatments (detailed below) followed.
In terms of income, we asked respondents for the average monthly income of their house-hold in 2014.3 To enable respondents to make meaningful comparisons of households of
2Norstat is a market research company (http://opinion-people.com/de). Participants in Norstat panels cancollect points that can be exchanged for money.
3In 2015 – the survey year – a minimum wage was implemented in Germany. Therefore, we restrict ouranalysis to the previous period to avoid (unknown) biases resulting from this reform.
3
ECINEQ WP 2016 - 389 January 2016
different size, we broadly explained to them the concept of equivalent incomes, and theninformed them about their monthly net household income corrected by the modified OECDequivalence weight. We then asked them:
“What do you think, how many households in Germany have an equal or lowerstandard of living than yours?”
Response categories were given in deciles. We then compared respondents’ perceived decileto their actual income decile. These objective deciles were calculated from the boundaries ofdeciles of the German monthly net household income distribution, corrected by the modifiedOECD equivalence weights, based on the then most recent German Socio-Economic Panel(GSOEP 2012, (v29)).
Social stratification was expressed by five different stylized types of society (for details seeSection 6). We introduced them to our respondents and asked them to state which type bestdescribes German society today and of which type Germany ought to be.
The experiment proceeded as follows: after a first set of questions on attitudes toward in-come inequality and social stratification, incomes, and self-assessment in the income dis-tribution for everybody, we randomly split the group of participants into two halves whowould continue with different questionnaires. Each questionnaire again posed questions onrespondents’ preferences for redistribution and social stratification, but they differed in theamount of information we provided to participants: before we asked them to (re-)state theirpreferences, individuals in the treatment group were informed about the income distribution,their actual relative position and their self-positioning bias; the control group did not get anysuch information.
Our design is inspired by the information treatment in Cruces et al. (2013), but we providedthe treatment group with detailed information about the actual income distribution, theirrelative position in it and which income belongs to the relative position they estimated to beassociated with. All information was given graphically and in written.
To test the role of self-interest and pocketbook concerns we implemented, within the firsttreatment group, a second information treatment. Here, we informed respondents whetherthey are (likely to be) a net payer or net beneficiary from the German tax-transfer system.This information does not target at respondents’ beliefs but at their budget constraints.
Our design allows us to use difference-in-differences approaches when assessing outcomes.We included two information treatments to check the robustness of the stated preferences for(more) redistribution. In Sections 4 and 6 we will report on the first information treatment.The second treatment will be dealt with in Section 7.
3.2 The sample
Our survey was quoted according to age and gender, which consequently lead to a represen-tative age structure in the sample. Around 92 % of the respondents were born in Germany.
4
ECINEQ WP 2016 - 389 January 2016

Our sample is slightly more educated and their mean income is lower than in the generalpopulation (probably because the sample did not include earners of very high incomes). Acomparison of selective main characteristics between the general German population and oursurvey sample can be seen in Table A.2 in the Appendix.
We dropped the first (net income below 400e) and the hundredth percentile (net incomeabove 5000e) from our sample for data cleaning reasons. The remaing sample consistsof 859 observations. The left-hand panel of Figure 1 shows the income distribution of oursample by income deciles, taken from the German Socio-Economic Panel (GSOEP, v29). Afully representative sample should exhibit a 10 % density in every decile. In our sample,low income deciles are somewhat overrepresented, while high income deciles are underrep-resented. Otherwise the inaccuracies in the distribution of incomes are negligible.
To capture potential correlates of attitudes towards redistribution, we constructed a numberof variables for our sample.4 To measure whether the availability of social comparisonsshapes perceptions and positions on income inequality, we defined dummy variable (refer-ence group) with value of one when a respondent stated that his/her reference group encom-passes all social classes.5. This holds for 13 % of respondents; 26 % state to be mainly incontact with the lower class, 62 % with the middle class, and 3 % with the upper class.
Bartels (2005, 2008) argue that perceptions of inequality are systematically shaped by po-litical ideology, with conservatives being less aware of (changes in) inequality, even whencontrolling for their general political knowledge. We let respondents self-locate their ideo-logical position on a scale from 1 (“left”) to 10 (“right”), from which we constructed variableideology.
The demand for redistribution can also be associated to individuals’ views on the fairness ofthe income distribution. Following Corneo and Grüner (2002), we asked respondents (as inthe ISSP) “How important is hard work for getting ahead in life?”, with five categories from“essential” to “not important at all”. We include this as a regressor (hard work), too.
Media consumption may be relevant, too. We asked respondents how often (daily, weekly,monthly, rarely, or never) they used different media (newspaper, TV, internet). 75% of re-spondents watch news in TV or read news in the internet daily, and 37% read a daily newspa-per. We constructed a variable informed to summarize all media usage, with greater numbersindicating higher levels of usage.
4 Biases in self-assessments
4.1 Measurement and descriptives
The right-hand part of Figure 1 shows the distribution of our respondents across (actual)income deciles, based on their self-assessments. This distribution is considerably less dis-
4Table A.1 in the Appendix provides a list of all (generated) survey variables.5We asked this question at the end of the survey, after having uncovered the actual type of society.
5
ECINEQ WP 2016 - 389 January 2016

persed than the objective one. Moreover, lower income groups tend to overestimate theirrelative income position while higher income groups tend to underestimate the relative in-come.
0.0
5.1
.15
.2D
ensi
ty
1 2 3 4 5 6 7 8 9 10Objective income decile
0.0
5.1
.15
.2D
ensi
ty1 2 3 4 5 6 7 8 9 10
Perceived own-income decile
Figure 1: Distribution of objective and perceived income decile.
We defined as variable bias the difference between perceived and actual decile. A negative[positive] bias indicates an underestimation [overestimation] of one’s income decile. Table 1provides a detailed picture of respondents’ self-positioning biases, sorted by actual incomedeciles. Column (1) shows that the average perceived own decile ranges from 3.106 (in thefirst decile) to 6.240 (in the tenth decile). In the middle of the income distribution the meanbias (column (2)) is relatively small, but it increases towards both ends. Perceptions of rela-tively poor respondents are positively based (columns (3) and (4)), while the relatively richtend to underestimate their relative income position which leads to negative biases (columns(5) and (6)). The distribution of biases is also shown in Figure A.1 in the appendix.
Table 1: Self-Positioning Bias by Income Decile(1) (2) (3) (4) (5) (6)
objective average perceived mean proportion with average proportion with averagedecile own decile bias positive bias positive bias negative bias negative bias
1 3.106 2.106 0.695 3.031 0.000 0.0002 3.330 1.330 0.582 2.547 0.154 -1.0003 3.725 0.725 0.418 2.684 0.319 -1.2414 4.055 0.055 0.397 1.828 0.438 -1.5315 4.174 -0.826 0.174 1.600 0.640 -1.7276 4.369 -1.631 0.131 1.455 0.810 -2.2507 4.695 -2.305 0.061 1.200 0.805 -2.9558 4.930 -3.070 0.012 1.000 0.965 -3.1939 4.947 -4.053 0.000 0.000 1.000 -4.05310 6.240 -3.760 0.000 0.000 1.000 -3.760
In Table 2 we report correlates of perceived deciles other than objective relative income.As can be seen in column (1), the objective income rank is a statistically highly significant
6
ECINEQ WP 2016 - 389 January 2016
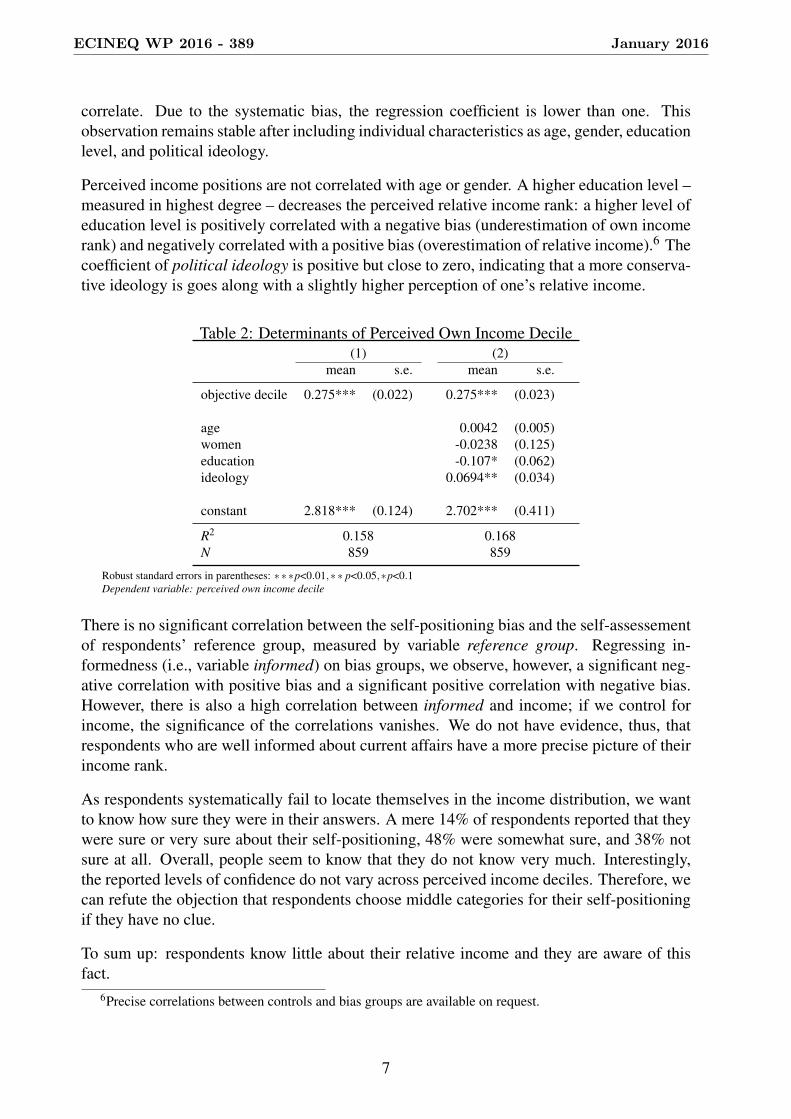
correlate. Due to the systematic bias, the regression coefficient is lower than one. Thisobservation remains stable after including individual characteristics as age, gender, educationlevel, and political ideology.
Perceived income positions are not correlated with age or gender. A higher education level –measured in highest degree – decreases the perceived relative income rank: a higher level ofeducation level is positively correlated with a negative bias (underestimation of own incomerank) and negatively correlated with a positive bias (overestimation of relative income).6 Thecoefficient of political ideology is positive but close to zero, indicating that a more conserva-tive ideology is goes along with a slightly higher perception of one’s relative income.
Table 2: Determinants of Perceived Own Income Decile(1) (2)
mean s.e. mean s.e.
objective decile 0.275*** (0.022) 0.275*** (0.023)
age 0.0042 (0.005)women -0.0238 (0.125)education -0.107* (0.062)ideology 0.0694** (0.034)
constant 2.818*** (0.124) 2.702*** (0.411)
R2 0.158 0.168N 859 859
Robust standard errors in parentheses: ∗∗∗p<0.01,∗∗ p<0.05,∗p<0.1Dependent variable: perceived own income decile
There is no significant correlation between the self-positioning bias and the self-assessementof respondents’ reference group, measured by variable reference group. Regressing in-formedness (i.e., variable informed) on bias groups, we observe, however, a significant neg-ative correlation with positive bias and a significant positive correlation with negative bias.However, there is also a high correlation between informed and income; if we control forincome, the significance of the correlations vanishes. We do not have evidence, thus, thatrespondents who are well informed about current affairs have a more precise picture of theirincome rank.
As respondents systematically fail to locate themselves in the income distribution, we wantto know how sure they were in their answers. A mere 14% of respondents reported that theywere sure or very sure about their self-positioning, 48% were somewhat sure, and 38% notsure at all. Overall, people seem to know that they do not know very much. Interestingly,the reported levels of confidence do not vary across perceived income deciles. Therefore, wecan refute the objection that respondents choose middle categories for their self-positioningif they have no clue.
To sum up: respondents know little about their relative income and they are aware of thisfact.
6Precise correlations between controls and bias groups are available on request.
7
ECINEQ WP 2016 - 389 January 2016

5 Preferences for redistribution
5.1 Initial preferences
Even before the self-assessments we had asked respondents about their general opinion onredistribution in Germany. Answers were coded in seven categories, ranging from 1 (“Thereis too much effort to equalize incomes.”) over 4 (“It is fine as it is.”) to 7 (“Income in-equality is far too high and should be reduced.”). An overwhelming majority of 83 % of therespondents asks for more redistribution (categories 5 to 7), 11 % are satisfied with the statusquo (category 4), and merely 6 % think there is too much income equalization in Germany(categories 1 to 3).
This is a strong and surprising observation, and we had a more detailed look at respondents’preferences for redistribution. We first study the mean preferences for redistribution by in-come deciles. 7 As can be seen in column (1) of Table 3, mean preferences for redistributionrange from 4.125 in the top perceived decile to 6.100 in the lowest perceived decile. This in-dicates that there is a quite uniform (average) preference for more redistribution and greaterincome equality across all deciles of perceived income (recall that 4 signifies a preference forthe status quo). Moreover, between the second and ninth decile, the average preferences forredistribution do not show much variation. Preferences are, thus, remarkably homogeneousacross income groups.
These observations are in harmony with the pattern that one gets from the International SocialSurvey Program (ISSP). Answers for Germany can be seen in Table A.4, column (1). Again,mean preferences are quite similar across perceived income deciles and virtually everybodyasks for more redistribution.8
5.2 Informed preferences
Preferences generally depend on the perceived relative position. If an information treatmentjust confirms individual perceptions, nothing should happen. But if the perception is initiallywrong and then corrected by an information treatment, preferences might be updated.
First insights emerge from columns (2) and (3) in Table 3.9 The columns report mean pref-erences for redistribution in the perceived income deciles for, respectively, treatment andcontrol group. Differences are small, and the values do not visibly differ from the replies tothe initial question, reported in column (1).
7We report results for perceived income decile because perceptions might matter more for political prefer-ences than the (unknown) actual position. Results for mean preferences in actual income deciles are reportedin Table A.3. They are qualitatively the same as for perceived deciles.
8Columns (2) and (3) in Table A.4 show that this phenomenon is not confined to Germany: the meanpreferences for redistribution by perceived income decile for Sweden and Argentina – the two countries forwhich comparable studies exist (Cruces et al. (2013) and Karadja et al. (2014)) – lie in a relatively small range,too.
9See columns (2) and (3) in Table A.3 for mean preferences by income decile.
8
ECINEQ WP 2016 - 389 January 2016

Table 3: (Mean) Preferences for Redistribution by Perceived Income Decile(1) (2) (3) (4)
initial 1st treatment 1st treatment 2nd treatmentpreferences (treated) (control) (of the treated)
perc. decile mean s.e. mean s.e. mean s.e. mean s.e.
1 6.100 (1.241) 6.243 (0.955) 5.906 (1.304) 6.162 (0.958)2 5.763 (1.319) 5.933 (1.087) 5.731 (1.430) 5.683 (1.308)3 5.730 (1.186) 5.702 (1.144) 6.048 (0.877) 5.606 (1.280)4 5.679 (1.212) 5.707 (1.250) 5.839 (1.059) 5.480 (1.379)5 5.430 (1.426) 5.347 (1.465) 5.500 (1.422) 5.236 (1.477)6 5.543 (1.456) 5.452 (1.418) 5.653 (1.451) 5.310 (1.490)7 5.592 (1.308) 5.714 (1.132) 5.765 (1.208) 5.476 (1.194)8 5.500 (1.767) 5.700 (1.342) 6.118 (1.054) 5.600 (1.603)9 6.000 (1.155) 6.500 (0.707) 7.000 (0.000) 6.000 (1.414)
10 4.125 (1.642) 4.250 (0.957) 4.250 (1.258) 3.750 (2.217)
To identify whether or not there is a treatment effect, we used both the simple first-differenceestimator as well as a difference in differences estimator. As our sample size is too small,we cannot meaningfully estimate potential treatment effects for each pair of perceived andfactual income decile. We therefore choose plausible larger subgroups and partitioned re-spondents into those who held no bias, a positive bias or a negative bias in their income as-sessment. For the “no-bias-respondents” the information treatment just confirms their beliefsand we, thus, do not expect any treatment effect. But the information treatment (truthfully)may change the beliefs of respondents with a bias.
Results are reported in Table 4. Columns (1) to (3) show the average preferences for redis-tribution of those who, respectively, underestimated, correctly assessed, and overestimatedtheir relative income positions. Panel A uses the full sample – and shows that the treatmentdid not generate any statistically significant effects, neither for simple differences nor fordifferences in differences.
A plausible explanation for the lack of effect is, of course, that our information treatment– which should make most respondents conclude that inequality is more pronounced thanthey initially thought – further cemented their strong preference for redistribution (recall thatmore than 83% of the respondents stated a preference for more redistribution already at theoutset).
To check whether the information treatment at least impacted on those who had initially notbeen for more redistribution, we restrict our sample to these respondents. This shrinks thenumber of observations dramatically. However, as reported in Panel B of Table 4, we do notobserve any difference between control and treatment group.
In Panel C we restrict attention to respondents who initially held a large (i.e., above-average)bias, as these individuals might have had much reason to change their views, becoming awareof their great knowledge gap. Here, the first difference estimator in column (3) reports a sta-tistically significant difference of stated preferences between control and treatment group,which vanishes, however, when diff-in-diff is implemented. That the first difference is non-zero in a statistically significant way is, thus, likely to be an artefact of having systematic
9
ECINEQ WP 2016 - 389 January 2016

Table 4: (Perceived) Distribution and Preferences for Redistribution: Experimental Results
(1) (2) (3)Negative Bias No Bias Positive Bias
Panel A: Full Sample
Treatment group [obs.] 5.694 [248] 5.696 [69] 5.679 [131]Control group [obs.] 5.681 [220] 5.897 [68] 5.923 [118]Difference [s.e.] 0.012 [0.110] -0.201 [0.222] -0.244 [0.169]Diff-in-Diff [s.e.] 0.079 [0.162] -0.060 [0.332] 0.005 [0.242]
Panel B: Initial preference for less redistribution
Treatment group [obs.] 4.098 [41] 3.875 [16] 4.000 [24]Control group [obs.] 3.897 [39] 4.000 [8] 3.950 [20]Difference [s.e.] 0.200 [0.257] -0.125 [0.552] 0.050 [0.479]Diff-in-Diff [s.e.] 0.249 [0.329] -0.750 [0.697] -0.108 [0.570]
Panel C: Above average bias
Treatment group [obs.] 5.631 [122] 5.696 [69] 5.435 [46]Control group [obs.] 5.570 [114] 5.897 [68] 5.978 [45]Difference [s.e.] 0.061 [0.159] -0.201 [0.222] -0.543* [0.292]Diff-in-Diff [s.e.] 0.032 [0.235] -0.060 [0.332] -0.173 [0.427]
Panel D: Leftist attitude
Treatment group [obs.] 6.000 [78] 6.259 [27] 5.700 [40]Control group [obs.] 5.989 [90] 5.885 [26] 6.119 [42]Difference [s.e.] 0.011 [0.157] 0.375 [0.282] -0.419* [0.280]Diff-in-Diff [s.e.] 0.830 [0.237] -0.001 [0.414] -0.020 [0.427]
Panel E: Hard work is important
Treatment group [obs.] 5.677 [164] 5.636 [44] 5.677 [96]Control group [obs.] 5.711 [152] 5.744 [39] 6.108 [83]Difference [s.e.] -0.034 [0.133] -0.107 [0.309] -0.431** [0.189]Diff-in-Diff [s.e.] 0.045 [0.197] 0.013 [0.458] 0.007 [0.272]
Robust standard errors in parentheses. ∗∗∗: p < 0.01, ∗∗: p < 0.05, ∗: p < 0.1Dependent variable: preferences for redistributionInitial preferences for less redistribution: initial preference≤4Above average bias: bias > mean bias (pos. bias > 2.5 and neg. bias <−2.8)
10
ECINEQ WP 2016 - 389 January 2016
differences among those members in treament and control group who held a positive bias.Respondents with a leftist leaning (Panel D), do not show any treatment effect either. Nei-ther do those who attach great importance to hard work, i.e., who (initially) considered theprocess of income generation as fair (Panel E).
Hence, preferences for redistribution proved to be immune against our informative update.Still, 26 % of treatment group members change their preferences upon treatment (only 14 %in the control group). Thus, we indeed observe a higher variation of preferences in thetreatment group, but the difference is not statistically significant.10 By design, we cannot saywhy the treatment was ineffective: it might not have changed individuals’ perceptions or, ifit did, did not translate into changes in preferences for redistribution.
6 Perceived and preferred types of society
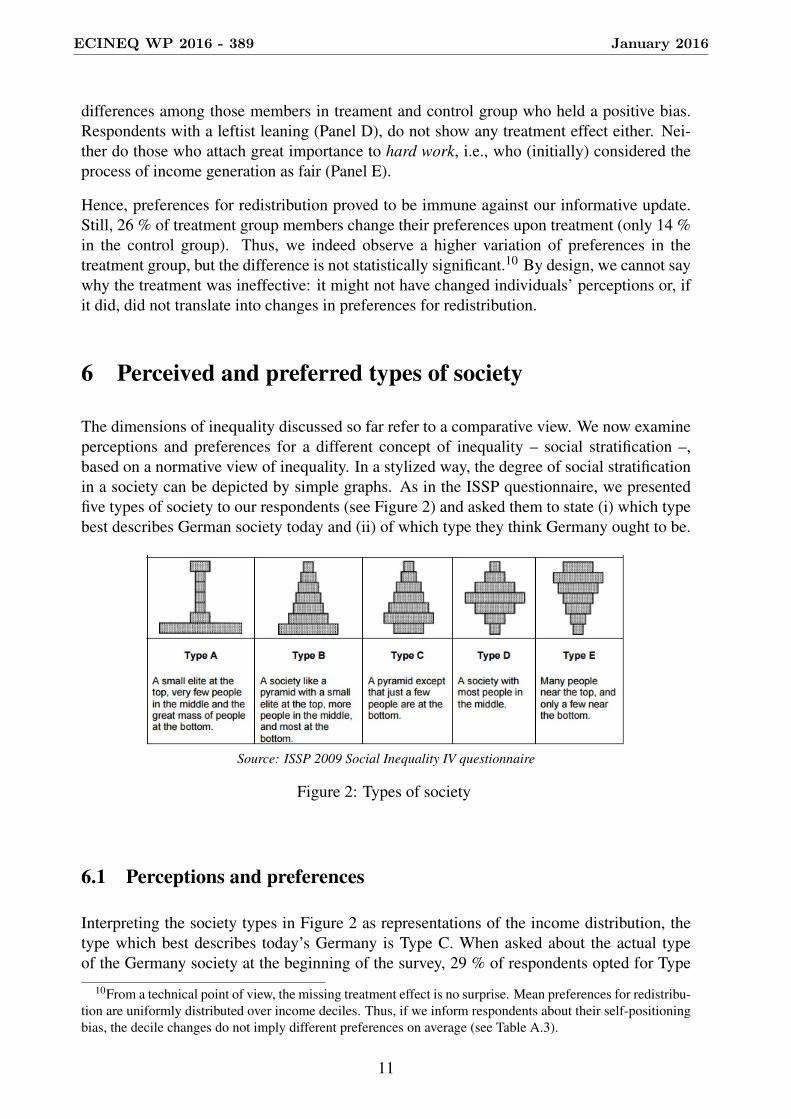
The dimensions of inequality discussed so far refer to a comparative view. We now examineperceptions and preferences for a different concept of inequality – social stratification –,based on a normative view of inequality. In a stylized way, the degree of social stratificationin a society can be depicted by simple graphs. As in the ISSP questionnaire, we presentedfive types of society to our respondents (see Figure 2) and asked them to state (i) which typebest describes German society today and (ii) of which type they think Germany ought to be.
Source: ISSP 2009 Social Inequality IV questionnaire
Figure 2: Types of society
6.1 Perceptions and preferences
Interpreting the society types in Figure 2 as representations of the income distribution, thetype which best describes today’s Germany is Type C. When asked about the actual typeof the Germany society at the beginning of the survey, 29 % of respondents opted for Type
10From a technical point of view, the missing treatment effect is no surprise. Mean preferences for redistribu-tion are uniformly distributed over income deciles. Thus, if we inform respondents about their self-positioningbias, the decile changes do not imply different preferences on average (see Table A.3).
11
ECINEQ WP 2016 - 389 January 2016

C (see column (1) in Table 5). About 57 % chose one of the more unequal Types A orB, and 15 % thought it was one of the more equal Types D or E. For reference, a randomchoice among these five types of society would lead to the right answer in 20 % of the time.I.e., the majority of respondents misjudge social stratification. Interestingly, they tend tooverestimate inequality.11
If we turn to the “What do you think Germany ought to be like”- question the picture reverses:more than 80 % of respondents think that the rather equal Types D and E are desirable (seecolumn (1) in Table 6). About 10 % vouch for Type C and a mere 7 % prefer the ratherunequal Types A and B.
6.2 Information treatment
Our treatment does not inform respondents about the actual type of the German society butonly provides additional information about the income distribution. Still, this could havehelped treated participants to improve their assessments. We therefore asked both the “is”and the “ought” question on stratification again, after the treatment. As can be seen fromTables 5 and 6 there are indeed small differences between treatment group (column (2)) andcontrol group (column (3)).
Table 5: What type of society is Germany today?(1) (2) (3)
initial 1st treatment 1st treatmenttype today (treated) (control)
Type A 21.65% 26.34% 21.90%Type B 34.92% 29.91% 32.36%Type C 28.52% 27.23% 30.90%Type D 10.71% 11.83% 9.49%Type E 4.19% 4.69% 5.35%
Table 6: What do you think Germany ought to be like?(1) (2) (3)
initial 1st treatment 1st treatmenttype preferred (treated) (control)
Type A 1.86% 2.01% 1.48%Type B 5.01% 4.91% 6.42%Type C 10.48% 13.39% 12.10%Type D 63.33% 62.28% 60.49%Type E 19.32% 17.41% 19.51%
11Verify from column (1) in Table A.5 that responses in our sample are in line with those in the ISSP 2009.The same holds for the “ought”-question; see column (2) in Table A.5.
12
ECINEQ WP 2016 - 389 January 2016
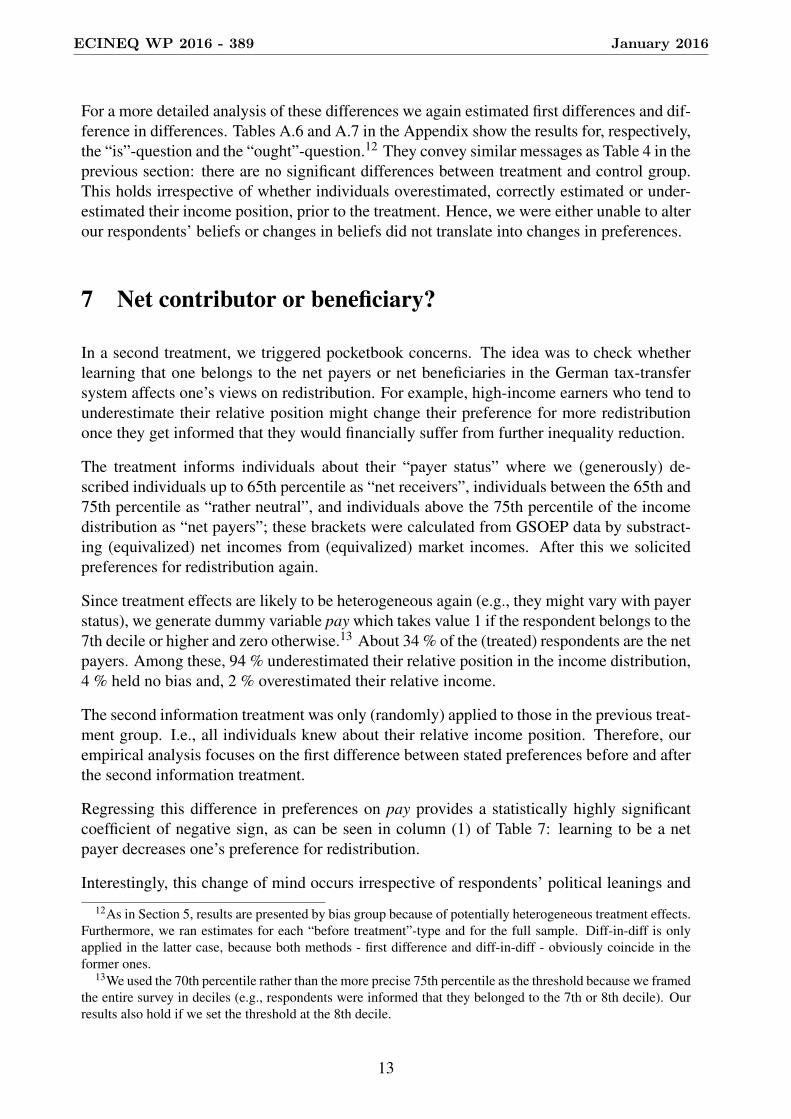
For a more detailed analysis of these differences we again estimated first differences and dif-ference in differences. Tables A.6 and A.7 in the Appendix show the results for, respectively,the “is”-question and the “ought”-question.12 They convey similar messages as Table 4 in theprevious section: there are no significant differences between treatment and control group.This holds irrespective of whether individuals overestimated, correctly estimated or under-estimated their income position, prior to the treatment. Hence, we were either unable to alterour respondents’ beliefs or changes in beliefs did not translate into changes in preferences.
7 Net contributor or beneficiary?
In a second treatment, we triggered pocketbook concerns. The idea was to check whetherlearning that one belongs to the net payers or net beneficiaries in the German tax-transfersystem affects one’s views on redistribution. For example, high-income earners who tend tounderestimate their relative position might change their preference for more redistributiononce they get informed that they would financially suffer from further inequality reduction.
The treatment informs individuals about their “payer status” where we (generously) de-scribed individuals up to 65th percentile as “net receivers”, individuals between the 65th and75th percentile as “rather neutral”, and individuals above the 75th percentile of the incomedistribution as “net payers”; these brackets were calculated from GSOEP data by substract-ing (equivalized) net incomes from (equivalized) market incomes. After this we solicitedpreferences for redistribution again.
Since treatment effects are likely to be heterogeneous again (e.g., they might vary with payerstatus), we generate dummy variable pay which takes value 1 if the respondent belongs to the7th decile or higher and zero otherwise.13 About 34 % of the (treated) respondents are the netpayers. Among these, 94 % underestimated their relative position in the income distribution,4 % held no bias and, 2 % overestimated their relative income.
The second information treatment was only (randomly) applied to those in the previous treat-ment group. I.e., all individuals knew about their relative income position. Therefore, ourempirical analysis focuses on the first difference between stated preferences before and afterthe second information treatment.
Regressing this difference in preferences on pay provides a statistically highly significantcoefficient of negative sign, as can be seen in column (1) of Table 7: learning to be a netpayer decreases one’s preference for redistribution.
Interestingly, this change of mind occurs irrespective of respondents’ political leanings and
12As in Section 5, results are presented by bias group because of potentially heterogeneous treatment effects.Furthermore, we ran estimates for each “before treatment”-type and for the full sample. Diff-in-diff is onlyapplied in the latter case, because both methods - first difference and diff-in-diff - obviously coincide in theformer ones.
13We used the 70th percentile rather than the more precise 75th percentile as the threshold because we framedthe entire survey in deciles (e.g., respondents were informed that they belonged to the 7th or 8th decile). Ourresults also hold if we set the threshold at the 8th decile.
13
ECINEQ WP 2016 - 389 January 2016

fairness perceptions: the sign and magnitude of preference changes when being informedabout one’s net payer status do not vary when we control for political attitudes and the hardwork-variable (see columns (2) and (3) in Table 7).
Table 7: Net Payer/Beneficiary and Preferences for Redistribution(1) (2) (3)
Coef. Std. Err. Coef. Std. Err. Coef. Std. Err.
pay -0.251*** (0.001) -0.251*** (0.073) -0.257*** (0.073)hard work -0.087 (0.074)ideology 0.017 (0.018)
constant -0.078* (0.042) -0.019 (0.066) -0.160 (0.101)
R2 0.026 0.029 0.028N 448 448 448
Robust standard errors in parentheses: ∗∗∗: p < 0.01, ∗∗: p < 0.05, ∗: p < 0.1Dependent variable: change in preferences = after-treatment preference minus before-treatment preference
8 Discussion and conclusion
All in all, our results show that Germans are poorly informed about their own relative income,that their perception of social stratification is just slightly better, and that they are aware oftheir ignorance. Still, they have outspoken preferences for more redistribution. A surprisingobservation from our survey are the stable and strong preferences for more redistributionacross all incomes.14 This is in contrast to what one would expect, in particular towards thetop of the income distribution and in a country with a full-fledged and highly progressivewelfare state.
Part of the puzzle might be resolved when noticing that the average survey participant fromincome deciles 8 to 10 locates herself between deciles 5 and 6 and, thus, holds a massivelynegative self-perception bias. Obviously, these comparatively rich people believe that thereis a considerable share of the population with (even) higher incomes – and that there are,thus, substantial resources available that could be redistributed downwards. Hence, addi-tional redistribution looks easily feasible. Moreover, underestimating their relative position,the upper income groups might not think of themselves as massive net contributors to redis-tributive schemes (some might even hope to benefit financially from redistribution), whichmakes a greater degree egalitarianism appear costless to themselves.15
Given their preference for more redistribution we expected that it would be mainly thoserelatively rich respondents who underestimate their actual income position who reacted to
14By contrast, Cruces et al. (2013, Figure 4) find a u-shaped pattern in the preference for more redistributionover the Argentinian income distribution.
15Observe from Table 3 that some respondents who believe to belong to the top deciles of the income distribu-tion indeed do ask for more redistribution (38 respondents locating themselves in the 8th decile, 4 respondentsin the 9th decile, and 8 in the 10th). Still there is no bias resulting from a potentially above-average leftistideology in this subsample.
14
ECINEQ WP 2016 - 389 January 2016

the information treatment by expressing lower enthusiasm for redistribution. This did nothappen, however. A tentative explanation – apart from the possibility that the informationtreatment did not help respondents to better understand inequality – would be that high-income earners indeed harbour sincere egalitarian or pro-poor preferences. Inferring fromthe information treatment how big the gap between rich and poor in Germany actually isor how low incomes in the poorer strata really are, might strengthen their desire for moreredistribution, even after taking potential pocketbook concerns into account.
Our results trigger the question why we do not observe more redistribution, given that allGermans seem to cherish it. Tentative answers are: first, the preference for more egali-tarianism is mostly cheap talk – if programs are actually proposed, pocketbook concernsoverride well-intentioned preference statements. Our experiment supports this explanation:already informational clues towards net payer status weaken the preference for redistribu-tion noticeably. Second, the “political system” (government, parliament, lobby groups etc.)holds different preferences on redistribution than the citizenry. Third, financial feasibilityand government budget constraints limit the scope for more redistribution, even if it weredesirable.
(Mis-)Perceptions of reality in the citizenry matter in democracies: normative views on thedesirability (or lack thereof) of policy changes – more or less redistribution, say – are shaped,among others, by perceptions of the status quo. Distorted perceptions might lead to biasedpolitical choices. The links between citizens’ views and preferences and actual redistributionpolicies certainly deserve greater attention.
ReferencesBartels, L. M., 2005. Homer gets a tax cut: Inequality and public policy in the American
mind. Perspectives on Politics 3, 15–31.
Bartels, L. M., 2008. Unequal Democracy: The Political Economy of the New Gilded Age.Princeton University Press, Princeton, NJ.
Corneo, G., Grüner, H.-P., 2002. Individual preferences for political redistribution. Journalof Public Economics 83, 83–107.
Cruces, G., Perez-Truglia, R., Tetaz, M., 2013. Biased perception of income distributionand preferences for redistribution: Evidence from a survey experiment. Journal of PublicEconomics 98, 100–112.
D’Ambrosio, C., Clark, A. E., 2015. Attitudes to income inequality: Experimental and sur-vey evidence. In: Atkinson, A. B., Bourguignon, F. (Eds.), Handbook of Income Distribu-tion. Vol. 2. North-Holland, Amsterdam etc., pp. 1147–1208.
Duflo, E., Saez, E., 2003. The role of information and social interactions in retirement plandecisions: Evidence from a randomized experiment. The Quarterly Journal of Economics118 (3), 815–842.
15
ECINEQ WP 2016 - 389 January 2016

Engelhardt, C., Wagener, A., 2014. Biased perceptions of income inequality and redistribu-tion. CESifo Working Paper No. 4838, CESifo, Munich.
Evans, M., Kelley, J., 2004. Subjective social location: Data from 21 nations. InternationalJournal of Public Opinion Research 16, 3–38.
Gimpelson, V., Treisman, D., 2015. Misperceiving inequality. NBER Working PaperNo. 21174, National Bureau of Economic Research, Cambridge, MA.
Hornik, R., 1989. The knowledge-behavior gap in public information campaigns: A devel-opment communication view. In: Salmon, C. T. (Ed.), Information Campaigns: BalancingSocial Values and Social Change. Sage, London, pp. 113–138.
Jensen, R., 2010. The (perceived) returns to education and the demand for schooling. Quar-terly Journal of Economics 125 (2), 515–548.
Karadja, M., Moellerstroem, J., Seim, D., 2014. Richer (and holier) than thou? The effectof relative income improvements on demand for redistribution. IFN Working Paper No.1042, Research Institute of Industrial Economics (IFN), Stockholm.
Kenworthy, L., McCall, L., 2008. Inequality, public opinion and redistribution. Socio-Economic Review 6, 35–68.
Niehues, J., 2014. Subjective perceptions of inequality and redistributive preferences: An in-ternational comparison. Discussion paper, Cologne Institute for Economic Research (IW),Cologne.
Norton, M. I., Ariely, D., 2011. Building a better America – one wealth quintile at a time.Perspectives on Psychological Science 6, 9–12.
Osberg, L., Smeeding, T., 2006. “Fair” inequality? Attitudes toward pay differentials: TheUnited States in comparative perspective. American Sociological Review 71, 450–473.
Runciman, W. G., 1966. Relative Deprivation and Social Justice: A Study of Attitudes toSocial Inequality in Twentieth-Century England. Routledge Kegan Paul, London.
Stevenson, R. T., Duch, R., 2013. The meaning and use of subjective perceptions in studiesof economic voting. Electoral Studies 32 (2), 305–320.
Tichenor, P. J., Donohue, G. A., Olien, C. N., 1970. Mass media flow and differential growthin knowledge. Public Opinion Quarterly 34 (2), 159–170.
16
ECINEQ WP 2016 - 389 January 2016

Appendix: Tables and figures
Table A.1: Variable Definitions and Descriptive StatisticsVariable Definition Mean SD.
equiv. household net income (Monthly) Net income divided by equivalence weight 1461.25 745.88based on the modified OECD scale.
objective income decile Respondent’s relative income rank corresponding 4.960 2.886to the deciles of the GSOEP v29 (equivalence weighted).
perceived own income decile Respondent’s stated perceived own decile. 4.184 1.998Survey question: What is the share of householdsin Germany that have a lower standard of living than yours?Answer categories were given in deciles.
bias Perceived own income decile minus objective income decile. -0.774 2.781preference for redistribution Respondent’s stated attitude towards 5.651 1.341
actual income inequality (scale ranges from 1 to 7):(1) there is too much effort to equalize incomes,(4) satisfied with status quo,(7) there should be much more effort to equalize incomes.
type today Survey question: Which type (see Figure 2) 2.409 1.069best describes German society today?(1) Type A, (2) Type B, (3) Type C, (4) Type D, (5) Type E.
preferred type Survey question: Which type (see Figure 2) 3.932 0.814the German society ought to be like?(1) Type A, (2) Type B, (3) Type C, (4) Type D, (5) Type E.
pay Indicator variable equal to 1 if respondents 0.341 0.474objective income decile is 7 or higher.
informed Sum of respondents stated (news) media consumption. 12.744 2.287We asked for news in TV, internet and newspaper,response categories: (1) never, (2) seldom, (3) monthly,(4) weekly, (5) daily.
confidence How confident respondent feels with her answer 1.790 0.757on the own income decile(1) not sure, (2) somewhat sure, (3) sure, (4) very sure
confident Indicator variable equal to 1 if 0.618 0.486confidence is (2), (3), or (4)
reference group Indicator variable equal to 1 if the respondent statesthat she hast friends from all social classes.
ideology Respondent’s stated political leaning on a range 5.013 1.875from (1) left to (10) right
left Indicator variable equal to 1 if ideology is equal or lower (4) 0.484 0.500hard work Indicator variable equal to 1 if respondent states 0.675 0.469
that hard work is important to get ahead in live.Survey question: How important is hard work to get aheadin live?: (1) essential, (2) very important, (3) important,(4) somewhat important, (5) not important.
age Age in years. 45.213 14.541women Indicator variable equal to 1 if respondent is female. 0.505 0.500education respondent’s highest degree: 3.794 1.081
(1) primary education, (2) lower secondary education,(3) secondary education, (4) higher secondary education(Fachhochschulreife), (5) higher secondary education (Abitur)
N = 859 for all variables.
17
ECINEQ WP 2016 - 389 January 2016
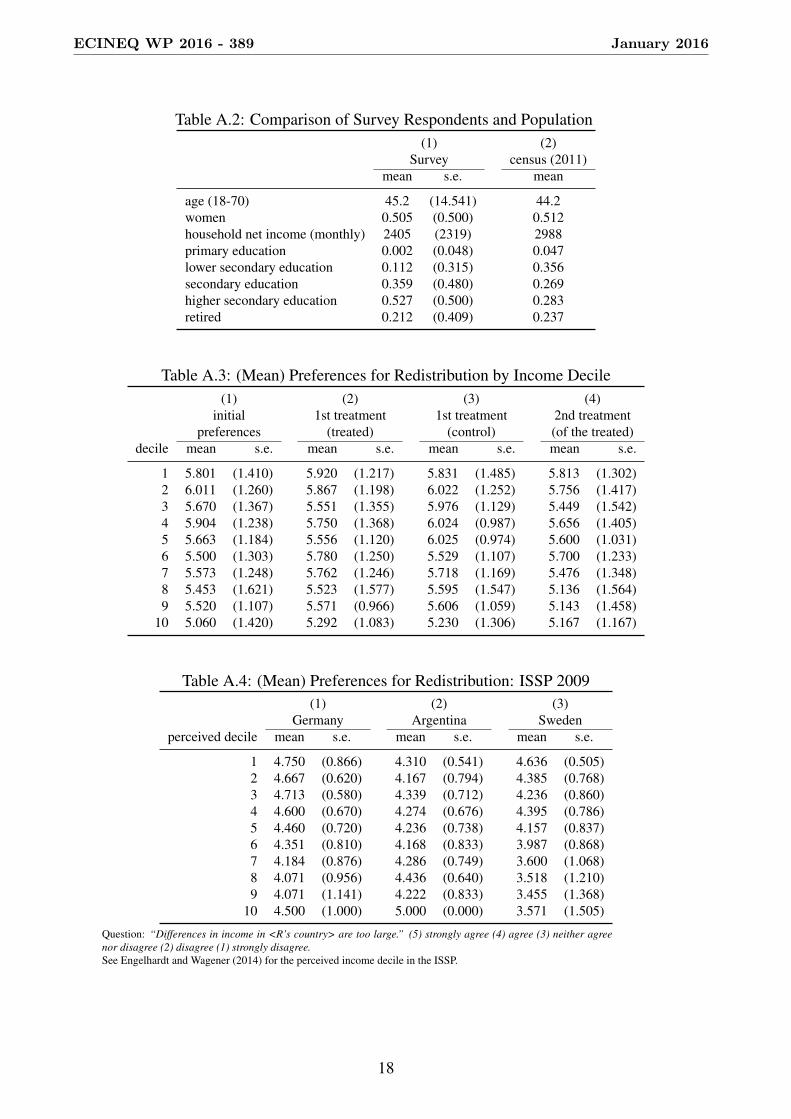
Table A.2: Comparison of Survey Respondents and Population(1) (2)
Survey census (2011)mean s.e. mean
age (18-70) 45.2 (14.541) 44.2women 0.505 (0.500) 0.512household net income (monthly) 2405 (2319) 2988primary education 0.002 (0.048) 0.047lower secondary education 0.112 (0.315) 0.356secondary education 0.359 (0.480) 0.269higher secondary education 0.527 (0.500) 0.283retired 0.212 (0.409) 0.237
Table A.3: (Mean) Preferences for Redistribution by Income Decile(1) (2) (3) (4)
initial 1st treatment 1st treatment 2nd treatmentpreferences (treated) (control) (of the treated)
decile mean s.e. mean s.e. mean s.e. mean s.e.
1 5.801 (1.410) 5.920 (1.217) 5.831 (1.485) 5.813 (1.302)2 6.011 (1.260) 5.867 (1.198) 6.022 (1.252) 5.756 (1.417)3 5.670 (1.367) 5.551 (1.355) 5.976 (1.129) 5.449 (1.542)4 5.904 (1.238) 5.750 (1.368) 6.024 (0.987) 5.656 (1.405)5 5.663 (1.184) 5.556 (1.120) 6.025 (0.974) 5.600 (1.031)6 5.500 (1.303) 5.780 (1.250) 5.529 (1.107) 5.700 (1.233)7 5.573 (1.248) 5.762 (1.246) 5.718 (1.169) 5.476 (1.348)8 5.453 (1.621) 5.523 (1.577) 5.595 (1.547) 5.136 (1.564)9 5.520 (1.107) 5.571 (0.966) 5.606 (1.059) 5.143 (1.458)
10 5.060 (1.420) 5.292 (1.083) 5.230 (1.306) 5.167 (1.167)
Table A.4: (Mean) Preferences for Redistribution: ISSP 2009(1) (2) (3)
Germany Argentina Swedenperceived decile mean s.e. mean s.e. mean s.e.
1 4.750 (0.866) 4.310 (0.541) 4.636 (0.505)2 4.667 (0.620) 4.167 (0.794) 4.385 (0.768)3 4.713 (0.580) 4.339 (0.712) 4.236 (0.860)4 4.600 (0.670) 4.274 (0.676) 4.395 (0.786)5 4.460 (0.720) 4.236 (0.738) 4.157 (0.837)6 4.351 (0.810) 4.168 (0.833) 3.987 (0.868)7 4.184 (0.876) 4.286 (0.749) 3.600 (1.068)8 4.071 (0.956) 4.436 (0.640) 3.518 (1.210)9 4.071 (1.141) 4.222 (0.833) 3.455 (1.368)
10 4.500 (1.000) 5.000 (0.000) 3.571 (1.505)
Question: “Differences in income in <R’s country> are too large.” (5) strongly agree (4) agree (3) neither agreenor disagree (2) disagree (1) strongly disagree.See Engelhardt and Wagener (2014) for the perceived income decile in the ISSP.
18
ECINEQ WP 2016 - 389 January 2016

Table A.5: Answers ISSP 2009 (for Germany)(1) (2)
Type Today Type Preferred
Type A 18.80% 1.49%Type B 35.38% 10.36%Type C 23.03% 18.21%Type D 18.57% 57.06%Type E 4.22% 12.87%
N 1,255 1,274
Table A.6: Perceived types today: experimental results
(1) (2) (3)Negative Bias No Bias Positive Bias
Type A
Treatment group [obs.] 1.264 [53] 1.111 [18] 1.394 [33]Control group [obs.] 1.200 [40] 1.467 [15] 1.222 [27]Difference [s.e.] 0.064 [0.143] -0.356 [0.277] 0.172 [0.227]
Type B
Treatment group [obs.] 2.107 [75] 2.154 [26] 2.220 [50]Control group [obs.] 2.025 [79] 1.957 [23] 2.149 [47]Difference [s.e.] 0.081 [0.107] 0.197 [0.188] 0.071 [0.182]
Type C
Treatment group [obs.] 2.868 [76] 2.867 [15] 2.939 [33]Control group [obs.] 3.000 [76] 2.833 [24] 2.857 [21]Difference [s.e.] -0.132 [0.870] 0.033 [0.180] 0.082 [0.166]
Type D
Treatment group [obs.] 3.541 [37] 3.625 [8] 3.889 [9]Control group [obs.] 3.905 [21] 3.750 [4] 3.769 [13]Difference [s.e.] -0.364* [0.190] -0.125 [0.314] 0.120 [0.352]
Type E
Treatment group [obs.] 4.714 [7] 3.500 [2] 3.000 [6]Control group [obs.] 4.500 [8] 5.000 [2] 4.182 [11]Difference [s.e.] 0.214 [0.564] -1.500 [1.500] -1.182 [0.846]
Full Sample
Treatment group [obs.] 2.448 [248] 2.246 [69] 2.344 [131]Control group [obs.] 2.473 [224] 2.353 [68] 2.429 [119]Difference [s.e.] -0.026 [0.100] -0.107 [0.179] -0.085 [0.154]Diff-in-Diff [s.e.] -0.046 [0.138] -0.044 [0.251] 0.086 [0.211]
Robust standard errors in parentheses: ∗∗∗: p < 0.01, ∗∗: p < 0.05, ∗: p < 0.1Dependent variable: type today
19
ECINEQ WP 2016 - 389 January 2016
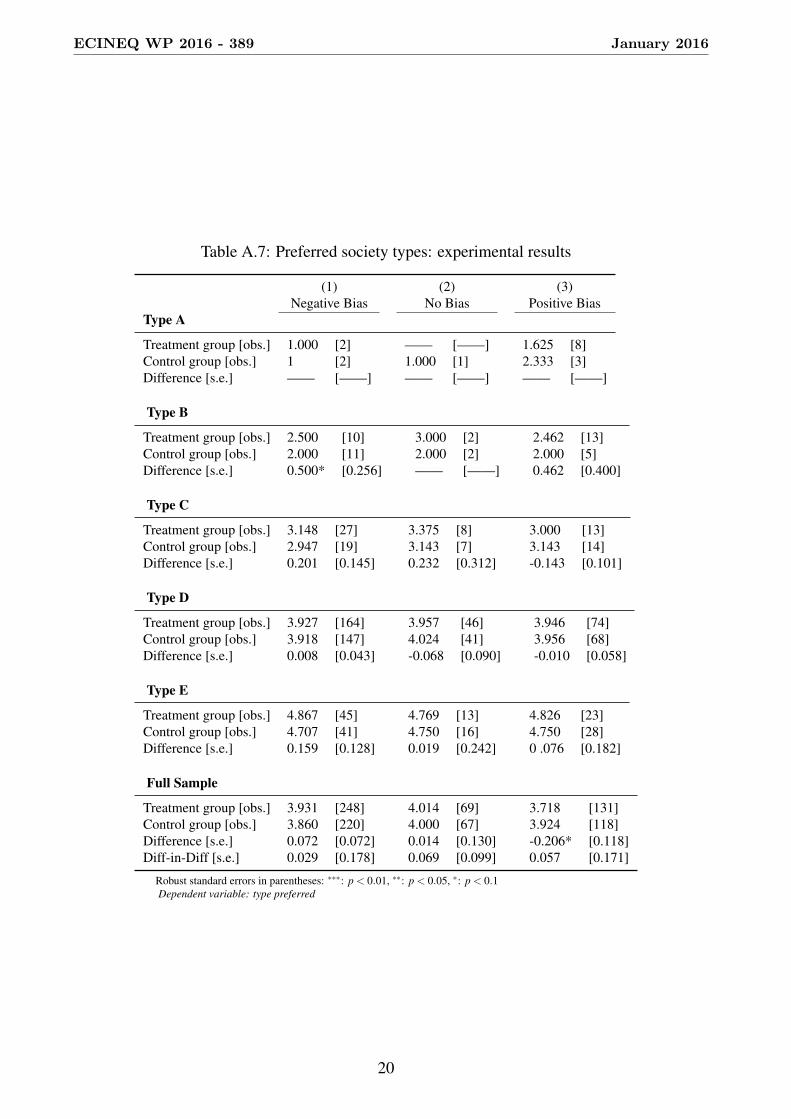
Table A.7: Preferred society types: experimental results
(1) (2) (3)Negative Bias No Bias Positive Bias
Type A
Treatment group [obs.] 1.000 [2] —— [——] 1.625 [8]Control group [obs.] 1 [2] 1.000 [1] 2.333 [3]Difference [s.e.] —— [——] —— [——] —— [——]
Type B
Treatment group [obs.] 2.500 [10] 3.000 [2] 2.462 [13]Control group [obs.] 2.000 [11] 2.000 [2] 2.000 [5]Difference [s.e.] 0.500* [0.256] —— [——] 0.462 [0.400]
Type C
Treatment group [obs.] 3.148 [27] 3.375 [8] 3.000 [13]Control group [obs.] 2.947 [19] 3.143 [7] 3.143 [14]Difference [s.e.] 0.201 [0.145] 0.232 [0.312] -0.143 [0.101]
Type D
Treatment group [obs.] 3.927 [164] 3.957 [46] 3.946 [74]Control group [obs.] 3.918 [147] 4.024 [41] 3.956 [68]Difference [s.e.] 0.008 [0.043] -0.068 [0.090] -0.010 [0.058]
Type E
Treatment group [obs.] 4.867 [45] 4.769 [13] 4.826 [23]Control group [obs.] 4.707 [41] 4.750 [16] 4.750 [28]Difference [s.e.] 0.159 [0.128] 0.019 [0.242] 0 .076 [0.182]
Full Sample
Treatment group [obs.] 3.931 [248] 4.014 [69] 3.718 [131]Control group [obs.] 3.860 [220] 4.000 [67] 3.924 [118]Difference [s.e.] 0.072 [0.072] 0.014 [0.130] -0.206* [0.118]Diff-in-Diff [s.e.] 0.029 [0.178] 0.069 [0.099] 0.057 [0.171]
Robust standard errors in parentheses: ∗∗∗: p < 0.01, ∗∗: p < 0.05, ∗: p < 0.1Dependent variable: type preferred
20
ECINEQ WP 2016 - 389 January 2016

0.0
5.1
.15
Den
sity
-9 -8 -7 -6 -5 -4 -3 -2 -1 0 1 2 3 4 5 6 7 8 9Bias
Figure A.1: Distribution of bias in the sample.Bias := perceived minus actual percentile in the income distribution.
21
ECINEQ WP 2016 - 389 January 2016