working paper series 112 - connecting repositories · 2017-05-05 · interdependence among latin...
TRANSCRIPT


ISSN 1518-3548 CGC 00.038.166/0001-05
Working Paper Series
Brasília
n. 112
Jul
2006
P. 1-36

Working Paper Series Edited by Research Department (Depep) – E-mail: [email protected] Editor: Benjamin Miranda Tabak – E-mail: [email protected] Editorial Assistent: Jane Sofia Moita – E-mail: [email protected] Head of Research Department: Carlos Hamilton Vasconcelos Araújo – E-mail: [email protected] The Banco Central do Brasil Working Papers are all evaluated in double blind referee process. Reproduction is permitted only if source is stated as follows: Working Paper n. 112. Authorized by Afonso Sant’Anna Bevilaqua, Deputy Governor of Economic Policy. General Control of Publications Banco Central do Brasil
Secre/Surel/Dimep
SBS – Quadra 3 – Bloco B – Edifício-Sede – M1
Caixa Postal 8.670
70074-900 Brasília – DF – Brazil
Phones: (5561) 3414-3710 and 3414-3567
Fax: (5561) 3414-3626
E-mail: [email protected]
The views expressed in this work are those of the authors and do not necessarily reflect those of the Banco Central or its members. Although these Working Papers often represent preliminary work, citation of source is required when used or reproduced. As opiniões expressas neste trabalho são exclusivamente do(s) autor(es) e não refletem, necessariamente, a visão do Banco Central do Brasil. Ainda que este artigo represente trabalho preliminar, citação da fonte é requerida mesmo quando reproduzido parcialmente. Consumer Complaints and Public Enquiries Center Address: Secre/Surel/Diate
Edifício-Sede – 2º subsolo
SBS – Quadra 3 – Zona Central
70074-900 Brasília – DF – Brazil
Fax: (5561) 3414-2553
Internet: http://www.bcb.gov.br/?english

3
Interdependence and Contagion: an Analysis of Information Transmission in Latin America’s Stock Markets
Angelo Marsiglia Fasolo*
Abstract
The Working Papers should not be reported as representing the views of the Banco Central do
Brasil. The views expressed in the papers are those of the author(s) and do not necessarily reflect those of the Banco Central do Brasil.
This paper brings evidences about the hypotheses of financial crisis contagion over Latin American stock markets in the 90’s using a multivariate GARCH model. We added to the volatility structure a leverage term in order to avoid problems due to the use of conditional correlation as a measure of relationship between stock markets. Results point to the existence of contagion only during the Asian (1997) and the Russian (1998) crises. The consequences of the change in the exchange rate regime in Brazil (1999) can be identified as a result of interdependence among Latin American markets, while the Mexican (1994) and Argentinean (2001) crises show a specific mechanism of propagation. This result raises questions about the adequacy of the “contagion” and “interdependence” concepts for the information transmission analysis among stock markets.
* Research Department, Central Bank of Brazil. The author would like to thank Fernando Alberto S.
Rocha, Christiane Rocha Albuquerque, Carlos Hamilton Vasconcelos Araújo e José Álvaro Rodrigues Neto for comments on previous versions of this paper. The views expressed here are solely those of the author and do not necessarily reflect those of the Institution or its staff. E-mail: [email protected].
4
1. Introduction
The liberalization of financial markets and capital flows, deepened during the 1990’s,
raised questions concerning the conduct of national economic policies. In this context, studies
on information transmission between financial markets and its effects over asset prices grew
in importance. The joint movement of asset markets in different countries, especially in crisis
events – the so called “contagion” – became an actual topic of discussion in financial
literature.
Latin American stock markets, in particular after last decade’s economic reforms,
were affected by a sequence of shocks originated from different sources. Their performance
was conditioned not only by internal crises – as that of Mexico in 1994 or the devaluation
Argentinean currency in 2001 – but also by external crises, which, in general, had origins in
countries with little in common with the Latin America’s economies. It’s important to
highlight the collapse of Southern Asian economies in 1997 and the devaluation of the
Russian Rublo in 1998.
Amongst the available techniques to study markets’ relations, the multivariate
ARCH/GARCH models represent the classical framework of analysis. However, the
excessive number of parameters in those formulations conditions their use. The approach
proposed by ENGLE (2002) not only reduces this problem, but also offers an immediate
hypothesis test about information transmission among markets. In this sense, it is possible to
test the existence and intensity of the linkages among markets through conditional
correlations.
Despite its econometric advantages, the basic model in ENGLE (2002) does not
incorporate important developments from traditional univariate models, such as leverage
effects of volatility under negative news. Thus, we added a GJR formulation (see GLOSTEN
et alli, 1993) applied to the variance structure proposed by ENGLE (2002). By doing so, we
can expect to detect occasional asymmetry and leverage phenomena over stock markets’
returns.
Concerning the results, it is possible to say, in advance, that only the effects from
Asian and Russian crises can be seen in the classical definition of contagion. Other shocks,
especially those originated from Latin American countries, are cases of interdependence or
represent an alternative pattern of information transmission that we call “isolation effect”.
Section 2 brings a brief literature review, focusing mainly in the measure of contagion
among stock markets, which is the objective of this article. Section 3 describes the
methodology used, emphasizing ENGLE (2002)’s multivariate model. Results are presented
in section 4, highlighting the relations among markets, while section 5 discusses, based on
some results presented in the previous section, the sufficiency of the concepts proposed in the

5
literature about markets’ interdependence. Finally, section 6 concludes.
1. Review of the Literature: Contagion and Spillover Effects
The three classical approaches to test contagion among markets are1: the assets
returns’ correlation, cointegration analysis and volatility models. The first methodology
consists of calculation the returns’correlation in the so-called normal periods of time and
compares results to those obtained in crisis’ periods. Cointegration tests try to establish a
long-run relationship between markets, leaving behind components such as the markets’
short-run volatilities. Volatility models try to conciliate the long run and short-run analysis,
considering not only the first but also higher statistical moments of assets’ returns. Other
hypothesis, such as non-normality in the returns’ distribution or the influence of markets’
volatility over the mean of returns, may be tested with no harm to results, especially due to
large samples from high frequency data.
Evidences about the existence of a relevant channel of information transmission
among markets are mixed. LIN, ENGLE and ITO (1994) find little evidence of causality
between the US and Japanese markets. However, BAE and KAROLYI (1994) state that not
considering the asymmetric responses of shocks may bias this kind of causality analysis.
FLEMING and LOPEZ (1999) use GARCH models to find evidences of the interdependency
among New York, London and Tokyo’s Treasury markets. Their conclusions points to the
influence of the US market over the others, but not the other way round.
Concerning Latin America’s stock market, the literature is still incipient. CHRISTOFI
and PERICLI (1999) estimate an EGARCH, with a VAR structure in the mean equations,
while the estimated covariances follow a constant conditional correlation (CCC) pattern.
Authors find asymmetric effects in the markets’ responses, especially in the presence of bad
news. However, the US market is not incorporated in the analysis, what may cause distortions
in results, due to absence of an influential factor to the average return.
CHOEIRI (1999) estimates a common factor model to the foreign exchange reserves’
stock in Argentina, Brazil, Chile and Mexico, based on the similar pattern in the movements
of capital flows to Asian and Latin American markets throughout the 70’s and in the early
90’s. Her study confirms a common dynamics among the variables in times of high
international liquidity. The same does not occur in crisis period, when the estimated factor is
not significant. The author points out that, maybe, these movements are determined by
financial markets’ linkages, instead of economies’ fundamentals.
EDWARDS (1998) tests the volatility of the interest rates of Chile, Argentina and
Mexico. The author finds contagion effects from Mexico to Argentina during 1994 crisis, but
1 See FORBES e RIGOBON (2000) about the first three methods.

6
do not find the same result from Mexico to Chile. The absence of a relationship in more than
one direction is confirmed by DÍEZ DE LOS RIOS and HERRERO (2003), when testing the
causality relations among external debt bonds’ returns from emerging markets economies.
Using the Par Bonds from Mexico, Argentina, Brazil and Venezuela, MORAIS and
PORTUGAL (2001) detect common movements among the returns’ volatilities, especially
between the first two countries. LOPES and MIGON (2002) also apply common factors
models to Latin America and point out that, during every crisis periods in the sample, the four
major stock markets in the region had suffered contagion.
FORBES and RIGOBON (2000) show some necessary corrections in the contagion
measures to analyze financial markets. After those corrections, the changes in bonds and stock
markets’ returns in Latin America show only the interdependence among the countries, and
not contagion, as it could be expected. However, as a long-run concept, the acceptance of the
interdependence hypotheses must be seen with some careful, once TABAK and LIMA (2002)
finds only a short-run causality among those markets, rejecting the existence of a
cointegration vector2. The corrections proposed by FORBES and RIGOBON (2000) are also
criticized by BAIG and GOLDFAJN (2000), who point that volatility increases are an
inherent characteristic of crisis. Thus, correcting the estimated correlation by eliminating the
change in volatility is the same as estimating a new value without considering relevant
features of those periods.
2. Applied Volatility Models: Methodology
This section consists of two parts. The first one presents the concepts that are the basis
to the applications from which the results were derived. The second part presents the
econometric methodology and the consequences of the hypothesis that were set according to
the chosen model.
By contagion among stock markets we mean a significant increase in their relations
after a shock in one of the markets, as defined in FORBES and RIGOBON (2000, p.13). It is
important to notice that, according to the authors, high values of correlation (or of any other
measure of relation between assets) mean interdependence among markets, but not contagion.
What is important to identify contagion is a significant change in level of the relation among
markets during crisis periods.
Here, the relation among stock markets is measured by the conditional correlation that
is estimated in the volatility models of section 4. This assumption turns the tests into simpler
ones, since contagion can be verified only by the analysis of the median correlation between
normal and crisis periods3. The VAR form of the mean equation allows us to correct the bias
2 These results confirm the conclusions reached by SINHA e CASTAÑEDA (1999). 3 About the validity of the concept, its implications and the transmition mechanisms, see FORBES and
RIGOBON (2000, 2002). In section 5, it is discussed only the sufficiency of the concept, based in one of the

7
in the analysis of contagion based on ARCH/GARCH models, as pointed out in FORBES and
RIGOBON (2000, p. 23), concerning the omission of relevant variables. Hence, occasional
shocks in one of the countries involved would propagate the impact through all over the
system.
The use of ARCH/GARCH models is highly spread in the literature, with various
applications in economics and finance. Recently, there has been an increase in the number of
studies with multivariate formulations. The growth in the number of parameters to be
estimated is a restriction to these models4, bringing some problems to guarantee the
convergence of the estimation’s algorithms.
Amongst the possible restrictions proposed to the covariance matrix, ENGLE (2002)’s
Dynamic Conditional Correlation (DCC) seems to be the most interesting. Consider that the
conditional variance of the returns of an asset i is given by hi,t = Et-1(ri,t2). Then the returns
may be written as:
ni
RNwherehr ttitititi
,...,2,1
),0(~:,. ,,,,
=
= εε (1)
In this case, εt is, in matrix notation, the vector of standardized residuals, Rt is the
returns’ correlation matrix and ht is the variance-covariance matrix. Using these definitions in
the estimator of the conditional correlation between two assets, i and j, we have that:
( )( ) ( ) ( )tjtit
tjttit
tjtittji E
EE
E,,1
2,1
2,1
,,1,, εε
εε
εερ −
−−
− == (2)
Defining the variance-covariance structure as:
tttt DRDH = , (3)
where }{ ,tit hdiagD = , the equations representing the individual variances of the assets
follow a GARCH process similar to the univariated models, while the correlation matrix is
estimated in each moment of time5. The restriction applied to the variance matrix asserts a
unique GARCH process to the conditional correlation matrix. Here, the correlation estimator
has the following form:
obtained results. 4 In a GARCH (1,1) formulation, with two dependent variables, it is necessary to compute the values of
21 parameters to get the estimation completed. The same formulation using three dependent variables needs the estimation of 78 parameters.
5 Note that, leaving Dt on the left side of the equation, we obtain the conditional correlation estimator. See equation 4.
8
11
11
|
11
}{}{
)(1
−−
=−
=−−
==
=
++
−−= ∑∑∑∑
tttt
s
ssts
r
rrtrtr
s
ss
r
rrt
QdiagQQdiagR
QSQ βεεαβα (4)
where αi and βi are scalars.
The linkage between the concepts of contagion and interdependence is a natural
consequence. Following LOPES and MIGON (2002), the relation between two markets is
given by the conditional correlation between the assets’ returns, estimated at each period. This
scheme also corrects problems caused by omitted variables and heteroskedasticity, pointed
out by FORBES and RIGOBON (2000) as potential sources of distortion in the correlations´
results.
Finally, considering the asymmetry effects of the responses to shocks, we adopt the
volatility model first presented in GLOSTEN et al (1993), denoted by GJR. In this
formulation, the variance equations are given by:
≥<
=
+++=
−
−
=−
=−
=− ∑∑∑
0,0
0,1
1,
1,
1
2,,
1
2,,
1,,,
ti
tii
d
ddtdidi
q
qqtiqi
p
pptipiiti
if
ifwhere
BBhAwh
µµ
χ
µχµ (5)
In equation 5, the dummy χi is set endogenously throughout the estimation. It reflects
the additional leverage effect caused by a negative surprise in the market. Thus, for each
market, the dummy variable will be estimated in the equation of its own variance process.
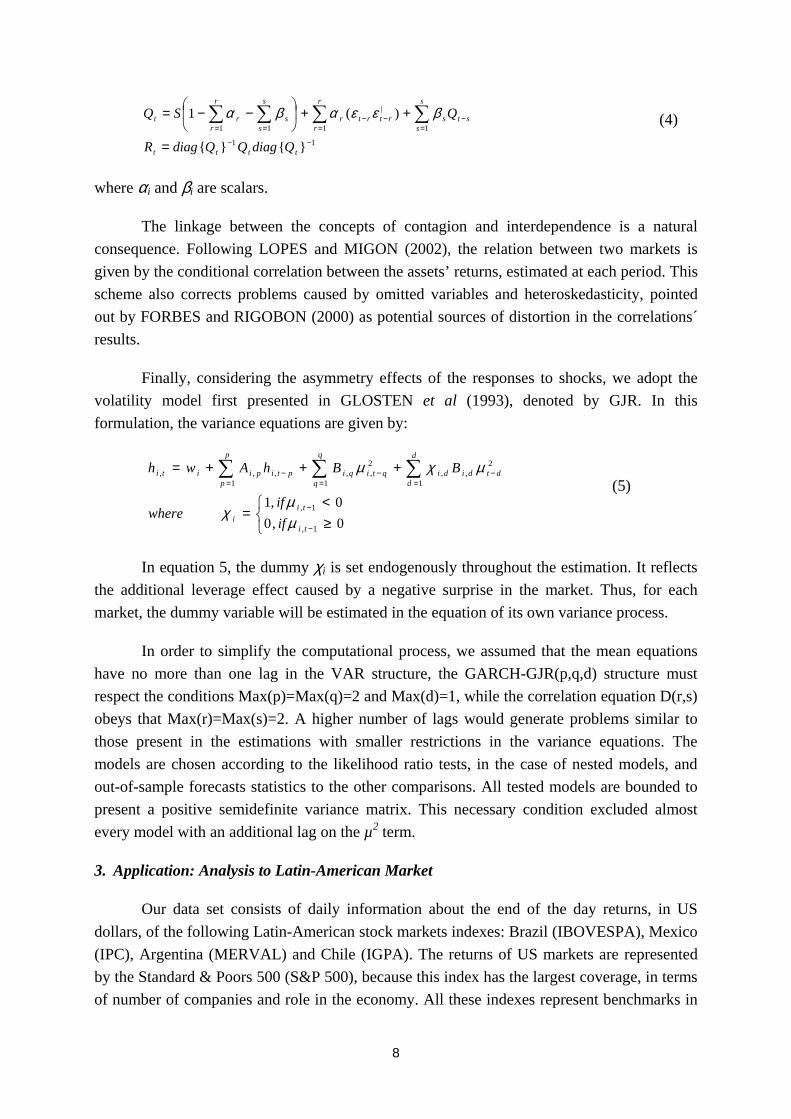
In order to simplify the computational process, we assumed that the mean equations
have no more than one lag in the VAR structure, the GARCH-GJR(p,q,d) structure must
respect the conditions Max(p)=Max(q)=2 and Max(d)=1, while the correlation equation D(r,s)
obeys that Max(r)=Max(s)=2. A higher number of lags would generate problems similar to
those present in the estimations with smaller restrictions in the variance equations. The
models are chosen according to the likelihood ratio tests, in the case of nested models, and
out-of-sample forecasts statistics to the other comparisons. All tested models are bounded to
present a positive semidefinite variance matrix. This necessary condition excluded almost
every model with an additional lag on the µ2 term.
3. Application: Analysis to Latin-American Market
Our data set consists of daily information about the end of the day returns, in US
dollars, of the following Latin-American stock markets indexes: Brazil (IBOVESPA), Mexico
(IPC), Argentina (MERVAL) and Chile (IGPA). The returns of US markets are represented
by the Standard & Poors 500 (S&P 500), because this index has the largest coverage, in terms
of number of companies and role in the economy. All these indexes represent benchmarks in

9
their own countries. The sample ranges from August 1st, 1994 to May 5th, 2003, with a total of
2263 observations, after the necessary adjustments. Absent information, due to national
holidays, were replaced by the data of the previous day.6
The choice of representative assets for Latin America was based on two aspects: the
distortion caused by the model’s restrictions and the daily average value, in US dollars, traded
by each stock market. The restrictions upon the DCC structures, mentioned in ENGLE and
SHEPPARD (2001), end up causing a natural restriction over the number of variables. In
simulations using Dow Jones and S&P 500 stocks, the portfolio’s choice was not always
optimal because of the unique dynamic structure of correlations: as the number of assets in the
portfolio increases, the DCC model tends to underestimate the assets’ variances. Thus, in
order to avoid estimation problems, a total of five assets seems to be a reasonable
representation for the stock market in the region. Table A shows the average volume (in US
dollars) traded in each market. Following this criterion, a natural choice is the four largest
Latin American stock markets, considering the discrepancy when compared to the ones in
other countries.
TABLE A – Average Traded Volume – Latin-American Stock Market –
August, 94 to June, 03
Stock Market Average Volume (in US$)
1. Brazil – IBOVESPA 323,529,584
2. Mexico – IPC 158,076,318
3. Chile – IGPA 25,410,683
4. Argentina – MERVAL 24,871,015
5. Venezuela – IBC 9,598,514
6. Peru – IGBVL 5,431,841
Source: Bloomberg.
Table B shows the descriptive statistics of the returns. One can notice that only the US
market had a positive average return in that period. Concerning risk, the markets with smaller
variance and standard errors of the sample are those of Chile and the USA. The kurtosis
values, indicating a platykurtic distribution and the low asymmetry of returns also draw
attention. Hence, the rejection of the normal-distribution hypothesis by the Jarque-Bera test
was expected.
6 Common holidays (Eastern, Christmas and January 1st) were excluded from the sample.

10
TABLE B – Descriptive Statistics of the Returns
S&P 500 – US
IBOVESPA -
BRA IPC - MEX
MERVAL -
ARG IGPA – CHI
Average 0.000312 -0.000029 -0.000049 -0.000391 -0.000091
Standard Error 0.011738 0.028401 0.021291 0.027398 0.009062
Sample Variance 0.000138 0.000807 0.000453 0.000751 0.000082
Kurtosis 3.116009 6.177906 13.331070 62.180004 3.734255
Asymmetry -0.105220 0.099108 -1.172025 -3.379893 0.081100
Jarque-Bera 914.1046 3583.530 17194.11 367228.6 1309.681
Minimum -0.071127 -0.172462 -0.227132 -0.518372 -0.048967
Maximum 0.055697 0.237176 0.117112 0.161165 0.059337
Table C presents the sample correlation between assets. The highest values are found
between the IPC and the S&P500 (0.4426), the IBOVESPA and the MERVAL index (0.4772)
and the IBOVESPA and the IGPA (0.4822). It is obvious that these values must be seen
carefully, because they reveal the “average” correlation in the analyzed period: if the variance
changes across time, these correlations are no longer valid. Table D, for instance, shows, in
the lower diagonal, the correlations during the Mexico’s crisis (October, 1994 to December,
1995) and, in the upper diagonal, those during the change in the exchange rate regime in
Brazil (January to December, 1999). The differences between correlations during crises and
with the whole sample correlation show the importance of a careful analysis of this
phenomenon.
TABLE C – Returns’ Correlation – August, 94 to June, 03
S&P 500
USA
IBOVESPA
BRA
IPC
MEX
MERVAL
ARG
IGPA
CHI
S&P 500 – USA 1
IBOVESPA – BRA 0.413124 1
IPC – MEX 0.442572 0.388471 1
MERVAL – ARG 0.294935 0.477175 0.341101 1
IGPA – CHI 0.312176 0.482160 0.304869 0.338996 1
Before any time-series analysis, one needs to consider the stationarity of the series
involved. Table E reports the Augmented Dickey-Fuller (ADF) and Phillips-Perron (PP) tests
and graph 1 shows the evolution of the series in levels. Indexes’ returns, calculated by the
difference between the natural logarithm of the series in level, have the expected stationary
behavior. The PP test, in financial series, is fundamental due to the correction of the test

11
statistics for the heteroskedaticity problem.
TABLE D – Returns’ Correlation –Crises’ Periods
S&P 500
USA
IBOVESPA
BRA
IPC
MEX
MERVAL
ARG
IGPA
CHI
S&P 500 – USA 1 0.469918 0.575103 0.487571 0.229126
IBOVESPA – BRA -0.478585 1 0.414804 0.777306 0.259236
IPC – MEX -0.364736 0.021291 1 0.412716 0.257158
MERVAL – ARG -0.437293 0.816172 0.207634 1 0.169838
IGPA – CHI -0.513253 0.805349 -0.141970 0.567627 1
Exchange R
ate
Regim
e – Brazil –
Jan/99 to Mai/99
Mexican Crisis– 12/19/94 to 12/31/94
GRAPH 1 - Stock Market Index - US and Latin-America
-
2,000
4,000
6,000
8,000
10,000
12,000
14,000
16,000
18,000
01-
Aug
-94
01-
De
c-94
01-
Ap
r-95
01-
Au
g-9
5
01-D
ec-9
5
01-A
pr-
96
01-A
ug-
96
01-D
ec-
96
01-A
pr-9
7
01-
Aug
-97
01-
De
c-97
01-
Apr
-98
01-
Aug
-98
01-
De
c-9
8
01-
Ap
r-9
9
01-A
ug-
99
01-D
ec-9
9
01-A
pr-0
0
01-A
ug-0
0
01-
De
c-00
01-A
pr-0
1
01-
Aug
-01
01-
De
c-01
01-
Apr
-02
01-
Au
g-0
2
01-D
ec-0
2
01-
Ap
r-03
Period
Ind
exe
s Ib
ove
spa
and
IGP
A
-
200
400
600
800
1,000
1,200
1,400
1,600
1,800
Ind
exes
Merva
l, IPC
and S
&P
500
IBOVESPA - Brazil IGPA - Chile S&P 500 - US IPC - Mexico Merval - Argentina
TABLE E – Unit Root Tests
Series in Levels Series in Differences (Returns)
ADF PP ADF PP
S&P 500 (C) -1.6978 ( 3) -1.6832 �SP (C/T) -29.262* ( 2) -48.434*
IBOVESPA (C) -1.8750 (10) -1.9406 �BOV (C) -13.284* (10) -42.933*
IPC (C/T) -3.2986 ( 2) -3.2263 �IPC (C) -15.059* ( 7) -46.114*
MERVAL (C) -1.3569 (10) -1.2210 �MER -34.027* ( 1) -44.025*
IGPA (C/T) -3.0156 ( 1) -3.1364 �IGPA -18.134* ( 4) -36.937*
Note: (*) Indicates rejection of the null hypothesis of a unit root at 5%. The numbers among brackets show the
lag used in the test, chosen by the AIC. (C/T) Indicate that the test used as deterministic terms a Constant and a
Trend.

12
Table F reports some likelihood ratio tests (LR), comparing models with different
mean processes. It also compares the VAR structure in the mean, testing against a simple
AR(1) formulation, trying to verify if the VAR significance is a strict consequence of
autocorrelation. The rejection of the AR(1) formulation implies the existence of an
information channel through the mean of the returns, a characteristic of spillover effects.
Table G compares the variance structure, also testing the GJR formulation against the
traditional GARCH formulation7.
TABLE F – LR Tests – Nested Models – Mean Structure
Null Hypothesis Alternative Hypothesis Test Degree of
Freedom Choice
C-G(1,1)D(1,1) AR(1)-G(1,1)D(1,1) 204.716* 5 AR(1)-G(1,1)D(1,1)
AR(1)-G(1,1)D(1,1) V(1)-G(1,1)D(1,1) 94.024* 20 V(1)-G(1,1)D(1,1)
C-G(1,1)D(1,1) V(1)-G(1,1)D(1,1) 298.739* 25 V(1)-G(1,1)D(1,1)
C-G(1,1)D(2,2) AR(1)-G(1,1)D(2,2) 206.930* 5 AR(1)-G(1,1)D(2,2)
AR(1)-G(1,1)D(2,2) V(1)-G(1,1)D(2,2) 97.221* 20 V(1)-G(1,1)D(2,2)
C-G(1,1)D(2,2) V(1)-G(1,1)D(2,2) 304.151* 25 V(1)-G(1,1)D(2,2)
C-G(2,1)D(1,1) V(1)-G(2,1)D(1,1) 291.936* 25 V(1)-G(2,1)D(1,1)
C-GJR-G(1,1)D(1,1) V(1)-GJR-G(1,1)D(1,1) 301.642* 25 V(1)-GJR-G(1,1)D(1,1)
C-GJR-G(2,1)D(2,1) V(1)-GJR-G(2,1)D(2,1) 294.612* 25 V(1)-GJR-G(2,1)D(2,1)
C-GJR-G(2,1)D(1,2) V(1)-GJR-G(2,1)D(1,2) 297.673* 25 V(1)-GJR-G(2,1)D(1,2)
Note: (*) Indicate rejection of the null hypothesis at 5%.
As in the case of the mean process, a large number of parameters are accepted when
the variance equations are compared. However, structures that already have a large number of
parameters are not always inferior to those with the maximum number allowed. Table G
shows that the GJR term always provides a better performance than the simple GARCH
structure, an evidence of the presence of asymmetries in the markets responses caused by
surprises.
7 Additional tests are available with the author upon request.

13
TABLE G – LR Tests – Nested Models – Variance Structure – GARCH e GJR
Null Hypothesis Alternative Hypothesis Test
Degree
of
Freedom
Choice
Variance Structure
C-G(1,1)D(1,1) C-G(2,1)D(1,1) 12.632* 5 C-G(2,1)D(1,1)
C-G(1,1)D(1,2) C-G(2,1)D(1,2) 14.276* 5 C-G(2,1)D(1,2)
V(1)-G(1,1)D(1,1) V(1)-G(2,1)D(1,1) 6.044 5 V(1)-G(1,1)D(1,1)
V(1)-G(1,1)D(2,1) V(1)-G(2,1)D(2,1) 6.089 5 V(1)-G(1,1)D(2,1)
C-GJR-G(1,1)D(1,1) C-GJR-G(2,1)D(1,1) 12.632* 5 C-GJR-G(2,1)D(1,1)
C-GJR-G(1,1)D(2,2) C-GJR-G(2,1)D(2,2) 16.807* 5 C-GJR-G(2,1)D(2,2)
V(1)-GJR-G(1,1)D(2,1) V(1)-GJR-G(2,1)D(2,1) 4.733 5 V(1)-GJR-G(1,1)D(2,1)
V(1)-GJR-G(1,1)D(1,2) V(1)-GJR-G(2,1)D(1,2) 4.986 5 V(1)-GJR-G(1,1)D(1,2)
GARCH × GJR
C-G(1,1)D(1,1) C-GJR-G(1,1)D(1,1) 193.778* 5 C-GJR-G(1,1)D(1,1)
C-G(2,1)D(2,1) C-GJR-G(2,1)D(2,1) 219.812* 5 C-GJR-G(2,1)D(2,1)
V(1)-G(1,1)D(1,1) V(1)-GJR-G(1,1)D(1,1) 196.681* 5 V(1)-GJR-G(1,1)D(1,1)
V(1)-G(1,1)D(2,2) V(1)-GJR-G(1,1)D(2,2) 193.527* 5 V(1)-GJR-G(1,1)D(2,2)
V(1)-G(2,1)D(1,1) V(1)-GJR-G(2,1)D(1,1) 195.092* 5 V(1)-GJR-G(2,1)D(1,1)
V(1)-G(2,1)D(2,1) V(1)-GJR-G(2,1)D(2,1) 195.145* 5 V(1)-GJR-G(2,1)D(2,1)
Conditional Correlation Structure
C-G(1,1)D(1,1) C-G(1,1)D(1,2) 5.668* 1 C-G(1,1)D(1,2)
V(1)-G(1,1)D(1,1) V(1)-G(1,1)D(2,2) 11.141* 2 V(1)-G(1,1)D(2,2)
V(1)-G(2,1)D(1,1) V(1)-G(2,1)D(2,1) 5.399* 1 V(1)-G(2,1)D(2,1)
C-GJR-G(1,1)D(1,1) C-GJR-G(1,1)D(2,2) 3.251 2 C-GJR-G(1,1)D(1,1)
V(1)-GJR-G(1,1)D(2,1) V(1)-GJR-G(1,1)D(2,2) 2.813 1 V(1)-GJR-G(1,1)D(2,1)
V(1)-GJR-G(1,1)D(1,1) V(1)-GJR-G(1,1)D(2,2) 7.987* 2 V(1)-GJR-G(1,1)D(2,2)
Note: (*) Indicate rejection of the null hypothesis at 5%.
Therefore, tables F and G present three important results on model selection and the
market’s information transmission mechanism:
• Models with a VAR structure perform better than those with only a constant in the
mean equation or with a simple autoregressive structure, as well as a variance
structures with small number of parameters.
• Models with the GJR formulation in the variance equation perform better than those
with a simple GARCH structure.

14
• The VAR structure confirms the existence of a transmission mechanism among
markets that may affect their returns. However, it is not possible, yet, to make
inferences about the relationship among volatilities, since it is necessary additional
information that can be brought by the GJR structure and through the observation of
the estimated volatilities.
Since the LR tests do not offer a unique solution to the conditional correlation
structure selection problem, table H reports the forecasting evaluation statistics8 applied to the
estimated conditional volatilities. The tests were performed in one, five and ten-steps-ahead
forecasts, trying to identify the best model among non-nested formulations, i.e. those that
cannot be directly compared by a LR test. As an example, the model with two autoregressive
terms in the correlation equation (V1-GJR-G11-D21) is not a restricted case of the
formulation with two shock terms in the same equation (V1-GJR-G11-D12). In this sense, a
LR test cannot be implemented to solve the model selection problem.
TABLE H –Model Selection – Out-of-Sample Statistics
Mean Squared Root Error Mean Absolute Percentage Error Models
1 Day 5 Days 10 Days 1 Day 5 Days 10 Days
V1-GJR-G11-D11 0.00059597 0.00064567 0.00118115 732.843% 1967.775% 2163.287%
V1-GJR-G11-D12 0.00059682 0.00064714 0.00118330 736.885% 1973.490% 2171.871%
V1-GJR-G11-D21 0.00059621 0.00064613 0.00118228 734.307% 1968.129% 2165.833%
V1-GJR-G11-D22 0.00071439 0.00101382 0.00198188 1072.170% 2660.042% 4389.019%
Choice: V1-GJR-
G11-D11
V1-GJR-
G11-D11
V1-GJR-
G11-D11
V1-GJR-
G11-D11
V1-GJR-
G11-D11
V1-GJR-
G11-D11
The results show that the large number of parameters is not an important feature to
describe data, since both statistics selected the same model on every horizon. Based on these
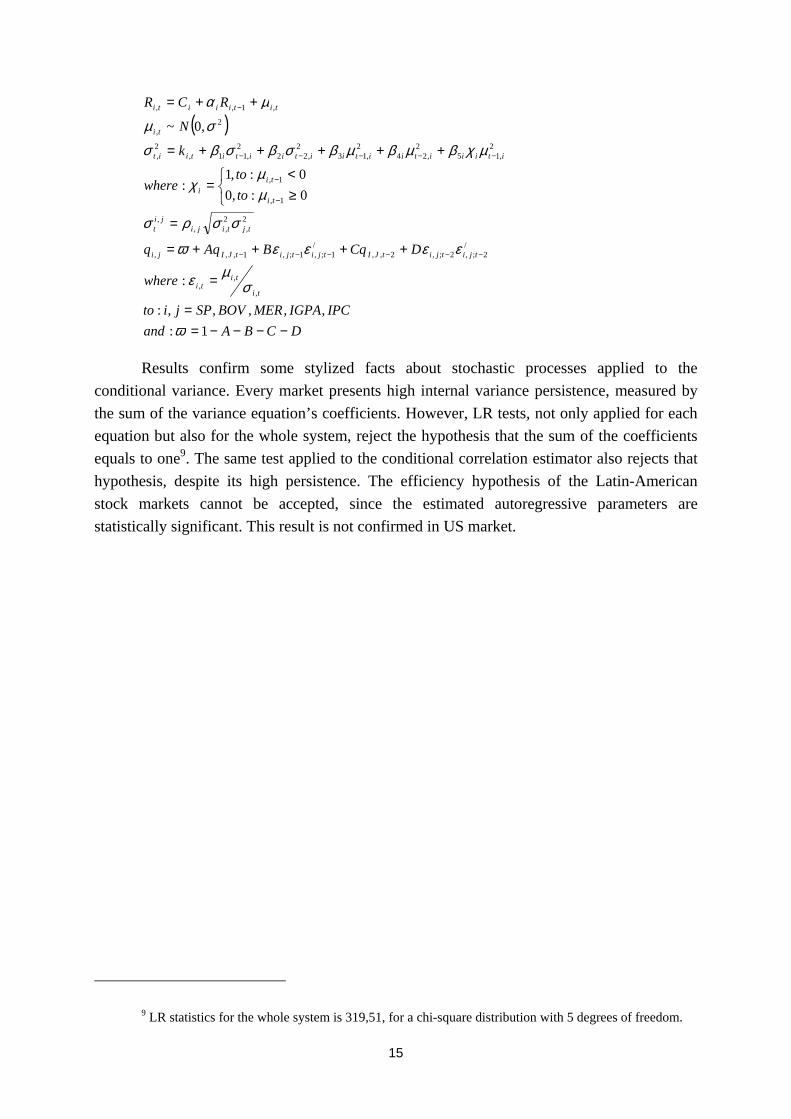
outome, the V1-GJR-G11-D11 model is chosen as the best selection. Table I presents the
results, emphasizing the estimated conditional correlation equation. The parameters’ standard
errors are estimated with heteroskedaticity correction. Initial values were picked up from
univariate GJR models. The estimated structure follows the process:
8 Values on table H report the simple mean of the statistic for each of the five markets. The use of
weighted averages does not change results qualitatively.
15
( )
DCBAand
IPCIGPAMERBOVSPjito
where
DCqBAqq
to
towhere
k
N
RCR
ti
titi
tjitjitJItjitjitJIji
tjtijiji
t
ti
tii
itiiitiitiitiititiit
ti
titiiiti
−−−−==
=
++++=
=
≥<
=
+++++=
++=
−−−−−−
−
−
−−−−−
−
1:
,,,,,:
:
0:,0
0:,1:
,0~
,
,,
/2;,2;,2,,
/1;,1;,1,,,
2,
2,,
,
1,
1,
2,15
2,24
2,13
2,22
2,11,
2,
2,
,1,,
ϖ
σµε
εεεεϖ
σσρσ
µµ
χ
µχβµβµβσβσβσ
σµ
µα
Results confirm some stylized facts about stochastic processes applied to the
conditional variance. Every market presents high internal variance persistence, measured by
the sum of the variance equation’s coefficients. However, LR tests, not only applied for each
equation but also for the whole system, reject the hypothesis that the sum of the coefficients
equals to one9. The same test applied to the conditional correlation estimator also rejects that
hypothesis, despite its high persistence. The efficiency hypothesis of the Latin-American
stock markets cannot be accepted, since the estimated autoregressive parameters are
statistically significant. This result is not confirmed in US market.
9 LR statistics for the whole system is 319,51, for a chi-square distribution with 5 degrees of freedom.

16
TABLE I – Multivariate GARCH-GJR Model – V1-GJR-G(2,2)-D(2,2)
S&P 500 IBOVESPA MERVAL IGPA IPC
C 0.0004271*
(0.0001957) C
0.0002725
(0.0004474) C
0.0000474
(0.0004091) C
-0.0001630
(0.0001586) C
0.0004186
(0.0003372)
�S&Pt-1 0.0209000
(0.0243000) �S&Pt-1
0.0605000
(0.0455000) �S&Pt-1
-0.0384000
(0.0375000) �S&Pt-1
0.0339000*
(0.0152000) �S&Pt-1
0.0524000
(0.0333000)
�IBOVt-1 0.0017698
(0.0088331) �IBOVt-1
0.0693000*
(0.0230000) �IBOVt-1
-0.0254000
(0.0178000) �IBOVt-1
0.0092124
(0.0070964) �IBOVt-1
0.0076934
(0.0149000)
�MERt-1 0.0038730
(0.0097973) �MERt-1
-0.0134000
(0.0214000) �MERt-1
0.0700000*
(0.0240000) �MERt-1
0.0058312
(0.0063019) �MERt-1
0.0178000
(0.0131000)
�IGPAt-1 0.0165000
(0.0237000) �IGPAt-1
0.0830000
(0.0577000) �IGPAt-1
0.0365000
(0.0491000) �IGPAt-1
0.2207000*
(0.0214000) �IGPAt-1
0.0648000
(0.0385000)
�IPCt-1 0.0048168
(0.0110000) �IPCt-1
0.1216000*
(0.0274000) �IPCt-1
0.1466000*
(0.0233000) �IPCt-1
0.0348000*
(0.0088892) �IPCt-1
0.1096000*
(0.0238000)
K1 0.0000017*
(0.0000002) k2
0.0000133*
(0.0000020) k3
0.0000060*
(0.0000007) k4
0.0000009*
(0.0000002) k5
0.0000113*
(0.0000017)
σ2t-1,1
0.9310000*
(0.0075325) σ2
t-1.2 0.9039000*
(0.0086655) σ2
t-1.3 0.9145000*
(0.0046645) σ2
t-1.4 0.9175000*
(0.0077073) σ2
t-1.5 0.8628000*
(0.0107000)
µ2t-1,1
-0.0124000
(0.0076073) µ2
t-1.2 0.0229000*
(0.0095044) µ2
t-1.3 0.0562000*
(0.0065106) µ2
t-1.4 0.0625000*
(0.0092560) µ2
t-1.5 0.0405000*
(0.0106000)
χ1
0.1365000*
(0.0123000) χ2
0.1046000*
(0.0134000) χ3
0.0461000*
(0.0066697) χ4
0.0245000*
(0.0096635) χ5
0.1405000*
(0.0138000)
Conditional Correlation Structure
qi,j;t-1 0.9583000
(0.0037571)
εi,j;t-1ε’i,j;t-1 0.0262000
(0.0022223)
Note: (*) Indicate significance at 5%. Standard Deviations are in the brackets.
The model allows identifying some common channels of information transmission
over the returns. While none of the Latin-American stock markets affect the US market, the
US stock market only affects through mean returns the Chilean market. The performance of
the Mexican market has influence over returns of other Latin markets. The last result is the
opposite as those in EDWARDS (1998), who did not find any effects on the interest rates’
market between Mexico and Chile. However, it is possible that, for other asset markets, there
are different relations of dependence among countries.
Another interesting feature is the market asymmetric response when faced by different
types of shocks. All markets report higher volatility levels in the presence of bad news, when
compared to positive deviations from the mean. The LR statistics accepts the joint

17
significance of the asymmetry terms (150.43 in a chi-squared distribution with one degree of
freedom). Graph 2 presents the estimated reaction curves for each market. The deviations in
relation to the median of the conditional volatility are estimated in the vertical axis, while the
horizontal one presents the shocks. The result may be considered a long-run effect, since the
dynamics between periods is not considered10.
GRAPH 2 - News Impact Curves
0.000000
0.000005
0.000010
0.000015
0.000020
0.000025
0.000030
-10 -9 -8 -7 -6 -5 -4 -3 -2 -1 0 1 2 3 4 5 6 7 8 9 10
Simulated Shock
Co
nditi
on
al V
aria
nce
S&P 500 IBOVESPA MERVAL IPC IGPA
An interesting result is that shock’s effects over the Mexican stock market are
equivalent to the S&P 500’s response, despite a large differential in the average level of
conditional variance. It also draws attention the higher asymmetry value estimated to the
American market in comparison with that of the Mexican IPC. The Chilean stock market’s
reaction is less disproportional when compared to the volatilities estimated in the IBOVESPA
and MERVAL indexes. A higher asymmetry in the Brazilian asset’s response can be verified
by a larger reaction estimated to the Brazilian market, in face of negative surprises, than the
one of the Argentinean stock market.
4. Testing for Contagion Using Conditional Correlation
The objective of this section is to test for the existence of contagion among markets,
according to those concepts postulated in FORBES and RIGOBON (2000, p.13), presented in
the previous section. In our framework, as long as the multivariate GARCH model is correctly
specified, the estimated markets’ conditional correlations provide the measure of the
10 The concave form of the curve is a consequence of a standardized residual simulation (namely, ε = µ /σ) applied over the conditional variance. To eliminate dynamics, the long-run response was calculated just like the conditional mean under AR structures, taking the form:
εββ
ββσ)1(
)(
21
432
−−+
=

18
relationship necessary for testing our procedures. Table J compares the sample correlation
between the returns and the median of the conditional variance estimated by the model,
presented in the upper diagonal block. One can notice that the results do not differ much when
comparing the whole sample.
TABLE J – Returns’ Median Conditional Correlation – August, 94 to June, 03
S&P 500
USA
IBOVESPA
BRA
IPC
MEX
MERVAL
ARG
IGPA
CHI
S&P 500 - USA 1 0.417134 0.464627 0.331940 0.330201
IBOVESPA - BRA 0.413124 1 0.385868 0.492353 0.440519
IPC – MEX 0.442572 0.388471 1 0.343400 0.330427
MERVAL – ARG 0.294935 0.477175 0.341101 1 0.285871
IGPA – CHI 0.312176 0.482160 0.304869 0.338996 1
Five events have their conditional median correlation compared to that estimated by
the model. Three of them are considered to be endogenous, since that the stock markets’
returns reflect the shocks originated in countries included in the equation system: the
depreciation of the Mexican peso (12/19/94 to 12/31/94); the crisis with the Argentinean peso
(12/01/01 to 12/31/02); and the change in the Brazilian exchange rate regime (01/15/99 to
03/31/99). The other two are considered to be exogenous once they occurred in countries that
are not included in the system, such as the Asian countries’ crisis (10/17/97 to 10/31/97) and
the Russian one (08/01/98 to 12/31/98)11.
One can point out that this test compares a specific period of crisis to the whole
correlation series estimated by the model. This objection, based on FORBES and RIGOBON
(2002), states that structural changes may affect the estimation of the mean correlation,
inserting a bias in the parameter. However, the solution proposed there –to compare the crisis
period with the month that immediately precedes its start – is not necessarily the most
adequate, since it is also arbitrary establishing a normality period. BAIG and GOLDFAJN
(2000) illustrate this point by the strong rise in the Russian interest rate at the end of 1997 as a
mean to avoid the deterioration of the country’s international reserves. In a sense, this policy
action signalized that there were severe problems with the Russian economy, marking the
period, if not as a sharp crisis, as a period of high volatility. Hence, it is not adequate to
establish September 1998 as a normality month that preceded the crisis.
11 The choice of the periods was as follows: Mexican and Asian crises – FORBES and RIBOBON (2002), p. 2238; Russian crisis – BAIG and GOLDFAJN (2000), p. 5, with the restructuring of rublo-denominated debt and the change in the exchange rate band; Argentinean collapse – CHUI, HALL and TAYLOR (2004), p. 34, with the introduction of capital controls over the external flows. In the Brazilian crisis, the choice of period reflects the sharp increase in exchange rates returns after the change in regime in January 15th.

19
Table K presents the median correlations estimated for the high volatility’s periods.
The lower diagonal reports the median of the correlation estimated for the whole sample. For
those events defined as endogenous, bold values highlight the correlations of the countries in
a crisis.
TABLE K – Returns’ Median Conditional Correlation – Crises Periods
S&P 500
USA
IBOVESPA
BRA
IPC
MEX
MERVAL
ARG
IGPA
CHI
S&P 500 – USA 1 0.2134 0.0657 0.2173 0.2247
IBOVESPA – BRA 0.4171 1 0.1841 0.5405 0.3507
IPC – MEX 0.4643 0.3855 1 0.2229 0.0876
MERVAL – ARG 0.3310 0.4928 0.3429 1 0.3514
IGPA – CHI 0.3309 0.4411 0.2855 0.3303 1
Mexican C
risis
(12/19/1994 to
S&P 500 – USA 1 0.5091 0.5231 0.2861 0.3908
IBOVESPA –
BRA 0.4171 1 0.3859 0.3721 0.4934
IPC – MEX 0.4643 0.3855 1 0.2946 0.3020
MERVAL – ARG 0.3310 0.4928 0.3429 1 0.2279
IGPA – CHI 0.3309 0.4411 0.2855 0.3303 1
Exchange R
ate Regim
e –
Brazil – (01/15/1999 to
S&P 500 – USA 1 0.4078 0.4972 0.1506 0.3658
IBOVESPA – BRA 0.4171 1 0.3887 0.2332 0.4888
IPC – MEX 0.4643 0.3855 1 0.2075 0.2755
MERVAL – ARG 0.3310 0.4928 0.3429 1 0.1619
IGPA – CHI 0.3309 0.4411 0.2855 0.3303 1
Argentinean C
risis
(12/01/2001 to
S&P 500 – USA 1 0.5414 0.5261 0.4701 0.3597
IBOVESPA – BRA 0.4171 1 0.5105 0.5957 0.4472
IPC – MEX 0.4643 0.3855 1 0.4656 0.3297
MERVAL – ARG 0.3310 0.4928 0.3429 1 0.3961
IGPA – CHI 0.3309 0.4411 0.2855 0.3303 1
Asian C
risis
(10/17/1997 to
S&P 500 – USA 1 0.5518 0.5529 0.5479 0.4170
IBOVESPA – BRA 0.4171 1 0.6267 0.7067 0.5796
IPC – MEX 0.4643 0.3855 1 0.5870 0.5147
MERVAL – ARG 0.3310 0.4928 0.3429 1 0.5686
IGPA – CHI 0.3309 0.4411 0.2855 0.3303 1
Russian C
risis
(01/08/1998 a
There are some patterns in the exogenous events responses. For the Asian and Russian
crises, each estimated correlation rises sharply, in a kind of level-shift change. This is the
ultimate signal of contagion, as described in FORBES and RIGOBON (2000). The possibility

20
of a structural break, based in FORBES and RIBOBON (2002), is ruled out by the data
presented in table L, since an eventual bias in the sample – a bad selection of crisis dates –
can not be sustained, as long as median correlations in normal periods are lower before 1999.
In this sense, as long as these events occurred before 1999, the verified volatility increase is
not a consequence of a structural break during the period.
TABLE L – Returns’ Median Conditional Correlation – Partial Samples – Excludes Crises
Periods
S&P 500
USA
IBOVESPA
BRA
IPC
MEX
MERVAL
ARG
IGPA
CHI
S&P 500 –
USA 1 0.3847 0.3969 0.3436 0.2942
IBOVESPA
– BRA 0.4592 1 0.3559 0.5044 0.3975
IPC – MEX 0.5108 0.4210 1 0.3441 0.2672
MERVAL –
ARG 0.3432 0.4932 0.3650 1 0.3233
IGPA – CHI 0.3630 0.4578 0.3167 0.3625 1
1994-1998
1999-2003
The endogenous events show some peculiar features. The change in the Brazilian
exchange rate regime, in 1999, was an atypical event of information transmission in the stock
markets, since only in this episode the estimated conditional correlation does not point to a
unique direction. During stress events, the Chilean and the Mexican stock markets increase
their correlation with the US market. Coincidently, these are the markets with a lower
asymmetric response under negative news. The correlations of IBOVESPA and MERVAL do
not rise under the same circumstances.
5. Contagion or Interdependence: Sufficient Concepts? Analyzing Mexico and Argentina
The results in the analysis of endogenous events raise a few questions about the
sufficiency of the concepts proposed in FORBES and RIGOBON (2000) concerning
contagion and interdependence. The decline of the conditional correlation among markets was
a common feature of the Argentinean and Mexican crises. Therefore, it is reasonable to
believe that their effects over other markets were insignificant. Graphs 3 and 4 present the
estimated correlations between Mexican and Argentinean stock markets with the other
markets.

21
GRAPH 3 - Estimated Conditional Correlation - Argentina
-0.2
0.0
0.2
0.4
0.6
0.8
1.0
10-
Oct
-94
10-F
eb-9
5
10-
Jun-
95
10-
Oct
-95
10-
Fe
b-96
10-
Jun-
96
10-
Oct
-96
10-
Fe
b-9
7
10-J
un-9
7
10-O
ct-9
7
10-F
eb-
98
10-J
un-9
8
10-
Oct
-98
10-F
eb-9
9
10-
Jun-
99
10-
Oct
-99
10-
Feb-
00
10-
Jun-
00
10-
Oct
-00
10-
Fe
b-01
10-J
un-0
1
10-O
ct-0
1
10-
Fe
b-0
2
10-J
un-0
2
10-O
ct-0
2
10-F
eb-0
3
Period
Co
nditi
ona
l Cor
rela
tion
S&P 500 - EUA IBOVESPA - Brasil IGPA - Chile IPC - México
Mexican Crisis
Argentinean Crisis
GRAPH 4 - Estimated Conditional Correlation - Mexico
-0.2
0.0
0.2
0.4
0.6
0.8
1.0
10-
Oct
-94
10-F
eb-9
5
10-
Jun-
95
10-
Oct
-95
10-
Fe
b-96
10-
Jun-
96
10-
Oct
-96
10-
Fe
b-9
7
10-J
un-9
7
10-O
ct-9
7
10-F
eb-
98
10-J
un-9
8
10-
Oct
-98
10-F
eb-9
9
10-
Jun-
99
10-
Oct
-99
10-
Feb-
00
10-
Jun-
00
10-
Oct
-00
10-
Fe
b-01
10-J
un-0
1
10-O
ct-0
1
10-
Fe
b-0
2
10-J
un-0
2
10-O
ct-0
2
10-F
eb-0
3
Period
Co
nditi
ona
l Cor
rela
tion
S&P 500 - EUA IBOVESPA - Brasil MERVAL - Argentina IGPA - Chile
Mexican Crisis
Argentinean Crisis
The concepts presented in FORBES and RIGOBON (2000) are based on the variation
of some measure of market’s relation: if the common shocks in markets do not alter this
measure of relationship, then, it is a matter of interdependence; if the measure rises in stress
events, then, it is a matter of contagion. However, in the Argentinean and Mexican cases, the
effects of the stock markets’ returns over the others seem to have been small, despite the
crises’ intensity. All markets had a decrease in the estimated correlation, which allows us to
consider the hypothesis that, under certain circumstances, the market experiencing the crisis is
isolated.

22
Table M reports the results of simple dynamic models where the endogenous variables
are the deviations from the mean correlation among Latin American markets and the US12.
Dummies variables, whose values equal the unity in crisis periods, were introduced in order to
check the existence of a significant deviation of the conditional correlation from the sample
mean. Coherently with table K’s results, the crisis periods’ dummies are significant only in
contagion (Asian and Russian Crisis, with positive sign) and isolation cases (Mexican and
Argentinean Crisis, with negative sign). The coefficient associated with the Brazilian event
was never significant. An alternative set of regressions includes the nominal exchange rate
variation of the local currency against US dollars, in order to check if nominal variations in
the asset prices can be important to explain these deviations. Only in the IGPA and MERVAL
equations these movements are significant at 5%. The negative sign implies that local
currency devaluations increase the isolation’s probability.
TABLE M – Regression Results – Deviation from Sample Correlations – Latin America and US Markets
IBOVESPA
BRA
IPC
MEX
MERVAL
ARG
IGPA
CHI
Without ER With ER Without ER With ER Without ER With ER Without ER With ER
C -0.001553
(0.010579)
0.002874
(0.010363)
-0.003182
(0.012628)
-0.003657
(0.013046)
0.003108
(0.015256)
-0.000311
(0.012664)
-0.013642
(0.015712)
0.002958
(0.016409)
AR(1) 0.501967**
(0.114714)
0.539139**
(0.111236)
0.616022**
(0.102646)
0.614423**
(0.104774)
0.387877**
(0.138628)
0.530193**
(0.121177)
0.484771**
(0.151809)
0.602673**
(0.150977)
Mexican Crisis -0.118575**
(0.038478)
-0.116079**
(0.036756)
-0.175367
(0.045752)
-0.191063**
(0.086678)
-0.085859
(0.054847)
-0.076271
(0.045483)
-0.063456
(0.054660)
-0.084638
(0.051837)
Brazilian
Exchange Rate
Regime
0.005905
(0.055460)
0.084967
(0.067281)
-0.043976
(0.064066)
-0.041981
(0.065887)
0.024896
(0.081137)
-0.005911
(0.067698)
-0.035040
(0.078479)
-0.048482
(0.073428)
Argentinean
Crisis
-0.000947
(0.028388)
0.022381
(0.029741)
0.042227
(0.033605)
0.041559
(0.034356)
-0.141339*
(0.051626)
-0.032682
(0.052040)
0.044964
(0.040510)
0.043289
(0.037784)
Asian Crisis 0.227883**
(0.052869)
0.227741**
(0.050471)
0.197434
(0.062881)
0.196576**
(0.064146)
0.258942**
(0.075131)
0.257889**
(0.062201)
0.128680
(0.076551)
0.150997**
(0.072073)
Russian Crisis 0.096549**
(0.038391)
0.095078**
(0.036658)
0.069653
(0.045335)
0.068341
(0.046560)
0.136273**
(0.054557)
0.130259**
(0.045196)
0.087388
(0.055701)
0.072405
(0.052369)
Exchange Rate
Variation -
-0.209842*
(0.110189) -
0.038012
(0.177032) -
-0.140795**
(0.038471) -
-0.746552**
(0.332251)
Note: (**) Indicate significance at 5%. (*) Indicate significance at 10%. Standard Deviations are in the brackets.
12 The choice of US market as a benchmark in this analysis was mainly due to the GARCH results, where the US market characteristics were closer to the definition of an “efficient” market. However, similar results can be achieved comparing different sets of correlations. Data frequency was changed to quarterly basis, as long as other tests were performed with different macroeconomic variables.

23
There is an expressive part of the literature about crises in Latin America justifying the
events based on the economies’ fundamentals. In this sense, BAIG and GOLDFAJN (2000, p.
12) draws attention to the change in the composition of international capital flows to Brazil,
where foreign direct investments (FDI) turned to be a considerable part of the Capital and
Financial account. Indeed, as table N shows – by comparing the FDI inflows and the outcome
of the Financial and Capital account for the three countries – Brazil did not incur on deficits in
those accounts. Argentina and Mexico, on the other hand, had some problems with their
external position, largely due to the decrease in the long-run capital inflows, such as FDI. The
Argentinean case had a dramatic aspect, since the capital inflows were in a sharp decrease
since the Brazilian crisis.
CHUI, HALL and TAYLOR (2004) also highlight the lower intensity in the answers
of a group of countries in face of the Argentinean crisis when compared to the Asian one. The
authors point to the improvement in these countries’ fundamentals, for instance, the adoption
of a flexible exchange rate system in Brazil in 1999. Hence, not only the capital account
composition, emphasized in BAIG and GOLDFAJN (2000), but also the economic policy mix
adopted by those countries, under trade and financial aspects, may have contributed to the
smaller effects of those crises throughout the time.
TABLE N – Capital Flows to Brazil, Mexico and Argentina – 1993-2001 – In US$ Billions
1993 1994 1995 1996 1997 1998 1999 2000 2001
Argentina 2,793 3,635 5,609 6,949 9,160 7,291 23,988 10,418 2,166
Brasil 1,292 3,072 4,859 11,200 19,650 31,913 28,576 32,779 22,457 Foreign Direct
Investment (a) Mexico 4,389 10,973 9,526 9,186 12,831 12,285 13,166 16,449 26,569
Argentina 20,344 11,377 5,003 11,764 16,850 19,009 14,494 7,824 -13,268
Brasil 7,685 8,193 29,658 33,922 25,400 20,438 8,395 29,649 20,295
Capital and
Financial
Account (b) Mexico 33,760 15,787 -10,487 4,248 25,745 19,747 17,563 22,611 25,403
Argentina 0.137 0.319 1.121 0.591 0.544 0.384 1.655 1.332 -0.163
Brasil 0.168 0.375 0.164 0.330 0.774 1.561 3.404 1.106 1.107 (a) / (b)
Mexico 0.130 0.695 -0.908 2.162 0.498 0.622 0.750 0.727 1.046
Source: International Finance Statistics – International Monetary Fund.
Anyway, it should be highlighted that, as in BAIG and GOLDFAJN (2000), higher
contagion effects were found in the markets of external debt bonds. This result is consistent
with EDWARDS (1998), who finds higher connections among Latin-American markets by
comparing the yield of the debt bonds. In other words, in spite of the evidences about the
effects of countries’ fundamentals on crises propagation, one should consider the specific
information transmission among different markets assets.

24
6. Conclusions:
The results derived from the estimation of GARCH models allow us to draw some
conclusions about the information transmission mechanism among the Latin America’s stock
markets. The main conclusions are:
a) All the evidences point to the occurrence of contagion, as defined in FORBES and
RIGOBON (2000), over Latin America only in the Russian and Asian crises. The Mexican
and Argentinean crises had a specific propagation dynamics that is not, necessarily, an event
of contagion, while the effects of Brazilian exchange rate developments over Latin America
should be seen as a phenomenon of interdependence among the markets;
b) The small direct influence of the average US market returns over the Latin-
America’s stock markets. Although this is a counter-intuitive fact, the correlation between the
returns is increasing over time, as table L shows. This is a signal of a change in the structure
of the relation among markets, considering the financial opening of the Latin economies. The
increasing correlation between Latin and US market in crises periods, implying that the US
market works as reference in times of high volatility, also draws attention.
c) The different pattern in the markets’ responses in face of international crises
according to their origins. On one hand, crises that were originated outside Latin America had
contagion effects by increasing the correlation between the returns in all markets. On the other
hand, crises originating in Latin American countries do not present a uniform response,
having the “isolation” of the troubled country (Mexico, 1994 and Argentina, 2001) or the
propagation throughout close countries (Brazil, 1999) as possible outcomes.
d) There are evidences that the propagation of the so-called internal crises is related to
the countries’ macroeconomic fundamentals. The more solid Brazilian position, in
comparison with those of the other Latin–American countries, may have been a determinant
factor in the propagation of the country’s volatility to the other markets. Anyhow, if this is a
specific feature of stock markets or if other assets have the same pattern of behaviour remains
to be analyzed.

25
References
BAE, K-.H., KAROLYI, G.A. Good news, bad news and international spillovers of stock
return volatility between Japan and the U.S. The Pacific-Basin Finance Journal, v. 2, p. 405-
438, 1994.
BAIG, T. e GOLDFAJN, I. The Russian default and the contagion to Brazil. IMF Working
Paper n. 00/160, 2000.
BOLLERSLEV, T., CHOU, R.Y. e KRONER, K.F. ARCH modeling in finance – a review of
the theory and empirical evidence. Journal of Econometrics, v. 52, p. 5-59, 1992.
BOLLERSLEV, T., ENGLE, R. F. e WOOLDRIDGE, J. M. A capital asset pricing model
with time-varying covariances. Journal of Political Economy, v. 96, n.1, 1988.
CHUI, M., HALL, S. e TAYLOR, A. Crisis spillovers in emerging markets economies:
interlinkages, vulnerabilities and investor behaviour. Working Paper, n. 212, Bank of
England, 2004.
CHOUEIRI, N. Contagion in Latin America: an empirical investigation. Paper presented at
the XVII Latin American Meeting of the Econometric Society, Mexico, 1999.
CRISTOFI, A. e PERICLI, A. Correlation in price changes and volatility of major Latin
American stock markets. Journal of Multinational Financial Management, n. 9, p. 79-93,
1999.
DÍEZ DE LOS RIOS, A. e HERRERO, A.G. Contagion and portfolio shift in emerging
countries’ sovereign bonds. Documento de Trabajo número 317, Banco de España, 2003.
EDWARDS, S. Interest rate volatility, capital controls and contagion. NBER Working Paper
Series, n. 6756, 1998.
EDWARDS, S. e SUSMEL, R. Volatility dependence and contagion in emerging equity
markets. NBER Working Paper Series, n. 8506, 2001.
ENGLE, R.F. Dynamic Conditional Correlation: a simple class of multivariate GARCH
models. Journal of Business and Economic Statistics, v. 20, issue 3, p. 339-350, julho de
2002.
ENGLE, R.F. e SHEPPARD, K. Theoretical and empirical properties of Dynamic Conditional
Correlation Multivariate GARCH. NBER Working Paper Series, n. 8554, 2001
ENGLE, R.F., ITO, T. e LIN, W. Meteor showers or heat waves? Heteroskedastic intra-daily
volatility in the foreign exchange market. Econometrica, v. 58, p. 525-542, 1990.
26
ENGLE, R.F. e NG, V.K. Measuring and testing the impact of news on volatility, Journal of
Finance, v. 48, p. 1022–1082, 1993.
FLEMING, M.J., e LOPEZ, J.A. Heat waves, meteor showers, and trading volume: an
analysis of volatility spillovers in the U.S. treasury market. Federal Reserve Bank of New
York Staff Papers, number 82, 1999.
FORBES, K. e RIGOBON, R. Contagion in Latin América: definitions, measurement, and
policy implications. NBER Working Paper Series, n. 7885, 2000.
FORBES, K. e RIGOBON, R. No contagion, only interdependence: measuring stock market
comovements. Journal of Finance, v. 57, n. 5, 2002.
GLOSTEN, L.R, JAGANNATHAN, R. e RUNKLE, D.E. On the relation between the
expected value and the volatility of the nominal excess return on stocks. Journal of Finance
48, 1779–1801, 1993.
HAMILTON, J.D. Time series analysis. Princeton University Press, 1994.
INOUE, A. e KILIAN, L. On the selection of forecasting models. European Central Bank
Working Paper, número 214. Fevereiro, 2003.
LIN, W., ENGLE, R.F. e ITO, T. Do bulls and bears move across borders? International
transmission of stock returns and volatility. Review of Financial Studies v. 7, p. 507-538,
1994.
LOPES, H.F. e MIGON, H.S. Comovements and contagion in emerging markets: stock
indexes volatilities. Case Studies in Bayesian Statistics, Volume VI, 285-300, 2002.
MORAIS, I.A.C. e PORTUGAL, M.S. Uma investigação sobre os co-movimentos na
volatilidade dos Par Bonds latino-americanos. Revista Brasileira de Economia, v. 55, n. 2, p.
183-204, 2001.
SINHA, T. e CASTAÑEDA, M.D.S. Transmission of risk across stock markets in Latin
America. Paper presented at the XVII Latin American Meeting of the Econometric Society,
Cancun, Mexico, 1999.
TABAK, B.M. e LIMA, E.J.A. Causality and cointegration in stock markets: the case of Latin
America. Texto para discussão n. 56, Banco Central do Brasil, 2002.

27
I. Appendix:
Estimated Conditional Correlations and Volatilities – V(1)-GJR-GARCH(1,1)-D(1,1)
.0000
.0002
.0004
.0006
.0008
.0010
95 96 97 98 99 00 01 02
Estimated Volatility - S&P 500
.000
.001
.002
.003
.004
.005
.006
95 96 97 98 99 00 01 02
Estimated Volatility - IBOVESPA
.000
.004
.008
.012
.016
.020
.024
.028
.032
95 96 97 98 99 00 01 02
Estimated Volatility - MERVAL
.0000
.0001
.0002
.0003
.0004
.0005
.0006
.0007
95 96 97 98 99 00 01 02
Estimated Volatility - IGPA
.000
.002
.004
.006
.008
.010
.012
.014
.016
95 96 97 98 99 00 01 02
Estimated Volatility - IPC
-0 .2
0 .0
0 .2
0 .4
0 .6
0 .8
1 .0
9 5 9 6 9 7 9 8 9 9 0 0 0 1 0 2
IB O V E S P AM E R V A L
IG P AIP C
E s tim ated C on d it ion a l C o rre la tion - S & P 5 0 0

28
-0 .2
0 .0
0 .2
0 .4
0 .6
0 .8
1 .0
9 5 9 6 9 7 9 8 9 9 0 0 0 1 0 2
S & P 5 0 0M E R V A L
IG P AIP C
E s tim a ted C on d it ion a l C o rre la tion - IB O V E S P A
-0 .2
0 .0
0 .2
0 .4
0 .6
0 .8
1 .0
9 5 9 6 9 7 9 8 9 9 0 0 0 1 0 2
S & P 5 0 0IB O V E S P A
M E R V A LIP C
E s tim a ted C on d it ion a l C o rre la tion - IG P A

29
Banco Central do Brasil
Trabalhos para Discussão Os Trabalhos para Discussão podem ser acessados na internet, no formato PDF,
no endereço: http://www.bc.gov.br
Working Paper Series
Working Papers in PDF format can be downloaded from: http://www.bc.gov.br
1 Implementing Inflation Targeting in Brazil
Joel Bogdanski, Alexandre Antonio Tombini and Sérgio Ribeiro da Costa Werlang
Jul/2000
2 Política Monetária e Supervisão do Sistema Financeiro Nacional no Banco Central do Brasil Eduardo Lundberg Monetary Policy and Banking Supervision Functions on the Central Bank Eduardo Lundberg
Jul/2000
Jul/2000
3 Private Sector Participation: a Theoretical Justification of the Brazilian Position Sérgio Ribeiro da Costa Werlang
Jul/2000
4 An Information Theory Approach to the Aggregation of Log-Linear Models Pedro H. Albuquerque
Jul/2000
5 The Pass-Through from Depreciation to Inflation: a Panel Study Ilan Goldfajn and Sérgio Ribeiro da Costa Werlang
Jul/2000
6 Optimal Interest Rate Rules in Inflation Targeting Frameworks José Alvaro Rodrigues Neto, Fabio Araújo and Marta Baltar J. Moreira
Jul/2000
7 Leading Indicators of Inflation for Brazil Marcelle Chauvet
Sep/2000
8 The Correlation Matrix of the Brazilian Central Bank’s Standard Model for Interest Rate Market Risk José Alvaro Rodrigues Neto
Sep/2000
9 Estimating Exchange Market Pressure and Intervention Activity Emanuel-Werner Kohlscheen
Nov/2000
10 Análise do Financiamento Externo a uma Pequena Economia Aplicação da Teoria do Prêmio Monetário ao Caso Brasileiro: 1991–1998 Carlos Hamilton Vasconcelos Araújo e Renato Galvão Flôres Júnior
Mar/2001
11 A Note on the Efficient Estimation of Inflation in Brazil Michael F. Bryan and Stephen G. Cecchetti
Mar/2001
12 A Test of Competition in Brazilian Banking Márcio I. Nakane
Mar/2001
30
13 Modelos de Previsão de Insolvência Bancária no Brasil Marcio Magalhães Janot
Mar/2001
14 Evaluating Core Inflation Measures for Brazil Francisco Marcos Rodrigues Figueiredo
Mar/2001
15 Is It Worth Tracking Dollar/Real Implied Volatility? Sandro Canesso de Andrade and Benjamin Miranda Tabak
Mar/2001
16 Avaliação das Projeções do Modelo Estrutural do Banco Central do Brasil para a Taxa de Variação do IPCA Sergio Afonso Lago Alves Evaluation of the Central Bank of Brazil Structural Model’s Inflation Forecasts in an Inflation Targeting Framework Sergio Afonso Lago Alves
Mar/2001
Jul/2001
17 Estimando o Produto Potencial Brasileiro: uma Abordagem de Função de Produção Tito Nícias Teixeira da Silva Filho Estimating Brazilian Potential Output: a Production Function Approach Tito Nícias Teixeira da Silva Filho
Abr/2001
Aug/2002
18 A Simple Model for Inflation Targeting in Brazil Paulo Springer de Freitas and Marcelo Kfoury Muinhos
Apr/2001
19 Uncovered Interest Parity with Fundamentals: a Brazilian Exchange Rate Forecast Model Marcelo Kfoury Muinhos, Paulo Springer de Freitas and Fabio Araújo
May/2001
20 Credit Channel without the LM Curve Victorio Y. T. Chu and Márcio I. Nakane
May/2001
21 Os Impactos Econômicos da CPMF: Teoria e Evidência Pedro H. Albuquerque
Jun/2001
22 Decentralized Portfolio Management Paulo Coutinho and Benjamin Miranda Tabak
Jun/2001
23 Os Efeitos da CPMF sobre a Intermediação Financeira Sérgio Mikio Koyama e Márcio I. Nakane
Jul/2001
24 Inflation Targeting in Brazil: Shocks, Backward-Looking Prices, and IMF Conditionality Joel Bogdanski, Paulo Springer de Freitas, Ilan Goldfajn and Alexandre Antonio Tombini
Aug/2001
25 Inflation Targeting in Brazil: Reviewing Two Years of Monetary Policy 1999/00 Pedro Fachada
Aug/2001
26 Inflation Targeting in an Open Financially Integrated Emerging Economy: the Case of Brazil Marcelo Kfoury Muinhos
Aug/2001
27
Complementaridade e Fungibilidade dos Fluxos de Capitais Internacionais Carlos Hamilton Vasconcelos Araújo e Renato Galvão Flôres Júnior
Set/2001

31
28
Regras Monetárias e Dinâmica Macroeconômica no Brasil: uma Abordagem de Expectativas Racionais Marco Antonio Bonomo e Ricardo D. Brito
Nov/2001
29 Using a Money Demand Model to Evaluate Monetary Policies in Brazil Pedro H. Albuquerque and Solange Gouvêa
Nov/2001
30 Testing the Expectations Hypothesis in the Brazilian Term Structure of Interest Rates Benjamin Miranda Tabak and Sandro Canesso de Andrade
Nov/2001
31 Algumas Considerações sobre a Sazonalidade no IPCA Francisco Marcos R. Figueiredo e Roberta Blass Staub
Nov/2001
32 Crises Cambiais e Ataques Especulativos no Brasil Mauro Costa Miranda
Nov/2001
33 Monetary Policy and Inflation in Brazil (1975-2000): a VAR Estimation André Minella
Nov/2001
34 Constrained Discretion and Collective Action Problems: Reflections on the Resolution of International Financial Crises Arminio Fraga and Daniel Luiz Gleizer
Nov/2001
35 Uma Definição Operacional de Estabilidade de Preços Tito Nícias Teixeira da Silva Filho
Dez/2001
36 Can Emerging Markets Float? Should They Inflation Target? Barry Eichengreen
Feb/2002
37 Monetary Policy in Brazil: Remarks on the Inflation Targeting Regime, Public Debt Management and Open Market Operations Luiz Fernando Figueiredo, Pedro Fachada and Sérgio Goldenstein
Mar/2002
38 Volatilidade Implícita e Antecipação de Eventos de Stress: um Teste para o Mercado Brasileiro Frederico Pechir Gomes
Mar/2002
39 Opções sobre Dólar Comercial e Expectativas a Respeito do Comportamento da Taxa de Câmbio Paulo Castor de Castro
Mar/2002
40 Speculative Attacks on Debts, Dollarization and Optimum Currency Areas Aloisio Araujo and Márcia Leon
Apr/2002
41 Mudanças de Regime no Câmbio Brasileiro Carlos Hamilton V. Araújo e Getúlio B. da Silveira Filho
Jun/2002
42 Modelo Estrutural com Setor Externo: Endogenização do Prêmio de Risco e do Câmbio Marcelo Kfoury Muinhos, Sérgio Afonso Lago Alves e Gil Riella
Jun/2002
43 The Effects of the Brazilian ADRs Program on Domestic Market Efficiency Benjamin Miranda Tabak and Eduardo José Araújo Lima
Jun/2002

32
44 Estrutura Competitiva, Produtividade Industrial e Liberação Comercial no Brasil Pedro Cavalcanti Ferreira e Osmani Teixeira de Carvalho Guillén
Jun/2002
45 Optimal Monetary Policy, Gains from Commitment, and Inflation Persistence André Minella
Aug/2002
46 The Determinants of Bank Interest Spread in Brazil Tarsila Segalla Afanasieff, Priscilla Maria Villa Lhacer and Márcio I. Nakane
Aug/2002
47 Indicadores Derivados de Agregados Monetários Fernando de Aquino Fonseca Neto e José Albuquerque Júnior
Set/2002
48 Should Government Smooth Exchange Rate Risk? Ilan Goldfajn and Marcos Antonio Silveira
Sep/2002
49 Desenvolvimento do Sistema Financeiro e Crescimento Econômico no Brasil: Evidências de Causalidade Orlando Carneiro de Matos
Set/2002
50 Macroeconomic Coordination and Inflation Targeting in a Two-Country Model Eui Jung Chang, Marcelo Kfoury Muinhos and Joanílio Rodolpho Teixeira
Sep/2002
51 Credit Channel with Sovereign Credit Risk: an Empirical Test Victorio Yi Tson Chu
Sep/2002
52 Generalized Hyperbolic Distributions and Brazilian Data José Fajardo and Aquiles Farias
Sep/2002
53 Inflation Targeting in Brazil: Lessons and Challenges André Minella, Paulo Springer de Freitas, Ilan Goldfajn and Marcelo Kfoury Muinhos
Nov/2002
54 Stock Returns and Volatility Benjamin Miranda Tabak and Solange Maria Guerra
Nov/2002
55 Componentes de Curto e Longo Prazo das Taxas de Juros no Brasil Carlos Hamilton Vasconcelos Araújo e Osmani Teixeira de Carvalho de Guillén
Nov/2002
56 Causality and Cointegration in Stock Markets: the Case of Latin America Benjamin Miranda Tabak and Eduardo José Araújo Lima
Dec/2002
57 As Leis de Falência: uma Abordagem Econômica Aloisio Araujo
Dez/2002
58 The Random Walk Hypothesis and the Behavior of Foreign Capital Portfolio Flows: the Brazilian Stock Market Case Benjamin Miranda Tabak
Dec/2002
59 Os Preços Administrados e a Inflação no Brasil Francisco Marcos R. Figueiredo e Thaís Porto Ferreira
Dez/2002
60 Delegated Portfolio Management Paulo Coutinho and Benjamin Miranda Tabak
Dec/2002

33
61 O Uso de Dados de Alta Freqüência na Estimação da Volatilidade e do Valor em Risco para o Ibovespa João Maurício de Souza Moreira e Eduardo Facó Lemgruber
Dez/2002
62 Taxa de Juros e Concentração Bancária no Brasil Eduardo Kiyoshi Tonooka e Sérgio Mikio Koyama
Fev/2003
63 Optimal Monetary Rules: the Case of Brazil Charles Lima de Almeida, Marco Aurélio Peres, Geraldo da Silva e Souza and Benjamin Miranda Tabak
Feb/2003
64 Medium-Size Macroeconomic Model for the Brazilian Economy Marcelo Kfoury Muinhos and Sergio Afonso Lago Alves
Feb/2003
65 On the Information Content of Oil Future Prices Benjamin Miranda Tabak
Feb/2003
66 A Taxa de Juros de Equilíbrio: uma Abordagem Múltipla Pedro Calhman de Miranda e Marcelo Kfoury Muinhos
Fev/2003
67 Avaliação de Métodos de Cálculo de Exigência de Capital para Risco de Mercado de Carteiras de Ações no Brasil Gustavo S. Araújo, João Maurício S. Moreira e Ricardo S. Maia Clemente
Fev/2003
68 Real Balances in the Utility Function: Evidence for Brazil Leonardo Soriano de Alencar and Márcio I. Nakane
Feb/2003
69 r-filters: a Hodrick-Prescott Filter Generalization Fabio Araújo, Marta Baltar Moreira Areosa and José Alvaro Rodrigues Neto
Feb/2003
70 Monetary Policy Surprises and the Brazilian Term Structure of Interest Rates Benjamin Miranda Tabak
Feb/2003
71 On Shadow-Prices of Banks in Real-Time Gross Settlement Systems Rodrigo Penaloza
Apr/2003
72 O Prêmio pela Maturidade na Estrutura a Termo das Taxas de Juros Brasileiras Ricardo Dias de Oliveira Brito, Angelo J. Mont'Alverne Duarte e Osmani Teixeira de C. Guillen
Maio/2003
73 Análise de Componentes Principais de Dados Funcionais – Uma Aplicação às Estruturas a Termo de Taxas de Juros Getúlio Borges da Silveira e Octavio Bessada
Maio/2003
74 Aplicação do Modelo de Black, Derman & Toy à Precificação de Opções Sobre Títulos de Renda Fixa
Octavio Manuel Bessada Lion, Carlos Alberto Nunes Cosenza e César das Neves
Maio/2003
75 Brazil’s Financial System: Resilience to Shocks, no Currency Substitution, but Struggling to Promote Growth Ilan Goldfajn, Katherine Hennings and Helio Mori
Jun/2003

34
76 Inflation Targeting in Emerging Market Economies Arminio Fraga, Ilan Goldfajn and André Minella
Jun/2003
77 Inflation Targeting in Brazil: Constructing Credibility under Exchange Rate Volatility André Minella, Paulo Springer de Freitas, Ilan Goldfajn and Marcelo Kfoury Muinhos
Jul/2003
78 Contornando os Pressupostos de Black & Scholes: Aplicação do Modelo de Precificação de Opções de Duan no Mercado Brasileiro Gustavo Silva Araújo, Claudio Henrique da Silveira Barbedo, Antonio Carlos Figueiredo, Eduardo Facó Lemgruber
Out/2003
79 Inclusão do Decaimento Temporal na Metodologia Delta-Gama para o Cálculo do VaR de Carteiras Compradas em Opções no Brasil Claudio Henrique da Silveira Barbedo, Gustavo Silva Araújo, Eduardo Facó Lemgruber
Out/2003
80 Diferenças e Semelhanças entre Países da América Latina: uma Análise de Markov Switching para os Ciclos Econômicos de Brasil e Argentina Arnildo da Silva Correa
Out/2003
81 Bank Competition, Agency Costs and the Performance of the Monetary Policy Leonardo Soriano de Alencar and Márcio I. Nakane
Jan/2004
82 Carteiras de Opções: Avaliação de Metodologias de Exigência de Capital no Mercado Brasileiro Cláudio Henrique da Silveira Barbedo e Gustavo Silva Araújo
Mar/2004
83 Does Inflation Targeting Reduce Inflation? An Analysis for the OECD Industrial Countries Thomas Y. Wu
May/2004
84 Speculative Attacks on Debts and Optimum Currency Area: a Welfare Analysis Aloisio Araujo and Marcia Leon
May/2004
85 Risk Premia for Emerging Markets Bonds: Evidence from Brazilian Government Debt, 1996-2002 André Soares Loureiro and Fernando de Holanda Barbosa
May/2004
86 Identificação do Fator Estocástico de Descontos e Algumas Implicações sobre Testes de Modelos de Consumo Fabio Araujo e João Victor Issler
Maio/2004
87 Mercado de Crédito: uma Análise Econométrica dos Volumes de Crédito Total e Habitacional no Brasil Ana Carla Abrão Costa
Dez/2004
88 Ciclos Internacionais de Negócios: uma Análise de Mudança de Regime Markoviano para Brasil, Argentina e Estados Unidos Arnildo da Silva Correa e Ronald Otto Hillbrecht
Dez/2004
89 O Mercado de Hedge Cambial no Brasil: Reação das Instituições Financeiras a Intervenções do Banco Central Fernando N. de Oliveira
Dez/2004

35
90 Bank Privatization and Productivity: Evidence for Brazil Márcio I. Nakane and Daniela B. Weintraub
Dec/2004
91 Credit Risk Measurement and the Regulation of Bank Capital and Provision Requirements in Brazil – A Corporate Analysis Ricardo Schechtman, Valéria Salomão Garcia, Sergio Mikio Koyama and Guilherme Cronemberger Parente
Dec/2004
92
Steady-State Analysis of an Open Economy General Equilibrium Model for Brazil Mirta Noemi Sataka Bugarin, Roberto de Goes Ellery Jr., Victor Gomes Silva, Marcelo Kfoury Muinhos
Apr/2005
93 Avaliação de Modelos de Cálculo de Exigência de Capital para Risco Cambial Claudio H. da S. Barbedo, Gustavo S. Araújo, João Maurício S. Moreira e Ricardo S. Maia Clemente
Abr/2005
94 Simulação Histórica Filtrada: Incorporação da Volatilidade ao Modelo Histórico de Cálculo de Risco para Ativos Não-Lineares Claudio Henrique da Silveira Barbedo, Gustavo Silva Araújo e Eduardo Facó Lemgruber
Abr/2005
95 Comment on Market Discipline and Monetary Policy by Carl Walsh Maurício S. Bugarin and Fábia A. de Carvalho
Apr/2005
96 O que É Estratégia: uma Abordagem Multiparadigmática para a Disciplina Anthero de Moraes Meirelles
Ago/2005
97 Finance and the Business Cycle: a Kalman Filter Approach with Markov Switching Ryan A. Compton and Jose Ricardo da Costa e Silva
Aug/2005
98 Capital Flows Cycle: Stylized Facts and Empirical Evidences for Emerging Market Economies Helio Mori e Marcelo Kfoury Muinhos
Aug/2005
99 Adequação das Medidas de Valor em Risco na Formulação da Exigência de Capital para Estratégias de Opções no Mercado Brasileiro Gustavo Silva Araújo, Claudio Henrique da Silveira Barbedo,e Eduardo Facó Lemgruber
Set/2005
100 Targets and Inflation Dynamics Sergio A. L. Alves and Waldyr D. Areosa
Oct/2005
101 Comparing Equilibrium Real Interest Rates: Different Approaches to Measure Brazilian Rates Marcelo Kfoury Muinhos and Márcio I. Nakane
Mar/2006
102 Judicial Risk and Credit Market Performance: Micro Evidence from Brazilian Payroll Loans Ana Carla A. Costa and João M. P. de Mello
Apr/2006
103 The Effect of Adverse Supply Shocks on Monetary Policy and Output Maria da Glória D. S. Araújo, Mirta Bugarin, Marcelo Kfoury Muinhos and Jose Ricardo C. Silva
Apr/2006

36
104 Extração de Informação de Opções Cambiais no Brasil Eui Jung Chang e Benjamin Miranda Tabak
Abr/2006
105 Representing Roomate’s Preferences with Symmetric Utilities José Alvaro Rodrigues-Neto
Apr/2006
106 Testing Nonlinearities Between Brazilian Exchange Rates and Inflation Volatilities Cristiane R. Albuquerque and Marcelo Portugal
May/2006
107 Demand for Bank Services and Market Power in Brazilian Banking Márcio I. Nakane, Leonardo S. Alencar and Fabio Kanczuk
Jun/2006
108 O Efeito da Consignação em Folha nas Taxas de Juros dos Empréstimos Pessoais Eduardo A. S. Rodrigues, Victorio Chu, Leonardo S. Alencar e Tony Takeda
Jun/2006
109 The Recent Brazilian Disinflation Process and Costs Alexandre A. Tombini and Sergio A. Lago Alves
Jun/2006
110 Fatores de Risco e o Spread Bancário no Brasil Fernando G. Bignotto e Eduardo Augusto de Souza Rodrigues
Jul/2006
111 Avaliação de Modelos de Exigência de Capital para Risco de Mercado do Cupom Cambial Alan Cosme Rodrigues da Silva, João Maurício de Souza Moreira e Myrian Beatriz Eiras das Neves
Jul/2006