working paper - portland state...
TRANSCRIPT
WORKING PAPER
FOUR TYPES OF CYCLISTS? Testing a Typology to Better Understand Bicycling Behavior and Potential
Jennifer Dill, Ph.D. Associate Professor Nohad A. Toulan School of Urban Studies & Planning [email protected] Nathan McNeil Research Associate Center for Urban Studies Nohad A. Toulan School of Urban Studies & Planning [email protected]
August 10, 2012


Dill and McNeil 1
Abstract
Labeling or categorizing cyclists has been occurring for over a century for a variety of purposes. This paper aimed to test a typology developed for the city of Portland that includes four categories: Strong and the Fearless, Enthused and Confident, Interested but Concerned, and No Way No How. Unlike several other typologies, this one is intended to apply to all adults, regardless of their current cycling behavior. Our analysis used a random phone survey (n=908) of adults in the Portland region that included both land-line and mobile phone numbers; data were weighted to better reflect the population. Adults were put into the four types based primarily upon their stated level of comfort cycling on a variety of facility types, their interest in cycling more for transportation, and their physical ability to bicycle. Nearly all of the sampled population fit clearly into one of the four categories. A majority (56%) of the region’s population fit in the Interested but Concerned category – thought to be the key target market for increasing cycling for transportation. The analysis indicates that reducing traffic speeds and increasing separation between bicycles and motor vehicles, such as through cycle tracks, may increase levels of comfort and cycling rates. Women and older adults are underrepresented among the more confident adults and those who currently cycle for transportation.
Introduction
Typologies and classifications arise out of a desire to understand populations and apply categories that further a goal, be it academic or professional. From the dawn of bicycling in the United States, riders were being classified. To accommodate the burgeoning interest in bicycles and their predecessors, velocipedes, special rinks were created. Managers of these rinks created one of the first cyclist classification systems, isolating “timid toddlers,” still learning to ride these machines, from the classes of successively skilled riders in the rinks: the “Wary Wobblers,” “Go-it-Gracefuls,” and the “Fancy Few” (1, p. 112). This early typology categorized riders according to their approach and appearance.
A 1994 FHWA report sought to outline bicycle facility design concepts that would cater to all cyclist types, which, the report proposed, included “Advanced Bicyclists” who can “operate under most traffic conditions;” “Basic Bicyclists” who are “less confident of their ability to operate in traffic without special provisions for bicycles;” and “Children” who bicycle under parental supervision (2, p. 1-2). The 1999 AASHTO “Guide for the Development of Bicycles Facilities” echoed the FHWA report’s A, B, C of bicycle user groups, stating that “these three bicycle user types are a helpful guide to the highway designer” (3, p. 6). These reports made only vague efforts to quantify the share of people in each group. One suggested that there were as many as 100 million people own bicycles in the United States, but perhaps only 5% could be classified in the advanced category (2), while the other simply stated that “some” adults fall into the advanced category, but “most” fall into the basic category (3, p. 6). These typologies categorized existing bicycle users based on their skill level, but did not seek to categorize cyclists based on their purpose (e.g. recreation, transportation, etc). Further, they encouraged catering to “basic” users, but did not explicitly consider those who are not currently bicycle users.

Dill and McNeil 2
Background and Literature Review
In 2006, the Portland Office (now Bureau) of Transportation released a paper suggesting a new typology of cyclists titled “Four Types of Cyclists” (4). The paper, written by Portland Bicycle Coordinator Roger Geller, focused on riding for transportation purposes, and suggested that cyclists fell into one of four categories: The Strong and the Fearless, The Enthused and Confident, The Interested but Concerned, or No Way No How. Geller’s categories are in part determined by a person’s comfort riding a bicycle on different types of bikeways. Strong and Fearless cyclists will ride “regardless of roadway conditions” and take a “strong part of their identity” from riding a bicycle. Enthused and Confident cyclists are comfortable riding on a road with automobiles, but “prefer to do so operating on their own facilities” and appreciate efforts made to improve the bikeway infrastructure. Interested but Concerned people are “curious about bicycling,” like to ride, but are afraid to do so and therefore do not regularly ride and “will not venture out onto the arterials.” Finally, the No Way No How are not going to ride a bicycle, “for reasons of topography, inability, or simple a complete and utter lack of interest.” This categorization was intended to cover all adults, regardless of their current bicycling behavior. The paper suggests that the Strong and Fearless are less than one percent of the city of Portland’s population, while the Enthused and Confident are perhaps 7 percent. The Interested but Concerned are posited to comprise about 60 percent of the city. The No Way No How people comprised the remainder of the population, or about 33 percent. In its new Bicycle Master Plan, the City targeted the Interested but Concerned group as the market necessary to reach in order to achieve ambitious mode shift targets. As a result, the Plan emphasizes “low stress” facilities, such as bicycle boulevards and separated cycle tracks.
Geller’s paper has generated much discussion among bicycle bloggers and advocates on well-read websites such as Bikeportland.org (http://bikeportland.org/2006/12/07/what-type-of-cyclist-are-you/), Planetizen (http://www.planetizen.com/node/39394), and Reonnecting America (http://reconnectingamerica.org/news-center/half-mile-circles/2010/the-bikeway-network/). It has also gained considerable traction with bicycle planners. We identified at least fourteen recent city or regional bike plans (or supporting documents), including three in Canada and two in Australia, that referenced Geller’s typology, either with or without attribution: Cambridge, Ontario (2008); Albany, New York (2009); Burlington, Ontario (2010); Palo Alto, California (2011, draft plan); Los Angeles, California (2011); South Bay, CA (2011 draft); Sunshine Coast, Australia (2011); Reno-Sparks, Nevada (2011); Lincoln City, Oregon (2011 plan toolkit); Melbourne, Australia (2012); Southern California Association of Governments (2012, plan appendix); Bloomington-Normal, Illinois (2012 feasibility study); Lower Savannah Council of Governments, Georgia (2012 design guidelines); and Seattle, WA (2012 progress report).
Many of the plans have used the typology to demonstrate why investments in bicycle facilities are worthwhile. The 2011 plan for Sparks, NV noted that Geller’s typology shows how “a potential expansion of bicyclists could be attracted by investing in a better, safer bikeway system.” The 2011 plan for Palo Alto, CA argued that the city should plan for the “Interested but Concerned” group, and directly quoted Geller’s paper to state that "riding a bicycle should not require bravery.” Others simply used the typology to support the idea of building bikeways that are comfortable for a wide range of people. The paper’s influence has

Dill and McNeil 3
played a major role in bike plans abroad as well. The 2008 plan for Cambridge, Ontario, Canada stated that the four types of cyclists “illustrate that there is great potential to change the behaviour of a large proportion of the population, if changes to transportation infrastructure address the perception of cycling safety and comfort,” while a 2011 plan for the Sunshine Coast of Australia stated that “one of the main goals of an active transport plan is to convert non-cyclists to ‘enthused and confident’ cyclists.” While the percentage breakdown of the four types of cyclists is qualified in Geller’s paper as reasoned estimates, many of the citations of the typology do not provide the report’s qualification. Sometimes the plans and studies used Geller’s typology concept, but adapted the categories to fit their goals or perception of cyclist categories. For example, Calgary found that, rather than No Way No How, this least likely to cycle group was the “Reluctant to Cycle.” Seattle has used the term “Willing but Wary” in place of Interested but Concerned.
Meanwhile, in the academic realm, some researchers have categorized cyclists to better understand the non-homogenous behavior amongst people who bicycle. Several studies use current cycling frequency to categorize cyclists. Winters et al (5) defined everyone who had not ridden a bicycle in the past year as a “potential cyclist,” while all others were either occasional, frequent or regular. Similarly, Heinen et al (6) put commuters into three groups, non-cyclists, full-time cyclists (every working day), and part-time cyclists (at least once a year), and identified differences in attitudes between these groups. In their analysis of workers in two Swedish cities, Bergstom and Magnusson (7) added a seasonal dimension: Winter cyclist, Summer-only cyclist, Infrequent cyclist (less than two of five days a week), and Never cyclist. They identified the relative importance of factors that influenced the decision to commute by bicycle, such as exercise, cost, and the environment, and showed how they differed by category. One main objective was to identify ways to get people to cycle more in the winter. Gatersleben and Haddad (8) took a different approach in identifying the “typical bicyclist” according to both cyclists and non-cyclists. They used factor analysis to identify four types (or stereotypes) of cyclists based upon answers to 50 questions about attributes of cyclists: responsible, lifestyle, commuter, and hippy-go lucky. These categories are discussed as a useful framework for understanding how people view cyclists, and therefore potentially useful in attempts to change perceptions. None of these studies attempted to estimate the share of the broader population that fit into each category.
In a study for London’s Department for Transportation, Christmas et al (9) discuss the difficulty in segmenting the cycling population, concluding that the method must depend upon the intended purpose. For their purpose of road safety, the authors suggested including all or some of five variables: age, gender, motivation for cycling, cycling patterns, and cycling approaches. While they did not develop a typology, they noted significant diversity within the population cycling for utility (versus for leisure) and the likelihood that individuals may belong to more than one group.
Objectives
Geller’s four types of cyclists has clearly resonated among many transportation professionals and is now helping to guide bicycle planning in a growing number of cities. Given this expanding role, it is useful to examine its origins and validity. The categories were largely based upon Geller’s extensive professional experience. He describes the intent and process as follows:
Dill and McNeil 4
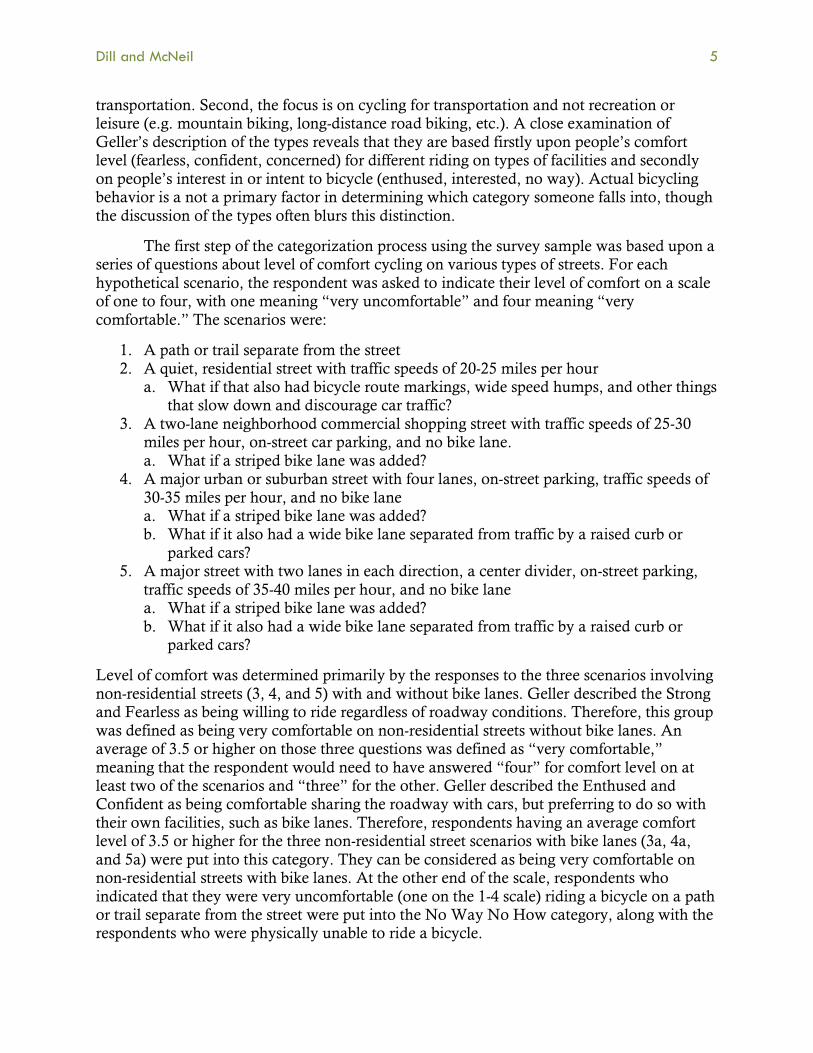
The intent behind its development was to get a better handle on our market for bicycle transportation. As such, it has been a useful tool, providing an organizing principle for understanding our target market and what we surmise their concerns and needs to be. As stated previously, the numbers assigned to each of these categories are not something over which any bicycle planner should be prepared to fall on their sword. These numbers, when originally assigned, were not based upon any survey or polling data, or on any study. Rather, they were developed based on the professional experience of one bicycle planner. Soon thereafter, these numbers were discussed and, in effect, vetted with various informed individuals and groups….But beyond that initial vetting of the idea there has been survey, polling and study data that continues to support the assignment of both numbers to and description of the categories. (4, p. 4)
The objectives of this paper are to: (1) examine the validity of Geller’s four types of cyclists in the Portland, Oregon region; (2) understand who falls into each type; and (3) use the typology to explore what might increase levels of cycling for transportation.
Methodology
The data were obtained through a random phone survey of adults in the Portland, OR region. The sample included both land-line and mobile phone numbers and was conducted July 19 through August 10, 2011. A total of 902 interviews were completed. Of those, 130 (14 percent) were completed on mobile phones. The mobile phone sample was used to help reduce sampling bias, particularly among younger adults. The overall response rate was 20% of eligible numbers and 35% of resolved numbers (see 10 for definitions). The data were weighted by age and sex to reflect the population using the 2010 U.S. Census.
The survey consisted of several sections:
1. Attitudes towards different forms of mobility (driving, walking, bicycling, transit) 2. Screening questions about physical ability to ride a bicycle and broad cycling habits
(I never ride a bike, I ride a bike occasionally, I ride a bike regularly); 3. Frequency of bicycling in the past month (30 days) for commuting, other utilitarian
purposes (e.g. shopping), and recreation/exercise only; 4. Past bicycling behavior, motivations for cycling, and future intentions; 5. Comfort level for bicycling on different types of facilities; 6. Perceptions of their neighborhood regarding bicycling, traffic, and safety; 7. Attitudes and concerns about bicycling; and 8. Demographics
Respondents who indicated that they were physically unable to ride a bicycle only answered sections 1 and 8. Thirteen percent of the weighted sample fell into this category, including about 40% of the respondents age 65 or older.
A key part of the research was to determine if the adult population fits into the four categories Geller created. To do so required a careful examination of the typology. A few things distinguish Geller’s typology from the others described above. First of all, the primary intent is to understand the market for cycling, not just the population of current cyclists. Therefore, the typology is not solely based upon current riding behavior. For example, Geller estimates that 60% of the Enthused and Confident are already riding regularly for
Dill and McNeil 5
transportation. Second, the focus is on cycling for transportation and not recreation or leisure (e.g. mountain biking, long-distance road biking, etc.). A close examination of Geller’s description of the types reveals that they are based firstly upon people’s comfort level (fearless, confident, concerned) for different riding on types of facilities and secondly on people’s interest in or intent to bicycle (enthused, interested, no way). Actual bicycling behavior is a not a primary factor in determining which category someone falls into, though the discussion of the types often blurs this distinction.
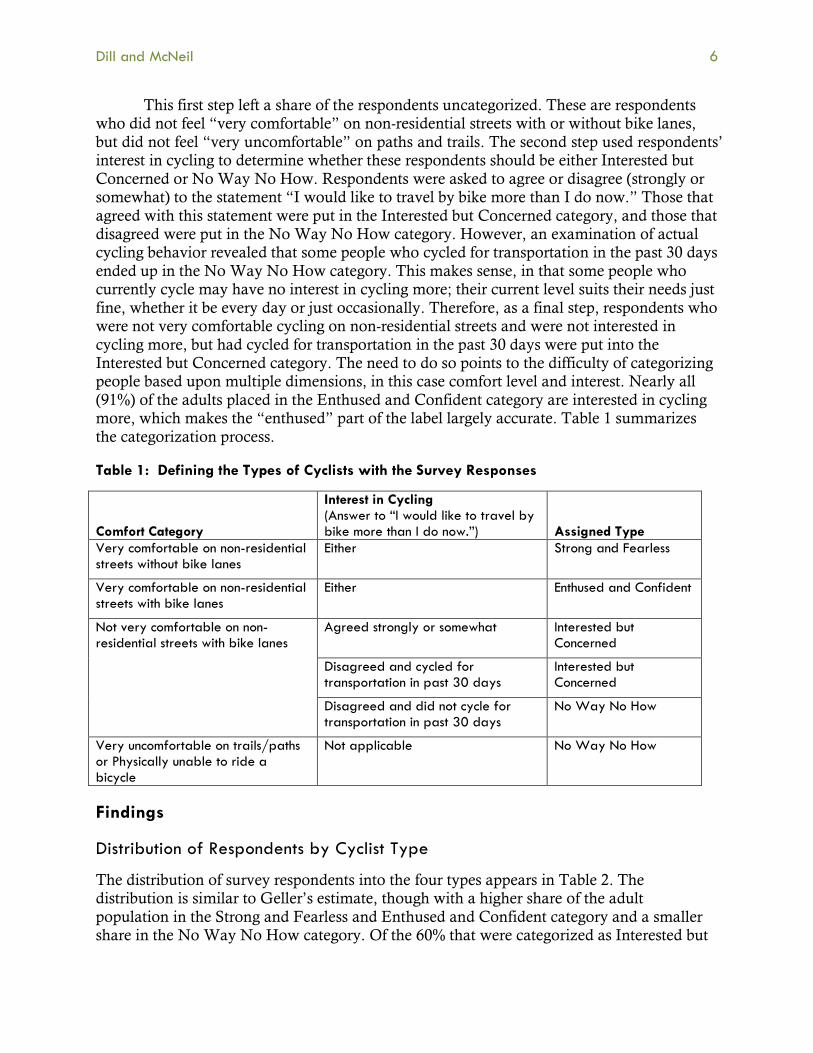
The first step of the categorization process using the survey sample was based upon a series of questions about level of comfort cycling on various types of streets. For each hypothetical scenario, the respondent was asked to indicate their level of comfort on a scale of one to four, with one meaning “very uncomfortable” and four meaning “very comfortable.” The scenarios were:
1. A path or trail separate from the street 2. A quiet, residential street with traffic speeds of 20-25 miles per hour
a. What if that also had bicycle route markings, wide speed humps, and other things that slow down and discourage car traffic?
3. A two-lane neighborhood commercial shopping street with traffic speeds of 25-30 miles per hour, on-street car parking, and no bike lane. a. What if a striped bike lane was added?
4. A major urban or suburban street with four lanes, on-street parking, traffic speeds of 30-35 miles per hour, and no bike lane a. What if a striped bike lane was added? b. What if it also had a wide bike lane separated from traffic by a raised curb or
parked cars? 5. A major street with two lanes in each direction, a center divider, on-street parking,
traffic speeds of 35-40 miles per hour, and no bike lane a. What if a striped bike lane was added? b. What if it also had a wide bike lane separated from traffic by a raised curb or
parked cars?
Level of comfort was determined primarily by the responses to the three scenarios involving non-residential streets (3, 4, and 5) with and without bike lanes. Geller described the Strong and Fearless as being willing to ride regardless of roadway conditions. Therefore, this group was defined as being very comfortable on non-residential streets without bike lanes. An average of 3.5 or higher on those three questions was defined as “very comfortable,” meaning that the respondent would need to have answered “four” for comfort level on at least two of the scenarios and “three” for the other. Geller described the Enthused and Confident as being comfortable sharing the roadway with cars, but preferring to do so with their own facilities, such as bike lanes. Therefore, respondents having an average comfort level of 3.5 or higher for the three non-residential street scenarios with bike lanes (3a, 4a, and 5a) were put into this category. They can be considered as being very comfortable on non-residential streets with bike lanes. At the other end of the scale, respondents who indicated that they were very uncomfortable (one on the 1-4 scale) riding a bicycle on a path or trail separate from the street were put into the No Way No How category, along with the respondents who were physically unable to ride a bicycle.
Dill and McNeil 6
This first step left a share of the respondents uncategorized. These are respondents who did not feel “very comfortable” on non-residential streets with or without bike lanes, but did not feel “very uncomfortable” on paths and trails. The second step used respondents’ interest in cycling to determine whether these respondents should be either Interested but Concerned or No Way No How. Respondents were asked to agree or disagree (strongly or somewhat) to the statement “I would like to travel by bike more than I do now.” Those that agreed with this statement were put in the Interested but Concerned category, and those that disagreed were put in the No Way No How category. However, an examination of actual cycling behavior revealed that some people who cycled for transportation in the past 30 days ended up in the No Way No How category. This makes sense, in that some people who currently cycle may have no interest in cycling more; their current level suits their needs just fine, whether it be every day or just occasionally. Therefore, as a final step, respondents who were not very comfortable cycling on non-residential streets and were not interested in cycling more, but had cycled for transportation in the past 30 days were put into the Interested but Concerned category. The need to do so points to the difficulty of categorizing people based upon multiple dimensions, in this case comfort level and interest. Nearly all (91%) of the adults placed in the Enthused and Confident category are interested in cycling more, which makes the “enthused” part of the label largely accurate. Table 1 summarizes the categorization process.
Table 1: Defining the Types of Cyclists with the Survey Responses
Comfort Category
Interest in Cycling (Answer to “I would like to travel by bike more than I do now.”) Assigned Type
Very comfortable on non-residential streets without bike lanes
Either Strong and Fearless
Very comfortable on non-residential streets with bike lanes
Either Enthused and Confident
Not very comfortable on non-residential streets with bike lanes
Agreed strongly or somewhat Interested but Concerned
Disagreed and cycled for transportation in past 30 days
Interested but Concerned
Disagreed and did not cycle for transportation in past 30 days
No Way No How
Very uncomfortable on trails/paths or Physically unable to ride a bicycle
Not applicable No Way No How
Findings
Distribution of Respondents by Cyclist Type
The distribution of survey respondents into the four types appears in Table 2. The distribution is similar to Geller’s estimate, though with a higher share of the adult population in the Strong and Fearless and Enthused and Confident category and a smaller share in the No Way No How category. Of the 60% that were categorized as Interested but

Dill and McNeil 7
Concerned, only 6% were not interested in cycling more but had cycled for transportation in the past month.
Table 2: Distribution of Survey Respondents by Cyclist Type
Type Description City of
Portland Rest of region All
Geller’s estimate for City
Strong & Fearless Very comfortable without bike lanes 6% 2% 4% <1%
Enthused & Confident Very comfortable with bike lanes 9% 9% 9% 7%
Interested but Concerned
Not very comfortable, interested in biking more Not very comfortable, currently cycling for transportation but not interested in biking more
60% 53% 56% 60%
No Way No How
Physically unable Very uncomfortable on paths Not very comfortable, not interested, not currently cycling for transportation
25% 37% 31% 33%
n (weighted) 436 479 915 Note: Weighted data, may not total 100% due to rounding.
Figure 1 shows that the different types have varying levels of concern about being hit by a motor vehicle while bicycling, which is consistent with way the categories were defined using the comfort levels. For example, 84 percent of the Interested but Concerned group is concerned about being hit, compared with 52% of the Enthused and Confident and 39% of the Strong and Fearless.
Figure 1: Concern about Being Hit by a Motor Vehicle and Cyclist Type
5% 6% 15%
50%
8% 10%
33%
12%
30%
45%
41% 21% 57%
39%
11% 18%
No Way No How Interested but Concerned
Enthused and Confident
Strong and Fearless
Strongly agree
Somewhat agree
Somewhat disagree
Strongly disagree
If or when I ride a bike, I'm concerned about being hit by a motor vehicle
Dill and McNeil 8
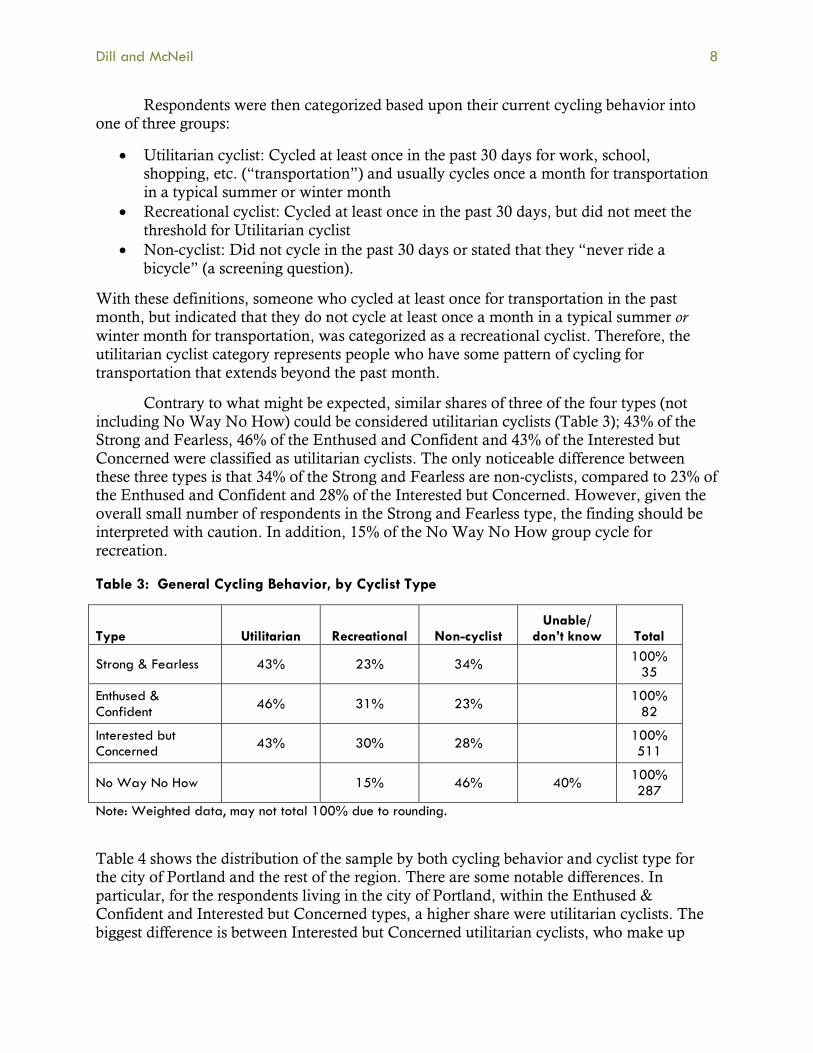
Respondents were then categorized based upon their current cycling behavior into one of three groups:
• Utilitarian cyclist: Cycled at least once in the past 30 days for work, school, shopping, etc. (“transportation”) and usually cycles once a month for transportation in a typical summer or winter month
• Recreational cyclist: Cycled at least once in the past 30 days, but did not meet the threshold for Utilitarian cyclist
• Non-cyclist: Did not cycle in the past 30 days or stated that they “never ride a bicycle” (a screening question).
With these definitions, someone who cycled at least once for transportation in the past month, but indicated that they do not cycle at least once a month in a typical summer or winter month for transportation, was categorized as a recreational cyclist. Therefore, the utilitarian cyclist category represents people who have some pattern of cycling for transportation that extends beyond the past month.
Contrary to what might be expected, similar shares of three of the four types (not including No Way No How) could be considered utilitarian cyclists (Table 3); 43% of the Strong and Fearless, 46% of the Enthused and Confident and 43% of the Interested but Concerned were classified as utilitarian cyclists. The only noticeable difference between these three types is that 34% of the Strong and Fearless are non-cyclists, compared to 23% of the Enthused and Confident and 28% of the Interested but Concerned. However, given the overall small number of respondents in the Strong and Fearless type, the finding should be interpreted with caution. In addition, 15% of the No Way No How group cycle for recreation.
Table 3: General Cycling Behavior, by Cyclist Type
Type Utilitarian Recreational Non-cyclist Unable/
don’t know Total
Strong & Fearless 43% 23% 34% 100%
35
Enthused & Confident 46% 31% 23%
100% 82
Interested but Concerned 43% 30% 28%
100% 511
No Way No How 15% 46% 40% 100% 287
Note: Weighted data, may not total 100% due to rounding.
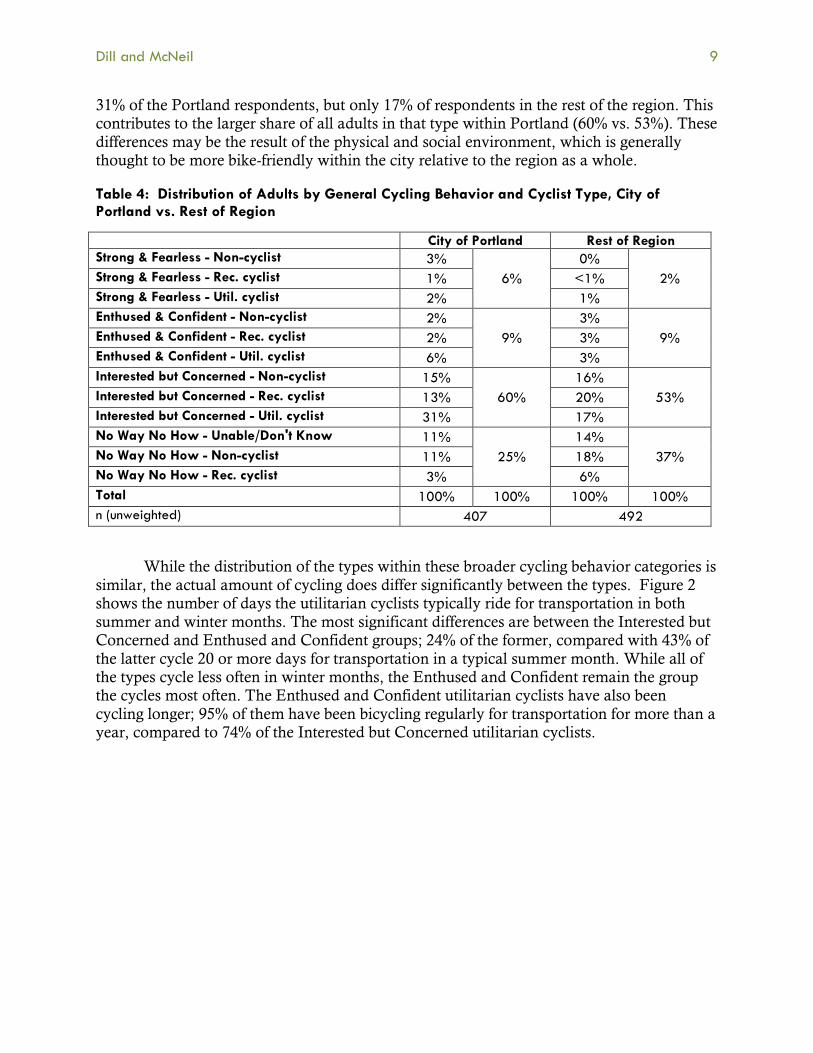
Table 4 shows the distribution of the sample by both cycling behavior and cyclist type for the city of Portland and the rest of the region. There are some notable differences. In particular, for the respondents living in the city of Portland, within the Enthused & Confident and Interested but Concerned types, a higher share were utilitarian cyclists. The biggest difference is between Interested but Concerned utilitarian cyclists, who make up
Dill and McNeil 9
31% of the Portland respondents, but only 17% of respondents in the rest of the region. This contributes to the larger share of all adults in that type within Portland (60% vs. 53%). These differences may be the result of the physical and social environment, which is generally thought to be more bike-friendly within the city relative to the region as a whole.
Table 4: Distribution of Adults by General Cycling Behavior and Cyclist Type, City of Portland vs. Rest of Region
City of Portland Rest of Region Strong & Fearless - Non-cyclist 3%
6% 0%
2% Strong & Fearless - Rec. cyclist 1% <1% Strong & Fearless - Util. cyclist 2% 1% Enthused & Confident - Non-cyclist 2%
9% 3%
9% Enthused & Confident - Rec. cyclist 2% 3% Enthused & Confident - Util. cyclist 6% 3% Interested but Concerned - Non-cyclist 15%
60% 16%
53% Interested but Concerned - Rec. cyclist 13% 20% Interested but Concerned - Util. cyclist 31% 17% No Way No How - Unable/Don't Know 11%
25% 14%
37% No Way No How - Non-cyclist 11% 18% No Way No How - Rec. cyclist 3% 6% Total 100% 100% 100% 100% n (unweighted) 407 492
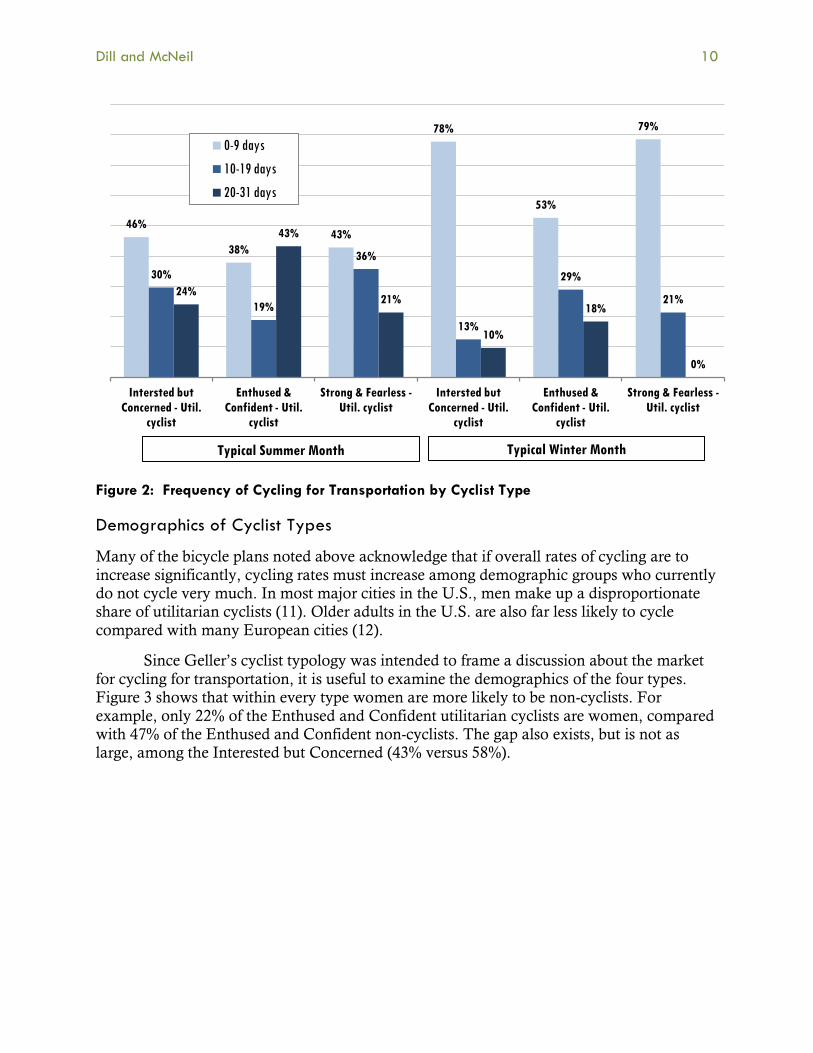
While the distribution of the types within these broader cycling behavior categories is similar, the actual amount of cycling does differ significantly between the types. Figure 2 shows the number of days the utilitarian cyclists typically ride for transportation in both summer and winter months. The most significant differences are between the Interested but Concerned and Enthused and Confident groups; 24% of the former, compared with 43% of the latter cycle 20 or more days for transportation in a typical summer month. While all of the types cycle less often in winter months, the Enthused and Confident remain the group the cycles most often. The Enthused and Confident utilitarian cyclists have also been cycling longer; 95% of them have been bicycling regularly for transportation for more than a year, compared to 74% of the Interested but Concerned utilitarian cyclists.
Dill and McNeil 10
Figure 2: Frequency of Cycling for Transportation by Cyclist Type
Demographics of Cyclist Types
Many of the bicycle plans noted above acknowledge that if overall rates of cycling are to increase significantly, cycling rates must increase among demographic groups who currently do not cycle very much. In most major cities in the U.S., men make up a disproportionate share of utilitarian cyclists (11). Older adults in the U.S. are also far less likely to cycle compared with many European cities (12).
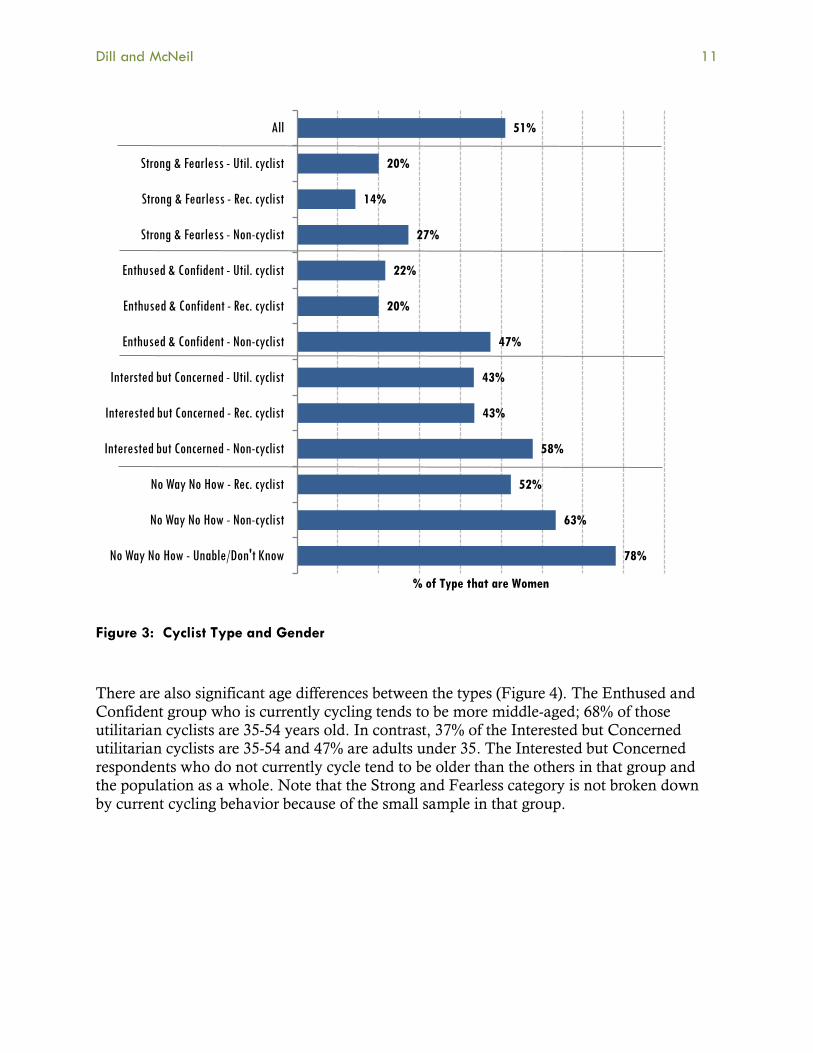
Since Geller’s cyclist typology was intended to frame a discussion about the market for cycling for transportation, it is useful to examine the demographics of the four types. Figure 3 shows that within every type women are more likely to be non-cyclists. For example, only 22% of the Enthused and Confident utilitarian cyclists are women, compared with 47% of the Enthused and Confident non-cyclists. The gap also exists, but is not as large, among the Interested but Concerned (43% versus 58%).
46%
38% 43%
78%
53%
79%
30%
19%
36%
13%
29%
21% 24%
43%
21%
10%
18%
0%
Intersted but Concerned - Util.
cyclist
Enthused & Confident - Util.
cyclist
Strong & Fearless - Util. cyclist
Intersted but Concerned - Util.
cyclist
Enthused & Confident - Util.
cyclist
Strong & Fearless - Util. cyclist
0-9 days
10-19 days
20-31 days
Typical Summer Month Typical Winter Month
Dill and McNeil 11
Figure 3: Cyclist Type and Gender
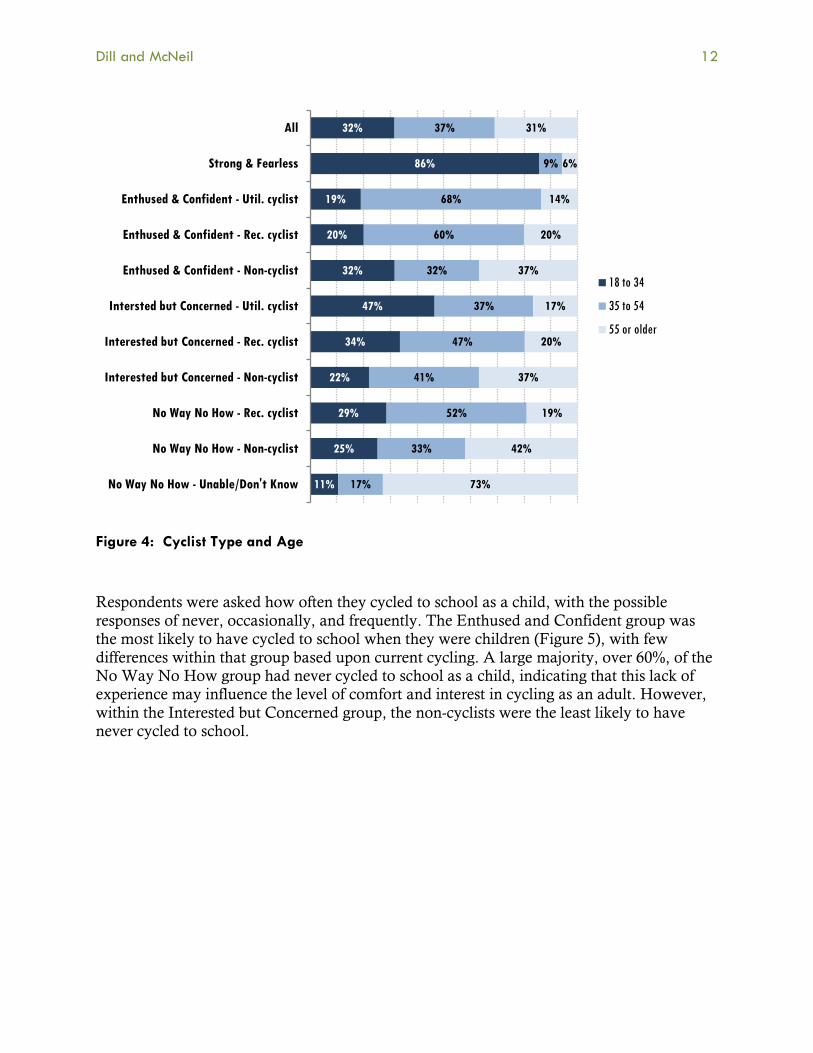
There are also significant age differences between the types (Figure 4). The Enthused and Confident group who is currently cycling tends to be more middle-aged; 68% of those utilitarian cyclists are 35-54 years old. In contrast, 37% of the Interested but Concerned utilitarian cyclists are 35-54 and 47% are adults under 35. The Interested but Concerned respondents who do not currently cycle tend to be older than the others in that group and the population as a whole. Note that the Strong and Fearless category is not broken down by current cycling behavior because of the small sample in that group.
78%
63%
52%
58%
43%
43%
47%
20%
22%
27%
14%
20%
51%
No Way No How - Unable/Don't Know
No Way No How - Non-cyclist
No Way No How - Rec. cyclist
Interested but Concerned - Non-cyclist
Interested but Concerned - Rec. cyclist
Intersted but Concerned - Util. cyclist
Enthused & Confident - Non-cyclist
Enthused & Confident - Rec. cyclist
Enthused & Confident - Util. cyclist
Strong & Fearless - Non-cyclist
Strong & Fearless - Rec. cyclist
Strong & Fearless - Util. cyclist
All
% of Type that are Women
Dill and McNeil 12
Figure 4: Cyclist Type and Age
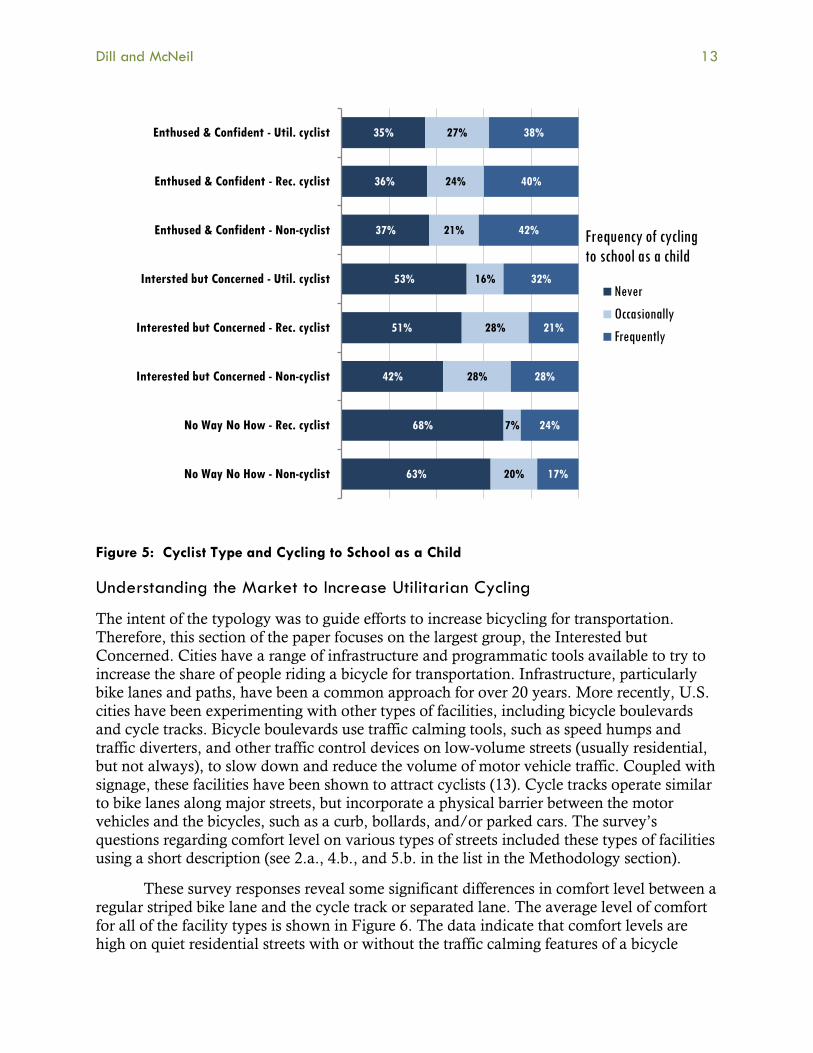
Respondents were asked how often they cycled to school as a child, with the possible responses of never, occasionally, and frequently. The Enthused and Confident group was the most likely to have cycled to school when they were children (Figure 5), with few differences within that group based upon current cycling. A large majority, over 60%, of the No Way No How group had never cycled to school as a child, indicating that this lack of experience may influence the level of comfort and interest in cycling as an adult. However, within the Interested but Concerned group, the non-cyclists were the least likely to have never cycled to school.
11%
25%
29%
22%
34%
47%
32%
20%
19%
86%
32%
17%
33%
52%
41%
47%
37%
32%
60%
68%
9%
37%
73%
42%
19%
37%
20%
17%
37%
20%
14%
6%
31%
No Way No How - Unable/Don't Know
No Way No How - Non-cyclist
No Way No How - Rec. cyclist
Interested but Concerned - Non-cyclist
Interested but Concerned - Rec. cyclist
Intersted but Concerned - Util. cyclist
Enthused & Confident - Non-cyclist
Enthused & Confident - Rec. cyclist
Enthused & Confident - Util. cyclist
Strong & Fearless
All
18 to 34
35 to 54
55 or older
Dill and McNeil 13
Figure 5: Cyclist Type and Cycling to School as a Child
Understanding the Market to Increase Utilitarian Cycling
The intent of the typology was to guide efforts to increase bicycling for transportation. Therefore, this section of the paper focuses on the largest group, the Interested but Concerned. Cities have a range of infrastructure and programmatic tools available to try to increase the share of people riding a bicycle for transportation. Infrastructure, particularly bike lanes and paths, have been a common approach for over 20 years. More recently, U.S. cities have been experimenting with other types of facilities, including bicycle boulevards and cycle tracks. Bicycle boulevards use traffic calming tools, such as speed humps and traffic diverters, and other traffic control devices on low-volume streets (usually residential, but not always), to slow down and reduce the volume of motor vehicle traffic. Coupled with signage, these facilities have been shown to attract cyclists (13). Cycle tracks operate similar to bike lanes along major streets, but incorporate a physical barrier between the motor vehicles and the bicycles, such as a curb, bollards, and/or parked cars. The survey’s questions regarding comfort level on various types of streets included these types of facilities using a short description (see 2.a., 4.b., and 5.b. in the list in the Methodology section).
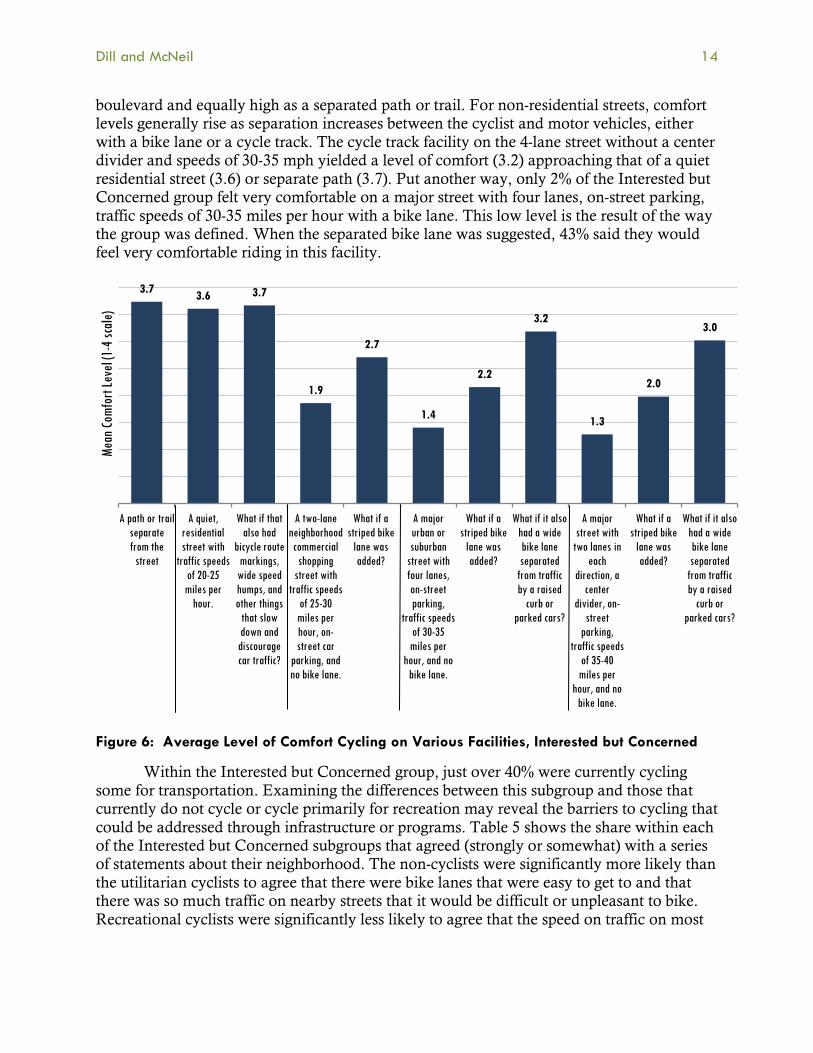
These survey responses reveal some significant differences in comfort level between a regular striped bike lane and the cycle track or separated lane. The average level of comfort for all of the facility types is shown in Figure 6. The data indicate that comfort levels are high on quiet residential streets with or without the traffic calming features of a bicycle
63%
68%
42%
51%
53%
37%
36%
35%
20%
7%
28%
28%
16%
21%
24%
27%
17%
24%
28%
21%
32%
42%
40%
38%
No Way No How - Non-cyclist
No Way No How - Rec. cyclist
Interested but Concerned - Non-cyclist
Interested but Concerned - Rec. cyclist
Intersted but Concerned - Util. cyclist
Enthused & Confident - Non-cyclist
Enthused & Confident - Rec. cyclist
Enthused & Confident - Util. cyclist
Never Occasionally Frequently
Frequency of cycling to school as a child
Dill and McNeil 14
boulevard and equally high as a separated path or trail. For non-residential streets, comfort levels generally rise as separation increases between the cyclist and motor vehicles, either with a bike lane or a cycle track. The cycle track facility on the 4-lane street without a center divider and speeds of 30-35 mph yielded a level of comfort (3.2) approaching that of a quiet residential street (3.6) or separate path (3.7). Put another way, only 2% of the Interested but Concerned group felt very comfortable on a major street with four lanes, on-street parking, traffic speeds of 30-35 miles per hour with a bike lane. This low level is the result of the way the group was defined. When the separated bike lane was suggested, 43% said they would feel very comfortable riding in this facility.
Figure 6: Average Level of Comfort Cycling on Various Facilities, Interested but Concerned
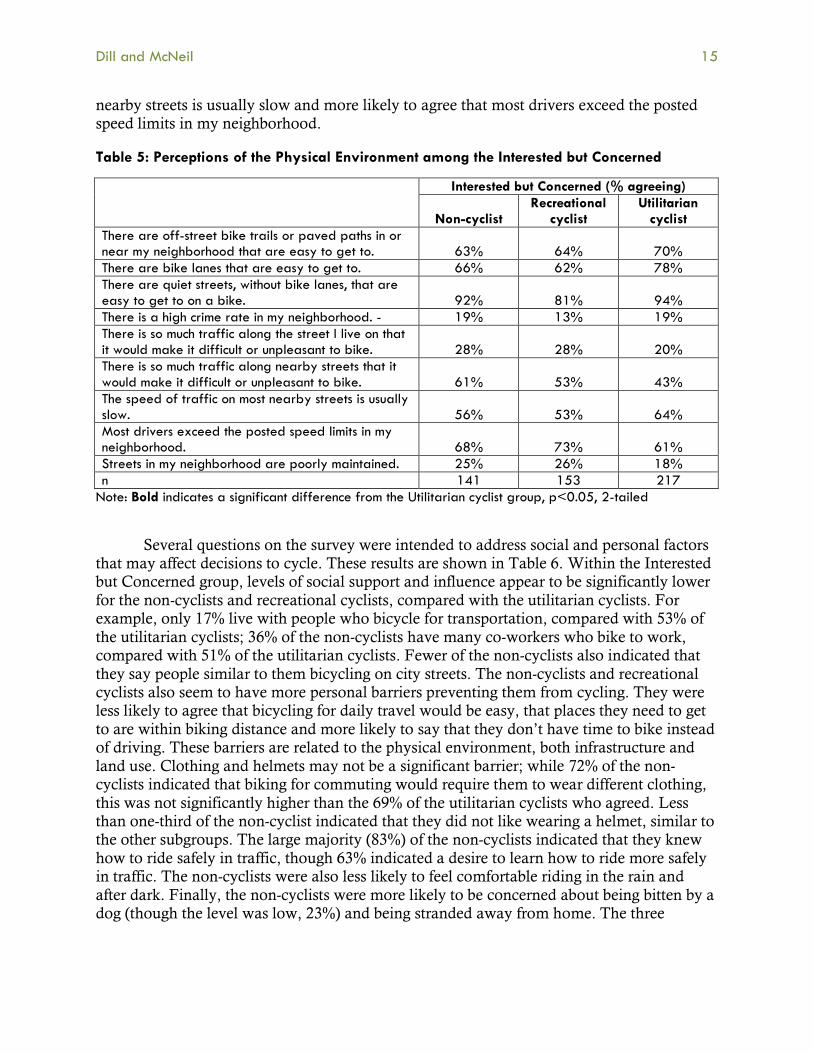
Within the Interested but Concerned group, just over 40% were currently cycling some for transportation. Examining the differences between this subgroup and those that currently do not cycle or cycle primarily for recreation may reveal the barriers to cycling that could be addressed through infrastructure or programs. Table 5 shows the share within each of the Interested but Concerned subgroups that agreed (strongly or somewhat) with a series of statements about their neighborhood. The non-cyclists were significantly more likely than the utilitarian cyclists to agree that there were bike lanes that were easy to get to and that there was so much traffic on nearby streets that it would be difficult or unpleasant to bike. Recreational cyclists were significantly less likely to agree that the speed on traffic on most
3.7 3.6 3.7
1.9
2.7
1.4
2.2
3.2
1.3
2.0
3.0
A path or trail separate from the
street
A quiet, residential street with
traffic speeds of 20-25 miles per
hour.
What if that also had
bicycle route markings,
wide speed humps, and other things
that slow down and discourage car traffic?
A two-lane neighborhood commercial shopping
street with traffic speeds
of 25-30 miles per hour, on-street car
parking, and no bike lane.
What if a striped bike
lane was added?
A major urban or suburban
street with four lanes, on-street parking,
traffic speeds of 30-35 miles per
hour, and no bike lane.
What if a striped bike
lane was added?
What if it also had a wide bike lane separated
from traffic by a raised
curb or parked cars?
A major street with
two lanes in each
direction, a center
divider, on-street
parking, traffic speeds
of 35-40 miles per
hour, and no bike lane.
What if a striped bike
lane was added?
What if it also had a wide bike lane separated
from traffic by a raised
curb or parked cars?
Mean
Comf
ort L
evel
(1-4 s
cale)
Dill and McNeil 15
nearby streets is usually slow and more likely to agree that most drivers exceed the posted speed limits in my neighborhood.
Table 5: Perceptions of the Physical Environment among the Interested but Concerned
Interested but Concerned (% agreeing)
Non-cyclist Recreational
cyclist Utilitarian
cyclist There are off-street bike trails or paved paths in or near my neighborhood that are easy to get to. 63% 64% 70% There are bike lanes that are easy to get to. 66% 62% 78% There are quiet streets, without bike lanes, that are easy to get to on a bike. 92% 81% 94% There is a high crime rate in my neighborhood. - 19% 13% 19% There is so much traffic along the street I live on that it would make it difficult or unpleasant to bike. 28% 28% 20% There is so much traffic along nearby streets that it would make it difficult or unpleasant to bike. 61% 53% 43% The speed of traffic on most nearby streets is usually slow. 56% 53% 64% Most drivers exceed the posted speed limits in my neighborhood. 68% 73% 61% Streets in my neighborhood are poorly maintained. 25% 26% 18% n 141 153 217
Note: Bold indicates a significant difference from the Utilitarian cyclist group, p<0.05, 2-tailed
Several questions on the survey were intended to address social and personal factors that may affect decisions to cycle. These results are shown in Table 6. Within the Interested but Concerned group, levels of social support and influence appear to be significantly lower for the non-cyclists and recreational cyclists, compared with the utilitarian cyclists. For example, only 17% live with people who bicycle for transportation, compared with 53% of the utilitarian cyclists; 36% of the non-cyclists have many co-workers who bike to work, compared with 51% of the utilitarian cyclists. Fewer of the non-cyclists also indicated that they say people similar to them bicycling on city streets. The non-cyclists and recreational cyclists also seem to have more personal barriers preventing them from cycling. They were less likely to agree that bicycling for daily travel would be easy, that places they need to get to are within biking distance and more likely to say that they don’t have time to bike instead of driving. These barriers are related to the physical environment, both infrastructure and land use. Clothing and helmets may not be a significant barrier; while 72% of the non-cyclists indicated that biking for commuting would require them to wear different clothing, this was not significantly higher than the 69% of the utilitarian cyclists who agreed. Less than one-third of the non-cyclist indicated that they did not like wearing a helmet, similar to the other subgroups. The large majority (83%) of the non-cyclists indicated that they knew how to ride safely in traffic, though 63% indicated a desire to learn how to ride more safely in traffic. The non-cyclists were also less likely to feel comfortable riding in the rain and after dark. Finally, the non-cyclists were more likely to be concerned about being bitten by a dog (though the level was low, 23%) and being stranded away from home. The three

Dill and McNeil 16
subgroups were equally and highly (over 80%) likely to be concerned about being hit by a motor vehicle, but not being hit by another bicyclist.
Table 6: Social and Personal Factors among the Interested but Concerned
Interested but Concerned (% agreeing) Non-cyclist
Recreational cyclist
Utilitarian cyclist
Social Factors Most people who are important to me, for example my family and friends, think I should bike more. 33% 29% 48%
Most people who are important to me, for example my family and friends, would support me in using a bike more. 90% 89% 94%
People I live with ride a bike to get to places, such as errands, shopping, and work. 17% 17% 53%
Many of my friends ride a bike to get to places, such as errands, shopping, and work. 43% 37% 79%
Many of my co-workers ride a bike to get to work. 36% 30% 51% In general, I see people similar to me bicycling on city streets. 71% 76% 85% Personal Factors I feel a personal obligation to bicycle instead of driving for everyday travel. 18% 17% 54%
For me to ride a bike for daily travel from home would be easy. 19% 17% 55%
I know where safe bike routes are in my neighborhood. 69% 78% 94% Many of the places I need to get to regularly are within biking distance of my home. 63% 47% 73%
I don't have time to bike places instead of driving. 62% 69% 49% Biking for commuting or transportation requires me to wear different clothes than normal. 72% 84% 69%
I don't like wearing a bike helmet. 31% 33% 36% I know how to ride a bike safely in traffic. 83% 93% 100% I would like to learn how to ride more safely in traffic. 63% 57% 61% There is secure bike parking at my work or school. 73% 73% 83% I would feel comfortable riding my bike when it is raining. 23% 28% 47% I would feel comfortable riding my bike in my neighborhood after dark. 48% 51% 67%
Concerns If or when I ride a bike, I'm concerned about… ...being hit by a motor vehicle. 82% 84% 84% ...being hit by another bicyclist. 12% 14% 18% ...being bitten by a dog. 23% 23% 14% ...falling off my bike. 32% 21% 23% ...being stranded away from home. 31% 25% 20% ...having my bicycle stolen. 64% 63% 63% n 141 153 217
Note: Bold indicates a significant difference from the Utilitarian cyclist group, p<0.05, 2-tailed
Dill and McNeil 17
Conclusion and Policy Implications
Labeling or categorizing cyclists has been occurring for over a century for a variety of purposes. The FHWA and AASTHO typologies from the 1990s were aimed at designing for the needs of current cyclists. The A, B, and C classifications catered to that objective and focused on cycling skills or confidence. There was no explicit attempt to apply the typology to the entire population or use it to examine the potential market for expanding cycling. Typologies developed by researchers have primary served the purpose of understanding the varied behavior of existing cyclists. Geller’s typology developed for the city of Portland, in contrast, aims to conceptualize the pool of existing and potential cyclists. As its proliferation in bicycle plans nationally demonstrates, it filled a need that was lacking.
This paper aimed to test that typology using a random survey of adults in the Portland region. Adults were put into the four types initially based upon their stated level of comfort cycling on a variety of facility types, their interest in cycling more for transportation, and their physical ability to bicycle. The initial result revealed that level of interest in cycling more is not necessarily consistent with current cycling behavior. In particular, some people who currently cycle are not interested in cycling more. This led to including a small number of people in the Interested but Concerned category who are concerned cyclists, but perhaps not interested, at least not in cycling more. With this exception, overall the typology appears to work well in distinguishing adults with respect to cycling. Nearly all of the sampled population fit clearly into one of the four categories. The process did use what could be considered arbitrary cut-off points for defining respondents’ level of comfort. However, changing these would simply affect the distribution of the population among the categories, not whether someone fit into any of the categories.
With the definitions used, the distribution of Portland’s adult population among the four types was very similar to Geller’s estimate, with the majority of the region’s (56%) and city’s (60%) population in the Interested but Concerned category – thought to be the key target market for increasing cycling for transportation. This confirms its usefulness as a tool for planning investments in bicycle infrastructure, at least in the Portland region. Its applicability in other U.S. cities should be tested. It is likely that the distribution of any city’s population among the four types will differ somewhat from that found in Portland. Without replicating the study elsewhere, it is hard to know if the magnitude of any differences would be significant enough to affect the usefulness of the typology for planning purposes. Our survey findings indicate that the physical environment influences the share of the population in each category. A key question for additional research is whether and how much the physical environment for bicycling (e.g. bicycle infrastructure, land use, street connectivity, hilliness, etc.) affects the two key components of the typology: comfort levels on different facilities and interest in cycling more. Cities with a less bike-friendly environment may find more adults in the No Way No How group, for example. Other factors, such as the driving styles of motor vehicle drivers (e.g. level of aggressiveness, speeds, etc.) may also influence levels of comfort and interest.
As discussed above, one difficulty in testing the typology and in discussions about the typology is the challenge of separating actual bicycling behavior from levels of comfort and interest. The typology is intended to apply to all adults, whether they bicycle or not. Yet many discussions of the typology (see, for example, the web sites referenced in the

Dill and McNeil 18
Background section, particularly the comments sections) focus on people who do bicycle. Even Geller’s document explaining the typology is titled “Four Types of Cyclists,” which does not explicitly acknowledge the inclusion of non-cyclists. A more accurate title, but very wordy and more cumbersome, would be something like “Four Types of Adults based on Attitudes towards Bicycling” or “Four Types of Current and Potential Cyclists.” Regardless of how things are titled, one important finding that there are people who do not currently bicycle for transportation in all four of the categories. And, perhaps surprisingly, the share of those in each of the categories (except No Way No How) is somewhat similar, ranging from 23% to 34%. However, the frequency of cycling does differ significantly between the Enthused and Confident and Interested but Concerned.
The typology does appear useful in distinguishing potential markets for cycling and understanding why some adults do not currently cycle for transportation. Some of the key findings and implications are as follows:
• Women are most likely to be in the No Way No How category or non-cyclists in the Enthused and Confident and Interested but Concerned categories. The barriers preventing them from cycling for transportation must be better understood if cycling rates are to increase significantly. Other research indicates that common barriers include concerns about traffic, different attitudes towards bicycling, and complex travel patterns, including transporting passengers (e.g. children and older parents) (11).
• Older adults (over 55) are also more likely to be in the No Way No How category or non-cyclists in the Enthused and Confident and Interested but Concerned categories. The large share in the No Way No How category is largely due to respondents indicating a physical inability to ride a bicycle. Non-traditional bicycle technologies, including electric-assist bicycles (e-bikes) and adult tricycles, might overcome this barrier for some older adults.
• There is a correlation between cycling to school as a child and levels of comfort cycling as an adult. The Enthused and Confident adults were most likely to have cycled frequently to school as a child, while the majority of No Way No How adults said that they never rode to school as a child. Cycling to school does not appear to affect whether an adult within one of the categories is currently cycling for transportation or recreation, however. Because cycling frequency does vary by category, these findings do lend support to the hypothesis that increasing cycling to school could have longer lasting effects on overall rates of cycling.
• The Interested but Concerned adults do represent the largest potential market for increasing cycling for transportation. Bicycle infrastructure that increases their physical separation from motor vehicles, such as cycle tracks, increases their level of comfort significantly. This would seem a necessary condition to increasing their levels of cycling for transportation.
• General concern about the amount of traffic and traffic speeds in neighborhoods, along with a lack of bike lanes and destinations nearby, appears to be preventing Interested but Concerned adults from bicycling either for transportation or recreation. Besides bicycle-specific infrastructure, traffic speed controls, traffic calming, and planning that promotes a mix of land uses could help overcome these barriers.

Dill and McNeil 19
• Social support for bicycling may influence whether an Interested but Concerned adult does cycle for transportation. Those who did not were less likely to live or work with people who bicycle for transportation or see people who look like them cycling on city streets.
• Time constraints are an important barrier to cycling for transportation among the Interested but Concerned. Overcoming this barrier is challenging. Land use and street patterns that shorten travel distances between destinations can help, as well as more direct bicycle infrastructure. E-bikes may also be a solution for some adults.
• Self-reported knowledge of safe bicycling practices in traffic are very high (over 80% among the Interested but Concerned), though a majority of all subgroups did indicate an interest in learning more. These findings make it unclear whether or how much cycling education efforts would change levels of cycling. On the other hand, non-cycling Interested but Concerned adults felt considerably less comfortable cycling in the rain or in the dark. Education might addess these concerns, by teaching people what gear to use in these conditions, as well as riding techniques specific to wet and/or dark conditions.
• Interested but Concerned adults that currently do not cycle for transportation were more concerned about the possibility of being stranded away from home. Having universal bicycle access on transit may help address this concern, if transit coverage is adequate. Emergency bicycle services, being provided by some automobile clubs and other companies, is another way to address this concern.
One additional area for further research is the subgroups of cyclists labeled here as recreational cyclists. These adults were found within all four types. They had ridden a bicycle in the past month, but do not do so regularly for transportation. Very little research exists examining the theory that people who cycle for recreation may more easily transition to cycling for transportation and people who do not bicycle at all. This is an example of where longitudinal research, perhaps involving an intervention, could be useful.
Finally, the aim of this paper was to test the typology developed by the city of Portland’s bicycle coordinator, Roger Geller, which is increasingly being used in other cities. It would perhaps be equally enlightening to develop a new typology from scratch. In both cases, a clear purpose and intended use is key in developing an internally consistent and useful typology.
Acknowledgments
This research was funded by the Oregon Transportation Research and Education Consortium (OTREC), a national university transportation center funded by the US Department of Transportation, and the City of Portland. The analysis and interpretation and any errors are solely those of the authors.
References
1. Herlihy, D., Bicycle: The History. 2004, New Haven: Yale University Press. 2. W.C. Wilkinson, A. Clarke, B. Epperson and R. Knoblauch. Selecting Roadway Design
Treatments to Accommodate Bicycles. US Department of Transportation, Federal Highway Administration, Publication No. FHWA-RD-92-073, 1994.

Dill and McNeil 20
3. American Association of State Highway and Transportation Officials (AASHTO), Guide for the Development of Bicycle Facilities. 1999, Washington, DC: AASHTO.
4. Geller, R. "Four Types of Cyclists," Portland Bureau of Transportation, Portland, OR, 2006. http://www.portlandoregon.gov/transportation/article/264746, Accessed June 23, 2012.
5. M. Winters, G. Davidson, D.N. Kao and K. Teschke, "Motivators and deterrents of bicycling: comparing influences on decisions to ride", Transportation 38, 153-168 (2011).
6. E. Heinen, K. Maat and B. van Wee, The role of attitudes toward characteristics of bicycle commuting on the choice to cycle to work over various distances. Transportation Research Part D-Transport and Environment 16, 102-109 (2011).
7. A. Bergstrom and R. Magnusson, Potential of transferring car trips to bicycle during winter. Transportation Research Part A-Policy and Practice 37, 649-666 (2003).
8. B. Gatersleben and H. Haddad, Who is the typical bicyclist? Transportation Research Part F-Traffic Psychology and Behaviour 13, 41-48 (2010).
9. S. Christmas, S. Helman, S. Bettress, C. Newman and R. Hutchins, Cycling, Safety, and Sharing the Road: Qualitative Research with Cyclists and Other Road Users. Department for Transport, London, 2010.
10. American Association for Public Opinion Research (AAPOR), "Standard Definitions, Final Dispositions of Case Codes and Outcome Rates for Surveys," American Association for Public Opinion Research 2011.
11. Garrard, J, Handy, S, Dill, J. Women and cycling. In Pucher, J, Buehler, R., Eds. 2012. City Cycling, MIT Press: Cambridge, MA, pp. 211-234, 2012.
12. Buehler, R, Pucher, J. International Overview: Cycling Trends in Western Europe, North America, and Australia. In Pucher, J, Buehler, R, eds. 2012. City Cycling, MIT Press: Cambridge, MA, pp. 9-29, 2012
13. Dill, J., Bicycling for Transportation and Health: The Role of Infrastructure. Journal of Public Health Policy, 2009. 30: p. S95-S110.